the Creative Commons Attribution 4.0 License.
the Creative Commons Attribution 4.0 License.
 | 06 Aug 2021
Validation of Aeolus winds using ground-based radars in Antarctica and in northern Sweden
Evgenia Belova
Sheila Kirkwood
Peter Voelger
Sourav Chatterjee
Karathazhiyath Satheesan
Susanna Hagelin
Magnus Lindskog
Heiner Körnich
Winds measured by lidar from the Aeolus satellite are compared with winds measured by two ground-based radars – MARA in Antarctica (70.77∘ S, 11.73∘ E) and ESRAD (67.88∘ N, 21.10∘ E) in Arctic Sweden – for the period 1 July–31 December 2019. Aeolus is a demonstrator mission to test whether winds measured by Doppler lidar from space can have sufficient accuracy to contribute to improved weather forecasting. A comprehensive programme of calibration and validation has been undertaken following the satellite launch in 2018, but, so far, direct comparison with independent measurements from the Arctic or Antarctic regions have not been made. The comparison covers heights from the low troposphere to just above the tropopause. Results for each radar site are presented separately for Rayleigh (clear) winds, Mie (cloudy) winds, sunlit (“summer”) and non-sunlit (“winter”) seasons, and ascending and descending satellite tracks. Horizontally projected line-of-sight (HLOS) winds from Aeolus, reprocessed using baseline 2B10, for passes within 100 km of the radar sites, are compared with HLOS winds calculated from 1 h averaged radar horizontal wind components. The agreement in most data subsets is very good, with no evidence of significant biases (<1 m s−1). Possible biases are identified for two subsets (about −2 m s−1 for the Rayleigh winds for the descending passes at MARA and about 2 m s−1 for the Mie winds for the ascending passes at ESRAD, both in winter), but these are only marginally significant. A robust significant bias of about 7 m s−1 is found for the Mie winds for the ascending tracks at MARA in summer. There is also some evidence for increased random error (by about 1 m s−1) for the Aeolus Mie winds at MARA in summer compared to winter. This might be related to the presence of sunlight scatter over the whole of Antarctica as Aeolus transits across it during summer.
Please read the corrigendum first before continuing.
-
Notice on corrigendum
The requested paper has a corresponding corrigendum published. Please read the corrigendum first before downloading the article.
-
Article
(2445 KB)
-
The requested paper has a corresponding corrigendum published. Please read the corrigendum first before downloading the article.
- Article
(2445 KB) - Full-text XML
- Corrigendum
- BibTeX
- EndNote


The Aeolus satellite is a European Space Agency (ESA) mission which aims to demonstrate the possibility of providing global wind measurements throughout the troposphere and lower stratosphere using Doppler wind lidar, with good enough accuracy for use in assimilations for numerical weather prediction. Aeolus carries a single instrument – the Atmospheric Laser Doppler Instrument (ALADIN) – with two detectors to analyse the backscattered laser light from atmospheric molecules (Rayleigh scatter) and cloud/aerosol particles (Mie scatter), respectively (Stoffelen et al., 2005; ESA, 2008; Reitebuch, 2012). The line-of-sight component of the wind is calculated from the Doppler shift of the backscattered light. Accurate measurement of the Doppler shift of the backscattered light requires careful calibration of the detectors, and a comprehensive process of calibration and validation was planned for the mission. More details on the lidar performance and sources of systematic and random errors are described in Reitebuch et al. (2020) and Rennie and Isaksen (2020). Dedicated campaigns for comparative measurements by airborne lidar and radiosonde profiling took place early in the mission (Baars et al., 2020; Lux et al., 2020; Witschas et al., 2020). Comparisons with ground-based radar and lidar observations, regular meteorological measurements, and global assimilations have also been undertaken both for specific locations (Khaykin et al., 2020; Guo et al., 2021) and on a global scale (Martin et al., 2021; Rennie and Isaksen, 2020). Particularly the dedicated campaign and global-scale studies have led to several changes in the data processing as the instrument performance in the space environment became better understood. For example, corrections have had to be made for “hot pixels”, which are increased dark current rates for specific ALADIN ACCD (accumulation charge coupled device) detector pixels (Weiler et al., 2020) and for biases in line-of-sight winds of up to 5 m s−1, which were found to differ between ascending and descending nodes and between different geographic regions (Martin et al., 2021; Rennie and Isaksen, 2020). These variable biases have been found to be largely caused by varying temperature gradients across the instrument's mirror, and, after application of corrections for the mirror effects, the biases have been reduced considerably (to <2 m s−1), sufficient for Aeolus winds to be able to improve weather forecasts (Rennie and Isaksen, 2020). Random errors have been found to be larger than the initial goal (1–2 m s−1) due to reduced laser power and signal losses in the receiver path (Reitebuch et al., 2020). They have been found to be 4–5 m s−1 (Rayleigh) or 3 m s−1 (Mie), at least up to February 2020 (Rennie and Isaksen, 2020). So far, validation for the polar regions has been based on the ECMWF global assimilation model (Rennie and Isaksen, 2020). However, very few standard upper-air meteorological measurements (radiosondes, aircraft in situ sensors) are available in the polar regions, so the model's accuracy is not well known in those regions. There is also a risk that different cloud conditions, surface reflectivities and summer daylight in these regions could lead to different performance of the lidar measurements. At the same time, accurate lidar measurements over the polar regions would be a particular asset to global weather forecasting and climate monitoring as these regions are so poorly covered by other observations. Validation of the Aeolus winds against direct independent wind measurements at polar latitudes offers a possibility to begin to see to what extent polar conditions might affect measurements, particularly whether scattered sunlight effects are as theoretically predicted, since the long summer days result in ALADIN measurements being made in full sunlight in those regions even with a dawn–dusk orbit.
2.1 Aeolus
The Aeolus satellite was launched on 22 August 2018 and lies in a dawn–dusk sun-synchronous orbit (inclination 97∘), at a height of about 320 km and with a period of about 90 min. The laser is pointed downwards at 35∘ from nadir. In most atmospheric conditions, magnitudes of vertical winds are small so that the Doppler shift of the backscattered light is mainly determined by the line-of-sight component of the horizontal wind. The laser is directed approximately perpendicular to the orbit track, towards the night hemisphere, so as to minimize background scatter due to sunlight. During the morning (descending) part of the track the azimuth of the target-to-laser direction is about 100∘, and during the evening (ascending) part the azimuth is about 260∘, so that the Doppler shift of the backscattered signal is mainly due to zonal winds. At high latitudes the azimuth changes gradually and, as a consequence, meridional winds have more effect on the Doppler shift. Measurements are typically made using 18–20 laser pulses (3 km of track distance), with returns integrated before height profiles of scattering characteristics and Doppler shift are extracted. In the early part of the mission, 30 of these measurements were then analysed as a group to pick separate valid Mie (cloudy) and Rayleigh (clear) returns, leading to profiles of line-of-sight wind corresponding to about an 87 km horizontal track (Reitebuch et al., 2020). The group length for Mie winds was later reduced to 14 km (horizontal averaging lengths smaller than 14 km are also possible) to improve the impact of the retrieved Aeolus winds on numerical weather prediction (Rennie and Isaksen, 2020).
Processed data including the mirror correction (baseline 2B10) have been available for new observations since April 2020; however, a different algorithm for the mirror correction was introduced in October 2020 (baseline 2B11). A period of homogeneous reprocessed data is also available using baseline 2B10 from July–December 2019. The move to baseline 2B10 and higher has been found to make considerable improvements to biases generally (Martin et al., 2021; Rennie and Isaksen, 2020), so it is most relevant to compare with these baselines. Because of long lead times for data transfer from Antarctica, at the time of writing, the most recent data available from MARA were 31 December 2019, so we focus on the time interval 1 July–31 December 2019.
2.2 MARA radar
The MARA wind-profiler radar is located at the Indian Antarctic station, Maitri, at 70.77∘ S, 11.73∘ E. It has been operational at that site since February 2014 (earlier located at other sites in Antarctica; see, e.g., Kirkwood et al., 2007; Mihalikova and Kirkwood, 2013). It operates continuously except for occasional breaks for repairs and maintenance and measures three components of wind in the troposphere/lowermost stratosphere at heights from about 500 m to 12 km, with interlaced measurement modes (1 min each) giving a height resolution of 75, 150 and 600 m. The radar operates at a frequency of 54.5 MHz, and signal is scattered back from irregularities in the refractive index of the air. The radar beam is vertical, with a beam width of about 12∘, corresponding to a 2000 m diameter of the measurement volume at 10 km height. Horizontal wind is derived from the horizontal motion of the diffraction pattern of the scattered signal across the antenna field (Briggs, 1994), while vertical wind is directly derived from the Doppler shift of the received backscatter. The strength of the scattered signal (from refractive index gradients in the air) is strongly dependent on the gradient of potential temperature (Kirkwood et al., 2010). This often leads to a gap in coverage in the upper troposphere (approx. 6–9 km altitude) where the temperature gradient is adiabatic. This restricts the heights available for comparison with Aeolus; however, the continuous operation allows comparison with any close Aeolus pass over the site (passes within 100 km occur about four times each week) over long periods of time. The location of MARA and the typical tracks for the four Aeolus orbits passing close by each week are shown in Fig. 1. The accuracy of wind measurements made by MARA has been assessed by comparison with regular radiosondes from a nearby station, over several months in 2014 (Belova et al., 2021). No significant biases (<0.25 m s−1) were found and random differences (standard deviation <4 m s−1, for 1 h averaged winds) were low enough to indicate the possibility of a useful comparison with Aeolus.
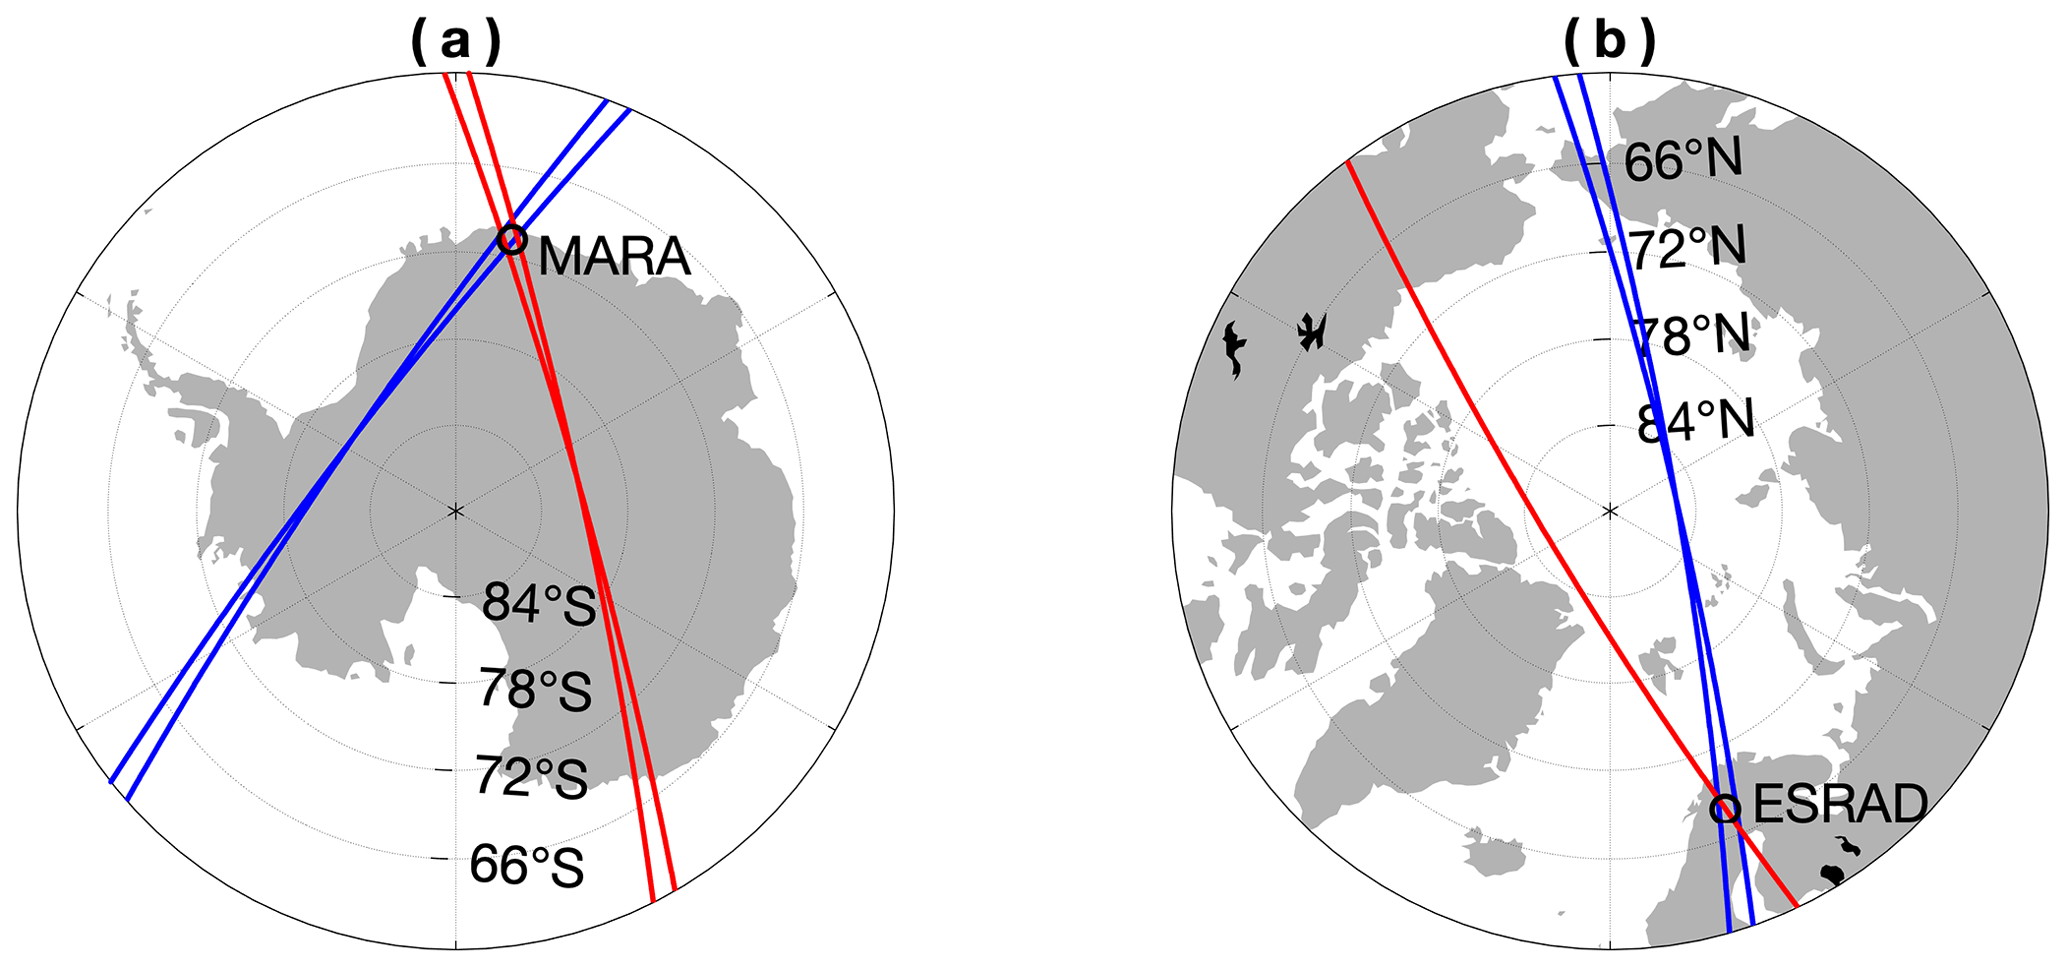
Figure 1Maps showing the locations of the MARA (a) and ESRAD (b) radars and typical Aeolus measurement tracks for orbits passing within 100 km of the respective radar. Red are ascending tracks, blue descending. At MARA four tracks per week and at ESRAD three per week pass close to the radars.
2.3 ESRAD
The ESRAD wind-profiler radar is located at Esrange, near Kiruna in Arctic Sweden, at 67.88∘ N, 21.10∘ E. It has been in continuous operation at the same site since 1996 (Chilson et al., 1999). ESRAD operates with a vertical beam, with a beamwidth of about 4∘, corresponding to a 700 m diameter for the measuring volume at 10 km height. It is operated in a similar fashion to MARA, with interlaced measurement modes with height resolutions of 75, 150 and 900 m. Since 2019, for better comparison with Aeolus, high signal-to-noise-ratio (SNR) measurements with 900 m resolution have occupied 4 min of each 8 min cycle. ESRAD operates at 52 MHz, and, like MARA, the signals have low SNR in the upper troposphere. However, ESRAD has higher power (about 1.5–2 times the power of MARA in 2019/2020) and a much larger antenna field (about 5 times the area of MARA), allowing better height coverage, from about 500 to 14 000 m, with fewer data gaps in the upper troposphere. The accuracy of the wind measurements made by ESRAD has been assessed by comparison with 28 radiosondes launched at the same site, during the period January 2017–August 2019 and with the regional NWP (numerical weather prediction) model HARMONIE-AROME for the period September 2018–May 2019 (Belova et al., 2021). These show a systematic underestimate of wind speed by about 8 % in zonal wind and 25 % in meridional wind at ESRAD, most likely due to non-random noise which cannot be easily removed. However, since the radiosonde and model comparisons cover the same time frame as the Aeolus mission, a correction for the underestimate can be applied before comparison with Aeolus. ESRAD–sonde random differences, after correction for the systematic underestimate (standard deviation <5 m s−1, for 1 h averaged winds) are again low enough to indicate the possibility of a useful comparison with Aeolus. The location of ESRAD and the typical measurement paths for the three Aeolus orbits which each week pass within 100 km of ESRAD are shown in Fig. 1.
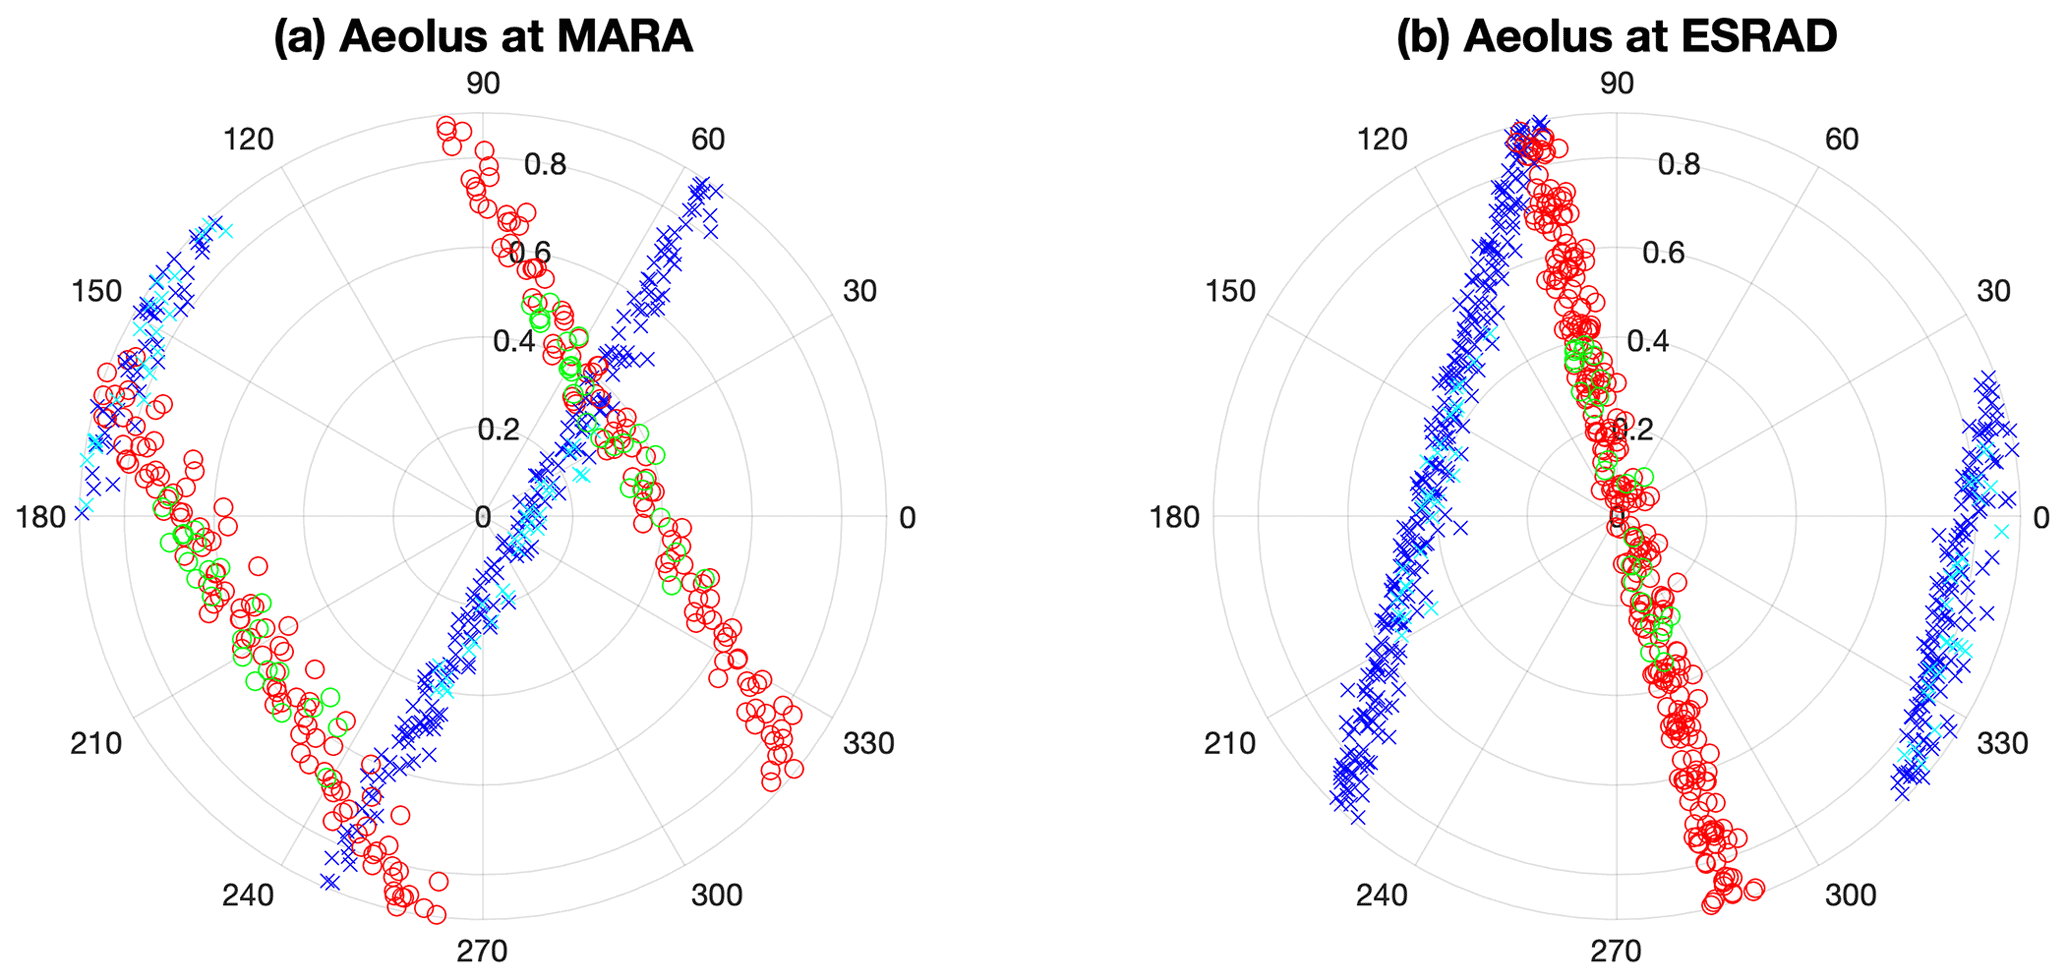
Figure 2Polar plots of azimuth and angular distance (∘) from the radars of mean locations of all Aeolus wind profiles used for comparison. Mie profiles are shown in red for ascending tracks and blue is for descending ones. The along-track distance included in each Mie profile is about 14 km (0.13∘). Rayleigh profiles are shown in green for ascending tracks and light blue for descending. The along-track distance included in each Rayleigh profile is about 87 km (0.78∘). There are up to 14 (very sparsely populated) Mie cloudy profiles within 100 km radius of the radar along each orbit track. These are combined to make a single profile for comparison with the single radar profile, as detailed in the text.
3.1 Aeolus HLOS winds
We use the Aeolus Level 2B (L2B) data product, with the 2B10 baseline which includes a bias correction for mirror temperature variations. Rayleigh clear and Mie cloudy winds are used. We use the period 1 July–31 December 2019 where a consistent reanalysed dataset is available. Aeolus HLOS (horizontal projection of the line-of-sight component) Mie and Rayleigh winds, where the distance between the mean position of a measurement and the radar was 100 km or less, have been used for comparison. Rayleigh winds are accumulated and averaged over 87 km, and we use only the measurement closest to the radar even though, sometimes, there is more than one with a mean position within 100 km. We reject Rayleigh HLOS winds with an error estimate >8 m s−1 (and if the validity flag is 0). Aeolus range–bin settings vary between different latitude bands and are changed from time to time to address different scientific or mission objectives. For the period July to mid-October, the height coverage for Rayleigh winds over the MARA site was up to 24 or 27 km (the Aeolus height bins also adjust to the ground elevation, which varies from sea level to almost 3000 m between 100 km north and south of MARA), with a height resolution between 500 and 2000 m; from mid-October until December it was up to 17 or 20 km (apart from 2 weeks at the beginning of November when height coverage was only up to 14–17 km), with a height resolution between 500 and 1000 m. For the period of July to the end of October, the height coverage for Rayleigh winds over the ESRAD site was up to 24 km, with a height resolution between 500 and 2000 m; from mid-October to December it was up to 20 km, with a height resolution between 500 and 1000 m (apart from 2 weeks at the beginning of November when height coverage was only up to 14 km).
Mie wind profiles are provided for 14 km (or shorter) accumulation lengths, so there are generally several Mie profiles within 100 km of the radar. The number of valid Mie wind measurements in each profile is very small. Between 1 and 14 Mie wind profiles were found for each pass (mean 11), with on average only one valid Mie wind per profile at MARA and two at ESRAD. At MARA a third of passes and at ESRAD 5 % of passes had no valid Mie winds. Valid Mie winds were found only below 11 km height at MARA and 13 km at ESRAD. Since the Mie wind data are so sparse, we average all profiles within 100 km of the radar to make a single profile, using the same height bins as the Rayleigh wind profile (closest to the radar) during the same pass. Before averaging, we reject Mie HLOS winds with an error estimate >5 m s−1 (and if the validity flag is 0). The rejection thresholds for Mie and Rayleigh winds were chosen as recommended by Rennie and Isaksen (2020). Those authors found appropriate thresholds subjectively based on a compromise between the number of observations that pass quality control and the overall quality of the dataset. (Note that the closest Rayleigh clear profile is chosen before quality criteria are applied.) The locations of all available Aeolus wind profiles, containing at least one valid wind measurement during the comparison period, are shown in Fig. 2.
3.2 MARA data
The MARA radar operates in three different modes, with different height coverage and resolution, interlaced, with 1 min for each mode (Table 1). The length of the radar pulse determines the height resolution. Shorter pulses/a smaller height resolution are aimed at the lower altitudes where the scattered signal is strong. Longer pulses, with a wider height resolution, are needed for the upper troposphere where the scattered signal is much weaker. The scattered signal is intrinsically highly variable in time and the 1 min wind estimates show considerable random variation. The Aeolus measurements which we compare with correspond to an 87 km (Rayleigh), or up to 200 km (Mie) distance along the satellite track and may be located up to 100 km from the radar, so there is no sense in comparing instantaneous measurements. We instead use averages from 30 min before to 30 min after the satellite passage. We also average to the same height intervals as the corresponding Rayleigh wind profile.
Table 1Main characteristics of the radar operating modes used in the comparison. MARA (ESRAD) is located at 117 m (295 m) above the mean sea level. Note that due to technical problems, the mode fca_4500 did not operate at MARA from 24 June–2 September 2019.
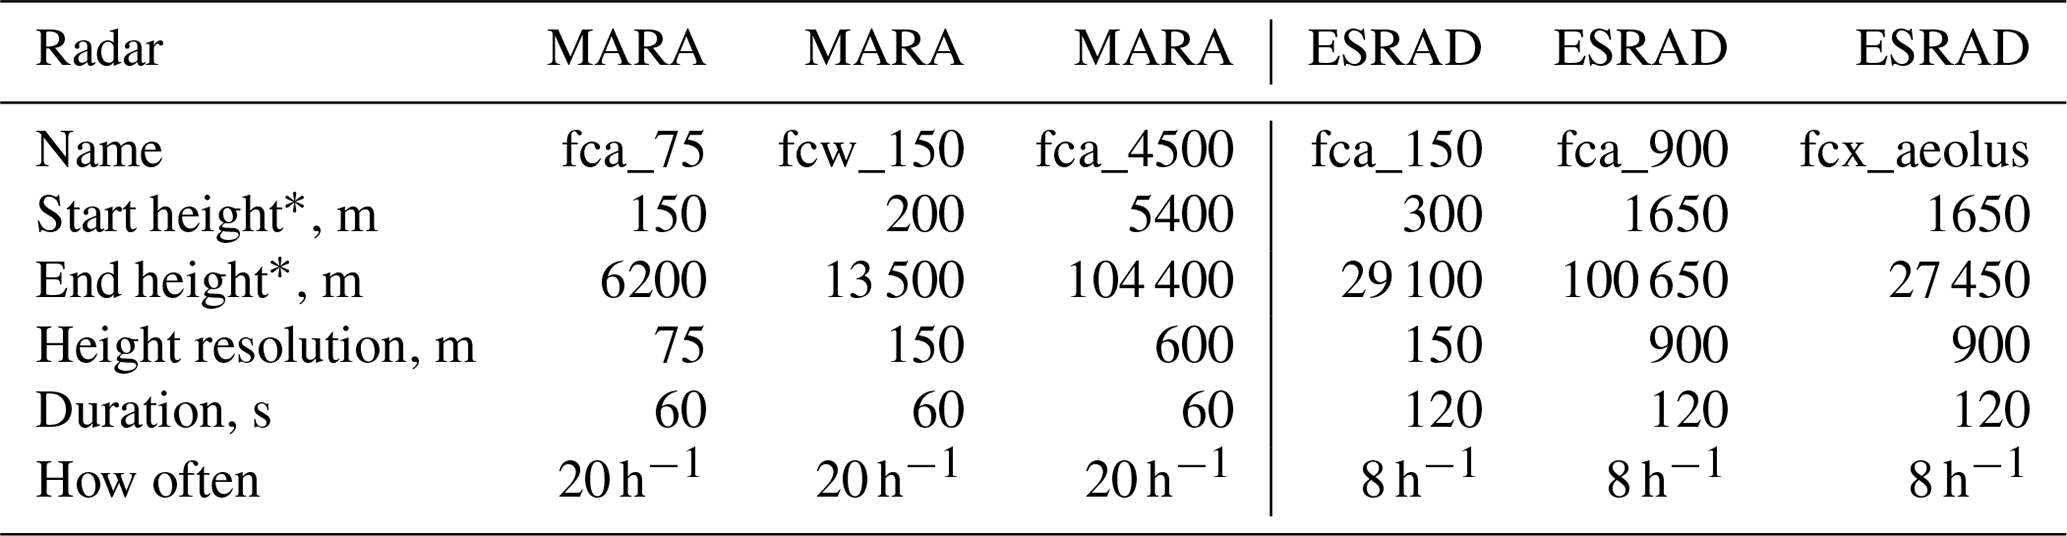
* Height above the ground.
Radar wind estimates are quality checked before averaging. Checks include the absence of non-atmospheric echoes, a high enough signal-to-noise ratio (>1) and mathematically successful fitting of the wind. For example, in a 1 h ×1 km (vertically) averaging bin, there are radar wind estimates from up to sixty 1 min time intervals and 20 heights at MARA. Some of these estimates will be invalid because of a low signal-to-noise ratio or because the full-correlation method used to derive the wind has been unsuccessful, which particularly affects the radar measurements with the shortest height resolution. In practice, between 100–400 estimates are averaged in typical height bins below 5 km altitude but only 10–20 above that. The large numbers of individual measurements in the lower troposphere lead to low values for the uncertainties in the mean values (standard error of the mean), typically <0.5 m s−1 for MARA. In order to further reject uncertain measurements, we reject averaged winds if the standard error of the mean is >2 m s−1.
3.3 ESRAD data
The ESRAD radar operated in four different modes, with different height coverage and resolution, interlaced, with 1 or 2 min for each mode. Three of these provided good enough quality data for use in this comparison (Table 1). The mode “fcx_aeolus” was implemented, with shorter height coverage, which allows faster repetition of the radar pulses, to try to retrieve more valid wind estimates from the upper troposphere for comparison with Aeolus. As at MARA, we use averages from 30 min before to 30 min after the satellite pass and average to the same height intervals as the corresponding Rayleigh wind profile.
As at MARA, ESRAD radar wind estimates are quality checked before averaging. At ESRAD, for example, in a 1 h ×1 km (vertically) averaging bin, there are radar wind estimates from up to twenty-two 2 min intervals and eight heights at ESRAD. In practice, between 20–70 radar wind estimates are averaged for height bins in the lower troposphere (below 6 km) and 10–20 at higher altitudes at ESRAD. Uncertainties in the mean values (standard error of the mean) are typically less than 1 m s−1 for ESRAD. As with MARA, we reject averaged winds if the standard error of the mean is >2 m s−1. We also correct ESRAD wind components for the systematic underestimate found in comparison with radiosondes and reanalysis (Belova et al., 2021): 8 % in zonal wind and 25 % in meridional wind. Radar winds are measured from time delays between signals received on different sections of the radar antenna array as the diffraction pattern of the scattered radio waves is advected by the wind. The baseline for determining the zonal component is longer than that for the meridional one, and the receivers for the different parts of the array are not equally susceptible to non-random noise. This leads to underestimates of the wind speed which differ between the two components (Belova et al., 2021).
3.4 ERA5 data
To provide a further check, we also compare Aeolus and radar winds with the ECMWF reanalysis ERA5 (Hersbach et al., 2020). ERA5 winds were taken from the closest grid point to each radar location (68.00∘ N, 21.00∘ E for ESRAD; 70.75∘ S, 11.75∘ E for MARA) and the closest hour to each Aeolus pass. Wind profiles are interpolated to the centre heights of the corresponding Aeolus Rayleigh wind profile height bins. The comparison is made using only those heights at which valid wind measurements are available for Aeolus Rayleigh clear and radar (or Aeolus Mie cloudy and radar). Note that neither ESRAD nor MARA data nor Aeolus data were assimilated by ECMWF for the period studied (July–December 2019).
To compare radar and Aeolus winds, we first calculate what the HLOS wind should be according to the zonal (U) and meridional (V) wind components measured by the radar. (We could in principle include the vertical wind component measured by the radar, but this was found to be negligible in the 1 h averages.)
where φAeolus is the azimuth from the laser scattering volume to the satellite.

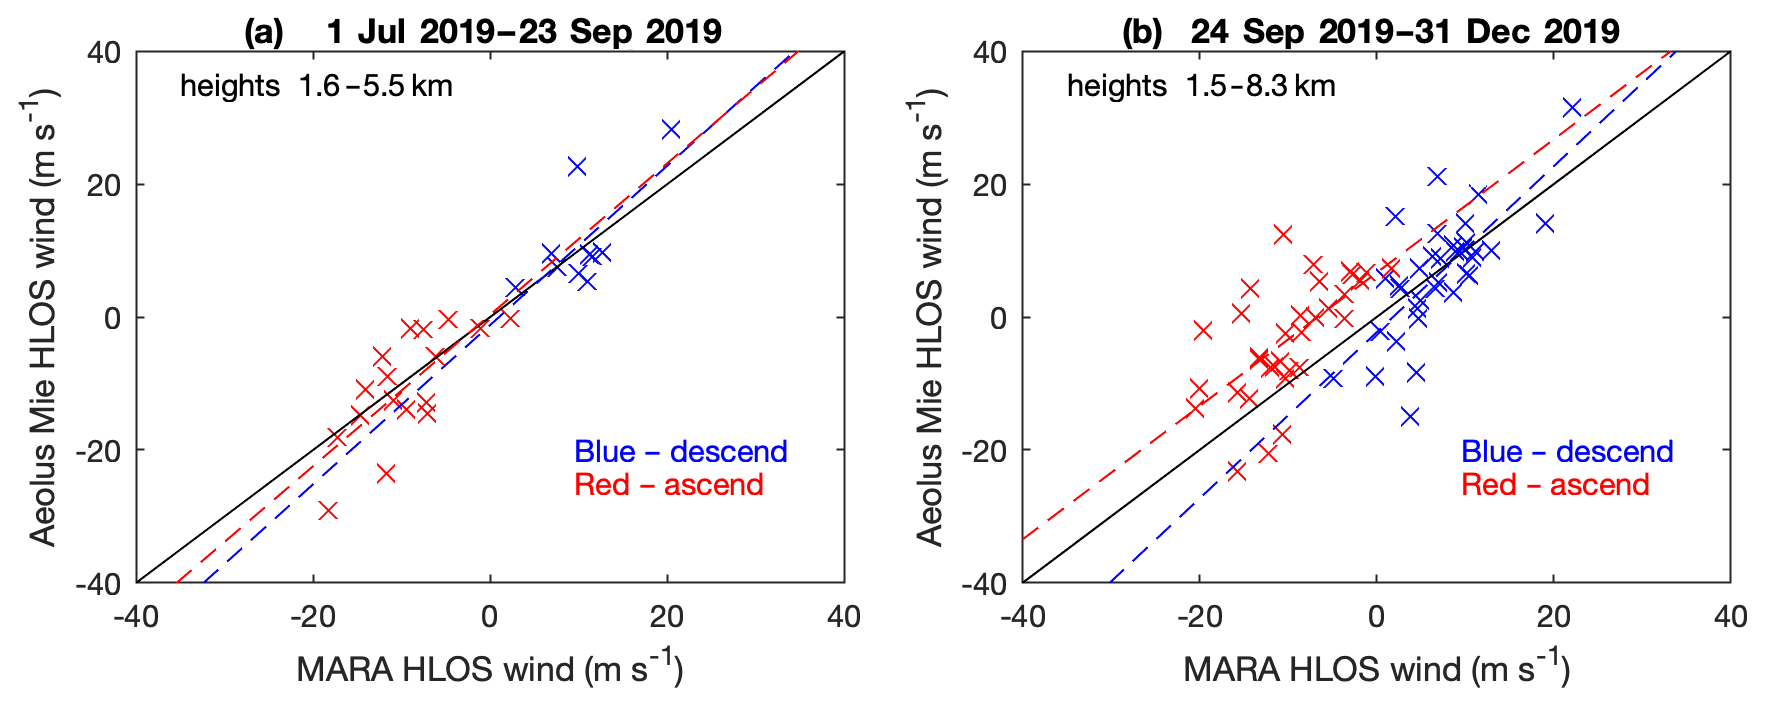
Figure 3Scatter plots of Aeolus Rayleigh HLOS winds against HLOS winds according to MARA radar data. Red crosses indicate measurements made on ascending tracks and blue crosses are used for descending tracks. Dashed red and blue lines show fitted regression lines. Black dashed line indicates equality. Heights indicated are the lowest and highest where valid winds are available for comparison. (a) The Antarctic winter period 1 July–23 September 2019; (b) summer 24 September–31 December 2019.
To quantify the differences between radar and Aeolus winds, we also compute mean differences (bias) and the standard deviation (SD) of the differences as
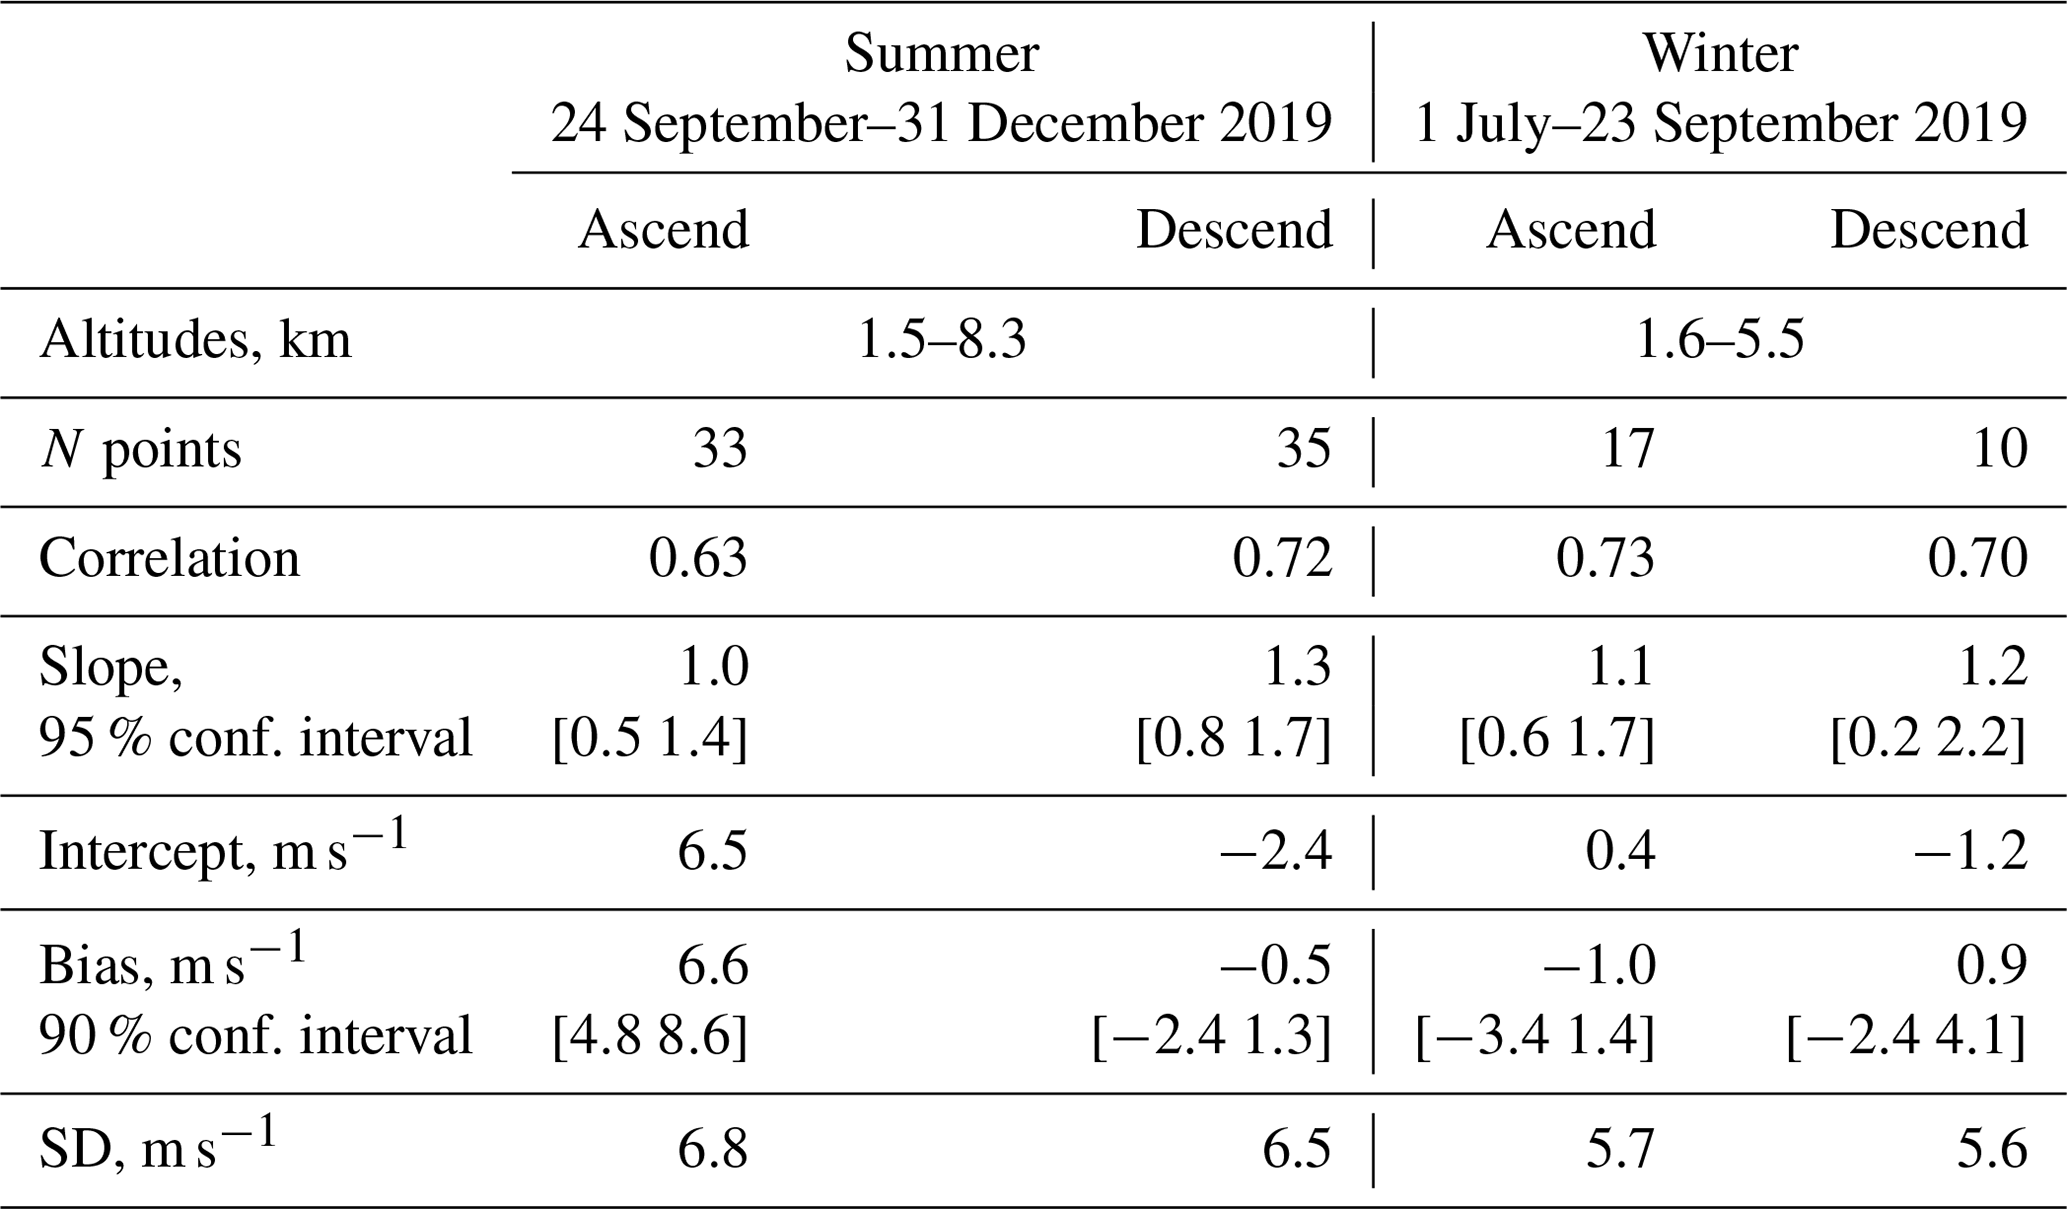
The HLOS winds measured by the radars for every Aeolus collocation event were calculated according to Eq. (1) using the zonal and meridional winds averaged as described in Sect. 3. All data from 1 July to 31 December 2019 were divided into two seasons: sunlit (“summer”, 1 July–23 September at ESRAD, 24 September–31 December at MARA) with 12–24 h direct sunlight and non-sunlit (“winter”) covering the rest of the time. Comparison between the Aeolus HLOS Rayleigh/Mie winds and HLOS winds measured by the radars has been made for each season separately. We computed correlation, a linear fit of Aeolus on the radar winds, a bias defined as the mean Aeolus–radar difference (Eq. 2) and the standard deviation (SD) of the difference (Eq. 3). In order to evaluate the uncertainties of the results, we estimated the confidence intervals for the slope of the fit and for the bias. For the calculation of the altitude profiles of the bias and SD, all Aeolus and radar wind data were collected into 1 km height bins.
4.1 Aeolus vs. MARA
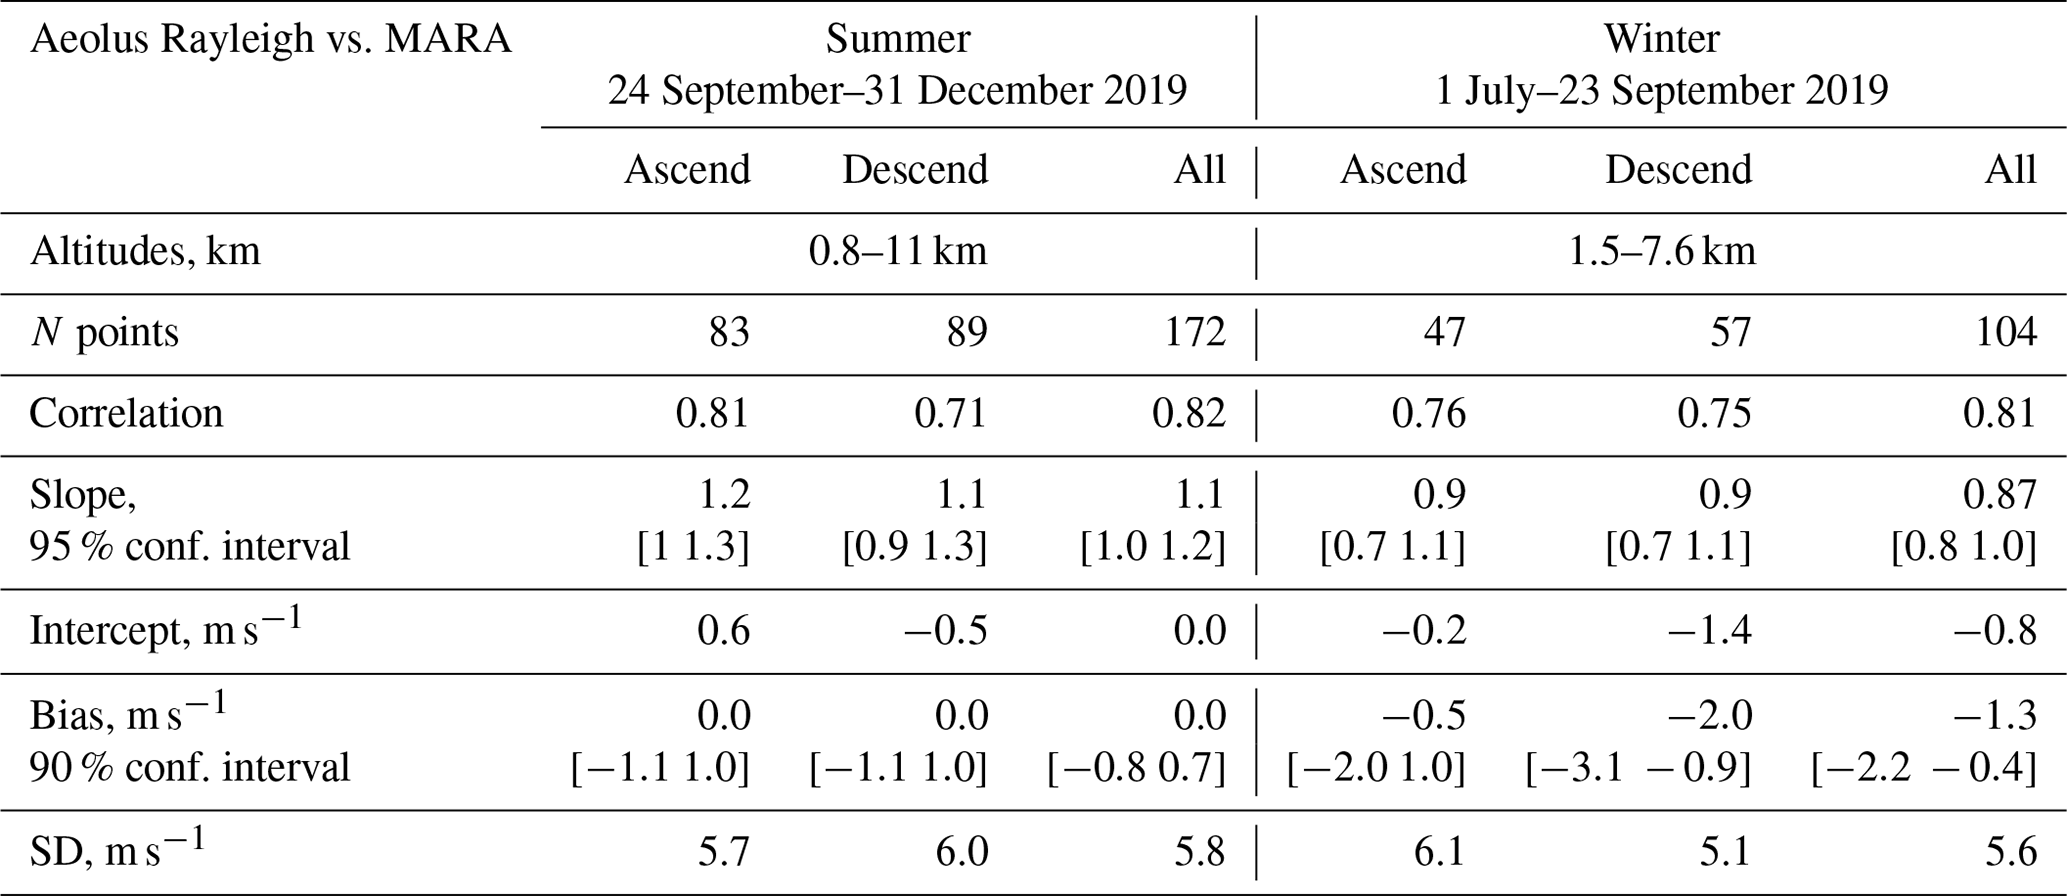
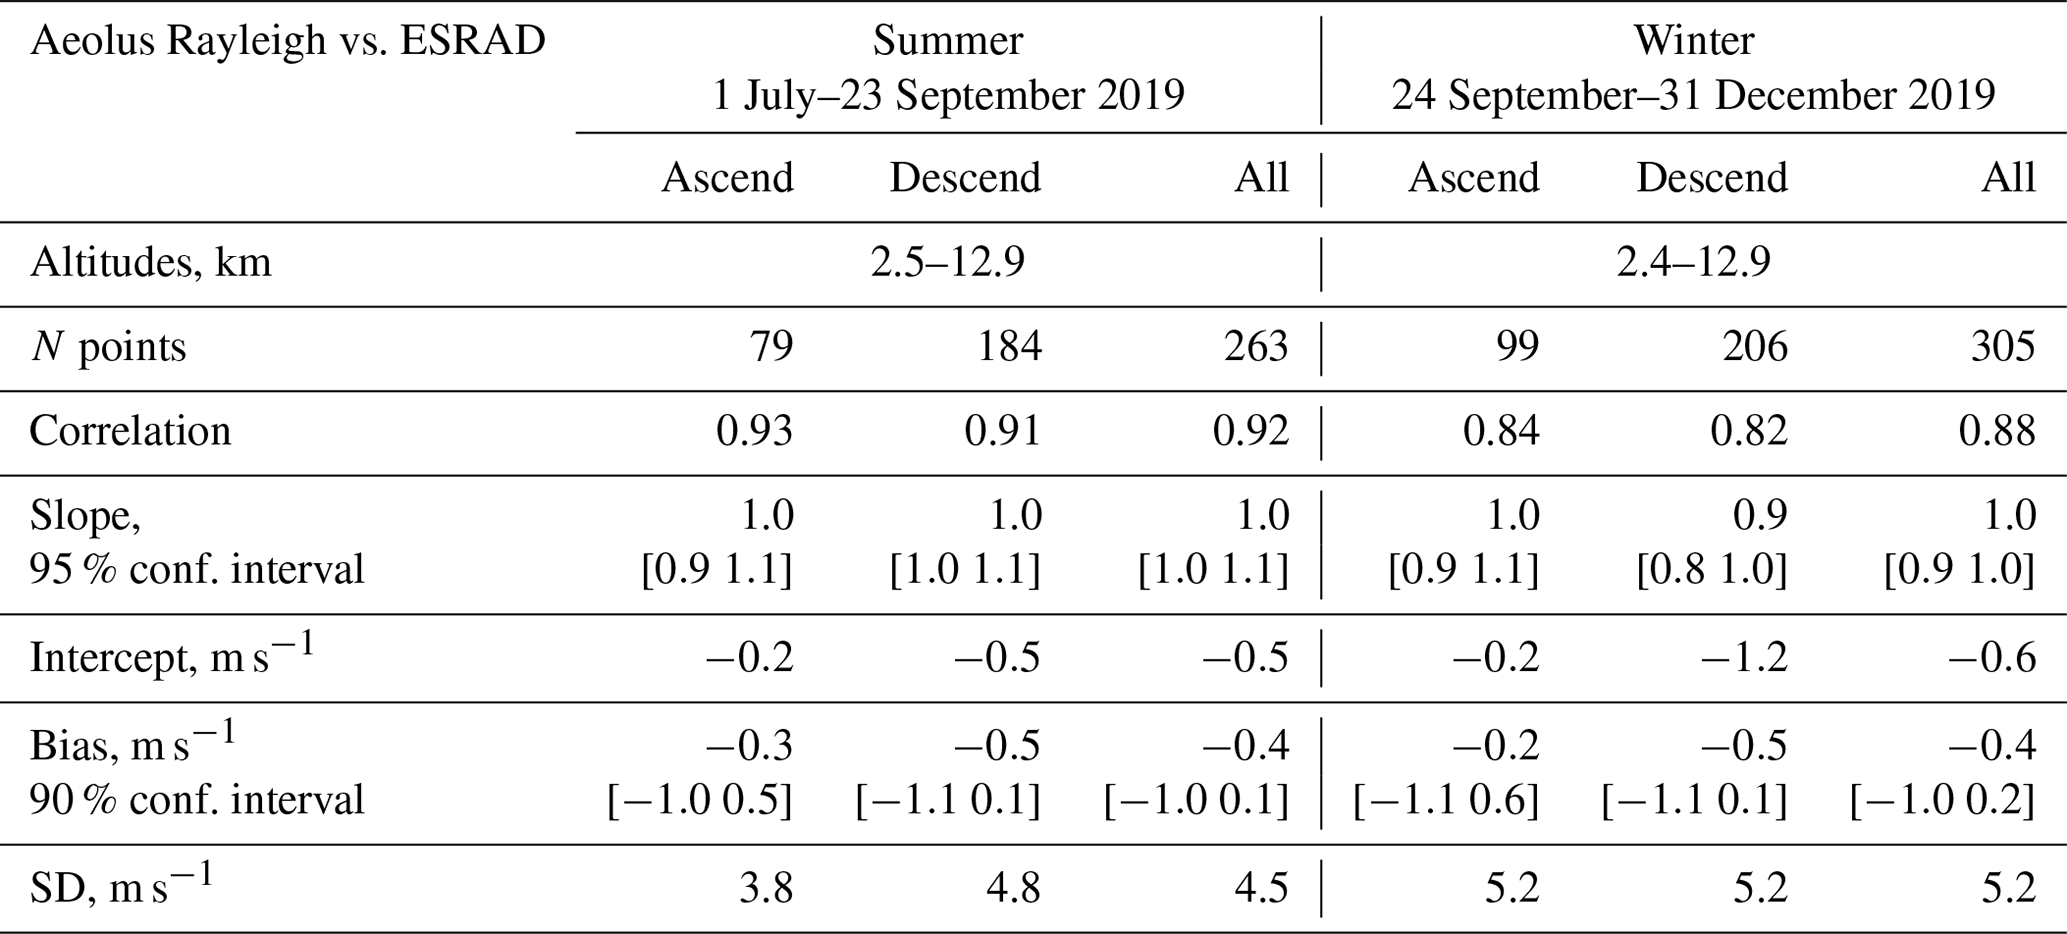
In Fig. 3 the comparison of Aeolus Rayleigh and MARA winds is presented. The data for the descending orbits are marked in blue and those for the ascending orbits in red. We also plot there the linear fits of Aeolus on MARA winds as dashed lines. The comparison results are presented in Table 2. We see a very good agreement between the Aeolus Rayleigh and MARA HLOS winds for both seasons and pass directions: the slope of the fit is not significantly different from 1 and the bias is close to 0, with one exception: for the descending orbits in winter there is a bias of about −2 m s−1. However, the standard deviations of the Aeolus–radar differences are relatively large (5–6 m s−1). Since no large differences were found between the ascending and descending orbits, we made calculations for all overpasses as well.
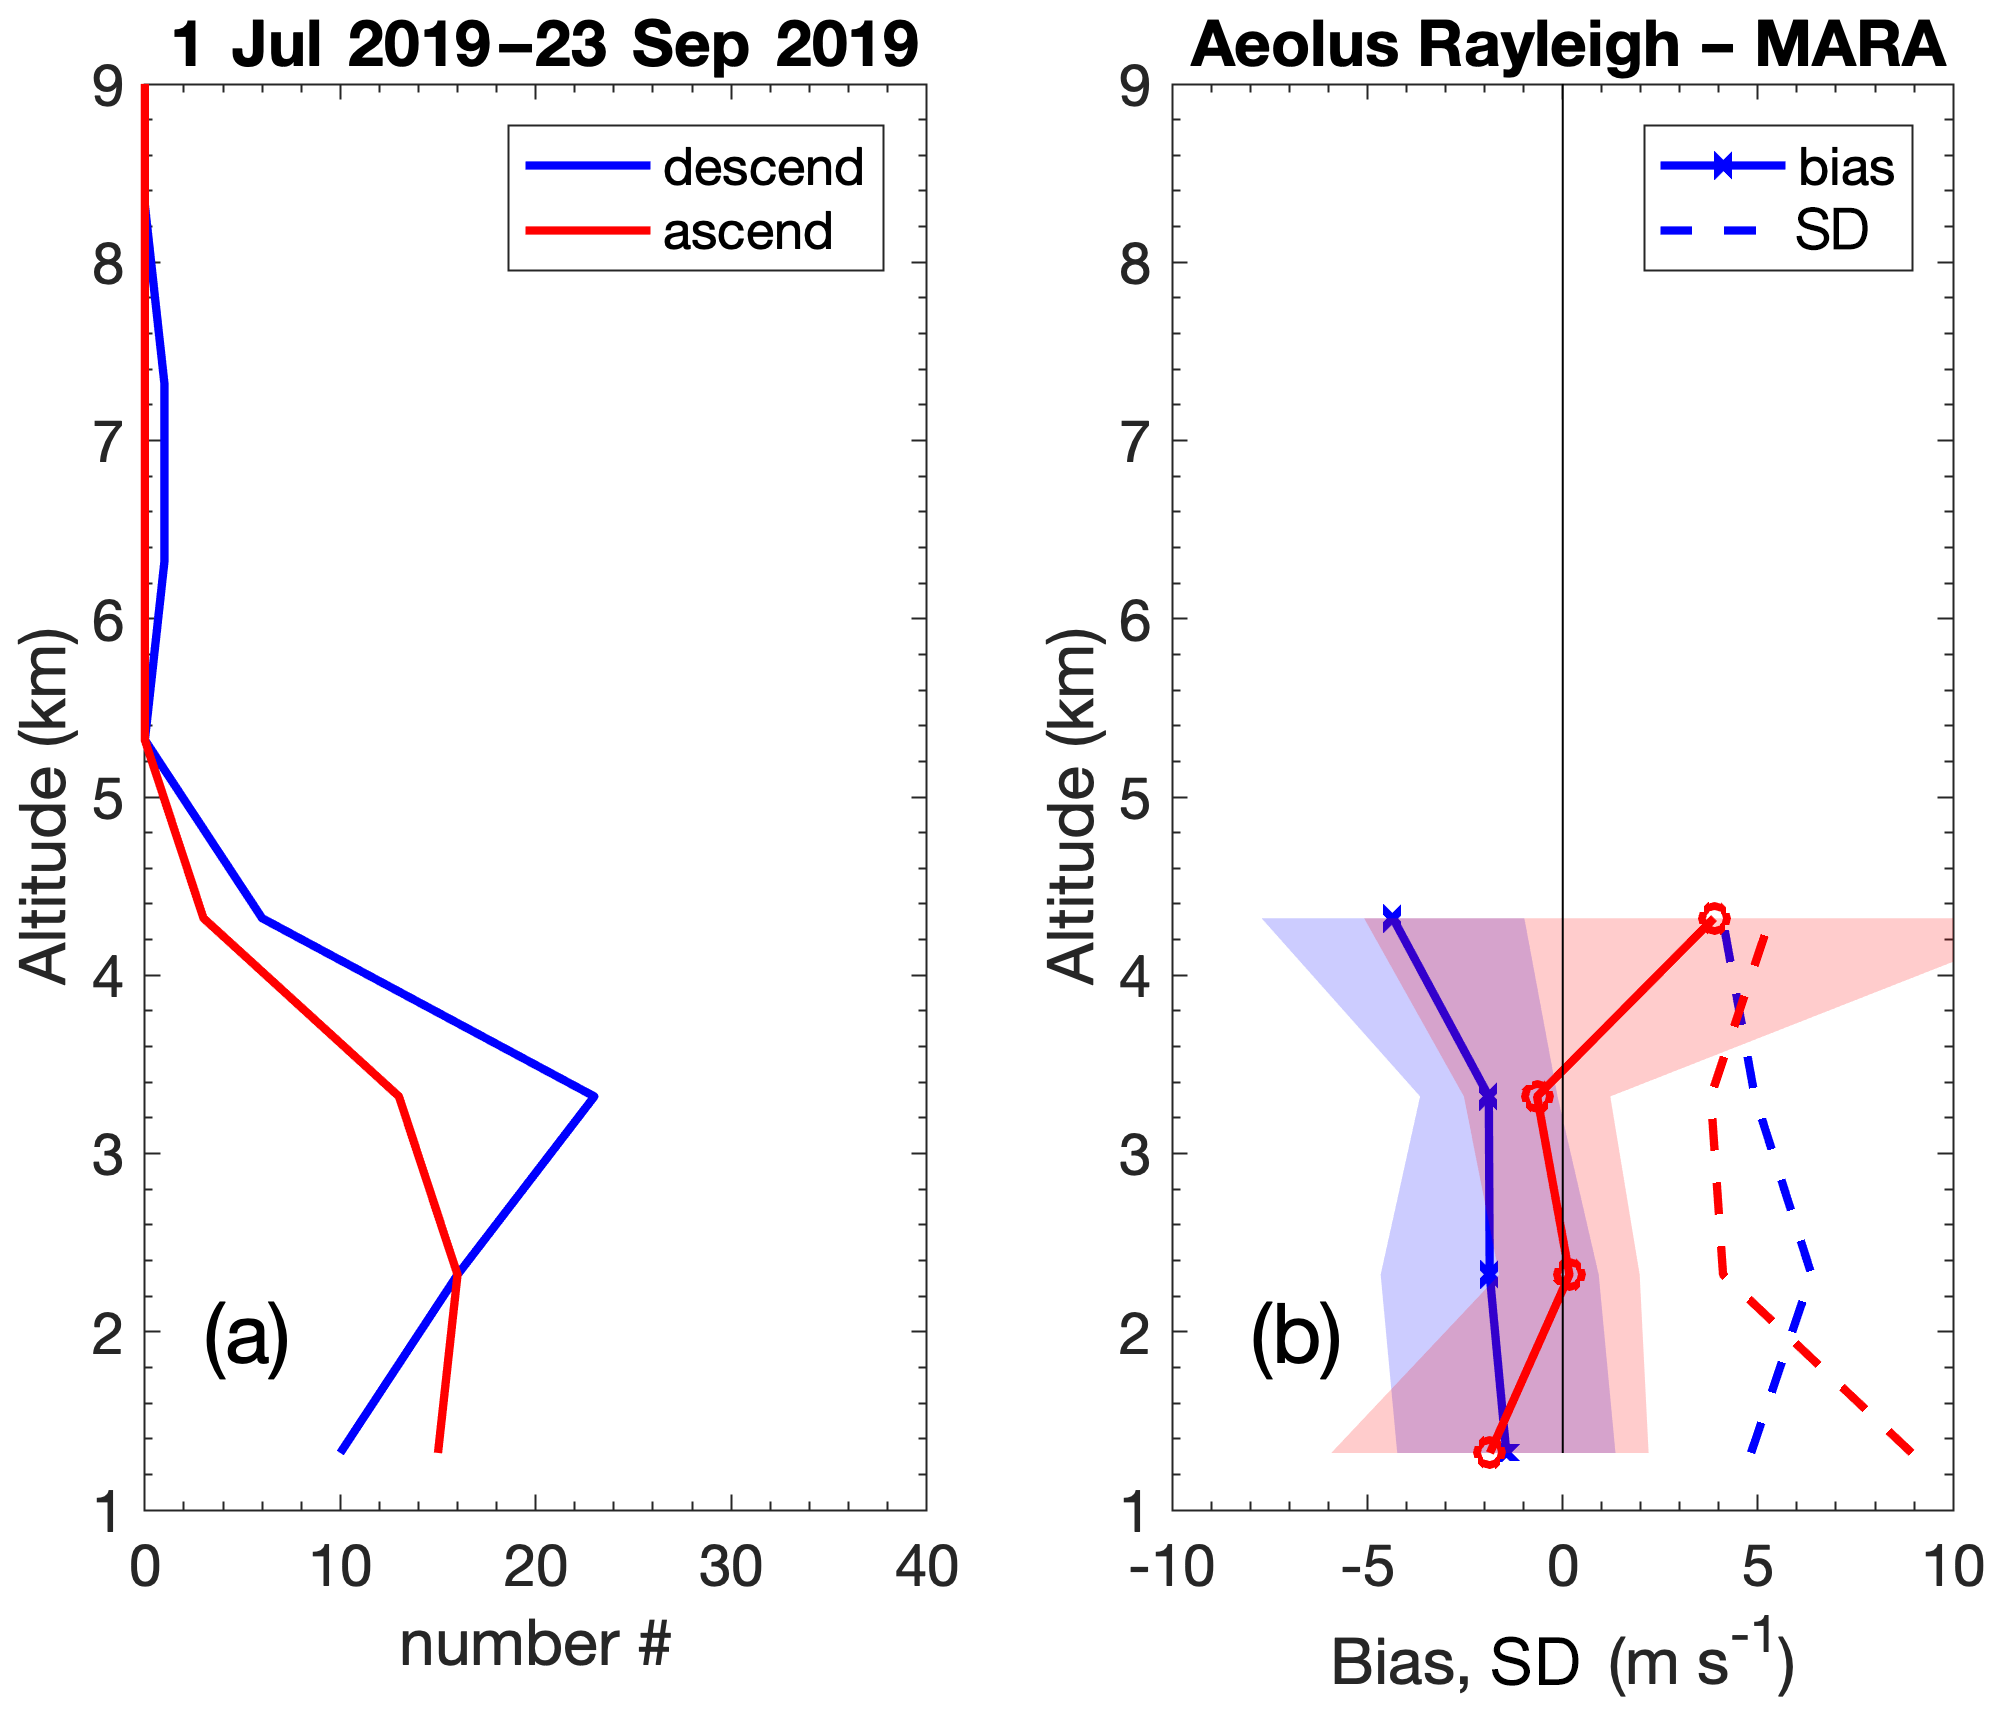
Figure 4Height profiles in 1 km bins of (a) the number of comparison points available and (b) mean value (bias) and standard deviation of the differences between Aeolus Rayleigh HLOS winds and MARA-derived HLOS winds for the Antarctic winter period 1 July–23 September 2019. Red lines and shading are for ascending tracks and blue is for descending ones. Solid lines in (b) show the bias, with the shaded areas corresponding to the 90 % confidence interval. Dashed lines in (b) show the standard deviation.
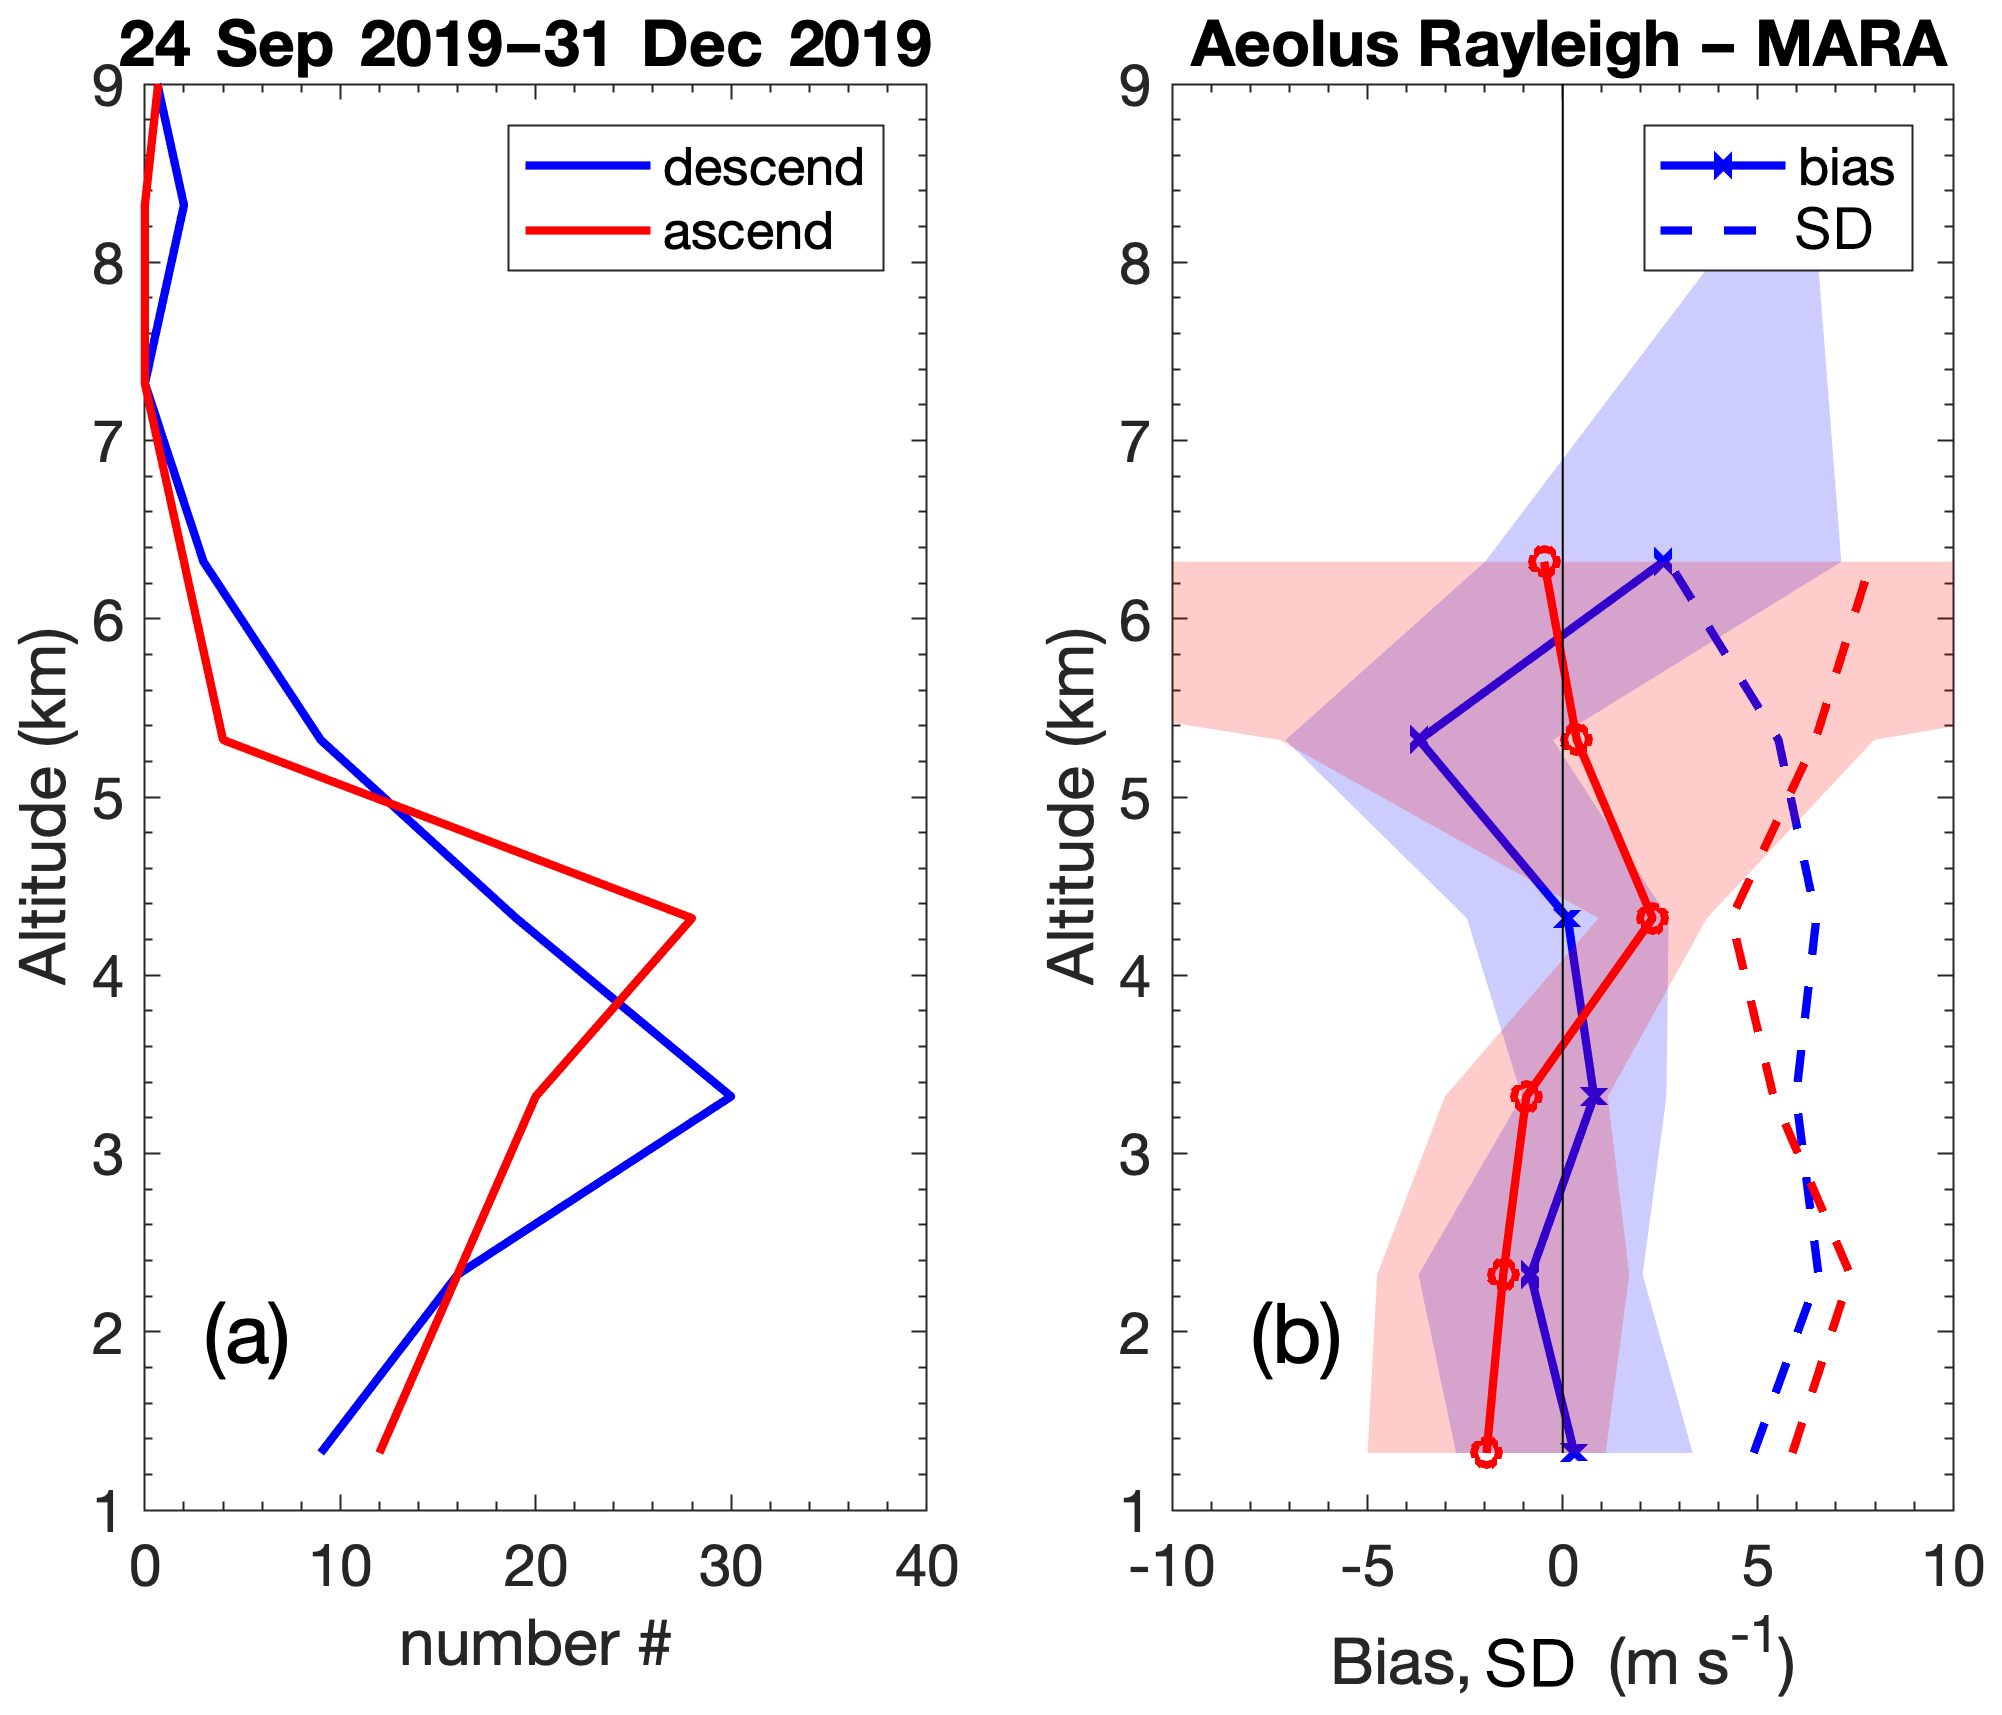
Figure 5The same as Fig. 4. but for Aeolus Rayleigh HLOS winds and MARA-derived HLOS winds for the Antarctic summer period 24 September–31 December 2019.
The behaviour of the bias and standard deviation of the Aeolus–radar differences as a function of height is shown in Figs. 4 and 5. In both figures it can be seen that the 90 % confidence intervals for both ascending and descending orbits largely overlap and, at most heights, overlap the zero line.
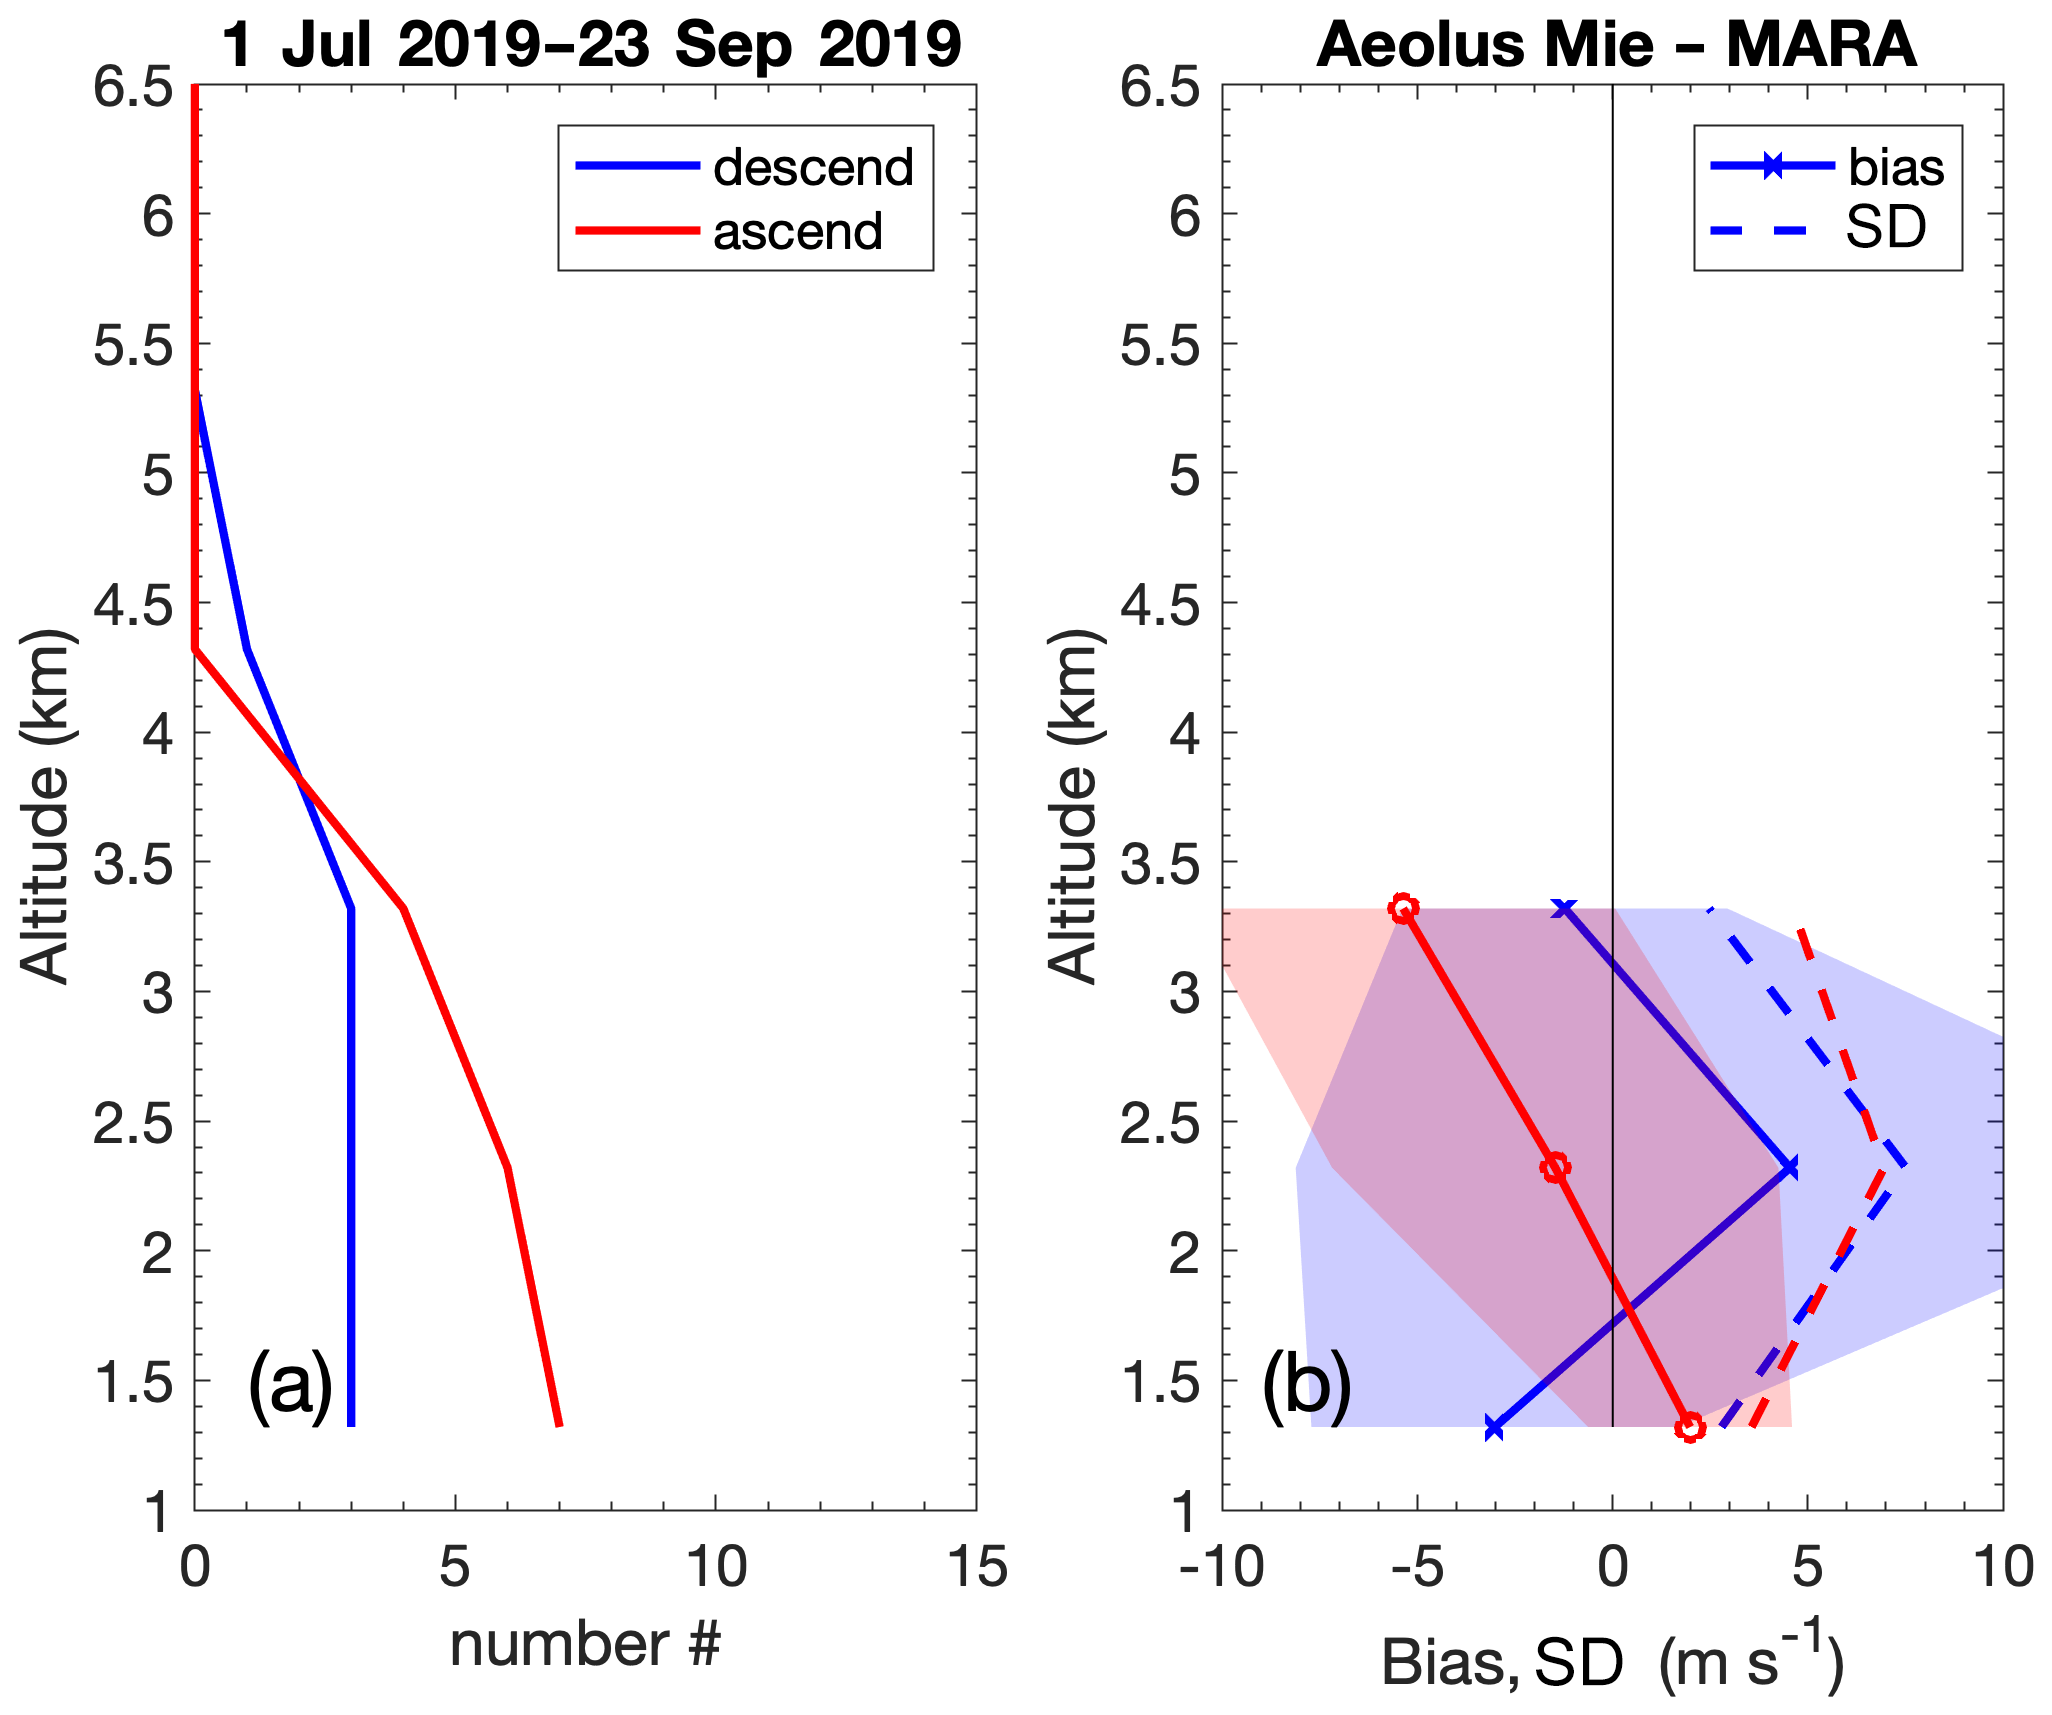

Figures 6–8 and Table 3 show the results of the comparison for Aeolus Mie winds. The height coverage and the number of valid Mie data points is small, especially for the winter season, which leads to high uncertainties. The biases are small except for the ascending passes in summer where the bias is substantial: 6.6 m s−1. This deviation is clearly seen in Fig. 6, and in the height-resolved plot in Fig. 8, between 2.5 and 4.5 km, it is systematically significantly well above zero. We note that the bias only appears for the ascending track, and only for Mie winds, not for Rayleigh winds. Closer examination of the data (not shown here) also shows that the bias affects both the closer tracks to the north-east of the radar and those to the south-west (see Fig. 2).
In Fig. 9 we show monthly average biases between MARA and Aeolus wind measurements and also a comparison with ERA5 winds (for the closest hour and closest grid point to the MARA location). There is clearly a close agreement between MARA and ERA5 and very similar biases between Aeolus and ERA5 as between Aeolus and MARA. The small negative bias seen for Rayleigh wind measurements for winter descending orbits appears only in August and is barely significant at the 90 % confidence limit in that month. Note also that the confidence limits for the biases are wider in winter due to fewer comparison points. In Fig. 9, the large positive bias seen for Mie wind measurements for summer ascending orbits appears in both October and November, in comparison with both MARA and ERA5, and is clearly significant at the 90 % confidence limit.
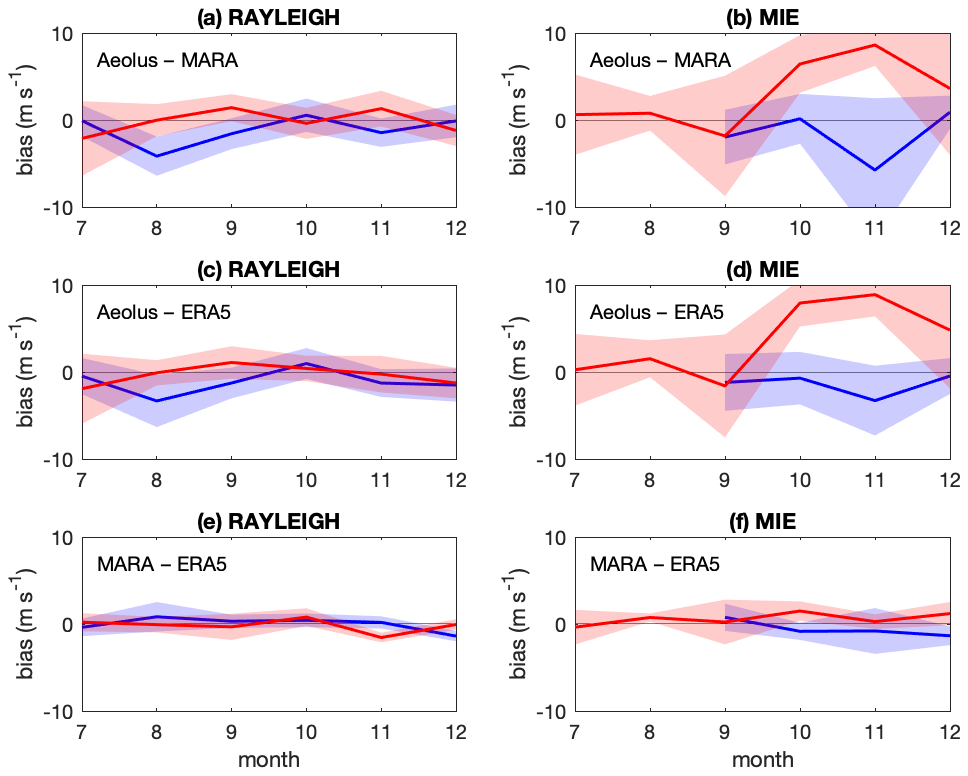
Figure 9Month-by-month mean values of biases in HLOS winds (solid lines) and 90 % confidence limits (shaded areas) at MARA. Red is for ascending tracks and blue is for descending ones. (a) Aeolus Rayleigh minus MARA, (b) Aeolus Mie minus MARA, (c) Aeolus Rayleigh minus ERA5, (d) Aeolus Mie minus ERA5, (e) MARA minus ERA5 at available Aeolus Rayleigh comparison times/heights and (f) MARA minus ERA5 at available Aeolus Mie comparison times/heights.
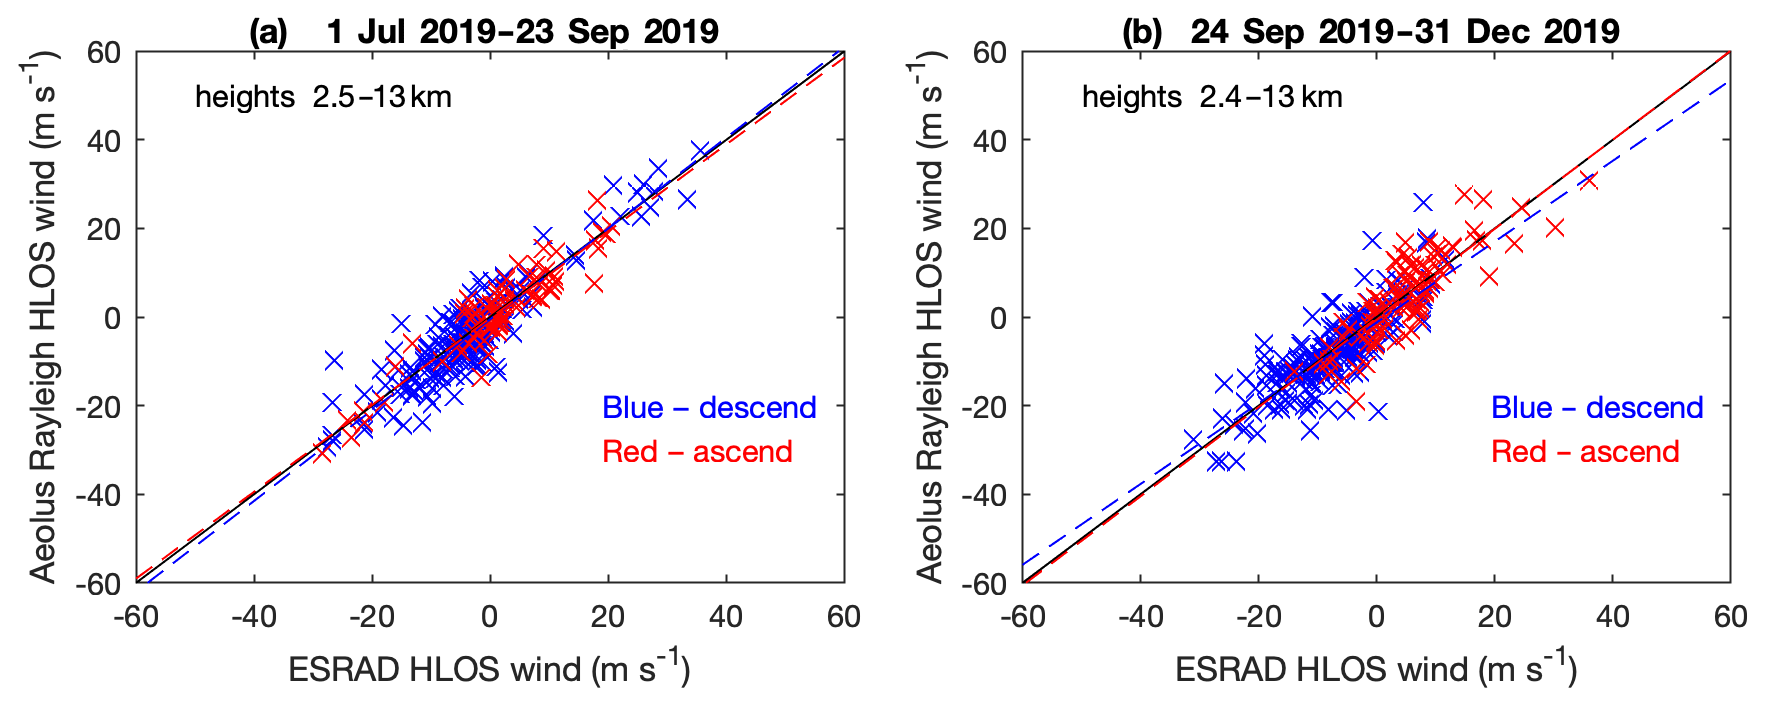
Figure 10Scatter plots of Aeolus Rayleigh HLOS winds against HLOS winds according to ESRAD radar data. Red crosses indicate measurements made on ascending tracks and blue crosses are for descending tracks. Dashed red and blue lines show fitted regression lines. Black dashed line indicates equality. Heights indicated are the lowest and highest where valid winds are available for comparison. (a) The Arctic summer period 1 July–23 September 2019; (b) winter 24 September–31 December 2019.
The random differences between MARA and Aeolus HLOS winds (SD) are 5.7–6.8 m s−1 for summer and 5.1–6.1 m s−1 for winter and similar for Mie and Rayleigh winds. This is much bigger than the standard error for the average radar winds themselves (2 m s−1) and somewhat more than found comparing MARA and radiosonde winds (4 m s−1, Belova et al., 2021). Some of this will be due to the expected random errors of the Aeolus winds (4–5 m s−1 for Rayleigh winds, 3 m s−1 for Mie winds) and the difference in location of MARA and Aeolus measurements (see Fig. 2).
The distance between the observations can be up to 100 km, with the largest spread of locations for the Mie measurements, and is more than in most cases in a comparison with radiosondes. However, the slightly higher random differences in summer compared to winter for Mie winds suggest higher Aeolus random errors in summer, since the distances from MARA do not vary between the seasons and weather systems are more variable, which would lead to more spatial difference in winter rather than in summer. However, given the short length of the analysed time interval, it is possible that this is not a summer/winter effect but just a result of a small number of individual weather systems.
4.2 Aeolus vs. ESRAD
The results of the comparison between Aeolus and ESRAD are presented in Figs. 10–16 and Tables 4 and 5. In general, there are significantly more valid data points for Rayleigh, as well for Mie winds, than in comparison with MARA, and height coverage is also extended. The results for Rayleigh winds are summarized in Table 4. The slopes of the linear fits are about 1, and the biases are 0, within the uncertainties. Again, since there are no large differences in bias or slope between ascent and descent, we also calculate the values for both sets together, and the results similarly show no significant deviation. The height profile of the biases in Figs. 11 and 12 shows apparently significant bias at a few heights but nothing systematically at all heights.

Figure 11Height profiles in 1 km bins of (a) the number of comparison points available and (b) mean value (bias) and standard deviation of the differences between Aeolus Rayleigh HLOS winds and ESRAD-derived HLOS winds for the Arctic summer period 1 July–23 September 2019. Red lines and shading are for ascending tracks and blue is for descending ones. Solid lines in (b) show the bias, with the shaded areas corresponding to the 90 % confidence interval. Dashed lines in (b) show the standard deviation.
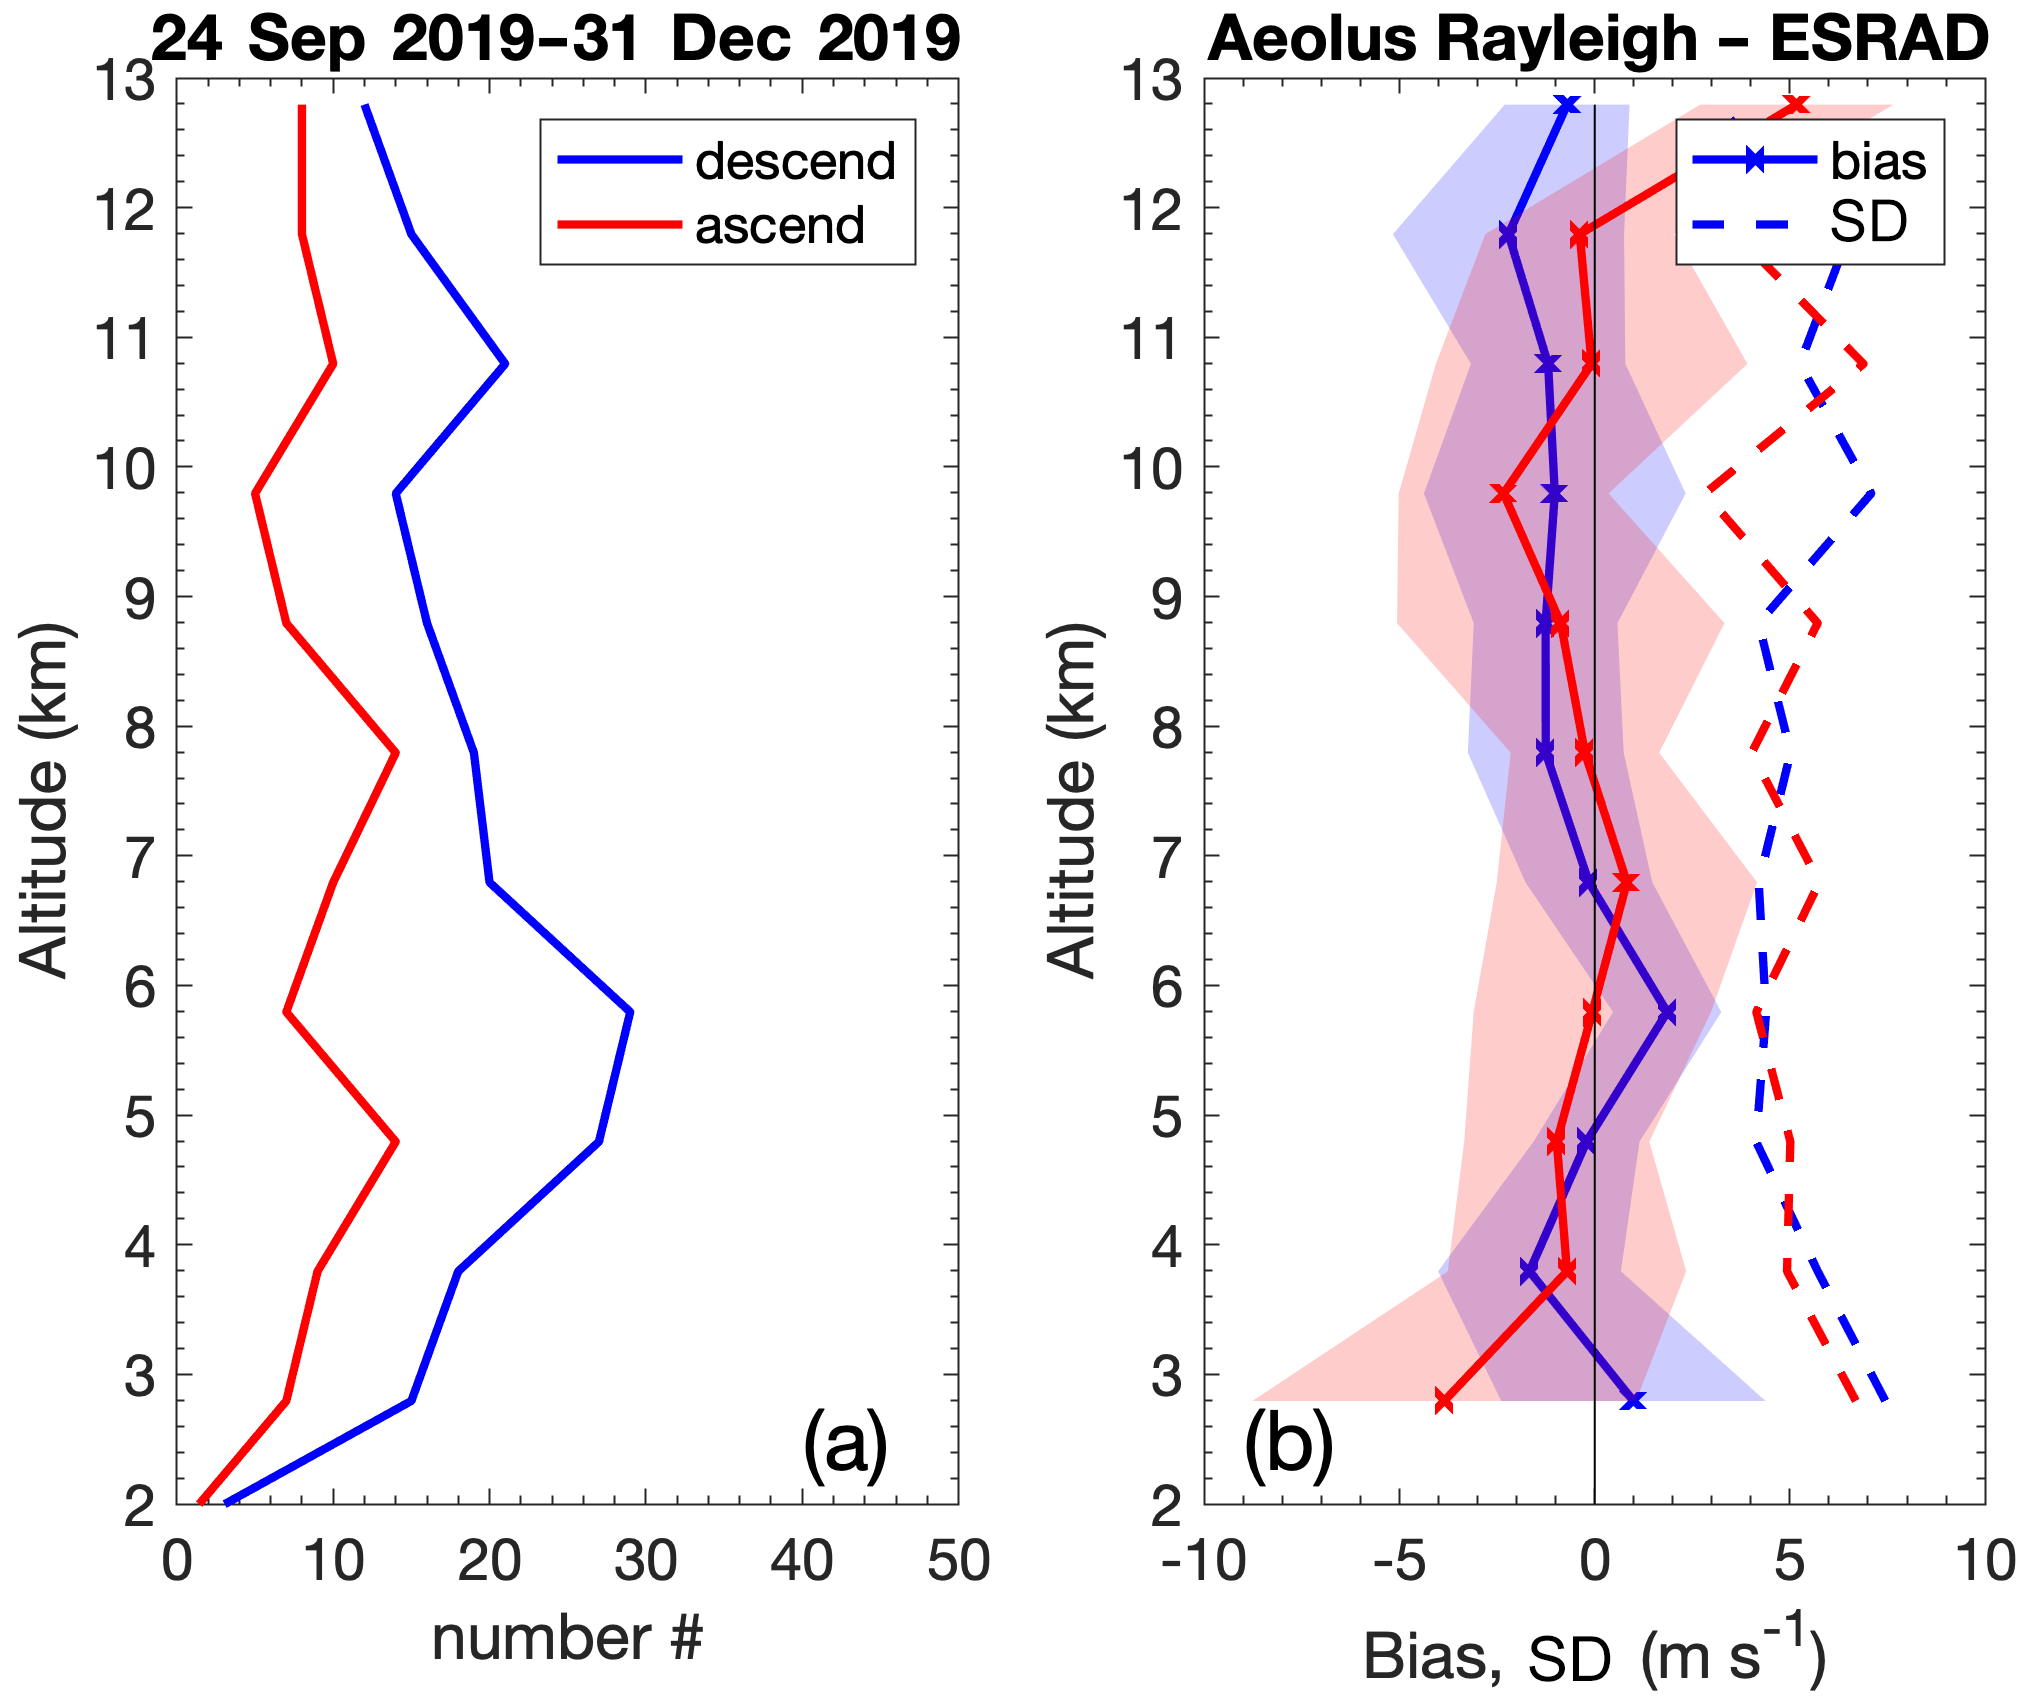
Figure 12The same as Fig. 11 but for Aeolus Rayleigh HLOS winds and ESRAD-derived HLOS winds for the Arctic winter period 24 September–31 December 2019.
For Mie winds (Figs. 13–15, Table 5), the number of available comparisons is small but higher than at MARA, and the height coverage is better. The slopes of the regression lines are close to 1, and the bias is not significantly different from 0, except in the case of the ascending orbits in winter when the average bias is found to be 2.4 m s−1. In Fig. 15 we can see that this bias is systematically positive at all heights, although the number of data points is very small and the significance is marginal.
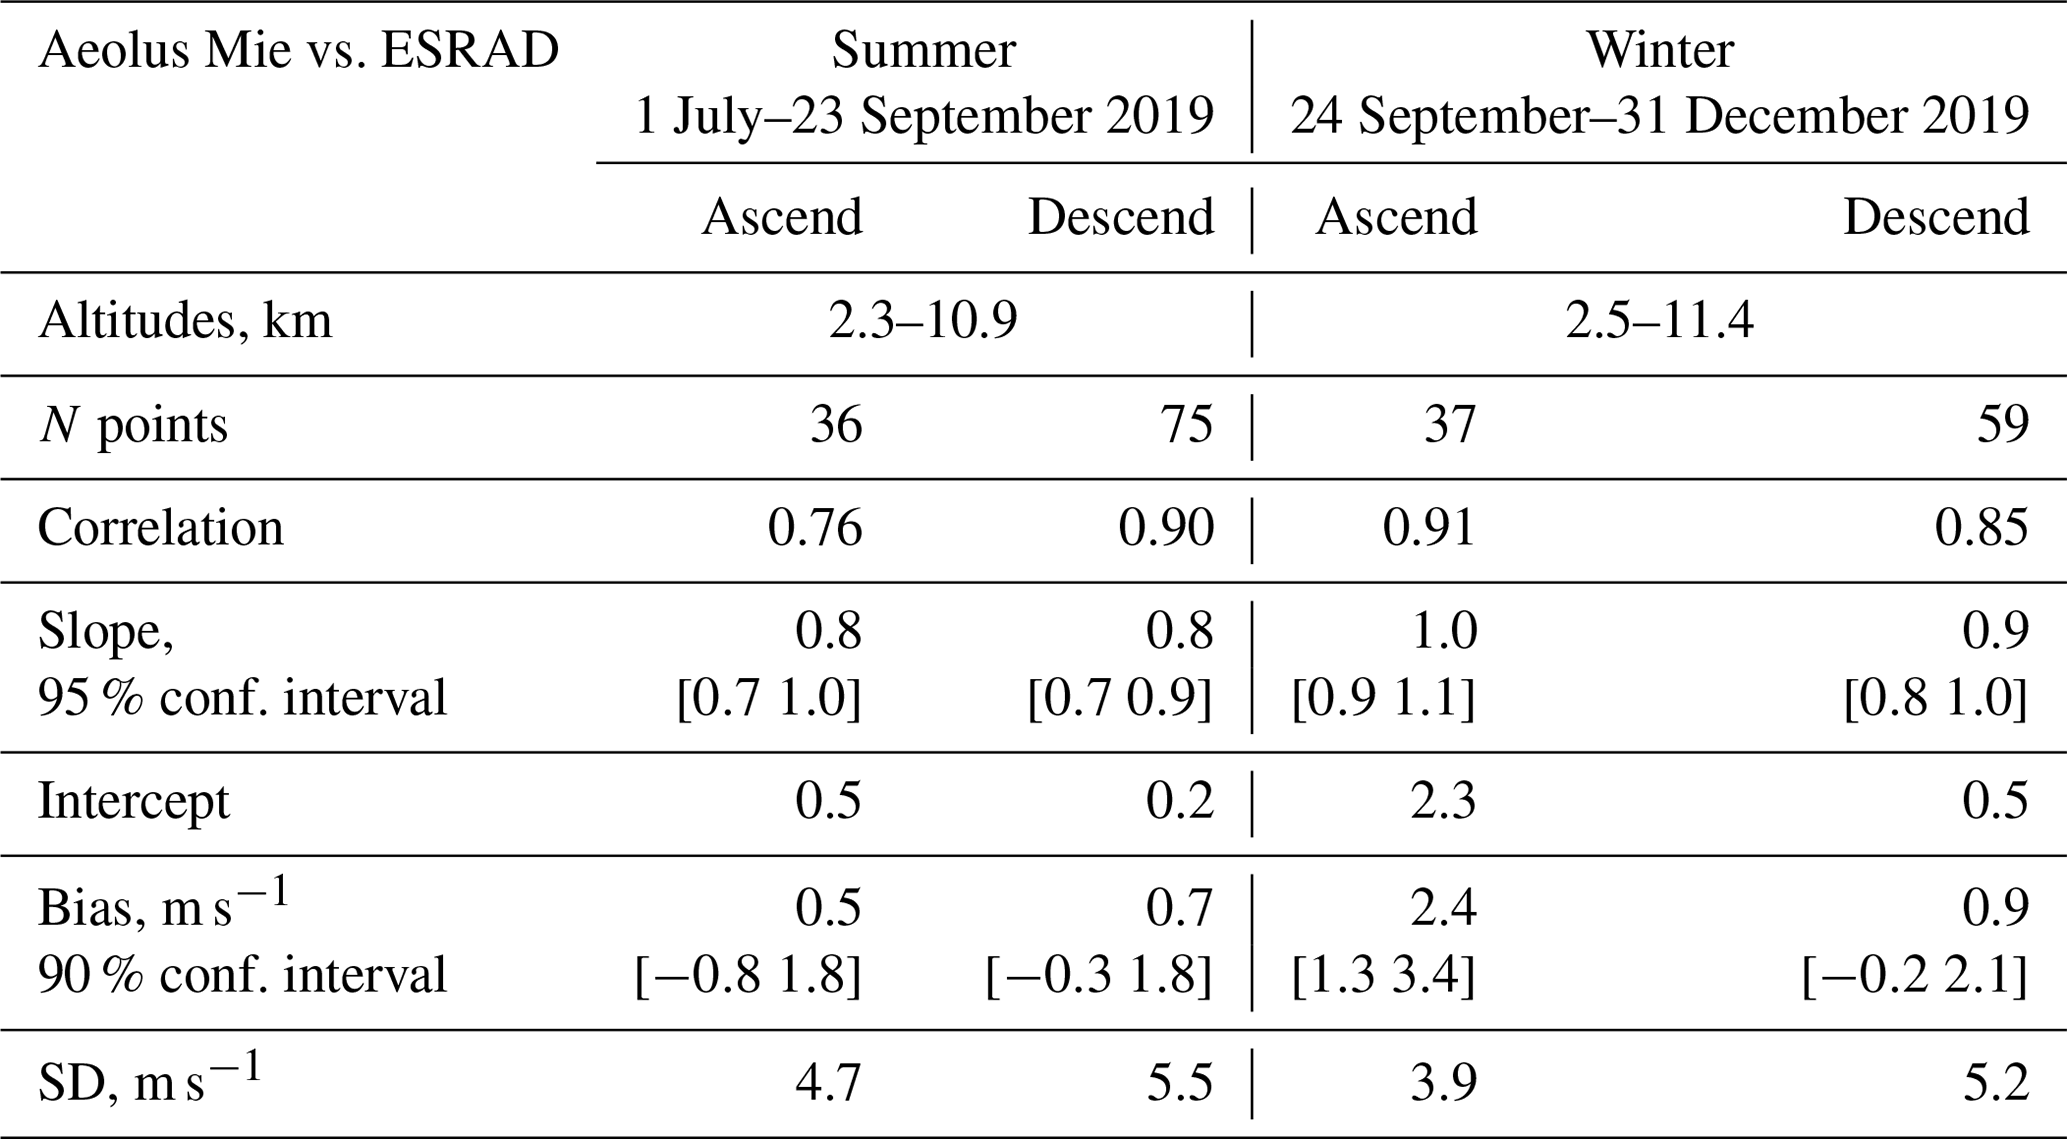
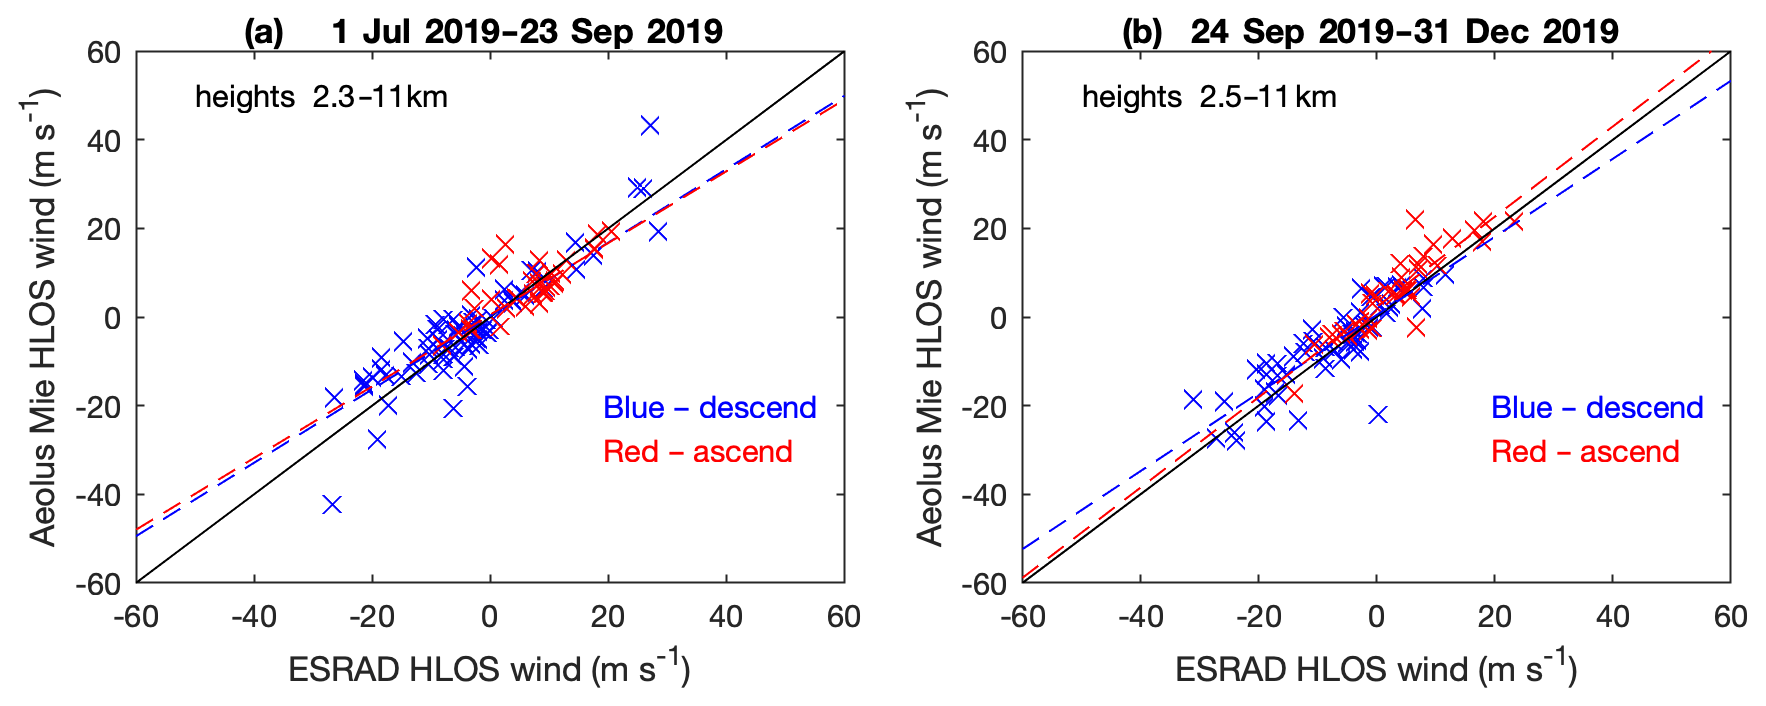
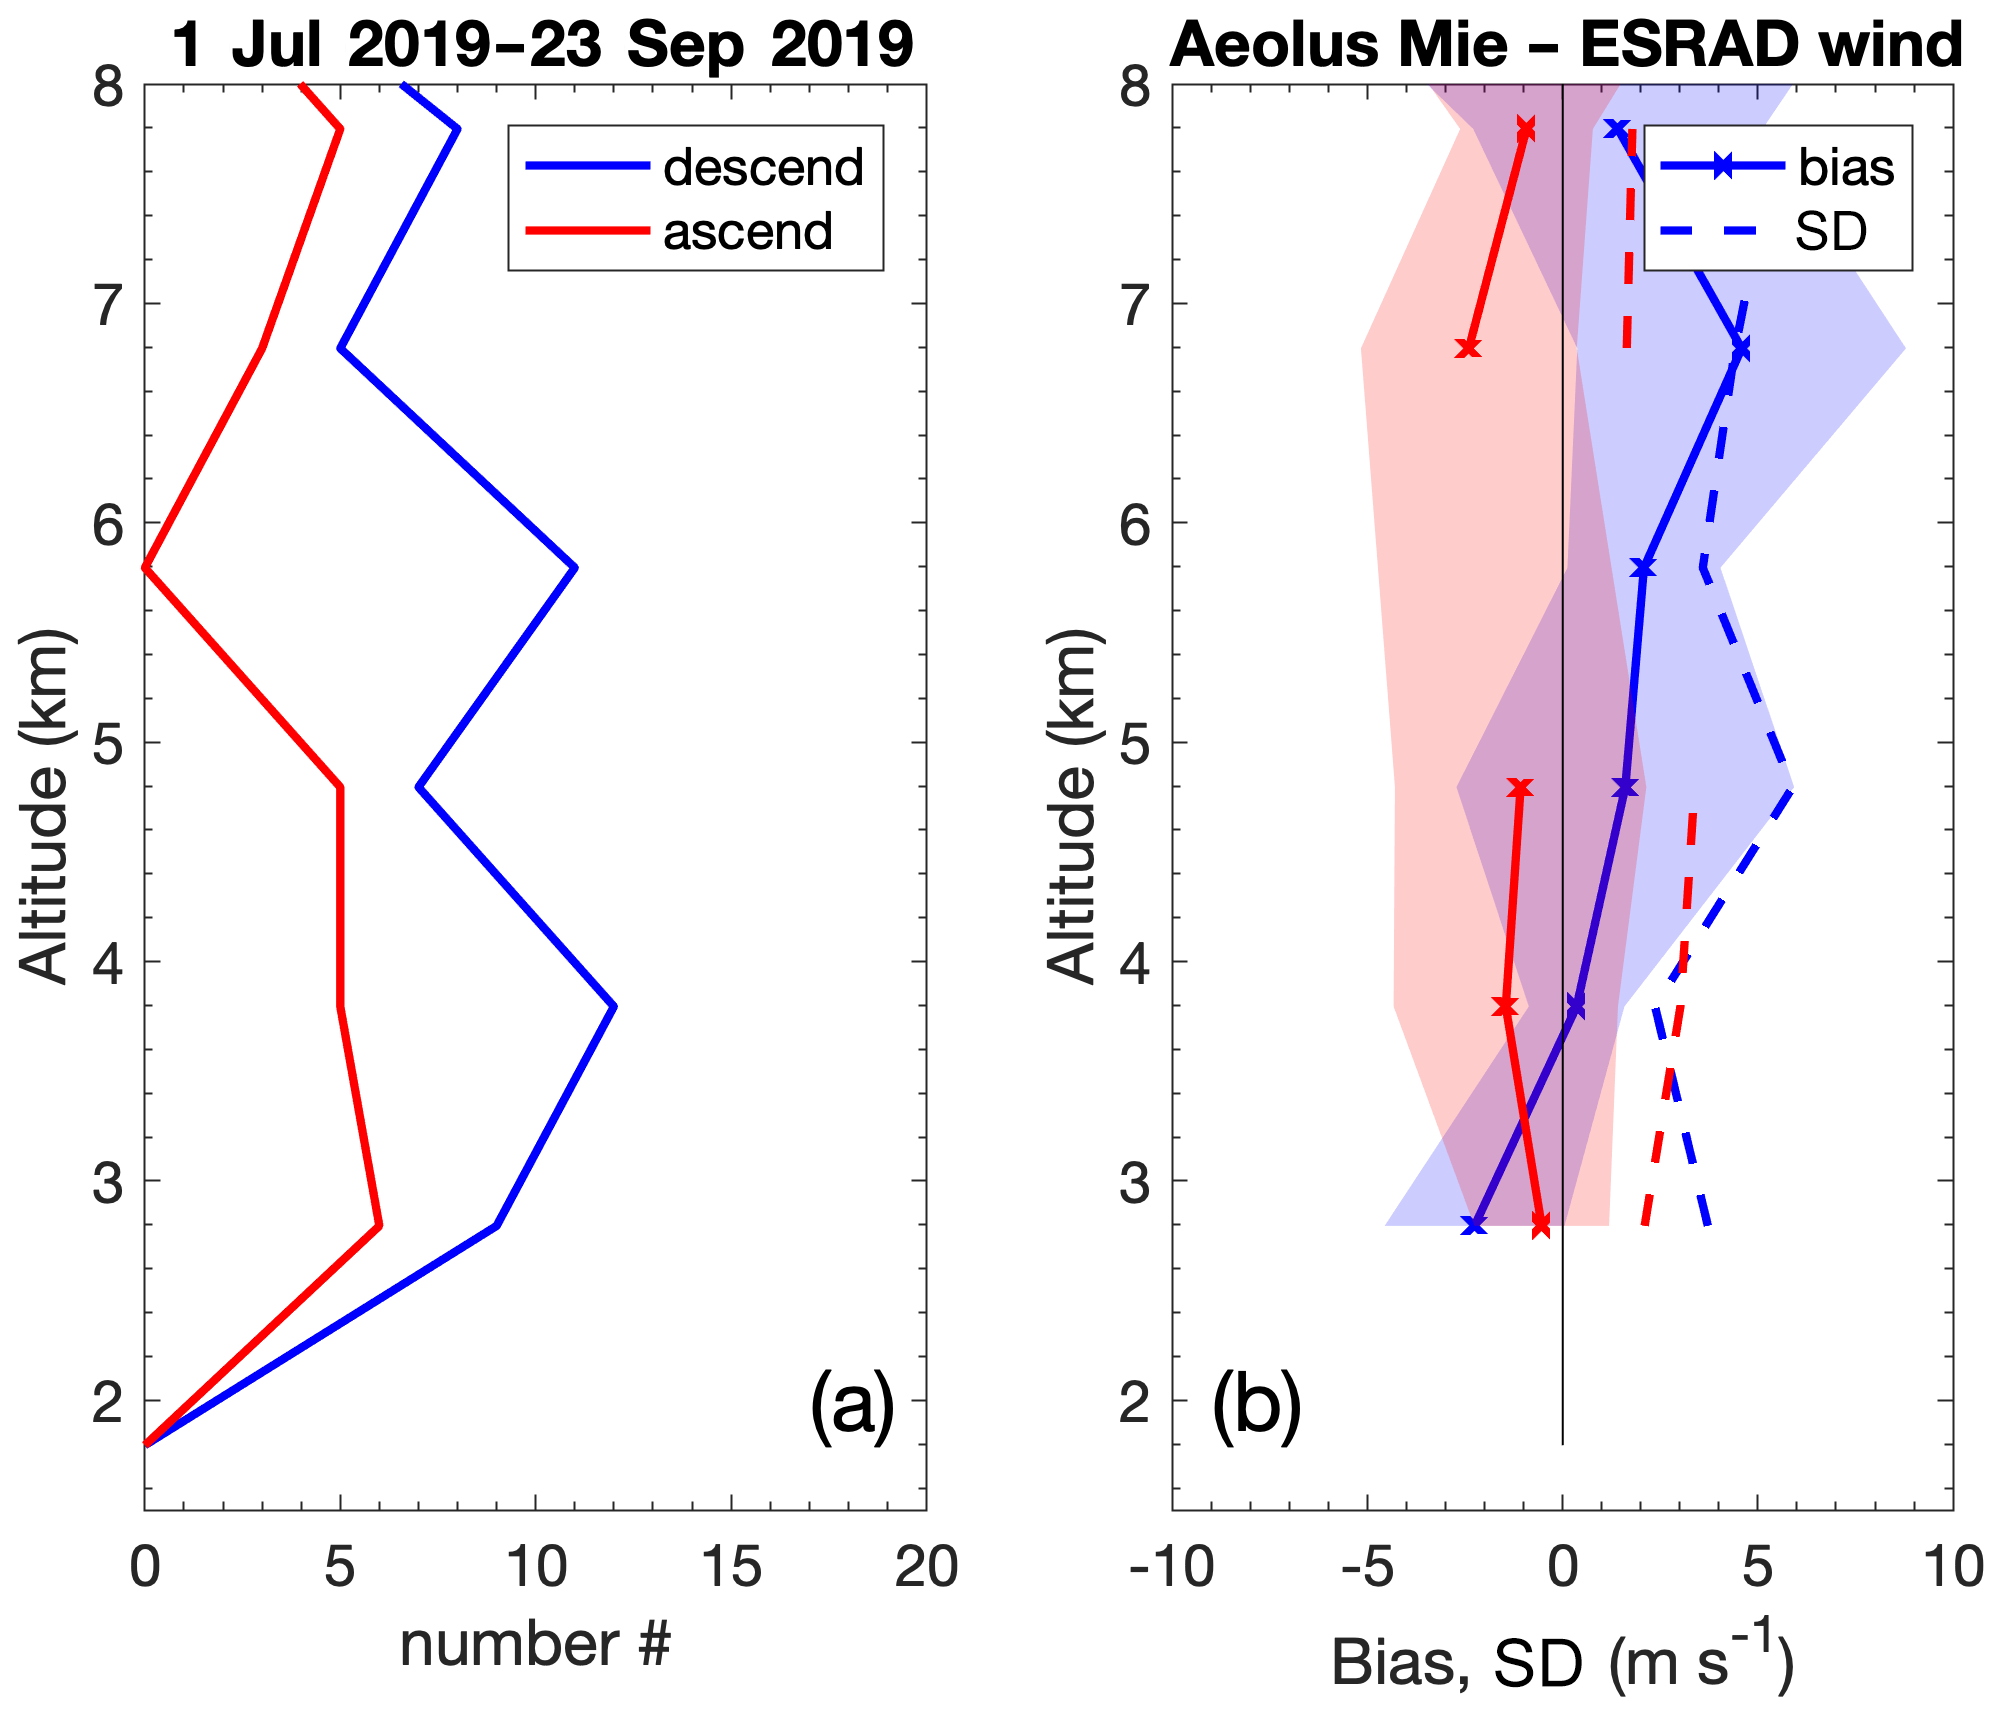
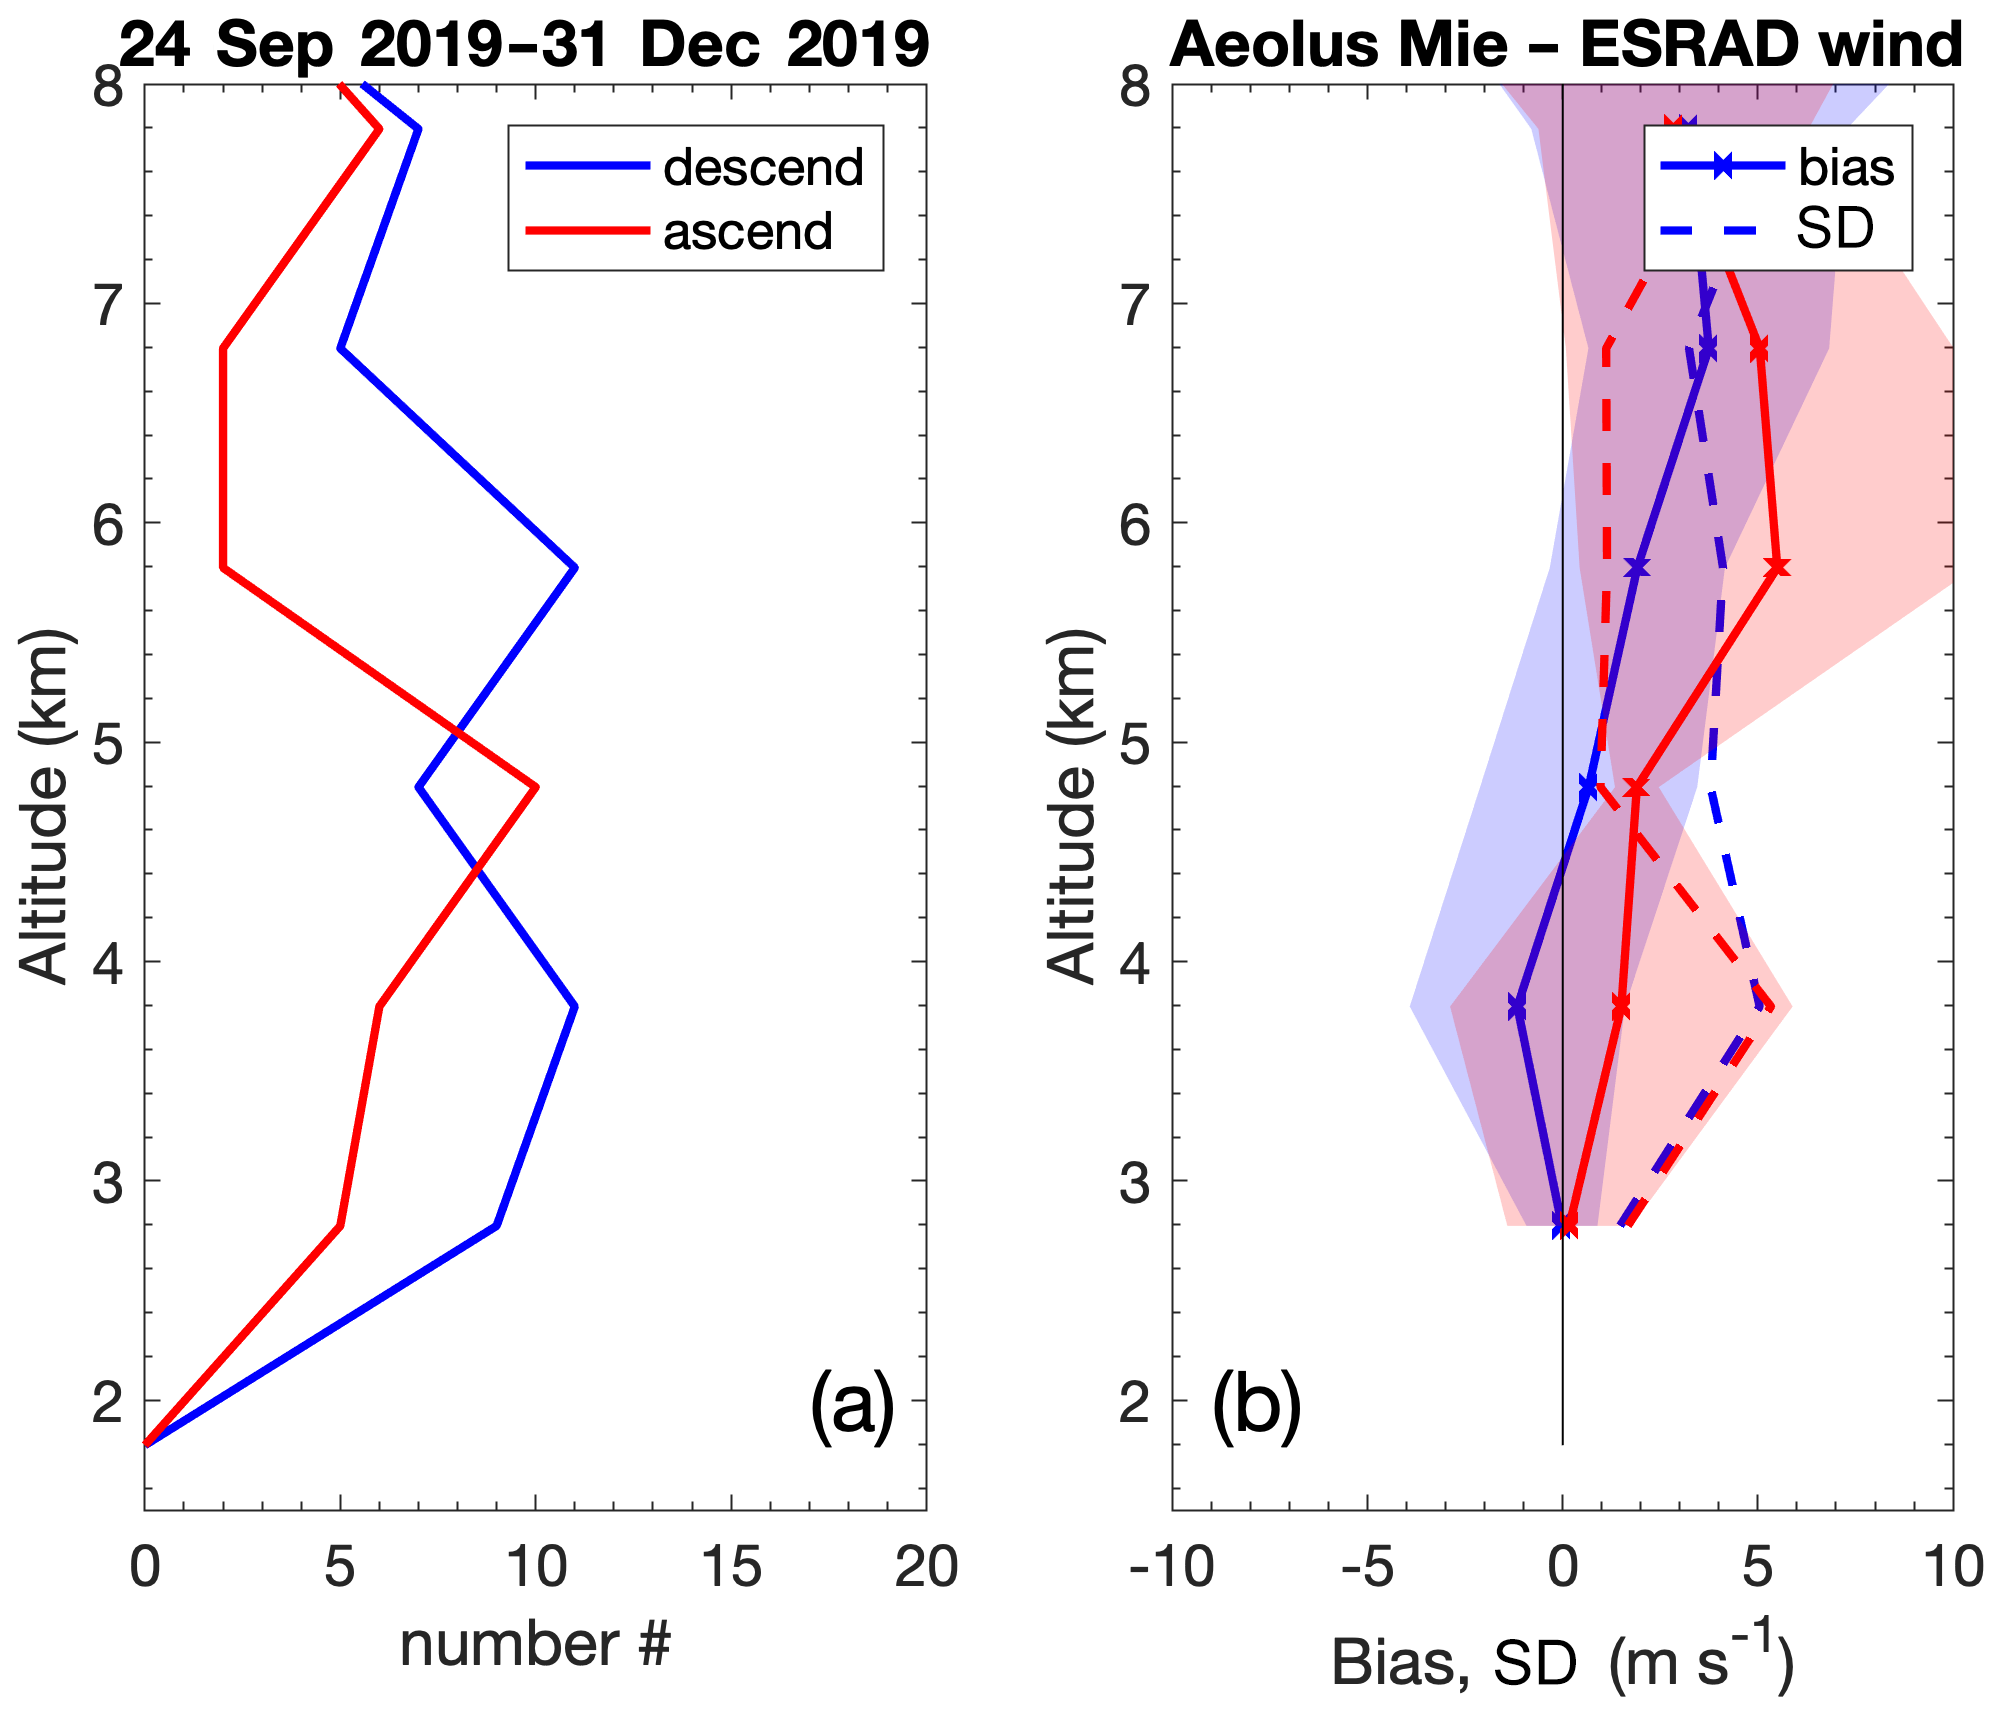

Figure 16Month-by-month mean values of biases in HLOS winds (solid lines) and 90 % confidence limits (shaded areas) at ESRAD. Red is for ascending tracks and blue is for descending ones. (a) Aeolus Rayleigh minus ESRAD, (b) Aeolus Mie minus ESRAD, (c) Aeolus Rayleigh minus ERA5, (d) Aeolus Mie minus ERA5, (e) ESRAD minus ERA5 at available Aeolus Rayleigh comparison times/heights and (f) ESRAD minus ERA5 at available Aeolus Mie comparison times/heights.
The random differences between ESRAD and Aeolus HLOS winds (SD) are 3.8–5.5 m s−1 for summer and 3.9–5.2 m s−1 for winter and are similar for Mie and Rayleigh winds. This is again much bigger than the standard error for the average radar winds themselves (2 m s−1) but close to that found when comparing ESRAD and radiosonde winds (4 m s−1, Belova et al., 2021). Some of this will be due to the expected random errors of the Aeolus winds together with the distance of up to 100 km between the observations. The random differences are indeed slightly smaller for the ascending paths than the descending ones and, as shown in Fig. 2, the Aeolus measurements are closer to the radar site on the ascending conjunctions.
In Fig. 16 we show monthly average biases between ESRAD and Aeolus wind measurements and also a comparison with ERA5 winds (for the closest hour and closest grid point to the ESRAD location). There is clearly a close agreement between ESRAD and ERA5 and very similar biases between Aeolus and ERA5 as between Aeolus and ESRAD. This confirms no biases for Rayleigh wind measurements significant at the 90 % confidence level. For Mie wind measurements the moderate positive bias seen for winter ascending orbits appears significant in both October and November, in comparison with both ESRAD and ERA5. It can also be noted that there is no seasonal change in the agreement between ESRAD and ERA5. So, this may be a genuine bias which has not been successfully removed in the Aeolus data processing. However, given the rather short time interval for the comparison, we cannot rule out the possibility that it is due to spatial differences between the winds at ESRAD and at the Aeolus measurement locations.
The aim of this study was to assess the accuracy of winds measured by lidar from the Aeolus satellite at polar latitudes by comparison with independent measurements made by two ground-based wind-profiler radars: MARA near the coast of Queen Maud Land in Antarctica and ESRAD in Arctic Sweden. The radars make their observations at fixed locations (within a radius of a few 100 m); hence, exactly co-located measurements with Aeolus are not possible. Aeolus Rayleigh (clear sky) measurements are averaged along a considerable accumulation length (87 km) and, although Aeolus Mie (cloudy) measurements are in principle averaged over shorter distances (14 km or less), the latter are in practice found to be sparse at the radar locations since they depend on the presence of suitable clouds or aerosols. For comparison with the radar, we therefore use the Rayleigh (clear) wind profile closest to the radar for any pass within 100 km and average all Mie (cloudy) winds registered within 100 km of the radar on that pass. We use temporal averaging from 30 min before to 30 min after the satellite pass for the radar winds, which may provide, to some extent, a proxy for the spatial averaging intrinsic to the Aeolus measurements. We separated the datasets at each radar site into ascending and descending passes and into summer and winter seasons as they might show different behaviour. The agreement between Aeolus and radar winds is generally very good. The slopes of Aeolus-on-radar wind regression lines do not differ significantly from 1, and correlation coefficients are between 0.63 and 0.93. The random differences are a combination of Aeolus observation error, representativeness error and radar wind random error. The values we observe (4–7 m s−1) are in most cases about what could be expected from the known level of random error for Aeolus winds (4–5 m s−1 for Rayleigh, 3 m s−1 for Mie) and spatial/temporal differences between radar and Aeolus measurements.
There is a particular interest in possible biases since these have been found to be a problem in the earlier stages of Aeolus validation but have been much reduced by more recent data processing methods (including the 2B10 baseline which is used here). The only clear systematic bias found in this comparison is 6.6 [4.8 8.6] m s−1 for Mie (cloudy) winds at MARA for ascending passes in summer (where the values inside the square brackets are the 90 % confidence limits). This bias also appears when the Aeolus Mie winds are compared with ECMWF ERA5 reanalysis. Summer is the season when the effect of scattered sunlight from the ice cap is at a maximum and can affect the satellite for some minutes as it crosses Antarctica before passing the MARA site. There is also some indication that the random errors of Mie winds may be about 1 m s−1 more in summer than in winter at MARA.
There are further small biases with marginal significance. At MARA, there is a bias −2.0 m s−1 for the Rayleigh descending passes in winter, but this is not systematically significant over an extended height range. At ESRAD, there appears to be a larger bias – 2.4 [1.3 3.4] m s−1 for the Mie ascending passes in winter – but this is based on a very small number of comparison points.
In summary, the agreement between radar and Aeolus winds is generally very good. For 13 out of 16 subdivisions of the data (Rayleigh/Mie, ascending/descending tracks, summer/winter, Arctic/Antarctic) we find no evidence for any bias in the Aeolus winds (<1 m s−1). For a further two subdivisions (specified in the previous paragraph) there may be a significant bias, but more data will be needed to establish whether this is truly the case. We find robust evidence for a large bias of about 7 m s−1 in only one case – summer, Mie winds for the ascending tracks over MARA in Antarctica. This should be looked into further when more recent data become available from MARA.
ESRAD data are available from Peter Voelger on motivated request. MARA data can be obtained on reasonable request from Sourav Chatterjee. Aeolus data are publicly available at the ESA Aeolus Online Dissemination System (https://earth.esa.int/eogateway/missions/aeolus/data, last access: 10 January 2021, ESA, 2021).
SK, EB and PV develop and maintain the software and data processing for ESRAD. They developed the codes for the radar–Aeolus comparison and conducted the data analysis. SC and KS provided the MARA data. All co-authors discussed the comparison methods and results. EB and SK prepared the paper with contribution from all co-authors.
The authors declare that they have no conflict of interest.
Publisher’s note: Copernicus Publications remains neutral with regard to jurisdictional claims in published maps and institutional affiliations.
This article is part of the special issue “Aeolus data and their application (AMT/ACP/WCD inter-journal SI)”. It is not associated with a conference.
This work was supported by the Swedish National Space Agency (grant nos. 125/18 and 279/18). ESRAD operation and maintenance is provided by Esrange Space Center of Swedish Space Corporation. The team members at Maitri station for the 38th Indian scientific expedition to Antarctica (ISEA) and the Antarctic logistics division at NCPOR (India) are acknowledged for providing necessary support for the operation of MARA. Figure 1 is plotted using “M_Map: A mapping package for MATLAB”, version 1.4m, by Pawlowicz (2020, https://www.eoas.ubc.ca/~rich/map.html, last access: 22 February 2021).
This research has been supported by the Swedish National Space Agency (grant nos. 125/18 and 279/18).
This paper was edited by Oliver Reitebuch and reviewed by three anonymous referees.
Baars, H., Herzog, A., Heese, B., Ohneiser, K., Hanbuch, K., Hofer, J., Yin, Z., Engelmann, R., and Wandinger, U.: Validation of Aeolus wind products above the Atlantic Ocean, Atmos. Meas. Tech., 13, 6007–6024, https://doi.org/10.5194/amt-13-6007-2020, 2020.
Belova, E., Voelger, P., Kirkwood, S., Hagelin, S., Lindskog, M., Körnich, H., Chatterjee, S., and Satheesan, K.: Validation of wind measurements of two mesosphere–stratosphere–troposphere radars in northern Sweden and in Antarctica, Atmos. Meas. Tech., 14, 2813–2825, https://doi.org/10.5194/amt-14-2813-2021, 2021.
Briggs, B. H.: The spaced-receiver technique, J. Atmos. Terr. Phys., 56, 831–834, https://doi.org/10.1016/0021-9169(94)90140-6, 1994.
Chilson, P. B., Kirkwood, S., and Nilsson, A.: The Esrange MST radar: a brief introduction and procedure for range validation using balloons, Radio Sci., 34, 427–436, https://doi.org/10.1029/1998RS900023, 1999.
ESA: ADM-Aeolus Science Report, ESA SP-1311, 121 pp., https://esamultimedia.esa.int/docs/EarthObservation/SP-1311ADM-Aeolus_Final.pdf (last access: 28 June 2021), 2008.
ESA: Aeolus Data, ESA [data set], available at: https://earth.esa.int/eogateway/missions/aeolus/data, last access: 10 January 2021.
Guo, J., Liu, B., Gong, W., Shi, L., Zhang, Y., Ma, Y., Zhang, J., Chen, T., Bai, K., Stoffelen, A., de Leeuw, G., and Xu, X.: Technical note: First comparison of wind observations from ESA's satellite mission Aeolus and ground-based radar wind profiler network of China, Atmos. Chem. Phys., 21, 2945–2958, https://doi.org/10.5194/acp-21-2945-2021, 2021.
Hersbach, H., Bell, B., Berrisford, P., Hirahara, S., Horányi, A., Muñoz-Sabater, J., Nicolas, J., Peubey, C., Radu, R., Schepers, D., Simmons, A., Soci, C., Abdalla, S., Abellan, X., Balsamo, G., Bechtold, P., Biavati, G., Bidlot, J., Bonavita, M., De Chiara, G., Dahlgren, P., Dee, D., Diamantakis, M., Dragani, R., Flemming, J., Forbes, R., Fuentes, M., Geer, A., Haimberger, L., Healy, S., Hogan, R. J., Hólm, E., Janisková, M., Keeley, S., Laloyaux, P., Lopez, P., Lupu, C., Radnoti, G., de Rosnay, P., Rozum, I., Vamborg, F., Villaume, S., and Thépaut, J.-N.: The ERA5 global reanalysis, Q. J. Roy. Meteor. Soc., 146, 1999–2049, https://doi.org/10.1002/qj.3803, 2020.
Khaykin, S. M., Hauchecorne, A., Wing, R., Keckhut, P., Godin-Beekmann, S., Porteneuve, J., Mariscal, J.-F., and Schmitt, J.: Doppler lidar at Observatoire de Haute-Provence for wind profiling up to 75 km altitude: performance evaluation and observations, Atmos. Meas. Tech., 13, 1501–1516, https://doi.org/10.5194/amt-13-1501-2020, 2020.
Kirkwood, S., Wolf, I., Nilsson, H., Dalin, P., Mikhaylova, D., and Belova E.: Polar mesosphere summer echoes at Wasa, Antarctica (73∘ S): First observations and comparison with 68∘ N, Geophys. Res. Lett., 34, L15803, https://doi.org/10.1029/2007GL030516, 2007.
Kirkwood, S., Belova, E., Satheesan, K., Narayana Rao, T., Rajendra Prasad, T., and Satheesh Kumar, S.: Fresnel scatter revisited – comparison of 50 MHz radar and radiosondes in the Arctic, the Tropics and Antarctica, Ann. Geophys., 28, 1993–2005, https://doi.org/10.5194/angeo-28-1993-2010, 2010.
Lux, O., Lemmerz, C., Weiler, F., Marksteiner, U., Witschas, B., Rahm, S., Geiß, A., and Reitebuch, O.: Intercomparison of wind observations from the European Space Agency's Aeolus satellite mission and the ALADIN Airborne Demonstrator, Atmos. Meas. Tech., 13, 2075–2097, https://doi.org/10.5194/amt-13-2075-2020, 2020.
Martin, A., Weissmann, M., Reitebuch, O., Rennie, M., Geiß, A., and Cress, A.: Validation of Aeolus winds using radiosonde observations and numerical weather prediction model equivalents, Atmos. Meas. Tech., 14, 2167–2183, https://doi.org/10.5194/amt-14-2167-2021, 2021.
Mihalikova, M. and Kirkwood, S.: Tropopause fold occurrence rates over the Antarctic station Troll (72∘ S, 2.5∘ E), Ann. Geophys., 31, 591–598, https://doi.org/10.5194/angeo-31-591-2013, 2013.
Pawlowicz, R.: M_Map: A mapping package for MATLAB, version 1.4m, EOAS [computer software], available at: https://www.eoas.ubc.ca/~rich/map.html, 2020 (last access: 22 February 2021).
Reitebuch, O.: The Spaceborne Wind Lidar Mission ADM-Aeolus, Atmos. Phys., 815–827, https://doi.org/10.1007/978-3-642-30183-4_49, 2012.
Reitebuch, O., Lemmerz, C., Lux, O., Marksteiner, U., Rahm, S., Weiler, F., Witschas, B., Meringer, M., Schmidt, K., Huber, D., Nikolaus, I., Geiß, A., Vaughan, M., Dabas, A., Flament, T., Stieglitz, H., Isaksen, L., Rennie, M., Kloe, J., and Parrinello, T.: Initial Assessment of the Performance of the First Wind Lidar in Space on Aeolus, EPJ Web Conf., 237, 01010, https://doi.org/10.1051/epjconf/202023701010, 2020.
Rennie, M. and Isaksen, L.: The NWP impact of Aeolus Level-2B winds at ECMWF, Technical Memorandum ECMWF no. 864, https://doi.org/10.21957/alift7mhr, 2020.
Stoffelen, A., Pailleux, J., Källén, E., Vaughan, M., Isaksen, L., Flamant, P., Wergen, W., Andersson, E., Schyberg, H., Culoma, A., Meynart, R., Endemann, M., and Ingmann, P.: The Atmospheric Dynamics Mission for Global Wind Field Measurements, B. Am. Meteorol. Soc., 86, 73–88, 2005.
Weiler, F., Kanitz, T., Wernham, D., Rennie, M., Huber, D., Schillinger, M., Saint-Pe, O., Bell, R., Parrinello, T., and Reitebuch, O.: Characterization of dark current signal measurements of the ACCDs used on-board the Aeolus satellite, Atmos. Meas. Tech. Discuss. [preprint], https://doi.org/10.5194/amt-2020-458, in review, 2020.
Witschas, B., Lemmerz, C., Geiß, A., Lux, O., Marksteiner, U., Rahm, S., Reitebuch, O., and Weiler, F.: First validation of Aeolus wind observations by airborne Doppler wind lidar measurements, Atmos. Meas. Tech., 13, 2381–2396, https://doi.org/10.5194/amt-13-2381-2020, 2020.
The requested paper has a corresponding corrigendum published. Please read the corrigendum first before downloading the article.
- Article
(2445 KB) - Full-text XML