the Creative Commons Attribution 4.0 License.
the Creative Commons Attribution 4.0 License.
 | 09 Aug 2021
The nano-scanning electrical mobility spectrometer (nSEMS) and its application to size distribution measurements of 1.5–25 nm particles
Weimeng Kong
Stavros Amanatidis
Huajun Mai
Changhyuk Kim
Benjamin C. Schulze
Yuanlong Huang
Gregory S. Lewis
Susanne V. Hering
John H. Seinfeld
Particle size measurement in the low nanometer regime is of great importance to the study of cloud condensation nuclei formation and to better understand aerosol–cloud interactions. Here we present the design, modeling, and experimental characterization of the nano-scanning electrical mobility spectrometer (nSEMS), a recently developed instrument that probes particle physical properties in the 1.5–25 nm range. The nSEMS consists of a novel differential mobility analyzer and a two-stage condensation particle counter (CPC). The mobility analyzer, a radial opposed-migration ion and aerosol classifier (ROMIAC), can classify nanometer-sized particles with minimal degradation of its resolution and diffusional losses. The ROMIAC operates on a dual high-voltage supply with fast polarity-switching capability to minimize sensitivity to variations in the chemical nature of the ions used to charge the aerosol. Particles transmitted through the mobility analyzer are measured using a two-stage CPC. They are first activated in a fast-mixing diethylene glycol (DEG) stage before being counted by a second detection stage, an ADI MAGIC™ water-based CPC. The transfer function of the integrated instrument is derived from both finite-element modeling and experimental characterization. The nSEMS performance has been evaluated during measurement of transient nucleation and growth events in the CLOUD atmospheric chamber at CERN. We show that the nSEMS can provide high-time- and size-resolution measurement of nanoparticles and can capture the critical aerosol dynamics of newly formed atmospheric particles. Using a soft x-ray bipolar ion source in a compact housing designed to optimize both nanoparticle charging and transmission efficiency as a charge conditioner, the nSEMS has enabled measurement of the contributions of both neutral and ion-mediated nucleation to new particle formation.
- Article
(2765 KB) - Full-text XML
-
Supplement
(4597 KB) - BibTeX
- EndNote


Aerosol particles can either be emitted into the atmosphere directly from primary sources or generated through the nucleation of atmospheric condensable precursor vapors. Atmospheric nucleation, or new particle formation (NPF), is frequently observed across the globe under diverse environmental conditions, ranging from populated urban centers (Dunn et al., 2004; Wang et al., 2017; Yao et al., 2018; Wang et al., 2020) to remote areas such as forests or oceans (O'Dowd et al., 2002; Bonn and Moortgat, 2003; Paasonen et al., 2010; Dall'Osto et al., 2017), as well as in the free troposphere (Kulmala et al., 2004; Kerminen et al., 2018; Lee et al., 2019). Large-scale simulations and parameterizations suggest that NPF may generate half of the global cloud condensation nuclei (CCN; Merikanto et al., 2009; Gordon et al., 2017). In addition to their climate impact, ultrafine particles formed by nucleation can also have disproportionate adverse effects on human health (Brown et al., 2000).
To understand the formation and subsequent growth of freshly nucleated particles in the atmosphere and to evaluate their impact on climate and human health requires measurement techniques that can enable particle size distribution measurements in the low nanometer regime. Nanoparticle sizing is often achieved using electrical mobility to separate charged particles according to the velocities with which they migrate in an electric field. The differential mobility analyzer (DMA) has long been the most widely used instrument to measure the size distribution of submicrometer (<1 µm) aerosol particles (Knutson and Whitby, 1975; Flagan, 1998). Most DMAs separate charged aerosol particles of different electrical mobilities by applying an electric field between two coaxial cylindrical electrodes that are parallel to a particle-free sheath flow. Classified particles from the DMAs are typically counted by a condensation particle counter (CPC) that uses supersaturated vapors to grow particle seeds before detection (Quant et al., 1992). This integrated instrument initially used stepwise variation in the voltage. By keeping the voltage applied between the electrodes constant at each step, particles are transmitted throughout the entire system under a steady field profile before they are counted by the CPC. This static-mode measurement system is referred to as the differential mobility particle sizer (DMPS) (Fissan et al., 1983). However, since the DMPS requires the system to reach a steady state before a reliable measurement can be made, the relatively long residence time of the particles in the DMA makes it less ideal in capturing transient aerosol activities. By continuously changing the voltage through an exponential ramp, the scanning electrical mobility spectrometer (SEMS; also known as the scanning mobility particle sizer, SMPS) considerably accelerates the particle classification using electrical mobility (Wang and Flagan, 1990).
While the traditional DMPS, SMPS, and SEMS systems can only detect particles with mobility-equivalent diameters above 10 nm, many efforts have focused on extending the classification range to smaller aerosol particles. The first major step in this direction was the Vienna short-column DMA that measured nanoparticles down to 3.5 nm (Winklmayr et al., 1991); the “nano-DMA”, modified from the traditional long-column DMA design, can measure particle size distribution in the range of 3–50 nm (Chen et al., 1998). A radial DMA (RDMA) that classifies particles in a radial flow toward the center of parallel disk electrodes also demonstrated a high detection efficiency for particles between 3 and 10 nm (Zhang et al., 1995). Both designs have been extended to smaller sizes. Through meticulous aerodynamic design and very large sheath flow rates of up to 1000 L min−1, Rosell-Llompart et al. (1996) refined the Vienna DMA into one instrument suitable for particle classification down to as small as 1 nm. Brunelli et al. (2009) developed an RDMA that could also classify 1 nm particles at much more modest flow rates, albeit at lower resolution. An alternate mobility analyzer design, the opposed-migration aerosol classifier (OMAC), uses a particle-free cross-flow instead of the parallel sheath flow in the DMAs to balance particle electrical migration. Since the aerosol being classified fills the space between the electrodes rather than occupying only a narrow slice of that space as in a DMA, this changes the scaling for where diffusion begins to degrade the resolution of the classifier, thereby enabling classification at lower voltages or operation at higher resolution than is possible with conventional DMAs (Flagan, 2004; Downard et al., 2011). A radial-flow form of this instrument, the radial opposed-migration ion and aerosol classifier (ROMIAC), has proven capable of measuring particles or ions approaching 1 nm in size and even separating peptide stereoisomers owing to its high resolving power when operated in voltage-stepping mode like a DMPS (Mui et al., 2013, 2017). The challenges with measuring particles in the low nanometer regime lie not only in classification, but also in particle detection. Some single-stage CPCs have been operated at sufficiently high supersaturation to activate particles as small as 1 nm in diameter, but in the experiment for which this instrument has been developed, wherein measurements must be made in a high-radiation environment, this can lead to ion-induced nucleation within the CPC. Therefore, we took a more conservative approach that has proven robust and effective for sub-10 nm particle detection, namely a two-stage CPC, in which the first stage employs a high-surface-tension, relatively low-vapor-pressure working fluid, typically diethylene glycol (DEG) in order to activate small particles with minimal risk of homogeneous nucleation (Iida et al., 2009; Jiang et al., 2011a), which was integrated with a DMA to produce the first SMPS system to measure size distributions approaching 1 nm (Jiang et al., 2011a) that agree closely with mass spectrometric data in the overlap region between the two methods (Jiang et al., 2011b). Owing to the low vapor pressure, the first stage does not grow particles to optically detectable size, so a second “booster” stage is used to grow the activated clusters and optically detect them. The second stage is typically a conventional CPC. The operation of two activation and growth systems in series compounds another challenge to SEMS and SMPS measurements; the residence time within the CPC can distribute counts of particles that exit the DMA over many time bins (Russell et al., 1995; Collins et al., 2002), thereby degrading the resolution of the instrument. This effect becomes increasingly important at scan rates that are fast relative to the response time of the CPC. Therefore, CPCs with a narrow distribution of residence times are preferred, particularly for one SEMS that targets the low nanometer range, in which the resolution is also compromised by Brownian diffusion.
In this work we show the development of a nano-scanning electrical mobility spectrometer (nSEMS) that features a fast-scanning OMAC and a two-stage CPC to acquire fast and accurate particle size distributions in the range of 1.5–25 nm. Here we describe the design and characterization of the scanning OMAC in detail as that is the unique component of the instrument which enables a sizing range that is not possible with a constant-flow DMA. A radial-flow version of the OMAC that is capable of classifying charged particles or ions as small as 1 nm in diameter (Mui et al., 2013, 2017) is used in this instrument. The two-stage CPC includes a fast-mixing activation stage using DEG as a working fluid, followed by an eco-friendly, fast-response, water-based CPC (Hering et al., 2019). Other CPCs, either two-stage ones like the one we have employed or single-stage CPCs that are capable of counting particles as small as 1 nm, could be integrated into the nSEMS, so we limit our discussion of the two-stage CPC to its essential features, its integration into the nSEMS, and the resulting performance. The nSEMS analyzes a charged aerosol, which can be naturally charged or one that is processed through a charge conditioner (CC). The present paper focuses on nanoparticle sizing and detection downstream of the CC.
The integrated transfer function of the nSEMS system was derived based on both experimental results and finite-element modeling using COMSOL Multiphysics™. The nSEMS has been intensively used in the Cosmics Leaving OUtdoor Droplets (CLOUD) experiments at CERN, in which its size resolution and fast response have made it possible to follow very rapid growth of freshly nucleated nanoparticles and to identify a new mechanism for new particle formation in a highly polluted atmosphere (Wang et al., 2020). A comparison of nSEMS data with measurements from other well-calibrated particle sizing instruments at CLOUD confirms its capacity to provide reliable size distribution in the low nanometer size regime.
The nSEMS was designed to capture critical aerosol dynamics during atmospheric nucleation and subsequent nanoparticle growth in both environmental chamber experiments and in ambient measurements. To this end, its design and operating parameters have been optimized to provide size distribution measurements with relatively high size resolution in the sub-25 nm range and with a fairly short duty cycle. The nSEMS classifies particles of different sizes according to their electrical mobilities, Zp, which is defined as the ratio of particle migration velocity, vm, to the electric field strength within the classifier, E:
where ϕ is the net number of elementary charges, e, on the particle, Cc is the Cunningham slip correction factor that accounts for the noncontinuum effects, μ is the dynamic viscosity of air, and dp is the particle diameter. Figure 1 shows a schematic of nSEMS main components. The aerosol enters the nSEMS after passing through a soft x-ray CC at a relatively high flow rate of 4.6 L min−1. A smaller, 1.2 L min−1 polydisperse aerosol sample flow from the core of the larger flow is introduced into a ROMIAC, while the remainder is exhausted. The high flow rate through the CC and the core sampling flow spitter are designed to minimize losses of the highly diffusive nanoparticles. While the ROMIAC was originally designed to operate at constant voltage, the voltage is continuously varied in an exponential ramp in the nSEMS. Particles transmitted through the ROMIAC are counted using a two-stage CPC to capture the particle size distribution. Detailed operating parameters and default settings are summarized in Table 1.
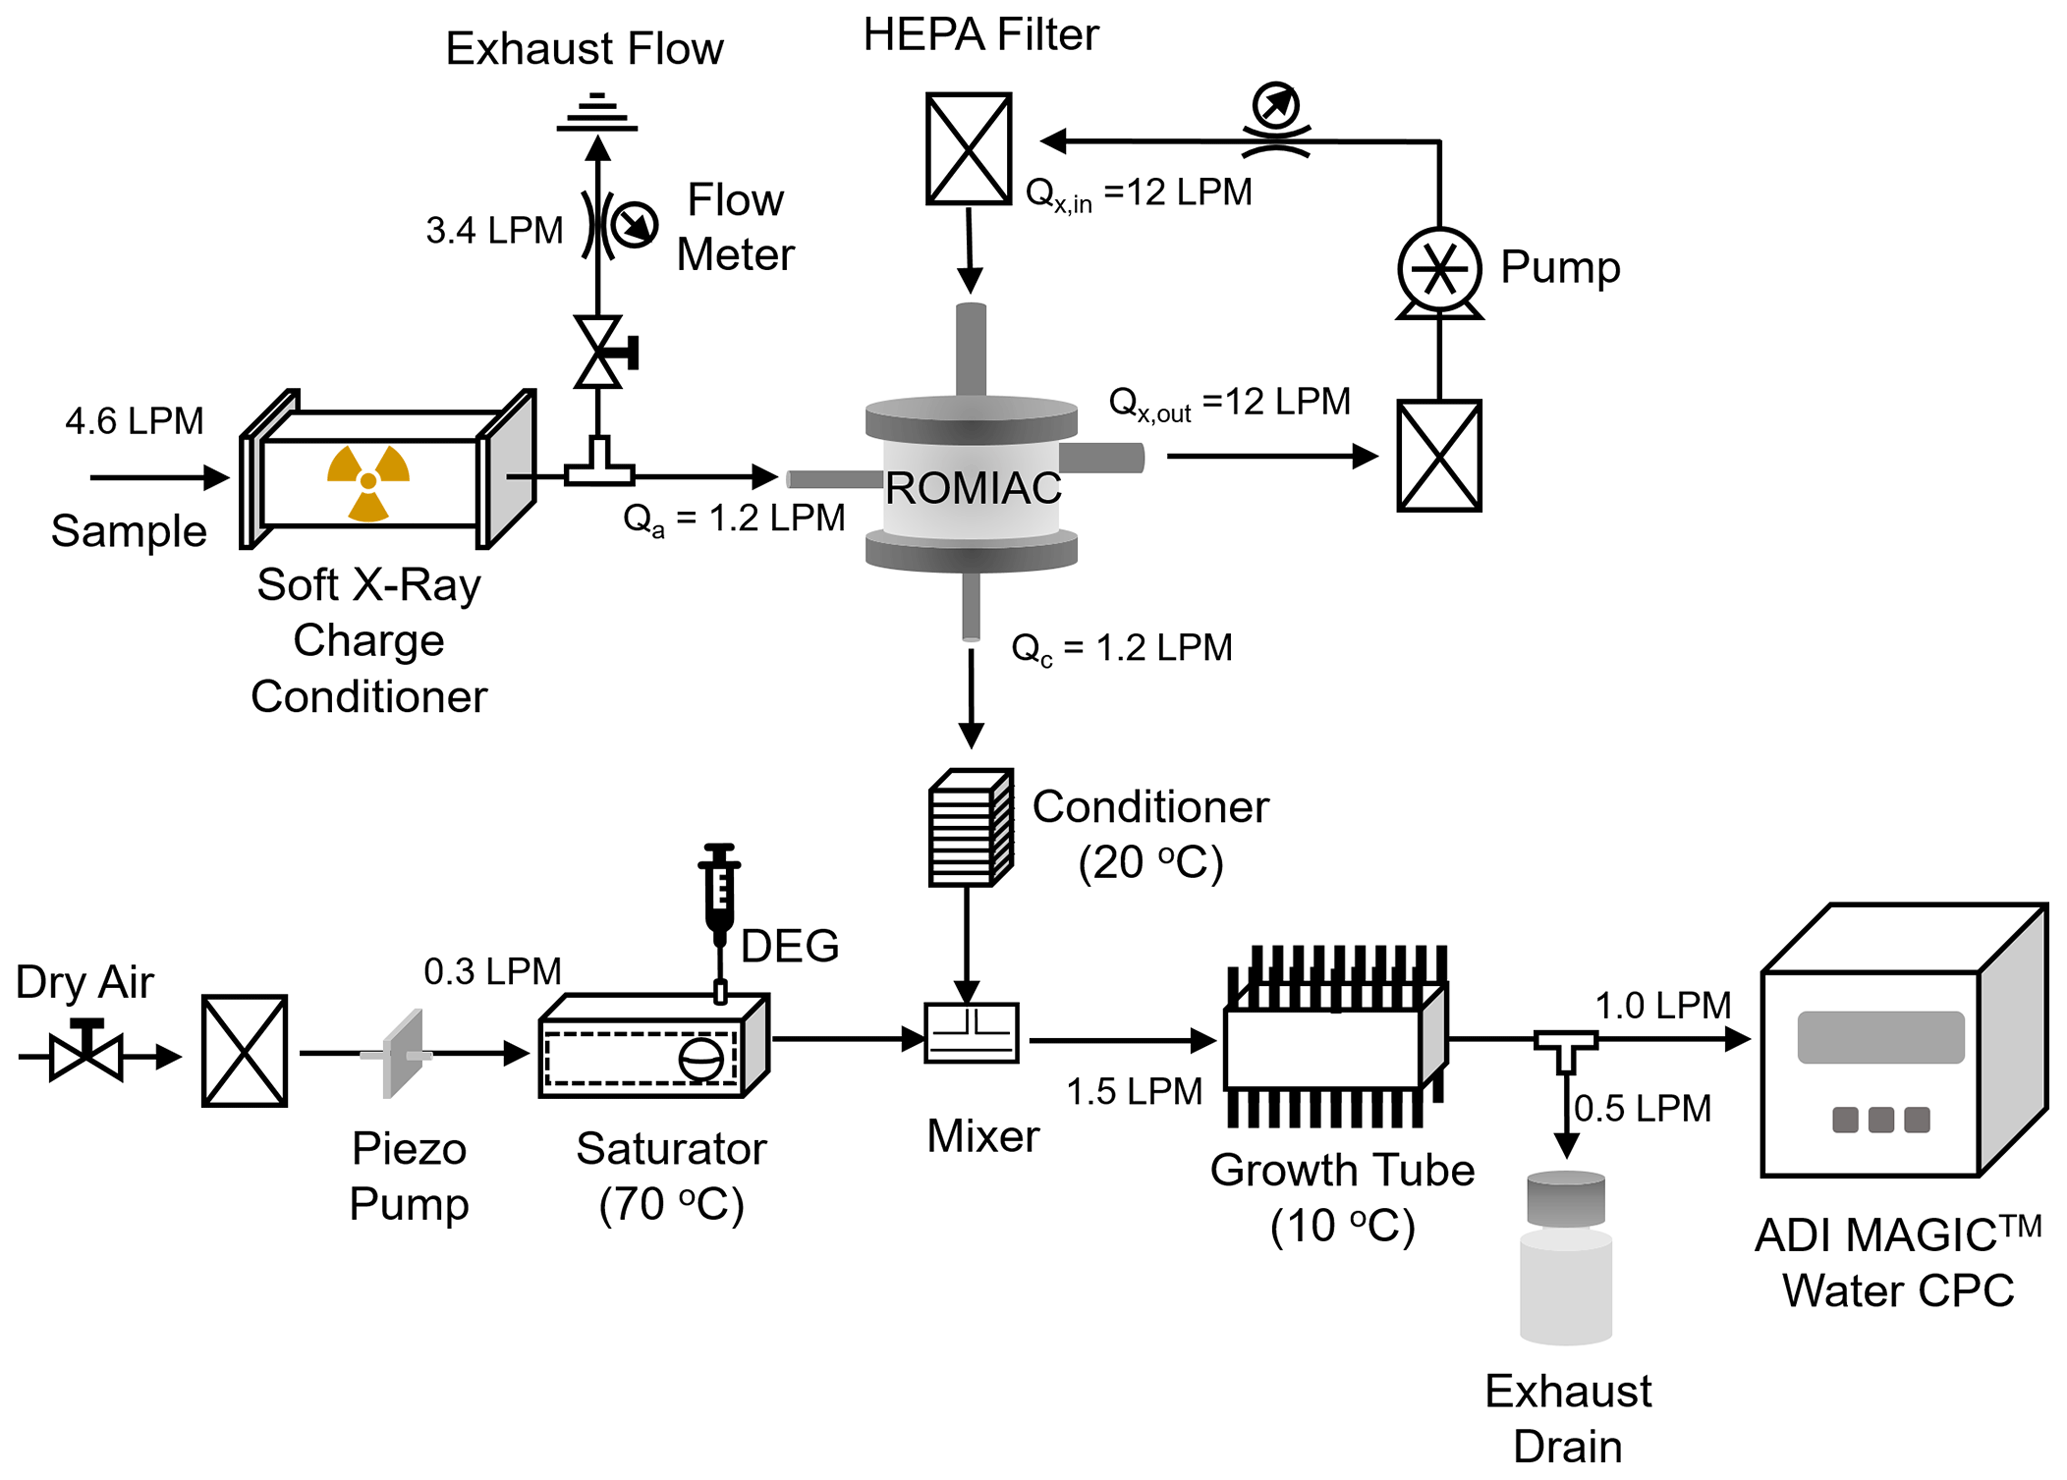
Figure 1Schematic of the nSEMS main components: a radial opposed-migration ion and aerosol classifier (ROMIAC) and a two-stage condensation particle counter (CPC). The aerosol enters the nSEMS after passing through a soft x-ray CC at a high flow rate (4.6 L min−1). Core sampling of that input sample flow is employed to minimize particle diffusional losses in the transport tubing and the CC. The ROMIAC is operated on exponentially increasing voltage ramps between 20 and 10 000 V of both positive and negative polarity at 1.2 and 12 L min−1 aerosol and cross-flows (Table 1). After exiting the classifier, monodisperse aerosol particles are mixed with 0.3 L min−1 diethylene glycol (DEG) vapor in the first stage of the CPC. This fast-mixing stage allows nanoparticles to grow through rapid vapor condensation before they enter the second “booster” CPC stage, a modified Aerosol Dynamics Inc. (ADI) MAGIC™ water CPC operated at a flow rate of 1.0 L min−1, in which particles grow further and are optically detected.
Table 1Default nSEMS operating parameters optimized for measurements of NPF events and nanoparticle growth. These settings enable particle size distribution measurements in the range of 1.5–25 nm, with a duty cycle of 1 min and a size classification resolution of ℛnom,nd=10.
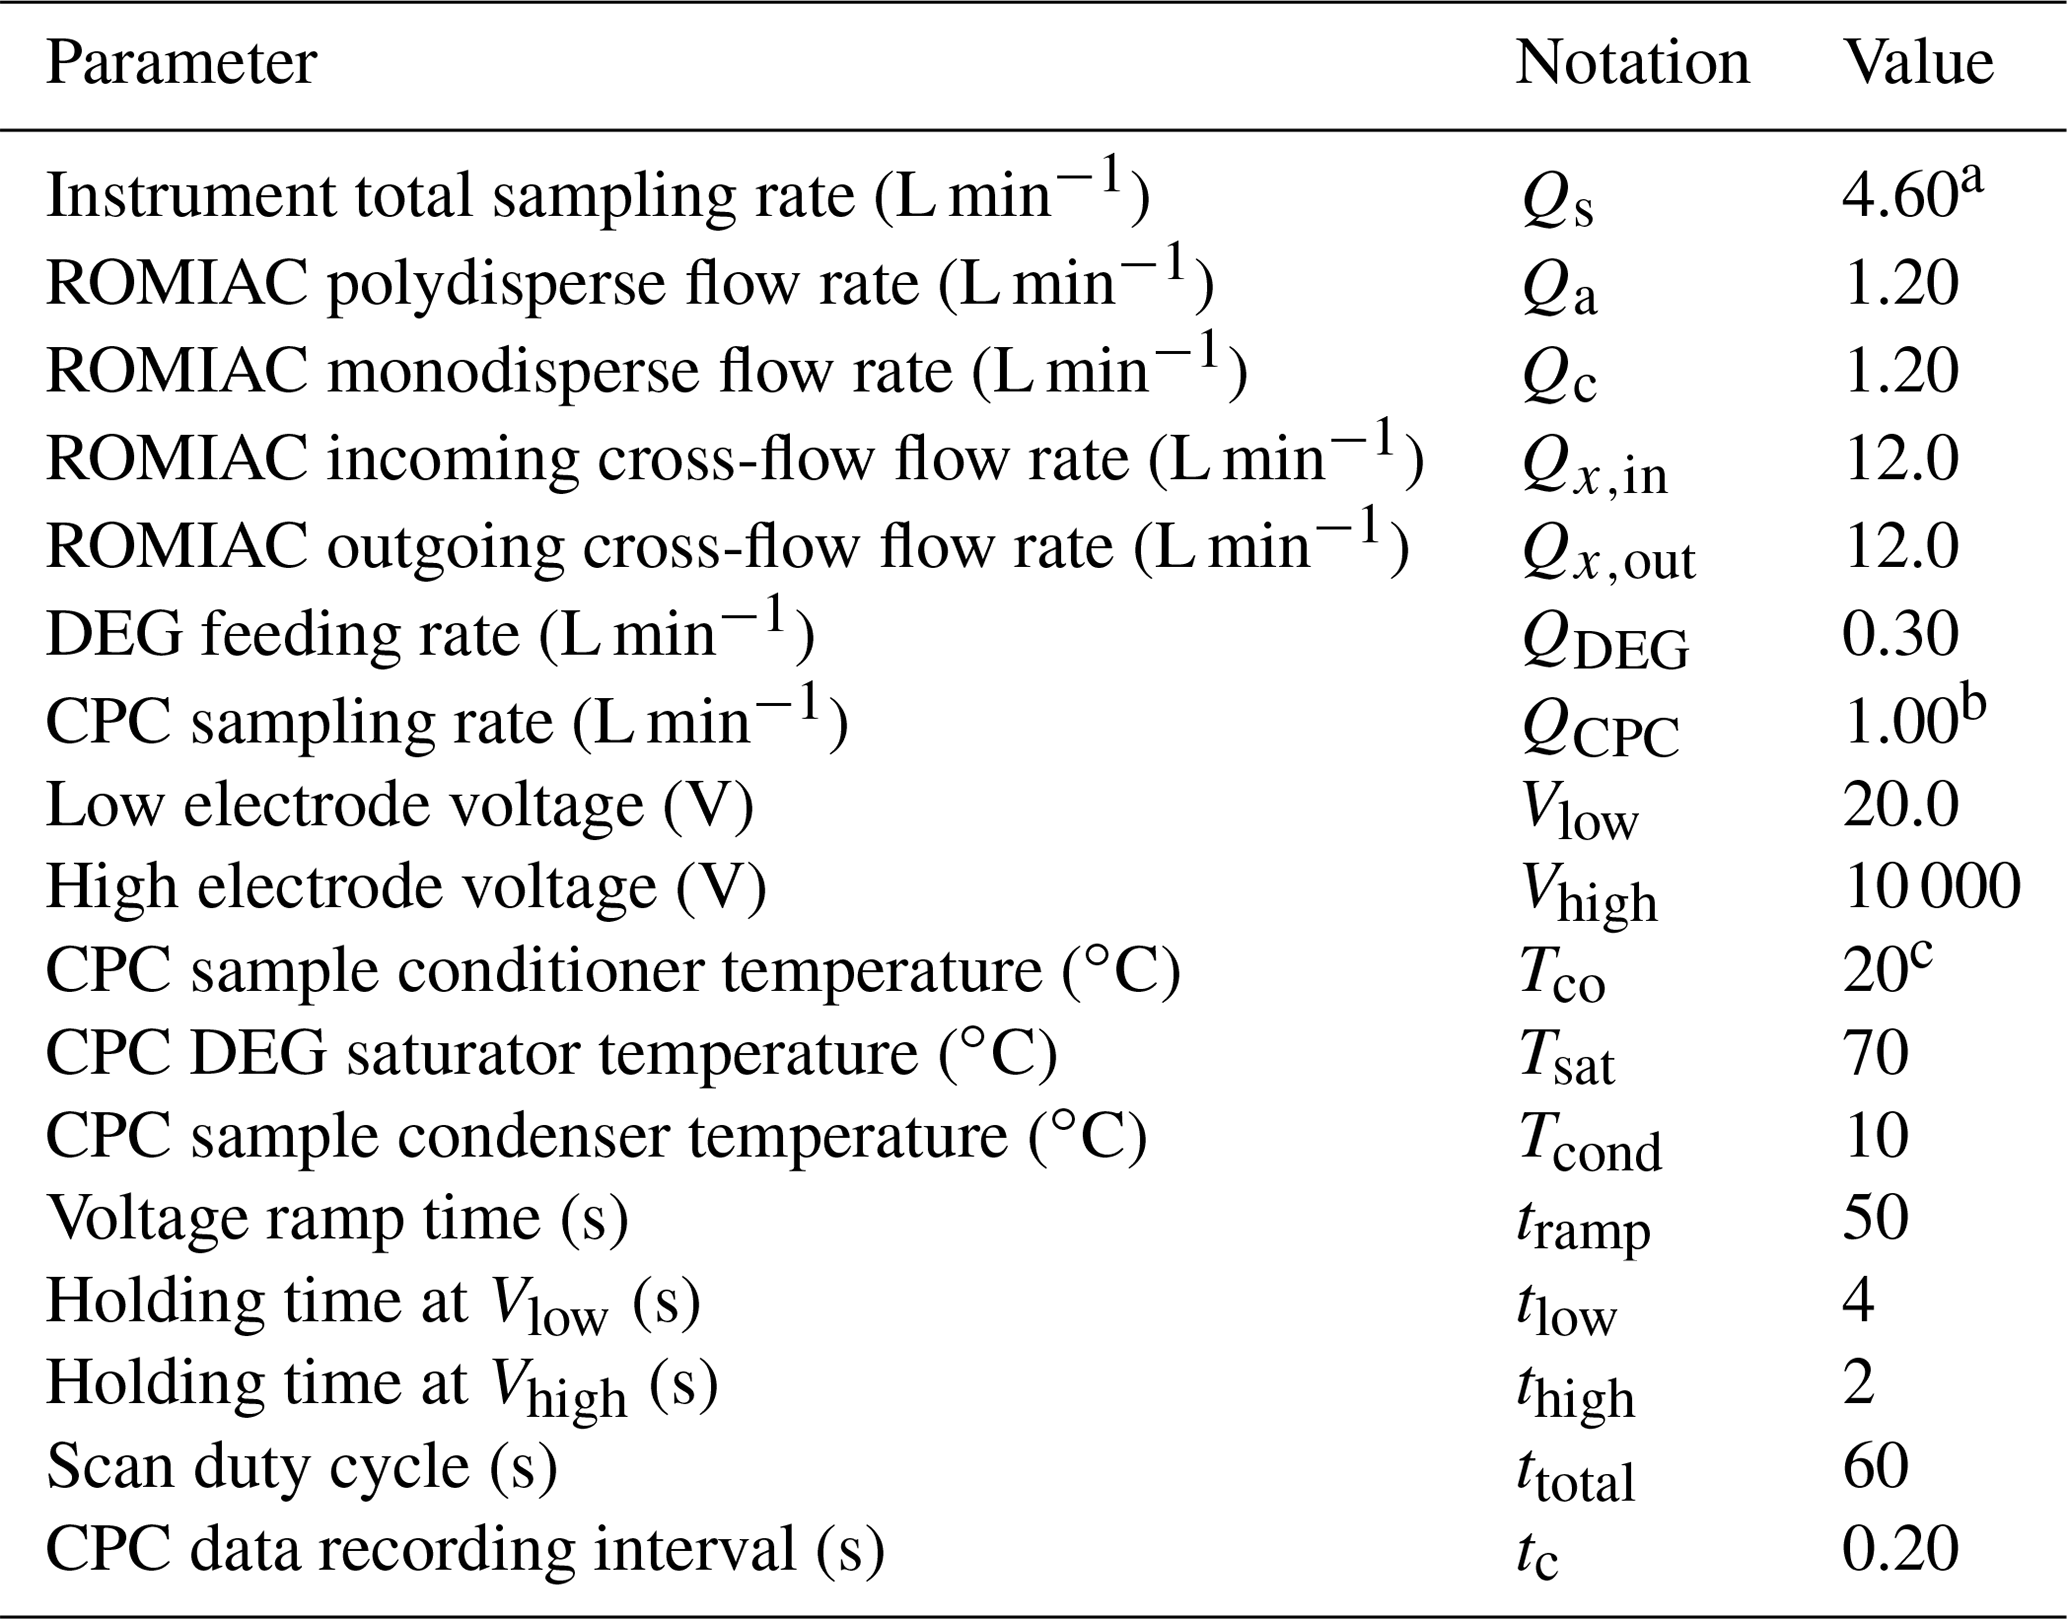
a All flow-rate measurements have an uncertainty of ±2 %.
b The MAGIC™ water-based CPC is a special, high-flow-rate, concise CPC.
c All temperature measurements have an uncertainty of ±0.1 ∘C.
The CC used in this study employs a soft x-ray source to produce ion pairs from the gas molecules in order to bring the aerosol to a steady-state Fuchs charge distribution that enables estimation of the size distribution whose initial charge state is uncertain. The soft x-ray source has two advantages: (i) fewer regulatory hurdles than radio-isotope sources used for the same purpose and (ii) the ability to turn off the ion source in order to measure those particles in the sample that carry charge due to gas ionization by galactic or simulated cosmic rays. It was designed to minimize losses of the smallest particles. Preliminary characterization of the CC and data from numerous experiments, in which it has been applied to conventional DMAs in parallel with other DMAs using conventional CCs and to the nano-radial differential mobility analyzer (Brunelli et al., 2009), yield results consistent with the Wiedensohler (1988) approximation of the Fuchs charge distribution, with no apparent biases. Since mobility classified and therefore charged particles are used to determine the integrated instrument transfer function that is reported here, the key results from this paper are not affected by any minor deviations from the Fuchs charge distribution that is assumed in inverting data from the nSEMS. Details of the design and quantitative calibration of the soft x-ray CC will be presented in a separate paper.
The charged nanoparticles transmitted through the aforementioned core sampling flow splitter enter the ROMIAC at a flow rate of 1.2 L min−1, tangentially into a flow distribution channel, and then enter the classification region through a narrow slit. Unlike traditional DMAs, in which the particle-free sheath flow is parallel to the electrodes, the ROMIAC uses a 12 L min−1 recirculated, filtered cross-flow that enters and exits the classification region through screen electrodes (Flagan, 2004; Mui et al., 2013, 2017). For nondiffusive particles, the ideal resolving power of the classifier, ℛnom,nd, is the same as that of a traditional DMA operating at the same flow-rate ratios, i.e.,
for all of the designs, configurations, or flow-rate ratios (Flagan, 1999, 2004). The two flow factors, the imbalance factor, δ, and the aerosol-to-cross-flow ratio, β, are defined as
where Qa is the incoming polydisperse aerosol flow rate, Qc is that of the outgoing classified sample flow, and Qx,in and Qx,out are the entering and exiting cross-flow rates. If the incoming flows are balanced with the outgoing flows (Qa=Qc; ), then the two factors can be simplified to δ=0 and . A resolution of ℛnom,nd=10 is generally sufficient to capture the critical cluster-to-ion formation process under ambient conditions. In order to get a reasonable size coverage to study the subsequent condensational or coagulational growth of newly formed nanoparticles, voltage is exponentially ramped between 20 and 10 000 V with a characteristic time,
of approximately 8 s. The mean residence time of the sample flow in the classifier, τf, is
with 𝒱class and corresponding to the volume and aerosol flow rates in the classification region. For the ROMIAC, , where R1=0.24 cm and R2=1.61 cm are the inner and outer electrode radii, and b=1 cm is the gap between the high-voltage and ground electrodes, resulting in a classification volume 𝒱class≃8.0 cm3. The resulting mean gas residence time at the nominal aerosol flow rate is τf≃0.4 s. The mobility of the particles that are transmitted through an ideal, constant-voltage ROMIAC is
where can be treated as the centroid particle electrical mobility in scanning mode, assuming highly idealized flow and electric fields, and corresponds to the peak of the transfer functions (Zhang et al., 1995; Mui et al., 2017). V∗ is the corresponding voltage applied to the central electrode when particles are detected by the CPC.
Most mobility-based particle sizing systems measure only one polarity of charged particles (usually positive) by employing a single-polarity high-voltage supply, but bipolar CCs such as the soft x-ray source used in this study produce ion pairs to bring the aerosol to a steady-state, “neutralized” state that contains both negatively and positively charged particles as they collide with ions of both polarities. Because ion properties, such as mass, mobility, and concentration, as well as experimental conditions, can all affect particle charging efficiency, and the ions produced by the soft x-rays can vary due to trace species in the gas, measuring only particles with single polarity may lead to uncertainties and variabilities in computing particle concentrations (Steiner et al., 2014; Chen et al., 2018; Kangasluoma et al., 2013). To optimize instrument performance and avoid potential variability in particle charging, the ROMIAC operates on a custom-built dual high-voltage supply with fast polarity-switching capability. In the default operating mode of the nSEMS, the polarity of the scanning voltage is switched at the start of every scan, but the polarity can also be fixed as either positive or negative, or it can be turned off to meet different scientific needs, i.e., to sample particles formed by ion-mediated nucleation. This feature not only helps to better understand the performance of bipolar diffusion charging, but it also enables measurement of the charge state of the sampled aerosol particles by deactivating the CC for some or all scans. This becomes an important feature when studying atmospheric nucleation as it enables discrimination between neutral and ion-mediated nucleation (Kirkby et al., 2016; Wagner et al., 2017).
Classified particles transmitted through the ROMIAC are subsequently detected by a two-stage CPC that enables particle counting approaching 1 nm in size (Iida et al., 2009; Jiang et al., 2011a). The first stage employs a fast-mixing condensational activation and growth reactor (Wang et al., 2002) that uses DEG as the working fluid to activate the nanoparticles. This activation stage is based upon the particle size magnifier (PSM) (Kousaka et al., 1982; Okuyama et al., 1984; Gamero-Castano and de la Mora, 2000; Sgro and de la Mora, 2004) in which a cool aerosol sample flow undergoes rapid turbulent mixing with a warm flow that is saturated with vapor to produce the supersaturated state that will activate and grow particles larger than a critical size. The detailed design incorporates modifications reported by Shah and Cocker (2005) that reduce the size of the mixing volume while maintaining the small growth tube, with a residence time of ∼ 10 ms. In the first stage used in this study, supersaturation is produced by turbulent mixing of a 0.3 L min−1 flow of hot (e.g., 70 ∘C) DEG vapor with a 1.2 L min−1 cold (20 ∘C) particle-laden flow. The downstream growth tube is cooled to 10 ∘C to accelerate particle growth and remove excess vapor. In contrast to the Airmodus particle size magnifier (PSM) and the CPC of Sgro and de la Mora (2004), on which the PSM is based, the mixing time in the activation stage of the present CPC has been minimized (∼ 0.12 s) to speed up instrument response compared with ∼ 0.7 s. The design and initial experiments were performed with a TSI model 8210 CPC operating at a flow rate of 1.5 L min−1 as the second detection stage. Owing to the slow response of that CPC, it was replaced with a modified, water-based ADI MAGIC™ CPC that serves as the second stage to grow particles sufficiently large for optical detection (Hering et al., 2019). Particle counts are recorded over the nSEMS size distribution scan at 5 Hz. The sample flow rate of the CPC is 1.00 L min−1. Between the activation and booster stages, the flow is split between the water CPC and a smaller (0.5 L min−1) excess flow to minimize deposition of excessive DEG vapor in the intervening plumbing and to match the flow to the water CPC.
While this CPC can detect particles as small as 1 nm in diameter and the ROMIAC can classify particles of that small size (Mui et al., 2013, 2017), Kangasluoma et al. (2013) observed larger numbers of apparent particles smaller than 1.5 nm in diameter than were present in the calibration aerosol that they generated and attributed the excess particle counts to the activation of gas ions within the CPC. Lacking a definitive method for discriminating between gas ions and particles in the sub-1.5 nm size range, we do not report size distributions below 1.5 nm.
Data acquisition and instrument control for the nSEMS are accomplished with a National Instruments™ sbRIO-9637 CompactRIO single-board controller coupled with a field-programmable gate array (FPGA) module. The FPGA module, which is programmable using LabVIEW 2018, is capable of operating at clock speeds up to 40 MHz with optimized hardware and memory settings. The FPGA is controlled by a microprocessor that runs on a real-time Linux operating system (OS), greatly reducing the overhead and response lag associated with typical LabVIEW applications running on other platforms. The real-time OS and FPGA enable independent time loops for precise control of the voltage exponential ramp and recording of CPC concentrations. The board controller is connected to a Windows PC via Ethernet, enabling communication among different programs, visualization of real-time data, and online monitoring of critical parameters without compromising instrument timing.
Compared to the DMPS, the SEMS accelerates mobility-based size distribution measurements by classifying particles in a time-varying electric field and eliminating the transition time between measurement channels. Although the exponential voltage ramping allows investigation of rapidly evolving aerosol particles, it alters the particle trajectories in the classifier such that the transfer function may differ significantly from that expected for a DMPS. Numerical simulations of particle trajectories in a scanning cylindrical DMA have shown that the width of instrument transfer function for fast scans can be significantly greater than that for a static (constant-voltage) DMA (Collins et al., 2004; Mai and Flagan, 2018; Mai et al., 2018). Similarly, voltage scanning of the ROMIAC may distort the transfer functions from those seen in static-mode operation.
3.1 Finite-element modeling of particle transmission
Both numerical simulations and derivations of analytical solutions for idealized instruments have proven to be powerful tools in the study of the transfer functions of DMAs operating in scanning mode (Collins et al., 2004; Dubey and Dhaniyala, 2011). However, the ROMIAC geometry and particle trajectories are more complicated than those in long-column cylindrical DMAs. In order to fully understand the flows, electric field, and particle trajectories inside a scanning ROMIAC, particle transmission has been examined with finite-element simulations using COMSOL Multiphysics® (version 5.3).
We have solved Navier–Stokes and Maxwell equations for the flow and electric fields, respectively, using the “Laminar” and “Electrostatic” modules in COMSOL Multiphysics®. The time-varying electric field, , can be treated as quasi-steady-state:
where is the electric field in the beginning of the voltage ramp at , and f(t) is the time variation factor depending on the characteristic ramping time τs defined in Eq. (4).
Because the particles classified in the ROMIAC are sufficiently small that inertial effects can be neglected, particle motion is numerically simulated using the “Particle trajectories” module in COMSOL, with only the drag, electrostatic forces, and Brownian motion being considered, as the particles are assumed to be massless. The scanning ROMIAC transfer function for monodisperse particles can be written as
where Na and Nc are the number of particles going in and coming out of the ROMIAC during the simulation. In order to determine the scanning ROMIAC transfer function with adequate time resolution, 200 particles are injected into the ROMIAC every 2.5 ms; simulations were performed for the default flows and voltage ramp settings listed in Table 1. The times at which particles enter and exit the scanning ROMIAC were recorded. Figure 2 shows an example of the finite-element solutions of the flow and electric fields for dp=4 nm particles. The modeled instrument response for particles with 13 different mobility diameters across the sizing range of the instrument is shown with solid lines in Fig. 3. The peak transmission ratio for particles larger than about 5 nm remains flat at approximately 60 % and progressively drops at smaller sizes. Simulation was also performed for different ramp times in order to compare the transfer function distortions that may result from fast voltage scanning (Fig. S1 in the Supplement).

Figure 2Example of finite-element simulations of the scanning ROMIAC at an aerosol flow rate of Qa=1.2 L min−1 and a cross-flow rate of Qc=12 L min−1, with particle diameter of dp=4.0 nm. (a) Particle trajectories over a 50 s upscan at t≈25 s. Cross-sectional view of (b) the flow velocity and (c) electric field distribution. The magnitude of the electric field corresponds to the maximum, 10 kV, electric potential. Particles enter the ROMIAC from the entrance slit that is tangential to the classification region and leave the ROMIAC from the slit perpendicular to the classification region.
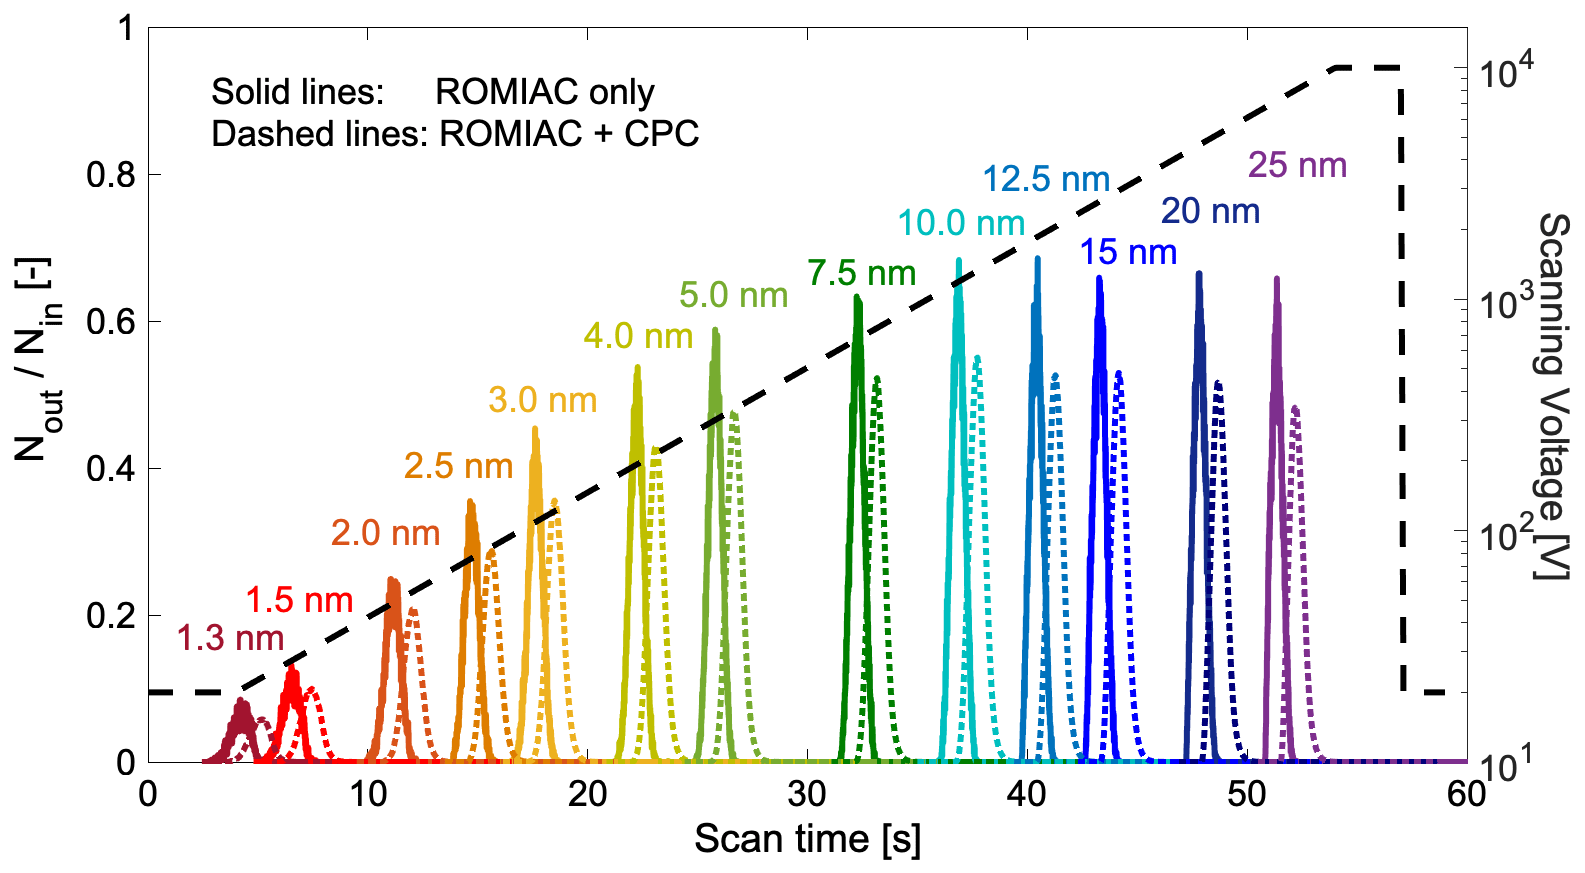
Figure 3Simulated transfer function of the scanning ROMIAC with monodisperse input particles in the 1.3–25 nm size range. The transfer function is calculated as the ratio of the particle number at the exit and the entrance of ROMIAC over a voltage scan (dashed black line) with tramp=50 s. Solid lines show the transfer function of the classifier (scanning ROMIAC) only; dashed lines show the simulated ROMIAC transfer function coupled with the CPC residence time distribution (see Eq. 12). The integrated transfer function peaks (dashed lines) are used to compute the inversion kernel for nSEMS data inversion.
3.2 Laboratory characterization of the ROMIAC
Although particle trajectory simulations using COMSOL Multiphysics® have proven very effective at retrieving particle transfer functions, they cannot fully capture the nonideal, three-dimensional behavior of particles inside the classifier due to the high computation cost (Mai and Flagan, 2018; Amanatidis et al., 2020). As a result, experimental calibrations are needed to closely examine the scanning ROMIAC performance. Figure 4 shows the tandem differential mobility analyzer (TDMA; Rader and McMurry, 1986) calibration setup used; aerosols of a known size are selected with a classifier (a constant-voltage ROMIAC or DMA for small, 1–20 nm, or large, 12–26.5 nm, respectively) before entering the nSEMS. Depending on the target size range, source particles were generated from electrosprayed tetra-alkyl ammonium solutions (Ude and de la Mora, 2005), a heated Nichrome hot-wire source (Peineke et al., 2006), or atomized sodium chloride solution. The polydisperse aerosols generated from the hot wire or the atomizer were size-selected by a ROMIAC or a cylindrical DMA operating at constant voltage to provide a narrow-mobility-distribution sample for nSEMS calibration. In order for the size-selected source particles to approximate a monodisperse aerosol, both the cylindrical DMA and the classifying ROMIAC were run at higher resolution than the nSEMS standard operating condition (ℛnd≥10 for both the classifying DMA and ROMIAC) using open-loop controlled sheath flow or cross-flow, respectively.
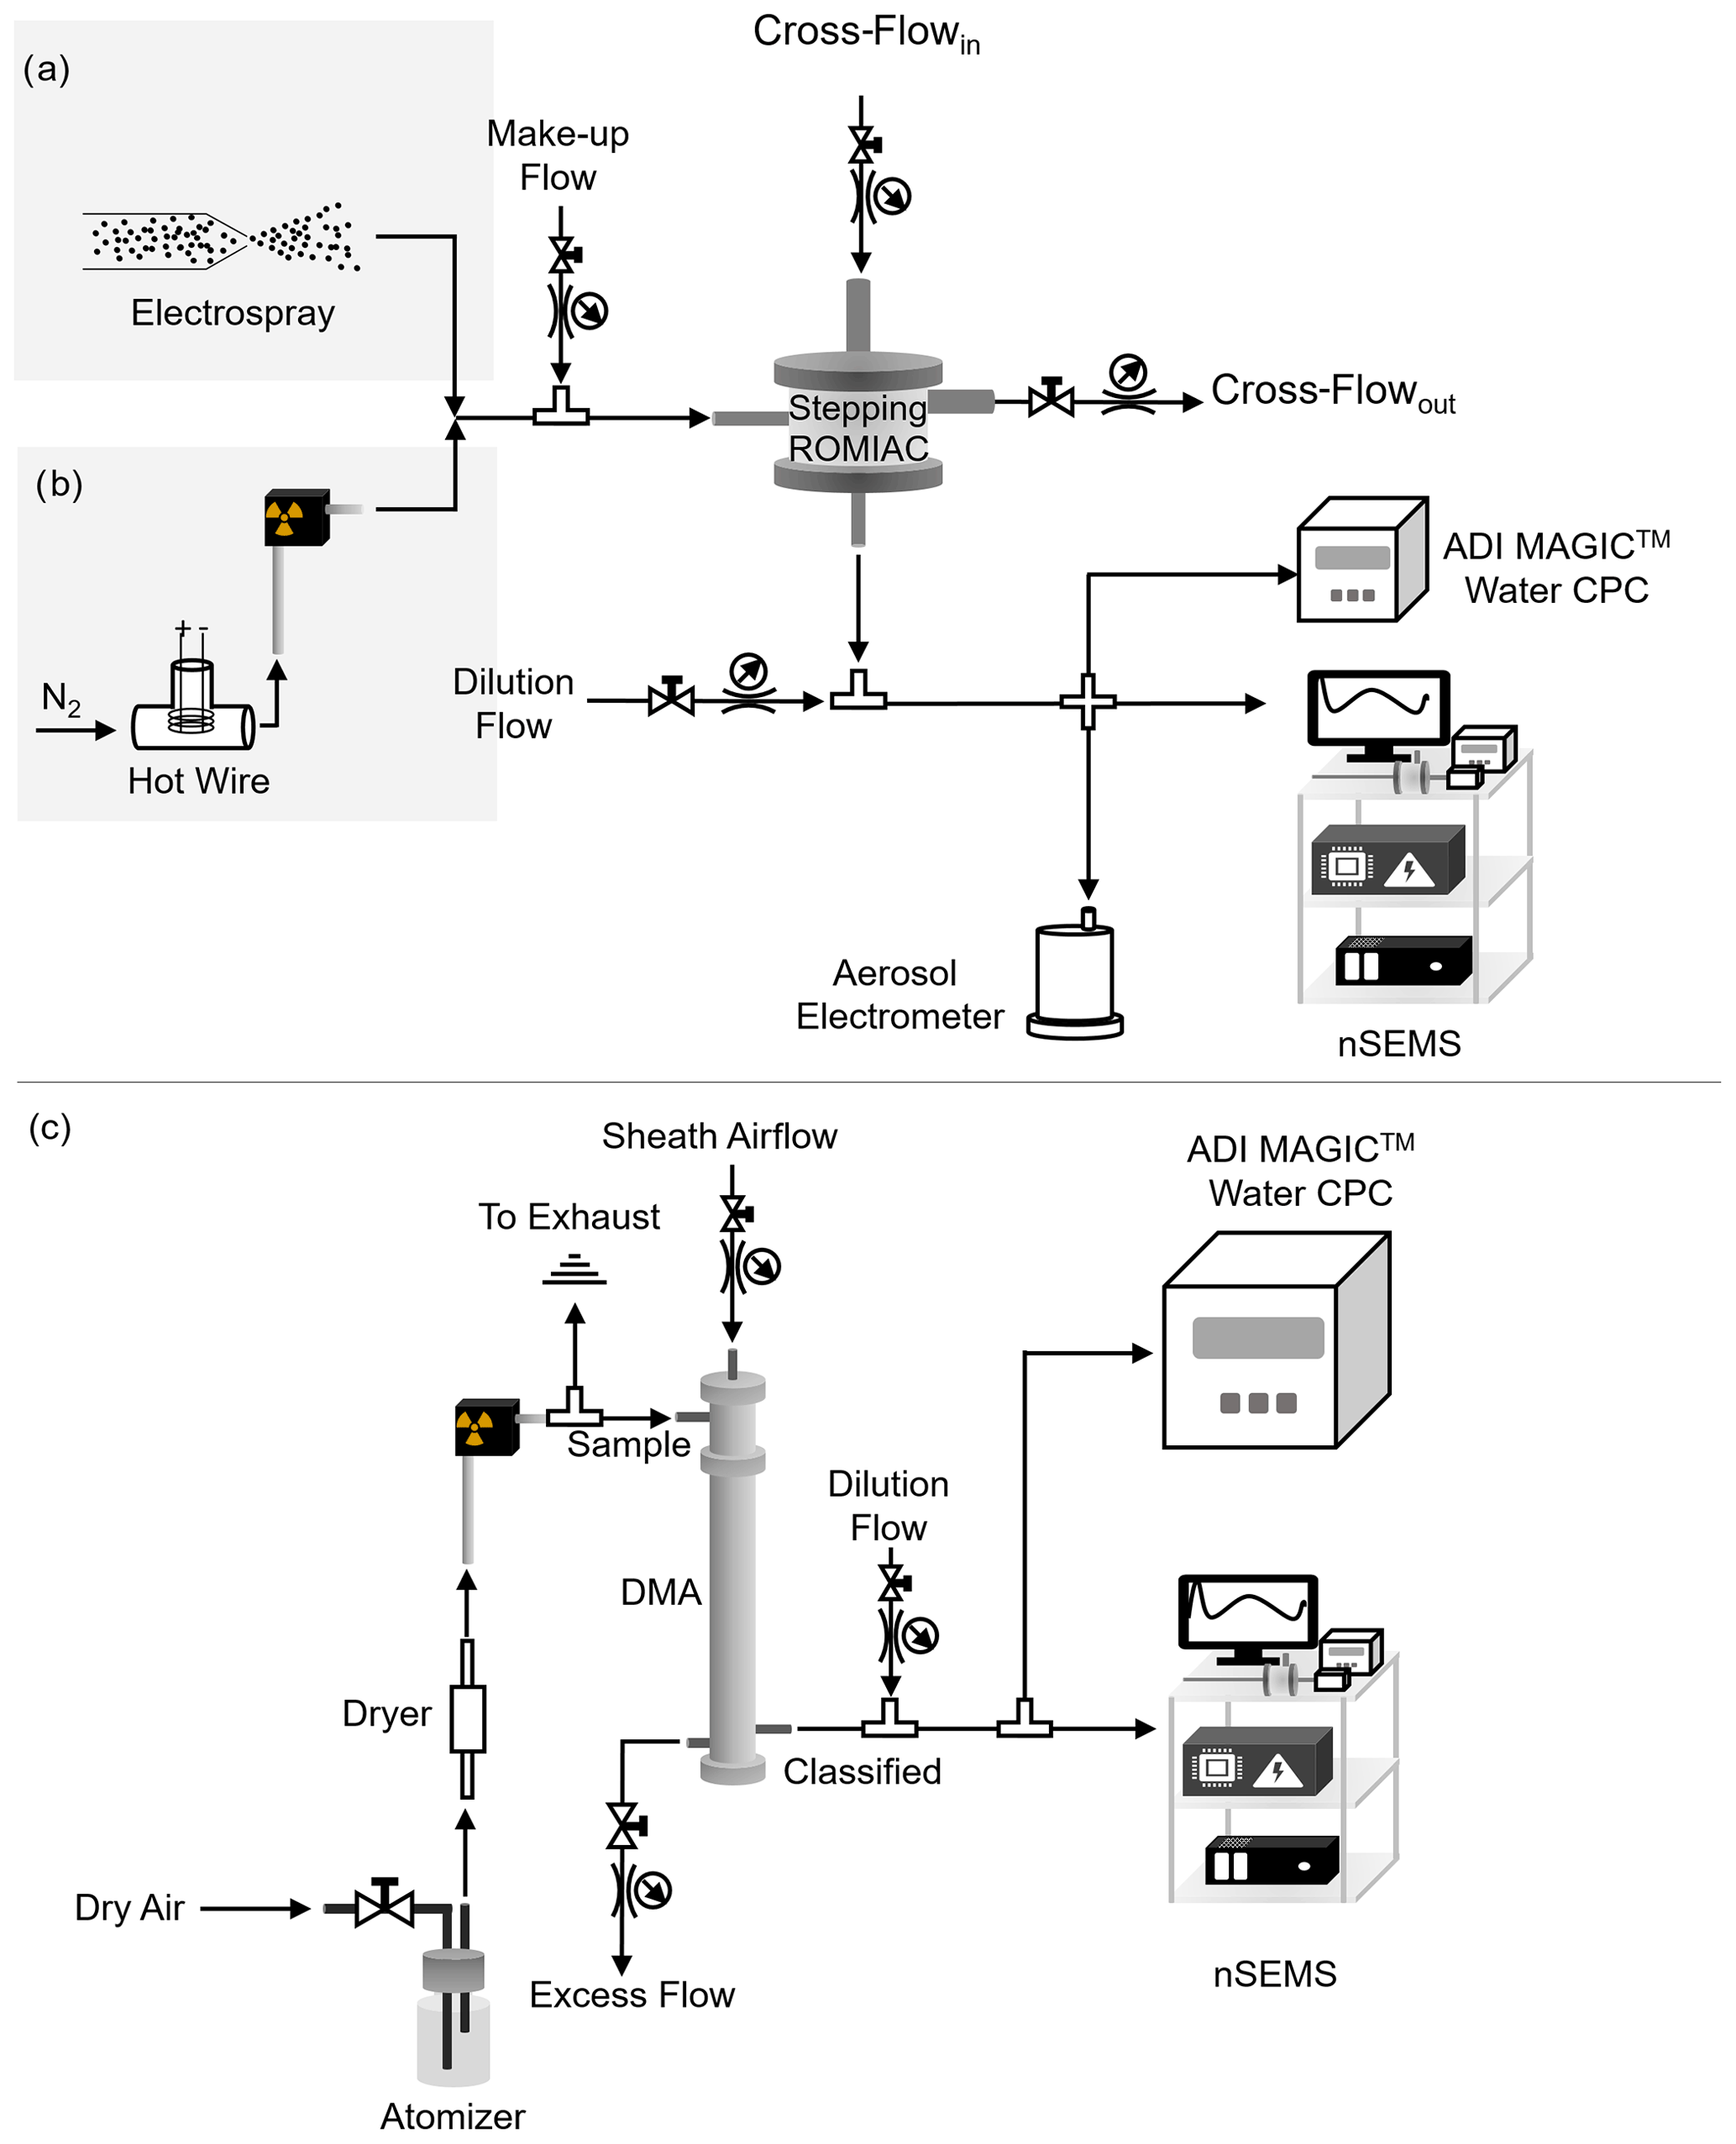
Figure 4The experimental setup used for the nSEMS calibration and characterization in different particle size ranges. (a) <3 nm size range: tetra-alkyl ammonium ions produced by an electrospray were classified using static ROMIAC as a classifier (ℛnom,nd≈10) and an aerosol electrometer as a reference for the upstream particle number. The electrospray was operated at 3000 V and 25 cm H2O pressure. The tetra-alkyl ammonium solutions were prepared with 10–20 mg salt in 1.5 mL methanol. (b) 1.5–20 nm size range: a heated Nichrome wire was employed as a hot-wire aerosol source, with a static ROMIAC as a classifier (ℛnom,nd≈10) and both an aerosol electrometer and ADI MAGIC™ water CPC as upstream particle counters. The hot wire was operated in the range of 5.0–7.0 V and 4.5–6.5 A. (c) 12.0–26.5 nm size range: atomized sodium chloride was employed as an aerosol source, with a cylindrical differential mobility analyzer (DMA) as a classifier (Qa=0.5 L min−1, Qsh=5.8 L min−1, ℛnom,nd≈12) and an ADI MAGIC™ water CPC as an upstream particle counter. Both (b) and (c) follow a TDMA calibration setup (Rader and McMurry, 1986), which uses a classifier at a constant voltage to select particles within a narrow range of sizes.
Due to perturbations of the electric field and imperfections in the instrument fabrication, particle transmission in any mobility analyzer can deviate from the designed performance. When the ROMIAC of the nSEMS is operated in static mode, correction factors can be determined empirically to account for any deviations from theoretical or numerical performance. In terms of particle sizing, an empirical mobility correction factor, fz, is calculated by comparing the experimental transfer function with the expected , as defined in Eq. (6), using the TDMA calibration setup (Mui et al., 2017). This correction factor, , is estimated to be 1.03 for the ROMIAC classifier used in the nSEMS system.
3.3 Characterization of the two-stage CPC
In addition to the ROMIAC, nonideal performance of the two-stage CPC may also affect the nSEMS data acquisition and interpretation. Figure 5 shows the experimental setup that was used to measure the size-dependent detection efficiency of the two-stage CPC. The classifying ROMIAC was operated in static mode with a resolving power of ℛnd=14. The hot-wire particle generator was set at similar conditions as shown in Fig. 4. Given that the hot-wire generator produces singly charged particles (Peineke et al., 2006), an aerosol electrometer was placed between the ROMIAC and the two-stage CPC to measure the total particle number concentrations coming out of the classifier. The plumbing upstream of the CPC was kept the same as on the integrated nSEMS system so that the resulting plumbing delays would be taken into account in this calibration. The CPC counting efficiency relative to that of the aerosol electrometer is shown in Fig. 6. The 50 % cutoff size is about 1.6 nm, and the counting efficiency reaches a plateau when particle-mobility-equivalent diameter is larger than about 2.1 nm (dp≥2.1 nm). The empirically determined two-stage CPC counting efficiency was fitted with a logistic function:
where ηmax=1.01, k=6.30 nm−1, and nm based on the calibration results.
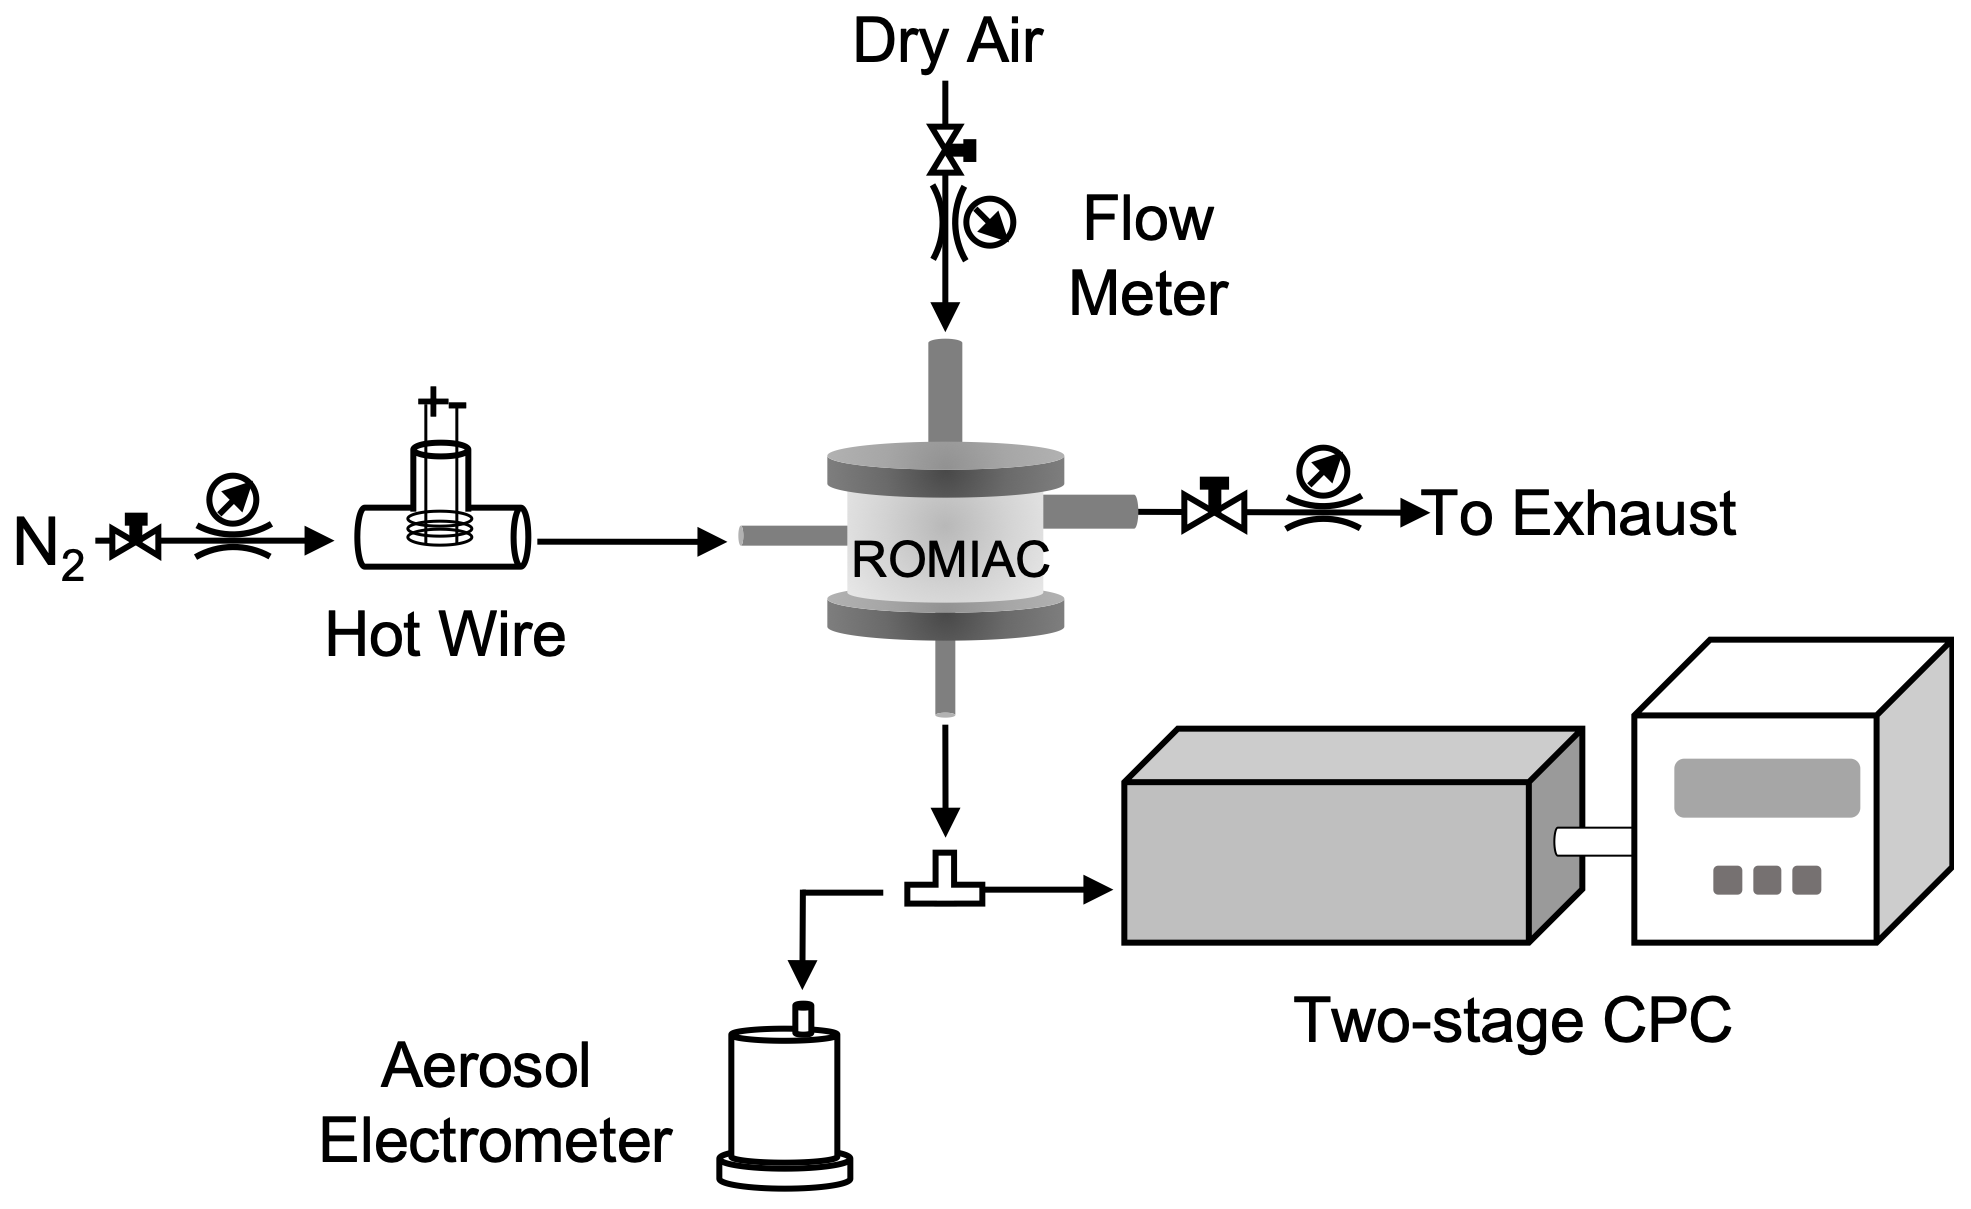
Figure 5Experimental setup used to characterize the two-stage CPC detection efficiency. A hot-wire aerosol generator was used to provide aerosol samples. The ROMIAC was operated at static mode to provide stable, monodisperse aerosol particles for both the two-stage CPC and the aerosol electrometer. The ROMIAC aerosol and cross-flow rates were Qa=2.5 L min−1 and Qx=35.5 L min−1. The electrometer was pre-calibrated against a TSI 3760A butanol-based CPC and an ADI MAGIC™ water-based CPC.
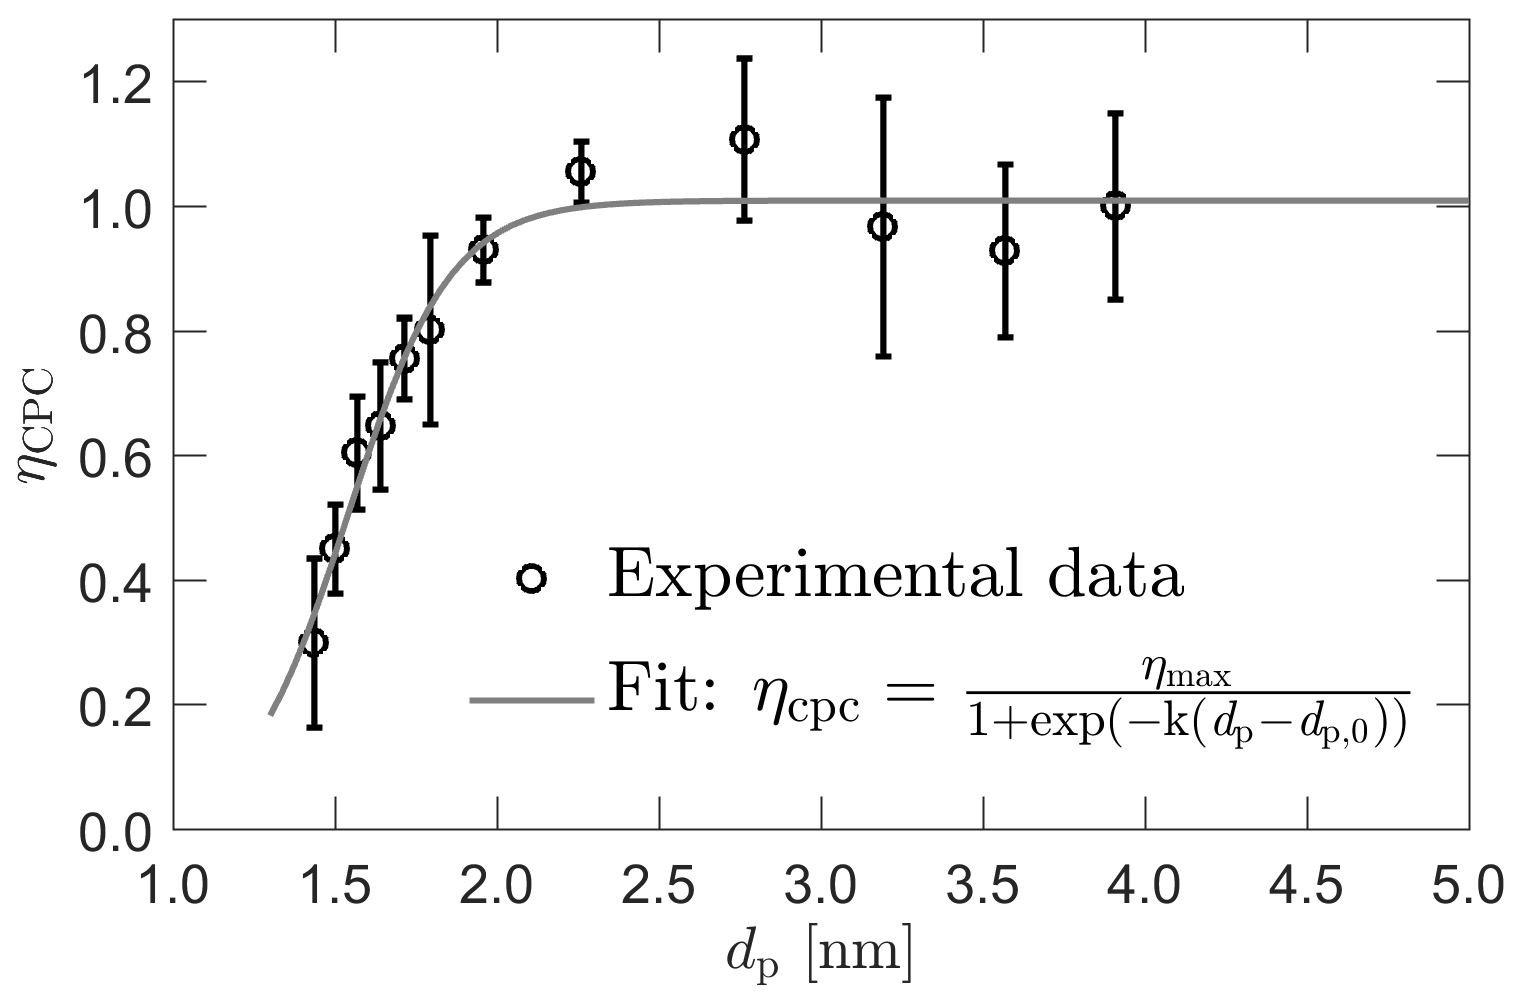
Figure 6Detection efficiency of the two-stage CPC as a function of dp, the mobility-equivalent particle diameter. The efficiency is corrected for the dilution due to the vapor flow. The size-dependent detection efficiency is fitted to a logistic function with fitting parameters ηmax=1.01, k=6.30 nm−1, and nm. The fit is used to approximate the CPC detection efficiency, ηcpc, in the data inversion.
In addition to detection efficiency, the delay in CPC response also complicates the transfer function of the system. When the classifier is operated at scanning mode, the slow response of the CPC may introduce a smearing effect and broaden the particle transfer functions. To account for this effect, the response of the two-stage CPC can be modeled as a plug flow reactor (PFR) in series with a continuous stirred-tank reactor (CSTR) to estimate its particle residence time distribution, Ecp(t) (Russell et al., 1995; Collins et al., 2002; Mai et al., 2018):
where τp and τc are the mean residence time of the PFR and the CSTR, respectively, and ⋆ is the symbol for the convolution of two functions (Bracewell and Bracewell, 1986). The transfer function of the integrated nSEMS system, , can be written as
To explore the extent of this effect, the nSEMS was run with different voltage ramp times (10–1400 s, corresponding to a value of 4–5600). At long voltage ramp times, e.g., at 1400 s, the nSEMS can be treated as operating in a quasi-static mode, wherein the CPC response time has no impact on the transfer functions. Figure 7 shows the experimentally determined particle transfer functions of the nSEMS at different tramp for dp=18 nm particles. The results indicate that the smearing effect is small when tramp is longer than 30 s (τs≥4.83 s). The residence time distribution is computed by deconvoluting the quasi-static nSEMS transfer function measured with tramp=1400 s from that measured with tramp=50 s. The resulting characteristic times for the CPC residence time distribution were τc=0.20 s and τp = 0.70 s (Fig. S2). The dashed lines in Fig. 3 show the convoluted nSEMS transfer function, , combining the CPC residence time distribution in addition to the scanning ROMIAC simulation.
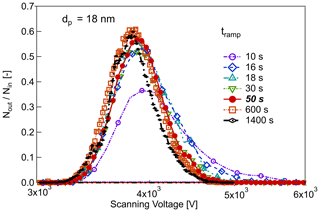
Figure 7Effect of voltage ramp time, tramp, on the nSEMS scanning transfer function with dp=18 nm input particles. The nSEMS voltage is increased exponentially from 20 V to 10 kV over ramp times within 10–1400 s, including the default tramp=50 s. CPC smearing of the transfer function increases with decreasing tramp and becomes very pronounced at tramp<20 s.
3.4 Derivation of the integrated instrument transfer function and data inversion
Data inversion is required to retrieve the particle size distribution of the source particles, n(log dp), from the particle counts measured by the CPC, RnSEMS, which can be represented in matrix form as
where AnSEMS is often referred to as the inversion kernel for the instrument, and N is the vector of weights for the discretized representation of the particle size distribution, for which we use linear splines on x=log (dp) (Mai et al., 2018). The time series instrument response can be written as . With the default nSEMS voltage ramp time, tramp=50 s, and the CPC data recording frequency, tc=0.2 s, the vector length for one complete scan is I=250. The particle number counts recorded by the CPC in the ith time bin, RnSEMS,i, can be represented as the integral of the total number of particles transmitted over the time interval .
The particle charging probability from the soft x-ray CC, pcharge(x,ϕ), was assumed to be that of the Wiedensohler (1988) approximation and is computed separately for scans of negative and positive polarity. In order to obtain the instrument transfer function, , for each time bin, the simulated ROMIAC transfer functions were first fitted as a Gaussian function.
The three fitting parameters, a, b, and c, were then interpolated over the entire time vector with 250 bins. By substituting the interpolated parameters back into Eq. (15), a ROMIAC transfer function, , was generated for each time bin. The fitted transfer functions were adjusted by the empirically determined mobility correction factor, fz. The nSEMS transfer function for each time bin, , was then computed by the convolution of the ROMIAC transfer function and the CPC residence time distribution of Eq. (12). The inversion kernel matrix for the ith time bin and jth particle size bin thus becomes
We then applied a totally nonnegative least squares (TNNLS) algorithm to retrieve the sample particle size distribution from the inversion kernel and the particle number concentrations detected by the CPC, i.e., solving for (Merritt and Zhang, 2005; Mai et al., 2018).
3.5 Calibration results
Figure 8 shows the nSEMS scanning response with size-selected particles of different mobility-equivalent diameters using the TDMA setup shown in Fig. 4b (dp≤10.70 nm) and Fig. 4c (dp≥12.00 nm) with the default operating parameters listed in Table 1. The particles fed into the nSEMS using the TDMA setup were not monodisperse, which may have led to peak broadening and particle losses. In order to compare the experimental result with the simulation, we deconvoluted the CPC residence time distribution and the static classifier transfer function from the instrument response as shown in Fig. 8 (Stolzenburg and McMurry, 2008):
where the dimensionless mobility, , is defined as the ratio of input particle electrical mobility and the ideal mobility, , as defined in Eq. (6),
and and are the diffusing Stolzenburg transfer functions for the ROMIAC and long-column DMA operated at static mode, respectively:
where ϵ is
and erf(x) is the error function. The dimensionless diffusion factor, , is defined as
At ambient temperature, the migration Péclet number for singly charged particles can be approximated as a function of the static voltage:
The dimensionless geometry factor for classifiers, Gclass, which is estimated to be GLDMA=2.55 for the TSI 3081 LDMA at ℛnd, DMA≈12 and for the ROMIAC at ℛnd, ROMIAC≈10, can be computed as
where and for the ROMIAC. The real resolution of the scanning ROMIAC can then be computed using the full width at half-maximum of the transfer function, , (Flagan, 1999, 2004):
The transmission efficiency can be calculated as the area under the transfer function normalized by the area of an ideal transfer function, which in non-dimensionless form is equivalent to the flow factor, β:
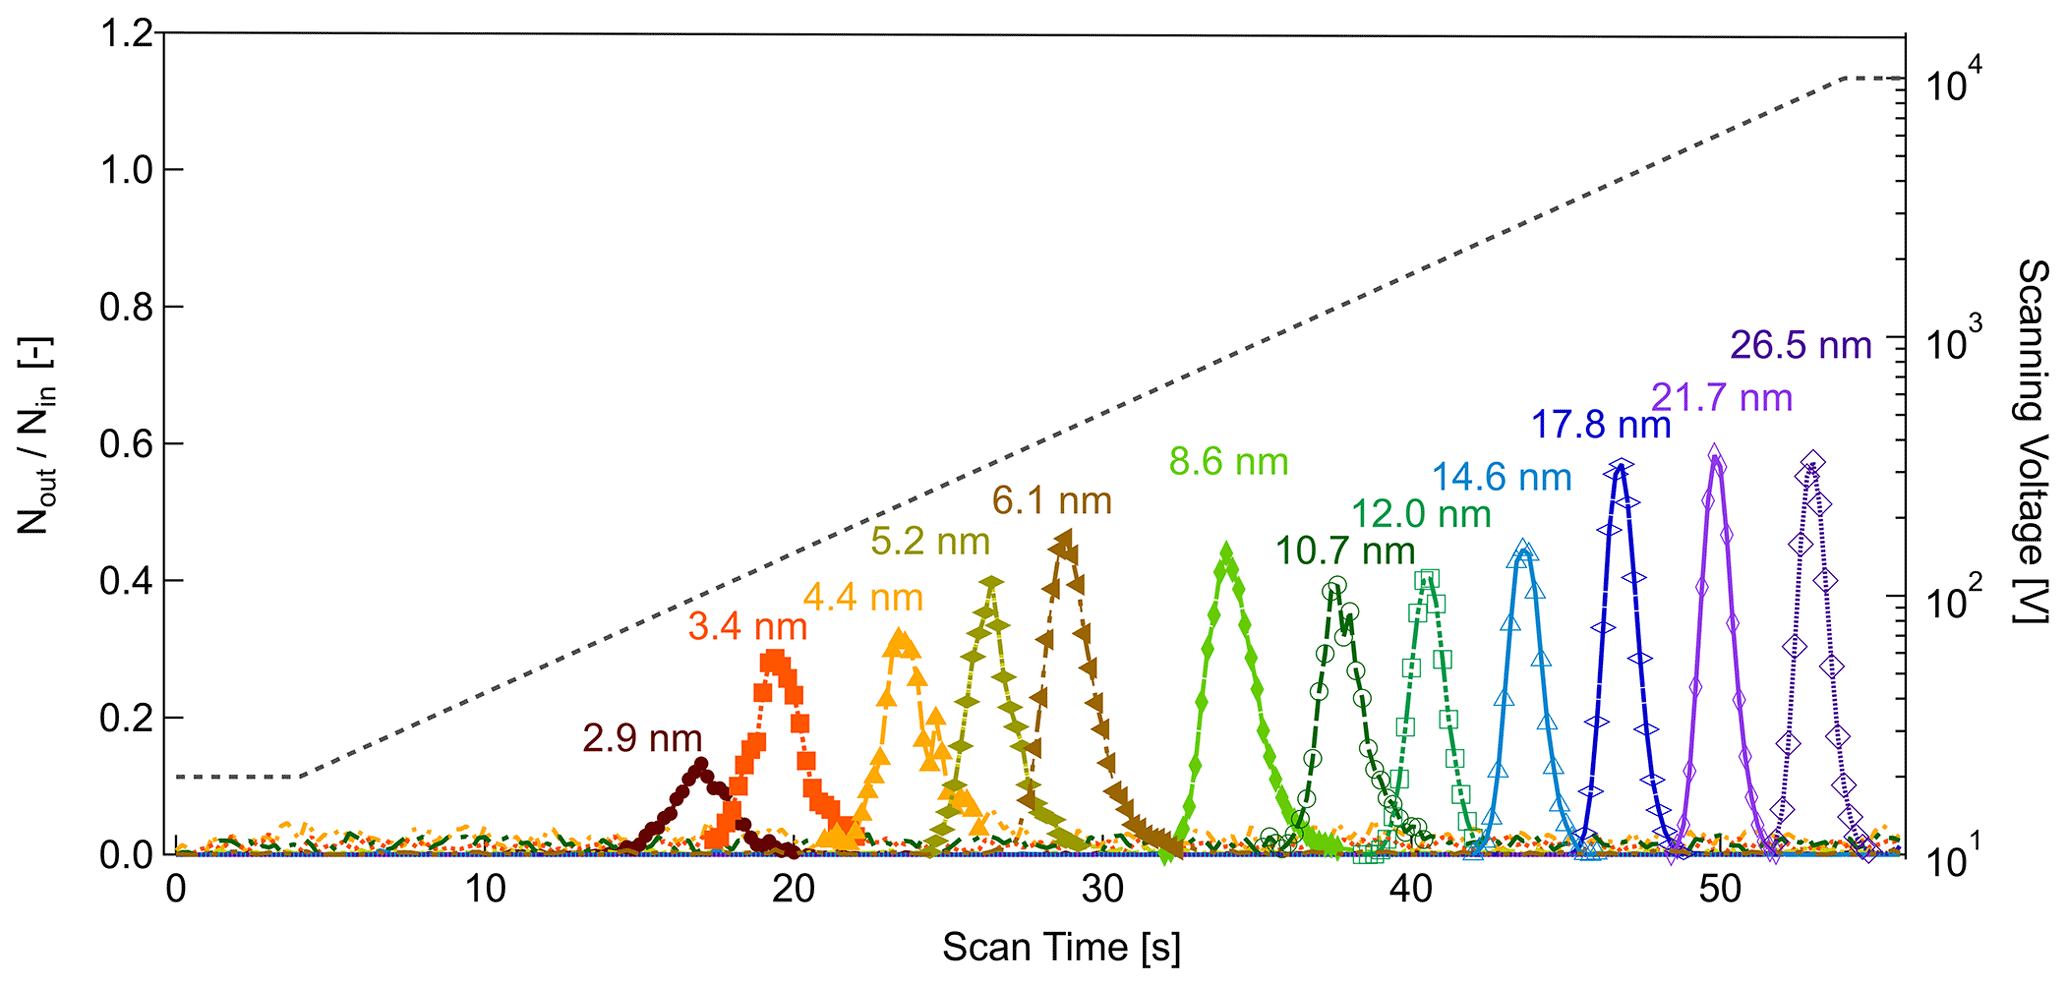
Figure 8Experimental calibration of the nSEMS using the TDMA setup shown in Fig. 4. Particles entering the nSEMS were classified as described; the reported mobility-equivalent diameters were calculated based on the upstream classifier operating parameters. The nSEMS was operated at the default parameters listed in Table 1, with tramp=50 s. The ratio of downstream to upstream particle counts of the nSEMS is shown as a function of time over the voltage scan, with input particles in the 2.9–26.5 nm range. The applied voltage is indicated by the dashed gray line. Only a fraction of the sizes used in the calibration are shown here for clarity; results from the complete size calibration summary are presented in Fig. 10.

Figure 9Comparison between experimental, simulated, and theoretical transfer functions. (a) The effect of operating voltage on classifier resolution calculated as the actual resolution based on the full width at half-maximum (FWHM) (Eq. 24) over ℛnd, the resolution at the nondiffusive regime (>5000 V). (b) Particle transmission efficiency as a function of operating voltage. Transmission efficiency, η, is calculated as the ratio of the actual over the ideal area below the transfer function peak. The error bars represent 1 standard deviation of uncertainty from multiple experiments at one size.
Figure 9 shows the comparison of ROMIAC resolution and efficiency between the experiment, COMSOL simulation, and the theoretical limit calculated for the DMA and the OMAC operated in static mode (Flagan, 2004). The overall performance of the nSEMS shows convincing agreement with the finite-element simulation results in Fig. 3, which proves the feasibility of coupling laboratory calibrations with numerical simulation to predict the instrument response of a SEMS system. Compared to the simulation and theoretical calculation, the effect of diffusional degradation at low voltages remains minimal for the scanning ROMIAC system compared to other conventional nano-SMPS systems, as previously predicted for the static OMAC (Flagan, 2004; Downard et al., 2011). Figure 10 shows the nSEMS peak voltage (V∗) as a function of particle mobility when operated at a cross-flow rate of Qc=12 L min−1. The relatively high classification voltage (∼ 35 V at 1.47 nm) compared to DMAs further reduces diffusional degradation of the resolution (Flagan, 1999). In addition to the calibration results using the hot-wire or atomized particle sources, it also includes the signature peak of tetra-heptyl ammonium bromide (THAB) ions (see Fig. 4a for setup). Particle mobilities are calculated using Eq. (1) at given diameters, assuming that the particles are singly charged. The experimentally determined voltages at the transfer function peaks are in close agreement with those predicted by the COMSOL simulation in Fig. 3. From the laboratory characterization results, the method of using empirical data to adjust the simulated particle transmission has proven to be an efficient and effective way to derive SEMS or SMPS system transfer function. In addition, the nSEMS, as the first system that employs an opposed-migration classifier with continuously varying voltage, has also demonstrated the great potential of scanning OMAC systems for providing fast and accurate particle size information in the low nanometer regime without significant diffusional degradation.
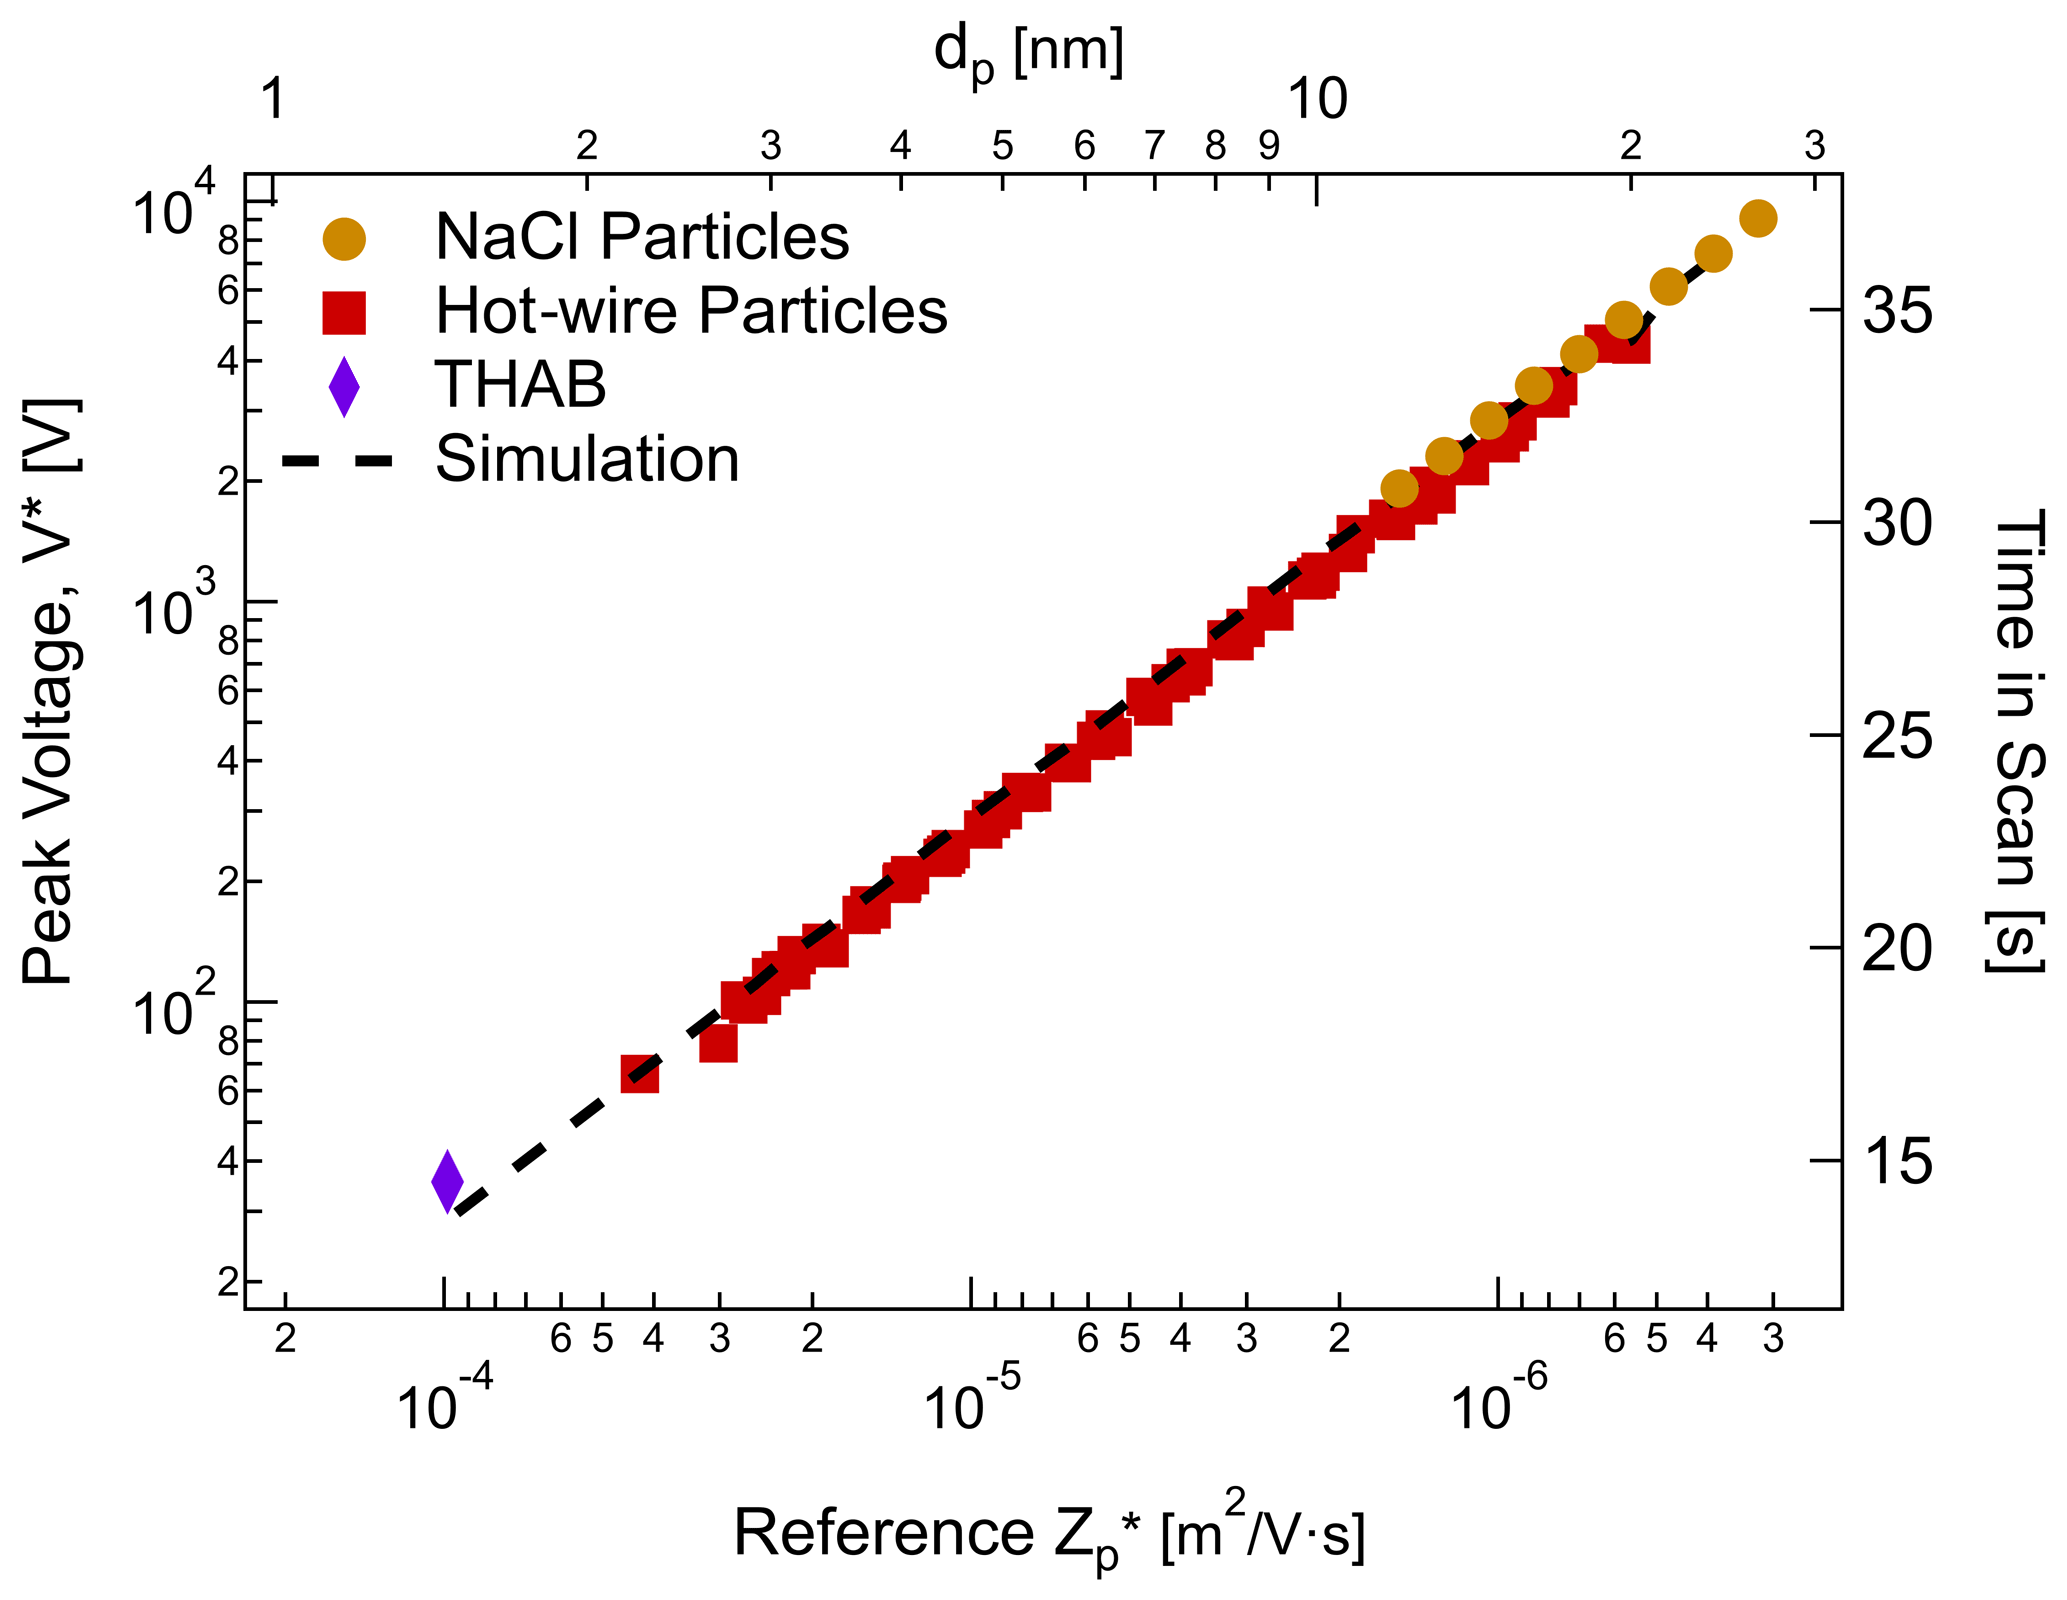
Figure 10The nSEMS voltage at the peak transmission (V∗) as a function of the input reference particle mobility, . Symbols represent experimental results with tetra-heptyl ammonium bromide (THAB), hot-wire, and atomized NaCl particles produced using the setups shown in Fig. 4. The black dotted line demonstrates the voltage at peak transmission predicted by the finite-element simulations. The top axis shows the corresponding particle diameter, dp, at a given mobility, , as defined in Eq. (1); the right axis shows the corresponding time in the scan.
Atmospheric new particle formation and its subsequent growth have a great impact on aerosol number concentrations and the Earth's total energy budget. In order to better understand the climate significance of NPF, much research has attempted to study the mechanisms of nucleation and the growth rates of nanoparticles. For example, the CLOUD experiments at CERN have extensively probed the roles of sulfuric acid, ammonia, cosmic rays, and other atmospheric components in nucleation (Kirkby et al., 2011, 2016). To determine the particle formation and growth rates from atmospheric chamber experiments, the particle size distribution needs to be measured at high resolving power and with a short duty cycle. In addition to being able to capture the transient aerosol dynamics during NPF events, since most of the nucleation occurs in clean atmospheric conditions, the instrument must be capable of taking measurements at relatively low particle concentrations. The scan rate selected for this initial implementation was therefore a compromise between fast response and counting statistics.
The nSEMS was used with a 60 s scan for particle sizing in both the CLOUD 13 and the CLOUD 14 campaigns. Figure 11 shows a particle size distribution measured with nSEMS during an ion-induced nucleation event that simulated atmospheric nucleation and nanoparticle growth in an urban environment in CLOUD 13. The experiment was conducted in the presence of sulfuric acid, nitric acid, and ammonia at −10 ∘C and 60 % RH. When particles reached dp≈4.6 nm, nitric acid and ammonia started condensing rapidly onto the particles, resulting in a growth rate of 40 nm h−1. This extremely fast growth from nitric acid and ammonia co-condensation can generally persist for only a few minutes and activate only the largest of the initial small nuclei, before depleting the nitric acid supersaturation and turning off additional nucleation. Those few nuclei that activate are often present only in low concentrations (Wang et al., 2020). Consequently, the other conventional particle sizing instruments that are connected to the CLOUD chamber were not able to fully capture this rapid growth event; the concentrations were too low to be detected by the nano-SMPS (Tröstl et al., 2015). Moreover, the size of the particles evolved so fast that a higher size resolution was required than could be attained by the DMA train that measures six sizes in parallel with separate static DMAs (Stolzenburg et al., 2017). In the region where multiple instruments can capture the aerosol dynamics, the intercomparison between the results of different instruments showed reasonably good agreement. Combining these measurements also provided detailed particle growth information in rapidly evolving new particle formation events that the other instruments could follow (Wang et al., 2020). In addition to enabling high-resolving-power measurements of size distributions during rapid particle growth events, the nSEMS also provides valuable information on natural ion and charged particle concentrations in the chamber when operated with the CC switched off. The ability to measure the concentrations of positive and negative nanoparticles separately facilitates study of the role of ions in atmospheric nucleation and growth.
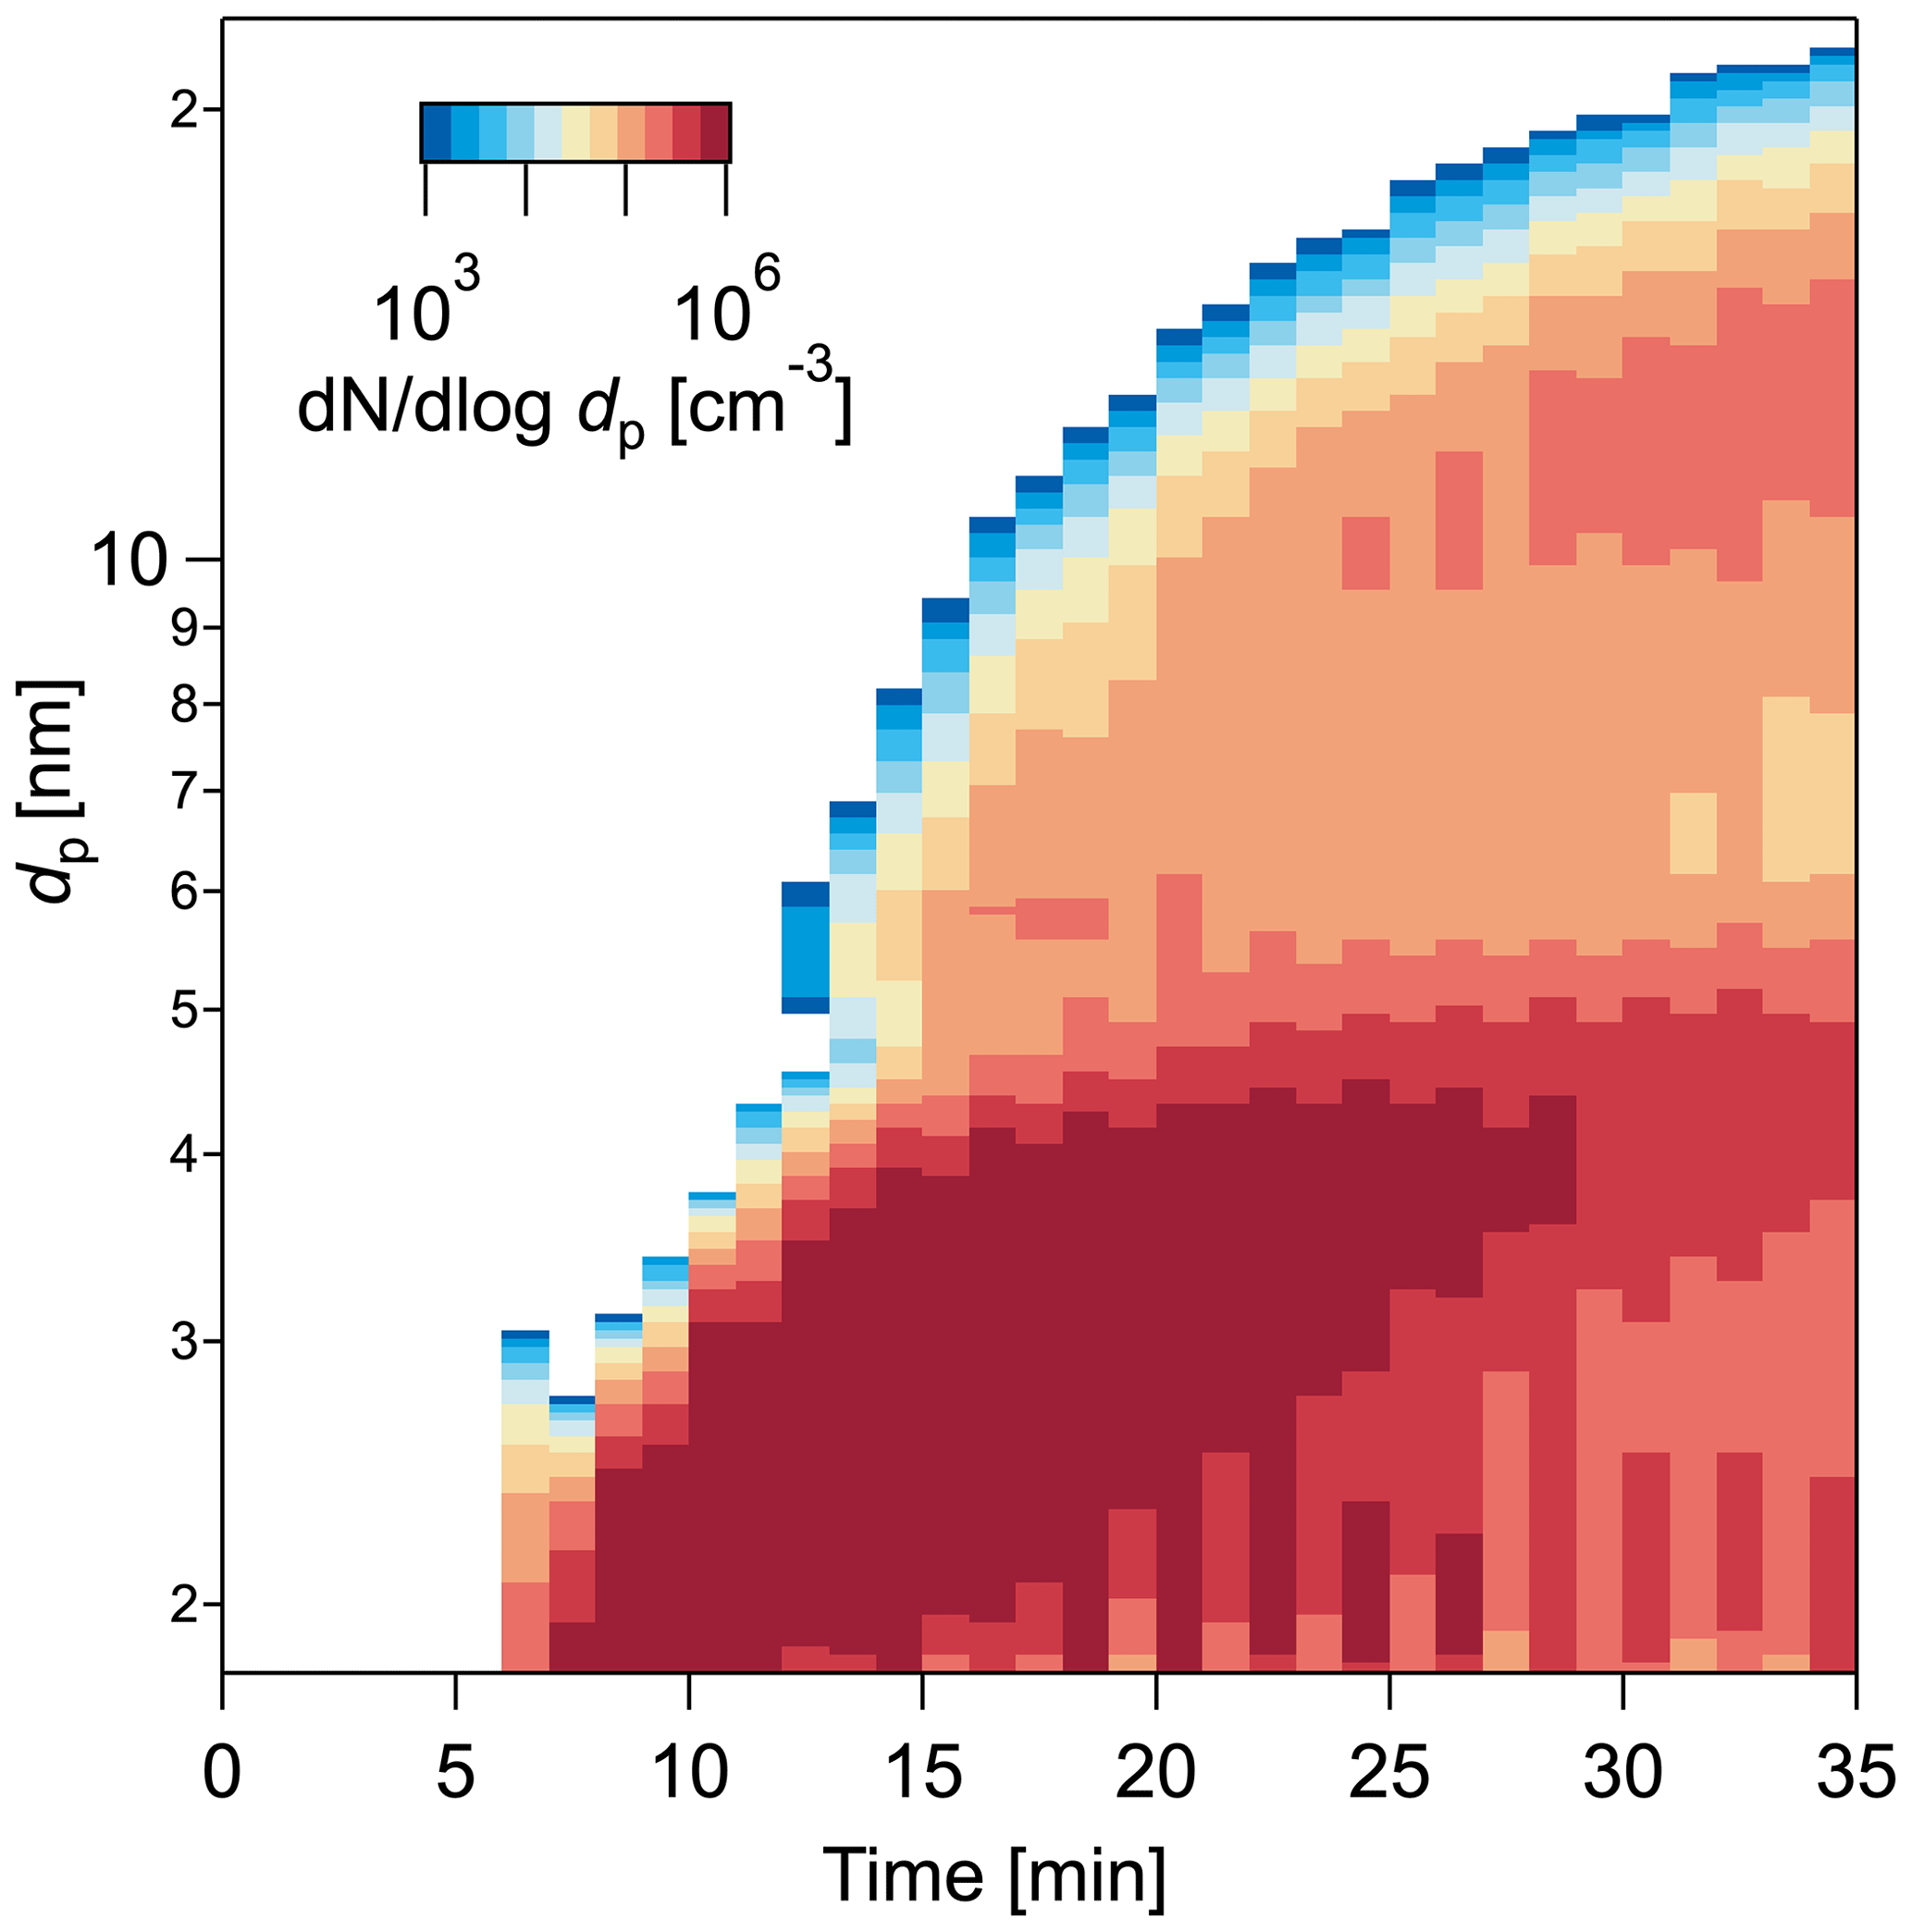
Figure 11Particle size distribution measured by the nSEMS during a nucleation and growth event in the CLOUD 13 campaign with anthropogenic trace gases. The experiment was conducted at −10 ∘C and 60 % RH, with 24 pptv HNO3, 2131 pptv NH3, 0.46 pptv H2SO4, and 0.28 pptv highly oxygenated organic molecules (HOMs). The nSEMS high-voltage polarity was switched between scans to probe both positively and negatively charged particles from the soft x-ray CC. A clear bimodal size distribution was observed by the nSEMS due to the rapid co-condensation of nitric acid and ammonia (Wang et al., 2020). The activation diameter, dact, for nitric acid condensation is around 4.6 nm.
The design and performance of a novel nanoparticle size-classifying instrument, the nSEMS, have been evaluated. The concept of OMAC was first proposed in order to overcome the diffusional degradation at lower voltages of the DMA (Flagan, 2004). The radial form of the OMAC, the ROMIAC, was then designed to classify nanoparticles in the low nanometer regime with high resolving power in static mode (Mui et al., 2013, 2017). According to the ideal model of OMAC, particles are transmitted through the classification region parallel to the porous electrodes, and voltage variations would lead to excessive particle losses. A key feature of the ROMIAC design was to both introduce the sample and extract the classified ions or particles on the ground-electrode side of the classifier. The resulting trajectories, which can be seen in COMSOL Multiphysics™ simulations shown in Fig. S1, reduce losses associated with voltage scanning to acceptable levels, thereby enabling measurement acceleration by voltage scanning and operating as a SEMS. The ability to classify particles at low voltage with minimal diffusional degradation of the transfer function, combined with a fast-response CPC that minimizes residence time distribution related to the smearing effect, made it possible for the ROMIAC to be operated with fast exponential voltage ramping, greatly accelerating the measurement over that of static-mode operation. The nSEMS system, which was used with a soft x-ray CC in this study, combines a scanning ROMIAC as a classifier and a two-stage CPC as a particle detector, and it can provide highly resolved particle size distribution measurements in the 1.5–25 nm size range in 1 min or less (we did not push the bound on the scan rate in the initial application of the nSEMS at CLOUD). The integrated instrument transfer function, which can reproduce how particles are transmitted inside the nSEMS within 10 % uncertainty, has been derived by combining COMSOL finite-element analysis with empirical adjustments. The particle size distributions measured by the nSEMS employing the described data inversion method agree reasonably well with other instruments (Tröstl et al., 2015; Stolzenburg et al., 2017) used in the CLOUD experiment (Wang et al., 2020). However, uncertainties remain that are associated with particle charge distribution. When combined with a soft x-ray CC that can be switched off, the dual-polarity scanning feature of the nSEMS makes it possible to observe the effects of charges on the evolution of the size distribution as particles nucleate and grow. Its dual-polarity capability will also facilitate characterization of the particle charge distribution in the low nanometer regime, thereby improving the instrumental transfer function and data inversion. Overall, this instrument is able to provide robust particle sizing information in the sub-25 nm region and is extremely powerful in examining atmospheric nucleation and the subsequent growth of nanoparticles.
Data and code related to this article are available upon request to the corresponding author.
The supplement related to this article is available online at: https://doi.org/10.5194/amt-14-5429-2021-supplement.
WK wrote the paper, analyzed the data, led the calibration of the instrument, and operated the instrument at CLOUD. SA led the construction the instrument as deployed to CLOUD, developed the data acquisition and control software, contributed to the calibration of the instrument, and contributed to the writing of the paper. HM built and conducted proof-of-concept experiments with the first prototype of the instrument and developed the finite-element simulation in developing the instrument response function. CK developed the soft x-ray charger used in the apparatus and did the initial construction of the two-stage condensation particle counter detector. BCS contributed to the construction and calibration of the instrument and operated it in CLOUD experiments. YH contributed to the development of the data analysis software and contributed to the writing of the paper. GSL developed the modified MAGIC CPC used as the second stage of the detector. SVH led the modifications of the MAGIC CPC for use in this instrument. JHS contributed to the analysis of the data and the writing of the paper. RCF led the project, development of the instrument, design of the experiments, and data analysis, along with contributing to the writing and editing of the paper.
The California Institute of Technology has a patent pending for the nSEMS. Aerosol Dynamics Inc. has a patent on the MAGIC CPC. No other conflicts of interest were identified.
Publisher's note: Copernicus Publications remains neutral with regard to jurisdictional claims in published maps and institutional affiliations.
This article is part of the special issue “The CERN CLOUD experiment (ACP/AMT inter-journal SI)”. It is not associated with a conference.
The authors would like to thank the CLOUD experiment for providing the facility for instrument testing and operation. We gratefully acknowledge a generous gift from Christine and Dwight Landis to improve the data acquisition system of the instrument.
This research has been supported by the National Science Foundation (grant nos. 1602086 and 1801329).
This paper was edited by Charles Brock and reviewed by Juan Fernandez de la Mora and one anonymous referee.
Amanatidis, S., Kim, C., Spielman, S. R., Lewis, G. S., Hering, S. V., and Flagan, R. C.: The Spider DMA: A miniature radial differential mobility analyzer, Aerosol Sci. Technol., 54, 175–189, https://doi.org/10.1080/02786826.2019.1626974, 2020. a
Bonn, B. and Moortgat, G. K.: Sesquiterpene ozonolysis: Origin of atmospheric new particle formation from biogenic hydrocarbons, Geophys. Res. Lett., 30, 1585, https://doi.org/10.1029/2003GL017000, 2003. a
Bracewell, R. N. and Bracewell, R. N.: The Fourier transform and its applications, 2nd edn., vol. 31999, McGraw-Hill, New York, USA, 1986. a
Brown, L. M., Collings, N., Harrison, R. M., Maynard, A. D., Maynard, R. L., Kim, C. S., and Jaques, P. A.: Respiratory dose of inhaled ultrafine particles in healthy adults, Philos. Trans. R. Soc. A, 358, 2693–2705, https://doi.org/10.1098/rsta.2000.0678, 2000. a
Brunelli, N. A., Flagan, R. C., and Giapis, K. P.: Radial differential mobility analyzer for one nanometer particle classification, Aerosol Sci. Technol., 43, 53–59, https://doi.org/10.1080/02786820802464302, 2009. a, b
Chen, D. R., Pui, D. Y. H., Hummes, D., Fissan, H., Quant, F. R., and Sem, G. J.: Design and evaluation of a nanometer aerosol differential mobility analyzer (Nano-DMA), J. Aerosol Sci., 29, 497–509, https://doi.org/10.1016/S0021-8502(97)10018-0, 1998. a
Chen, X., McMurry, P. H., and Jiang, J.: Stationary characteristics in bipolar diffusion charging of aerosols: Improving the performance of electrical mobility size spectrometers, Aerosol Sci. Technol., 52, 809–813, https://doi.org/10.1080/02786826.2018.1479058, 2018. a
Collins, D. R., Flagan, R. C., and Seinfeld, J. H.: Improved inversion of scanning DMA data, Aerosol Sci. Technol., 36, 1–9, https://doi.org/10.1080/027868202753339032, 2002. a, b
Collins, D. R., Cocker, D. R., Flagan, R. C., and Seinfeld, J. H.: The scanning DMA transfer function, Aerosol Sci. Technol., 38, 833–850, https://doi.org/10.1080/027868290503082, 2004. a, b
Dall'Osto, M., Beddows, D. C. S., Tunved, P., Krejci, R., Ström, J., Hansson, H.-C., Yoon, Y. J., Park, K.-T., Becagli, S., Udisti, R., Onasch, T., O´Dowd, C. D., Simó, R., and Harrison, R. M.: Arctic sea ice melt leads to atmospheric new particle formation, Sci. Rep., 7, 1–10, https://doi.org/10.1038/s41598-017-03328-1, 2017. a
Downard, A. J., Dama, J. F., and Flagan, R. C.: An asymptotic analysis of differential electrical mobility classifiers, Aerosol Sci. Technol., 45, 727–739, https://doi.org/10.1080/02786826.2011.558136, 2011. a, b
Dubey, P. and Dhaniyala, S.: A new approach to calculate diffusional transfer functions of scanning DMAs, Aerosol Sci. Technol., 45, 1031–1040, https://doi.org/10.1080/02786826.2011.579644, 2011. a
Dunn, M. J., Jiménez, J.-L., Baumgardner, D., Castro, T., McMurry, P. H., and Smith, J. N.: Measurements of Mexico City nanoparticle size distributions: Observations of new particle formation and growth, Geophys. Res. Lett., 31, L10102, https://doi.org/10.1029/2004GL019483, 2004. a
Fissan, H. J., Helsper, C., and Thielen, H. J.: Determination of particle size distributions by means of an electrostatic classifier, J. Aerosol Sci., 14, 354–357, https://doi.org/10.1016/0021-8502(83)90133-7, 1983. a
Flagan, R. C.: History of electrical aerosol measurements, Aerosol Sci. Technol., 28, 301–380, https://doi.org/10.1080/02786829808965530, 1998. a
Flagan, R. C.: On differential mobility analyzer resolution, Aerosol Sci. Technol., 30, 556–570, https://doi.org/10.1080/027868299304417, 1999. a, b, c
Flagan, R. C.: Opposed Migration Aerosol Classifier (OMAC), Aerosol Sci. Technol., 38, 890–899, https://doi.org/10.1080/027868290505242, 2004. a, b, c, d, e, f, g
Gamero-Castano, M. and de la Mora, J.: A condensation nucleus counter (CNC) sensitive to singly charged sub-nanometer particles, J. Aerosol Sci., 31, 757–772, https://doi.org/10.1016/S0021-8502(99)00555-8, 2000. a
Gordon, H., Kirkby, J., Baltensperger, U., Bianchi, F., Breitenlechner, M., Curtius, J., Dias, A., Dommen, J., Donahue, N. M., Dunne, E. M., Duplissy, J., Ehrhart, S., Flagan, R. C., Frege, C., Fuchs, C., Hansel, A., Hoyle, C. R., Kulmala, M., Kürten, A., Lehtipalo, K., Makhmutov, V., Molteni, U., Rissanen, M. P., Stozkhov, Y., Tröstl, J., Tsagkogeorgas, G., Wagner, R., Williamson, C., Wimmer, D., Winkler, P. M., Yan, C., and Carslaw, K. S.: Causes and importance of new particle formation in the present-day and preindustrial atmospheres, J. Geophys. Res.-Atmos., 122, 8739–8760, https://doi.org/10.1002/2017JD026844, 2017. a
Hering, S. V., Lewis, G. S., Spielman, S. R., and Eiguren-Fernandez, A.: A MAGIC concept for self-sustained, water-based, ultrafine particle counting, Aerosol Sci. Technol., 53, 63–72, https://doi.org/10.1080/02786826.2018.1538549, 2019. a, b
Iida, K., Stolzenburg, M. R., and McMurry, P. H.: Effect of working fluid on sub-2 nm particle detection with a laminar flow ultrafine condensation particle counter, Aerosol Sci. Technol., 43, 81–96, https://doi.org/10.1080/02786820802488194, 2009. a, b
Jiang, J., Chen, M., Kuang, C., and Attoui, M.: Electrical mobility spectrometer using diethylene glycol condensation particle counter for measuring aeerosol size distributions down to 1 nm, Aerosol Sci. Technol., 45, 510–521, https://doi.org/10.1080/02786826.2010.546817, 2011a. a, b, c
Jiang, J., Chen, M., Eisele, F. L., Scheckman, J., Williams, B. J., Kuang, C., and McMurry, P. H.: First measurements of neutral atmospheric cluster and 1–2 nm particle number size distributions during nucleation events, Aerosol Sci. Technol., 45, 2–5, https://doi.org/10.1080/02786826.2010.546817, 2011b. a
Kangasluoma, J., Junninen, H., Lehtipalo, K., Mikkilä, J., Vanhanen, J., Attoui, M., Sipilä, M., Worsnop, D., Kulmala, M., and Petäjä, T.: Remarks on Ion Generation for CPC Detection Efficiency Studies in the Sub-1-nm Size Range, Aerosol Sci. Technol., 47, 556–563, https://doi.org/10.1080/02786826.2013.773393, 2013. a, b
Kerminen, V.-M., Chen, X., Vakkari, V., Petäjä, T., Kulmala, M., and Bianchi, F.: Atmospheric new particle formation and growth: review of field observations, Environ. Res. Lett., 13, 103003, https://doi.org/10.1088/1748-9326/aadf3c, 2018. a
Kirkby, J., Curtius, J., Almeida, J., Dunne, E., Duplissy, J., Ehrhart, S., Franchin, A., Gagné, S., Ickes, L., Kürten, A., Kupc, A., Metzger, A., Riccobono, F., Rondo, L., Schobesberger, S., Tsagkogeorgas, G., Wimmer, D., Amorim, A., Bianchi, F., Breitenlechner, M., David, A., Dommen, J., Downard, A., Ehn, M., Flagan, R. C., Haider, S., Hansel, A., Hauser, D., Jud, W., Junninen, H., Kreissl, F., Kvashin, A., Laaksonen, A., Lehtipalo, K., Lima, J., Lovejoy, E. R., Makhmutov, V., Mathot, S., Mikkilä, J., Minginette, P., Mogo, S., Nieminen, T., Onnela, A., Pereira, P., Petäjä, T., Schnitzhofer, R., Seinfeld, J. H., Sipilä, M., Stozhkov, Y., Stratmann, F., Tomé, A., Vanhanen, J., Viisanen, Y., Vrtala, A., Wagner, P. E., Walther, H., Weingartner, E., Wex, H., Winkler, P. M., Carslaw, K. S., Worsnop, D. R., Baltensperger, U., and Kulmala, M.: Role of sulphuric acid, ammonia and galactic cosmic rays in atmospheric aerosol nucleation, Nature, 476, 429–433, https://doi.org/10.1038/nature10343, 2011. a
Kirkby, J., Duplissy, J., Sengupta, K., Frege, C., Gordon, H., Williamson, C., Heinritzi, M., Simon, M., Yan, C., Almeida, J., Tröstl, J., Nieminen, T., Ortega, I. K., Wagner, R., Adamov, A., Amorim, A., Bernhammer, A.-K., Bianchi, F., Breitenlechner, M., Brilke, S., Chen, X., Craven, J., Dias, A., Ehrhart, S., Flagan, R. C., Franchin, A., Fuchs, C., Guida, R., Hakala, J., Hoyle, C. R., Jokinen, T., Junninen, H., Kangasluoma, J., Kim, J., Krapf, M., Kürten, A., Laaksonen, A., Lehtipalo, K., Makhmutov, V., Mathot, S., Molteni, U., Onnela, A., Peräkylä, O., Piel, F., Petäjä, T., Praplan, A. P., Pringle, K., Rap, A., Richards, N. A. D., Riipinen, I., Rissanen, M. P., Rondo, L., Sarnela, N., Schobesberger, S., Scott, C. E., Seinfeld, J. H., Sipilä, M., Steiner, G., Stozhkov, Y., Stratmann, F., Tomé, A., Virtanen, A., Vogel, A. L., Wagner, A. C., Wagner, P. E., Weingartner, E., Wimmer, D., Winkler, P. M., Ye, P., Zhang, X., Hansel, A., Dommen, J., Donahue, N. M., Worsnop, D. R., Baltensperger, U., Kulmala, M., Carslaw, K. S., and Curtius, J.: Ion-induced nucleation of pure biogenic particles, Nature, 533, 521–526, https://doi.org/10.1038/nature17953, 2016. a, b
Knutson, E. O. and Whitby, K. T.: Aerosol classification by electric mobility: apparatus, theory, and applications, J. Aerosol Sci., 6, 443–451, https://doi.org/10.1016/0021-8502(75)90060-9, 1975. a
Kousaka, Y., Niida, T., Okuyama, K., and Tanaka, H.: Development of a mixing type condensation nucleus counter, J. Aerosol Sci., 13, 231–240, https://doi.org/10.1016/0021-8502(82)90064-7, 1982. a
Kulmala, M., Vehkamaki, H., Petaja, T., Dal Maso, M., Lauri, A., Kerminen, V.-M., Birmili, W., and McMurry, P.: Formation and growth rates of ultrafine atmospheric particles: A review of observations, J. Aerosol Sci., 35, 143–176, https://doi.org/10.1016/j.jaerosci.2003.10.003, 2004. a
Lee, S.-H., Gordon, H., Yu, H., Lehtipalo, K., Haley, R., Li, Y., and Zhang, R.: New particle formation in the atmosphere: From molecular clusters to global climate, J. Geophys. Res.-Atmos., 124, 7098–7146, https://doi.org/10.1029/2018JD029356, 2019. a
Mai, H. and Flagan, R. C.: Scanning DMA data analysis I. Classification transfer function, Aerosol Sci. Technol., 52, 1382–1399, https://doi.org/10.1080/02786826.2018.1528005, 2018. a, b
Mai, H., Kong, W., Seinfeld, J. H., and Flagan, R. C.: Scanning DMA data analysis II. Integrated DMA-CPC instrument response and data inversion, Aerosol Sci. Technol., 52, 1400–1414, https://doi.org/10.1080/02786826.2018.1528006, 2018. a, b, c, d
Merikanto, J., Spracklen, D. V., Mann, G. W., Pickering, S. J., and Carslaw, K. S.: Impact of nucleation on global CCN, Atmos. Chem. Phys., 9, 8601–8616, https://doi.org/10.5194/acp-9-8601-2009, 2009. a
Merritt, M. and Zhang, Y.: Interior-point gradient method for large-scale totally nonnegative least squares problems, J. Optim. Theory Appl., 126, 191–202, https://doi.org/10.1007/s10957-005-2668-z, 2005. a
Mui, W., Thomas, D. A., Downard, A. J., Beauchamp, J. L., Seinfeld, J. H., and Flagan, R. C.: Ion mobility-mass spectrometry with a radial opposed migration ion and aerosol classifier (ROMIAC), Anal. Chem., 85, 6319–6326, https://doi.org/10.1021/ac400580u, 2013. a, b, c, d, e
Mui, W., Mai, H., Downard, A. J., Seinfeld, J. H., and Flagan, R. C.: Design, simulation, and characterization of a radial opposed migration ion and aerosol classifier (ROMIAC), Aerosol Sci. Technol., 51, 801–823, https://doi.org/10.1080/02786826.2017.1315046, 2017. a, b, c, d, e, f, g
O'Dowd, C. D., Jimenez, J. L., Bahreini, R., Flagan, R. C., Seinfeld, J. H., Hämeri, K., Pirjola, L., Kulmala, M., Jennings, S. G., and Hoffmann, T.: Marine aerosol formation from biogenic iodine emissions, Nature, 417, 632–636, https://doi.org/10.1038/nature00775, 2002. a
Okuyama, K., Kousaka, Y., and Motouchi, T.: Condensational growth of ultrafine aerosol particles in a new particle size magnifier, Aerosol Sci. Technol., 3, 353–366, https://doi.org/10.1080/02786828408959024, 1984. a
Paasonen, P., Nieminen, T., Asmi, E., Manninen, H. E., Petäjä, T., Plass-Dülmer, C., Flentje, H., Birmili, W., Wiedensohler, A., Hõrrak, U., Metzger, A., Hamed, A., Laaksonen, A., Facchini, M. C., Kerminen, V.-M., and Kulmala, M.: On the roles of sulphuric acid and low-volatility organic vapours in the initial steps of atmospheric new particle formation, Atmos. Chem. Phys., 10, 11223–11242, https://doi.org/10.5194/acp-10-11223-2010, 2010. a
Peineke, C., Attoui, M., and Schmidt-Ott, A.: Using a glowing wire generator for production of charged, uniformly-sized nanoparticles at high concentrations, J. Aerosol Sci., 37, 1651–1661, https://doi.org/10.1016/j.jaerosci.2006.06.006, 2006. a, b
Quant, F. R., Caldow, R., Sem, G. J., and Addison, T. J.: Performance of condensation particle counters with three continuous-flow designs, J. Aerosol Sci., 23, 405–408, https://doi.org/10.1016/0021-8502(92)90435-X, 1992. a
Rader, D. J. and McMurry, P. H.: Application of the tandem differential mobility analyzer to studies of droplet growth or evaporation, J. Aerosol Sci., 17, 771–787, https://doi.org/10.1016/0021-8502(86)90031-5, 1986. a, b
Rosell-Llompart, J., Loscertales, I. G., Bingham, D., and de la Mora, J. F.: Sizing nanoparticles and ions with a short differential mobility analyzer, J. Aerosol Sci., 27, 695–719, https://doi.org/10.1016/0021-8502(96)00016-X, 1996. a
Russell, L. M., Flagan, R. C., and Seinfeld, J. H.: Asymmetric instrument response resulting from mixing effects in accelerated DMA-CPC measurements, Aerosol Sci. Technol., 23, 491–509, https://doi.org/10.1080/02786829508965332, 1995. a, b
Sgro, L. A. and de la Mora, J. F.: A simple turbulent mixing CNC for charged particle detection down to 1.2 nm, Aerosol Sci. Technol., 38, 1–11, https://doi.org/10.1080/02786820490247560, 2004. a, b
Shah, S. D. and Cocker, D. R.: A fast scanning mobility particle spectrometer for monitoring transient particle size distributions, Aerosol Sci. Technol., 39, 519–526, https://doi.org/10.1080/027868291004652, 2005. a
Steiner, G., Jokinen, T., Junninen, H., Sipilä, M., Petäjä, T., Worsnop, D., Reischl, G. P., and Kulmala, M.: High-resolution mobility and mass spectrometry of negative ions produced in a 241Am aerosol charger, Aerosol Sci. Technol., 48, 261–270, https://doi.org/10.1080/02786826.2013.870327, 2014. a
Stolzenburg, D., Steiner, G., and Winkler, P. M.: A DMA-train for precision measurement of sub-10 nm aerosol dynamics, Atmos. Meas. Tech., 10, 1639–1651, https://doi.org/10.5194/amt-10-1639-2017, 2017. a, b
Stolzenburg, M. R. and McMurry, P. H.: Equations governing single and tandem DMA configurations and a new lognormal approximation to the transfer function, Aerosol Sci. Technol., 42, 421–432, https://doi.org/10.1080/02786820802157823, 2008. a
Tröstl, J., Tritscher, T., Bischof, O. F., Horn, H.-G., Krinke, T., Baltensperger, U., and Gysel, M.: Fast and precise measurement in the sub-20 nm size range using a Scanning Mobility Particle Sizer, J. Aerosol Sci., 87, 75–87, https://doi.org/10.1016/j.jaerosci.2015.04.001, 2015. a, b
Ude, S. and de la Mora, J. F.: Molecular monodisperse mobility and mass standards from electrosprays of tetra-alkyl ammonium halides, J. Aerosol Sci., 36, 1224–1237, https://doi.org/10.1016/j.jaerosci.2005.02.009, 2005. a
Wagner, R., Yan, C., Lehtipalo, K., Duplissy, J., Nieminen, T., Kangasluoma, J., Ahonen, L. R., Dada, L., Kontkanen, J., Manninen, H. E., Dias, A., Amorim, A., Bauer, P. S., Bergen, A., Bernhammer, A.-K., Bianchi, F., Brilke, S., Mazon, S. B., Chen, X., Draper, D. C., Fischer, L., Frege, C., Fuchs, C., Garmash, O., Gordon, H., Hakala, J., Heikkinen, L., Heinritzi, M., Hofbauer, V., Hoyle, C. R., Kirkby, J., Kürten, A., Kvashnin, A. N., Laurila, T., Lawler, M. J., Mai, H., Makhmutov, V., Mauldin III, R. L., Molteni, U., Nichman, L., Nie, W., Ojdanic, A., Onnela, A., Piel, F., Quéléver, L. L. J., Rissanen, M. P., Sarnela, N., Schallhart, S., Sengupta, K., Simon, M., Stolzenburg, D., Stozhkov, Y., Tröstl, J., Viisanen, Y., Vogel, A. L., Wagner, A. C., Xiao, M., Ye, P., Baltensperger, U., Curtius, J., Donahue, N. M., Flagan, R. C., Gallagher, M., Hansel, A., Smith, J. N., Tomé, A., Winkler, P. M., Worsnop, D., Ehn, M., Sipilä, M., Kerminen, V.-M., Petäjä, T., and Kulmala, M.: The role of ions in new particle formation in the CLOUD chamber, Atmos. Chem. Phys., 17, 15181–15197, https://doi.org/10.5194/acp-17-15181-2017, 2017. a
Wang, J., McNeill, V. F., Collins, D. R., and Flagan, R. C.: Fast mixing condensation nucleus counter: Application to rapid scanning differential mobility analyzer measurements, Aerosol Sci. Technol., 36, 678–689, https://doi.org/10.1080/02786820290038366, 2002. a
Wang, M., Kong, W., Marten, R., He, X.-C., Chen, D., Pfeifer, J., Heitto, A., Kontkanen, J., Dada, L., Kürten, A., Yli-Juuti, T., Manninen, H. E., Amanatidis, S., Amorim, A., Baalbaki, R., Baccarini, A., Bell, D. M., Bertozzi, B., Bräkling, S., Brilke, S., Murillo, L. C., Chiu, R., Chu, B., De Menezes, L.-P., Duplissy, J., Finkenzeller, H., Carracedo, L. G., Granzin, M., Guida, R., Hansel, A., Hofbauer, V., Krechmer, J., Lehtipalo, K., Lamkaddam, H., Lampimäki, M., Lee, C. P., Makhmutov, V., Marie, G., Mathot, S., Mauldin, R. L., Mentler, B., Müller, T., Onnela, A., Partoll, E., Petäjä, T., Philippov, M., Pospisilova, V., Ranjithkumar, A., Rissanen, M., Rörup, B., Scholz, W., Shen, J., Simon, M., Sipilä, M., Steiner, G., Stolzenburg, D., Tham, Y. J., Tomé, A., Wagner, A. C., Wang, D. S., Wang, Y., Weber, S. K., Winkler, P. M., Wlasits, P. J., Wu, Y., Xiao, M., Ye, Q., Zauner-Wieczorek, M., Zhou, X., Volkamer, R., Riipinen, I., Dommen, J., Curtius, J., Baltensperger, U., Kulmala, M., Worsnop, D. R., Kirkby, J., Seinfeld, J. H., El-Haddad, I., Flagan, R. C., and Donahue, N. M.: Rapid growth of new atmospheric particles by nitric acid and ammonia condensation, Nature, 581, 184–189, https://doi.org/10.1038/s41586-020-2270-4, 2020. a, b, c, d, e, f
Wang, S. C. and Flagan, R. C.: Scanning electrical mobility spectrometer, Aerosol Sci. Technol., 13, 230–240, https://doi.org/10.1080/02786829008959441, 1990. a
Wang, Z., Wu, Z., Yue, D., Shang, D., Guo, S., Sun, J., Ding, A., Wang, L., Jiang, J., Guo, H., Gao, J., Cheung, H. C., Morawska, L., Keywood, M., and Hu, M.: New particle formation in China: Current knowledge and further directions, Sci. Total Environ., 577, 258–266, https://doi.org/10.1016/j.scitotenv.2016.10.177, 2017. a
Wiedensohler, A.: An approximation of the bipolar charge distribution for particles in the submicron size range, J. Aerosol Sci., 19, 387–389, https://doi.org/10.1016/0021-8502(88)90278-9, 1988. a, b
Winklmayr, W., Reischl, G. P., Lindner, A. O., and Berner, A.: A new electromobility spectrometer for the measurement of aerosol size distributions in the size range from 1 to 1000 nm, J. Aerosol Sci., 22, 289–296, https://doi.org/10.1016/S0021-8502(05)80007-2, 1991. a
Yao, L., Garmash, O., Bianchi, F., Zheng, J., Yan, C., Kontkanen, J., Junninen, H., Mazon, S. B., Ehn, M., Paasonen, P., Sipilä, M., Wang, M., Wang, X., Xiao, S., Chen, H., Lu, Y., Zhang, B., Wang, D., Fu, Q., Geng, F., Li, L., Wang, H., Qiao, L., Yang, X., Chen, J., Kerminen, V.-M., Petäjä, T., Worsnop, D. R., Kulmala, M., and Wang, L.: Atmospheric new particle formation from sulfuric acid and amines in a Chinese megacity, Science, 361, 278–281, https://doi.org/10.1126/science.aao4839, 2018. a
Zhang, S.-H., Akutsu, Y., Russell, L. M., Flagan, R. C., and Seinfeld, J. H.: Radial differential mobility analyzer, Aerosol Sci. Technol., 23, 357–372, https://doi.org/10.1080/02786829508965320, 1995. a, b
- Abstract
- Introduction
- The nSEMS design and system features
- Characterization of the nSEMS
- Application to particle size distribution measurement
- Conclusions
- Code and data availability
- Author contributions
- Competing interests
- Disclaimer
- Special issue statement
- Acknowledgements
- Financial support
- Review statement
- References
- Supplement