the Creative Commons Attribution 4.0 License.
the Creative Commons Attribution 4.0 License.
 | 20 Aug 2021
Intercomparison of IBBCEAS, NitroMAC and FTIR analyses for HONO, NO2 and CH2O measurements during the reaction of NO2 with H2O vapour in the simulation chamber CESAM
Hongming Yi
Mathieu Cazaunau
Aline Gratien
Vincent Michoud
Edouard Pangui
Jean-Francois Doussin
We report on applications of the ultraviolet-light-emitting-diode-based incoherent broadband cavity-enhanced absorption spectroscopy (UV-LED-IBBCEAS) technique for optical monitoring of HONO, NO2 and CH2O in a simulation chamber. Performance intercomparison of UV-LED-IBBCEAS with a wet chemistry-based NitroMAC sensor and a Fourier transform infrared (FTIR) spectrometer has been carried out on real-time simultaneous measurement of HONO, NO2 and CH2O concentrations during the reaction of NO2 with H2O vapour in CESAM (French acronym for Experimental Multiphasic Atmospheric Simulation Chamber). The 1σ (signal-to-noise ratio (SNR) = 1) detection limits of 112 pptv for NO2, 56 pptv for HONO and 41 ppbv for CH2O over 120 s were found for the UV-LED-IBBCEAS measurement. On the contrary to many set-ups where cavities are installed outside the simulation chamber, we describe here an original in situ permanent installation. The intercomparison results demonstrate that IBBCEAS is a very well suitable technique for in situ simultaneous measurements of multiple chemically reactive species with high sensitivity and high precision even if the absorption bands of these species are overlapped. It offers excellent capacity for non-invasive optical monitoring of chemical reactions without any perturbation. For the application to simulation chambers, it has the advantage to provide a spatially integrated measurement across the reactor and hence to avoid point-sampling-related artefacts.
- Article
(2984 KB) - Full-text XML
- BibTeX
- EndNote


Atmospheric nitrous acid (HONO) is known as a major source of hydroxyl radicals (OH) (Harris et al., 1982; Finlayson-Pitts and Pitts, 2000) in the atmosphere through its photolysis
which accounts for 30 %–60 % of the integrated OH source strength (Alicke et al., 2002; Michoud et al., 2012; Griffith et al., 2016). HONO plays hence a crucial role in the atmospheric oxidation capacity that significantly affects the regional air quality and global climate (Finlayson-Pitts and Pitts, 2000; Stutz et al., 2013). Previous studies have shown that known HONO sources include heterogeneous reactions, homogeneous gas-phase reactions, direct emission, surface photolysis and biological processes (Spataro and Ianniello, 2014). HONO formation through the most possible heterogeneous reaction of NO2 with water (H2O) on surfaces is as follows:
HONO can be also formed through homogeneous chemistry with the following reaction:
Though it is generally agreed that heterogeneous NO2 chemistry (Reaction R2) is probably among the most important sources of HONO (Finlayson-Pitts and Pitts, 2000; Spataro and Ianniello, 2014), modelled HONO concentrations are often significantly below observed values (Vogel et al., 2003; Lammel and Cape, 1996). The sources of HONO and the mechanisms of HONO formation in the troposphere are still under debate (Kleffmann, 2007; Sörgel et al., 2011; Li et al., 2014). Although laboratory studies show that H2O vapour and surface-adsorbed H2O both play an important role in the conversion process from NO2 to HONO (Finlayson-Pitts and Pitts, 2000; Spataro and Ianniello, 2014), the investigations regarding the influence of H2O on the NO2 and HONO chemistry in the real atmosphere remain a highly discussed topic (Stutz et al., 2004; Michoud et al., 2014), and a well-accepted parameterization is still to come. Scientific questions remain about its sources, sinks and vertical profile in the atmosphere (Young et al., 2012; VandenBoer et al., 2013) that will require high-precision measurements. In particular, to disentangle the complex mechanisms that are interplaying and affect HONO atmospheric burden, the scientific community needs reliable high-frequency assessment of the concentration change of HONO. In both laboratory studies and atmospheric field campaigns, these measurements are challenging due to HONO reactivity and solubility, which can cause sampling losses and/or positive artefacts in inlet systems of instruments.
Existing detection methods can be categorized as wet chemistry (WC), mass spectrometry (MS) and optical spectroscopy. In wet chemical methods, HONO is sampled on aqueous/humid surfaces and converted into a species suitable to be analysed with conventional chemical analytical techniques such as ion chromatography (IC), fluorescence (FL), chemiluminescence (CL), long-path absorption photometer (LOPAP) or high-performance liquid chromatography (HPLC) (Chen et al., 2013). These wet-chemistry-based instruments often suffer from unquantified chemical interferences and sampling artefacts (Stutz et al., 2010). Moreover, calibrations of the instruments based on WC and MS are difficult, because no permanently stable calibration mixtures exist for HONO.
Intercomparisons of ambient HONO measurement instruments have been carried out between differential optical absorption spectroscopy (DOAS) and long-path absorption photometer (LOPAP) (Kleffmann et al., 2006); between DOAS, mist-chamber/ion chromatograph (MC/IC), stripping coil visible absorption photometry (SC-AP), ion drift chemical ionization mass spectrometry (ID-CIMS), and quantum cascade tunable infrared laser differential absorption spectroscopy (QCL-TILDAS) (Pinto et al., 2014); between LOPAP and NitroMAC (French acronym for “continuous atmospheric measurements of nitrogenous compounds”) (Afif et al., 2016); between LOPAP and incoherent broadband cavity-enhanced absorption spectroscopy (IBBCEAS) (Wu et al., 2014); and between LOPAP, Fourier transform infrared (FTIR) spectrometer, and differential photolysis (Reed et al., 2016). Quite frequently, intercomparison between point and long-path measurements exhibited significant discrepancies with uncertainties within about 20 % (Pinto et al., 2014; Kleffmann et al., 2006) for HONO concentrations from the 10 pptv to the 10 ppbv range.
Calibration-free high-sensitivity direct HONO measurement with UV-IBBCEAS is capable of providing accurate and fast quantitative analysis of HONO concentration variation within its lifetime, which is crucial to improve the understanding of the atmospheric behaviour of HONO. Although the main interest for current work is to measure HONO, NO2 and CH2O are two other important atmospheric species (Washenfelder et al., 2016; Liu et al., 2020); these two molecules have strong absorption in the same region. Simultaneous measurements and quantification of HONO, NO2 and CH2O can be performed by the IBBCEAS techniques (Wu et al., 2014; Washenfelder et al., 2016; Duan et al., 2018; Jordan and Osthoff, 2020).
In the present work, we report on the development of an ultraviolet light-emitting diode (UV-LED)-based UV-IBBCEAS instrument for simultaneous measurement of concentration ranges of HONO (0–30 ppbv), NO2 (0–120 ppbv) and CH2O (0–150 ppbv) during the processes of HONO generation through NO2 reaction with H2O in a simulation chamber. HONO, NO2, CH2O and H2O vapour concentrations were real-time tracked at well-controlled conditions. Intercomparison measurements for HONO concentration by UV-IBBCEAS vs. NitroMAC and UV-IBBCEAS vs. FTIR were performed; these intercomparisons were also performed for NO2 concentrations by UV-IBBCEAS vs. chemiluminescence and UV-IBBCEAS vs. FTIR. These measurements were addressed during a 3 d campaign in the atmosphere simulation chamber CESAM (French acronym for Experimental Multiphasic Atmospheric Simulation Chamber). In addition, intercomparison measurements of CH2O concentration by UV-IBBCEAS vs. FTIR was also simultaneously committed at the last 8 h of the third day. Agreement of uncertainties <10 % were acquired for NO2, HONO and CH2O.
2.1 Intercompared instruments
2.1.1 LED-based UV-IBBCEAS set-up
The LED-based UV-IBBCEAS set-up installed in the simulation chamber, which was used for measurements of NO2, HONO and CH2O concentrations in the present work, is shown in Fig. 1. A UV-LED (Nichia, NCSU033AT), emitting ∼300 mW optical power and with divergence angle of ±60∘ in the UV spectral region around 365 nm, was used as probing light source. The LED source was mounted on a temperature-controlled heat sink made of a copper block to stabilize the output optical intensity and spectral profile of the LED emission. The temperature of the copper plate was stabilized at 20 ∘C within ±0.01 ∘C by means of a single-stage thermoelectric cooler (TEC, PE-063-08-15, Supercool) associated with a temperature sensor (PT100, RTD). A laser diode controller (LDC501, Stanford Research System) was used to supply electric power for both the TEC and the UV-LED. A high-finesse optical cavity was formed with two high-reflectivity mirrors (Layertec GmbH) that were installed in the simulation chamber walls facing each other (Fig. 2), separated by the diameter of the cylindrical CESAM chamber, m. The cavity mirrors had 25 mm in diameter, 2 m radius of curvature and 6.35 mm thickness. The experimentally measured reflectivity of the mirrors is shown in Fig. 3a between 350 and 380 nm with a peak value of R∼99.95 % at 360 nm. The enhancement factor of the cavity is wavelength-dependent: , ranging from F=2000 at λ=365 nm to F=1250 at λ=378 nm, corresponding to equivalent absorption path lengths through the intra-cavity sample between 4.2 and 2.6 km. Light from the LED was focused with achromatic lens L2 (BK7, f=75 mm) into the optical cavity. In order to avoid charge-coupled device (CCD) spectrometer saturation at the edges of high-reflectivity range of the cavity mirrors, a band-pass filter (Semrock 340–390 nm) was placed between achromatic lens L2 and the cavity to block the light at undesirable wavelengths. The diameter (∼10 mm) of the light beam injected into the cavity was controlled with an iris. The light transmitted through the cavity was collected through achromatic lens L3 (BK7, f=75 mm) to a multimode optical fibre (1000 µm in diameter) and coupled to a CCD spectrometer (QE65000, Ocean optics). A thermoelectric cooler (TEC) was used to cool the CCD camera temperature to 40 ∘C below ambient temperature to avoid wavelength drifts as well as to remove dark noise and readout noise. The spectrometer allowed for covering the whole 190–480 nm spectral range with a spectral resolution of 0.59 nm around 365 nm (this spectral resolution is sufficient for selective recognition of the structured broadband absorption of NO2, CH2O and HONO). The measured spectra from the spectrometer were recorded by a laptop computer through USB.
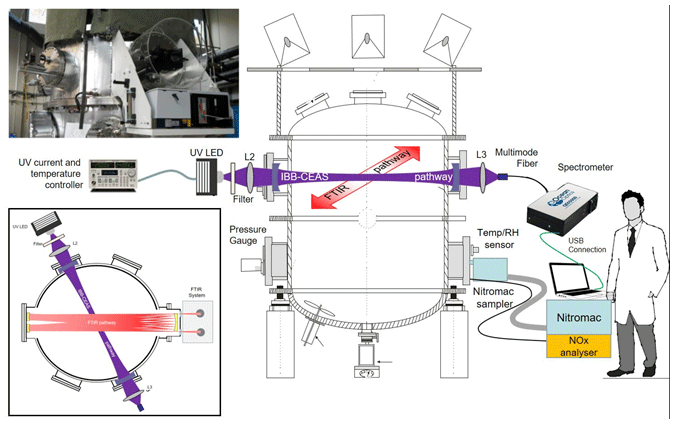
Figure 1Schematics of the experimental set-ups and devices installed around the CESAM chamber for intercomparison: IBBCEAS, NitroMAC, FTIR spectrometer, NOx analyser, temperature and relative humidity sensor (T & RH sensor), and pressure gauge. An insert displays a photograph of the set-up (top left) and a schematic view from the top showing the angle between the two in situ spectrometric pathways (bottom left). L2 and L3 are BK7 achromatic focus lens. Cavity mirrors had 25 mm in diameter, 2 m radius of curvature and 6.35 mm thickness.

Figure 2View of the IBBCEAS installation on the CESAM simulation chamber flanges. L2 and L3 are BK7 focus lens. M1 and M2 are two concave high-reflectivity mirrors.
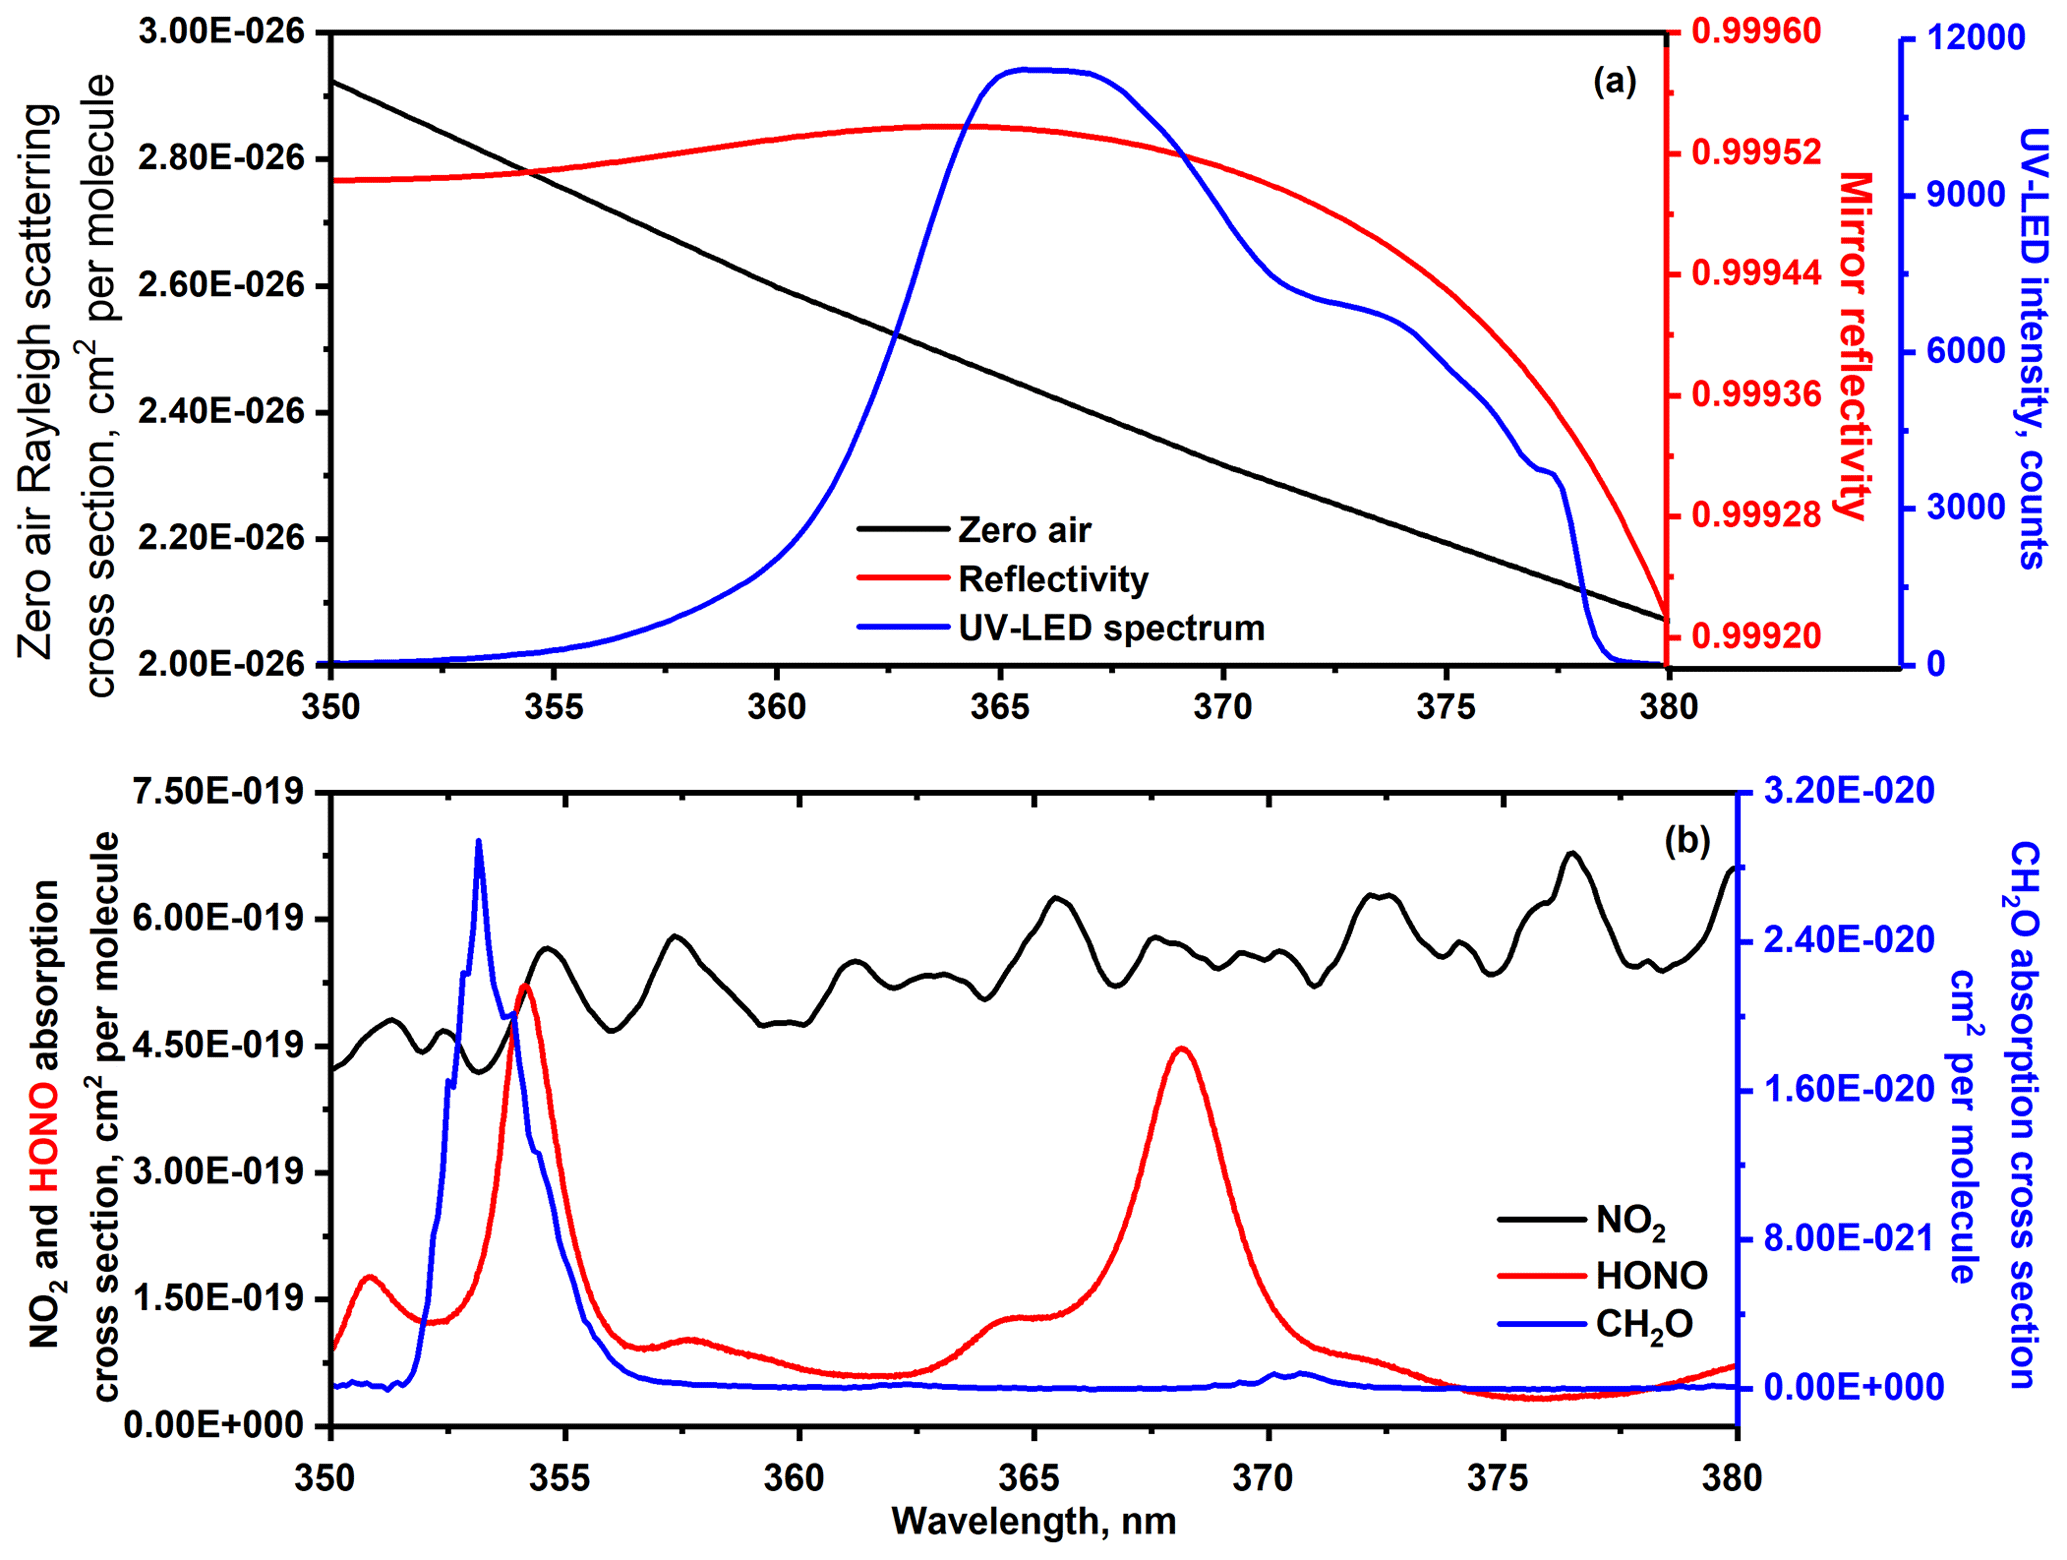
Figure 3Spectral region of 350–380 nm for IBBCEAS measurements: (a) UV-LED emission spectrum (blue), wavelength-dependent mirror reflectivity (red) and Rayleigh scattering cross section of zero air (black) (Miles et al., 2001); (b) NO2 (black), HONO (red) and CH2O (blue) absorption cross sections.
2.1.2 Wet chemical technique
NitroMAC is an analytical instrument developed for field measurement of atmospheric HONO. Based on the original work of Huang et al. (2002), the concept of NitroMAC relies on a wet-chemical derivatization and detection of absorption in the visible at 540 nm using high-performance liquid chromatography (HPLC). The instrument has been described in detail in another article (Afif et al., 2016), but in the present study the instrument was equipped with a dedicated external sampling unit similar to the one of the LOPAP instrument (Villena et al., 2011) to minimize potential artefacts in the sampling line. Sample gas from the simulation chamber is pumped into NitroMAC with a flow rate of 2 L/min. HONO is sampled in a temperature-controlled stripping coil by a fast chemical reaction in the stripping reagent and a few centimetres (ca. 5 cm) from the chamber port. It is right away converted by dissolution in a buffer phosphate solution followed by derivatization of nitrite to a highly light-absorbing azo dye with sulfanilamide (SA) and N-(1-naphthyl)-ethylenediamine (NED) and then transferred to the analytical unit. The operation mode for this instrument consists of two coils connected in series. The arrangement of the two identical coils in series allows for the determination of sampling efficiency or the evaluation of possible interferences in HONO measurements. The response obtained by integration of the chromatographic peak for the second stripping coil is then subtracted from that of the first one to eliminate interferences. HONO concentrations are then calculated from this net signal using calibration factors determined through direct calibrations of the analytical system (HPLC–UV–visible) performed using NaNO2 standard solutions. The performance of this instrument in terms of its detection limit was found to be around 3 pptv with an optimal integration time of 10 min. The relative standard deviation is 2 %, and the relative expanded measurement uncertainty is 12 % with a signal-to-noise ratio of 2 (2σ) (Michoud et al., 2014).
2.1.3 FTIR spectrometer
A Fourier transform infrared (FTIR) spectrometer (simply denoted FTIR hereafter) equipped with a White-type multipass cell was used. Its main purpose was to calibrate the mirror reflectivity in the IBBCEAS set-up based on concentration measurements of NO2. This spectrometer (Bruker® Tensor 37TM) is equipped with a liquid-nitrogen-cooled mercury–cadmium–telluride (MCT) detector and a globar source. The multipass cell consists of three high-reflectivity gold-coated mirrors with a base length of 1.9 m. The configuration of this White cell provided 96 reflections between three mirrors and offered a total optical path length of 182 ± 1 m. The multiple path system was crossing the chamber in the same plane as the IBBCEAS pathway with an angle of 60∘ between the two main optical axes (see Fig. 1). The FTIR system records spectra in the infrared range between 500 and 4000 cm−1 with an optimal resolution of 0.5 cm−1. A typical experiment leads to the acquisition of hundreds of FTIR spectra. To perform the analysis of huge datasets, a custom-made software algorithm was written to retrieve NO2 concentrations. Typical detection limits in absorption spectra recorded by co-adding 100 scans (i.e. with an integration time of 5 min) for various gaseous compounds are listed as follows: NO2 (5 ppbv typically but here 20 ppb because of the use of smaller absorptions regions), O3 (5 ppbv), HONO (10 ppb), CH2O (3 ppbv) or HNO3 (10 ppbv).
2.1.4 NOx analyser (chemiluminescence)
In the current experiment, NO2 is measured using a chemiluminescence (CL) NOx (= NO + NO2) analyser (Horiba, model APNA 360) equipped with a molybdenum converter (Sigsby et al., 1973). NO2 was indirectly measured by first converting it into NO and measuring the sum of NO + NO2. NO2 is transformed to NO via a heated converter using molybdenum, and the NO2 concentration is obtained as the difference between the NO-only measurement and the NO + NO2 measurement. Chemiluminescence instruments are typically calibrated with a NO mixture, usually in N2, which is injected directly or converted to NO2 via gas-phase titration (Tidona et al., 1988). It is well known that these instruments are subject to strong positive interferences from NOy (Dunlea et al., 2007) as a large class of nitrogenous compounds may be converted on heated Mo converters to produce NO and lead to a chemiluminescence signal on the NO2 channel. For HONO in particular, this interference is considered to be quantitative (Villena et al., 2012). In our chemical system, HONO is expected to be the main NOy species interfering with the NO2 measurement; its concentration when available from NitroMAC was subtracted from the APNA 360 “NO2 channel” to provide “corrected” NO2 concentration and assuming 100 % conversion efficiency for HONO.
2.1.5 Temperature and humidity sensor
Temperature and relative humidity (RH) inside the simulation chamber were recorded with a temperature and humidity sensor (Vaisala HMP 234) (denoted T&RH). Absolute water vapour concentrations were calculated using the measured RH, the corresponding temperature and the pressure. The measurement error is 1 % for RH and 0.1 ∘C for temperature at atmospheric pressure and room temperature.
2.2 Intercomparison experiments and set-up
The CESAM simulation chamber is a 4.2 m3 stainless-steel chamber. It has been described in detail elsewhere (Wang et al., 2011), and only key information will be recalled here. The CESAM simulation has roughly a cylindrical shape with a 1.7 m diameter. When adding the length of the flanges that support the various inlets and instruments (see Fig. 2), it provides a 2 m long diameter that is exploited here to provide the same single-pass length of both the FTIR and IBBCEAS analytical pathways.
The intercomparison set-up is shown in Fig. 1. The measurement instruments, such as the custom-made UV-LED-IBBCEAS and NitroMAC, a chemiluminescence (CL) NOx analyser (HORIBA APNA 370), and a FTIR spectrometer (Bruker Tensor 37), are installed around the atmosphere simulation chamber.
The experiments were performed at room temperature and atmospheric pressure (∼23 ∘C and 101.325 kPa). Firstly, the chamber was cleaned by pumping down to secondary vacuum (ca. 10−4 mbar). The chamber was then filled with clean dry air by mixing 800 mbar of nitrogen produced from the evaporation of a pressurized liquid-nitrogen tank (Messer, purity >99.995 %, H2O <5 ppmv) and 200 mbar of oxygen (Air Liquide, ALPHAGAZ™ class 1, purity 99.9 %). The mixture was left ca. 45 min for the acquisition of recording instrument background. A volume of 500 µL of gaseous mixture was then introduced with a gas-tight syringe (from an NO2 cylinder: Air Liquide™, ALPHAGAZ™ 99.9 % purity), leading to about 120 ppbv of NO2 in the CESAM chamber. A small pressurize stainless-steel vessel filled with ultrapure water (18.2 MΩ, ELGA Maxima) was used to produce the required water vapour. When the NO2 concentration inside the chamber was stabilized at 120 ± 5 ppbv, the prepared H2O vapour was introduced into the simulation chamber. The relative humidity (RH) inside the chamber was allowed to increase to ∼66 % at 23 ∘C (corresponding to an absolute H2O vapour mixing ratio of ∼1.85 %). There were four experiments during the whole measurement, the second to fourth experiments were performed under the same experimental conditions as the first one. The four experiments were followed by the same procedure.
Under these conditions, as described by Wang et al. (2011), the desired amount of gas-phase HONO is systematically observed. As stated in the literature (Finlayson-Pitts and Pitts, 2000; Lammel and Cape, 1996; Spataro and Ianniello, 2014), HONO is generated through heterogeneous formation on the chamber's inner surfaces via a complex reaction of NO2 with H2O adsorbed on the chamber walls. All instruments (UV-IBBCEAS, FTIR, NitroMAC, NOx analyser, temperature and humidity sensor, pressure gauge) simultaneously recorded the relevant data (including NO2, HONO, NO and H2O concentrations, temperature and pressure) for data analysis and instrument intercomparison. Absolute NO2 concentrations obtained by the FTIR were used to determine cavity mirror reflectivity.
Four NO2 injections in the presence of humid air were organized during the 4 d of experiments. During the last experiment, an injection of formaldehyde (HCHO) was performed to allow for the investigation of the sensitivity of the UV-IBBCEAS data analysis to the interferences in the UV range. Formaldehyde was prepared by sublimating commercial paraformaldehyde (CH2O)n (Fluka, “extra pure” grade) under vacuum in a glass line and collected at a known pressure in a bulb of known volume. This quantity was then flushed into the chamber with a gentle flow of pure nitrogen. A controlled dilution flow was allowed into the chamber to induce a forced decrease of the sampled concentrations and hence testing the quantification performance of the various analytical devices across a few orders of magnitudes.
2.3 Data analysis
2.3.1 UV-LED-IBBCEAS
In an IBBCEAS experiment, the transmitted spectra I0(λ) from the cavity without absorbing species are firstly measured by filling the cavity with pure N2 or zero air, and then the spectra I(λ) in the presence of target sample are recorded. The absorption by molecular species, Rayleigh scattering by molecular species αRay(λ), Mie scattering by particles αMie(λ) and absorption by particles αabs-particle(λ) contribute to optical light extinction in the cavity, and the total optical extinction coefficient α(λ) is given by the following (Gherman et al., 2008; Fuchs et al., 2010; Wu et al., 2012, 2014; Duan et al., 2018; Jordan and Osthoff, 2020):
where d is the distance between the two cavity mirrors. Here αRay(λ), αMie(λ) and αabs-particle(λ) are needed to consider for real atmospheric condition or open-path observation. However, αMie(λ) ≈0 and αabs-particle(λ)≈0 can be neglected for a particle-free environment.
In the present work of gas-phase chemical reaction in the simulation chamber filled by zero air, the chamber is free of particles; thus, αMie(λ)≈0 and αabs-particle(λ)≈0. Otherwise, low-concentration NO2 in air (<200 ppbv) was used for mirror reflectivity R(λ) determination, and the Rayleigh scattering coefficient of zero air (αRay(λ) in Eq. 1) between 350 and 380 nm ( cm−1) can be neglected, αRay(λ)≈0; thus, R(λ) can be determined by using a known-concentration NO2 sample as below:
where and Izero air(λ) are the transmitted LED light intensities through the cavity containing NO2 and zero air, respectively, and is the absorption coefficient of NO2. For determination of R(λ), about 100–200 ppbv NO2 (absolute NO2 concentrations were determined by the FTIR spectrometer) was injected into the simulation chamber. Using the known NO2 concentrations measured in situ by the FTIR spectrometer and Rayleigh scattering cross section of zero air (see Fig. 3b), the mirror reflectivity can be deduced from Eq. (2), as shown in Fig. 3a. With the measured mirror reflectivity R(λ), the mirror-to-mirror distance of optical cavity d, as well as absorption cross sections σ(λ) of the target gas from a common database, target gas concentrations can be simultaneously retrieved using a least-squares fit to the experimentally measured absorption coefficient α(λ):
where , σHONO(λ) and are the reference absorption cross sections (in cm2/molecule) of NO2, HONO and CH2O species (see Fig. 3b), respectively. As shown in Fig. 3a, the chosen UV-LED emission covers an absorption band of 350–380 nm including NO2, HONO and CH2O contributions. The reference cross sections of NO2 (Voigt et al., 2002), HONO (Stutz et al., 2000) and CH2O (Meller and Moortgat, 2000) were convoluted with the instrument function of approximately 0.59 nm (the spectrometer resolution). Symbols and are the concentrations (number densities) of NO2, HONO and CH2O, respectively. The second-order polynomial term in Eq. (3) represents the variation in spectral baseline which could arise from gas scattering, LED intensity fluctuations and other unspecified loss processes. The unknown parameters (number densities , a, b and c) can be extracted using a linear algebraic method known as the singular value decomposition (SVD) method (Varma et al., 2009; Yi et al., 2016). A LabVIEW-based concentration retrieval program was used to simultaneously process the data to provide real-time NO2, HONO and CH2O concentrations.
Acquisition time for each spectrum was 2 min; the statistical error of each individual spectrum is close to ∼1 %. This ∼1 % statistical error is as good as the results reported in the references for other IBBCEAS set-ups (Kleffmann, 2007; Fuchs et al., 2010; Varma et al., 2009; Gherman et al., 2008; Ródenas et al., 2013; Min et al., 2016). The measurement uncertainty in the retrieval of trace gas mixing ratios are dominated by the uncertainties in the used absorption cross sections of HONO, NO2 and CH2O (±5 %, ±3 % and ±3 %, respectively) (Voigt et al., 2002; Stutz et al., 2000; Meller and Moortgat, 2000), in the determination of (1−R) (∼7 %), in the measurement of (0.5 %) and in the cavity length determination (<1 %). The total relative uncertainty in the retrieved concentrations, including the statistical uncertainty from the fit (<0.5 %) and the measurement uncertainty, is approximately estimated to be ∼9 % for HONO and ∼8 % for both NO2 and CH2O.
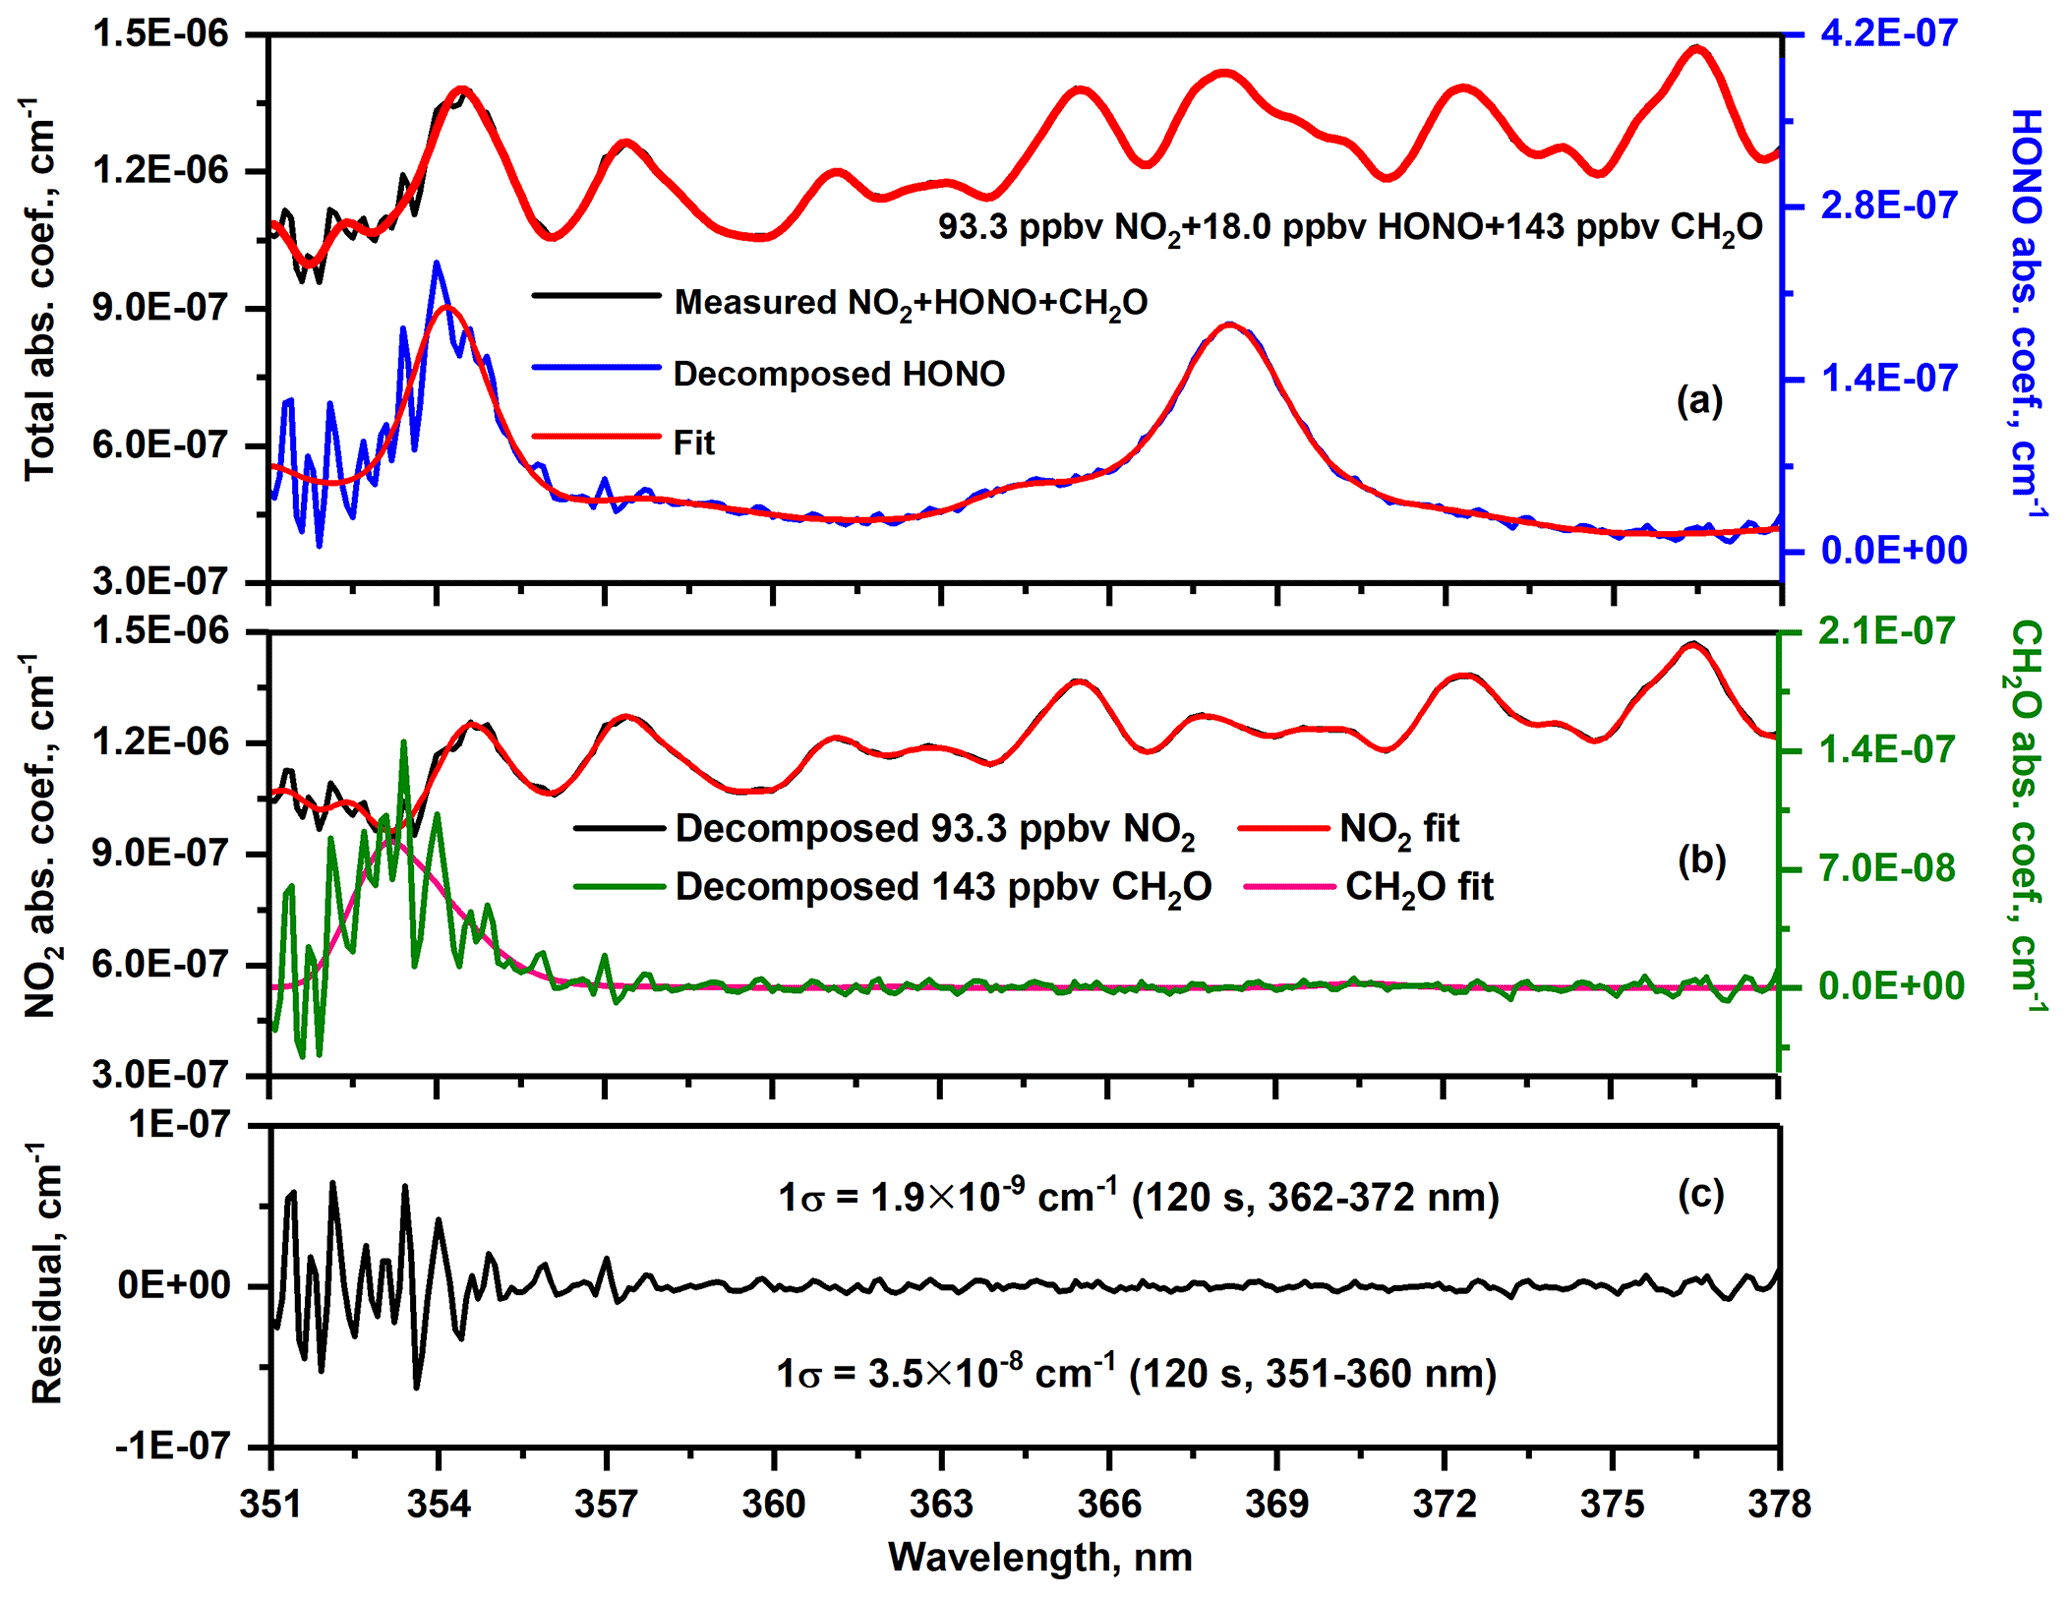
Figure 4Measured and fitted NO2, HONO and CH2O spectra associated with the related residual. Decomposed spectra were specified in Kennedy et al. (2011).
Typical UV-IBBCEAS spectra (from 351 to 378 nm) of 18.0 ppbv HONO, 93.3 ppbv NO2 and 143 ppbv CH2O as well as the total fit for their concentration retrievals are given in Fig. 4a (black line). In order to indicate individual absorption peaks for single molecules, the decomposed spectral (Kennedy et al., 2011) associated with the corresponding fits for HONO, NO2 and CH2O were shown in Fig. 4a (blue line), Fig. 4b (black line) and Fig. 4b (green line), respectively. Based on the fit residual, the corresponding 1σ minimum detectable concentrations (MDCs) with mixing ratio for 120 s integration time are 112 pptv for NO2, 56 pptv for HONO using 362–372 nm region data. MDC for CH2O with 120 s is 41 ppbv by using of 351–360 nm spectral data.
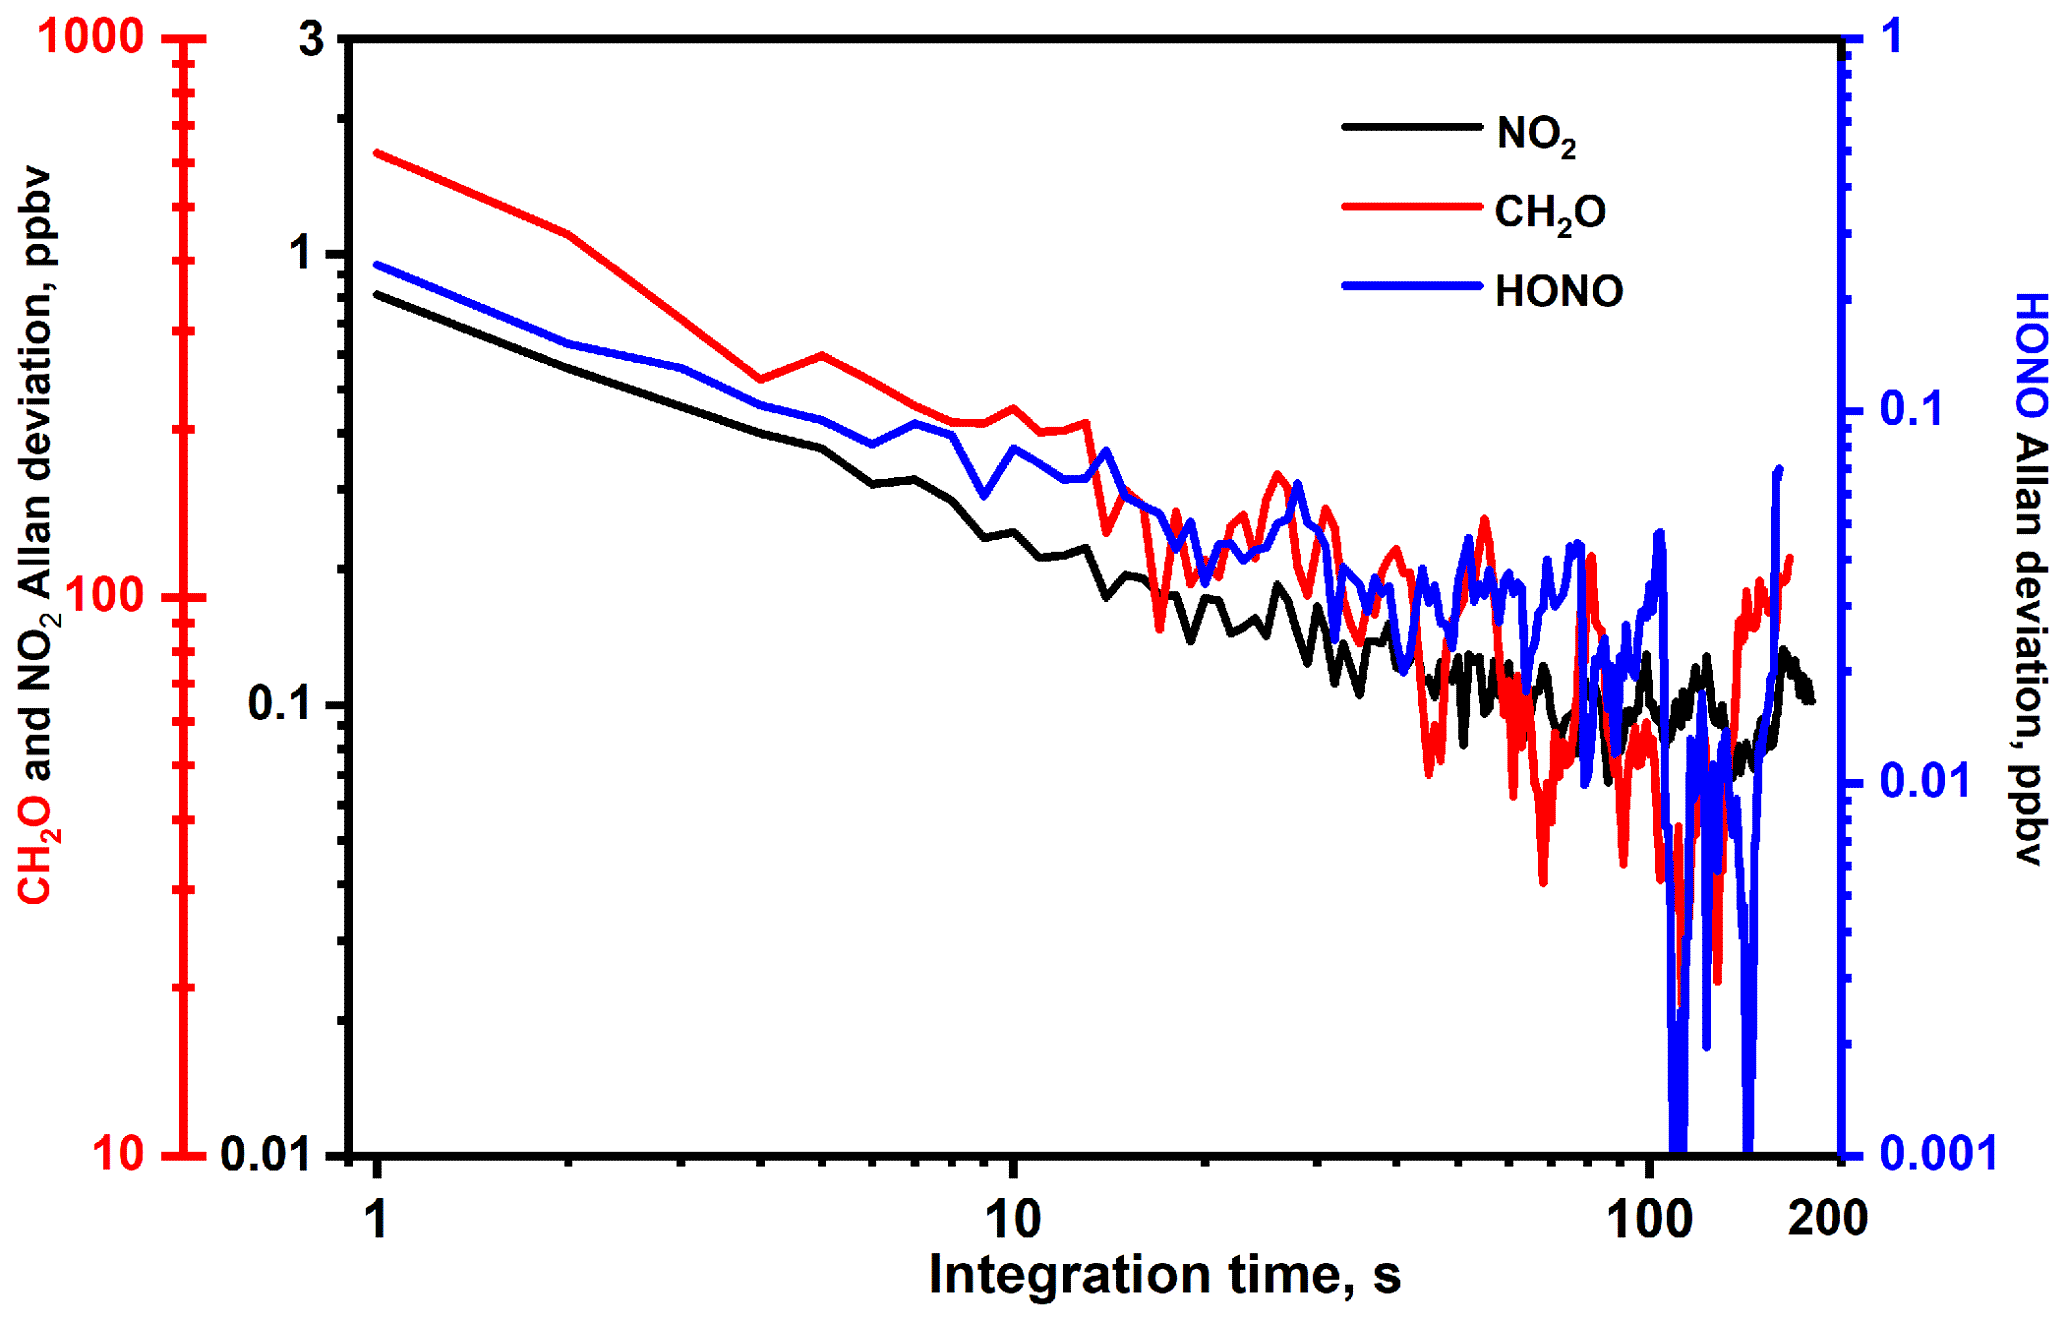
Allan variance analysis was carried out to assess the stability (corresponding to the optimal integration time) of the UV-IBBCEAS set-up. Zero air was used to purge the simulation chamber. Time series spectra of zero air were recorded with a rate of one spectrum per second; about 2000 spectra were acquired for the Allan variance study (Wu et al., 2012; Yi et al., 2015). Typical Allan variance curves are plotted in Fig. 5, illustrating a highly desired white noise dominated system stability. As a compromise between detection limit (requiring long integration time) and measurement time response (requiring short measurement time), an integration time of 120 s was selected for use in the present work, which correspond to the measurement precision of 100 pptv for NO2, 30 pptv for HONO and 40 ppbv for CH2O.
2.3.2 FTIR spectra
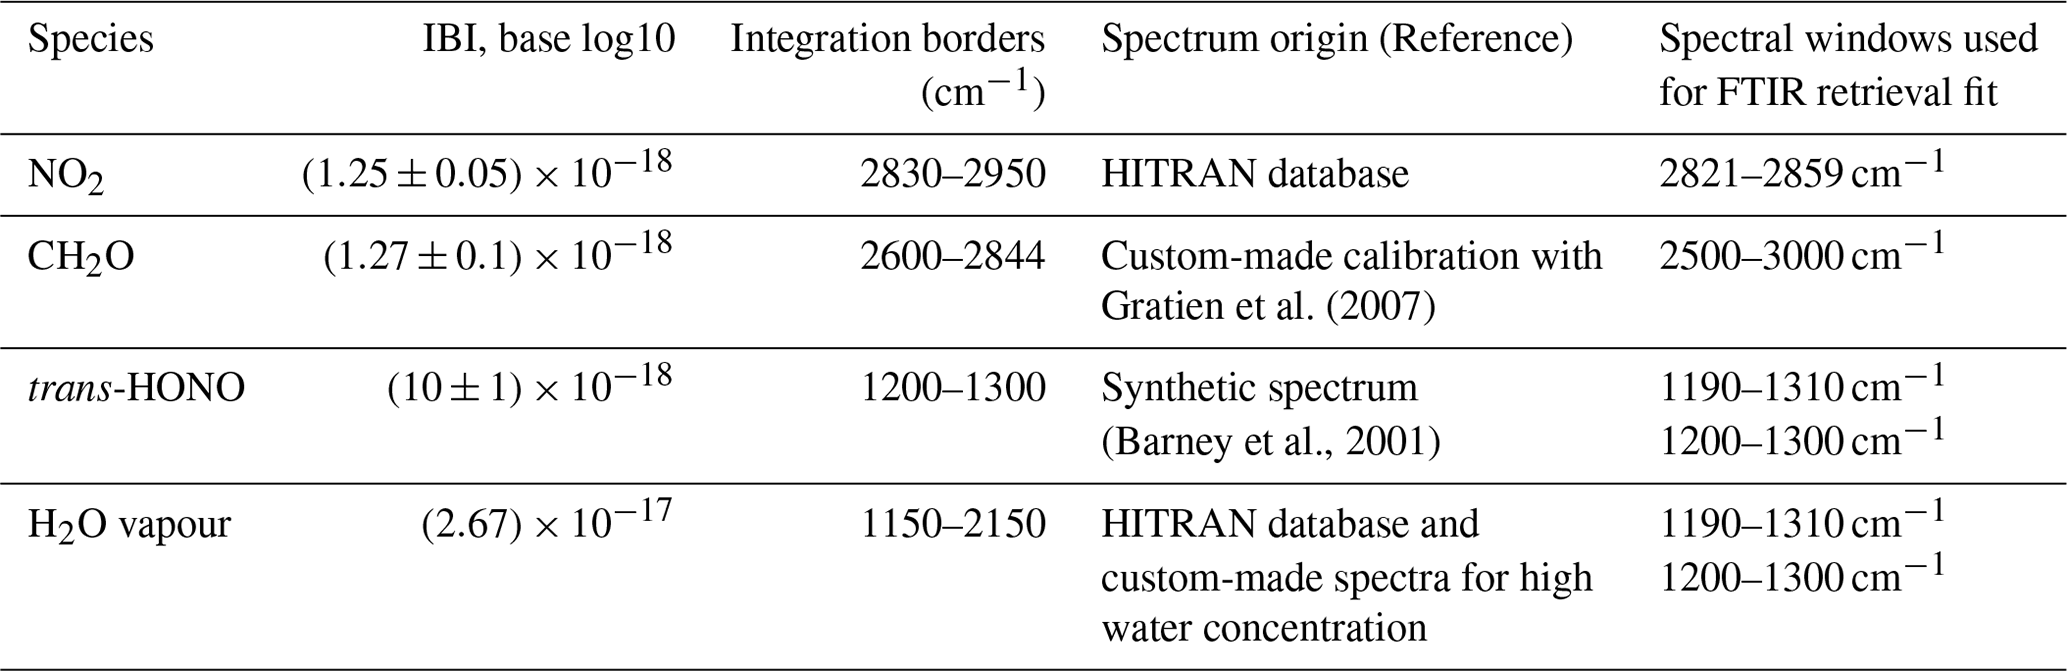
Infrared spectra were obtained at a resolution of 0.5 cm−1 and derived from the co-addition of approximately 200 scans collected over 5 min. Each scan was obtained from the Fourier transform of an interferogram apodized with the Happ–Genzel function. Concentrations of the target species were determined by subtracting pure reference spectra (brought to the experimental resolution of 0.5 cm−1) from spectra of reaction mixtures using custom-made software based on matrix algebra. To guarantee the performance of the automatic routine, selected spectra for each experiment were subtracted manually, and results were compared. Spectroscopic information used for the FTIR data were analysis are given in Table 1. HONO absorption was analysed from its ν3 absorption bands around 1263 cm−1 using the synthetic reference spectrum proposed by Barney et al. (2000) and modified by Barney and coworkers later (Barney et al., 2001). FTIR spectra of a mixture analysed using the ANIR deconvolution software (Ródenas et al., 2020), which uses a linear square fitting method to quantitatively analyse experimental spectra through a combination of reference spectra.
Table 1Absorption bands adopted by FTIR for NO2, HONO, CH2O and H2O measurements. IBI: integrated band intensities.
During the intercomparison experiments in the CESAM atmosphere simulation chamber, time series measurements of NO2, HONO and CH2O were simultaneously performed using the UV-LED-IBBCEAS, FTIR spectrometer, NOx analyser and NitroMAC.
Before HONO, NO2 and CH2O intercomparison measurements, the FTIR spectrometer was used to measure absolute NO2 concentrations between 60 and 120 ppbv in order to determine of the wavelength-dependent reflective curve of cavity mirror. The measured mirror reflectivity (R) is shown in Fig. 3a (red line). During the HONO-generation process, NO2 and H2O vapours were introduced into the simulation chamber four times, which correspond to four peaks of NO2 (as shown in Fig. 7a). The maximum H2O vapour concentrations measured by the T&RH sensor are 1.85 %, 1.54 % and 1.63 % for second, third and fourth peaks, respectively. At the fourth peak in Fig. 7a, ∼160 ppbv CH2O was also introduced into the chamber to evaluate the UV-LED-IBBCEAS performance for simultaneous detection of NO2, HONO and CH2O. This process explains the peak shape formed of a straight injection step followed by an exponential decay during 4 d experiments (first to fourth peaks in Figs. 7a and 8a).
The UV-LED-IBBCEAS spectrometer recorded spectra of the transmitted light intensity with an integration time of 1 s, and 120 data acquired in this manner were then averaged to produce one spectrum for I0(λ) or I(λ) (i.e. a net acquisition time of 2 min per spectrum). The integration time of the NitroMAC was 10 min for one measurement of HONO concentration. The integration time of the FTIR for NO2, HONO, CH2O and H2O vapours was 1 min.
3.1 Side-by-side comparison of NO2 and HONO measurements
Intercomparison of HONO measurements were executed between the UV-LED-IBBCEAS, the NitroMAC and the FTIR, while the measured NO2 concentrations were compared between the UV-LED-IBBCEAS, the NOx analyser and the FTIR.
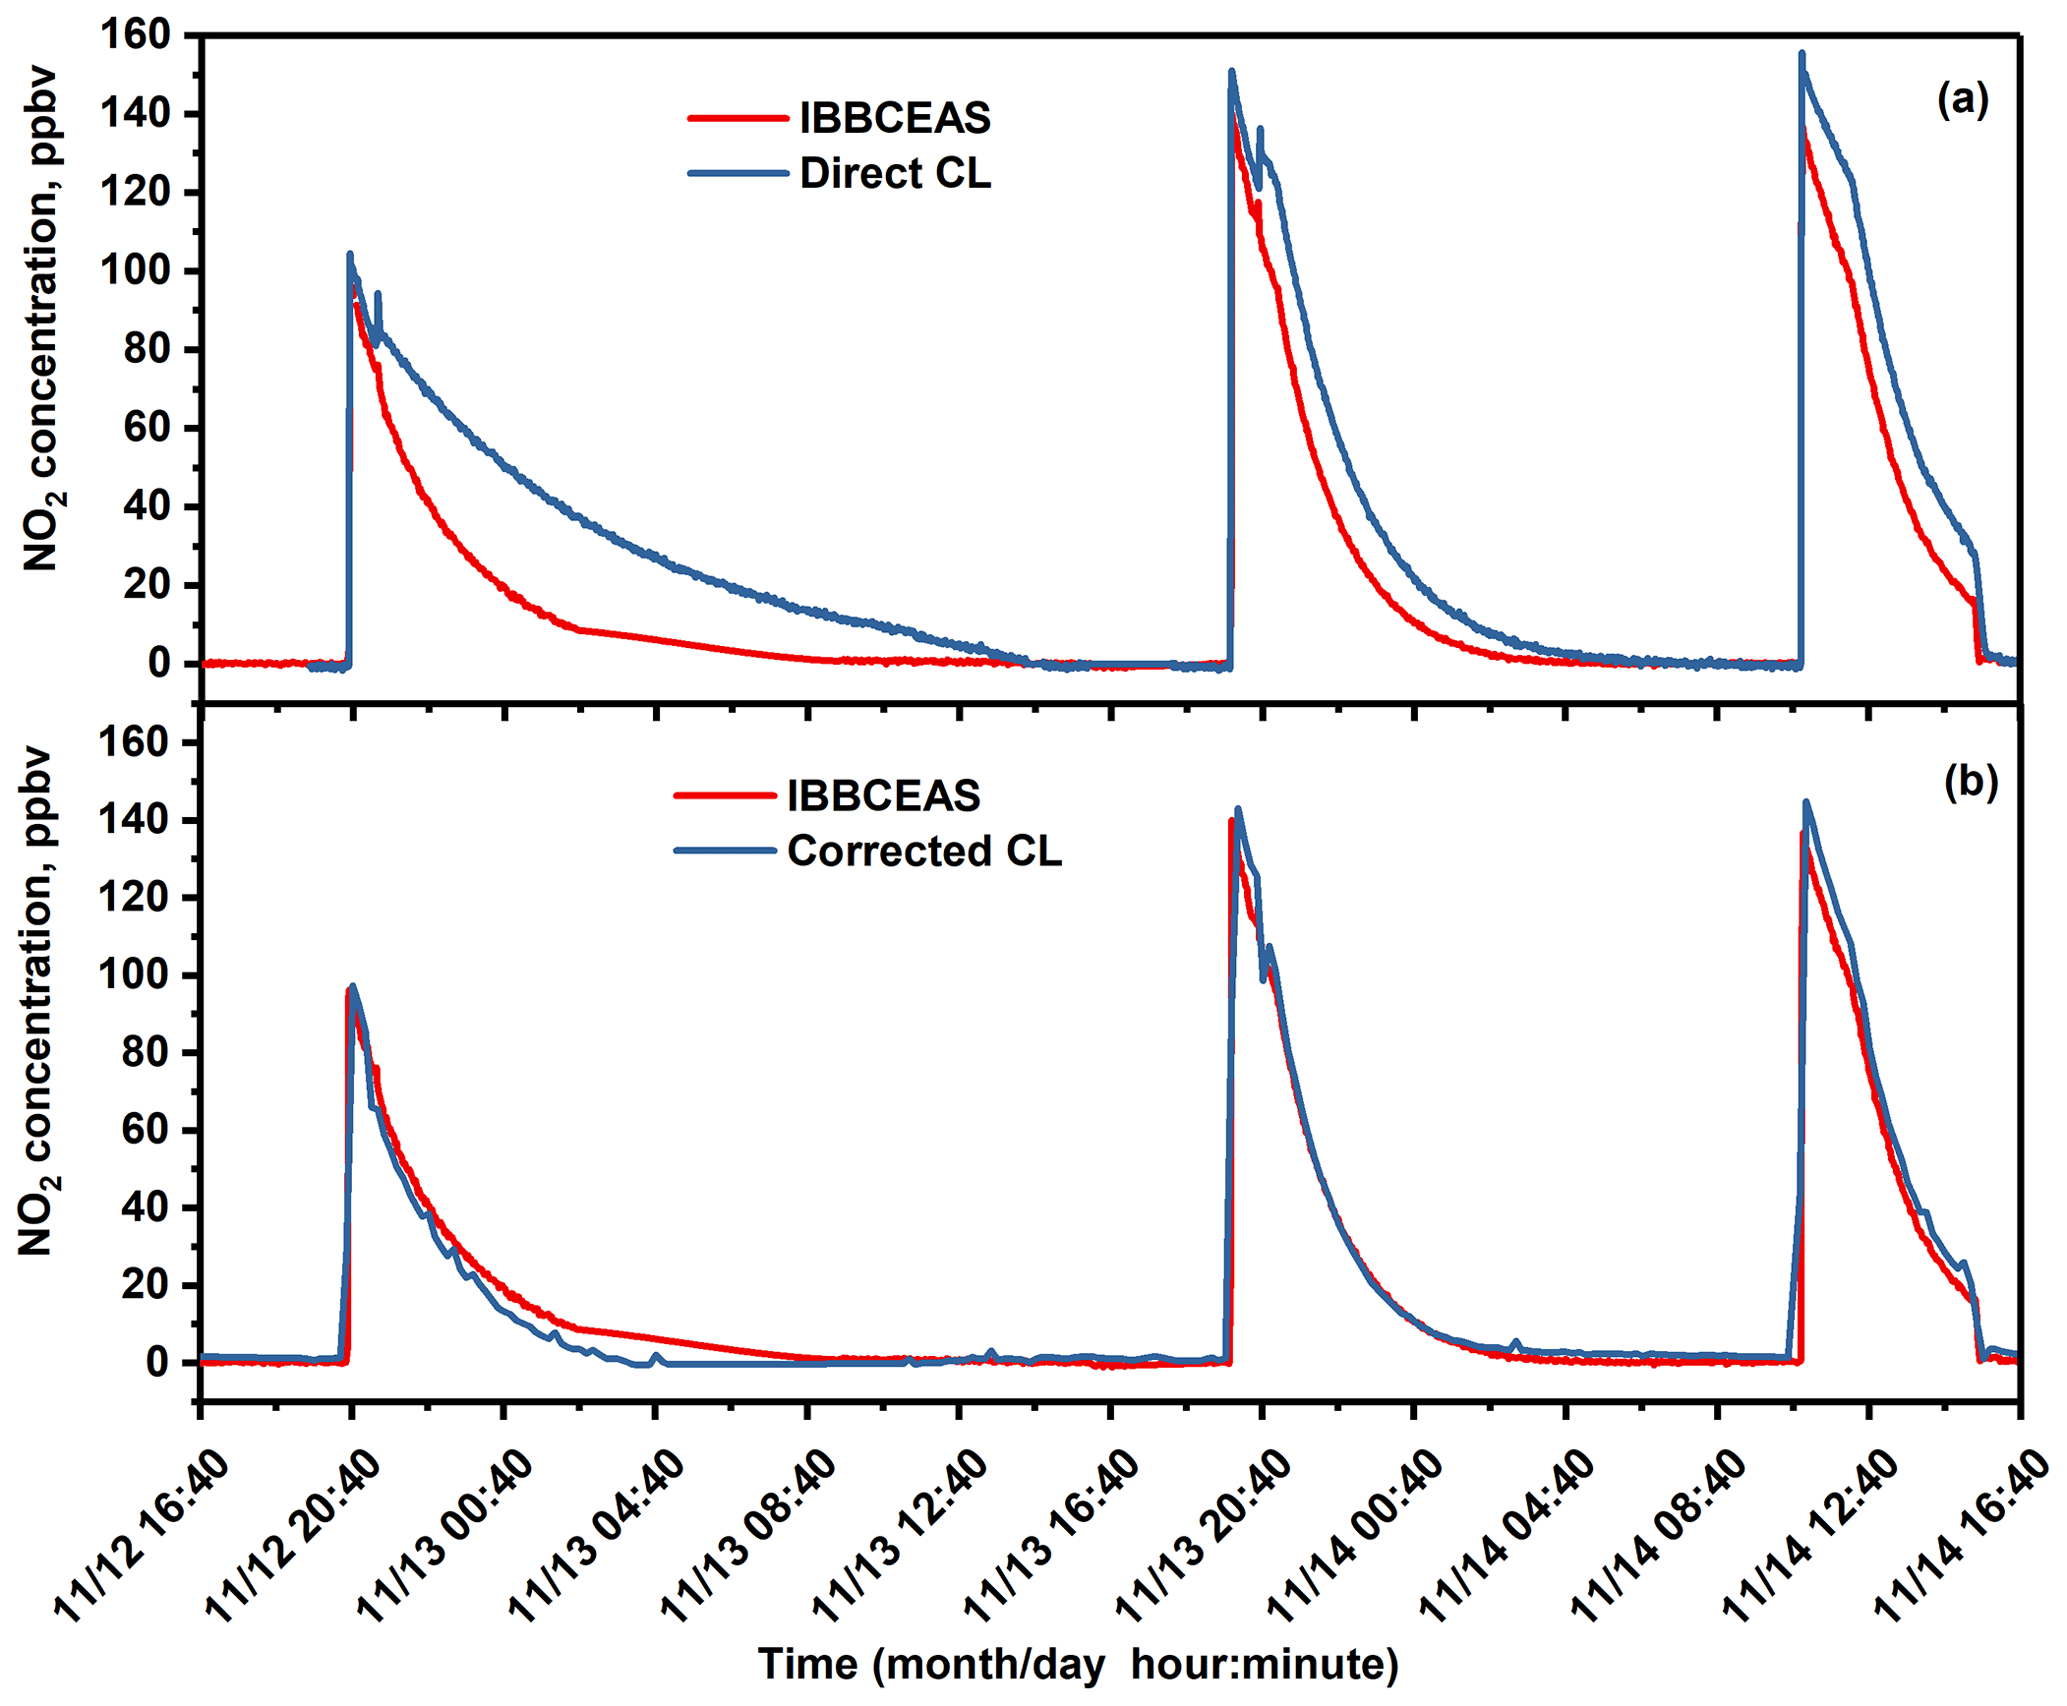
Figure 6Investigation of positive interferences from nitrogen-containing species (here HONO) in the NOx analyser (CL) measurement in comparison to the UV-LED-IBBCEAS measurement: (a) from CL-NOx analyser without HONO correction; (b) CL-NOx analyser results after HONO correction.
For in situ NO2 monitoring, the correlation between NOx analyser and IBBCEAS measurements is not linear. The NOx analyser overestimated NO2 concentrations during all measurements, as shown in Fig. 6a, which was caused by the well-known positive interferences (overestimation) (Villena et al., 2012) in the NOx analyser due to non-selective conversion of all nitrogen-containing species inside the chamber into NO (Tidona et al., 1988; Villena et al., 2012) for the indirect measurement of NO2 concentrations. In the present experiment, the main interference source was HONO that was transferred into NO in the NOx analyser, which resulted in an overestimation of the NO2 concentration. The amount of the overestimated NO2 concentration was equal to the HONO concentration simultaneously measured by NitroMAC in the current study. The real NO2 concentration can be obtained by deduction of HONO concentration simultaneously measured by NitroMAC from NO2 concentration measured by NOx analyser. After correction of the HONO contribution to the measured NO2 concentrations, time series intercomparison measurements of NO2 between the NOx analyser (with HONO correction) and the UV-LED-IBBCEAS are shown in Fig. 6b, which shows a good agreement between the two instruments. Measurements of NO2 have been then compared between the UV-LED-IBBCEAS, the NOx analyser (with HONO correction) and the FTIR, as shown in Fig. 7a. NO2 concentrations ranging from 100 pptv to 140 ppbv were investigated during the entire experimental intercomparisons; the corresponding correlation analyses are plotted in Figs. 7b, c. A linear correlation coefficient of r2=0.987 was acquired between data from the interference-corrected NOx analyser and the IBBCEAS instrument (Fig. 7b); both measurements agree well (slope = 1.051) with an offset of 0.130 ppbv. The plot of NO2 measurements by FTIR vs. IBBCEAS shown in Fig. 7c presents a linear correlation with an r2=0.885; the fitted slope and offset are 0.933 and 0.265 ppbv, respectively. This discrepancy of about 7 % between FTIR and IBBCEAS mainly comes from the larger relative measurement uncertainty of the FTIR due to its worse MDC of 10 ppbv at sampling time of 5 min compared to that of 112 pptv with 2 min integration time for IBBCEAS.
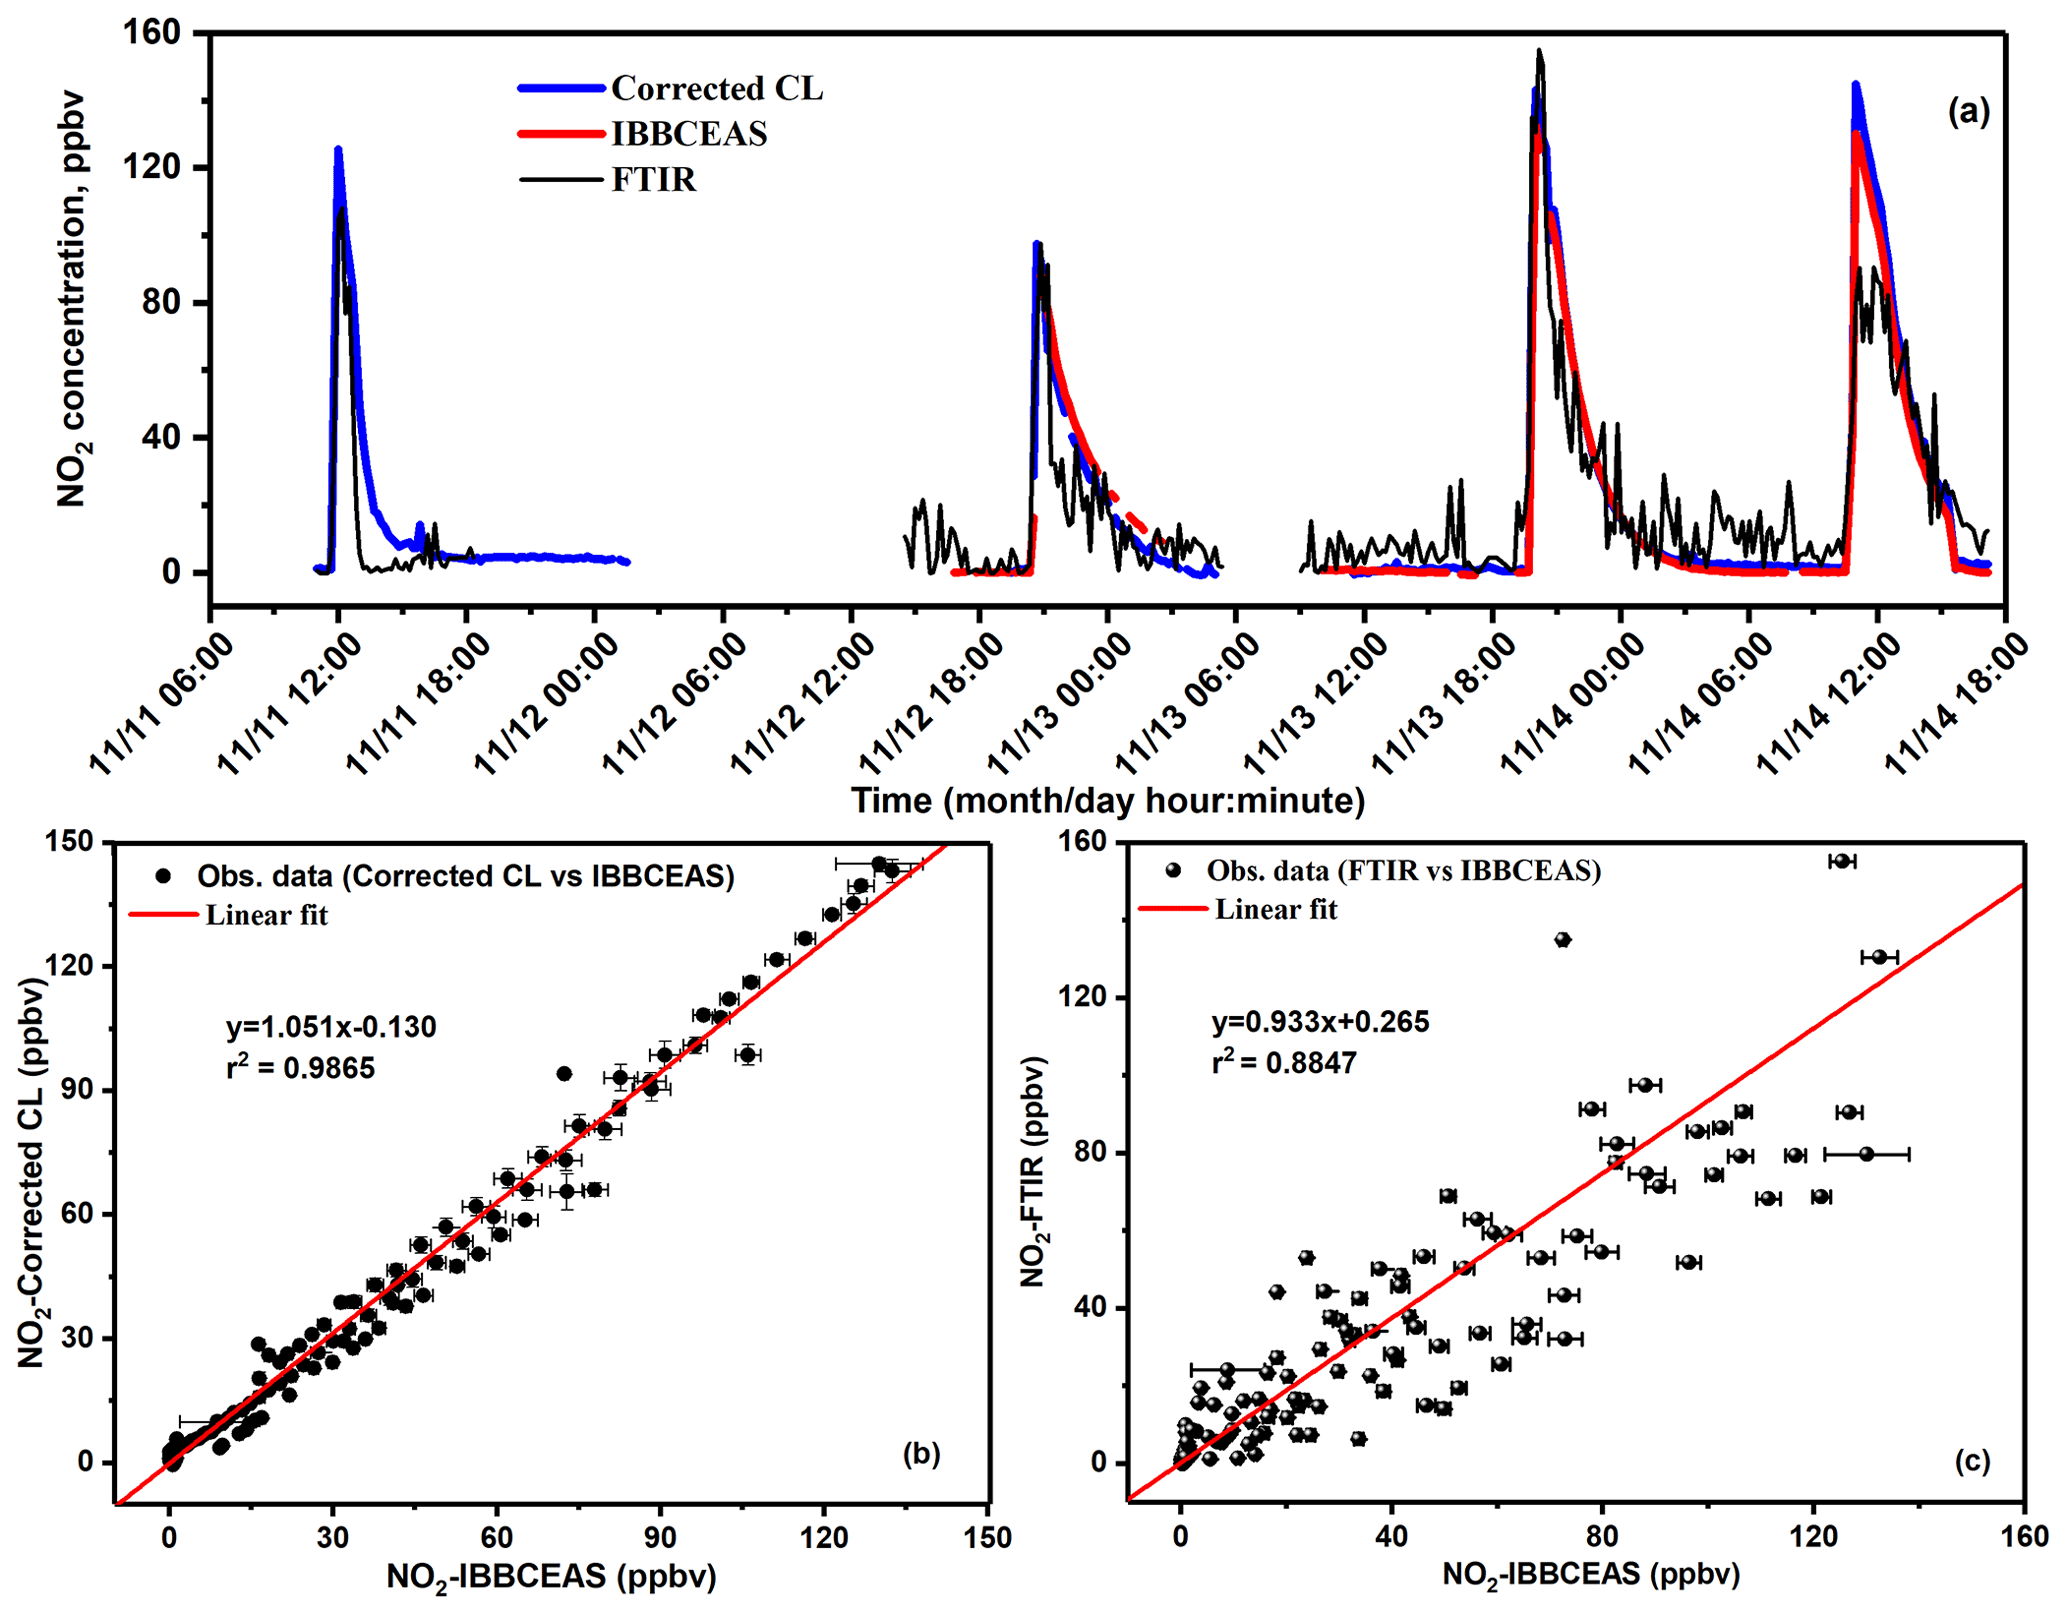
Figure 7(a) Intercomparison measurement for NO2 detection between IBBCEAS, FTIR and NOx analyser after HONO interference correction; (b) correlation of the measured NO2 concentrations between UV-LED-IBBCEAS and NOx analyser (CL) with HONO interferences correction; (c) correlation of the measured NO2 concentrations between UV-LED-IBBCEAS and FTIR.
Time series intercomparison measurements of HONO by UV-LED-IBBCEAS, NitroMAC and FTIR are shown in Fig. 8a. To provide a more quantitative intercomparison, a linear regression analysis was performed, weighted with errors of three instruments (IBBCEAS vs. NitroMAC and IBBCEAS vs. FTIR). The comparison of all data and the results of the regression analysis are shown in Fig. 8b and c. From these results, the HONO concentrations measured by the three instruments display the same variation trend when the HONO concentration varied from 0 to 40 ppbv (second to fourth peaks in Fig. 8a). For the region of second and third peaks in Fig. 8a, HONO concentrations from NitroMAC are 33 % and 35 % higher than that from IBBCEAS, respectively. During the fourth HONO-generation process (peak 4) in Fig. 8a, the correlation between the NitroMAC and the IBBCEAS becomes better, and the NitroMAC measurement is only 8.4 % higher than that from the IBBCEAS instrument. In this HONO-generation process, about 150 ppbv CH2O was injected into the chamber (Fig. 9a). Nevertheless, it is not possible to relate this better correlation result to the presence of formaldehyde. It is hypothesized that the speed of the mixing fan was increased during the last part of the experiment, and by improving the mixing, the point measurements by NitroMAC nearby the walls are getting more comparable with the spatially integrated value from the IBBCEAS. The correlation between these two instruments during the entire experiment is r2=0.954 (Fig. 8b), the gradient of this weighted regression is 1.273 with a y-axis intercept of 0.067 ppbv between the NitroMAC and the IBBCEAS (Fig. 8b), showing an overall level of agreement within 27 % throughout the entire experiment. Considering the relative measurement uncertainty of 12 % for NitroMAC and 9 % for IBBCEAS (a total uncertainty of 21 % for the two-instrument system), this difference is close to the measurement errors. A small systematic discrepancy is nevertheless remaining after the uncertainties analysis. It is hypothesized that this disagreement may arise from the sampling volumes of the two techniques and of the HONO-generation mechanism. First, IBBCEAS (similarly to FTIR) is providing a spatial average of the concentration across the chamber, while NitroMAC is a single-point sampler located at the bottom of a side port (see Fig. 1) ca. 20 cm away from the main well-mixed chamber volume. Further, HONO generation is a multiphase process that involves wall reaction. The local wall-to-volume ratio around the NitroMAC inlet is certainly larger than the average wall-to-volume ratio of the CESAM. This may explain why in most of the cases NitroMAC values were larger than those measured by IBBCEAS. On the other hand, in the IBBCEAS, the final HONO concentrations depend on the selected HONO cross sections (Gratien et al., 2009); the HONO time–concentration profiles in Fig. 8a were retrieved using the absorption cross section published by Stutz et al. (2000). If the absorption cross section from another publication (Brust et al., 2000) was used to retrieve HONO concentration, all HONO concentrations in IBBCEAS will increase 23 %, which equates to multiplying by a factor of 1.23 to the currently presented HONO concentrations in Fig. 8a. In this case, good agreement (with a linear-fit slope approaching 1) is observed between the HONO concentrations measured by LED-IBBCEAS and NitroMAC.
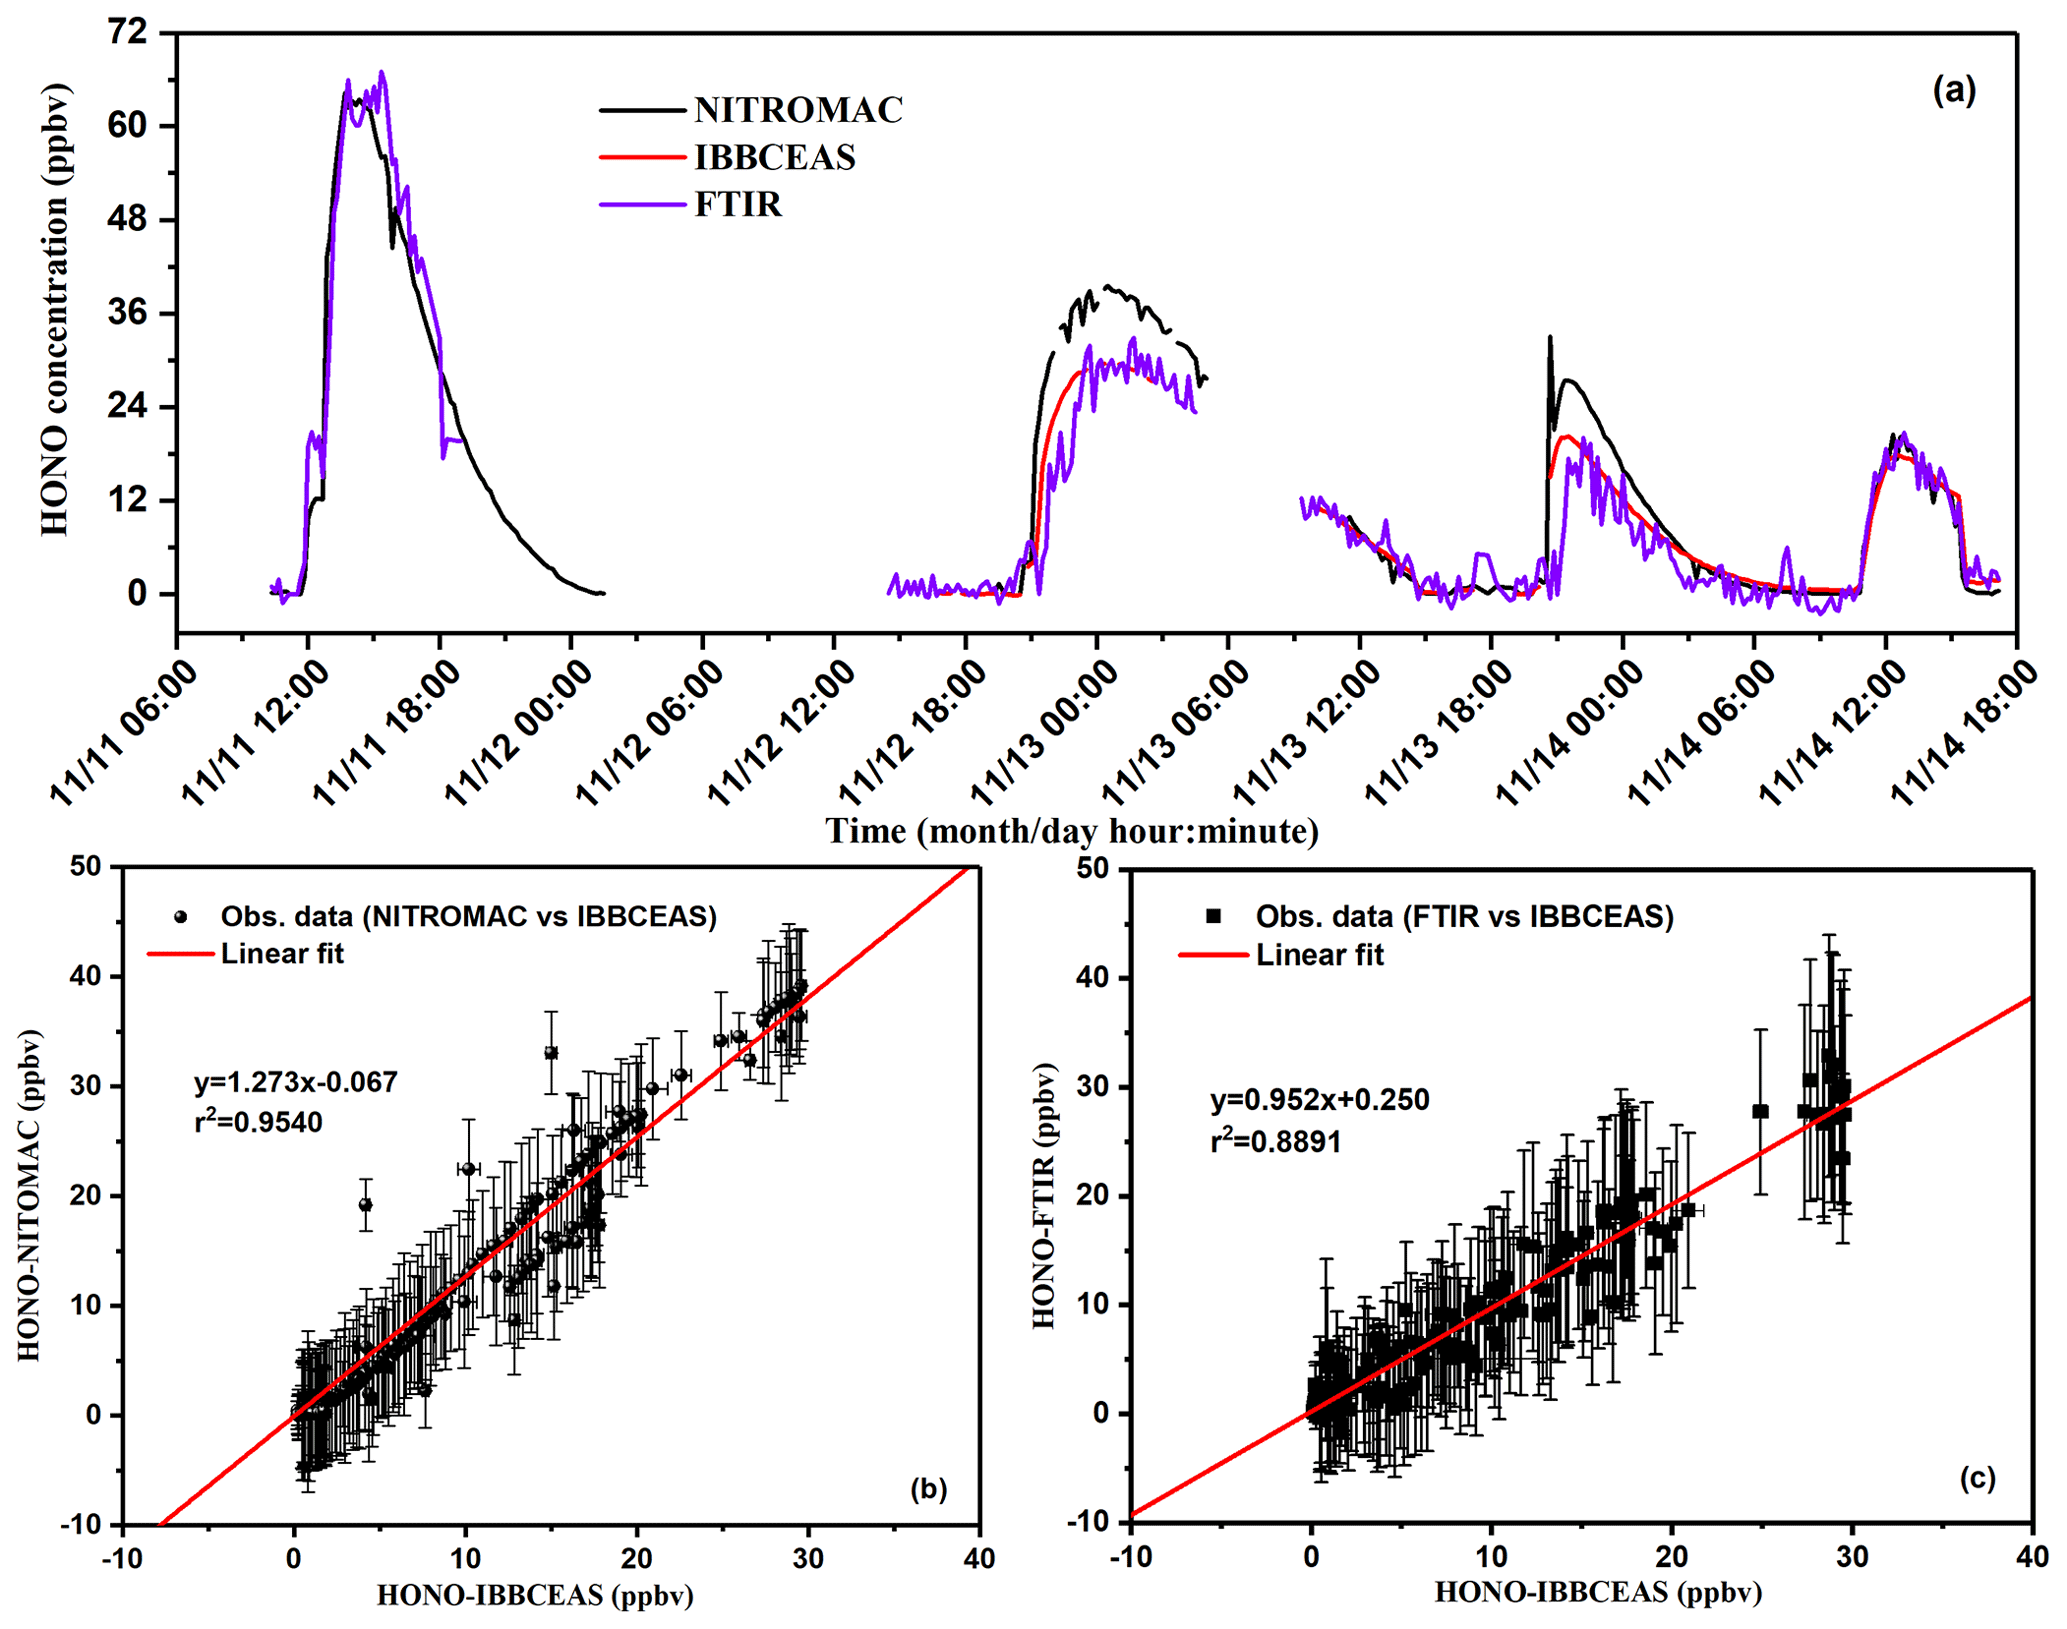
Figure 8(a) HONO intercomparison measurements between IBBCEAS, NitroMAC and FTIR; (b) regressions analysis for the correlation of the measured HONO concentrations using UV-LED-IBBCEAS and NitroMAC; (c) correlation of the measured HONO concentrations between UV-LED-IBBCEAS and FTIR.
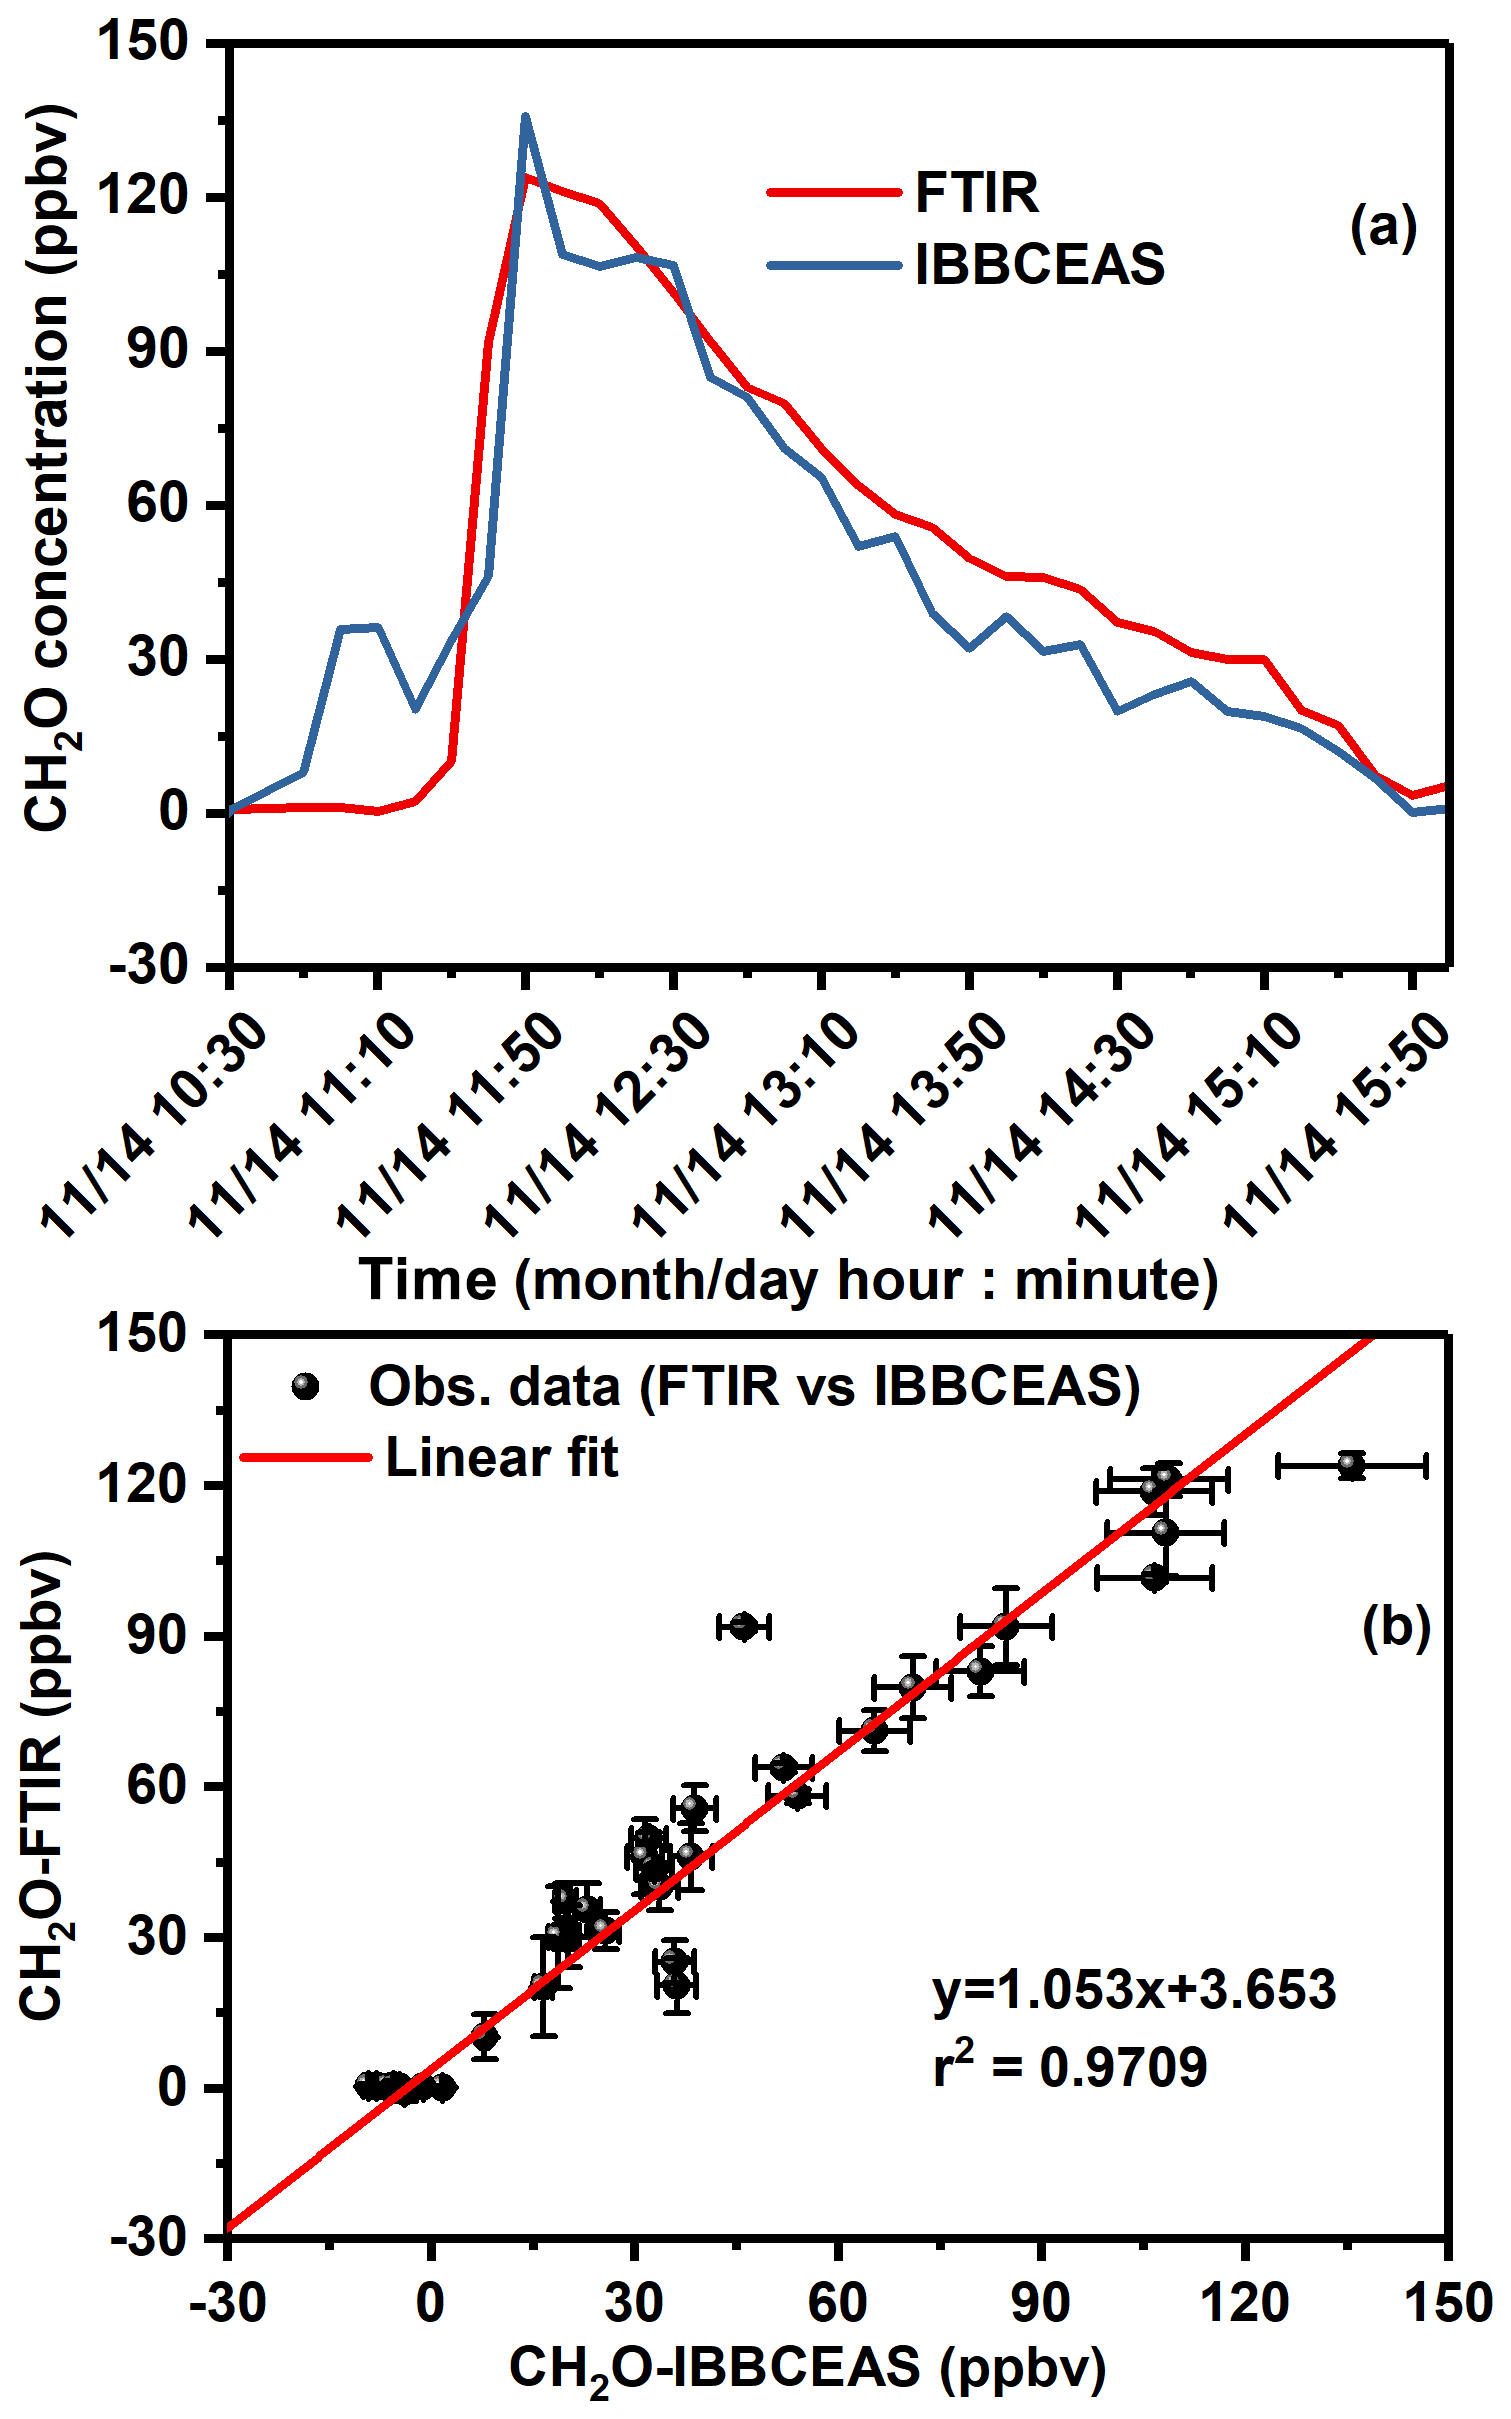
Figure 9Intercomparison measurements of CH2O between IBBCEAS and FTIR: (a) time series measurements of CH2O concentrations from UV-LED-IBBCEAS and FTIR; (b) linear regression of the measured CH2O in (a) IBBCEAS (x axis) versus FTIR (y axis).
The correlation and the regression analysis for the comparison between the FTIR and the IBBCEAS (second to fourth peaks) is given in Fig. 8c, displaying a slope of 0.952 with a y-axis intercept of 0.250 ppbv and an r2=0.89. The HONO concentration variation profile (second to fourth peaks in Fig. 8a) coincides well between IBBCEAS and FTIR with a correlation slope close to 1. The discrepancy (<5 %) is mainly due to the larger measurement uncertainty of HONO by FTIR. The FTIR spectrometer used the integrated HONO absorption band intensity to retrieve HONO concentration; interference from other species is hard to avoid, such as NO2, HNO3 and H2O absorption in the 1200–1300 cm−1 region.
3.2 Interferences and opportunity for formaldehyde measurements using IBBCEAS
Formaldehyde is ubiquitous in the atmosphere and is among the most probable interfering species for the deployment of the UV-LED-IBBCEAS as it exhibits strong absorptions between 260 and 360 nm. It is thus important (a) to investigate any potential artefact during its co-detection with HONO and (b) to evaluate through intercomparison the ability of the newly developed IBBCEAS to reliably quantify it.
During the NO2 and HONO intercomparison campaign around the fourth peak region, about 150 ppbv CH2O was added into the chamber in order to evaluate potential interference to the IBBCEAS data analysis. The CH2O concentrations ranging from 0 to 150 ppbv were investigated using UV-LED-IBBCEAS and FTIR; the time series measurements are plotted in Fig. 9a. A good linear correlation between the measurements by two instruments is obtained with a regression slope of 1.053 and an intercept of 3.653 ppbv (r2=0.971), as shown in Fig. 9b. This measurement intercomparison confirmed the good performance of the measurement of CH2O using IBBCEAS. The relatively large intercept of 3.653 ppbv is due to the relatively high MDC of 41 ppbv, because the used UV-LED emission intensity was very weak at its side wing near 350 nm at which CH2O was probed (Fig. 2), which degraded significantly the SNR (signal-to-noise ratio) in the IBBCEAS spectrum of CH2O. Moreover, the corresponding CH2O absorption cross section near 350 nm is not the maximal value in this region for its sensitivity measurement. The MDC can be further improved by using a suitable light source with main emission centred between 315–350 nm, allowing us to probe the strongest CH2O absorption lines, which may lead to an MDC of 0.38 ppbv (Washenfelder et al., 2016; Liu et al., 2020). The present work in an atmosphere simulation chamber, with excellent measurement correlation on NO2, HONO and CH2O between IBBCEAS and other well-established instruments, shows that the IBBCEAS technique offers the ability of self-calibration for simultaneously measuring concentrations of these three species with high precision without significant interference influence even if their absorption cross sections are overlapped. For its application to an uncontrolled environment, the interference resulting from the presence of aerosols, in particular, would degrade the performance of the IBBCEAS measurement, which is an issue to be carefully addressed. Under harsh environmental conditions, additional approaches, such as purging the high-reflectivity mirror and using a particle filter to reduce aerosol absorption and scattering, could be used to extend the IBBCEAS technique to field campaigns (Wu et al., 2014; Duan et al., 2018; Jordan and Osthoff, 2020).
Intercomparison measurements of HONO, NO2 and HCHO between IBBCEAS, NitroMAC and FTIR have been performed during the reaction of NO2 with H2O vapour in the CESAM atmosphere simulation chamber. The performance of IBBCEAS was evaluated through side-by-side comparison with NitroMAC and FTIR for HONO, with FTIR and NOx analyser for NO2, and with FTIR for CH2O. The intercomparison of the measured data shows a good agreement on the temporal trends and variability in HONO, NO2 and CH2O. Good correlation of better than 93 % for NO2 measurements between IBBCEAS, NOx analyser and FTIR was obtained under well-controlled conditions in the CESAM simulation chamber. Due to positive interference, NO2 concentration measurements using the NOx analyser were corrected by deduction of the HONO contribution. A more than 95 % correlation for the CH2O measurements was found between IBBCEAS and FTIR. The measured time series HONO profiles displayed a relatively large divergence (up to 30 %) in absolute concentrations from the intercomparison between IBBCEAS and NitroMAC. NitroMAC indicated somewhat higher HONO concentration than those from the IBBCEAS and the FTIR. This discrepancy of ∼27 % can only be partly attributed to the uncertainty of the cross sections used for HONO concentration retrieval. A significant fraction of the discrepancy can most probably be attributed to the fact that NitroMAC was sampling at a point that is relatively protected from mixing fan effects and close to the wall, i.e. where HONO is being produced. This drawback of our experimental strategy did not harm too seriously our assessment of the IBBCEAS set-up and retrieval thanks to the use of in situ FTIR, which had the advantage to illustrate well how important it is to perform measurements that spatially depends on the probed volume. It illustrates how in situ spatially averaged measurements are the strategy of choice for the monitoring of reactive species in simulation chambers.
The experimental results and relevant analysis show that UV-LED-IBBCEAS has advantages for studying chemical dynamics by means of in situ and fast concentration tracking with high precision. It also has the capacity for simultaneously and directly measuring NO2, HONO and CH2O in chamber experiments without any sample extraction and hence without any influence on the chemical reaction going on, which offers a unique advantage of non-invasive monitoring of chemical reaction in chamber studies. Its absorption line intensity based on self-calibration capacity exhibits another advantage compared to the need for complicated calibration processes using chemical solutions for wet-chemistry-based analytical instruments.
The data used in this study are available from the corresponding author upon request (Jean-Francois Doussin (jean-francois.doussin@lisa.u-pec.fr) and Weidong Chen (chen@univ-littoral.fr)).
WC and JFD conceived the research and supervised the project. HY and WC developed UV-LED-IBBCEAS instrument and processed the related data. MC, AG, VM, EP, and JFD performed CESAM simulation chamber, NitroMAC, and FTIR experiments and processed the related experimental data. HY analyzed the results and prepared the initial manuscript. WC and JFD edited and refined the manuscript. All authors discussed and commented on the article.
The authors declare that they have no conflict of interest.
Publisher’s note: Copernicus Publications remains neutral with regard to jurisdictional claims in published maps and institutional affiliations.
This article is part of the special issue “Simulation chambers as tools in atmospheric research (AMT/ACP/GMD inter-journal SI)”. It is not associated with a conference.
CNRS-INSU is gratefully acknowledged for supporting the CESAM chamber as a national facility (http://cesam.cnrs.fr, last access: 17 August 2021). European Union's Horizon 2020 research and innovation program through the EUROCHAMP-60 2020 Infrastructure Activity under grant agreement no. 730997 is also gratefully acknowledged for distributing freely the ANIR deconvolution software as well as Mila Rodenas and the Centro de Estudios Ambientales del Mediterráneo (CEAM – Valencia) for sharing the software and providing the guidance in using it.
This research has been supported by the Agence Nationale de la Recherche (CaPPA, grant no. ANR-10-LABX-005), as well as the support in the framework of the CPER CLIMIBIO programme funded by Nord-Pas de Calais region and the Ministère de l’Enseignement Supérieur et de la Recherche.
This paper was edited by Hartmut Herrmann and reviewed by three anonymous referees.
Afif, C., Jambert, C., Michoud, V., Colomb, A., Eyglunent, G., Borbon, A., Daële, V., Doussin, J. F., and Perros, P.: NitroMAC: An instrument for the measurement of HONO and intercomparison with a long-path absorption photometer, J. Environ. Sci. (China), 40, 105–113, https://doi.org/10.1016/j.jes.2015.10.024, 2016.
Alicke, B., Platt, U., and Stutz, J.: Impact of nitrous acid photolysis on the total hydroxyl radical budget during the Limitation of Oxidant Production / Pianura Padana Produzione di Ozono study in Milan, J. Geophys. Res., 107, 8196, https://doi.org/10.1029/2000JD000075, 2002.
Barney, W. S., Wingen, L. M., Lakin, M. J., Brauers, T., Stutz, J., and Finlayson-Pitts, B. J.: Infrared absorption cross-section measurements for nitrous acid (HONO) at room temperature, J. Phys. Chem. A, 104, 1692–1699, https://doi.org/10.1021/jp9930503, 2000.
Barney, W. S., Wingen, L. M., Lakin, M. J., Brauers, T., Stutz, J., and Finlayson-Pitts, B. J.: Infrared absorption cross-section measurements for nitrous acid (HONO) at room temperature, J. Phys. Chem. A, 105, 4166–4166, https://doi.org/10.1021/jp010734d, 2001.
Brust, A. S., Becker, K. H., Kleffmann, J., and Wiesen, P.: UV absorption cross sections of nitrous acid, Atmos Environ., 34, 13–19, https://doi.org/10.1016/S1352-2310(99)00322-2, 2000.
Chen, W., Maamary, R., Cui, X., Wu, T., Fertein, E., Dewaele, D., Cazier, F., Zha, Q., Xu, Z., Wang, T., Wang, Y., Zhang, W., Gao, X., Liu, W., and Dong, F.: Photonic Sensing of Environmental Gaseous Nitrous Acid (HONO): Opportunities and Challenges, in The Wonder of Nanotechnology: Quantum Optoelectronic Devices and Applications, edited by: Razeghi, M., Esaki, L., and von Klitzing, K., SPIE Press, Bellingham, WA, pp. 693–737, ISBN 978-0-8194-9596-9, 2013.
Duan, J., Qin, M., Ouyang, B., Fang, W., Li, X., Lu, K., Tang, K., Liang, S., Meng, F., Hu, Z., Xie, P., Liu, W., and Häsler, R.: Development of an incoherent broadband cavity-enhanced absorption spectrometer for in situ measurements of HONO and NO2, Atmos. Meas. Tech., 11, 4531–4543, https://doi.org/10.5194/amt-11-4531-2018, 2018.
Dunlea, E. J., Herndon, S. C., Nelson, D. D., Volkamer, R. M., San Martini, F., Sheehy, P. M., Zahniser, M. S., Shorter, J. H., Wormhoudt, J. C., Lamb, B. K., Allwine, E. J., Gaffney, J. S., Marley, N. A., Grutter, M., Marquez, C., Blanco, S., Cardenas, B., Retama, A., Ramos Villegas, C. R., Kolb, C. E., Molina, L. T., and Molina, M. J.: Evaluation of nitrogen dioxide chemiluminescence monitors in a polluted urban environment, Atmos. Chem. Phys., 7, 2691–2704, https://doi.org/10.5194/acp-7-2691-2007, 2007.
Finlayson-Pitts, B. J. and Pitts Jr., J. N.: Chemistry of the Lower and Upper Atmosphere: Theory, experiments and applications, Academic Press, New York, NY, USA, https://doi.org/10.1016/B978-0-12-257060-5.X5000-X, 2000.
Fuchs, H., Ball, S. M., Bohn, B., Brauers, T., Cohen, R. C., Dorn, H.-P., Dubé, W. P., Fry, J. L., Häseler, R., Heitmann, U., Jones, R. L., Kleffmann, J., Mentel, T. F., Müsgen, P., Rohrer, F., Rollins, A. W., Ruth, A. A., Kiendler-Scharr, A., Schlosser, E., Shillings, A. J. L., Tillmann, R., Varma, R. M., Venables, D. S., Villena Tapia, G., Wahner, A., Wegener, R., Wooldridge, P. J., and Brown, S. S.: Intercomparison of measurements of NO2 concentrations in the atmosphere simulation chamber SAPHIR during the NO3Comp campaign, Atmos. Meas. Tech., 3, 21–37, https://doi.org/10.5194/amt-3-21-2010, 2010.
Gherman, T., Venables, D. S., Vaughan, S., Orphal, J., and Ruth, A. A.: Incoherent broadband cavity-enhanced absorption spectroscopy in the near-ultraviolet: Application to HONO and NO2, Environ. Sci. Technol., 42, 890–895, https://doi.org/10.1021/es0716913, 2008.
Gratien, A., Nilsson, E., Doussin, J. F., Johnson, M. S., Nielsen, C. J., Stenstrøm, Y., and Picquet-Varrault B.: UV and IR Absorption Cross-sections of HCHO, HCDO, and DCDO, J. Phys. Chem. A, 111, 11506–11513, https://doi.org/10.1021/jp074288r, 2007.
Gratien, A., Lefort, M., Picquet-Varrault, B., Orphal, J., Doussin, J. F., and Flaud, J. M.: Experimental intercomparison of the absorption cross-sections of nitrous acid (HONO) in the ultraviolet and mid-infrared spectral regions, J. Quant. Spectrosc. Radiat. Transf., 110, 256–263, https://doi.org/10.1016/j.jqsrt.2008.11.003, 2009.
Griffith S. M., Hansen, R. F., Dusanter, S., Michoud, V., Gilman, J. B., Kuster, W. C., Veres, P., Graus, M., Warneke, C., Gouw, J. A. de, Young, C., Washenfelder, R., Brown, S. S., Volkamer, R., Stutz, J. S., Flynn, J. H., Grossberg, N., Lefer, B., Alvarez, S. L., Rappenglueck, B., Mielke, L. H., Osthoff, H. D., and Steven, P. S.: Measurements of hydroxyl and hydroperoxy radicals during CalNex-LA: Model comparisons and radical budgets, J. Geophys. Res.-Atmos., 121, 4211–4232, https://doi.org/10.1002/2015JD024358, 2016.
Harris, G. W., Carter, W. P. L., Winer, A. M., Pitts, A. M. J., Platt, U., and Perner, D.: Observations of nitrous acid in the Los Angeles atmospheres and implication for prediction of ozone-precursor relationship, Environ. Sci. Technol., 16, 414–419, https://doi.org/10.1021/es00101a009, 1982.
Huang, G., Zhou, X., Deng, G., Qiao, H., and Civerolo, K.: Measurements of atmospheric nitrous acid and nitric acid, Atmos. Environ., 36, 2225–2235, https://doi.org/10.1016/S1352-2310(02)00170-X, 2002.
Jordan, N. and Osthoff, H. D.: Quantification of nitrous acid (HONO) and nitrogen dioxide (NO2) in ambient air by broadband cavity-enhanced absorption spectroscopy (IBBCEAS) between 361 and 388 nm, Atmos. Meas. Tech., 13, 273–285, https://doi.org/10.5194/amt-13-273-2020, 2020.
Kennedy, O. J., Ouyang, B., Langridge, J. M., Daniels, M. J. S., Bauguitte, S., Freshwater, R., McLeod, M. W., Ironmonger, C., Sendall, J., Norris, O., Nightingale, R., Ball, S. M., and Jones, R. L.: An aircraft based three channel broadband cavity enhanced absorption spectrometer for simultaneous measurements of NO3, N2O5 and NO2, Atmos. Meas. Tech., 4, 1759–1776, https://doi.org/10.5194/amt-4-1759-2011, 2011.
Kleffmann, J.: Daytime sources of nitrous acid (HONO) in the atmospheric boundary layer, Chem. Phys. Chem., 8, 1137–1144, https://doi.org/10.1002/cphc.200700016, 2007.
Kleffmann, J., Lörzer, J. C., Wiesen, P., Kern, C., Trick, S., Volkamer, R., Rodenas, M., and Wirtz, K.: Intercomparison of the DOAS and LOPAP techniques for the detection of nitrous acid (HONO), Atmos. Environ., 40, 3640–3652, https://doi.org/10.1016/j.atmosenv.2006.03.027, 2006.
Lammel, G. and Cape, J. N.: Nitrous acid and nitrite in the atmosphere, Chem. Soc. Rev., 25, 361–369, https://doi.org/10.1039/CS9962500361, 1996.
Li, X., Rohrer, F., Hofzumahaus, A., Brauers, T., Häseler, R., Bohn, B., Broch, S., Fuchs, H., Gomm, S., Holland, F., Jäger, J., Kaiser, J., Keutsch, F. N., Lohse, I., Lu, K., Tillmann, R., Wegener, R., Wolfe, G. M., Mentel, T. F., Kiendler-Scharr, A., and Wahner, A.: Missing Gas-Phase Source of HONO Inferred from Zeppelin Measurements in the Troposphere, Science, 344, 292–296, https://doi.org/10.1126/science.1248999, 2014.
Liu, J., Li, X., Yang, Y., Wang, H., Kuang, C., Zhu, Y., Chen, M., Hu, J., Zeng, L., and Zhang, Y.: Sensitive Detection of Ambient Formaldehyde by Incoherent Broadband Cavity Enhanced Absorption Spectroscopy, Anal. Chem., 92, 2697–2705, https://doi.org/10.1021/acs.analchem.9b04821, 2020.
Meller, R. and Moortgat, G. K.: Temperature dependence of the absorption cross sections of formaldehyde between 223 and 323 K in the wavelength range 225–375 nm, J. Geophys. Res.-Atmos., 105, 7089–7101, https://doi.org/10.1029/1999JD901074, 2000.
Michoud, V., Kukui, A., Camredon, M., Colomb, A., Borbon, A., Miet, K., Aumont, B., Beekmann, M., Durand-Jolibois, R., Perrier, S., Zapf, P., Siour, G., Ait-Helal, W., Locoge, N., Sauvage, S., Afif, C., Gros, V., Furger, M., Ancellet, G., and Doussin, J. F.: Radical budget analysis in a suburban European site during the MEGAPOLI summer field campaign, Atmos. Chem. Phys., 12, 11951–11974, https://doi.org/10.5194/acp-12-11951-2012, 2012.
Michoud, V., Colomb, A., Borbon, A., Miet, K., Beekmann, M., Camredon, M., Aumont, B., Perrier, S., Zapf, P., Siour, G., Ait-Helal, W., Afif, C., Kukui, A., Furger, M., Dupont, J. C., Haeffelin, M., and Doussin, J. F.: Study of the unknown HONO daytime source at a European suburban site during the MEGAPOLI summer and winter field campaigns, Atmos. Chem. Phys., 14, 2805–2822, https://doi.org/10.5194/acp-14-2805-2014, 2014.
Miles, R. B., Lempert, W. R., and Forkey, J. N.: Laser Rayleigh scattering, Meas. Sci. Technol., 12, R33–R51, https://doi.org/10.1088/0957-0233/12/5/201, 2001.
Min, K.-E., Washenfelder, R. A., Dubé, W. P., Langford, A. O., Edwards, P. M., Zarzana, K. J., Stutz, J., Lu, K., Rohrer, F., Zhang, Y., and Brown, S. S.: A broadband cavity enhanced absorption spectrometer for aircraft measurements of glyoxal, methylglyoxal, nitrous acid, nitrogen dioxide, and water vapor, Atmos. Meas. Tech., 9, 423–440, https://doi.org/10.5194/amt-9-423-2016, 2016.
Pinto, J. P., Dibb, J., Lee, B. H., Rappenglück, B., Wood, E. C., Levy, M., Zhang, R.-Y., Lefer, B., Ren, X.-R., Stutz, J., Tsai, C., Ackermann, L., Golovko, J., Herndon, S. C., Oakes, M., Meng, Q.-Y., Munger, J. W., Zahniser, M., and Zheng, J.: Intercomparison of Field Measurements of HONO during SHARP, J. Geophys. Res.-Atmos., 119, 5583–5601, https://doi.org/10.1002/2013JD020287, 2014.
Reed, C., Brumby, C. A., Crilley, L. R., Kramer, L. J., Bloss, W. J., Seakins, P. W., Lee, J. D., and Carpenter, L. J.: HONO measurement by differential photolysis, Atmos. Meas. Tech., 9, 2483–2495, https://doi.org/10.5194/amt-9-2483-2016, 2016.
Ródenas, M., Munoz, A., Alacreu, F., Brauers, T., Dorn, H. P., Kleffmann, J., and Bloss, W.: Assessment of HONO Measurements: The FIONA Campaign at EUPHORE, in: Disposal of Dangerous Chemicals in Urban Areas and Mega Cities: Role of Oxides and Acids of Nitrogen in Atmospheric Chemistry, edited by: Barnes, I. and Rudzinski, K. J., NATO Science for Peace and Security Series C: Environmental Security, Springer, Dordrecht, the Netherlands, 45–58, https://doi.org/10.1007/978-94-007-5034-0_4, 2013.
Ródenas, M., Picquet-Varrault, B., and Munoz, A.: ANIR, a tool for analysis of Infrared spectra, EGU General Assembly 2020, Online, 4–8 May 2020, EGU2020-17199, https://doi.org/10.5194/egusphere-egu2020-17199, 2020.
Sigsby, J. E., Black, F. M., Bellar, T. A., and Klosterman, D. L.: Chemiluminescent method for analysis of nitrogen containing compounds in mobile source emissions (NO, NO2 and NH3), Environ. Sci. Technol., 7, 51–54, https://doi.org/10.1021/es60073a001, 1973.
Sörgel, M., Regelin, E., Bozem, H., Diesch, J.-M., Drewnick, F., Fischer, H., Harder, H., Held, A., Hosaynali-Beygi, Z., Martinez, M., and Zetzsch, C.: Quantification of the unknown HONO daytime source and its relation to NO2, Atmos. Chem. Phys., 11, 10433–10447, https://doi.org/10.5194/acp-11-10433-2011, 2011.
Spataro, F. and Ianniello, A.: Sources of atmospheric nitrous acid: State of the science, current research needs, and future prospects, J. Air Waste Manage. Assoc., 64, 1232–1250, https://doi.org/10.1016/j.atmosenv.2012.02.041, 2014.
Stutz, J., Kim, E. S., Platt, U., Bruno, P., Perrino, C., and Febo, A.: UV-visible absorption cross sections of nitrous acid, J. Geophys. Res., 105, 14585–14592, https://doi.org/10.1029/2000JD900003, 2000.
Stutz, J., Alicke, B., Ackermann, R., Geyer, A., Wang, S., White, A. B., Williams, E. J., Spicer, C. W., and Fast, J. D.: Relative humidity dependence of HONO chemistry in urban areas, J. Geophys. Res., 109, D03307, https://doi.org/10.1029/2003JD004135, 2004.
Stutz, J., Oh, H. J., Whitlow, S. I., Anderson, C., Dibbb, J. E., Flynn, J. H., Rappengluck, B., and Lefer, B.: Simultaneous DOAS and mist-chamber IC measurements of HONO in Houston, TX, Atmos. Environ., 44, 4090–4098, https://doi.org/10.1016/j.atmosenv.2009.02.003, 2010.
Stutz, J., Wong, K. W., and Tsai, C.: Field Observation of Daytime HONO Chemistry and its Impact on the OH Radical Budget, in: Disposal of Dangerous Chemicals in Urban Areas and Mega Cities, edited by: Barnes, I., and Rudzinski, K. J., NATO Science for Peace and Security Series C: Environmental Security, Springer, Dordrecht, the Netherlands, https://doi.org/10.1007/978-94-007-5034-0_1, 2013.
Tidona, R. J., Nizami A. A., and Cernansky, N. P.: Reducing Interference Effects in the Chemiluminescent Measurement of Nitric Oxides from Combustion Systems, J. Air Waste Manag. Assoc., 38, 806–811, https://doi.org/10.1080/08940630.1988.10466421, 1988.
VandenBoer, T. C., Brown, S. S., Murphy, J. G., Keene, W. C., Young, C. J., Pszenny, A. A. P., Kim, S., Warneke, C., de Gouw, J. A., Maben, J. R., Wagner, N. L., Riedel, T. P., Thornton, J. A., Wolfe, D. E., Dube, W. P., Ozturk, F., Brock, C. A., Grossberg, N., Lefer, B., Lerner, B., Middlebrook, A. M., and Roberts, J. M.: Understanding the role of the ground surface in HONO vertical structure: High resolution vertical profiles during NACHTT-11, J. Geophys. Res., 118, 10155–10171, https://doi.org/10.1002/jgrd.50721, 2013.
Varma, R. M., Venables, D. S., Ruth, A. A., Heitmann, U., Schlosser, E., and Dixneuf, S.: Long optical cavities for open-path monitoring of atmospheric trace gases and aerosol extinction, Appl. Opt., 48, B159–B171, https://doi.org/10.1364/AO.48.00B159, 2009.
Villena, G., Bejan, I., Kurtenbach, R., Wiesen, P., and Kleffmann, J.: Development of a new Long Path Absorption Photometer (LOPAP) instrument for the sensitive detection of NO2 in the atmosphere, Atmos. Meas. Tech., 4, 1663–1676, https://doi.org/10.5194/amt-4-1663-2011, 2011.
Villena, G., Bejan, I., Kurtenbach, R., Wiesen, P., and Kleffmann, J.: Interferences of commercial NO2 instruments in the urban atmosphere and in a smog chamber, Atmos. Meas. Tech., 5, 149–159, https://doi.org/10.5194/amt-5-149-2012, 2012.
Vogel, B., Vogel, H., Kleffmann, J., and Kurtenbach, R.: Measured and simulated vertical profiles of nitrous acid-Part II. Model simulations and indications for a photolytic source, Atmos. Environ., 37, 2957–2966, https://doi.org/10.1016/S1352-2310(03)00243-7, 2003.
Voigt, S., Orphal, J., and Burrows, J. P.: The temperature and pressure dependence of the absorption cross-sections of NO2 in the 250–800 nm region measured by Fourier-transform spectroscopy, J. Photochem. Photobiol. A: Chem., 149, 1–7, https://doi.org/10.1016/S1010-6030(01)00650-5, 2002.
Wang, J., Doussin, J. F., Perrier, S., Perraudin, E., Katrib, Y., Pangui, E., and Picquet-Varrault, B.: Design of a new multi-phase experimental simulation chamber for atmospheric photosmog, aerosol and cloud chemistry research, Atmos. Meas. Tech., 4, 2465–2494, https://doi.org/10.5194/amt-4-2465-2011, 2011.
Washenfelder, R. A., Attwood, A. R., Flores, J. M., Zarzana, K. J., Rudich, Y., and Brown, S. S.: Broadband cavity-enhanced absorption spectroscopy in the ultraviolet spectral region for measurements of nitrogen dioxide and formaldehyde, Atmos. Meas. Tech., 9, 41–52, https://doi.org/10.5194/amt-9-41-2016, 2016.
Wu, T., Chen, W., Fertein, E., Cazier, F., Dewaele, D., and Gao, X.: Development of an open-path incoherent broadband cavity-enhanced spectroscopy based instrument for simultaneous measurement of HONO and NO2 in ambient air, Appl. Phys. B, 106, 501–509, https://doi.org/10.1007/s00340-011-4818-3, 2012.
Wu, T., Zha, Q., Chen, W., Xu, Z., Wang, T., and He, X.: Development and deployment of a cavity enhanced UV-LED spectrometer for measurements of atmospheric HONO and NO2 in Hong Kong, Atmos. Environ., 95, 544–551, https://doi.org/10.1016/j.atmosenv.2014.07.016, 2014.
Yi, H., Maamary, R., Gao, X., Sigrist, M. W., Fertein, E., and Chen, W.: Short-lived species detection of nitrous acid by external-cavity quantum cascade laser based quartz-enhanced photoacoustic absorption spectroscopy, Appl. Phys. Lett., 106, 101109, https://doi.org/10.1063/1.4914896, 2015.
Yi, H., Wu, T., Wang, G., Zhao, W., Fertein, E., Coeur, C., Gao, X., Zhang, W., and Chen, W.: Sensing atmospheric reactive species using light emitting diode by incoherent broadband cavity enhanced absorption spectroscopy, Opt. Express, 24, A781–A790, https://doi.org/10.1364/OE.24.00A781, 2016.
Young, C. J., Washenfelder, R. A., Roberts, J. M., Mielke, L. H., Osthoff, H. D., Tsai, C., Pikelnaya, O., Stutz, J., Veres, P. R., Cochran, A. K., VandenBoer, T. C., Flynn, J., Grossberg, N., Haman, C. L., Lefer, B., Stark, H., Graus, M., de Gouw, J., Gilman, J. B., Kuster, W. C., and Brown, S. S.: Vertically resolved measurements of nighttime radical reservoirs in Los Angeles and their contribution to the urban radical budget, Environ. Sci. Technol., 46, 10965–10973, https://doi.org/10.1021/es302206a, 2012.