the Creative Commons Attribution 4.0 License.
the Creative Commons Attribution 4.0 License.
 | 30 Aug 2021
Validation of a new cavity ring-down spectrometer for measuring tropospheric gaseous hydrogen chloride
Teles C. Furlani
Patrick R. Veres
Kathryn E. R. Dawe
J. Andrew Neuman
Steven S. Brown
Trevor C. VandenBoer
Reliable, sensitive, and widely available hydrogen chloride (HCl) measurements are important for understanding oxidation in many regions of the troposphere. We configured a commercial HCl cavity ring-down spectrometer (CRDS) for sampling HCl in the ambient atmosphere and developed validation techniques to characterize the measurement uncertainties. The CRDS makes fast, sensitive, and robust measurements of HCl in a high-finesse optical cavity coupled to a laser centred at 5739 cm−1. The accuracy was determined to reside between 5 %–10 %, calculated from laboratory and ambient air intercomparisons with annular denuders. The precision and limit of detection (3σ) in the 0.5 Hz measurement were below 6 and 18 pptv, respectively, for a 30 s integration interval in zero air. The response time of this method is primarily characterized by fitting decay curves to a double exponential equation and is impacted by inlet adsorption/desorption, with these surface effects increasing with relative humidity and decreasing with decreasing HCl mixing ratios. The minimum 90 % response time was 10 s and the equilibrated response time for the tested inlet was 2–6 min under the most and least optimal conditions, respectively. An intercomparison with the EPA compendium method for quantification of acidic atmospheric gases showed good agreement, yielding a linear relationship statistically equivalent to unity (slope of 0.97 ± 0.15). The CRDS from this study can detect HCl at atmospherically relevant mixing ratios, often performing comparably or better in sensitivity, selectivity, and response time than previously reported HCl detection methods.
- Article
(425 KB) - Full-text XML
-
Supplement
(668 KB) - BibTeX
- EndNote


Halogenated compounds that participate in catalytic cycles in the atmosphere have major impacts on atmospheric chemistry. Chlorine-containing species have long been known to catalytically destroy stratospheric ozone (Solomon, 1999) and can have similar impacts on tropospheric ozone in polar regions (Simpson et al., 2007, 2015). In particular, early-morning oxidation in the troposphere can be influenced heavily by chlorine atoms released by photolabile chlorine species (Osthoff et al., 2008; Thornton et al., 2010; Young et al., 2012, 2014). It is estimated that reactions involving chlorine atoms account for 14 %–27 % of global tropospheric oxidation of abundant volatile organic compounds (VOCs) (Sherwen et al., 2016).
The role of chlorine chemistry in the troposphere remains uncertain in part due to a lack of a complete understanding of the contribution of chlorine reservoir species to the tropospheric chlorine inventory (Osthoff et al., 2008; Young et al., 2014). Sources of inorganic chlorine to the troposphere are important because many of them are photochemically active (e.g., ClNO2). A near-complete budget of inorganic tropospheric chlorine from aircraft transects of polluted North American continental outflow during the WINTER campaign demonstrated that hydrogen chloride (HCl) makes up 48 %–62 % of total inorganic chlorine and approximately 98 % of total gaseous inorganic chlorine (Haskins et al., 2018). Troposphere HCl levels are typically between 10 and 1000 parts per trillion by volume (pptv) (e.g., Crisp et al., 2014; Haskins et al., 2018; Young et al., 2013). Elevated levels of HCl are typically found near marine environments polluted with NOx, where reactions involving the chloride in sea spray aerosols can be a major source of chlorine to the troposphere (Crisp et al., 2014; Finlayson-Pitts et al., 1989; Haskins et al., 2018; Wang et al., 2019).
HCl is directly emitted to the atmosphere predominantly from volcanic activity, biomass burning, and industrial sources (Butz et al., 2017; Crisp et al., 2014; Keene et al., 1999). HCl is also produced through heterogeneous acid displacement reactions of strong acids, such as nitric acid, with particulate chloride (pCl−) (Bondy et al., 2017; Clegg and Brimblecombe, 1985; Gard et al., 1998; Valach, 1967; Wang et al., 2019):
where M represents a cation in a chloride salt (often sodium). Elevated levels of chlorine atoms may also be present in both indoor and outdoor environments due to the emission of photolabile reactive chlorine compounds (Dawe et al., 2019; Mattila et al., 2020; Osthoff et al., 2008; Young et al., 2014, 2019).
Secondary production of HCl predominantly occurs via the reaction of chlorine atoms with methane or VOCs by hydrogen abstraction:
The loss of gas-phase HCl occurs predominantly through wet or dry deposition, which are terminal sinks for tropospheric chlorine (Wang et al., 2019), with minor loss by reaction with the hydroxyl radical (OH) to re-form chlorine atoms:
The balance between loss and formation of chlorine atoms from HCl is highly dependent on factors such as the presence of pCl− and NOx (NOx = NO + NO2) and the HCl deposition rate (Finlayson-Pitts et al., 1989; Roberts et al., 2008).
Measuring HCl in the gas phase is challenging as it readily adsorbs to surfaces. Methods for atmospheric HCl detection must be sensitive, robust, and selective and address HCl interactions with instrument surfaces. Measurement techniques based on mass spectrometry have been developed for the detection of HCl in both the stratosphere and troposphere (e.g., Huey et al., 1996; Marcy et al., 2004). Other methods include scrubbing ambient air using an annular denuder and/or tandem mist chambers to collect HCl, followed by offline analysis such as ion chromatography (IC) (Keene et al., 2007, 2009; United States Environmental Protection Agency, 1999; Young et al., 2013). Online detection methods such as chemical ionization time of flight mass spectrometry (CI-ToF-MS) (Crisp et al., 2014), negative ion proton transfer chemical ionization mass spectrometry (NI-PT-CIMS) (Veres et al., 2008), and negative mode atmospheric pressure chemical ionization coupled to triple quadrupole mass spectrometry (APCI-MS-MS) (Karellas et al., 2003) have been shown to be reliable and sensitive methods for HCl detection. Limitations to these existing HCl measurement techniques include some or all of the following: detection limits that are not suitable for the low level of HCl in the troposphere, slow time response, lack of portability, and calibration challenges. Spectroscopic techniques offer distinct advantages over some previous methods. Spectroscopic techniques for measuring atmospheric HCl reported by Hagen et al. (2014) and Wilkerson et al. (2021) have shown precedent for fast time response as well as sensitive, selective, and robust detection. The portability and fast time response for instruments is of great importance for spatial resolution and is therefore a key factor for field deployment.
Measurements of HCl are typically calibrated using HCl from permeation devices and or standards in compressed gas cylinders. Method validation for HCl measurements are rare but can reduce these uncertainties (Hagen et al., 2014; Wilkerson et al., 2021). In this paper we demonstrate the versatility and validation of a new commercial cavity ring-down spectrometer (CRDS) for in situ atmospheric gas-phase HCl measurements. First, we compare this CRDS with existing HCl measurement techniques through lab and field intercomparisons. We then describe and characterize surface effects and recommend inlet configurations for best practices when conducting ambient sampling.
2.1 Chemicals
Reagent grade hydrochloric acid (HCl, 12 M) was used in permeation device construction (see Sect. 2.3). Potassium hydroxide (KOH) pellets were used to create a scrubbing solution for permeation device gas collection. Commercially available reagents were obtained from Sigma-Aldrich (Oakville, Ontario, Canada). Nitrogen (grade 4.8) and Ultra Zero Air (grade 5.0) gases were from Praxair (Toronto, Ontario, Canada). Experiments used deionized water generated by a Barnstead Infinity Ultrapure Water System (Thermo Fisher Scientific, Waltham, Massachusetts, USA; 18.2 MΩ cm−1). The annular denuder coating solution was prepared with reagent grade (> 95.5 %) sodium carbonate (Sigma-Aldrich, St. Louis, Missouri, USA), reagent grade glycerol (Sigma-Aldrich, St. Louis, Missouri, USA), HPLC grade methanol (Fisher Chemicals, Ottawa, Ontario, Canada), and 18.2 MΩ cm−1 deionized water. The eluent for the annular denuder IC analysis was prepared from a sodium hydroxide solution (NaOH, 50 % , Thermo Fisher Scientific, Sunnyvale, California, USA). IC calibration standards were prepared through serial dilution of a mixed anion standard concentrate (Thermo Fisher Scientific, Dionex Seven-Anion II, P/N: 057590).
2.2 Cavity ring-down spectrometer (CRDS)
The Picarro G2108 Hydrogen Chloride Gas Analyzer system was used for all analyses. The basic operating principles of this CRDS are similar to analogous Picarro greenhouse gas instruments that have been described in detail by Crosson (2008). The CRDS consists of a tunable laser, a wavelength monitor, and a heated optical cavity (80 ∘C). All components of this analyzer and internal stainless-steel fittings are contained within a heat-regulated metal case maintained at 45 ∘C. The laser radiation (1742 nm, 5739 cm−1) is directed by a fibre optic cable to the wavelength monitor and optical cavity. The first overtone (2-0 absorption band) of HCl is easily discernable from other absorbing species (e.g., H2O, CH4), has a relatively high intensity compared to the fundamental absorption transition, and is accessible to near-infrared (IR) diode laser light sources. The optical cavity is fitted with three highly reflective dielectric-coated fused silica mirrors (R > 99.995 %; ring-down time constant of 53 µs, which is equivalent to a path length of 16 km) oriented in an acute triangular arrangement supported by an invar housing. The reflectivity of the mirrors is measured from the laser signal loss in an analyte-free optical cavity under inert gas flow. The CRDS flow rate is 2 L min−1 and the cavity is held at a reduced pressure of 18.70 ± 0.02 kPa (140 Torr) thermostated to 80.000 ± 0.005 ∘C. One mirror is mounted on a piezoelectric actuator to achieve optical resonance between the laser frequency and the longitudinal modes of the cavity. The laser is shut off rapidly (< 1 µs) once resonance is achieved. A photodetector monitors the decay of the photons exiting the cavity through another mirror. Custom electronics digitize the signal for fitting of an exponential decay; the time constant of the decay, τ, is converted to absorbance, α, using the expression
where c is the speed of light. The instrument measures 30 specific frequencies within ∼ 1 cm−1 centred at 5739 cm−1 to fit the absorption spectra of trace species in this region (see Fig. S2 in the Supplement). HCl, H2O, and CH4 mixing ratios are reported every 2 s, though the true time response of the measurement method is limited by surface effects (see Sect. 3.4). Gaseous inorganic chlorine reservoir species (e.g., ClNO2) cannot thermally dissociate under the cavity (80 ∘C) conditions (Thaler et al., 2011). The instrument zero measurement drift is reduced by a high-precision distributed feedback laser centred at 5739.2625 cm−1 coupled with a custom-designed wavelength monitor to determine the frequency axis of each spectrogram. To mitigate particulate matter optical extinction and surface deposition on the high reflectivity mirrors, two high efficiency particulate air (HEPA) filters are placed upstream of the cavity, contained within the 45 ∘C heat-regulated compartment.
2.3 In-house HCl permeation device validation
The in-house assembly of HCl permeation devices (PDs) is described in detail in Lao et al. (2020). Briefly, 200 µL of 12 M aqueous HCl solution was pipetted into a 7.62 cm perfluoroalkoxy (PFA) tube (3 mm i.d. with 1 mm thickness) plugged at both ends with porous polytetrafluoroethylene (PTFE) (1 cm length by 3.17 mm o.d.). The polymers allow a consistent mass of HCl to permeate at a given temperature and pressure. An aluminum block that was temperature-controlled using a cartridge heater (Omega™; CIR-2081/120V, Saint-Eustache, Quebec, Canada) housed the PD and was regulated to 60.0 ± 0.1 ∘C by a process controller. Dry N2 flowed through a PFA tube (1.27 cm o.d.) in the block containing the PD. Stable flows of 49 ± 2 standard cubic centimetres per minute (sccm) through the oven were maintained with a 50 µm diameter critical orifice (Lenox laser, Glen Arm, Maryland, USA, 15 psi; SS-4-VCR-2-50). Flows were measured using a DryCal Definer 220 (Mesa Labs, Lakewood, Colorado, USA). The mass emission rate of HCl from the PD was quantified by scrubbing into a 25 mL glass impinger containing 1 mM KOH over 24 h followed by analysis using IC with conductivity detection (CD). Mass emission rates for the PD were determined as 140 ± 18 ng min−1 (n = 3, ±1σ) at 60 ∘C.
2.4 Laboratory intercomparison
A laboratory intercomparison between the CRDS and offline-measured HCl scrubbed into a basic solution of 100 mM KOH was performed by delivering gaseous HCl from the permeation device to the sampling systems. The 140 ng min−1 of HCl in dry N2 from the PD was mixed into a zero air dilution flow of 2.1 to 8.0 L min−1 to provide standard addition HCl mixing ratios that ranged from 12 to 45 ppbv.
The dilution flow was maintained using a 10 L min−1 mass flow controller (GM50A, MKS instruments, Andover, Massachusetts, USA). All inlet lines and fittings were kept at ambient temperature (∼ 25 ∘C) and were made of PFA unless stated otherwise. The inlet mixing line between the PD emissions and the humidified dilution flow was 3.17 mm i.d. and 45 cm in length. Residence times for HCl in the sampling line ranged from 0.02 to 0.08 s. To vary relative humidity (RH), a controlled flow of zero air was directed into a glass impinger at room temperature containing deionized water to yield a water-saturated air stream. The humidified flow was passed through a 2 µm Teflon filter (TISCH scientific, North Bend, Ohio, USA) in a PFA holder to prevent any aqueous droplets from entering the experimental lines. The RH was set by mixing with dry zero air to generate 0 %, 20 %, 50 %, and 80 % RH values.
2.5 Ambient intercomparison
An ambient intercomparison was undertaken by measuring outdoor air with the CRDS in parallel with sodium carbonate-coated annular denuders. A total of 11 denuder samples were collected alongside continuous CRDS observations, each for approximately 24 h between 4–11 April 2019. The measurement site was the Air Quality Research Station, located on the roof of the Petrie Science and Engineering Building at York University in Toronto, Ontario, Canada (43.7738∘ N, 79.5071∘ W; 220 m above sea level). All indoor inlet lines and fittings were kept at room temperature while the outdoor temperature ranged from −2 to 14 ∘C. All inlet lines and fittings were made of PFA unless stated otherwise. A full schematic of the sampling apparatus indicating the separation between the outdoor and indoor inlet positions is provided in Fig. S5. A 22 L min−1 sampling flow was pulled through a Teflon-Coated Aluminum Cyclone (URG Corporation, Chapel Hill, North Carolina, USA) with a 2.5 µm cutoff for particulate matter. The inlet lines were such that each sampling setup collected HCl at equal residence time to ensure equivalent wall losses of HCl. The shared inlet line was 4.65 m in length and had an i.d. of 4.76 mm. The flow was split between the 1.5 m denuder sampling line (20 L min−1) and the 0.15 m CRDS sampling line (2 L min−1), yielding a 0.375 s residence time for both methods. The denuder line flow was equally divided into two multichannel etched glass annular denuders (URG Corporation, Chapel Hill, North Carolina, USA, 4 channel, 242 mm length, URG-2000-30x242-4CSS) at 10 L min−1. The denuders collected HCl in parallel to each other with flows controlled using two separate 10 L min−1 mass flow controllers (GM50A, MKS instruments). Denuders were coated with a solution of 2 % sodium carbonate and 0.1 % glycerol in a solution of 1 : 1 methanol:water. A 15 mL aliquot of coating solution was dispensed into a denuder and two polypropylene caps affixed. The sealed denuders were inverted and rotated for a few minutes to ensure an even coating. The excess coating solution was decanted and the denuder was dried for 15 min with 2 L min−1 of zero air. After sampling, denuders were extracted with two aliquots of 5.00 mL deionized water, following the same sealing and inversion procedure, for a total extraction volume of 10.00 mL. Extracts were collected into a 15 mL polypropylene tube for storage at 4 ∘C until analysis. Instances of flagged instrument errors in the CRDS data during ambient observations were removed as standard practice in quality control procedures (see Fig. S3). The loss of observational data during such periods corresponds to a negative bias. The CRDS data loss during a given denuder sampling period was included in setting the overall measurement error when intercomparing measurements. The dataset can be found in Furlani et al. (2021).
2.6 Ion chromatography analysis
Samples collected into an impinger from the HCl PD were analyzed as the chloride anion by IC-CD using an ICS-2100 (Thermo Fisher Scientific, Sunnyvale, California, USA) according to the method described in Place et al. (2018). Annular denuder extracts were analyzed by IC-CD using an ICS-6000 (Thermo Fisher Scientific, Sunnyvale, California, USA). Details of both separation methods can be found in the SI. Chloride was quantified using external calibration with a five-point calibration curve. Two check standards, located at the high and low ends of the working range, were used to evaluate the accuracy of quantification.
3.1 Suitability for atmospheric measurements
The selectivity of this CRDS analyzer arises from monitoring a high-intensity spectral line (5739.2625 cm−1). The absorption used by this instrument is suitable for HCl measurements in the ambient atmosphere because abundant atmospheric gaseous species such as CO, CO2, NOx, and N2O (Gordon et al., 2017; Kochanov et al., 2019) do not have major absorption features in the same region. Absorption features of H2O and CH4 in this spectral region are part of the fitting parameters used to determine number densities of HCl, as described in Sect. 2.2. Most organic and inorganic compounds commonly found at trace levels in the atmosphere do not absorb strongly in this region (Gordon et al., 2017; Kochanov et al., 2019). For these compounds to interfere with the CRDS measurement, their mixing ratios would need to be very high (> 10 parts per million by volume, ppmv). Under conditions where the peak shape is compromised by the presence of interfering absorbing species or instrument instabilities (e.g., cavity pressure fluctuations), the instrument fitting is interrupted and the “bad” data are flagged, thereby allowing simple quality control (see Fig. S3).
The limit of detection (LOD) of the CRDS analyzer is suitable for expected HCl levels in the atmosphere. Instrument LODs were calculated as three times the Allan–Werle deviation (Fig. 1; Hagen et al., 2014) when overflowing a 15 cm inlet (3.17 mm i.d.) with zero air directed into the CRDS for ∼ 10 h. The LODs determined in the CRDS measurements for 2 s, 30 s, 5 min, and 1 h integration times were 66, 18, 5, and 2 pptv, respectively. Similarly, precision was determined from the Allan–Werle deviation in the blank over the same 10 h of zero air sampling. Precision in a 2 s, 30 s, 5 min, and 1 h integration time was 22, 6, 2, and 0.8 pptv, respectively.
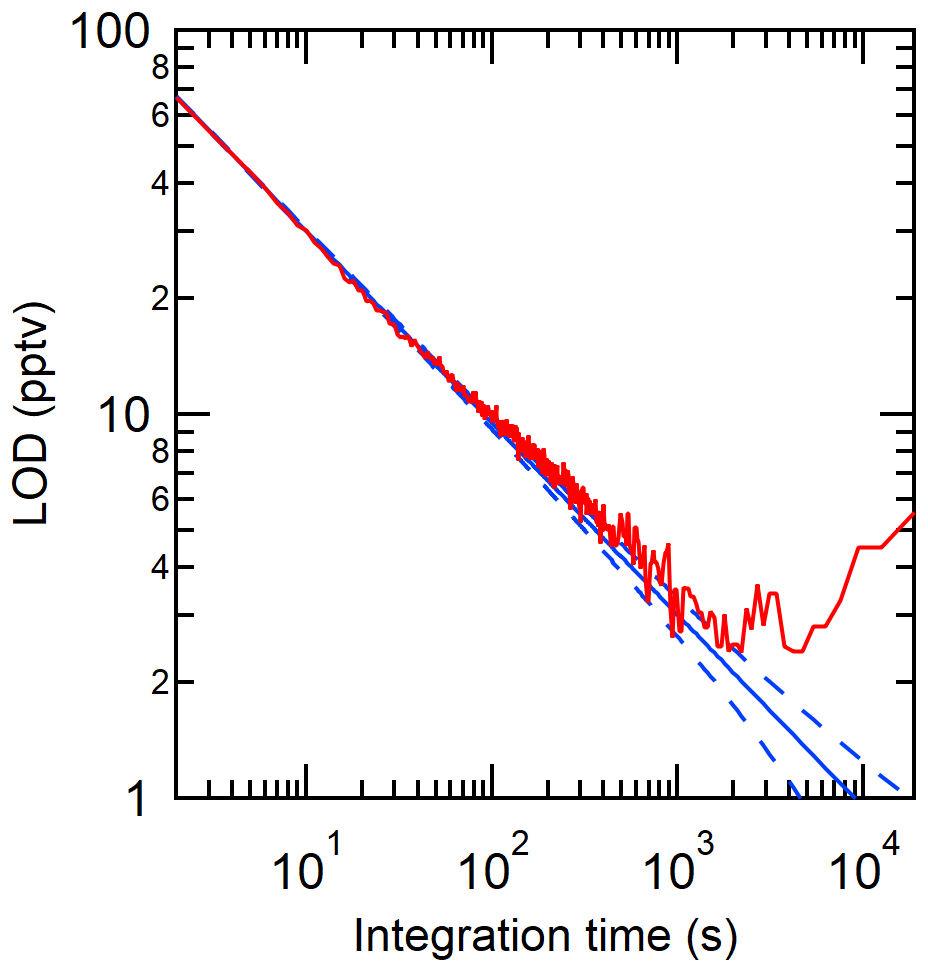
Figure 1Allan–Werle deviation (3σ) in the optical cavity purged with zero air (red line) shown with the ideal deviation (no drift; solid blue line) and associated error in the deviation (dashed blue line).
3.2 Instrument performance
This CRDS has many advantages compared to methods previously used to measure HCl in the ambient atmosphere (Table 1). The LOD and precision of the instrument is comparable to prior high time resolution methods, allowing changes in HCl mixing ratio of a few pptv to be measured. The accuracy and uncertainty are the hardest to compare due to the differences in assessment. A particular challenge is that other methods require external calibrations to determine accuracy and a stable, accurately calibrated HCl source at atmospherically relevant mixing ratios is challenging to obtain (Lao et al., 2020; MacInnis et al., 2016). In contrast, spectroscopic techniques offer a distinct advantage as they are absolute measurements and accuracy determinations rely on propagating uncertainty in the measured parameters (i.e., wavelength and the time constant τ). In the absence of determining accuracy of the CRDS from its operating parameters, we use the deviations in our intercomparisons to estimate the accuracy of the full system, i.e., the instrument and ambient sampling inlet combined. We assess the total method uncertainty using intercomparisons with the gold standard for atmospheric acid detection (EPA Compendium method IO-4.2; United States Environmental Protection Agency, 1999) due to the greater uncertainty when considering the potential total system error from the sorption/desorption to all sampling surfaces (i.e., instrument and inlet). We measured that the accuracy of the analyzer ranges from 5 % to 15 %. This is a conservative range based on the methods we used to validate the instrument, which is further described in Sect. 3.3. The response time of the CRDS used in this work is fast compared to most measurements; the limitation for all online methods compared in Table 1 is not the measurement frequency but rather the time required for HCl to adsorb and desorb from the inlet to the sample stream, which is discussed further in Sect. 3. Lastly, instrument size and power consumption of this CRDS are much lower than many other techniques and have major advantages when considering use in the field, particularly for mobile platforms.
Table 1Performance characteristics of the CRDS HCl analyzer compared to previously reported methods.
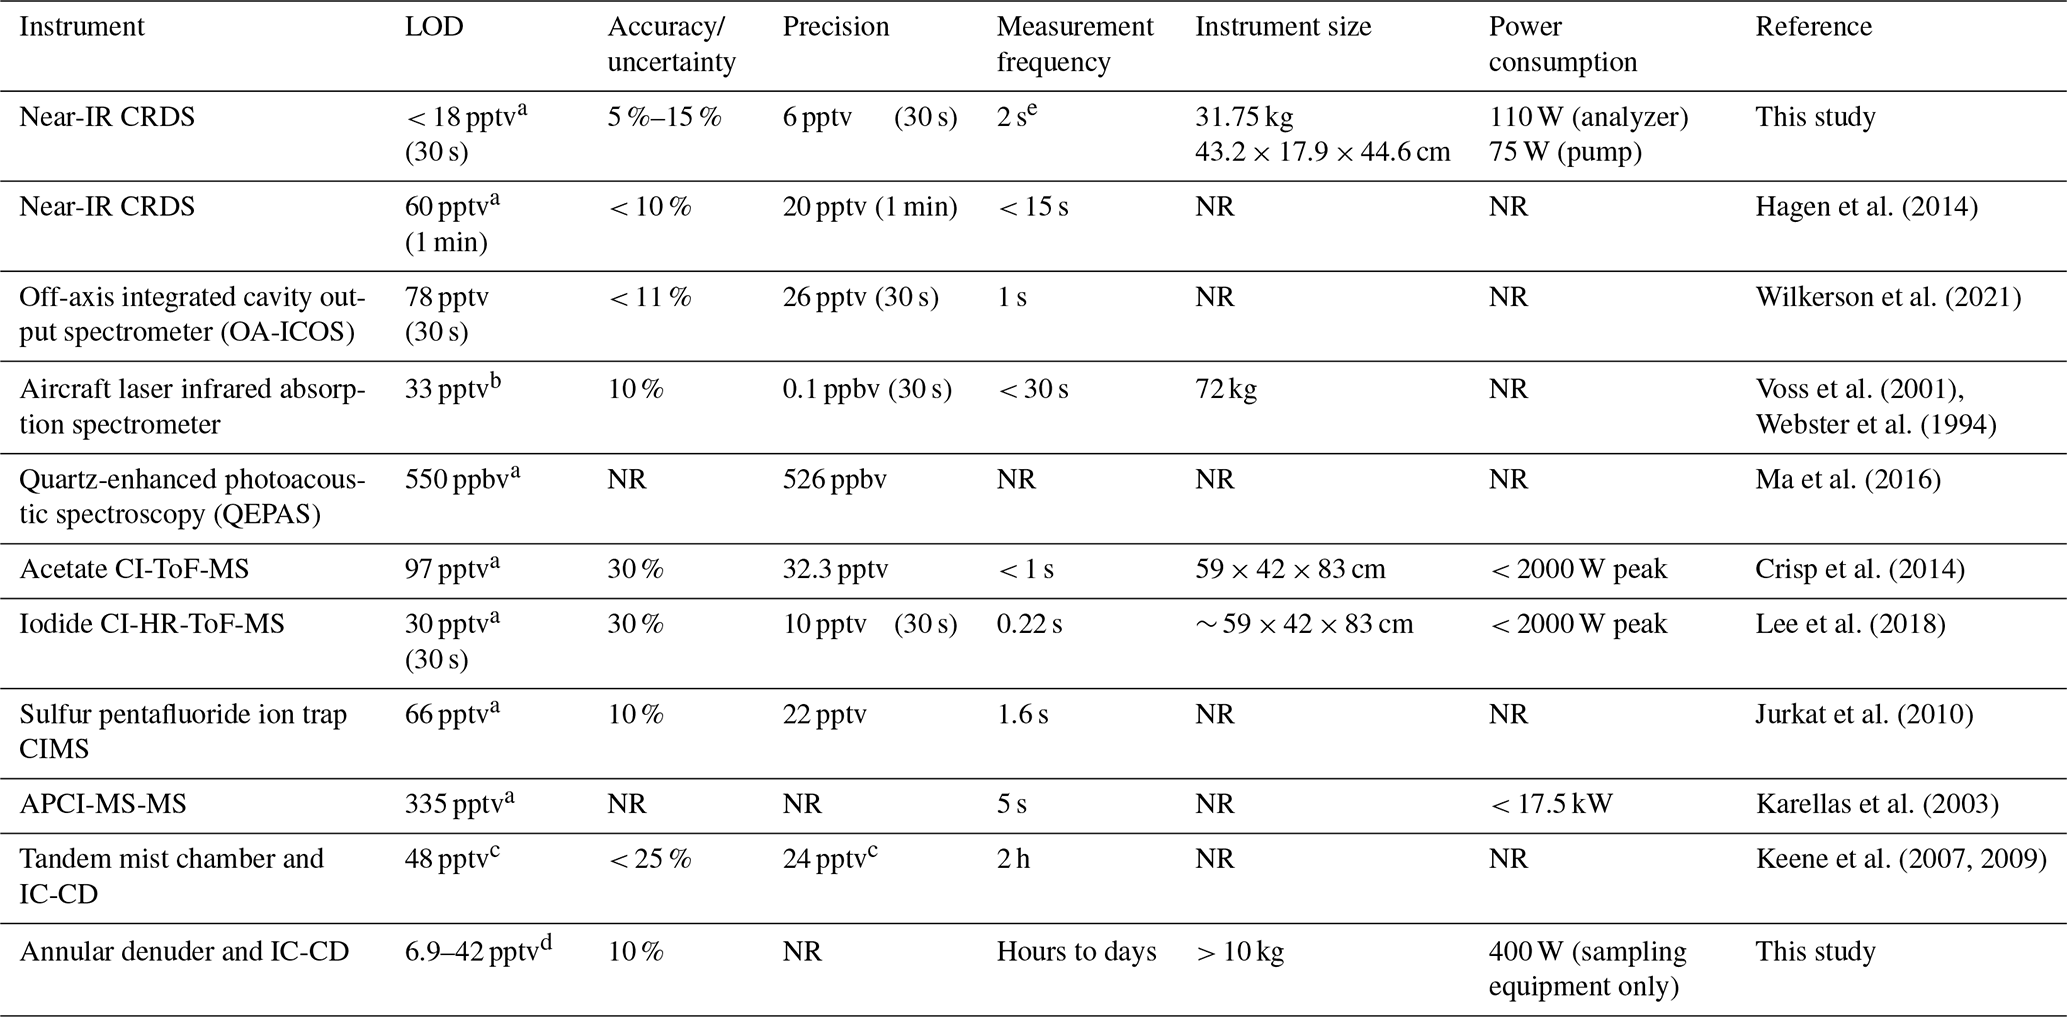
a 3σ. b Predicted assuming a minimum detectable line-centre absorption of 1 × 10⁻⁵ can be achieved in 30 s. c Precision (σ) determined from averaged paired measurements in 2 h samples on IC-CD and LOD was calculated at 2σ. d 3σ Calculated range for a 24 h sampling time from three denuder method blanks. e Instrument data reporting frequency.
The true measurement frequency will also be affected by surface effects, as described in Sect. 3.4. NR: not reported.
3.3 Laboratory and ambient intercomparison
We compared the CRDS analyzer-measured HCl with the gas standard mixing ratios provided by an IC-certified PD under dry conditions and observed a close to 1 : 1 correlation. We explored five mixing ratios: 12, 16, 21, 32, and 45 ppbv. These levels are higher than have been observed in the ambient atmosphere but demonstrate good single response linearity. When the HCl gas entrained in flows of higher RH (≥ 50 %) a negative bias was observed, although the measurements generally remained within the quantified error in the PD output. Negative bias from the provided HCl mixing ratios at 50 % and 80 % RH were 9.6 % and 14.9 %, respectively. As described above, there is no spectroscopic water absorption interference in the HCl measurement, indicating that water increased HCl losses to gas handling surfaces for experiments conducted in humidified air. Inlet surface effects are well established for gaseous strong acids and bases, as these compounds readily sorb at interfaces (e.g., Eisele and Tanner, 1993; Kim et al., 2008; Neuman et al., 1999; Pszenny et al., 1993; Roscioli et al., 2016). The comparison presented here is a best-case scenario because the sampled mixing ratios were much greater than expected in the ambient atmosphere and therefore less likely to be impacted by surface effects. Surface effects under humid conditions necessitated the mitigation and quantification efforts described further in Sect. 3.4. To practically validate the CRDS under real-world conditions, an ambient intercomparison was performed over a period of 7 d (4–11 April 2019).
Online HCl detection by CRDS showed good agreement with HCl mixing ratios quantified from 10 annular denuder extracts collected according to EPA Compendium method IO-4.2 (United States Environmental Protection Agency, 1999), which is a standard offline method for quantitation of acidic atmospheric gases (see Fig. 3a). Measurements from the two instruments were linearly related with a slope of 0.97 ± 0.15, as determined by orthogonal least distance regression, with a y intercept of −0.001 ± 0.021. Half of the measurements are within 10 % of a 1 : 1 correlation and the remaining half fall within 25 %. To further validate the comparison, a linear correlation coefficient (see Fig. S7) of 0.93 ± 0.14 was determined for the two methods and shows good agreement with the orthogonal least distance regression. Changes in RH had no systematic bias on the correlation. Our intercomparison indicates that CRDS measures HCl with comparable results to those obtained by carbonate-coated annular denuders. While the latter requires offline analysis, the CRDS has the additional benefit of continuous high time resolution measurements at 0.5 Hz and dramatically better precision.
Although average HCl measurements between the CRDS and denuders agreed well, much of the useful temporal variability were lost in the time-integrated denuder data (see Fig. 3b). For example, from 19:00 5 April to 01:00 6 April (all times EDT), the CRDS measured mixing ratios between 91 and 598 pptv. This rapid change of mixing ratios is not captured by the 24 h average denuder-measured mixing ratio of 348 pptv. The fast time response of the CRDS also captured other rapidly changing HCl features such as the peak observed between 00:00–06:00 on 7 April. The 6 h event started at 80 pptv and increased at a rate of 1.2 pptv min−1 to 230 pptv over ∼ 120 min, followed by a decrease at a rate of 0.5 pptv min−1 for ∼ 240 min to 98 pptv. The fast time response of the CRDS on the order of minutes is crucial when applying the technique to the real atmosphere for the purpose of fully constraining the sources and sinks for HCl, for which many precursors have similar lifetimes, and ultimately improve our understanding of the chlorine budget (Crisp et al., 2014).
Results from the laboratory and ambient intercomparisons were used to determine the accuracy of the HCl analyzer as 5 % to 15 %. The lower bound of uncertainty (5 %) was determined from the laboratory intercomparison under the optimal dry conditions (Fig. 2). The upper bound of uncertainty (15 %) was consistent across the laboratory intercomparison under the highest RH (80 %) conditions tested (Fig. 2) and the standard deviation of the orthogonal distance regression slope from the ambient intercomparison (Fig. 3a).

Figure 2Comparison of CRDS HCl measurements and output from an HCl permeation device over a range of RHs. Error bars in the x direction represent propagated IC measurement error, while error bars in the y direction represent the standard deviation of the online sampling plateau for each mixing ratio (low magnitudes mean these error bars do not extend beyond the points). A 1 : 1 correlation (solid black line) is shown with the uncertainty in the permeation device emission rate (shaded grey area).
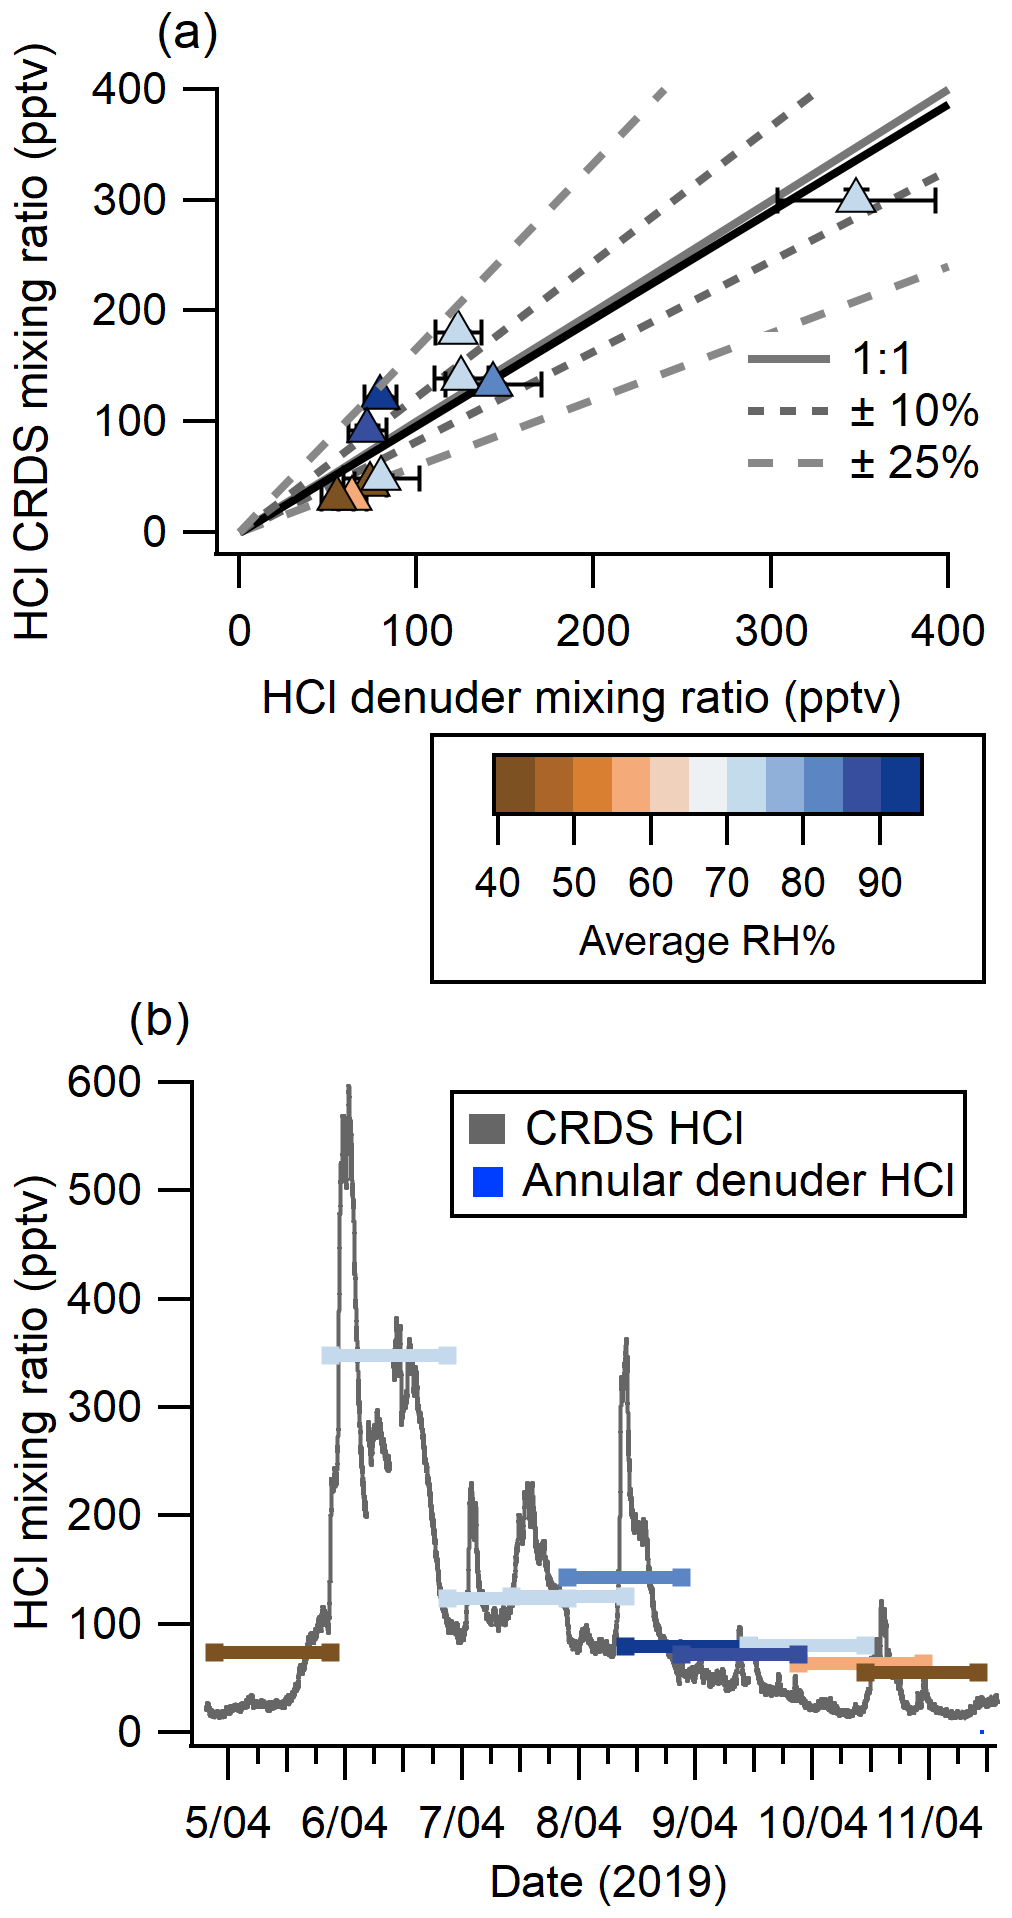
Figure 3(a) Comparison of HCl measured from 4–11 April 2019 using annular denuders and CRDS (averaged to the collection time of denuders). Denuder error bars are derived from the error in the IC calibration, standard deviation of method blanks, and extraction recovery. CRDS measurement errors are the precision in a single measurement combined with data loss for flagged instrument errors. Also shown are a 1 : 1 correlation line (solid grey), 10 % (short grey dash) and 25 % (long grey dash) deviation from 1 : 1, and the orthogonal distance regression (solid black). Points are coloured by the average RH during sampling. (b) Continuous HCl mixing ratio time series by CRDS overlaid with averaged 24 h denuder measurement analyzed by IC with lines coloured according to the average RH during sampling.
3.4 Sampling line and instrument response time assessment
We have thus far demonstrated the efficacy of the CRDS for accurately analyzing gas standards and ambient HCl. However, the potential for sampling losses or desorption sources of surface-active gases that could affect the quality of such measurements is ubiquitous, and these effects are well established (Crisp et al., 2014; Ellis et al., 2010; Pollack et al., 2019; Roscioli et al., 2016). This makes quantification a challenge as there are typically long equilibration times associated with signal stabilization. Long equilibrations make fast time response detection difficult without first characterizing line sorption and desorption, followed by making inlet modifications to minimize losses (Deming et al., 2019; Ellis et al., 2010; Pagonis et al., 2017). To ensure accurate field measurements of HCl, a characterization of the magnitude of HCl loss and desorption during sampling was made. The response time of an instrument to a rapid change in HCl can be calculated by both the time it takes for the measurement to go from 0 to 100 % of the HCl quantity being delivered, as well as the time it takes to return from the HCl quantity being delivered back to 0.
Inlet and instrument surface effects for surface active gases such as HCl can be characterized by fitting decay curves to a double exponential (Ellis et al., 2010; Moravek et al., 2019; Pollack et al., 2019; Zahniser et al., 1995):
where y is the mixing ratio of HCl, y0 is the mixing ratio at the end of the decay, A1 and A2 are proportionality coefficients that determine how much the decay is governed by τ1 and τ2, respectively, t is the time elapsed, and t0 is the initial time. The first time constant (τ1) represents air exchange within the instrument, while the second (τ2) is the surface interaction equilibrium time between HCl adsorbed to surfaces and the overlying airstream mixing ratio. The only term in this equation that can be optimized for the CRDS is τ2, which can be reduced by decreasing the amount of time HCl interacts with inlet surfaces. The sampling flow rate and cavity temperatures are constant for the commercial software and not adjustable; therefore, changing the value of τ1 was not explored in this study. In most reports, τ1 represents the largest change in signal and represents instrument response time. For example, Whitehead et al. (2008) found that τ1 values governed > 75 % (i.e., A1) of changes in measured NH3. For the CRDS, measured values of τ1 were between 5 and 10 s under all conditions and could be improved with a faster inlet flow rate for the CRDS to subsample from.
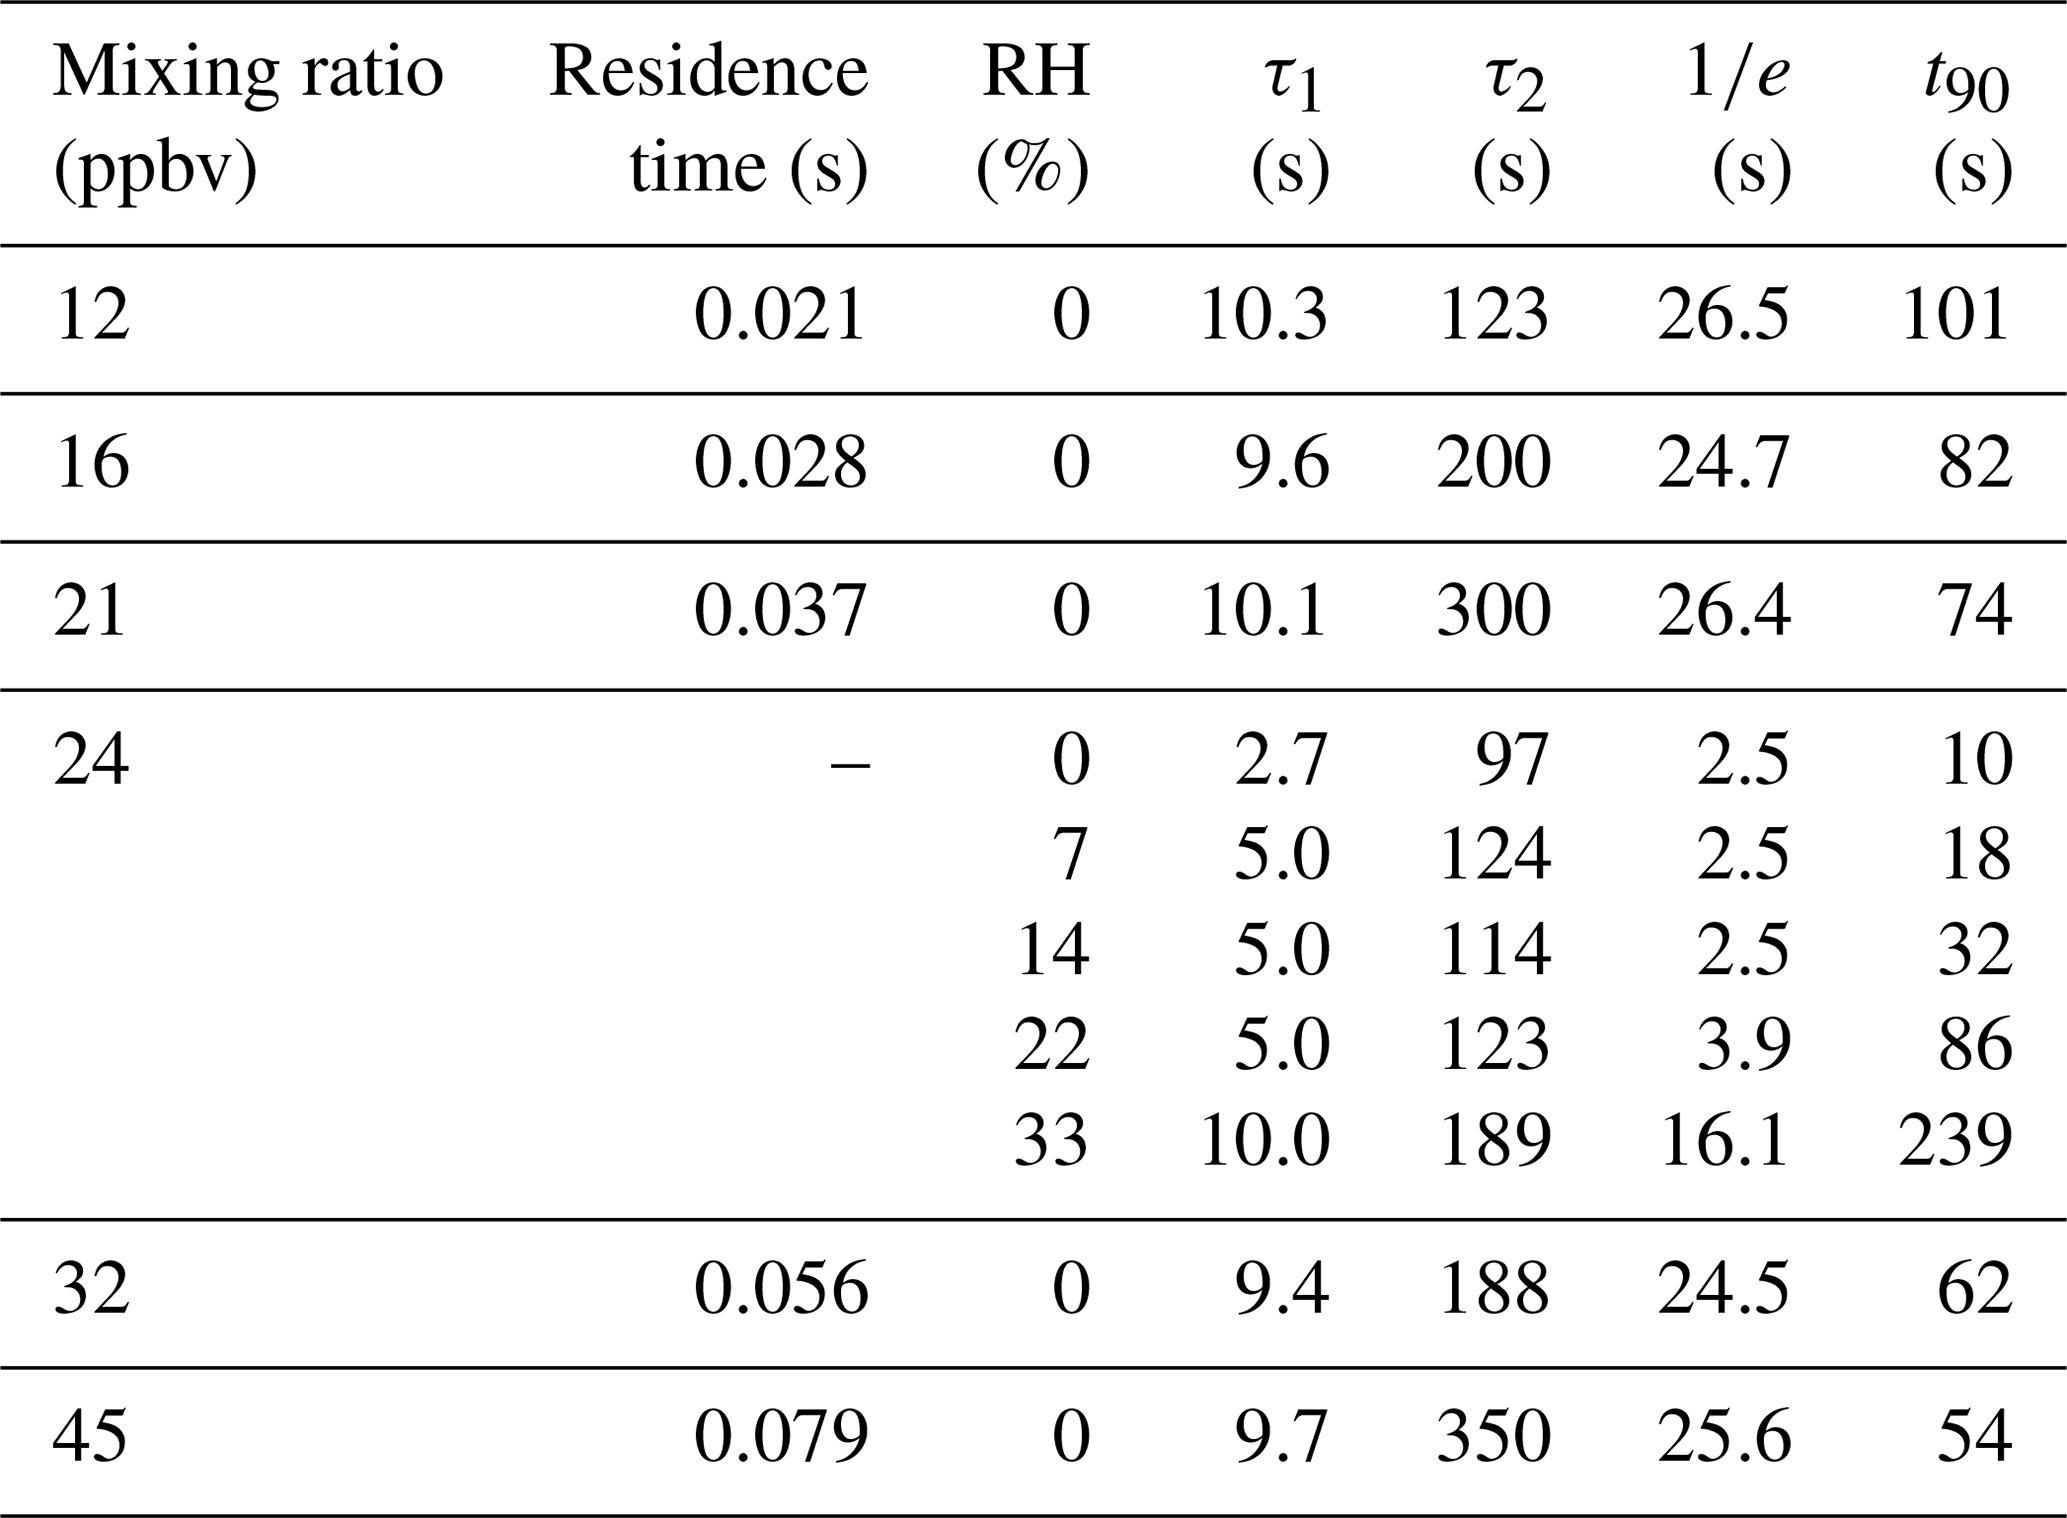
An additional set of experiments was undertaken in which a 24 ppbv HCl standard was sampled while varying RH from 0 % to 33 % (Fig. 4). The effect of RH on the response time of the CRDS was measured using a method similar to that described in Sect. 2.4. The HCl standard gas was sampled over three 10 min pulses at each RH (±2 %). The HCl standard was introduced into a 3.17 mm i.d. PFA tube and 10 cm long inlet line. Data were background corrected to levels measured prior to the standard addition, and the signal was normalized to the HCl enhancement during the final 10 s of each HCl pulse. Due to a lack of inlet characterization for systems measuring HCl, we compare our decay constants to literature values for compounds with similar surface-active properties (e.g., HNO3 and NH3). The instrument exchange rate (τ1) values for spectroscopic methods measuring HNO3 and NH3 are generally faster than our measured values for HCl. However, it should be noted that measurements of τ1 reflect differences in sampling flow rates and internal volume and are likely affected by the internal filters present in the HCl CRDS. Typically, τ1 was < 2 s (Ellis et al., 2010; Pollack et al., 2019; Roscioli et al., 2016) but could be as high as 4.5 s for larger pulses (1 ppmv) of analyte (Roscioli et al., 2016). We observed a highly variable surface interaction equilibrium time constant (τ2), with values ranging between 97 and 350 s. Reported values of τ2 for other surface-active gases are similarly variable, with values < 50 s for heated short clean inlets (Ellis et al., 2010; Pollack et al., 2019; Roscioli et al., 2016), and ∼ 300 s for a contaminated inlet measuring NH3 (Pollack et al., 2019). Major differences in the surface area between our instrument and the instruments to which we compare are likely to cause τ2 differences. Our method employs the use of three filters that increase the gas to surface interactions and therefore increase our equilibrated response time τ2.
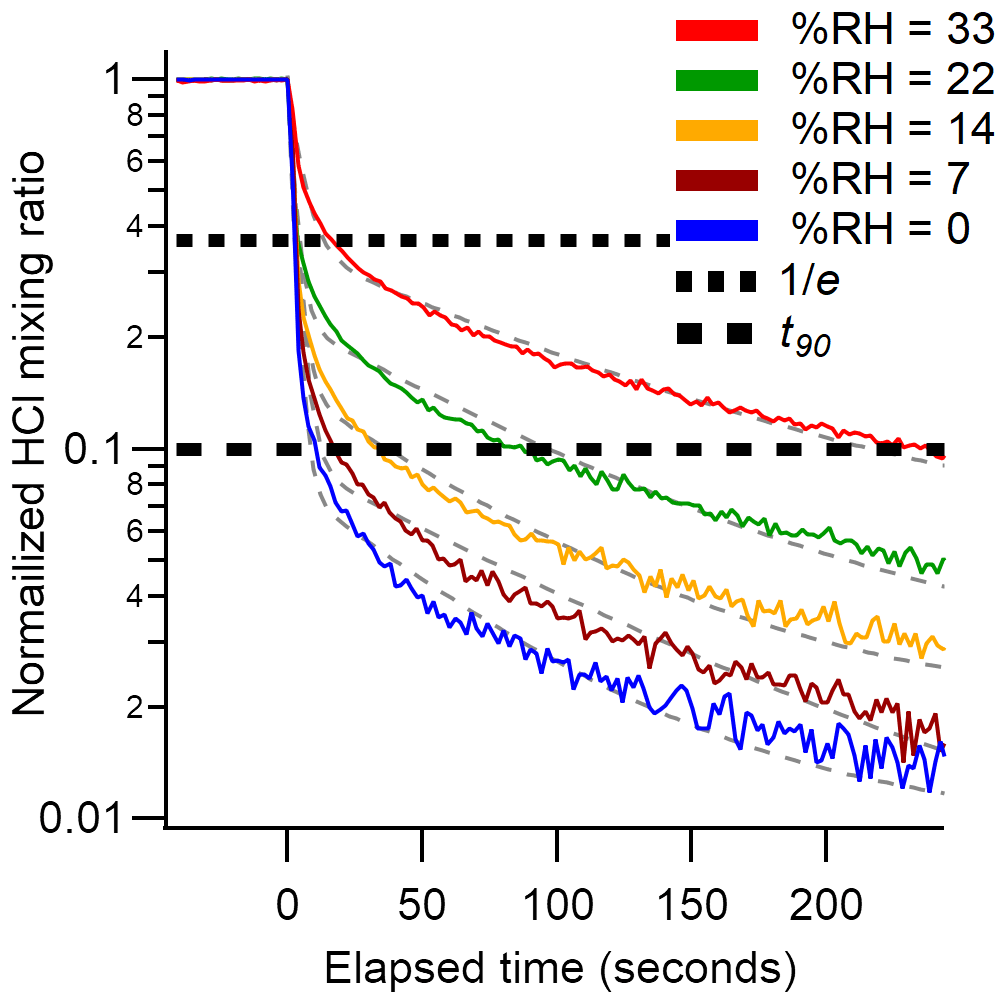
Figure 4Background corrected and normalized signal decay curves observed for pulsed HCl (24 ppbv) performed at various RHs. Dashed grey lines represent a double exponential fit to the average of three cycles at each water mixing ratio. The short and long dashed black lines indicate 37 % () and 90 % (t90) decrease from the initial signal, respectively.
Another method for quantifying response time is by calculating the e-folding () signal loss with respect to time. Calculated e-folding response times demonstrated the fast exchange within the system with values comparable to τ1. Similarly, a signal decrease of 90 % (t90) illustrates the total decay of the sampling line. Using e-folding response time and t90 offers a better visual understanding of the relative roles for instrument and inlet responses and the impacts of increasing RH. We summarize the double exponential decay constants, e-folding response time, and t90 for the rise and decay of HCl mixing ratios from pulses delivered to the instrument in Tables 2 and S1–S4. Increasing the RH increases the response time of the inlet (Fig. 4). At the highest experimental RH (33 %), τ2 is increased by almost a factor of two compared to dry conditions, that is, from seconds to minutes. At lower mixing ratios the higher RH increased the response times to a greater extent (Tables 2 and S1–S4). The increased response time at high ambient RH would not compromise stationary measurements in which HCl mixing ratios changed on timescales of minutes to hours but would not capture more rapid changes. The largest impact on the CRDS time response likely comes from unavoidable effects of partitioning on the large surface area of the HEPA filters located before the optical cavity. Minimizing inlet effects for the CRDS where observation of HCl mixing ratio changes over < 1 min is required (e.g., aircraft or mobile measurements) are most important. The wall interactions of HCl can be reduced by increasing the inlet flow rate and/or decreasing the tubing length (Pagonis et al., 2017).
Table 2Summary of the fit parameters for the double exponential decay curves as a function of mixing ratio and humidity, e-folding response time, and t90.
Physical approaches to improving inlet response include inlet material substitution, heating, and pressure reduction to reduce adsorption of surface-active analytes through removal of surface water and promoted mass transfer of analytes to the gas phase (Sintermann et al., 2011). Deming et al. (2019) found that PFA tubing had the lowest delay times for semivolatile compounds and would likely extend to small polar molecules like HCl. For a clean thermally equilibrated inlet, HCl artifacts can be minimized, but if semivolatile aerosol chloride is sampled (e.g., NH4Cl), the thermodynamic equilibrium can be shifted to result in a positive bias in the HCl measurement, equivalent to similar considerations when measuring HNO3 and NH3 (Ellis et al., 2010; Sintermann et al., 2011; Whitehead et al., 2008). While HEPA filters prevent aerosol from entering the cavity, their elevated temperature (45 ∘C) could lead to volatilization bias and therefore the use of an inlet filter held at ambient temperature to reduce such effects is recommended at a minimum.
Chemical approaches can also help mitigate adsorption of surface-active molecules to inlet surfaces through derivatization or passivation. The silanization of glass or stainless-steel to form an inert fluorinated or silicon coating on a virtual impactor or the introduction of a gaseous fluorinated compound that adsorbs competitively to instrument surfaces in place of the analytes have been demonstrated to substantially reduce surface adsorption on PFA (Ellis et al., 2010; Moravek et al., 2019; Pollack et al., 2019; Roscioli et al., 2016; Wilkerson et al., 2021). However, environmental impacts must be considered when constantly adding fluorinated compounds to sampling flows as they may have deleterious environmental consequences (Cousins et al., 2020). In particular, perfluorobutanesulfonic acid, the fluorinated chemical suggested for passivating inlets (Roscioli et al., 2016), is subject to usage restrictions in some European countries (ECHA, 2020) based on potential negative human and environmental health impacts (Benskin et al., 2012; Sunderland et al., 2019). The high surface activity of perfluorobutanesulfonic acid is likely to cause issues in the analyzer used in this work because the gas sample comes into direct contact with the high reflectivity mirrors. Acid deposition onto mirrors will degrade their reflectivity. Silicon coatings on all plumbed surfaces have been successfully used for atmospheric HCl measurements (Wilkerson et al., 2021) and recommended for applications where PFA use is impractical. Although a direct comparison has not been conducted for HCl, PFA inlet material has been reported to yield better response times than silicon coatings for nitric acid (Neuman et al., 1999). Differences in instrument configurations and applications may warrant the use of different inlet materials and coatings for successful measurement of atmospheric HCl.
The suitability of a CRDS analyzer for measuring ambient atmospheric HCl was explored through laboratory and ambient air intercomparisons, assessing their inlet and analyzer sampling challenges against established atmospheric sampling techniques for strong acids. In comparison to other reported instrumentation, the CRDS is shown to perform similarly or better than the most sensitive HCl measurements reported. As with many in situ measurements of HCl, the most significant limitation is adsorption/desorption loss and release on inlet surfaces, with the deposition effects increasing with increasing RH and decreasing HCl mixing ratios. Given the long-standing knowledge of these issues for surface active gases, such as HNO3 and NH3, there are a variety of chemical and physical options discussed in this study to mitigate inlet effects and achieve faster response times for the CRDS. Increasing the flow rate of the sampling inlet while maintaining laminar flow is the simplest approach to reducing surface effects discussed in Sect. 3.4. Spectra capturing errors in the measurement of HCl for the CRDS can occur at high levels of VOCs (e.g., near emission point sources or biomass burning plumes) or instrument instabilities (e.g., pressure fluctuations); however, potential instrument errors are minimal under most operating and atmospheric conditions. Finally, comparison with annular denuder observations agreed within the combined uncertainties, with the CRDS measurement rate demonstrating the power of capturing transient events that are important to constraining atmospheric chlorine chemistry (e.g., photolysis of precursors, thermodynamic partitioning, and direct emissions).
The ambient intercomparison dataset can be found in Furlani et al. (2021, https://doi.org/10.20383/102.0486).
The supplement related to this article is available online at: https://doi.org/10.5194/amt-14-5859-2021-supplement.
TCF, PRV, and KERD collected and analyzed the data. TCF, PRV, JAN, SSB, TCV, and CJY conceived of and designed the experiments. Funding was obtained by CJY. The manuscript was written by TCF with input from all authors.
The authors declare that they have no conflict of interest.
Publisher’s note: Copernicus Publications remains neutral with regard to jurisdictional claims in published maps and institutional affiliations.
We thank Andrea Angelucci and Sonya Daljeet for assistance with the data collection.
This research has been supported by the Natural Sciences and Engineering Research Council of Canada (grant nos. RTI-2017-00242 and RGPIN-2018-05990).
This paper was edited by Reem Hannun and reviewed by two anonymous referees.
Benskin, J. P., Muir, D. C. G., Scott, B. F., Spencer, C., De Silva, A. O., Kylin, H., Martin, J. W., Morris, A., Lohmann, R., Tomy, G., Rosenberg, B., Taniyasu, S., and Yamashita, N.: Perfluoroalkyl Acids in the Atlantic and Canadian Arctic Oceans, Environ. Sci. Technol., 46, 5815–5823, https://doi.org/10.1021/es300578x, 2012.
Bondy, A. L., Wang, B., Laskin, A., Craig, R. L., Nhliziyo, M. V, Bertman, S. B., Pratt, K. A., Shepson, P. B., and Ault, A. P.: Inland Sea Spray Aerosol Transport and Incomplete Chloride Depletion: Varying Degrees of Reactive Processing Observed during SOAS, Environ. Sci. Technol., 51, 9533–9542, https://doi.org/10.1021/acs.est.7b02085, 2017.
Butz, A., Dinger, A. S., Bobrowski, N., Kostinek, J., Fieber, L., Fischerkeller, C., Giuffrida, G. B., Hase, F., Klappenbach, F., Kuhn, J., Lübcke, P., Tirpitz, L., and Tu, Q.: Remote sensing of volcanic CO2, HF, HCl, SO2, and BrO in the downwind plume of Mt. Etna, Atmos. Meas. Tech., 10, 1–14, https://doi.org/10.5194/amt-10-1-2017, 2017.
Clegg, S. L., and Brimblecombe, P.: Potential degassing of hydrogen chloride from acidified sodium chloride droplets, Atmos. Environ., 19, 465–470, https://doi.org/10.1016/0004-6981(85)90167-2, 1985.
Cousins, I. T., Dewitt, J. C., Glüge, J., Goldenman, G., Herzke, D., Lohmann, R., Ng, C. A., Scheringer, M., and Wang, Z.: The high persistence of PFAS is sufficient for their management as a chemical class, Environ. Sci. Process. Impacts, 22, 2307–2312, https://doi.org/10.1039/d0em00355g, 2020.
Crisp, T. A., Lerner, B. M., Williams, E. J., Quinn, P. K., Bates, T. S., and Bertram, T. H.: Observations of gas phase hydrochloric acid in the polluted marine boundary layer, J. Geophys. Res., 119, 6897–6915, https://doi.org/10.1002/2013JD020992, 2014.
Crosson, E. R.: A cavity ring-down analyzer for measuring atmospheric levels of methane, carbon dioxide, and water vapor, Appl. Phys. B Lasers Opt., 92, 403–408, https://doi.org/10.1007/s00340-008-3135-y, 2008.
Dawe, K. E. R., Furlani, T. C., Kowal, S. F., Kahan, T. F., Vandenboer, T. C., and Young, C. J.: Formation and emission of hydrogen chloride in indoor air, Indoor Air, 29, 70–78, https://doi.org/10.1111/ina.12509, 2019.
Deming, B. L., Pagonis, D., Liu, X., Day, D. A., Talukdar, R., Krechmer, J. E., de Gouw, J. A., Jimenez, J. L., and Ziemann, P. J.: Measurements of delays of gas-phase compounds in a wide variety of tubing materials due to gas–wall interactions, Atmos. Meas. Tech., 12, 3453–3461, https://doi.org/10.5194/amt-12-3453-2019, 2019.
Eisele, F. L. and Tanner, D. J.: Measurement of the gas phase concentration of H2SO4 and methane sulfonic acid and estimates of H2SO4 production and loss in the atmosphere, J. Geophys. Res.-Atmos., 98, 9001–9010, https://doi.org/10.1029/93JD00031, 1993.
Ellis, R. A., Murphy, J. G., Pattey, E., van Haarlem, R., O'Brien, J. M., and Herndon, S. C.: Characterizing a Quantum Cascade Tunable Infrared Laser Differential Absorption Spectrometer (QC-TILDAS) for measurements of atmospheric ammonia, Atmos. Meas. Tech., 3, 397–406, https://doi.org/10.5194/amt-3-397-2010, 2010.
European Chemicals Agency (ECHA): Four new substances added to Candidate List, available at: https://echa.europa.eu/-/four-new-substances-added-to-candidate-list, last access: 20 November 2020.
Finlayson-Pitts, B. J., Ezell, M. J., and Pitts Jr., J. N.: Formation of chemically active chlorine compounds by reactions of atmospheric NaCl particles with gaseous N2O5 and ClONO2, Nature, 337, 241–244, https://doi.org/10.1038/337241a0, 1989.
Furlani, T. C., Veres, P. R., Dawe, K. E. R., Neuman, J. A., Brown, S. S., VandenBoer, T. C., and Young, C. J.: Gaseous HCl ambient intercomparison in Toronto Canada April 2019, Federated Research Data Repository [data set], https://doi.org/10.20383/102.0486, 2021.
Gard, E. E., Kleeman, M. J., Gross, D. S., Hughes, L. S., Allen, J. O., Morrical, B. D., Fergenson, D. P., Dienes, T., Gälli, M. E., Johnson, R. J., Cass, G. R., and Prather, K. A.: Direct observation of heterogeneous chemistry in the atmosphere, Science, 279, 1184–1187, https://doi.org/10.1126/science.279.5354.1184, 1998.
Gordon, I. E., Rothman, L. S., Hill, C., Kochanov, R. V, Tan, Y., Bernath, P. F., Birk, M., Boudon, V., Campargue, A., Chance, K. V, Drouin, B. J., Flaud, J.-M., Gamache, R. R., Hodges, J. T., Jacquemart, D., Perevalov, V. I., Perrin, A., Shine, K. P., Smith, M.-A. H., Tennyson, J., Toon, G. C., Tran, H., Tyuterev, V. G., Barbe, A., Császár, A. G., Devi, V. M., Furtenbacher, T., Harrison, J. J., Hartmann, J.-M., Jolly, A., Johnson, T. J., Karman, T., Kleiner, I., Kyuberis, A. A., Loos, J., Lyulin, O. M., Massie, S. T., Mikhailenko, S. N., Moazzen-Ahmadi, N., Müller, H. S. P., Naumenko, O. V, Nikitin, A. V, Polyansky, O. L., Rey, M., Rotger, M., Sharpe, S. W., Sung, K., Starikova, E., Tashkun, S. A., Auwera, J. Vander, Wagner, G., Wilzewski, J., Wcisło, P., Yu, S., and Zak, E. J.: The HITRAN2016 molecular spectroscopic database, J. Quant. Spectrosc. Radiat. Transf., 203, 3–69, https://doi.org/10.1016/j.jqsrt.2017.06.038, 2017.
Hagen, C. L., Lee, B. C., Franka, I. S., Rath, J. L., VandenBoer, T. C., Roberts, J. M., Brown, S. S., and Yalin, A. P.: Cavity ring-down spectroscopy sensor for detection of hydrogen chloride, Atmos. Meas. Tech., 7, 345–357, https://doi.org/10.5194/amt-7-345-2014, 2014.
Haskins, J. D., Jaeglé, L., Shah, V., Lee, B. H., Lopez-Hilfiker, F. D., Campuzano-Jost, P., Schroder, J. C., Day, D. A., Guo, H., Sullivan, A. P., Weber, R., Dibb, J., Campos, T., Jimenez, J. L., Brown, S. S., and Thornton, J. A.: Wintertime gas-particle partitioning and speciation of inorganic chlorine in the lower troposphere over the northeast United States and coastal ocean, J. Geophys. Res.-Atmos., 123, 12897–12916, https://doi.org/10.1029/2018JD028786, 2018.
Huey, L. G., Villalta, P. W., Dunlea, E. J., Hanson, D. R., and Howard, C. J.: Reactions of CF3O- with atmospheric trace gases, J. Phys. Chem., 100, 190–194, https://doi.org/10.1021/jp951928u, 1996.
Jurkat, T., Voigt, C., Arnold, F., Schlager, H., Aufmhoff, H., Schmale, J., Schneider, J., Lichtenstern, M., and Dörnbrack, A.: Airborne stratospheric ITCIMS measurements of SO2, HCl, and HNO3 in the aged plume of volcano Kasatochi, J. Geophys. Res.-Atmos., 115, D00L17, https://doi.org/10.1029/2010JD013890, 2010.
Karellas, N. S., Chen, Q. F., De Brou, G. B., and Milburn, R. K.: Real time air monitoring of hydrogen chloride and chlorine gas during a chemical fire, J. Hazard. Mater., 102, 105–120, https://doi.org/10.1016/S0304-3894(03)00205-X, 2003.
Keene, W. C., Khalil, M. A. K., Erickson, D. J., McCulloch, A., Graedel, T. E., Lobert, J. M., Aucott, M. L., Gong, S. L., Harper, D. B., Kleiman, G., Midgley, P., Moore, R. M., Seuzaret, C., Sturges, W. T., Benkovitz, C. M., Koropalov, V., Barrie, L. A., and Li, Y. F.: Composite global emissions of reactive chlorine from anthropogenic and natural sources: Reactive chlorine emissions inventory, J. Geophys. Res., 104, 8429–8440, 1999.
Keene, W. C., Stutz, J., Pszenny, A. A. P., Maben, J. R., Fischer, E. V., Smith, A. M., von Glasow, R., Pechtl, S., Sive, B. C., and Varner, R. K.: Inorganic chlorine and bromine in coastal New England air during summer, J. Geophys. Res.-Atmos., 112, 1–15, https://doi.org/10.1029/2006JD007689, 2007.
Keene, W. C., Long, M. S., Pszenny, A. A. P., Sander, R., Maben, J. R., Wall, A. J., O'Halloran, T. L., Kerkweg, A., Fischer, E. V., and Schrems, O.: Latitudinal variation in the multiphase chemical processing of inorganic halogens and related species over the eastern North and South Atlantic Oceans, Atmos. Chem. Phys., 9, 7361–7385, https://doi.org/10.5194/acp-9-7361-2009, 2009.
Kim, S., Huey, L. G., Stickel, R. E., Pierce, R. B., Chen, G., Avery, M. A., Dibb, J. E., Diskin, G. S., Sachse, G. W., McNaughton, C. S., Clarke, A. D., Anderson, B. E., and Blake, D. R.: Airborne measurements of HCl from the marine boundary layer to the lower stratosphere over the North Pacific Ocean during INTEX-B, Atmos. Chem. Phys. Discuss., 8, 3563–3595, https://doi.org/10.5194/acpd-8-3563-2008, 2008.
Kochanov, R. V, Gordon, I. E., Rothman, L. S., Shine, K. P., Sharpe, S. W., Johnson, T. J., Wallington, T. J., Harrison, J. J., Bernath, P. F., Birk, M., Wagner, G., Le Bris, K., Bravo, I., and Hill, C.: Infrared absorption cross-sections in HITRAN2016 and beyond: Expansion for climate, environment, and atmospheric applications, J. Quant. Spectrosc. Radiat. Transf., 230, 172–221, https://doi.org/10.1016/j.jqsrt.2019.04.001, 2019.
Lao, M., Crilley, L. R., Salehpoor, L., Furlani, T. C., Bourgeois, I., Neuman, J. A., Rollins, A. W., Veres, P. R., Washenfelder, R. A., Womack, C. C., Young, C. J., and VandenBoer, T. C.: A portable, robust, stable, and tunable calibration source for gas-phase nitrous acid (HONO), Atmos. Meas. Tech., 13, 5873–5890, https://doi.org/10.5194/amt-13-5873-2020, 2020.
Lee, B. H., Lopez-Hilfiker, F. D., Schroder, J. C., Campuzano-Jost, P., Jimenez, J. L., McDuffie, E. E., Fibiger, D. L., Veres, P. R., Brown, S. S., Campos, T. L., Weinheimer, A. J., Flocke, F. F., Norris, G., O'Mara, K., Green, J. R., Fiddler, M. N., Bililign, S., Shah, V., Jaeglé, L., and Thornton, J. A.: Airborne Observations of Reactive Inorganic Chlorine and Bromine Species in the Exhaust of Coal-Fired Power Plants, J. Geophys. Res.-Atmos., 123, 11225-11237, https://doi.org/10.1029/2018JD029284, 2018.
Ma, Y., He, Y., Yu, X., Chen, C., Sun, R., and Tittel, F. K.: HCl ppb-level detection based on QEPAS sensor using a low resonance frequency quartz tuning fork, Sensor. Actuat. B-Chem., 233, 388–393, https://doi.org/10.1016/j.snb.2016.04.114, 2016.
MacInnis, J. J., VandenBoer, T. C., and Young, C. J.: Development of a gas phase source for perfluoroalkyl acids to examine atmospheric sampling methods, Analyst, 141, 3765–3775, https://doi.org/10.1039/C6AN00313C, 2016.
Marcy, T. P., Fahey, D. W., Gao, R. S., Popp, P. J., Richard, E. C., Thompson, T. L., Rosenlof, K. H., Ray, E. A., Salawitch, R. J., Atherton, C. S., Bergmann, D. J., Ridley, B. A., Weinheimer, A. J., Loewenstein, M., Weinstock, E. M., and Mahoney, M. J.: Quantifying Stratospheric Ozone in the Upper Troposphere with in Situ Measurements of HCl, Science, 304, 261–265, https://doi.org/10.1126/science.1093418, 2004.
Mattila, J. M., Lakey, P. S. J., Shiraiwa, M., Wang, C., Abbatt, J. P. D., Arata, C., Goldstein, A. H., Ampollini, L., Katz, E. F., Decarlo, P. F., Zhou, S., Kahan, T. F., Cardoso-saldan, F. J., Ruiz, L. H., Abeleira, A., Boedicker, E. K., Vance, M. E., and Farmer, D. K.: Multiphase chemistry controls inorganic chlorinated and nitrogenated compounds in indoor air during bleach cleaning, Environ. Sci. Technol., 54, 1730–1739, https://doi.org/10.1021/acs.est.9b05767, 2020.
Moravek, A., Singh, S., Pattey, E., Pelletier, L., and Murphy, J. G.: Measurements and quality control of ammonia eddy covariance fluxes: a new strategy for high-frequency attenuation correction, Atmos. Meas. Tech., 12, 6059–6078, https://doi.org/10.5194/amt-12-6059-2019, 2019.
Neuman, J. A., Huey, L. G., Ryerson, T. B., and Fahey, D. W.: Study of inlet materials for sampling atmospheric nitric acid, Environ. Sci. Technol., 33, 1133–1136, https://doi.org/10.1021/es980767f, 1999.
Osthoff, H. D., Roberts, J. M., Ravishankara, A. R., Williams, E. J., Lerner, B. M., Sommariva, R., Bates, T. S., Coffman, D., Quinn, P. K., Dibb, J. E., Stark, H., Burkholder, J. B., Talukdar, R. K., Meagher, J., Fehsenfeld, F. C., and Brown, S. S.: High levels of nitryl chloride in the polluted subtropical marine boundary layer, Nat. Geosci., 1, 324–328, https://doi.org/10.1038/ngeo177, 2008.
Pagonis, D., Krechmer, J. E., de Gouw, J., Jimenez, J. L., and Ziemann, P. J.: Effects of gas–wall partitioning in Teflon tubing and instrumentation on time-resolved measurements of gas-phase organic compounds, Atmos. Meas. Tech., 10, 4687–4696, https://doi.org/10.5194/amt-10-4687-2017, 2017.
Place, B. K., Young, C. J., Ziegler, S. E., Edwards, K. A., Salehpoor, L., and VandenBoer, T. C.: Passive sampling capabilities for ultra-trace quantitation of atmospheric nitric acid (HNO3) in remote environments, Atmos. Environ., 191, 360–369, https://doi.org/10.1016/j.atmosenv.2018.08.030, 2018.
Pollack, I. B., Lindaas, J., Roscioli, J. R., Agnese, M., Permar, W., Hu, L., and Fischer, E. V.: Evaluation of ambient ammonia measurements from a research aircraft using a closed-path QC-TILDAS operated with active continuous passivation, Atmos. Meas. Tech., 12, 3717–3742, https://doi.org/10.5194/amt-12-3717-2019, 2019.
Pszenny, A. A. P., Keene, W. C., Jacob, D. J., Fan, S., Maben, J. R., Zetwo, M. P., Springer-Young, M., and Galloway, J. N.: Evidence of inorganic chlorine gases other than hydrogen chloride in marine surface air, Geophys. Res. Lett., 20, 699–702, https://doi.org/10.1029/93GL00047, 1993.
Roberts, J. M., Osthoff, H. D., Brown, S. S., and Ravishankara, A. R.: N2O5 oxidizes chloride to Cl2 in acidic atmospheric aerosol, Science, 321, 1059, https://doi.org/10.1126/science.1158777, 2008.
Roscioli, J. R., Zahniser, M. S., Nelson, D. D., Herndon, S. C., and Kolb, C. E.: New Approaches to Measuring Sticky Molecules: Improvement of Instrumental Response Times Using Active Passivation, J. Phys. Chem. A, 120, 1347–1357, https://doi.org/10.1021/acs.jpca.5b04395, 2016.
Sherwen, T., Schmidt, J. A., Evans, M. J., Carpenter, L. J., Großmann, K., Eastham, S. D., Jacob, D. J., Dix, B., Koenig, T. K., Sinreich, R., Ortega, I., Volkamer, R., Saiz-Lopez, A., Prados-Roman, C., Mahajan, A. S., and Ordóñez, C.: Global impacts of tropospheric halogens (Cl, Br, I) on oxidants and composition in GEOS-Chem, Atmos. Chem. Phys., 16, 12239–12271, https://doi.org/10.5194/acp-16-12239-2016, 2016.
Simpson, W. R., von Glasow, R., Riedel, K., Anderson, P., Ariya, P., Bottenheim, J., Burrows, J., Carpenter, L. J., Frieß, U., Goodsite, M. E., Heard, D., Hutterli, M., Jacobi, H.-W., Kaleschke, L., Neff, B., Plane, J., Platt, U., Richter, A., Roscoe, H., Sander, R., Shepson, P., Sodeau, J., Steffen, A., Wagner, T., and Wolff, E.: Halogens and their role in polar boundary-layer ozone depletion, Atmos. Chem. Phys., 7, 4375–4418, https://doi.org/10.5194/acp-7-4375-2007, 2007.
Simpson, W. R., Brown, S. S., Saiz-Lopez, A., Thornton, J. A., and Von Glasow, R.: Tropospheric halogen chemistry: Sources, cycling, and impacts, Chem. Rev., 115, 4035–4062, https://doi.org/10.1021/cr5006638, 2015.
Sintermann, J., Spirig, C., Jordan, A., Kuhn, U., Ammann, C., and Neftel, A.: Eddy covariance flux measurements of ammonia by high temperature chemical ionisation mass spectrometry, Atmos. Meas. Tech., 4, 599–616, https://doi.org/10.5194/amt-4-599-2011, 2011.
Solomon, S.: Stratospheric ozone depletion: A review of concepts and history, Rev. Geophys., 37, 275–316, https://doi.org/10.1029/1999RG900008, 1999.
Sunderland, E. M., Hu, X. C., Dassuncao, C., Tokranov, A. K., Wagner, C. C., and Allen, J. G.: A review of the pathways of human exposure to poly- and perfluoroalkyl substances (PFASs) and present understanding of health effects, J. Expo. Sci. Environ. Epidemiol., 29, 131–147, https://doi.org/10.1038/s41370-018-0094-1, 2019.
Thaler, R. D., Mielke, L. H., and Osthoff, H. D.: Quantification of Nitryl Chloride at Part Per Trillion Mixing Ratios by Thermal Dissociation Cavity Ring-Down Spectroscopy, Anal. Chem., 83, 2761–2766, https://doi.org/10.1021/ac200055z, 2011.
Thornton, J. A., Kercher, J. P., Riedel, T. P., Wagner, N. L., Cozic, J., Holloway, J. S., Dube, W. P., Wolfe, G. M., Quinn, P. K., Middlebrook, A. M., Alexander, B., and Brown, S. S.: A large atomic chlorine source inferred from mid-continental reactive nitrogen chemistry, Nature, 464, 271–274, https://doi.org/10.1038/nature08905, 2010.
United States Environmental Protection Agency: Compendium of Methods for the Determination of Inorganic Compounds in Ambient Air: Determination of reactive acidic and basic gases and strong acidity of atmospheric fine particles (< 2.5 µm) (Compendium Method IO-4.2), Cincinnati, OH, USA, 1999.
Valach, R.: The origin of the gaseous form of natural atmospheric chlorine, Tellus, 19, 509–516, https://doi.org/10.3402/tellusa.v19i3.9819, 1967.
Veres, P. R., Roberts, J. M., Warneke, C., Welsh-Bon, D., Zahniser, M., Herndon, S., Fall, R., and de Gouw, J.: Development of negative-ion proton-transfer chemical-ionization mass spectrometry (NI-PT-CIMS) for the measurement of gas-phase organic acids in the atmosphere, Int. J. Mass Spectrom., 274, 48–55, https://doi.org/10.1016/j.ijms.2008.04.032, 2008.
Voss, P. B., Stimpfle, R. M., Cohen, R. C., Hanisco, T. F., Bonne, G. P., Perkins, K. K., Lanzendorf, E. J., Anderson, J. G., Salawitch, R. J., Webster, C. R., Scott, D. C., May, R. D., Wennberg, P. O., Newman, P. A., Lait, L. R., Elkins, J. W., and Bui, T. P.: Inorganic chlorine partitioning in the summer lower stratosphere: Modeled and measured [ClONO2]/[HCl] during POLARIS, J. Geophys. Res.-Atmos., 106, 1713–1732, https://doi.org/10.1029/2000JD900494, 2001.
Wang, X., Jacob, D. J., Eastham, S. D., Sulprizio, M. P., Zhu, L., Chen, Q., Alexander, B., Sherwen, T., Evans, M. J., Lee, B. H., Haskins, J. D., Lopez-Hilfiker, F. D., Thornton, J. A., Huey, G. L., and Liao, H.: The role of chlorine in global tropospheric chemistry, Atmos. Chem. Phys., 19, 3981–4003, https://doi.org/10.5194/acp-19-3981-2019, 2019.
Webster, C. R., May, R. D., Trimble, C. A., Chave, R. G., and Kendall, J.: Aircraft (ER-2) laser infrared absorption spectrometer (ALIAS) for in situ stratospheric measurements of HCl, N2O, CH4, NO2, and HNO3, Appl. Optics, 33, 454–472, https://doi.org/10.1364/AO.33.000454, 1994.
Whitehead, J. D., Twigg, M., Famulari, D., Nemitz, E., Sutton, M. A., Gallagher, M. W., and Fowler, D.: Evaluation of Laser Absorption Spectroscopic Techniques for Eddy Covariance Flux Measurements of Ammonia, Environ. Sci. Technol., 42, 2041–2046, https://doi.org/10.1021/es071596u, 2008.
Wilkerson, J., Sayres, D. S., Smith, J. B., Allen, N., Rivero, M., Greenberg, M., Martin, T., and Anderson, J. G.: In situ observations of stratospheric HCl using three-mirror integrated cavity output spectroscopy, Atmos. Meas. Tech., 14, 3597–3613, https://doi.org/10.5194/amt-14-3597-2021, 2021.
Young, A. H., Keene, W. C., Pszenny, A. A. P., Sander, R., Thornton, J. A., Riedel, T. P., and Maben, J. R.: Phase partitioning of souble trace gases with size-resolved aerosols in near-surface continental air over northern Colorado, USA, during winter, J. Geophys. Res., 118, 9414–9427, https://doi.org/10.1002/jgrd.50655, 2013.
Young, C. J., Washenfelder, R. A., Roberts, J. M., Mielke, L. H., Osthoff, H. D., Tsai, C., Pikelnaya, O., Stutz, J., Veres, P. R., Cochran, A. K., Vandenboer, T. C., Flynn, J., Grossberg, N., Haman, C. L., Lefer, B., Stark, H., Graus, M., De Gouw, J., Gilman, J. B., Kuster, W. C., and Brown, S. S.: Vertically resolved measurements of nighttime radical reservoirs in los angeles and their contribution to the urban radical budget, Environ. Sci. Technol., 46, 10965–10973, https://doi.org/10.1021/es302206a, 2012.
Young, C. J., Washenfelder, R. A., Edwards, P. M., Parrish, D. D., Gilman, J. B., Kuster, W. C., Mielke, L. H., Osthoff, H. D., Tsai, C., Pikelnaya, O., Stutz, J., Veres, P. R., Roberts, J. M., Griffith, S., Dusanter, S., Stevens, P. S., Flynn, J., Grossberg, N., Lefer, B., Holloway, J. S., Peischl, J., Ryerson, T. B., Atlas, E. L., Blake, D. R., and Brown, S. S.: Chlorine as a primary radical: evaluation of methods to understand its role in initiation of oxidative cycles, Atmos. Chem. Phys., 14, 3427–3440, https://doi.org/10.5194/acp-14-3427-2014, 2014.
Young, C. J., Zhou, S., Siegel, J. A., and Kahan, T. F.: Illuminating the dark side of indoor oxidants, Environ. Sci. Process. Impacts, 21, 1229–1239, https://doi.org/10.1039/C9EM00111E, 2019.
Zahniser, M. S., Nelson, D. D., McManus, B., Kebabian, P. L., Lloyd, D., Fowler, D., Jenkinson, D. S., Monteith, J. L., and Unsworth, M. H.: Measurement of trace gas fluxes using tunable diode laser spectroscopy, Philos. Trans. R. Soc. London Ser. A Phys. Eng. Sci., 351, 371–382, https://doi.org/10.1098/rsta.1995.0040, 1995.