the Creative Commons Attribution 4.0 License.
the Creative Commons Attribution 4.0 License.
 | 03 Sep 2021
First ground-based Fourier transform infrared (FTIR) spectrometer observations of HFC-23 at Rikubetsu, Japan, and Syowa Station, Antarctica
Masanori Takeda
Isao Murata
Tomoo Nagahama
Isamu Morino
Geoffrey C. Toon
Ray F. Weiss
Jens Mühle
Paul B. Krummel
Paul J. Fraser
Hsiang-Jui Wang
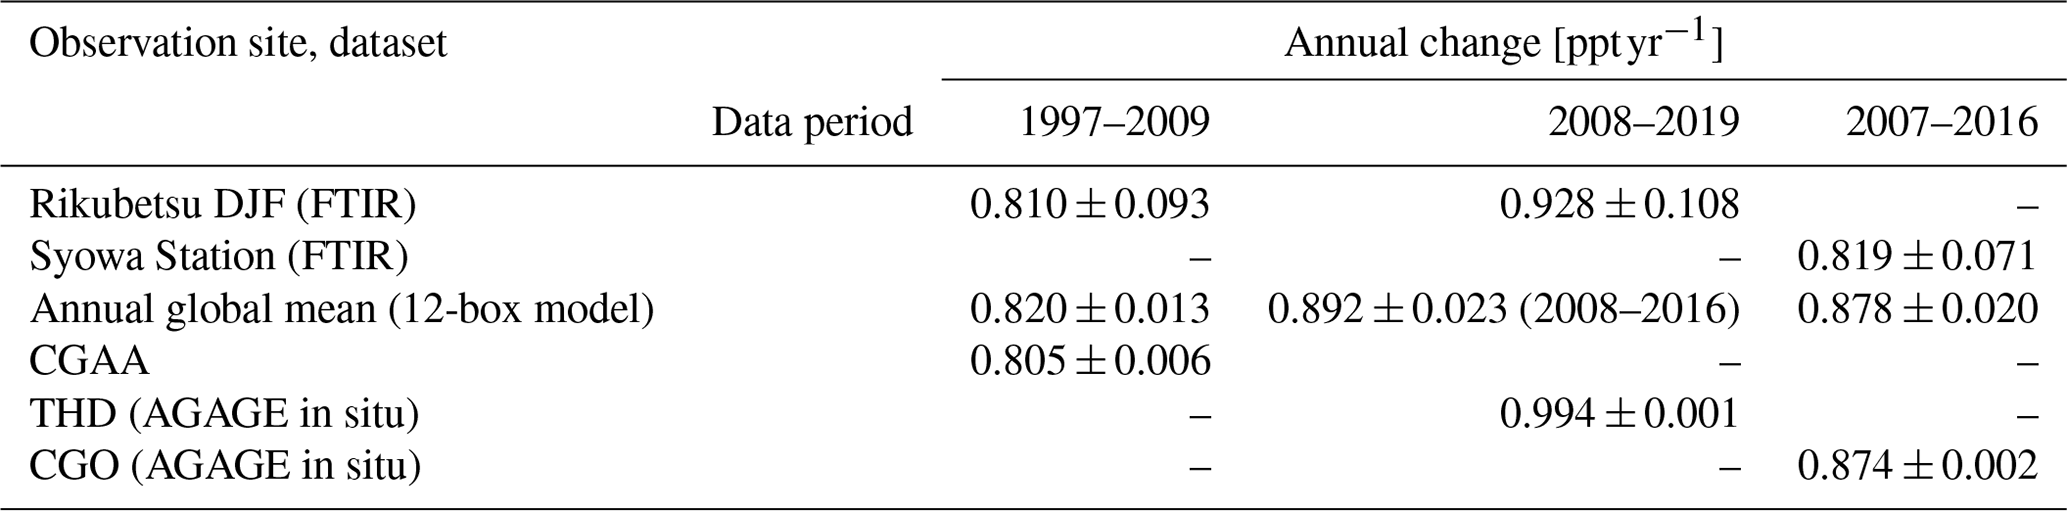
We have developed a procedure for retrieving atmospheric abundances of HFC-23 (CHF3) with a ground-based Fourier transform infrared (FTIR) spectrometer and analyzed the spectra observed at Rikubetsu, Japan (43.5∘ N, 143.8∘ E), and at Syowa Station, Antarctica (69.0∘ S, 39.6∘ E). The FTIR retrievals were carried out with the SFIT4 retrieval program, and the two spectral windows of 1138.5–1148.0 cm−1 and 1154.0–1160.0 cm−1 in the overlapping ν2 and ν5 vibrational–rotational transition bands of HFC-23 were used to avoid strong H2O absorption features. We considered O3, N2O, CH4, H2O, HDO, CFC-12 (CCl2F2), HCFC-22 (CHClF2), peroxyacetyl nitrate (PAN) (CH3C(O)OONO2), HCFC-141b (CH3CCl2F), and HCFC-142b (CH3CClF2) to be interfering species. Vertical profiles of H2O, HDO, and CH4 are preliminarily retrieved with other independent spectral windows because these profiles may induce large uncertainties in the HFC-23 retrieval. Each HFC-23 retrieval has only one piece of vertical information with sensitivity to HFC-23 in the troposphere and the lower stratosphere. Retrieval errors mainly arise from the systematic uncertainties of the spectroscopic parameters used to obtain HFC-23, H2O, HDO, and CH4 abundances. For comparison between FTIR-retrieved HFC-23 total columns and surface dry-air mole fractions provided by AGAGE (Advanced Global Atmospheric Gases Experiment), FTIR-retrieved HFC-23 dry-air column-averaged mole fractions (XHFC-23) were calculated. The FTIR-retrieved XHFC-23 values at Rikubetsu and Syowa Station have negative biases of −15 % to −20 % and −25 % compared to the AGAGE datasets, respectively. These negative biases might mainly come from systematic uncertainties of HFC-23 spectroscopic parameters. The trend of the FTIR-retrieved XHFC-23 data at Rikubetsu was derived for December to February (DJF) observations, which are considered to represent the background values when an air mass reaching Rikubetsu has the least influence by transport of HFC-23 emissions from nearby countries. The DJF trend of Rikubetsu over the 1997–2009 period is 0.810 ± 0.093 ppt yr−1 (ppt: parts per trillion), which is in good agreement with the trend derived from the annual global mean datasets of the AGAGE 12-box model for the same period (0.820 ± 0.013 ppt yr−1). The DJF trend of Rikubetsu over the 2008–2019 period is 0.928 ± 0.108 ppt yr−1, which is consistent with the trend in the AGAGE in situ measurements at Trinidad Head (41.1∘ N, 124.2∘ W) for the same period (0.994 ± 0.001 ppt yr−1). The trend of the FTIR-retrieved XHFC-23 data at Syowa Station over the 2007–2016 period is 0.819 ± 0.071 ppt yr−1, which is consistent with that derived from the AGAGE in situ measurements at Cape Grim (40.7∘ S, 144.7∘ E) for the same period (0.874 ± 0.002 ppt yr−1). Although there are systematic biases in the FTIR-retrieved XHFC-23 at both sites, these results indicate that ground-based FTIR observations have the capability to monitor the long-term trend of atmospheric HFC-23. If this FTIR measurement technique were extended to other Network for the Detection of Atmospheric Composition Change (NDACC) ground-based FTIR sites around world, the measurements reported from these sites would complement the global AGAGE observations by filling spatial and temporal gaps and may lead to improved insights about changes in regional and global emissions of HFC-23 and its role in global warming.
- Article
(3829 KB) - Full-text XML
- BibTeX
- EndNote


Trifluoromethane (CHF3), also known as hydrofluorocarbon-23 (HFC-23), has an atmospheric lifetime of 228 years and a global warming potential integrated over a 100-year timescale (100-year GWP) of 12 690 (Montzka et al., 2019). Due to this high GWP, emissions of HFC-23 are contributing to climate change. HFC-23 is an unwanted by-product of the production of chlorodifluoromethane (CHClF2), also known as hydrochlorofluorocarbon-22 (HCFC-22), with the HFC-23 HCFC-22 production ratio estimated to be up to 4 % (McCulloch and Lindley, 2007).
Under the regulations of the Montreal Protocol on Substances that Deplete the Ozone Layer (Montreal Protocol) (UNEP, 2000), production and consumption of ozone-destroying chlorofluorocarbons (CFCs) have been completely banned since 2010, whereas production and consumption of hydrochlorofluorocarbons (HCFCs), which have less of an effect on ozone depletion, have continued. The Montreal Protocol is phasing out the production and consumption of HCFCs for emissive uses by 2020 in developed countries and by 2030 in developing countries, while use for feedstock (e.g., in production of HFCs and fluoropolymers) is not restricted. Hence, emissions of HCFCs to the Earth's atmosphere are expected to continue for quite a while. HCFC-22, one of the major HCFCs with an ozone depletion potential (ODP) of ∼ 0.03 and a 100-year GWP of 1760 (Harris et al., 2014), has been widely used in air conditioners, refrigerators, foaming agents, and heat-insulating materials, and therefore large banks still exist, which also contribute to ongoing emissions. Emissions of HCFC-22 have increased since 2004 (Montzka et al., 2009), and global emissions in 2010 are estimated to have reached 386 ± 41 Gg yr−1 by an inverse model (Simmonds et al., 2018a). HFC-23 emissions have been increasing as a consequence.
Currently, hydrofluorocarbons (HFCs) are widely used as substitutes for CFCs and HCFCs because they do not contain ozone-depleting halogen atoms (Cl or Br). However, HFC-23 is not used as a substitute for CFCs or HCFCs, but it is used in halon-1301 (CBrF3) production, semiconductor manufacturing, very low-temperature refrigeration, and specialty fire extinguishers (Oram et al., 1998; Miller et al., 2010, Simmonds et al., 2018a), which means that emissions from deliberate use of HFC-23 are small. Hence, HFC-23 has mainly been vented from HCFC-22 production plants into the atmosphere (Montzka et al., 2019). Simmonds et al. (2018a) reported that global annual emissions of HFC-23 were estimated to have reached 13.3 ± 0.8 Gg yr−1 in 2006 up from 4.2 ± 0.7 Gg yr−1 in 1980 due to rising production of HCFC-22. After 2006, HFC-23 emissions rapidly decreased to 9.6 ± 0.6 Gg yr−1 in 2009 as a result of thermal destruction of HFC-23 incentivized by the Clean Development Mechanism (CDM) under the Kyoto Protocol to the United Nations Framework Convention on Climate Change (UNFCCC). Due to a scheduled end of the CDM project, however, HFC-23 emission again increased, rapidly reaching 14.5 ± 0.6 Gg yr−1 in 2014 (Simmonds et al., 2018a). The annual global average mole fraction of HFC-23 reached 28.9 ppt (parts per trillion) in 2016, which corresponds to a radiative forcing of 5.2 mW m−2. This is the second-largest radiative forcing among all HFCs and fluorinated gases just after HFC-134a (14.3 mW m−2) (Montzka et al., 2019). Miller and Kuijpers (2011) suggested that if no additional abatement measures are implemented to reduce HFC-23, its emission will rise to 24 Gg yr−1 in 2035, and the mole fraction will rise to 50 ppt, which corresponds to a radiative forcing of 9 mW m−2. Furthermore, if emissions of HFC-23 were not regulated and all UNFCCC CDM projects were terminated, the HFC-23 emission growth rate after 2030 would rise to 0.8 Gg yr−2, which is 4 times larger than the previous trend (Miller and Kuijpers, 2011). In 2016, the parties to the Montreal Protocol agreed to amend the Montreal Protocol to gradually reduce the production and consumption of HFCs (the 2016 Kigali Amendment) and to control emissions of HFC-23. Unfortunately, Stanley et al. (2020) reported that the global HFC-23 emissions, derived from atmospheric measurements (top-down estimate), reached 15.9 ± 0.9 Gg yr−1 in 2018, which was higher than in any year in history. Moreover, their results indicated that the top-down global emission in 2017 was 12.5 ± 0.7 Gg yr−1 higher than the inventory-based emission of 2.4 Gg yr−1 (bottom-up estimate). This result clearly implies that unreported HFC-23 by-product emissions exist. Therefore, the global observation system of atmospheric HCFC-22 and HFC-23 abundances is important to monitor the efficacy of the phase-down under the Montreal Protocol and to accurately project the impact of emissions of these compounds on ozone depletion and climate change into the future.
A ground-based in situ measurement of HCFC-22 with a gas chromatography–mass spectrometer (GC-MS) technique was first reported by Rasmussen et al. (1980). The Halocarbons and other Atmospheric Trace Species (HATS) group in the Global Monitoring Division (GMD) of the Earth System Research Laboratory at the National Oceanic and Atmospheric Administration (NOAA/ESRL) has been analyzing atmospheric minor constituents sampled in flasks at several remote sites since 1977, and the measurement of HCFC-22 by the HATS group started in 1992 (Montzka et al., 1993, 2009). The Advanced Global Atmospheric Gases Experiment (AGAGE) observation network, supported by a consortium of multinational institutions and organizations, started HCFC-22 in situ measurements in 1998 using a GC-MS (adsorption–desorption systems (ADSs) since 1998 and more advanced “Medusa” systems since the mid-2000s) (Simmonds et al., 1995; Prinn et al., 2000; O'Doherty et al., 2004; Miller et al., 2008).
In contrast, the history of in situ observation of atmospheric HFC-23 is relatively short. Atmospheric HFC-23 abundances were first reported in Oram et al. (1998) based on GC-MS measurements of flask background air samples collected at Cape Grim, Tasmania, Australia (40.7∘ S, 144.7∘ E), from 1978 to 1995. But high-frequency in situ measurement of HFC-23 by the AGAGE network are only available since the late 2000s using the GC-MS-Medusa at AGAGE stations (e.g., Cape Grim; Gosan, Jeju island, South Korea – 33.3∘ N, 126.2∘ E) (Miller et al., 2010; Kim et al., 2010; Simmonds et al., 2018a). Also, in situ measurements of HFC-23 with AGAGE-compatible (but not identical) instruments have been made at two stations of the National Institute for Environmental Studies (NIES) in Japan: Hateruma, Okinawa (24.1∘ N, 123.8∘ E; since 2004), and Cape Ochiishi, Hokkaido (43.2∘ N,145.5∘ E; since 2006) (Yokouchi et al., 2006; Fang et al., 2015). In total, however, there are only 13 sites with HFC-23 in situ measurements in the AGAGE network, including three affiliated stations.
Thanks to the evolution of molecular spectroscopy and increasing atmospheric concentrations, spaceborne remote sensing observation of HFCs, in addition to several CFCs and HCFCs, became possible (Nassar et al., 2006). For HFC-23, the first spaceborne and balloon-borne remote sensing observations were done by the Atmospheric Chemistry Experiment-Fourier Transport Spectrometer (ACE-FTS) on SCISAT and the JPL MkIV interferometer using the spectral region (1140–1160 cm−1) covering the ν2 and ν5 vibrational–rotational transition bands of HFC-23 (Harrison et al., 2012). Fernando et al. (2019) reported the HFC-23 trend above cloud top derived from the ACE-FTS measurements for the period of 2004–2017 and indicated that the annual HFC-23 mole fractions retrieved from the ACE-FTS consistently averaged 5 % smaller than ones at ground level from the AGAGE annual global mean dataset.
The Network for the Detection of Atmospheric Composition Change – Infrared Working Group (NDACC-IRWG) has been globally monitoring abundances of various atmospheric trace gases (e.g., O3, HCl, HNO3, CH4, CO) using ground-based Fourier transform infrared (FTIR) spectrometer instruments (De Mazière et al., 2018). At present, the contributing ground-based FTIR instruments to the NDACC-IRWG are located at more than 20 sites around the world and have yielded long-term consistent high-quality data by adherence to strict measurement and analysis procedures. For CFCs and HCFCs, for example, atmospheric CFC-11, CFC-12, and HCFC-22 have been retrieved from infrared spectra taken by ground-based FTIR spectrometers at Reunion Island (Zhou et al., 2016). For HFCs, however, there has been no attempt to retrieve their atmospheric abundances. If routine observations of atmospheric HFC-23 using the NDACC's ground-based FTIR spectrometers were possible, we could fill spatial and temporal gaps in the existing observations by AGAGE and ACE-FTS, which would allow for monitoring of global atmospheric HFC-23 abundances in greater detail than ever.
This study aims to investigate the retrieval procedure of atmospheric HFC-23 using the overlapping ν2 and ν5 vibrational–rotational transition bands of HFC-23. We analyze solar infrared spectra observed by two ground-based FTIR spectrometers installed at Rikubetsu, Japan, and Syowa Station, Antarctica. First, the details of the FTIR observations at both sites are described in Sect. 2. In Sect. 3, the retrieval strategy of HFC-23 for both sites is described in detail. Section 4 presents the results and characteristics of the HFC-23 retrievals, including the retrieval error budget. In Sect. 5, the time series of our FTIR-retrieved HFC-23 are compared to the in situ measurements from the AGAGE network and the modeled annual global mean dataset based on the AGAGE measurements. In addition, we discuss the HFC-23 trends derived from each dataset. Finally, conclusions and perspectives are summarized in Sect. 6.
2.1 Rikubetsu
Measurements of atmospheric trace gases at Rikubetsu, Hokkaido, Japan (43.5∘ N, 143.8∘ E), have been carried out since May 1995 using two high-spectral-resolution FTIR instruments as part of NDACC-IRWG. The site is located 200 km east of Sapporo in a small town surrounded by forests and pastures. In October 1997, this observatory was relocated to the top of a hill (380 ) near the town. The first instrument, which operated until April 2010, was a Bruker IFS-120M FTIR spectrometer. In 2013, a Bruker IFS-120/5HR, an upgrade of the IFS-120HR, was installed as a second instrument taking over the observations by the IFS-120M, contributing to the Total Carbon Column Observing Network (TCCON) in addition to NDACC-IRWG. The FTIR instruments at Rikubetsu have been taking solar infrared spectra from 500 to 7500 cm−1 with a KBr beam splitter, the NDACC-recommended optical filters, and two liquid-nitrogen-cooled detectors since 1995: indium–antimonide (InSb) and mercury–cadmium–telluride (HgCdTe, so-called MCT). Typically, measurements with 2 scans were executed to acquire a spectrum with a resolution of 0.0035 cm−1; however, sometimes 4 to 16 scans were co-added to improve signal-to-noise ratios (SNRs). These measurements covering long periods of time have been used for various studies of atmospheric tracers (e.g., O3, CO, C2H6, and HCN) related to stratospheric composition change and biomass burning (Nakajima et al., 1997; Zhao et al., 1997; 2002; Koike et al., 2006; Nagahama and Suzuki, 2007).
In this study, we used the spectra measured with the NDACC optical filter no. 6 (covering 500–1400 cm−1) and an MCT detector under clear-sky conditions since October 1997. For the observations with the NDACC filter no. 6 by the IFS-120/5HR from 2013 to 2018, the SNR values of the spectra are unfortunately about 20 % of those achieved before the replacement of the instrument in 2013 because smaller apertures were used. Since 2019, the more suitable aperture size of 1.7 mm has been adopted for measurements using the NDACC optical filter no. 6. Hence, those observed spectra were additionally used in the retrievals of HFC-23. Also, these spectra are degraded to 0.0070 cm−1 (see Sect. 3.3).
2.2 Antarctic Syowa Station
Since the Japanese Antarctic Syowa Station (69.0∘ S, 39.6∘ E; 10 ) was established in 1957, various kinds of scientific observations (e.g., meteorology, upper atmospheric physics, cryospheric sciences, biology, geology) have been conducted. Syowa Station has been maintained by members of the Japanese Antarctic Research Expedition (JARE). In 2007, a Bruker IFS-120M FTIR instrument was installed at Syowa Station by NIES and Tohoku University, in cooperation with the 48th JARE members. Measurements using the FTIR at Syowa Station contributed to research related to stratospheric composition near the edge of the polar vortex during ozone hole evolution due to its geographical location (Nakajima et al., 2020). As this is a remote site in Antarctic, it is possible to observe the background atmosphere of the Southern Hemisphere, which is not influenced by local human activity.
The instrument has two liquid-nitrogen-cooled detectors (InSb and MCT), which are the same as those in the FTIR at Rikubetsu. Solar infrared spectra (500–7500 cm−1) were recorded using the same measurement settings as used at Rikubetsu under clear-sky conditions in 2007 (and January 2008), 2011, and 2016 but not during polar night periods. In this study, we used the spectra covering 500–1400 cm−1 measured with the MCT detector. Note that the observed spectra in 2007 were measured with the NDACC filter no. 6, but since January 2008 the observations covering this spectral region have been separated into two measurements using the narrower NDACC filter no. 7 (covering 500–1100 cm−1) and no. 8 (covering 1000–1400 cm−1). Similar to observations at Rikubetsu, these measurements were used from 2 to 16 scans with 0.0035 cm−1 resolution. However, we degrade the resolution of these spectra to 0.0070 cm−1 (see Sect. 3.3).
To derive HFC-23 vertical mole fraction profiles and total column abundances, all spectra taken from the FTIR instruments at Rikubetsu and Syowa Station were analyzed with the SFIT4 version 0.9.4.4 program (see https://wiki.ucar.edu/display/sfit4/, last access: 13 August 2021) based on the optimal estimation method (OEM) of Rodgers (Rodgers, 1976; Rodgers, 2000). This program was developed by scientists from the National Center for Atmospheric Research (NCAR), the University of Bremen, and other institutes taking part in the NDACC-IRWG as an upgraded version of the previous SFIT2 algorithm (Pougatchev et al., 1995). This program includes a procedure to calculate the theoretical absorption spectrum based on prior information (e.g., meteorological profiles, a priori profile of target) and fits the calculated spectrum to the observed one for one or more selected spectral regions (micro-windows; MWs). Finally, the program derives the most suitable state vector (i.e., the retrieved target profile) that balances information obtained from observations and from the a priori. Hereafter, the details of HFC-23 retrieval are described.
3.1 Retrieval method
From the Rodgers OEM, the measured spectrum y can be written using a forward model F with a vector vertical profile of gas x and all non-retrieved parameters (temperature, pressure, etc.) in vector b as
where ε is the measurement noise. By taking a Taylor series expansion around an a priori profile xa and best-estimated value of b, as well as neglecting higher orders, we get the linear expression of Eq. (1) as
where ya is a spectrum calculated from a priori, and K and Kb are weighting function matrices, also called the Jacobians, for state vector x and model parameter b, respectively. From the inversion of Eq. (2), we get the best-estimated vertical profile of the gas mole fraction vector as

where is the gain matrix, or contribution function, which represents the sensitivity of the retrieved parameters to the measurements. Combining a profile x taken from an observed spectrum y with an a priori profile as described in Rodgers (1976) and assuming a linear relationship , the best estimation of is defined as the following weighted average:
where Sa and Sε are a priori and measurement noise covariance matrices, respectively, and is the covariance matrix of . Comparing Eq. (3), which neglects the error terms of the forward model parameters and the measurement noise, with Eq. (4), we get the following matrix, which is the so-called averaging kernel matrix A:
which is described in Rodgers (2000) in detail. Each line in matrix A is called the averaging kernel, which represents the sensitivity of the retrieved value compared to the true value. The sum of diagonal elements of matrix A (trace; tr(A)) is called degrees of freedom for signal (DOFS), which gives the number of pieces of vertical information.
Since the forward model for FTIR observation is usually a nonlinear problem, is taken by minimizing the following cost function J derived from Bayes' theorem and Gaussian statistics:
where is a regularization matrix. The second term of Eq. (6) is generally called the constraint, and it is important for a stable solution of the state vector x. In the case of the Rodgers OEM, the covariance matrix obtained from a realistic variability of target gas is used as the regularization matrix R, but we use Tikhonov regularization (Tikhonov, 1963) to set up R in this study. The details about selection of the regularization matrix are described in Sect. 3.5. Finally, the cost function is minimized by the Gauss–Newton iteration method so that the appropriate profile is found by iteration, which is described as
where i = 0, 1, 2,…, is the iteration counter, Ki is the Jacobian diagnosed at xi, and yi = F(xi). If this iterative calculation converges, the best estimate of results.
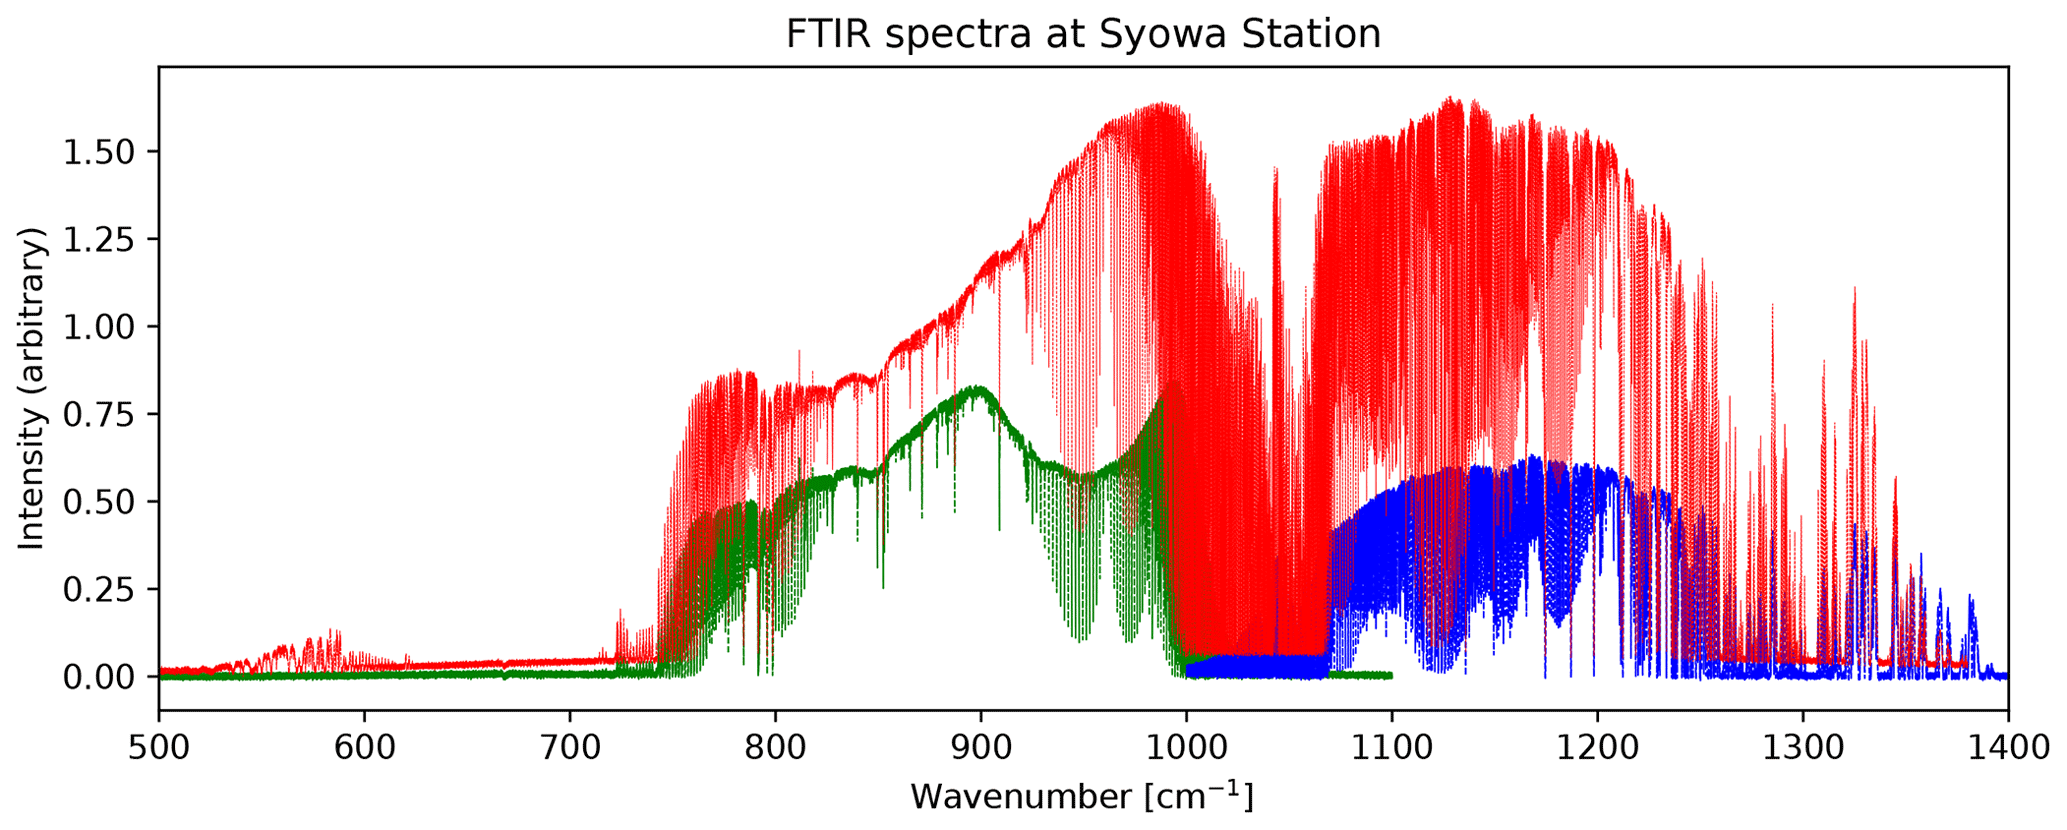
Figure 1Examples of solar absorption spectra taken from FTIR observations at Syowa Station. The red spectrum was obtained with the filter no. 6 on 30 September 2007. The green and the blue ones were measured with filter no. 7 and no. 8 on 30 September 2011, respectively. A positive zero-level offset is clearly seen in the red filter no. 6 spectrum.
3.2 Retrieval micro-windows
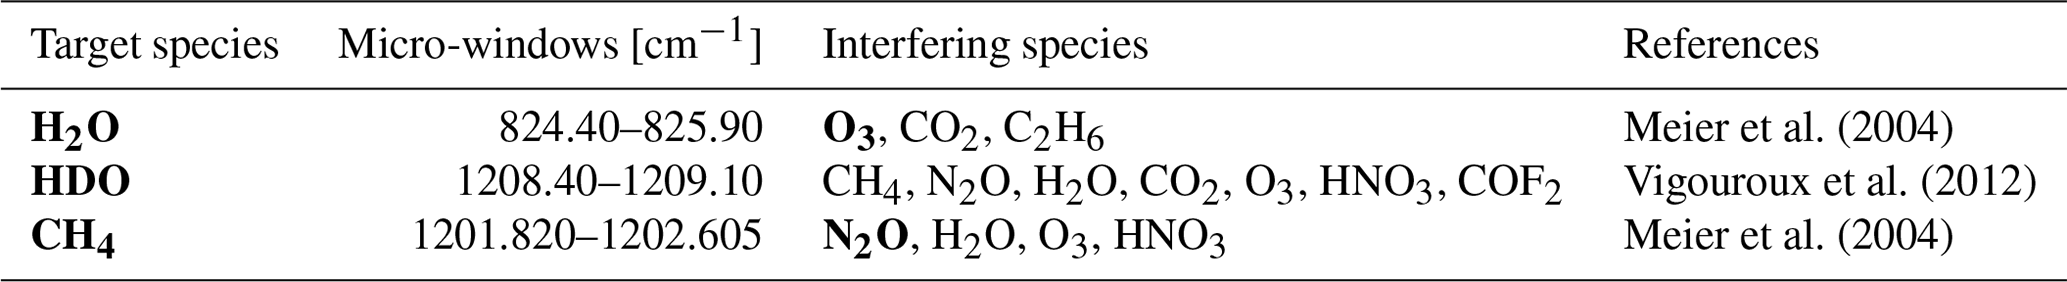
Table 1 summarizes the strategy for the retrieval of HFC-23 in this study. For the retrieval of HFC-23 from FTIR spectra, we used the ν2 and ν5 vibrational–rotational transition bands of HFC-23 located at ∼ 1150 cm−1, which is the same spectral region as the retrieval of ACE-FTS (Harrison et al., 2012). The infrared absorption by HFC-23 typically contributes to only about 1 % of the atmospheric transmittance of solar infrared radiation at ground level. Hence, the choice of MWs is critically important for the retrieval of HFC-23 from ground-based measurements. To avoid three strong H2O absorption lines at 1149.47 cm−1, 1151.54 cm−1, and 1152.44 cm−1, we used two MWs: MW1 at 1138.5–1148.0 cm−1 and MW2 at 1154.0–1160.0 cm−1. Major interfering species in these MWs are O3, N2O, CH4, H2O, HDO, CCl2F2 (CFC-12), CHClF2 (HCFC-22), and CH3C(O)OONO2 (peroxyacetyl nitrate: PAN). Since there are several strong absorption lines of O3 and N2O in these MWs, we retrieve profiles of these gases in addition to HFC-23. For the other species except for CH4, we fit to an observed spectrum by scaling the a priori profile (column retrieval). In addition, CH3CCl2F (HCFC-141b) and CH3CClF2 (HCFC-142b) exist as minor interfering gases in these MWs, but these gases were not retrieved in this study because the contributions of these gases to the transmittance in the MWs are very small. More details are given in the following sections.
3.3 Spectral correction and instrumental line shape
As was stated in Sect. 2, absorption spectra, which include HFC-23 retrieval MWs, were recorded with the NDACC no. 6 and no. 8 optical filters in the MCT channel with 0.0035 cm−1 resolution. In order to reduce the spectral random noise, we degraded the spectral resolution from 0.0035 cm−1 to 0.0070 cm−1. Note that the zero level of the measured spectra (see Fig. 1) are raised (about +5 % relative to maximum signal intensity) and curved due to the nonlinearity of the MCT detector. Therefore, we corrected this zero-level offset in the measured spectrum with a second-order polynomial fit using well-known absorption-saturated bands sprinkled over the spectral region of 750–1350 cm−1.
On the other hand, the continuum level, which is equal to 100 % in transmittance, has a shape that is caused by the optical characterization of the FTIR instrument, especially the optical bandpass filter. Since the MWs for HFC-23 retrieval are rather wide, the slope and curvature (parabola) of the spectral continuum level over each MW are retrieved in the SFIT4 program. This correction multiplies the transmission spectrum B by
where α is the curvature, β is the slope factor, w is the wavenumber vector in the MW, and w0 is the starting wavenumber of the MW. As a result, the calculated spectrum yc can be written as
where τ(w) is a calculated transmission spectrum with absorptions by each gas and solar lines (the Fraunhofer lines), and ψ[τ(w)] is a transmission spectrum of τ(w) convolved with an instrumental line shape (ILS) function.
Hydrogen bromide (HBr) gas-cell spectra were taken using a mid-infrared internal light source to check the alignment of the FTIR instrument and to evaluate the ILS function for both the instruments at Rikubetsu and Syowa Station. At Rikubetsu, the first HBr cell spectrum was taken on 26 March 2002 after the relocation of the instrument in October 1997. In this study, all observed spectra from October 1997 to April 2010 with the IFS-120M instrument were convolved with the ILS function derived from the HBr cell measurement. For all spectra observed with the IFS-120/5HR instrument, the ILS function was accurately defined by the theoretical model for the given instrument configuration because the instrument had always been maintained with the best optical alignment. At Syowa Station, HBr cell spectra were taken from time to time following installation and re-alignment. Therefore, ILS corrections were applied for all the spectra. The modulation efficiency and phase error of the ILS at Rikubetsu and Syowa Station were evaluated with the LINEFIT9 and LINEFIT14 programs, respectively (Hase et al., 1999).
3.4 Spectroscopic parameters
For the calculation of absorption by each atmospheric species, the HITRAN 2008 line-by-line spectroscopic database (Rothman et al., 2009) was primarily used. For spectroscopic parameters of H2O and its isotopes, the updated ATM18 line list by co-author G. C. Toon (NASA/JPL) was used (see https://mark4sun.jpl.nasa.gov/toon/atm18/atm18.html, last access: 8 August 2020). For heavy molecules (such as CFCs, HCFCs, HFCs, and PAN), there are no resolved line lists available in HITRAN 2008. For our retrieval of CFC-12, HCFC-22, HFC-23, and PAN, we used a pseudo-line list (PLL) developed by co-author G. C. Toon (see https://mark4sun.jpl.nasa.gov/pseudo.html, last access: 13 August 2021). In these PLLs, the 296 K line strength and ground-state energy (E′′) for each pseudo-line were empirically reproduced by fitting transmittance laboratory spectra (absorption cross sections) acquired under various temperature and pressure conditions. In Harrison et al. (2012), the PLL of HFC-23 obtained from the cross sections acquired with a resolution of 0.02 cm−1, a temperature range of 214–300 K, and a total pressure range of 0.184–253 Torr by Chung (2005) was used to analyze solar occultation spectra, but there was a large systematic bias of ∼ 30 % in the retrieved profiles. This is mostly caused by the poor quality of the cross section dataset used (e.g., inconsistency between the spectral absorptions and the temperature–pressure–mole fraction conditions). To reduce the systematic uncertainty in the HFC-23 PLL, Harrison (2013) reported new absorption cross section measurements with a resolution of 0.015 cm−1, which cover a wider spectral range of 950–1500 cm−1 and more realistic atmospheric conditions in the troposphere and the stratosphere, i.e., a wider temperature range of 188–294 K and a wider pressure range of 23–762 Torr.
For the current study, a new HFC-23 PLL was used with a wavenumber interval of 0.004 cm−1 over a spectral range of 1105–1425 cm−1 (https://mark4sun.jpl.nasa.gov/data/spec/Pseudo/CHF3_PLL_Update.pdf, last access: 13 August 2021). In addition to the spectra from Chung (2005), these pseudo-line parameters were obtained from refitting Harrison's 2013 laboratory spectra, three spectra from the Pacific Northwest National Laboratory (PNNL) infrared database (Sharpe et al., 2004), and one spectrum from Gohar et al. (2004). Using this new PLL, which is dominated by the Harrison 2013 data, the bias in MkIV balloon measurements of HFC-23 is eliminated. In the forward model, the absorption line intensities are calculated by assuming a Boltzmann distribution, which includes the temperature dependences of rotational–vibrational partition functions and induced emission. For the rotational partition function, its temperature dependence is calculated from , where T is the temperature and β is the temperature coefficient. For HFC-23, β was set to 1.5, the normal value for nonlinear molecules. To calculate the vibrational partition function, we assumed a harmonic oscillator approximation and used the fundamental vibrational frequencies and degeneracies from Ceausu-Velcescu et al. (2003). For solar lines, we used the empirical line-by-line parameters in the mid-infrared region (Hase et al. 2006) in the SFIT4 program package.
3.5 Information of atmospheric state and regularization matrix
We consider 47 atmospheric layers for Rikubetsu and 48 layers for Syowa Station from the ground to 120 km in altitude. The thickness of the layers increases with altitude. We used Reanalysis-1 daily temperature and pressure data obtained from the National Center for Environmental Prediction (NCEP; http://www.ncep.noaa.gov) from the ground to 40 km and zonal monthly mean climatological profiles from the COSPAR International Reference Atmosphere 1986 (CIRA-86) from 40 km to 120 km (Rees et al., 1990). For the a priori profiles of N2O, O3, and PAN, the averaged profiles in the period of 1980–2020 derived from the monthly mean profile data computed by the Whole Atmospheric Community Climate Model (WACCM) version 6 (Chang et al., 2008) were used.
For CFC-12, HCFC-22, HCFC-141b, and HCFC-142b, the mean profiles for 1995–2010 at Rikubetsu and for 2007–2016 at Syowa Station derived from the WACCM monthly dataset were used because these species in the atmosphere have dramatically increased since 1980. Note that the mean profiles of HCFC-141b and HCFC-142b were used as fixed profiles in the HFC-23 retrieval.
For HFC-23, WACCM does not provide a profile, and thus the a priori profile of HFC-23 was based on the global and annual mean mole fraction profile from the two-dimensional chemistry–radiation–transport model by Naik et al. (2000). This a priori profile shows little decrease in HFC-23 mixing ratios above the tropopause, reflecting a very long lifetime (228 years) of HFC-23 in the atmosphere (Montzka et al., 2019). For Rikubetsu, the HFC-23 a priori profile was scaled to 16 ppt at the ground, which corresponds to the mole fraction of HFC-23 in 2002 in the Northern Hemisphere. For Syowa Station, the HFC-23 a priori profile was scaled to 24 ppt at the ground, which corresponds to the mole fraction of HFC-23 in 2011 in the Southern Hemisphere.
For H2O, HDO, and CH4, a priori profiles were preliminarily retrieved (pre-retrieved) using other independent MWs because these profiles may induce large uncertainties in the HFC-23 retrieval. The detailed pre-retrieval procedure is described in Sect. 3.6.
Table 2Windows used for the pre-retrievals of H2O, HDO, and CH4. Profile-retrieved species are in bold.
In the retrieval of an atmospheric profile, it is crucial to select an optimal regularization matrix as a constraint on the a priori profile because the regularization matrix affects the vertical resolution and the retrieval error. In the case of the general OEM, the regularization matrix R is the inverse of the a priori covariance matrix Sa, which represents the natural variability for the target. To calculate Sa, the climatological dataset, which is constructed by a large number of independent profiles, should be used. For O3, this is available because there are several high-frequency observations (e.g., balloon-borne sondes, satellite measurements). In many cases, however, it is difficult to calculate realistic natural variabilities for a priori profiles, and our target gas is one of them. Therefore, Sa is set up by an ad hoc method. In this study, Tikhonov regularization (Tikhonov, 1963) was used as in the previous studies of Sussman et al. (2009) for water vapor and Vigouroux et al. (2009) for formaldehyde (HCHO). The regularization matrix is defined as R = αLTL, where α is the strength parameter of the constraint and L is a discrete derivative operator. We used the discrete first-order derivative operator L1 as L:
The operator conserves the vertical shape of the a priori profile and suppresses oscillation of the retrieved profile. We have to properly determine the value of the regularization parameter α, which is tuned to balance the constraint on the a priori profile and the residual between the measured and the calculated spectra, the so-called L-curve method (Hansen, 1992). In this study, we tuned α following the alternative method described in Sect. 4.D of Steck (2002). This method can determine the optimal α to minimize the total retrieval error (the smoothing plus the measurement errors; for details, see Sect. 4.2). In this study, we used α = 100 for all retrievals at Rikubetsu and Syowa Station.
According to Eq. (6), we can understand that the measurement noise covariance matrix Sε is also a key constraint that balances the observations against the regularization matrix. We use the real SNR of the measured spectrum as an indicator of the noise level in the first iteration, but the SNR defined as the inverse of the root mean square (rms) value of the residuals in the previous spectral fit (referred to as the fitted residuals) is used in the following iterations. The SNR from the fitted residuals is smaller than the real one since the fitted residuals are caused by various imperfections in forward model parameters (e.g., spectroscopic data, temperature profile, ILS) in addition to simple measurement noise. It is assumed that Sε is a diagonal matrix, and we put in the diagonal elements of Sε, where ym and yc are the measured and the calculated spectrum, respectively, and N is the number of spectral points.
3.6 Pre-retrievals for H2O, HDO, and CH4
The vertical gradient and spatial–temporal variability of water vapor in the atmosphere are very large. For many ground-based FTIR observations, it is impossible to choose the retrieval MWs without absorption structures of water vapor and its isotopes, and thus it is important to use accurate water vapor profiles that are coincident with the location and time of each observation. Many previous studies (Vigouroux et al., 2009; 2012; Ortega et al., 2019) used the pre-retrieved H2O (and/or HDO) profiles with dedicated MWs in order to reduce their interference errors. In this study, a priori profiles of H2O and HDO were acquired by pre-retrievals using the different MWs shown in Table 2.
H2O profiles were retrieved by using the MW of 824.40–825.90 cm−1 as suggested in the NDACC IR reference micro-window atlas (Meier et al., 2004) and the monthly profiles derived from the WACCM version 6 in the period of 1980–2020 as the a priori profile for each spectrum. Since an H2O absorption line having an E′′ of 586.48 cm−1 is in the MW, we assume that the uncertainties of the retrieved H2O profiles caused by temperature dependence on the line strength are small. The H2O line is relatively weak and is hardly ever saturated, even when the humidity at Rikubetsu is high in summer. For HDO, the profile was pre-retrieved using the MW of 1208.40–1209.10 cm−1, and the pre-retrieved H2O profile shape was used as a priori profile shapes for HDO and H2O. This HDO MW was used in the study of Vigouroux et al. (2012), but our MW is slightly wider than the previous study because the DOFS for HDO was increased when the wider window was used. We estimated the retrieval uncertainties to be approximately 10 % for the pre-retrieved total columns of H2O and HDO, mainly due to systematic uncertainties of the spectroscopic parameters based on HITRAN 2008.
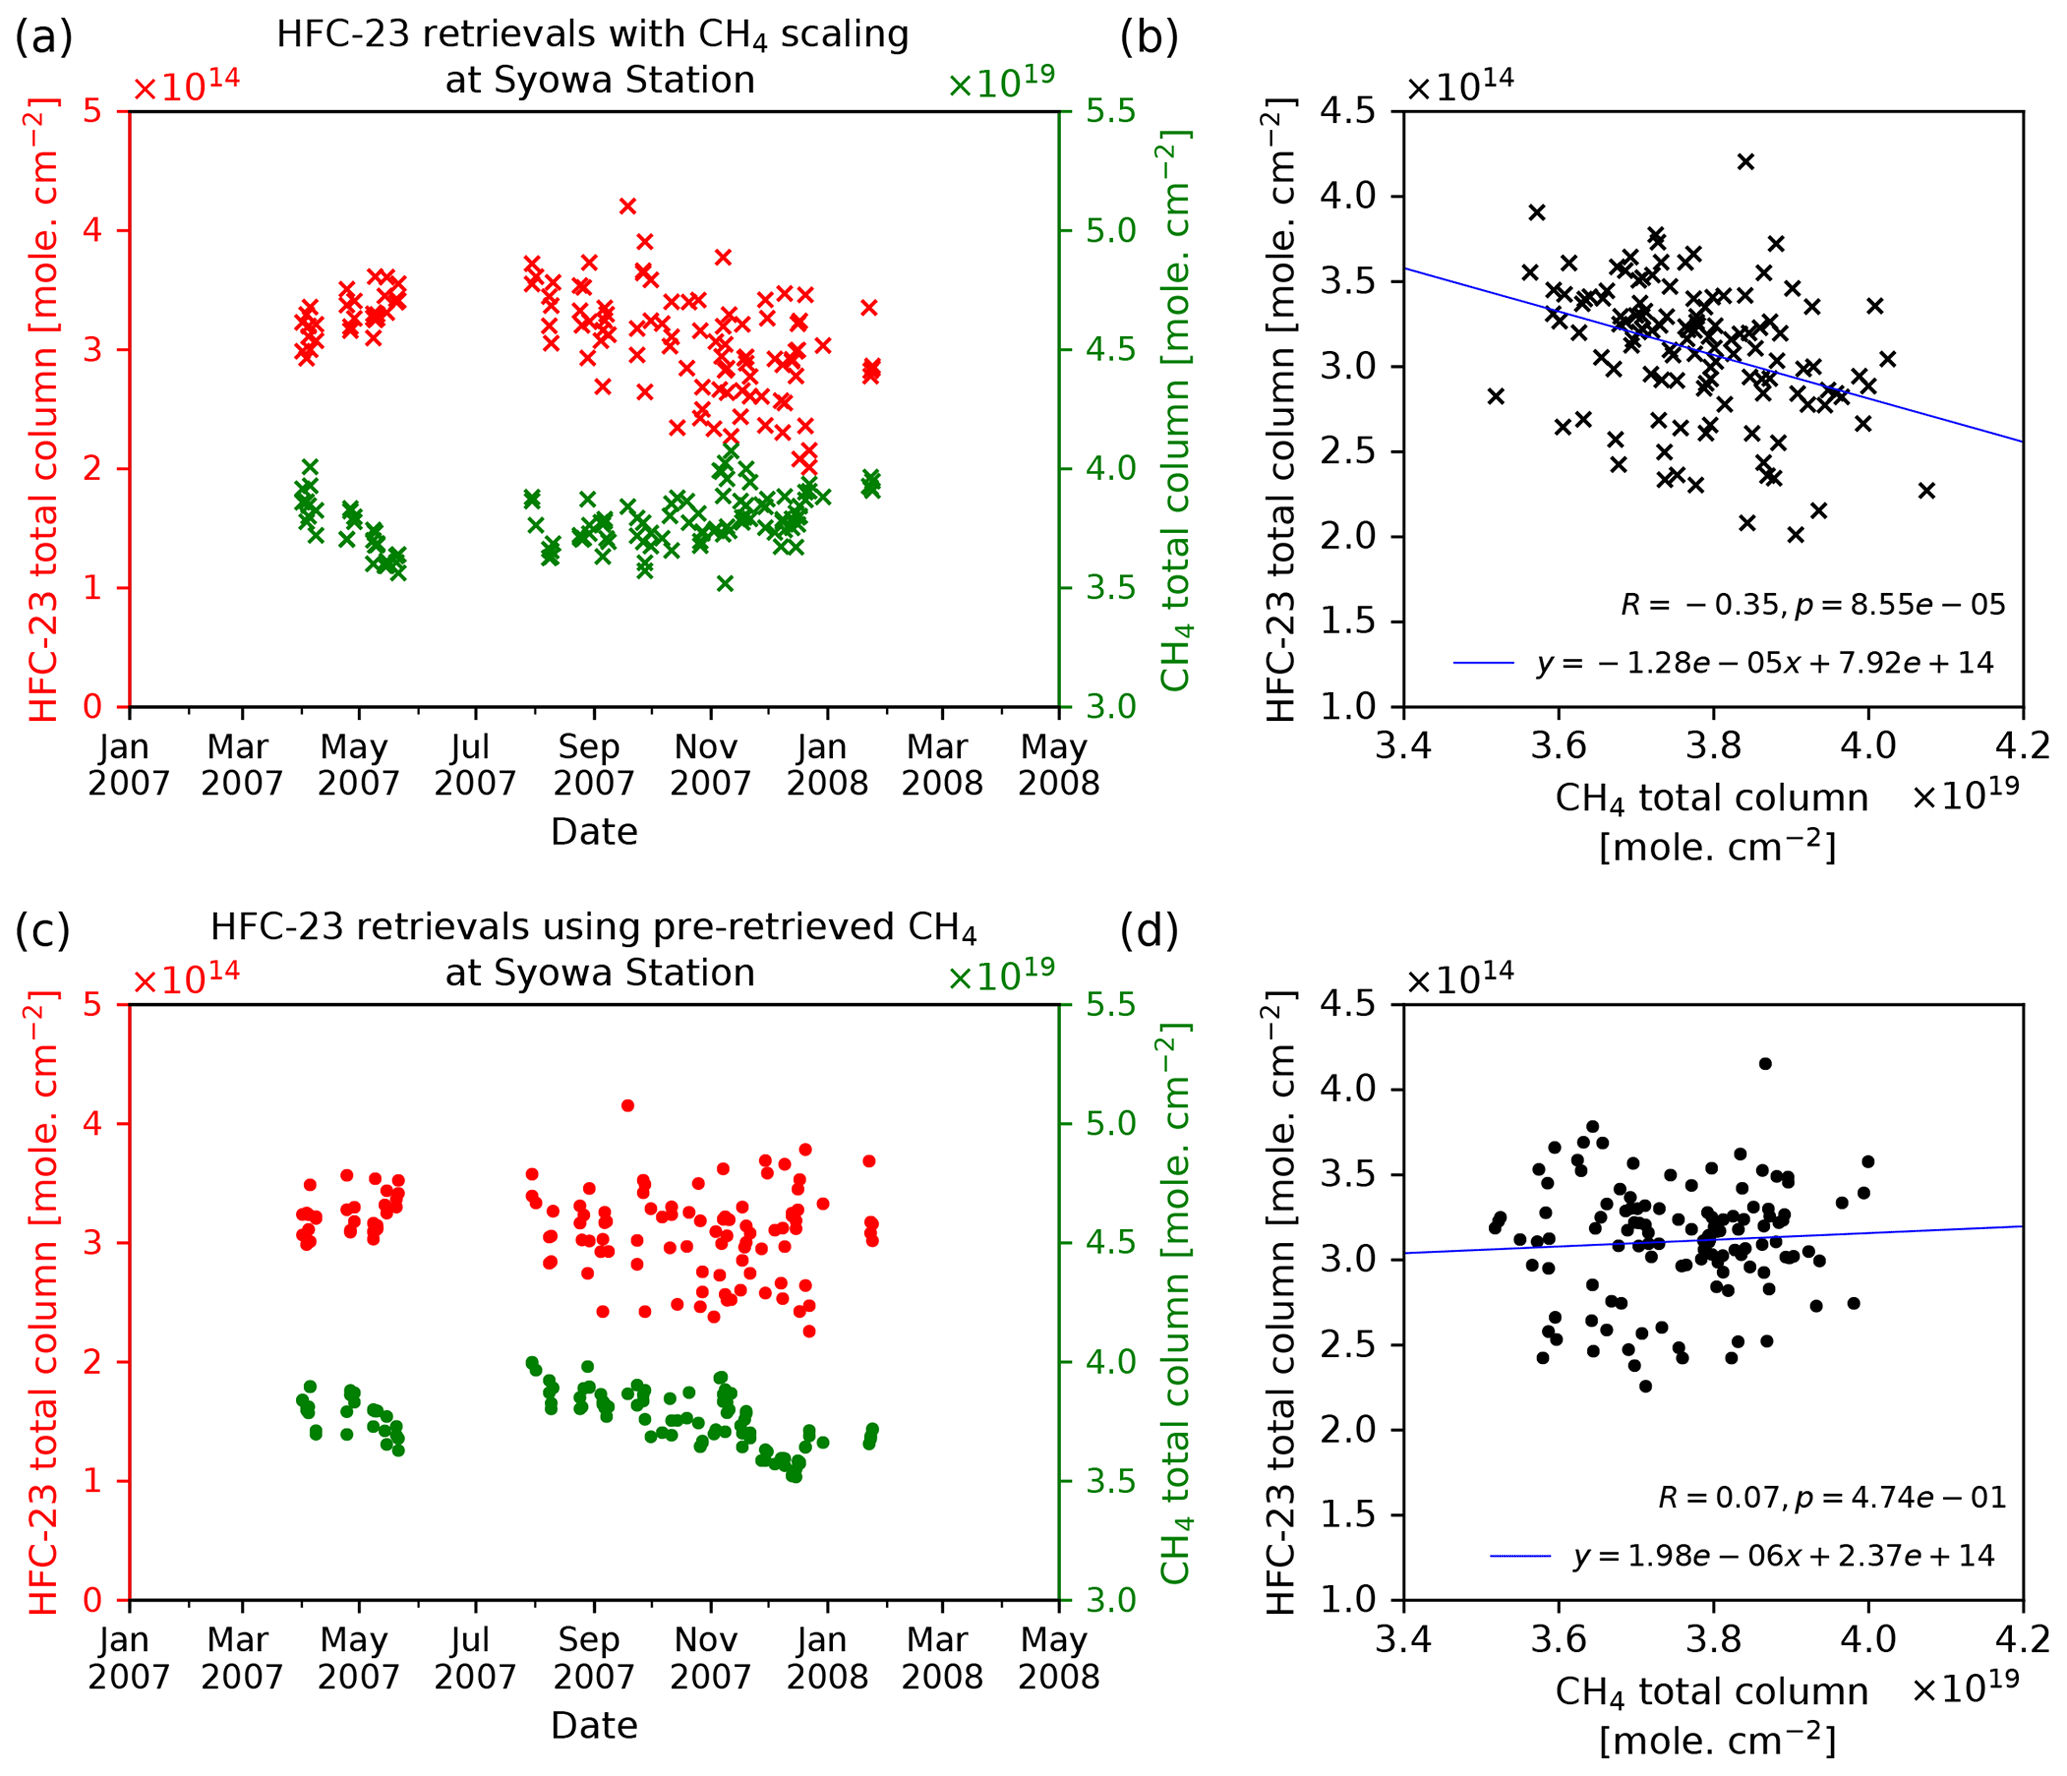
Figure 2Time series of the total columns of HFC-23 and CH4 retrieved from FTIR infrared spectra observed at Syowa Station in 2007 and January 2008. (a) HFC-23 total columns (red X plots) derived from HFC-23 retrievals accompanied by column retrieval (scaling) of the CH4 profile and the scaled CH4 total columns (green X plots). (b) The correlation between HFC-23 and CH4 of (a). (c) Independent retrieved CH4 total columns using a spectral region from 1201.820 to 1202.605 cm−1 (green dots) and HFC-23 total columns from retrievals using the independent retrieved CH4 profiles as fixed profiles (red dots). (d) The correlation between HFC-23 and CH4 of (c). Note that these retrieved HFC-23 columns were selected by the threshold of the fitted rms value depending on the value of the solar zenith angle (SZA): the thresholds of the fitted rms are < 0.5 % for SZA < 85∘ and < 1.5 % for SZA of 85∘ or greater.
As HFC-23 and CH4 have absorption structures that overlap each other at around 1156 cm−1, the retrievals of these species are difficult because they interfere with each other. Therefore, we took a strategy of “CH4 pre-retrieval”, in which the CH4 amount is determined in another wavelength region, and used the solved CH4 amount as a fixed value for the HFC-23 retrieval. Figure 2 shows the time series of the total columns of HFC-23 and CH4 retrieved from FTIR infrared spectra observed at Syowa Station in 2007 and January 2008 along with their scatter plot. The HFC-23 total column amounts (red X symbols) derived from retrievals of HFC-23 accompanied by column retrieval (scaling) of the CH4 profile and the scaled CH4 total columns (green X symbols) are presented in Fig. 2a. There is an anticorrelation between these two time series. Since the typical seasonal cycle of CH4 shows a minimum in summer due to destruction by the OH radical, the seasonal cycle of the scaled CH4 total columns in the retrievals is inconsistent with the expected cycle. Furthermore, a seasonal cycle in the HFC-23 total columns is observed, but this is not expected since the atmospheric lifetime of HFC-23 is very long and thus its variability due to atmospheric loss is very small. Figure 2b shows the scatter plot of the total columns of HFC-23 and CH4 in Fig. 2a. Upon examination by two-sided hypothesis testing with a Student's t distribution under a null hypothesis in which there is no correlation between these total columns, the anticorrelation between HFC-23 and CH4 is statistically significant with a significance level of 5 % (p value < 0.05). Figure 2c shows the time series of the independently retrieved CH4 total columns using a spectral region from 1201.820 to 1202.605 cm−1 from Meier et al. (2004) (green dots) and of the HFC-23 total columns from retrievals using these independently retrieved CH4 profiles (CH4-fixed retrievals; red dots). In contrast to the scaled CH4 in Fig. 2a, the independently retrieved CH4 shows the expected seasonal cycle. As a result, there is no unrealistic cycle in the HFC-23 total columns derived from these CH4-fixed retrievals. As can be seen in the scatter plot of Fig. 2d, there is no correlation between HFC-23 and interfering CH4. Therefore, we decided to pre-retrieve the CH4 profile with the independent window before the retrieval of HFC-23. For pre-retrieving the profile of CH4, we used the mean CH4 profile (1980–2020) derived from WACCM and the pre-retrieved H2O profiles mentioned above.
In conclusion, the pre-retrieved profiles of H2O, HDO, and CH4 were used as a priori profiles (H2O and HDO) and a fixed profile (CH4) in the subsequent retrieval of HFC-23.
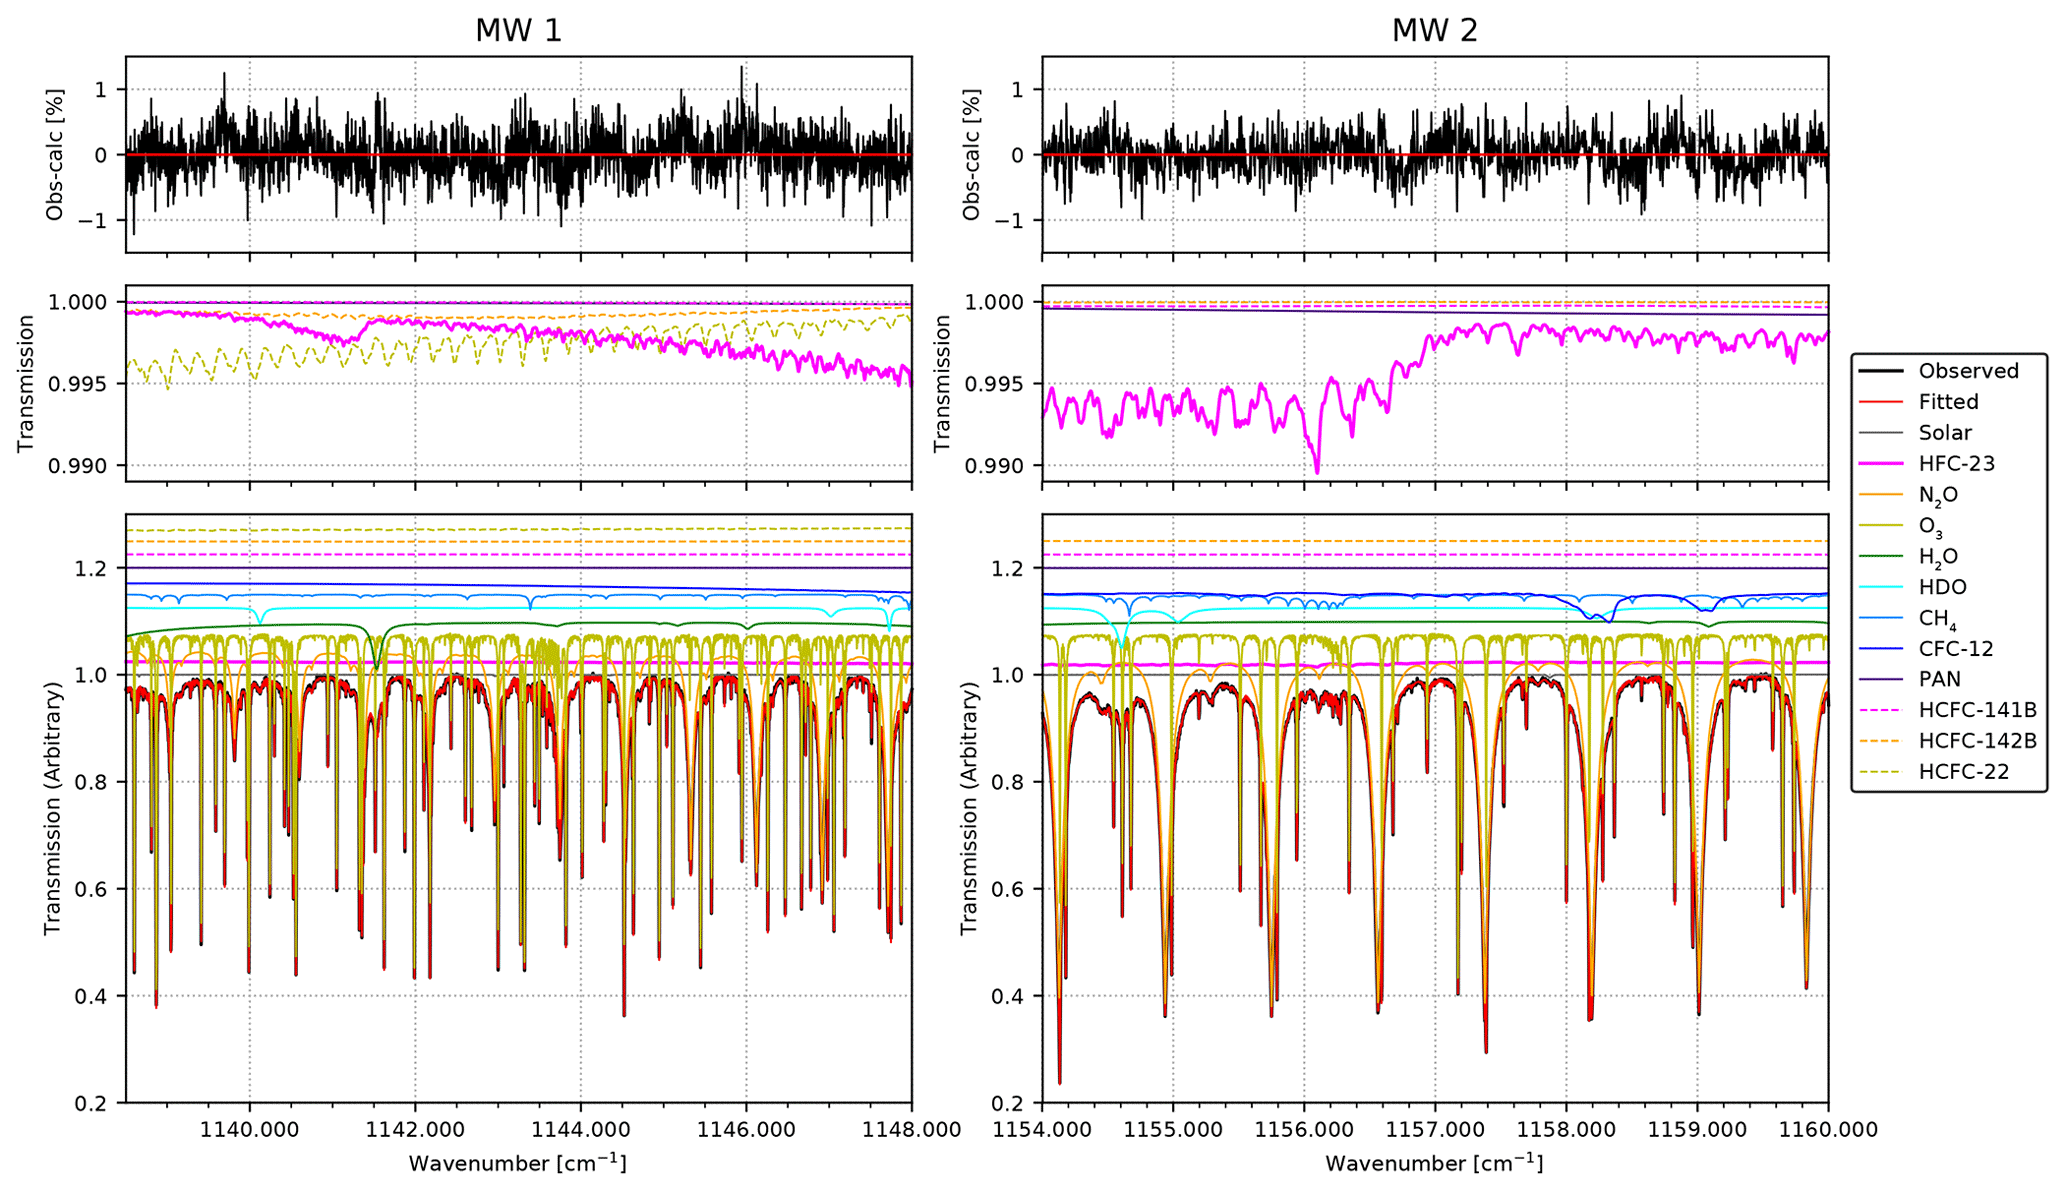
Figure 3Typical spectral simulation results of the two HFC-23 retrieval micro-windows (left panel: MW1; right panel: MW2) fitted to the observed spectrum at Syowa Station on 9 November 2011 at 13:47 UTC. The top two panels show the residuals (observed minus calculated) of the fittings for MW1 and MW2. The middle two panels show the absorption contributions of HFC-23, PAN, HCFC-141b, HCFC-142b, and HCFC-22 in MW1 and MW2. The bottom two panels show the individual contributions from each interfering species, shifted by multiples of 0.025 for clarity, except the observed and the calculated lines.
Figure 3 shows an example spectral fitting result for the two MWs (MW1 and MW2) for HFC-23. This typical fitting was for a spectrum observed by the IFS-120M FTIR spectrometer at Syowa Station on 9 November 2011 at 13:47 UTC with a solar zenith angle (SZA) of 67.3∘. In this case, the absorption contribution of HFC-23 is about 1 % relative to the total transmittance of around 1156 cm−1, corresponding to a total column of 3.85 × 10¹⁴ . The typical root mean square (rms) of the fitted residual (observed minus calculated spectrum) is 0.34 %.
Table 3Statistical summary of the fitted SNRs, the root mean square (rms) of the fitted residuals (observed minus calculated spectrum), the degrees of freedom for signal (DOFS), and the retrieved HFC-23 total columns at Rikubetsu and Syowa Station. The errors of the fitted rms, the DOFS, and the total columns are 1 standard deviation (1σ) around the averages. The numbers of HFC-23 retrievals (N) are divided into two parts: the number of retrievals used in this analysis (valid) and the total ones including those rejected (total).
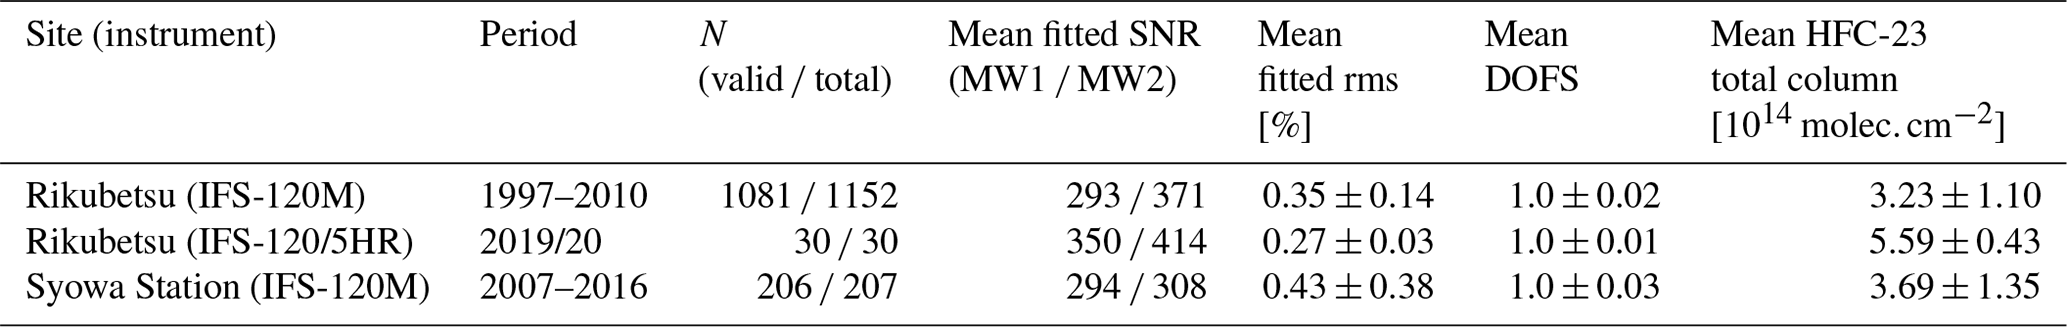
A summary of all the HFC-23 retrievals with SFIT4 at Rikubetsu and Syowa Station is shown in Table 3. The retrievals at Rikubetsu are summarized for the periods of 1997–2010 and 2019/20 due to the use of different instruments. The retrievals without negative values in the profile were counted into the number of observations as the “valid” number, and those results were used to calculate each statistic. About 6 % of observations at Rikubetsu in 1997–2010 were rejected. On the other hand, almost all of observations at Rikubetsu in 2019/20 and at Syowa Station were used. The mean rms of the fitted residuals within 1 standard deviation (1σ) at Rikubetsu is 0.35 ± 0.14 % and 0.27 ± 0.03 % for 1997–2010 and 2019/20, respectively. The mean rms within 1σ at Syowa Station is 0.43 ± 0.38 %. The mean HFC-23 total column within 1σ standard deviation at Rikubetsu increased from (3.23 ± 1.10) × 1014 in the 1997–2010 period to (5.59 ± 0.43) × 1014 in the 2019/20 period due to the increase in atmospheric HFC-23.
In the following sections, we describe the vertical information and the error estimation of our HFC-23 retrieval.
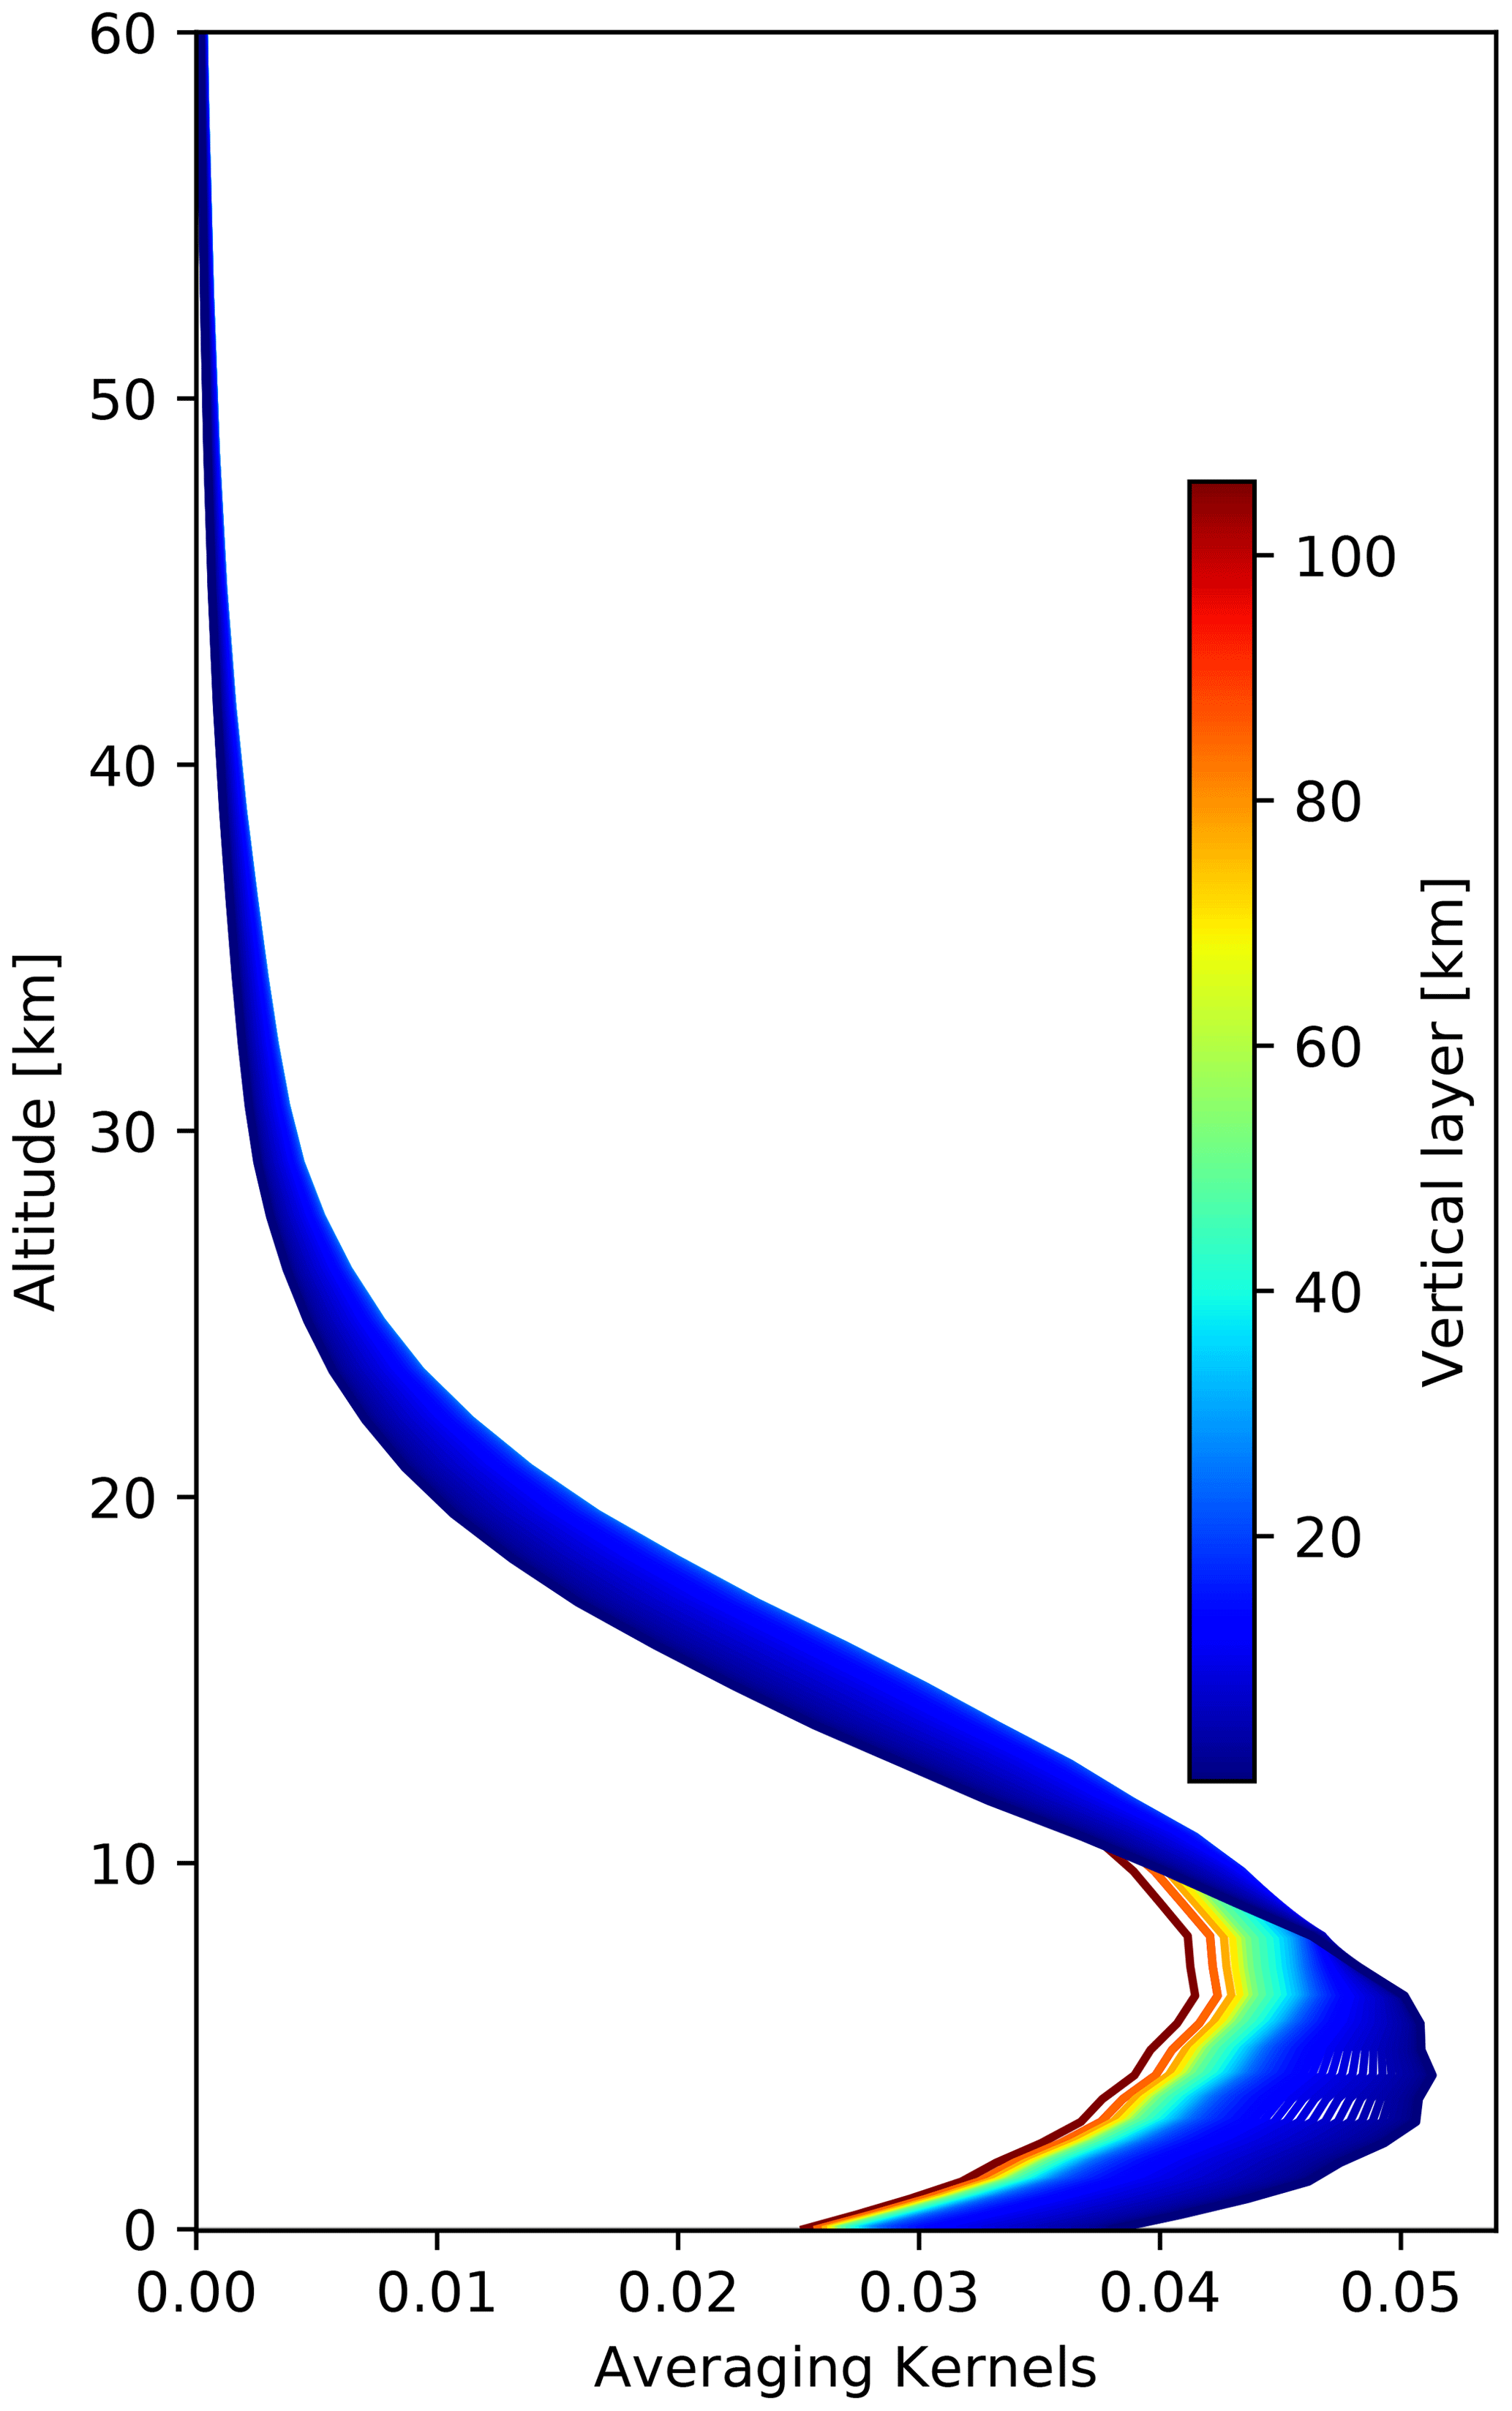
Figure 4Typical averaging kernels of the HFC-23 retrieval for the same spectrum shown in Fig. 3, which are normalized using the a priori profile. Note that the vertical scale is from the surface up to 60 km because there is almost no sensitivity above 60 km.
4.1 Vertical information
As mentioned in Sect. 3.1, the vertical information content of FTIR retrievals is characterized by the averaging kernel matrix A, defined by Eq. (5). Figure 4 shows typical averaging kernels of the HFC-23 retrieval for the same spectrum shown in Fig. 3. Each curve colored according to the right color bar in Fig. 4 represents the row value of the averaging kernel matrix on the corresponding vertical layer. All the retrievals, including the typical case in Fig. 4, are sensitive to the troposphere and lower stratosphere, having a sensitivity peak in averaging kernel at ∼ 4 km. The full widths at half-maximum of the averaging kernels are ∼ 20 km, and the mean DOFS for all retrievals at Rikubetsu and Syowa Station is approximately 1.0. Note that we use Tikhonov regularization. The DOFS is around 1.0 even if we apply OEM for the retrieval. We conclude that only one piece of vertical information (the total column) can be extracted in this study.
4.2 Error analysis
The retrieval error can be considered to be the difference between the retrieved and the true state vector. Subtracting the true state vector x from Eq. (3) including the systematic forward model error εf, the difference is defined as the following equation:
where I is an identity matrix and is the uncertainty of non-retrieved parameters (Rodgers, 1990; 2000). The retrieval error consists of four parts: the smoothing error , the non-retrieved forward model parameter error GKbεb, the forward model error Gεf, and the measurement noise Gε. The smoothing error is caused by the lack of vertical sensitivity combined with uncertainty in xa and includes the uncertainties from the target gas, interfering gases, and any other retrieved parameters (e.g., background correction parameters). The forward model parameter error GKbεb comes from the uncertainties of the parameters (e.g., profiles of temperature and pressure, line lists of target and interfering gases, SZA) that are used for the forward model calculation. The forward model error results from the uncertainty in the forward model itself relative to true physics. In this study, the forward model error was ignored because the physical processes (radiation transfer, infrared absorption, etc.) in the SFIT4 algorithm have been well established in previous studies.
The smoothing random error from target gas profile retrieval is described by the covariance matrix
where ATar is a part of the full averaging kernel matrix A for which the row and column elements run over all target components, and Sa,Tar is the a priori covariance matrix. In general, Sa,Tar should represent the natural variability of the target gas, but we do not know the natural variability of the HFC-23 profile well due to the lack of vertically resolved measurement data. Therefore, a variability matrix derived from the AGAGE in situ and sampling measurement dataset was used at each site as a substitute for Sa,Tar. For Rikubetsu, a variability of 25 % against the a priori profile (square of 0.25xa) based on the background air sampling data at Cape Grim in the period of 1995–2009 (Simmonds et al., 2018b) was adopted as the diagonal elements of the variability matrix. For Syowa Station, a variability of 10 % against the a priori profile (square of 0.10xa) computed from the non-polluted data of the AGAGE in situ measurements at Cape Grim (https://agage2.eas.gatech.edu/data_archive/agage/gc-ms-medusa/complete/tasmania/, last access: 12 August 2020) was adopted as the diagonal elements of the variability matrix. Note that the systematic uncertainty for the smoothing error was not considered because we assumed that the shape of the HFC-23 a priori profile does not have a large altitudinal gradient, as mentioned in Sect. 3.1.5. The smoothing random errors for the retrieval uncertainties from all interfering species and some other retrieval parameters (background slope and curvature correction, wavenumber shift, solar line shift, solar line strength, and simple phase correction) can be written as
where ATar,Int is a part of the full averaging kernel matrix A for which the row elements run over all target components and the column elements run over all interfering species; ATar,Oth is a part of the A matrix for which the row and column elements run over all target and other parameter components, respectively; and , , , and are the true and a priori state vectors of interfering species and other parameters. To estimate the retrieval errors from the interfering gases, the variabilities around the a priori profiles for H2O (HDO) were set to 10 %, and the uncertainties for other species were set to the values calculated from the appropriate WACCM datasets.
In order to estimate the non-retrieved forward model parameter error, the covariance matrix Sf is calculated as
where Sb is the model parameter covariance matrix, which is derived from the uncertainties in the model parameters. For the random and systematic uncertainties of temperatures at Rikubetsu and Syowa Station, the uncertainties reported from the NCEP temperature profiles were assumed. The uncertainty of temperature at Rikubetsu is about 2 K in the troposphere, 2–10 K between the tropopause and 60 km, and 10 K above 60 km. The uncertainty of temperature at Syowa Station is about 2.5 K in the altitude range from the surface to 20 km, 2.5–10 K between 20 and 60 km, and 10 K above 60 km. The SZA random uncertainty was assumed to be 0.15∘ considering measurement time. For HFC-23, N2O, O3, H2O, and HDO, the uncertainties of the spectroscopic parameters (i.e., line intensity, Sν; air-broadening coefficient, γair; coefficient of temperature dependence for γair, nair) were also estimated. The uncertainties of Sν, γair, and nair of HFC-23 were set to 10 %, 15 %, and 15 %, respectively, based on the PLL database (see https://mark4sun.jpl.nasa.gov/data/spec/Pseudo/CHF3_PLL_Update.pdf, last access: 13 August 2021). For heavy molecules like HFC-23, ground-state energy E′′ values, which are relevant to the temperature dependency of Sν, are empirically given so that their uncertainties are larger than for light molecules (e.g., H2O, O3). In addition, the E′′ uncertainty has a larger effect on Sν at a cold site like Syowa Station. We assumed an error of 50 cm−1 for the E′′ values of the HFC-23 PLL and estimated uncertainties of 10 % and 15 % at Rikubetsu and Syowa Station, respectively, as the effect of the E′′ error on Sν. For N2O, O3, H2O, and HDO, the spectroscopic uncertainties were derived from the HITRAN 2008 database. The uncertainties for N2O and O3 were set to 5 %, 10 %, and 5 % for Sν, γair, and nair, respectively. For H2O and HDO, we assigned an uncertainty of 10 % to each parameter.
The measurement error was calculated from the error covariance matrix Sn defined as
where Sε is the measurement noise covariance matrix. We adopted the square inverse of the SNR from the fitted residuals of the last iteration for the diagonal elements of Sε, as mentioned in Sect. 3.5.
Furthermore, we estimated the impact of the interfering CH4 on the HFC-23 retrievals as the retrieved HFC-23 total column is affected by the retrieval uncertainty of the pre-fitted CH4 profile. The uncertainties of the pre-retrieved CH4 total columns are dominated by the systematic uncertainties of its spectroscopic parameters. Considering the spectroscopic parameter uncertainty provided by the HITRAN2008 database, the mean uncertainties of Sν, γair, and nair in the pre-retrieved CH4 total columns were approximately 5 %, 4 %, and 1 %, respectively, at both sites. Since the MW for CH4 pre-retrieval is close to the HFC-23 MWs, these spectroscopic uncertainties in CH4 are partly canceled between the two MWs. Therefore, we assumed that the uncertainties of Sν, γair, and nair for CH4 are 3 %, 3 %, and 1 %, respectively, in the HFC-23 MWs. The effects of the CH4 systematic uncertainties on the retrieved HFC-23 total column were calculated from Eq. (14) using these uncertainties. On the other hand, the effect of the CH4 random uncertainty on the retrieved HFC-23 was derived from the 1σ variability in the pre-retrieved CH4 total columns. The 1σ standard deviations at Rikubetsu and Syowa Station were 4 % and 3 %, respectively. To quantity this uncertainty, we tested the HFC-23 retrievals by scaling the pre-retrieved CH4 profiles by ± 4 % and ± 3 % at Rikubetsu and Syowa Station, respectively. Then we calculated the percent difference between the HFC-23 total column retrieved with the scaled CH4 profile (“scaled CH4”) and the ones retrieved with the non-scaled CH4 profile (“normal”). The percent difference D is defined as
where and are the HFC-23 total columns retrieved with the scaled CH4 profile and the normal CH4 profile, respectively.
Table 4Mean random and systematic errors as well as uncertainties in FTIR-retrieved HFC-23 total columns at Rikubetsu and Syowa Station.

a These uncertainties are described in detail in Sect. 4.2.
Table 4 lists the mean contributions to the relative total retrieval errors in the retrieved HFC-23 total columns at Rikubetsu for the 1997–2010 period and Syowa Station for the 2007–2016 period. Assuming that each error is independent, the total errors in retrieved total columns are simply calculated from the square root of the square sum of the error components.
At Rikubetsu, the random and systematic errors are 15 % and 24 %, respectively. The random error is dominated by the measurement error of 12 % and the error of 7.3 % by the pre-retrieved CH4 profile. The relative random error by the CH4 pre-retrieved profile decreased from about 10 % to about 5 % during the period of 1998–2010. This indicates that the random error has been decreasing with increasing atmospheric HFC-23. The systematic error is mainly caused by the E′′ uncertainty of HFC-23, the Sν uncertainties of HFC-23 and CH4, and the γair uncertainties of H2O and HDO.
At Syowa Station, the random and systematic errors are 8.6 % and 19 %, respectively. The random error mostly comes from the measurement error of 6.8 % and the CH4 pre-retrieved profile error of 4.4 %. The CH4 pre-retrieved profile error was reduced from 5 % to 3 % during the 2007–2016 period, similar to Rikubetsu. The systematic error is mainly caused by the E′′ uncertainty of HFC-23 and the Sν uncertainties of HFC-23 and CH4. In contrast to the retrievals at Rikubetsu, the contributions of the line parameter uncertainties of H2O and HDO are small.
In conclusion, the mean total error for all the retrieved HFC-23 total columns at Rikubetsu for the 1997–2010 period and Syowa Station are 28 % and 21 %, respectively. In our HFC-23 retrieval strategy, the retrieval error is dominated by the systematic uncertainty of the line parameters, especially the Sν uncertainties of HFC-23 and CH4. The contribution of the random error caused mainly by the measurement noise is relatively small.

Figure 5(a) Time series of FTIR-retrieved HFC-23 total columns with total random errors at Rikubetsu and Syowa Station. (b) The fitted rms values for an individual retrieved total column. The total columns at Rikubetsu and Syowa Station are shown by green circles and blue triangles, respectively. The fitted rms values at Rikubetsu and Syowa Station are shown by circles and triangles, respectively, with the color coding depended on the SZA.
Figure 5a shows the time series of the FTIR-retrieved HFC-23 total columns with the total random errors at Rikubetsu and Syowa Station. Note that the two high total columns at Syowa Station in 2016 come from temporal contamination of HFC-23 refrigerant used for cryogenic frost-point hygrometer (CFH) sonde observations (Vömel et al., 2007), which were flown in the same place on the same days. We can see the increasing trend of the retrieved HFC-23 total columns, even taking into account the random retrieval errors in the total columns.
4.3 Impact of background correction
Since the widths of the MWs for our HFC-23 retrieval are 9.5 cm−1 for MW1 and 6.0 cm−1 for MW2, the shape of continuum levels (transmittance of 1.0) in the observed spectra, which result from the characteristic of the optical filters, should be properly corrected (a so-called background correction). In this study, we used a second-order polynomial (slope + curvature) for fitting of the background continuum shape for a wide MW. If a simple linear slope is employed for the background spectra, the HFC-23 total column is systematically biased toward a negative amount. The difference between using a linear slope and a second-order polynomial was calculated using Eq. (16). At Rikubetsu, the mean percent difference was about −33 % throughout the analysis period. At Syowa Station, the mean percent difference was about −10 %, which is smaller than at Rikubetsu. These relative biases lead to an underestimation of the trend in the retrieved HFC-23 abundances compared to that from AGAGE in situ measurements. Therefore, it is very important that the curvature of the continuum is considered when applying the background correction.
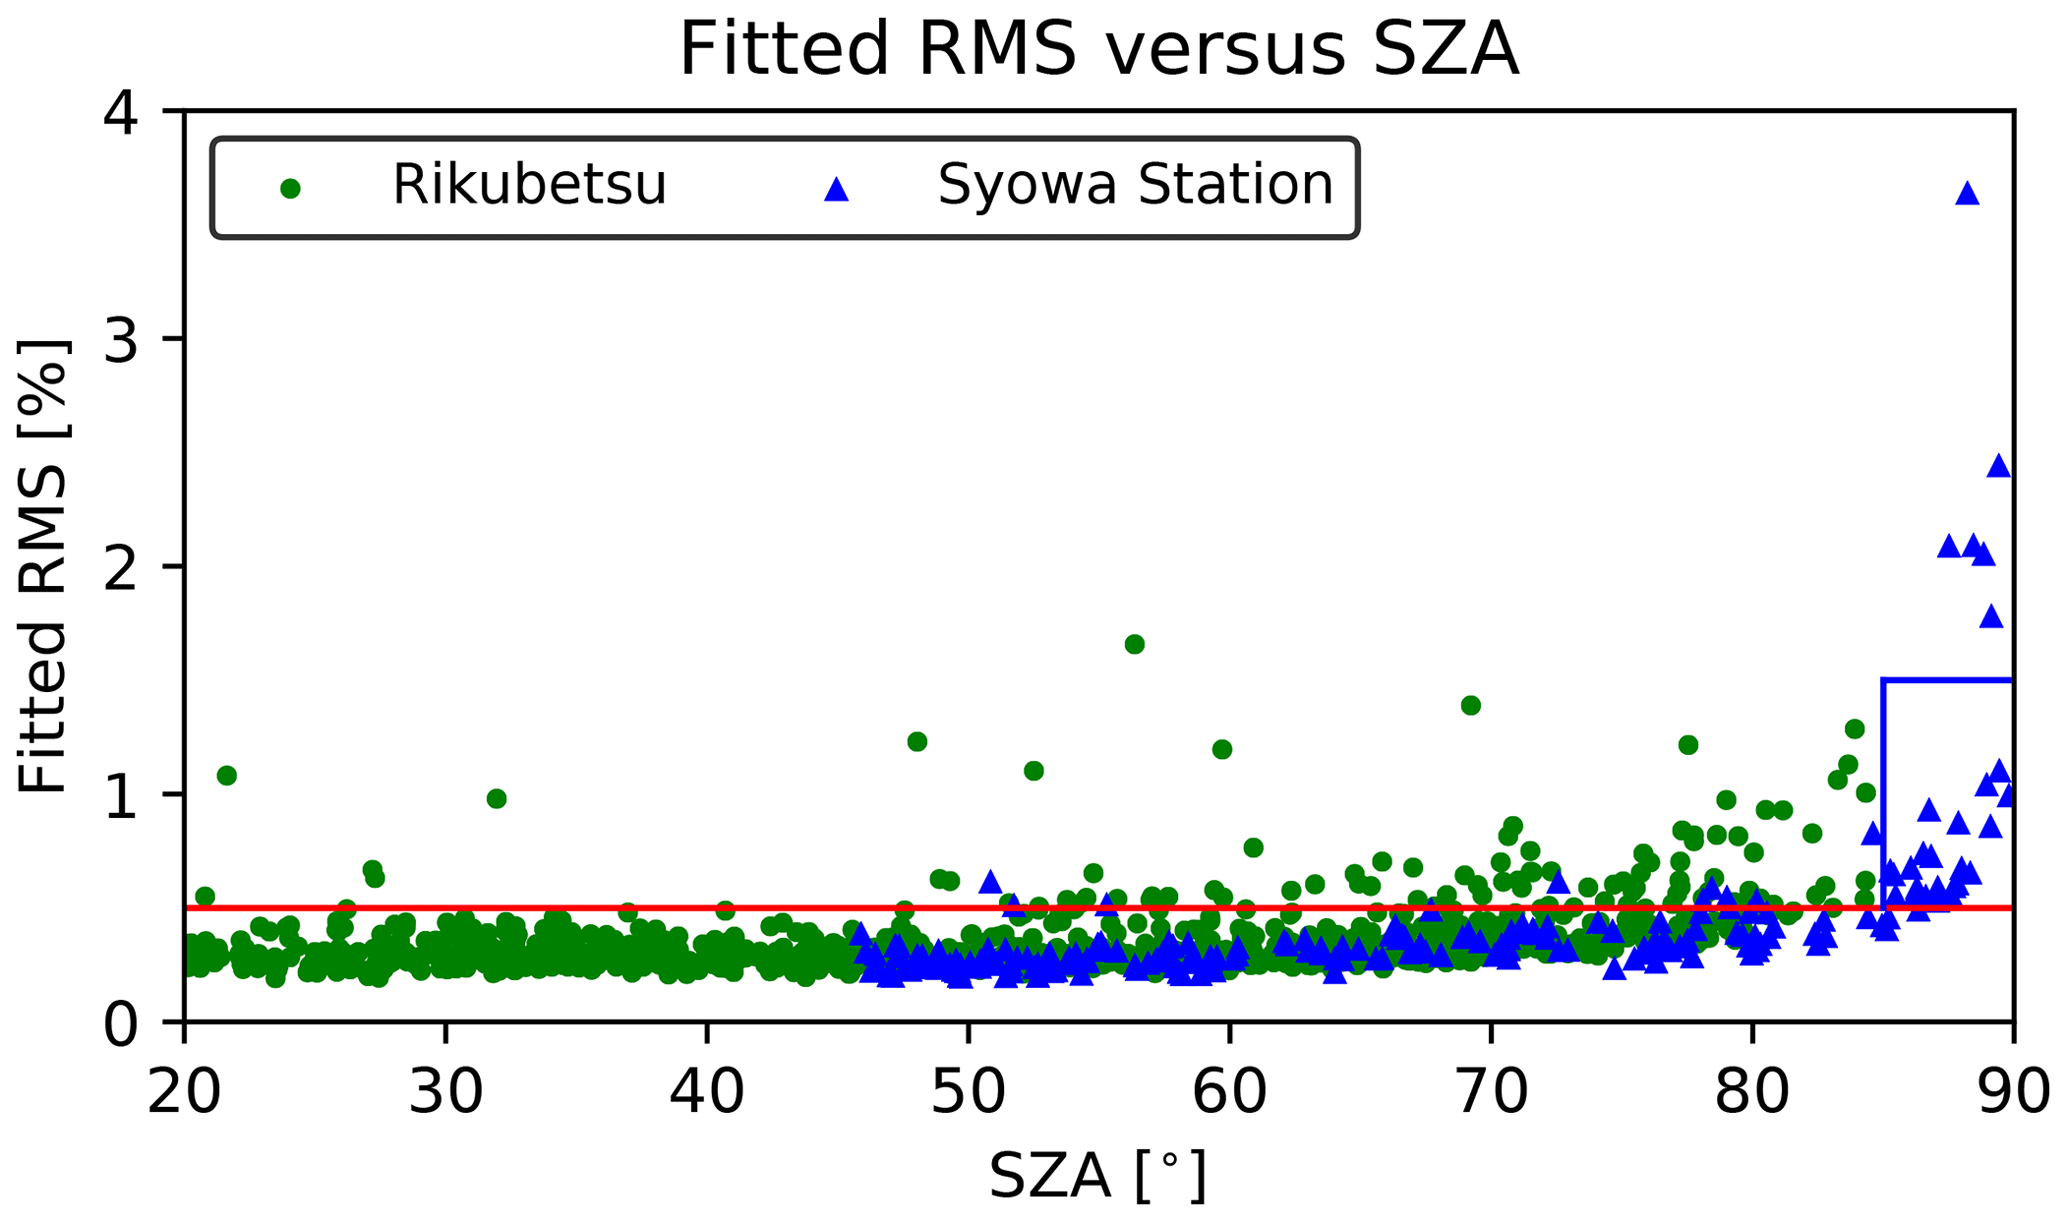
Figure 6The fitted rms residuals vs. the SZA values for an individual retrieval. The rms values at Rikubetsu and Syowa Station are shown by green circles and blue triangles, respectively.
5.1 Datasets
5.1.1 Ground-based FTIR data
In this study, the fitted rms residuals for most retrievals were less than 0.5 % (Table 3, Figs. 5b and 6). Figure 5b shows the time series of the fitted rms residuals at Rikubetsu and Syowa Station, along with the SZA. In general, the rms values rise with increasing SZA due to a decrease in the SNR as shown in Fig. 6. However, with SZA lower than 50∘, there are some observations with fitted rms values exceeding 0.5 % at Rikubetsu before 1999. This is caused by relatively poor optical alignment of the FTIR instrument before April 1999 when a Bruker technician re-aligned the instrument. In the following analysis, we basically use the FTIR-retrieved HFC-23 data filtered with the threshold of the fitted rms (< 0.5 %) to make the FTIR-retrieved data as uniform in quality as possible. However, this threshold rejects most retrievals at Syowa Station in winter when ground-based FTIR observations at large SZA generally gave large rms for the spectral fit residuals due to weak solar intensity. Thus, for the retrievals at Syowa Station, we applied two fitted rms thresholds depending on the value of SZA: the thresholds are < 0.5 % for SZA < 85∘ and < 1.5 % for SZA of 85∘ or greater. Note that the high HFC-23 abundances caused by CFH sonde observations, which used HFC-23 as a cryogen at Syowa Station in 2016 as mentioned in Sect. 4.2, are also excluded.
Since the HFC-23 retrievals have only one piece of vertical information, as mentioned in Sect. 4.1, we consider the dry-air column-averaged mole fractions XHFC-23 as in
where TCHFC-23, TCdry, and are the FTIR-retrieved HFC-23 total column, the dry-air total column, and the a priori (pre-retrieved) H2O total column, respectively; Ps is the surface pressure calculated from the NCEP reanalysis; NA is Avogadro's constant; g is the column-averaged acceleration due to gravity; and mdry and are the mean molecular masses of dry-air and H2O, respectively. Finally, we calculated the monthly mean column-averaged XHFC-23 at both sites.
5.1.2 AGAGE in situ and air archive measurements
The AGAGE instruments are based on gas chromatography coupled with mass spectrometry (GC-MS) and cryogenic sample pre-concentration system, so-called Medusa systems. These GC-MS-Medusa systems, with 2-hourly sampling and cryogenic pre-concentration at ∼ −180 ∘C, are operated at each AGAGE station (Miller et al., 2008; Arnold et al., 2012). For HFC-23, reported in situ measurements started in 2007 after HFC-23 contamination from the air pump module was resolved by changing from Viton to Neoprene diaphragms (KNF Neuberger UN05 pumps). The HFC-23 abundances at all AGAGE stations are reported relative to Scripps Institution of Oceanography (SIO) SIO-07 primary calibration scales in dry-air mole fractions. The absolute accuracies of the HFC-23 measurements were liberally estimated to be −3 % to 2 % (Simmonds et al., 2018a).
For comparison with the FTIR measurements at Rikubetsu and Syowa Station, we used the AGAGE in situ measurement HFC-23 data at Trinidad Head, California, USA (THD; 41.1∘ N, 124.2∘ W), and Cape Grim, Tasmania, Australia (CGO; 40.7∘ S, 144.7∘ E), respectively. We downloaded the high-frequency HFC-23 in situ measurement dataset for THD and CGO and used the embedded pollution flags (P) to remove polluted data (https://agage2.eas.gatech.edu/data_archive/agage/gc-ms-medusa/complete/, last access: 24 August 2020) and then calculated daily median mole fractions. Note that there are no in situ measurements at THD and CGO or other AGAGE sites before 2007 due to HFC-23 pump contamination problems. Therefore, we additionally used annual global mean mole fractions of HFC-23 estimated by the AGAGE 12-box model, a two-dimensional atmospheric chemistry and transport model (Simmonds et al., 2018a), for which pre-2007 abundances are only based on HFC-23 dry-air mole fractions measured in the Cape Grim Air Archive (CGAA) samples (Simmonds et al., 2018b). These data were taken from the Simmonds et al. paper.
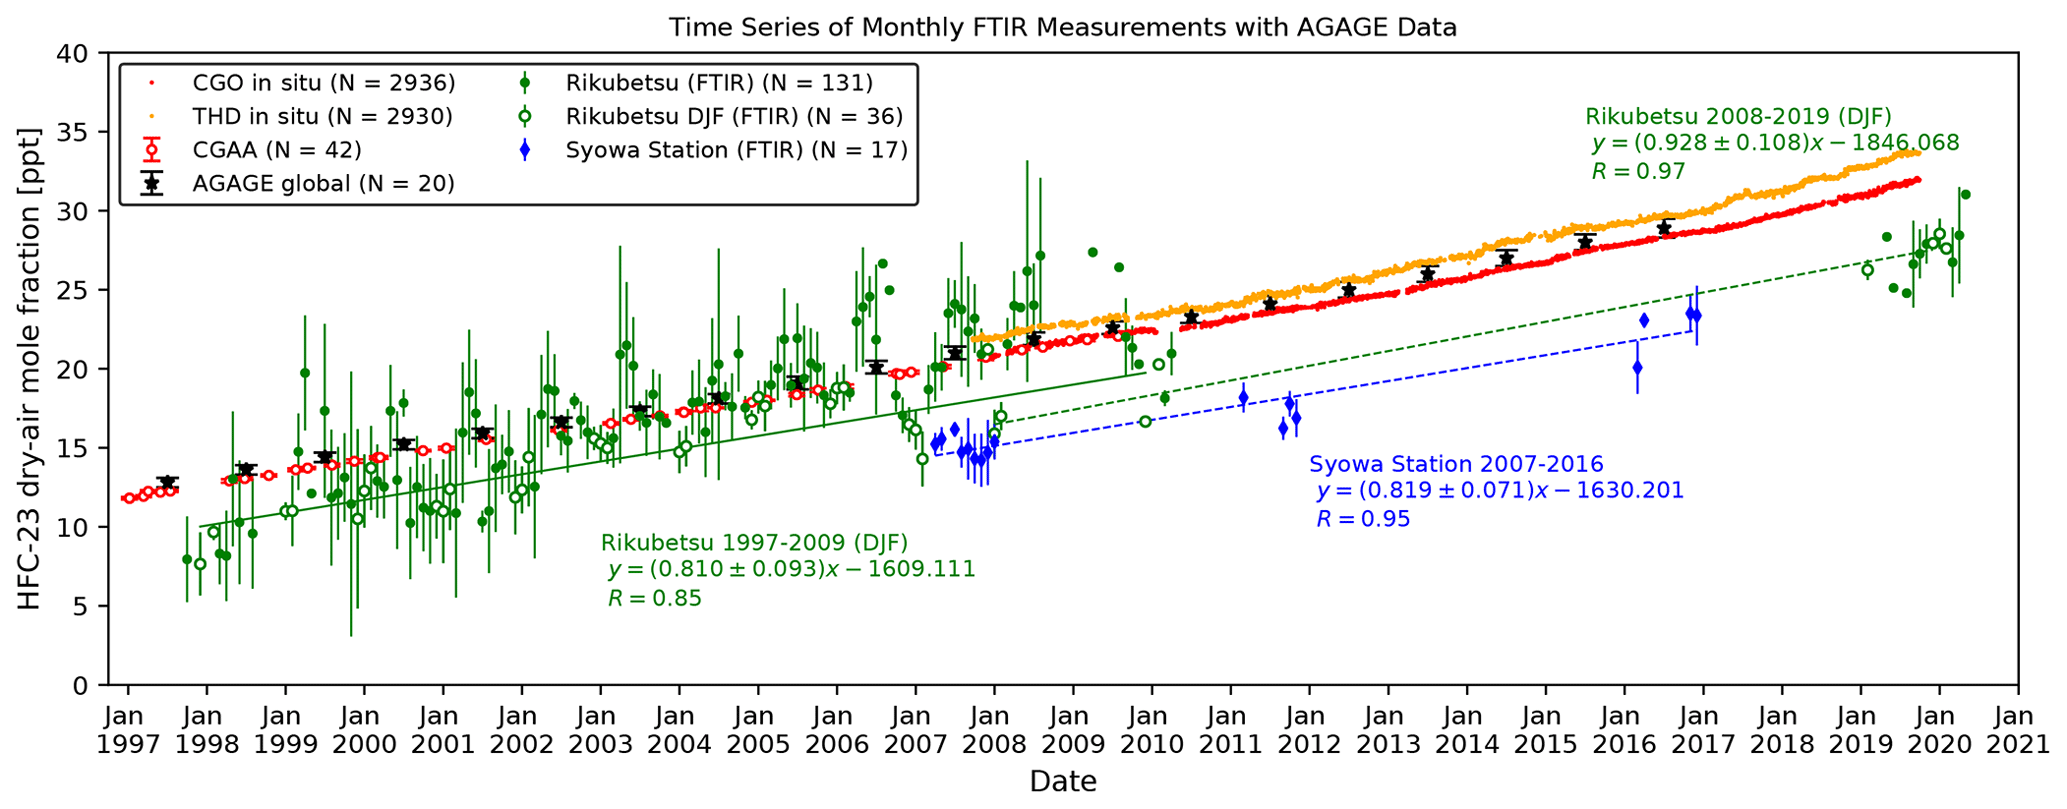
Figure 7Time series of the monthly mean FTIR-retrieved XHFC-23 at Rikubetsu and Syowa Station, along with the AGAGE in situ measurements at CGO and THD, and the annual global mean mole fractions and the Cape Grim Air Archive samples, which were reported by Simmonds et al. (2018b).
5.2 Time series and seasonal variation
Figure 7 shows the time series of the monthly mean FTIR-retrieved XHFC-23 at Rikubetsu and Syowa Station, along with the dry-air mole fractions from the AGAGE annual global mean dataset, the CGAA samples, and the in situ measurements at THD and CGO. The error bar on each monthly mean XHFC-23 is 1σ standard deviation around the monthly mean. The AGAGE annual global mean data and the CGAA data are plotted with the uncertainties reported by Simmonds et al. (2018a, b). The FTIR-retrieved XHFC-23 data at Rikubetsu during the whole period look consistent with the AGAGE annual global mean and the CGAA data. However, the FTIR dataset at Rikubetsu has a peak during spring and summer. In contrast, the time series at Syowa Station has a systematic underestimation of about 5 ppt (about 25 % relative to the CGO in situ data in 2007) compared to the CGO in situ data and almost no significant seasonal cycle.

Figure 8Seasonal cycles of the FTIR-retrieved XHFC-23 at Rikubetsu for the 1997–2020 period and at Syowa Station for the 2007–2016 period. Year-to-year variability is shown as 1σ standard deviation for each month. At Syowa Station, there are no observations in February and June and only 1 year of observations for January, May, July, and August; hence, no 1σ standard deviations are plotted for these months.
Figure 8 shows monthly mean detrended XHFC-23 values (in percent, relative to the trend for all data) and 1σ standard deviations at Rikubetsu and Syowa Station. At Rikubetsu, the monthly mean detrended XHFC-23 shows high values from April to July, with large year-to-year variability (± 15 %–20 %) for each month. On the other hand, the monthly mean XHFC-23 values from December to February are mostly stable, with relatively small standard deviations of about ± 10 % and a value of 10 %–15 % smaller than the AGAGE in situ measurements of HFC-23. As mentioned in Sect. 1, HFC-23 has a very long lifetime of 228 years and there is almost no sink for HFC-23 in the atmosphere; i.e., HFC-23 is chemically inactive in the atmosphere. In addition, the sources of HFC-23 exist in limited places on the ground. For example, there is no HCFC-22 production in Australia, and therefore Cape Grim is not impacted by this major source of HFC-23. Consequently, we expect almost no seasonal variation of the HFC-23 dry-air mole fraction at any remote site as seen in the time series of the THD and CGO measurements. At Syowa Station, for which there are no observations in February and June and only 1 year of observations for January, May, July, and August, the seasonal cycle of the FTIR-retrieved XHFC-23 is almost unrecognized in Fig. 8 because the variability is smaller than the retrieval random error of about 10 %. We suspected some retrieval artifacts and checked the correlations between HFC-23 and H2O, HFC-23 and temperature, and HFC-23 and HDO/H2O. There is temperature dependency on the PLL and this explains 5 % of the difference in the maximum (see Sect. 5.3 for more details), but we could not find any other significant retrieval artifacts. Note that enhancements of HFC-23, especially in spring and summer, are also observed by the surface measurements at Cape Ochiishi (43.2∘ N, 145.5∘ E), which is located close (about 150 km) to Rikubetsu (https://gaw.kishou.go.jp/search/file/0053-2008-1502-01-01-9999, last access: 13 August 2021). As a hypothesis, we suggest that the peaks at Rikubetsu during spring–summer were affected by enhancements due to atmospheric transport from a region emitting HFC-23. Several previous studies using FTIR observations of biomass-burning-derived gases and a backward-trajectory analysis method (Zhao et al., 1997, 2002; Nagahama and Suzuki, 2007) showed that the air masses over northern Japan at the 800–300 hPa level during April to November were mostly transported from the Eurasian continent. Furthermore, Koike et al. (2006) investigated the seasonal contribution from various sources of tropospheric carbon monoxide (CO) at Rikubetsu in 2001 using a three-dimensional global chemistry transport model. Their study showed that, for CO levels at 1 km, the contribution from Asian fossil fuel combustion increases from early spring to summer due to Asian pollutants transported by the weak southwesterly wind in summer. We also calculated 10 d backward trajectories for all FTIR measurement days from Rikubetsu originating at 2000 m, and the results show that, for example, nearly 30 % of air masses above Rikubetsu came from China in 2006. Figure 5a of Simmonds et al. (2018a) illustrates that while the contribution to annual global emissions of HFC-23 has been decreasing since 2000 for developed countries (e.g., Europe, Japan, USA), annual Chinese emissions have been rapidly increasing since the late 1990s and the contribution of Chinese emissions to global emission exceeded 50 % in the early 2000s. Considering this, we suggest that the peaks of XHFC-23 at Rikubetsu during spring–summer before and after about 2002 may be affected by HFC-23 emissions in Japan and China, respectively. This postulated change in the location of Eurasian HFC-23 emissions needs to be examined with an inversion study, but this exceeds the focus of our study.
We propose that the FTIR observations at Rikubetsu in December, January, and February (DJF) represent the baseline of the atmospheric HFC-23 at the site. Although the observations at Rikubetsu look consistent with the AGAGE measurements as seen in Fig. 7, the retrievals at Rikubetsu in DJF have a negative bias of 3 to 4 ppt. The FTIR-retrieved XHFC-23 data at Rikubetsu in DJF are shown as green open circles in Fig. 7. In Sect. 5.4, we derive the trends for the XHFC-23 data in DJF. These trends are compared with the AGAGE measurements and whether the DJF dataset represents the background level of HFC-23 at Rikubetsu or not. For the trend analysis at Syowa Station, all XHFC-23 data are used due to no significant seasonal cycle. The negative biases that occurred at both FTIR sites are described in the following section.
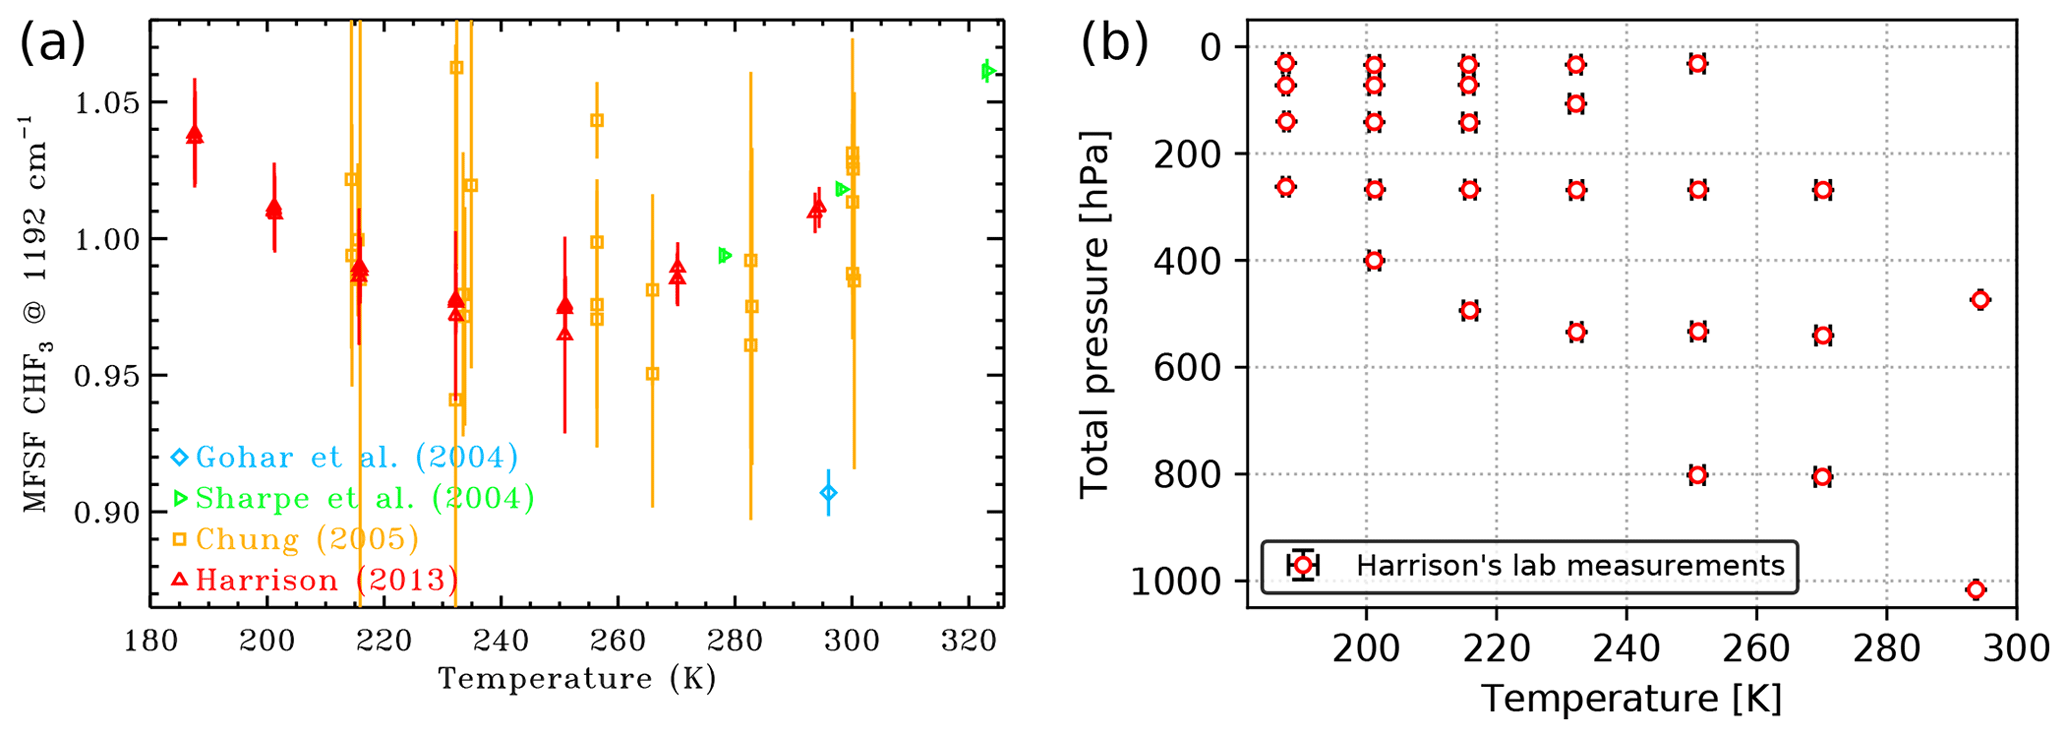
Figure 9(a) Retrieved mole fraction scaling factors from four HFC-23 laboratory spectrum datasets using the 2020 HFC-23 PLL at the spectral region from 1105–1240 cm−1 plotted vs. temperature. (b) The temperature and pressure conditions of the laboratory measurements of Harrison (2013).
5.3 Negative bias in XHFC-23
The negative bias with respect to the AGAGE annual global mean dataset of the FTIR-retrieved XHFC-23 at Syowa Station (about 25 % in 2007) is larger than that at Rikubetsu (about 15 % in 2007). The difference of 10 % between the two sites could be explained by (1) the latitudinal concentration difference and (2) the temperature dependency of the derived HFC-23 pseudo-line parameter. With regard to the latitudinal concentration difference, Fig. 1 of Simmonds et al. (2018a) shows that the difference between the in situ measurements at midlatitude in the Northern and Southern Hemisphere is about 1 ppt (5 % in 2007). For the remaining 5 % of our observed difference, by using the PLL we retrieved the HFC-23 mole fraction values from each spectrum of four laboratory measurement datasets, which had been used to create the HFC-23 PLL (see Sect. 3.4), and then investigated the discrepancies between the retrieved mole fractions and the reported ones in the laboratory datasets. We represent the discrepancies by the HFC-23 mole fraction scaling factors (MFSFs). Figure 9a shows the HFC-23 MFSFs at the spectral region from 1105–1240 cm−1 plotted vs. temperature. In an ideal spectroscopic parameter, the MFSFs in all temperature regions would be 1. The red plots in regard to the laboratory spectral dataset of Harrison (2013) in Fig. 9a present the curved temperature dependency like a parabola, taking a minimum value of ∼ 0.95 at around 240 K. In other words, it means that a retrieved mole fraction from a spectrum measured at 240 K is about 5 % smaller than the actual mole fraction. As the annual mean surface temperature at Syowa Station is about 260 K, it is assumed that this temperature dependency caused the negative bias of 5 % at Syowa Station, in addition to the latitudinal concentration contrast. Also, this temperature dependency on the PLL has probably affected the HFC-23 total columns at Rikubetsu. As shown in Fig. 9a, the MFSFs of the Harrison laboratory measurements at >260 K rapidly increase with rising temperature. Therefore, the temperature dependency may cause some of the seasonal variation of HFC-23 at Rikubetsu because the surface temperature at the site ranged from approximately 260 to 300 K. For the unrealistic cycle of XHFC-23, with a maximum in summer caused by the PLL, we estimated an amplitude of about 1 ppt as the peak-to-peak value.
Here we assess the large negative bias of 15 % in the FTIR-retrieved XHFC-23 at both sites. As mentioned in Sect. 4.2, our HFC-23 retrieval was mainly affected by the spectroscopic parameter uncertainties of HFC-23, HDO, and CH4. Therefore, it is reasonable to assume that the negative bias mainly comes from the systematic uncertainty of these spectroscopic parameters. This is consistent with the negative average difference of 5 % of the ACE-FTS HFC-23 time series compared to the annual global mean data calculated by the AGAGE 12-box model illustrated in Fernando et al. (2019), which is based on the Harrison laboratory spectra. However, it is difficult to quantify the contributions of these parameters to the bias in XHFC-23. In order to resolve the negative bias, we suggest that new laboratory measurements are needed to improve the spectroscopic parameters of the HFC-23 PLL. The negative bias of 15 % is consistent with the systematic uncertainty of the HFC-23 line intensity, which is estimated by the error analysis in Sect. 4.2. We suggest that the systematic uncertainty is affected by the temperature and pressure conditions in measuring the laboratory spectra of HFC-23. Figure 9b shows the conditions of the HFC-23 laboratory measurements of Harrison (2013). Harrison's laboratory measurements (total of 27 measurements) cover the temperature and pressure region corresponding to the altitude from the surface to the stratosphere, but the number of the measurements corresponding to the lower troposphere (below the 600 hPa level) is only 3. The typical surface temperatures at Rikubetsu and Syowa Station range from 260 to 300 K and from 240 to 280 K, respectively. Hence, at a pressure corresponding to the surface, there is no measurement in the temperature region covering the surface temperature at Rikubetsu, except for summer, and Syowa Station. This lack of measurements could result in a significant error in creating the HFC-23 pseudo-line parameters. Therefore, high-accuracy laboratory spectra of HFC-23 are required at various atmospheric conditions of the lower troposphere in order to improve the pseudo-line parameters of HFC-23. In addition, further studies should be undertaken to understand the reasons for the negative bias and the apparent seasonal cycle by an intercomparison with HCF-23 total columns at other NDACC-IRWG ground-based FTIR sites around the world.
Table 5HFC-23 annual growth rates and standard errors derived from monthly mean XHFC-23 at Rikubetsu and Syowa Station, (ppt yr−1). The annual growth rates computed from the AGAGE annual global mean dataset, the CGAA air sample dataset, and the AGAGE in situ measurements at THD and CGO are also listed for the same periods unless indicated by other time frames in brackets.
5.4 Trend analysis
Table 5 summarizes the HFC-23 annual growth rates (ppt yr−1), computed from the monthly XHFC-23 at both FTIR sites and from the AGAGE datasets. The columns in Table 5 represent the trend in the time periods of 1997–2009, 2008–2019, and 2007–2016 according to the available data periods of both FTIR and AGAGE datasets. The annual growth rates were calculated by linear regression and any seasonal cycles were neglected. The uncertainty in each annual growth rate represents the standard error of the slope estimated by linear regression. The trend regression lines for the XHFC-23 data at Rikubetsu in DJF over the 1997–2009 and 2008–2019 periods, shown in Fig. 7 as green solid and green dashed lines, are consistently lower than the AGAGE datasets by about 3 to 4 ppt (about −15 % to −20 % relative to the AGAGE in situ measurements in 2007), as mentioned in Sect. 5.2. However, the annual growth rate calculated from XHFC-23 data at Rikubetsu in DJF over 1997–2009 (0.810 ± 0.093 ppt yr−1) is in good agreement with the AGAGE annual global mean data (0.820 ± 0.013 ppt yr−1) and the CGAA data (0.805 ± 0.006 ppt yr−1) within the uncertainties. For the 2008–2019 period, the annual growth rate at Rikubetsu in DJF (0.928 ± 0.108 ppt yr−1) is consistent with the one derived from the AGAGE annual global mean dataset during 2008 to 2016 (0.892 ± 0.023 ppt yr−1) and that of the AGAGE in situ measurements at THD (0.994 ± 0.001 ppt yr−1), even though the differences of the annual growth rates are a bit larger than those in the period of 1997–2009. Considering the above, we argue that the FTIR-retrieved XHFC-23 data in DJF represent the baseline of the atmospheric HFC-23 at Rikubetsu.
At Syowa Station, the annual growth rate over the 2007–2016 period (0.819 ± 0.071 ppt yr−1) is consistent with the annual global mean dataset (0.878 ± 0.020 ppt yr−1) and the AGAGE CGO in situ measurements (0.874 ± 0.002 ppt yr−1) over the same period.
Summarizing the above, the trends of the atmospheric HFC-23 retrieved with our strategy agree within the errors with the trends derived from the AGAGE datasets, while the absolute values of HFC-23 are biased low. These results indicate that ground-based FTIR measurement has the capacity to monitor the long-term trends of HFC-23.
We have developed a procedure for retrieving atmospheric column abundances of HFC-23 with ground-based FTIR. The first HFC-23 retrievals were carried out using the infrared spectra taken from ground-based FTIR spectrometers at Rikubetsu (1997–2020) and Antarctic Syowa Station (2007–2016) with the SFIT4 retrieval software. The two retrieval micro-windows (1138.5–1148.0 cm−1 and 1154.0–1160.0 cm−1), encompassing the v2 and v5 vibrational–rotational bands of HFC-23, were selected to avoid strong H2O absorption lines at 1149.47 cm−1, 1151.54 cm−1, and 1152.44 cm−1. Significant interfering species in the micro-windows are O3, N2O, CH4, H2O, HDO, CFC-12, HCFC-22, and PAN. In particular, H2O, HDO, and CH4 affect the HFC-23 retrievals. Due to large daily variabilities of H2O and HDO in the atmosphere, those a priori profiles were pre-retrieved with the individual dedicated MWs (H2O: 824.40–825.90 cm−1, HDO: 1208.40–1209.10 cm−1) for each observed spectrum and were then simply scaled in the subsequent HFC-23 retrievals. For a priori profiles of CH4, a pre-retrieval with the dedicated MW of 1201.820–1202.605 cm−1 was carried out for each spectrum, and then these CH4 profiles were fixed in the subsequent HFC-23 retrievals in order to reduce the retrieval error resulting from competition between several weak absorptions of CH4 and the weak HFC-23 absorption. Our HFC-23 retrieval was typically sensitive to the atmospheric layer from the surface to the lower stratosphere. However, its DOFS was only 1, and only the total column amount can be retrieved. The mean HFC-23 total columns retrieved from the observed spectra at Rikubetsu over the periods of 1997–2009 and 2008–2019 were estimated as (3.23 ± 1.10) × 1014 and (5.64 ± 0.59) × 1014 , respectively. The mean HFC-23 total column at Syowa Station over the 2007–2016 period was (3.69 ± 1.35) × 1014 .
We estimated the random and systematic retrieval errors for the FTIR-retrieved HFC-23 total columns assuming four error components – the smoothing error, other retrieved parameter error, non-retrieved model parameter error, and measurement noise error. The retrieval random and systematic errors are 15 % and 24 % at Rikubetsu and 8.6 % and 19 % at Syowa Station, respectively. The random errors at both sites mainly come from measurement noise and the CH4 pre-retrieved profile uncertainty. The systematic errors at both sites are dominated by the uncertainty of the spectroscopic parameters, in particular the spectroscopic uncertainties of HFC-23, H2O, HDO, and CH4. The total errors for the retrieved HFC-23 total columns at Rikubetsu and Syowa Station are 28 % and 21 %, respectively.
The time series of the FTIR-retrieved HFC-23 columns at Rikubetsu and Syowa Station show an increasing trend. The FTIR-retrieved XHFC-23 values at both sites were compared to AGAGE in situ measurements at THD and CGO, CGAA samples filled at CGO, and results from the AGAGE 12-box model based on AGAGE measurements. The trends of XHFC-23 at Rikubetsu in DJF and Syowa Station are consistent with the trends derived from AGAGE data, but at Syowa Station there is a negative bias of 5 ppt (−25 %) compared to the AGAGE in situ measurements at CGO. The time series of the FTIR-retrieved XHFC-23 at Rikubetsu has a seasonal cycle with a peak during spring to summer, but the XHFC-23 at Syowa Station did not show a significant cycle. We suggest that the seasonal cycle of HFC-23 at Rikubetsu is mainly caused by the transport of HFC-23 emitted from East Asia and Eurasia, as is confirmed by 10 d backward-trajectory calculations from Rikubetsu. We found that the minimum of the seasonal cycle occurred from December to February and represented the background concentration of HFC-23 at Rikubetsu at that time. The negative bias at Rikubetsu in DJF was 3 to 4 ppt (−15 % to −20 %) compared to the AGAGE datasets. We showed that the bias occurred at both sites and was caused mostly by the spectroscopic parameter uncertainties of HFC-23, H2O, HDO, and CH4. Therefore, these molecules mostly affect the HFC-23 retrieval. ACE-FTS HFC-23 measurements also showed a negative average difference of 5 % compared with the AGAGE 12-box model. A solution for this bias problem may be found in new high-resolution laboratory spectra of HFC-23 measured under the atmospheric conditions of the lower troposphere, leading to an expected improvement of the HFC-23 spectroscopic parameters and HFC-23 retrievals.
The annual growth rates of the XHFC-23 at Rikubetsu in DJF over the periods of 1997–2009 and 2008–2019 were 0.810 ± 0.093 and 0.928 ± 0.108 ppt yr−1, respectively, which are in good agreement with the trend derived from the AGAGE datasets over the same periods. The annual growth rate at Syowa Station is 0.819 ± 0.071 ppt yr−1 over the 2007–2016 period, which is also consistent with the trend from the AGAGE datasets over the same period. The trend derived from the XHFC-23 data retrieved with our retrieval strategy agreed with other ground-based in situ measurements.
The present study demonstrates that ground-based FTIR measurements are capable of monitoring the long-term trend of HFC-23. If this FTIR measurement technique were extended to other NDACC ground-based FTIR sites around world, the measurements reported from these sites would complement the global AGAGE observations by filling spatial and temporal gaps and may lead to improved insights about changes in regional and global emissions of HFC-23 and its role in global warming.
The retrieval software for the FTIR spectra used in this study (SFIT4) can be obtained from the SFIT wiki at https://wiki.ucar.edu/display/sfit4/ (Hannigan, 2021).
The FTIR data presented here can be obtained from one of the co-authors (Hideaki Nakajima) upon request. The AGAGE data presented here can be obtained from the Advanced Global Atmospheric Gases Experiment home page at https://agage2.eas.gatech.edu/data_archive/agage/gc-ms-medusa/complete/ (AGAGE consortium, 2021).
MT, HN, and IMu designed the retrieval strategy with the SFIT4. MT performed the retrievals. MT, HN, and IMu wrote the paper with comments and suggestions received from all co-authors. HN and MT performed FTIR observations at Syowa Station. TN was responsible for FTIR observations with the IFS-120M instrument at Rikubetsu. IMo performed FTIR observations with the IFS-120/5 HR instrument at Rikubetsu. GCT created the HFC-23 pseudo-line list and provided advice on the use of the line list. RFW and JM provided the AGAGE in situ measurements at Trinidad Head. PBK and PJF provided the AGAGE in situ measurements at Cape Grim. HJW is responsible for the AGAGE data archival. HN and IMu supervised this work.
The authors declare that they have no conflict of interest.
Publisher's note: Copernicus Publications remains neutral with regard to jurisdictional claims in published maps and institutional affiliations.
We acknowledge Makoto Koike, Kazuo Hanano, and Nobuyuki Yokozeki for the operation of the FTIR observations at Rikubetsu. We want to thank Kosuke Saeki and Takeshi Kinase for performing the FTIR observations at Syowa Station in 2007 and 2011, respectively. We are grateful to all the members of the 48th Japanese Antarctic Research Expedition (JARE-48), JARE-52, and JARE-57, as well as the National Institute for Polar Research (NIPR) for supporting for the FTIR observations at Syowa Station. This work was carried out by the joint research program of the Institute for Space–Earth Environmental Research, Nagoya University. FTIR operations at the Rikubetsu site are financially supported in part by the GOSAT series project.
This research has been supported by NIES, Nagoya University, JARE, and GOSAT.
This paper was edited by Gabriele Stiller and reviewed by three anonymous referees.
AGAGE consortium: Advanced Global Atmospheric Gases Experiment data archive, available at: https://agage2.eas.gatech.edu/data_archive/agage/gc-ms-medusa/complete/, last access: 13 August 2021.
Arnold, T., Mühle, J., Salameh, P. K., Harth, C. M., Ivy, D. J., and Weiss, R. F.: Automated measurement of nitrogen trifluoride in ambient air, Anal. Chem., 84, 4798–4804, 2012.
Ceausu-Velcescu, A., Bürger, H., and Graner, G.: High-resolution infrared spectra of HCF3 in the ν6 (500 cm−1) and 2ν6 (1000 cm−1) regions: rovibrational analysis and accurate determination of the ground state constants C0 and , J. Mol. Spectrosc., 220, 298–305, 2003.
Chang, L., Palo, S., Hagan, M, Richter, J., Garcia, R., Riggin, D., and Fritts, D.: Structure of the migrating diurnal tide in the Whole Atmosphere Community Climate Model (WACCM), Adv. Space Res., 41, 1398–1407, https://doi.org/10.1016/j.asr.2007.03.035, 2008.
Chung, Y. K.: Absorption cross-sections off HFC-23 at atmospheric conditions, J. Quant. Spectrosc. Ra., 96, 281–287, https://doi.org/10.1016/j.jqsrt.2005.04.004, 2005.
De Mazière, M., Thompson, A. M., Kurylo, M. J., Wild, J. D., Bernhard, G., Blumenstock, T., Braathen, G. O., Hannigan, J. W., Lambert, J.-C., Leblanc, T., McGee, T. J., Nedoluha, G., Petropavlovskikh, I., Seckmeyer, G., Simon, P. C., Steinbrecht, W., and Strahan, S. E.: The Network for the Detection of Atmospheric Composition Change (NDACC): history, status and perspectives, Atmos. Chem. Phys., 18, 4935–4964, https://doi.org/10.5194/acp-18-4935-2018, 2018.
Fernando, A. M., Bernath, P. F., and Boone, C. D.: Trends in atmospheric HFC-23 (CHF3) and HFC-134a abundances, J. Quant. Spectrosc. Ra., 238, 106540, https://doi.org/10.1016/j.jqsrt.2019.06.019, 2019.
Fang, X., Stohl, A., Yokouchi, Y., Kim, J., Li, S., Saito, T., Park, S., and Hu, J.: Multiannual top-down estimate of HFC-23 emissions in east Asia, Environ. Sci. Technol., 49, 4345–4353, https://doi.org/10.1021/es505669j, 2015.
Gohar, L. K., Myhre, G., and Shine, K. P.: Updated radiative forcing estimates of four halocarbons, J. Geophys. Res., 109, D01107, https://doi.org/10.1029/2003JD004320, 2004.
Hannigan, J.: NDACC Infrared Working Group Retrieval Code, SFIT wiki, available at: https://wiki.ucar.edu/display/sfit4/, last access: 13 August 2021.
Hansen, P. C.: Analysis of discrete ill-posed problems by means of the L-curve, SIAM Rev., 34, 561–580, 1992.
Harris, N. R. P., Wuebbles, D. J. (lead authors), Daniel, J. S., Hu, J., Kuijpers, L. J. M., Law, K. S., Prather, M. J., and Schofield, R.: Scenarios and information for policymakers, Chapter 5 in: Scientific Assessment of Ozone Depletion: 2014, Global Ozone Research and Monitoring Project – Report No. 55, World Meteorological Organization, Geneva, Switzerland, 2014.
Harrison, J. J.: Infrared absorption cross sections for trifluoromethane, J. Quant. Spectrosc. Ra., 130, 359–364, https://doi.org/10.1016/j.jqsrt.2013.05.026, 2013.
Harrison, J. J., Boone, C. D., Brown, A. T., Allen, N. D. C., Toon, G. C., and Bernath, P. F.: First remote sensing observations of trifluoromethane (HFC-23) in the upper troposphere and lower stratosphere, J. Geophys. Res., 117, D05308, https://doi.org/10.1029/2011JD016423, 2012.
Hase, F., Blumenstock, T., and Paton-Walsh, C.: Analysis of the instrumental line shape of high-resolution Fourier transform IR spectrometers with gas cell measurements and new retrieval software, Appl. Optics, 38, 3417–3422, https://doi.org/10.1364/AO.38.003417, 1999.
Hase, F., Demoulin, P., Sauval, A. J., Toon, G. C., Bernath, P. F., Goldman, A., Hannigan, J. W., and Rinsland, C. P.: An empirical line-by-line model for the infrared solar transmittance spectrum from 700 to 5000 cm−1, J. Quant. Spectrosc. Ra., 102, 450–463, 2006.
Kim, J., Li, S., Kim, K. R., Stohl, A., Mühle, J., Kim, S. K., Park, M. K., Kang, D. J., Lee, G., Harth, C. M., Salameh, P. K., and Weiss, R. F.: Regional atmospheric emissions determined from measurements at Jeju Island, South Korea: halogenated compounds from China, Geophys. Res. Lett, 37, L12801, https://doi.org/10.1029/2010GL043263, 2010.
Koike, M., Jones, N. B., Palmer, P. I., Matsui, H., Zhao, Y., Kondo, Y., Matsumi, Y., and Tanimoto, H.: Seasonal variation of carbon monoxide in northern Japan: Fourier transform IR measurements and source-labeled model calculations, J. Geophys. Res., 111, D15306, https://doi.org/10.1029/2005JD006643, 2006.
McCulloch, A. and Lindley, A. A.: Global emissions of HFC-23 estimated to year 2015, Atmos. Environ., 41, 1560–1566, https://doi.org/10.1016/j.atmosenv.2006.02.021, 2007.
Meier, A., Toon, G. C., Rinsland, C. P., Goldman, A., and Hase, F.: Spectroscopic Atlas of Atmospheric Microwindows in the Middle Infrared, 2nd edn., IRF Technical Report 048, ISSN 0284-1738, IRF, Kiruna, Sweden, 2004.
Miller, B. R. and Kuijpers, L. J. M.: Projecting future HFC-23 emissions, Atmos. Chem. Phys., 11, 13259–13267, https://doi.org/10.5194/acp-11-13259-2011, 2011.
Miller, B. R., Weiss, R. F., Salameh, P. K., Tanhua, T., Greally, B. R., Mühle, J., and Simmonds, P. G.: Medusa: A sample preconcentration and GC/MS detector system for in situ measurements of atmospheric trace halocarbons, hydrocarbons and sulfur compounds, Anal. Chem., 80, 1536–1545, https://doi.org/10.1021/ac702084k, 2008.
Miller, B. R., Rigby, M., Kuijpers, L. J. M., Krummel, P. B., Steele, L. P., Leist, M., Fraser, P. J., McCulloch, A., Harth, C., Salameh, P., Mühle, J., Weiss, R. F., Prinn, R. G., Wang, R. H. J., O'Doherty, S., Greally, B. R., and Simmonds, P. G.: HFC-23 (CHF3) emission trend response to HCFC-22 (CHClF2) production and recent HFC-23 emission abatement measures, Atmos. Chem. Phys., 10, 7875–7890, https://doi.org/10.5194/acp-10-7875-2010, 2010.
Montzka, S. A., Myers, R. C., Butler, J. H., Elkins, J. W., and Cummings, S. O.: Global tropospheric distribution and calibration scale of HCFC-22, Geophys. Res. Lett., 20, 703–706, 1993.
Montzka, S. A., Hall, B. D., and Elkins, J. W.: Accelerated increases observed for Hydrochlorofluorocarbons since 2004 in the global atmosphere, Geophys. Res. Lett., 36, L03804, https://doi.org/10.1029/2008GL036475, 2009.
Montzka, S. A., Velders, G. J. M. (Lead Authors), Krummel, P. B., Mühle, J., Orkin, V. L., Park, S., Shah, N., and Walter-Terrinoni, H.: Hydrofluorocarbons (HFCs), Chapter 2 in Scientific Assessment of Ozone Depletion: 2018, Global Ozone Research and Monitoring Project – Report No. 58, World Meteorological Organization, Geneva, Switzerland, 2019.
Nagahama, Y. and Suzuki, K.: The influence of forest fires on CO, HCN, C2H6, and C2H2 over northern Japan measured by infrared solar spectroscopy, Atmos. Environ., 41, 9570–9579, 2007.
Naik, V., Jain, A. K., Patten, K. O., and Wuebbles, D. J.: Consistent sets of atmospheric lifetimes and radiative forcings on climate for CFC replacements: HCFCs and HFCs, J. Geophys. Res., 105, 6903–6914, 2000.
Nakajima, H., Liu, X., Murata, I., Kondo, Y., Murcray, F. J., Koike, M., Zhao, Y., and Nakane, H.: Retrieval of vertical profiles of ozone from high-resolution infrared solar spectra at Rikubetsu, Japan, J. Geophys. Res., 102, 29981–29990, 1997.
Nakajima, H., Murata, I., Nagahama, Y., Akiyoshi, H., Saeki, K., Kinase, T., Takeda, M., Tomikawa, Y., Dupuy, E., and Jones, N. B.: Chlorine partitioning near the polar vortex edge observed with ground-based FTIR and satellites at Syowa Station, Antarctica, in 2007 and 2011, Atmos. Chem. Phys., 20, 1043–1074, https://doi.org/10.5194/acp-20-1043-2020, 2020.
Nassar, R., Bernath, P. F., Boone, C. D., McLeod, S. D., Skelton, R., Walker, K. A., Rinsland, C. P., and Duchatelet, P.: A global inventory of stratospheric fluorine in 2004 based on Atmospheric Chemistry Experiment Fourier transform spectrometer (ACE-FTS) measurements, J. Geophys. Res., 111, D22313, https://doi.org/10.1029/2006JD007395, 2006.
O'Doherty, S., Cunnold, D. M., Manning, A., Miller, B. R., Wang, R. H. J., Krummel, P. B., Fraser, P. J., Simmonds, P. G., McCulloch, A., Weiss, R. F., Salameh, P., Porter, L. W., Prinn, R. G., Huang, J., Sturrock, G., Ryall, D., Derwent, R. G., and Montzka, S. A.: Rapid growth of hydrofluorocarbon 134a and hydrochlorofluorocarbons 141b, 142b, and 22 from Advanced Global Atmospheric Gases Experiment (AGAGE) observations at Cape Grim, Tasmania, and Mace Head, Ireland, J. Geophys. Res., 109, D06310, https://doi.org/10.1029/2003JD004277, 2004.
Oram, D. E., Sturges, W. T., Penkett, S. A., McCulloch, A., and Fraser, P. J.: Growth of fluoroform (CHF3, HFC-23) in the background atmosphere, Geophys. Res. Lett., 25, 35–38, 1998.
Ortega, I., Buchholz, R. R., Hall, E. G., Hurst, D. F., Jordan, A. F., and Hannigan, J. W.: Tropospheric water vapor profiles obtained with FTIR: comparison with balloon-borne frost point hygrometers and influence on trace gas retrievals, Atmos. Meas. Tech., 12, 873–890, https://doi.org/10.5194/amt-12-873-2019, 2019.
Pougatchev, N. S., Connor, B. J., and Rinsland, C. P.: Infrared measurements of the ozone vertical distribution above Kitt Peak, J. Geophys. Res., 100, 16689–16697, https://doi.org/10.1029/95JD01296, 1995.
Prinn, R. G., Weiss, R. F., Fraser, P. J., Simmonds, P. G., Cunnold, D. M., Alyea, F. N., O'Doherty, S., Salameh, P., Miller, B. R., Huang, J., Wang, R. H. J., Hartley, D. E., Harth, C., Steele, L. P., Sturrock, G., Midgley, P. M., and McCulloch, A.: A history of chemically and radiatively important gases in air deduced from ALE/GAGE/AGAGE, J. Geophys. Res., 105, 17751–17792, 2000.
Rasmussen, R. A., Khalil, M. A. K., Penkett, S. A., and Prosser, N. J. D.: CHClF2 (F-22) in the Earth's atmosphere, Geophys. Res. Lett., 7, 809–812, 1980.
Rees, D., Barnett, J. J., and Labitzke, K.: COSPAR International Reference Atmosphere: 1986, Part II, Middle Atmosphere Models, Adv. Space Res., 10, 1–525, 1990.
Rodgers, C. D.: Retrieval of atmospheric temperature and composition from remote measurements of thermal radiation, Rev. Geophys., 14, 609–624, 1976.
Rodgers, C. D.: Characterization and error analysis of profiles retrieved from remote sounding measurements, J. Geophys. Res., 95, 5587–5595, 1990.
Rodgers, C. D.: Inverse methods for atmospheric sounding: Theory and practice, World Scientific, Publishing Co., Singapore, 238 pp., ISBN 981-02-2740-X, 2000.
Rothman, L. S., Gordon, I. E., Barbe, A., Chris Benner, D., Bernath, P. F., Birk, M., Boudon, V., Brown, L. R., Campargue, A, Champion, J.-P., Chance, K., Coudert, L. H., Dana, V., Devi, V. M., Fally, S., Flaud, J.-M., Gamache, R. R., Goldman, A., Jacquemart, D., Kleiner, I., Lacome, N., Lafferty, W. J., Mandin, J.-Y., Massie, S. T., Mikhailenko, S. N., Miller, C. E., Moazzen-Ahmadi, N., Naumenko, O. V., Nikitin, A. V., Orphal, J., Perevalov, V. I., Perrin, A., Predoi-Cross, A., Rinsland, C. P., Rotger, M., Šimečtová, M., Smith, M. A. H., Sung, K., Tashkun, S. A., Tennyson, J., Toth, R. A., Vandaele, A. C., and Vander Auwera, J.: The HITRAN 2008 molecular spectroscopic database, J. Quant. Spectrosc. Ra., 110, 533–572, https://doi.org/10.1016/j.jqsrt.2009.02.013, 2009.
Sharpe, S. W., Johnson, T. J., Sams, R. L., Chu, P. M., Rhoderick, G. C., and Johnson, P. A.: Gas-phase databases for quantitative infrared spectroscopy, Appl. Spectrosc., 58, 1452–1461, https://doi.org/10.1366/0003702042641281, 2004.
Simmonds, P. G., O'Doherty, S., Nickless, G., Sturrock, G. A., Swaby, R., Knight, P., Ricketts, J., Woffendin, G., and Smith, R.: Automated gas chromatograph/mass spectrometer for routine atmospheric field measurements of the CFC replacement compounds, the hydrofluorocarbons and hydrochlorofluorocarbons, Anal. Chem., 67, 717–723, 1995.
Simmonds, P. G., Rigby, M., McCulloch, A., Vollmer, M. K., Henne, S., Mühle, J., O'Doherty, S., Manning, A. J., Krummel, P. B., Fraser, P. J., Young, D., Weiss, R. F., Salameh, P. K., Harth, C. M., Reimann, S., Trudinger, C. M., Steele, L. P., Wang, R. H. J., Ivy, D. J., Prinn, R. G., Mitrevski, B., and Etheridge, D. M.: Recent increases in the atmospheric growth rate and emissions of HFC-23 (CHF3) and the link to HCFC-22 (CHClF2) production, Atmos. Chem. Phys., 18, 4153–4169, https://doi.org/10.5194/acp-18-4153-2018, 2018a.
Simmonds, P. G., Rigby, M., McCulloch, A., Vollmer, M. K., Henne, S., Mühle, J., O'Doherty, S., Manning, A. J., Krummel, P. B., Fraser, P. J., Young, D., Weiss, R. F., Salameh, P. K., Harth, C. M., Reimann, S., Trudinger, C. M., Steele, L. P., Wang, R. H. J., Ivy, D. J., Prinn, R. G., Mitrevski, B., and Etheridge, D. M.: Supplement of Recent increases in the atmospheric growth rate and emissions of HFC-23 (CHF3) and the link to HCFC-22 (CHClF2) production, Supplement of Atmos. Chem. Phys., 18, 4153–4169, https://doi.org/10.5194/acp-18-4153-2018-supplement, 2018b.
Stanley, K. M., Say, D., Mühle, J., Harth, C. M., Krummel, P. B., Young, D., O'Doherty, S. J., Salameh, P. K., Simmonds, P. G., Weiss, R. F., Prinn, R. G., Fraser, P. J., and Rigby, M.: Increase in global emissions of HFC-23 despite near-total expected reductions, Nat. Commun., 11, 397, https://doi.org/10.1038/s41467-019-13899-4, 2020.
Steck, T.: Methods for determining regularization for atmospheric retrieval problems, Appl. Optics, 41, 1788–1797, 2002.
Sussmann, R., Borsdorff, T., Rettinger, M., Camy-Peyret, C., Demoulin, P., Duchatelet, P., Mahieu, E., and Servais, C.: Technical Note: Harmonized retrieval of column-integrated atmospheric water vapor from the FTIR network – first examples for long-term records and station trends, Atmos. Chem. Phys., 9, 8987–8999, https://doi.org/10.5194/acp-9-8987-2009, 2009.
Tikhonov, A.: On the solution of incorrectly stated problems and a method of regularization, Dokl. Acad. Nauk SSSR+, 151, 501–504, 1963.
UNEP: Montreal Protocol on substances that deplete the ozone layer, United Nations Environment Programme: UNEP, Nairobi, 2000.
Vigouroux, C., Hendrick, F., Stavrakou, T., Dils, B., De Smedt, I., Hermans, C., Merlaud, A., Scolas, F., Senten, C., Vanhaelewyn, G., Fally, S., Carleer, M., Metzger, J.-M., Müller, J.-F., Van Roozendael, M., and De Mazière, M.: Ground-based FTIR and MAX-DOAS observations of formaldehyde at Réunion Island and comparisons with satellite and model data, Atmos. Chem. Phys., 9, 9523–9544, https://doi.org/10.5194/acp-9-9523-2009, 2009.
Vigouroux, C., Stavrakou, T., Whaley, C., Dils, B., Duflot, V., Hermans, C., Kumps, N., Metzger, J.-M., Scolas, F., Vanhaelewyn, G., Müller, J.-F., Jones, D. B. A., Li, Q., and De Mazière, M.: FTIR time-series of biomass burning products (HCN, C2H6, C2H2, CH3OH, and HCOOH) at Reunion Island (21∘ S, 55∘ E) and comparisons with model data, Atmos. Chem. Phys., 12, 10367–10385, https://doi.org/10.5194/acp-12-10367-2012, 2012.
Vömel, H., David, D. E., and Smith, K.: Accuracy of tropospheric and stratospheric water vapor measurements by the cryogenic frost point hygrometer: Instrumental details and observations, J. Geophys. Res., 112, 8305, https://doi.org/10.1029/2006JD007224, 2007.
Yokouchi, Y., Taguchi, S., Saito, T., Tohjima, Y., Tanimoto, H., and Mukai, H.: High frequency measurements of HFCs at a remote site in east Asia and their implications for Chinese emissions, Geophys. Res. Lett., 33, L21814, https://doi.org/10.1029/2006GL026403, 2006.
Zhao, Y., Kondo, Y., Murcray, F. J., Liu, X., Koike, M., Kita, K., Nakajima, H., Murata, I., and Suzuki, K.: Carbon monoxide column abundances and tropospheric concentrations retrieved from high resolution ground-based infrared solar spectra at 43.5∘ N over Japan, J. Geophys. Res., 102, 23403–23411, 1997.
Zhao, Y., Strong, K., Kondo, Y., Koike, M., Matsumi, Y., Irie, H., Rinsland, C. P., Jones, N. B., Suzuki, K., Nakajima, H., Nakane, H., and Murata, I.: Spectroscopic measurements of tropospheric CO, C2H6, C2H2, and HCN in northern Japan, J. Geophys. Res., 107, 4343, https://doi.org/10.1029/2001JD000748, 2002.
Zhou, M., Vigouroux, C., Langerock, B., Wang, P., Dutton, G., Hermans, C., Kumps, N., Metzger, J.-M., Toon, G., and De Mazière, M.: CFC-11, CFC-12 and HCFC-22 ground-based remote sensing FTIR measurements at Réunion Island and comparisons with MIPAS/ENVISAT data, Atmos. Meas. Tech., 9, 5621–5636, https://doi.org/10.5194/amt-9-5621-2016, 2016.