the Creative Commons Attribution 4.0 License.
the Creative Commons Attribution 4.0 License.
 | 15 Sep 2021
A low-cost monitor for simultaneous measurement of fine particulate matter and aerosol optical depth – Part 3: Automation and design improvements
Eric A. Wendt
Casey Quinn
Christian L'Orange
Daniel D. Miller-Lionberg
Bonne Ford
Jeffrey R. Pierce
John Mehaffy
Michael Cheeseman
Shantanu H. Jathar
David H. Hagan
Zoey Rosen
Marilee Long
John Volckens
Atmospheric particulate matter smaller than 2.5 µm in diameter (PM2.5) has a negative impact on public health, the environment, and Earth's climate. Consequently, a need exists for accurate, distributed measurements of surface-level PM2.5 concentrations at a global scale. Existing PM2.5 measurement infrastructure provides broad PM2.5 sampling coverage but does not adequately characterize community-level air pollution at high temporal resolution. This motivates the development of low-cost sensors which can be more practically deployed in spatial and temporal configurations currently lacking proper characterization. Wendt et al. (2019) described the development and validation of a first-generation device for low-cost measurement of AOD and PM2.5: the Aerosol Mass and Optical Depth (AMODv1) sampler. Ford et al. (2019) describe a citizen-science field deployment of the AMODv1 device. In this paper, we present an updated version of the AMOD, known as AMODv2, featuring design improvements and extended validation to address the limitations of the AMODv1 work. The AMODv2 measures AOD and PM2.5 at 20 min time intervals. The sampler includes a motorized Sun tracking system alongside a set of four optically filtered photodiodes for semicontinuous, multiwavelength (current version at 440, 500, 675, and 870 nm) AOD sampling. Also included are a Plantower PMS5003 sensor for time-resolved optical PM2.5 measurements and a pump/cyclone system for time-integrated gravimetric filter measurements of particle mass and composition. AMODv2 samples are configured using a smartphone application, and sample data are made available via data streaming to a companion website (https://csu-ceams.com/, last access: 16 July 2021). We present the results of a 9 d AOD validation campaign where AMODv2 units were co-located with an AERONET (Aerosol Robotics Network) instrument as the reference method at AOD levels ranging from 0.02 ± 0.01 to 1.59 ± 0.01. We observed close agreement between AMODv2s and the reference instrument with mean absolute errors of 0.04, 0.06, 0.03, and 0.03 AOD units at 440, 500, 675, and 870 nm, respectively. We derived empirical relationships relating the reference AOD level to AMODv2 instrument error and found that the mean absolute error in the AMODv2 deviated by less than 0.01 AOD units between clear days and elevated-AOD days and across all wavelengths. We identified bias from individual units, particularly due to calibration drift, as the primary source of error between AMODv2s and reference units. In a test of 15-month calibration stability performed on 16 AMOD units, we observed median changes to calibration constant values of −7.14 %, −9.64 %, −0.75 %, and −2.80 % at 440, 500, 675, and 870 nm, respectively. We propose annual recalibration to mitigate potential errors from calibration drift. We conducted a trial deployment to assess the reliability and mechanical robustness of AMODv2 units. We found that 75 % of attempted samples were successfully completed in rooftop laboratory testing. We identify several failure modes in the laboratory testing and describe design changes that we have since implemented to reduce failures. We demonstrate that the AMODv2 is an accurate, stable, and low-cost platform for air pollution measurement. We describe how the AMODv2 can be implemented in spatial citizen-science networks where reference-grade sensors are economically impractical and low-cost sensors lack accuracy and stability.
- Article
(2777 KB) - Full-text XML
- Companion paper 1
- Companion paper 2
-
Supplement
(7511 KB) - BibTeX
- EndNote


Fine particulate matter air pollution (PM2.5) is a leading cause of human morbidity and mortality as well as a significant contributor to radiative climate forcing (Myhre et al., 2013; Forouzanfar et al., 2016; Brauer et al., 2016; Vohra et al., 2021). Inhaled PM2.5 can penetrate deep into the lungs, leading to both acute and chronic health impacts (Pope and Dockery, 2006; Janssen et al., 2013; Feng et al., 2016; Kim et al., 2019). Each year, millions of deaths worldwide are attributed to PM2.5 exposure (Brauer et al., 2016; Forouzanfar et al., 2016). In addition to public health, PM2.5 also contributes to visual degradation of the atmosphere and affects the climate by influencing Earth's radiative budget (Myhre et al., 2013). Regions with the highest levels of air pollution often lack adequate ground-level monitoring (Snider et al., 2015; Brauer et al., 2016). Thus, disease estimates for much of the world's population rely on exposure estimates where satellite data or model simulations are the best or only source of information on human exposure. Installing a global network of reference-grade surface monitors is not currently feasible due to the high installation and maintenance costs.
Satellite remote sensing, supplemented with data from surface measurements and chemical transport models (CTMs), represents the state of the art for global PM2.5 monitoring at relatively high temporal and spatial resolution (van Donkelaar et al., 2016, 2019; Hammer et al., 2020; Lee, 2020). Measurements from satellite instruments, such as the Moderate Resolution Imaging Spectrometer (MODIS) and the Multi-angle Imaging SpectroRadiometer (MISR) (Salomonson et al., 1989; Diner et al., 1998), are used to estimate surface-level PM2.5 concentrations (e.g Liu et al., 2005), which, in turn, have facilitated research into the health effects associated with PM2.5 exposure (Brauer et al., 2016; Forouzanfar et al., 2016; Li et al., 2018; Lu et al., 2019). Satellites equipped with aerosol remote sensing instrumentation retrieve aerosol optical depth (AOD), a measure of light extinction in the atmospheric column, which can then be converted to ground-level PM2.5 using a CTM or statistical relationship (Liu et al., 2005; van Donkelaar et al., 2006, 2010, 2012, 2016; Hammer et al., 2020). The relationship between AOD and PM2,5 can be expressed as follows (Liu et al., 2005):
where η is a conversion factor between PM2.5 and AOD. The uncertainty of surface-level PM2.5 concentrations derived from satellite observations has two main components: (1) the uncertainty of the satellite AOD measurement and (2) the uncertainty of the modeled PM2.5-to-AOD ratio (η) (e.g., Ford and Heald, 2016; Jin et al., 2019).
The error of the satellite AOD retrieval can be estimated using ground-level AOD measurements from instruments known as Sun photometers (e.g., Sayer et al., 2012). The Aerosol Robotics Network (AERONET) provides reference-quality AOD measurements at hundreds of locations around the Earth; these data are used to constrain and reduce uncertainties in AOD values (Holben et al., 1998). AERONET instruments are rarely deployed at high spatial density (i.e., sub-city scale), outside of field campaigns (e.g., Garay et al., 2017), due to the high cost of the instrument and supporting equipment (> USD 50 000). Determining the uncertainty in the modeled PM2.5-to-AOD ratio requires co-locating AOD and PM2.5 measurements. The Surface PARTiculate mAtter Network (SPARTAN) was established to provide co-located PM2.5 and AOD reference measurements and to evaluate uncertainties in both AOD and the PM2.5-to-AOD ratio; however, the number of SPARTAN sites worldwide is limited by number (∼ 20 active sites), equipment, and operational costs (Snider et al., 2015).
Networks of low-cost nephelometers (notably the Plantower PMS5003) have been suggested and deployed in large numbers as a means to provide surface PM2.5 data at a higher spatial density than can be achieved with reference-grade monitors (Lin et al., 2020; Li et al., 2020; Badura et al., 2020; Lu et al., 2021; Chadwick et al., 2021). However, low-cost sensors (or more specifically, the Plantower PMS5003 devices) tend to exhibit measurement bias (Kelly et al., 2017; Zheng et al., 2018; Levy Zamora et al., 2019; Sayahi et al., 2019; Tryner et al., 2020), requiring correction relative to reference monitors (Ford et al., 2019; Wendt et al., 2019). Low-cost Sun photometers have been deployed at high spatial resolution to evaluate satellite AOD uncertainty as part of the Global Learning and Observations to Benefit the Environment (GLOBE) program (Boersma and de Vroom, 2006; Brooks and Mims, 2001). GLOBE Sun photometers were operated by students as part of education programming, resulting in over 400 measurements between January 2002 and October 2005 in the Netherlands (Boersma and de Vroom, 2006). These data were used to evaluate satellite-derived AOD in corresponding regions. However, the authors noted difficulty coordinating with schools to achieve consistent measurements, specifically those corresponding with satellite overpasses. Collectively, these previous efforts have advanced the understanding of AOD and PM2.5-to-AOD variability considerably. However, there is still demand for co-located PM2.5 and AOD samplers deployed at higher spatial density and with greater temporal resolution (Ford and Heald, 2016; Garay et al., 2017; Jin et al., 2019). Samplers used in these networks must have a sufficiently low cost in order to be deployed in large numbers, must have manageable operational and maintenance requirements, and must provide useful and reliable PM2.5 and AOD measurements (i.e., measurement data of sufficient accuracy and precision so as to support scientific inference or public decision-making). Thus, consideration should be given to the trade-offs associated with deploying low-cost sensors, such as scalability and simplicity vs. accuracy and reliability.
Wendt et al. (2019) describe a low-cost, compact PM2.5 and AOD ground monitor. The device, known as the Aerosol Mass and Optical Depth (AMOD) sampler, featured a PM2.5 cyclone inlet for integrated gravimetric sampling and composition analysis, a low-cost nephelometer (Plantower PMS5003, Beijing, China) for real-time PM2.5 mass estimate, and four filtered-photodiode (Intor Inc., Socorro, NM, USA) sensors at 440, 520, 680, and 870 nm for measuring AOD. Here, we refer to this earlier instrument as the AMODv1. The assembly cost for the first manufacturing set of 25 AMODv1 instruments was under USD 1100 per unit (Wendt et al., 2019). The results of a field validation campaign revealed agreement to within 10 % (mean relative error) for AOD values relative to co-located AERONET instruments. The mean AOD difference was < 0.01 with 95 % confidence upper and lower limits of agreement of 0.03 and −0.02, respectively. With respect to PM2.5, the AMODv1 filter measurements agreed within 8 % (mean relative error) relative to federal equivalent method (FEM) monitors from the Environmental Protection Agency (EPA), with a mean difference of −0.004 µg m−3 and 95 % confidence upper and lower limits of agreement of 1.84 and −1.85 µg m−3, respectively (Wendt et al., 2019). With respect to real-time PMS5003 PM2.5 measurements, the mean relative error between the AMODv1 and an FEM monitor was 1.98 µg m−3 with a mean difference of 0.04 µg m−3 and 95 % confidence upper and lower limits of agreement of 5.02 and −4.95 µg m−3, respectively (Wendt et al., 2019). These results indicated that the AMODv1 accurately quantified surface PM2.5 concentrations and AOD simultaneously and at a substantially lower cost and smaller size than existing equipment. To test the implementation of the AMODv1, we constructed and deployed 25 AMODv1 units in a citizen-science network, as documented in Ford et al. (2019).
Despite the promise of the AMODv1, the initial deployment highlighted several key limitations. First, the AMODv1 lacked quality control measures for misalignment or cloud contamination during the measurement period. Second, the instrument had limited temporal resolution for AOD (typically one measurement per day). Third, despite the presence of a visual alignment aid (Wendt et al., 2019), many volunteers found it difficult to align the instrument with the Sun, which was compounded by inconsistent standards as to what constituted proper alignment. Fourth, data could not be transmitted wirelessly or accessed remotely. The first objective of this current work was to address the abovementioned four major limitations of the AMODv1 design. Another shortcoming of our work on the AMODv1 was limited stability analysis of the AOD sensors across varying atmospheric conditions and over time. Therefore, the second objective of this work was to evaluate the stability of the AOD sensors across a range of pollution levels and to assess the stability of the AOD sensors after repeated deployments over the course of a year. Here, we describe our design changes and extended validation efforts toward our research objectives. First, we summarize the design advantages of the AMODv2 relative to the AMODv1. Second, we present the results from a validation campaign where AMODv2 units were co-located with reference instruments. Third, we analyze the stability of AMODv2 AOD measurements after 15 months of use. Finally, we analyze the reliability of the AMODv2 design in a series of laboratory experiments. The results presented here demonstrate that the AMODv2 is a practical option to establish spatially dense PM2.5 and AOD measurement networks. Applied in these networks, the AMODv2 will close gaps in the existing global aerosol measurement infrastructure of ground-based and satellite-based observations.
2.1 Instrument design
We designed the AMODv2 to sample integrated gravimetric PM2.5 mass concentration, real-time PM2.5 mass concentration, and AOD simultaneously. One intended application is large-scale sampling campaigns with the AMODv2 instruments operated by volunteers with little to no background in aerosol or atmospheric science (Ford et al., 2019). Thus, we prioritized a design that is low-cost, accurate, mechanically robust, portable, automated, and user-friendly. We provide images of AMODv2 hardware in Fig. 1, highlighting key internal and external components.
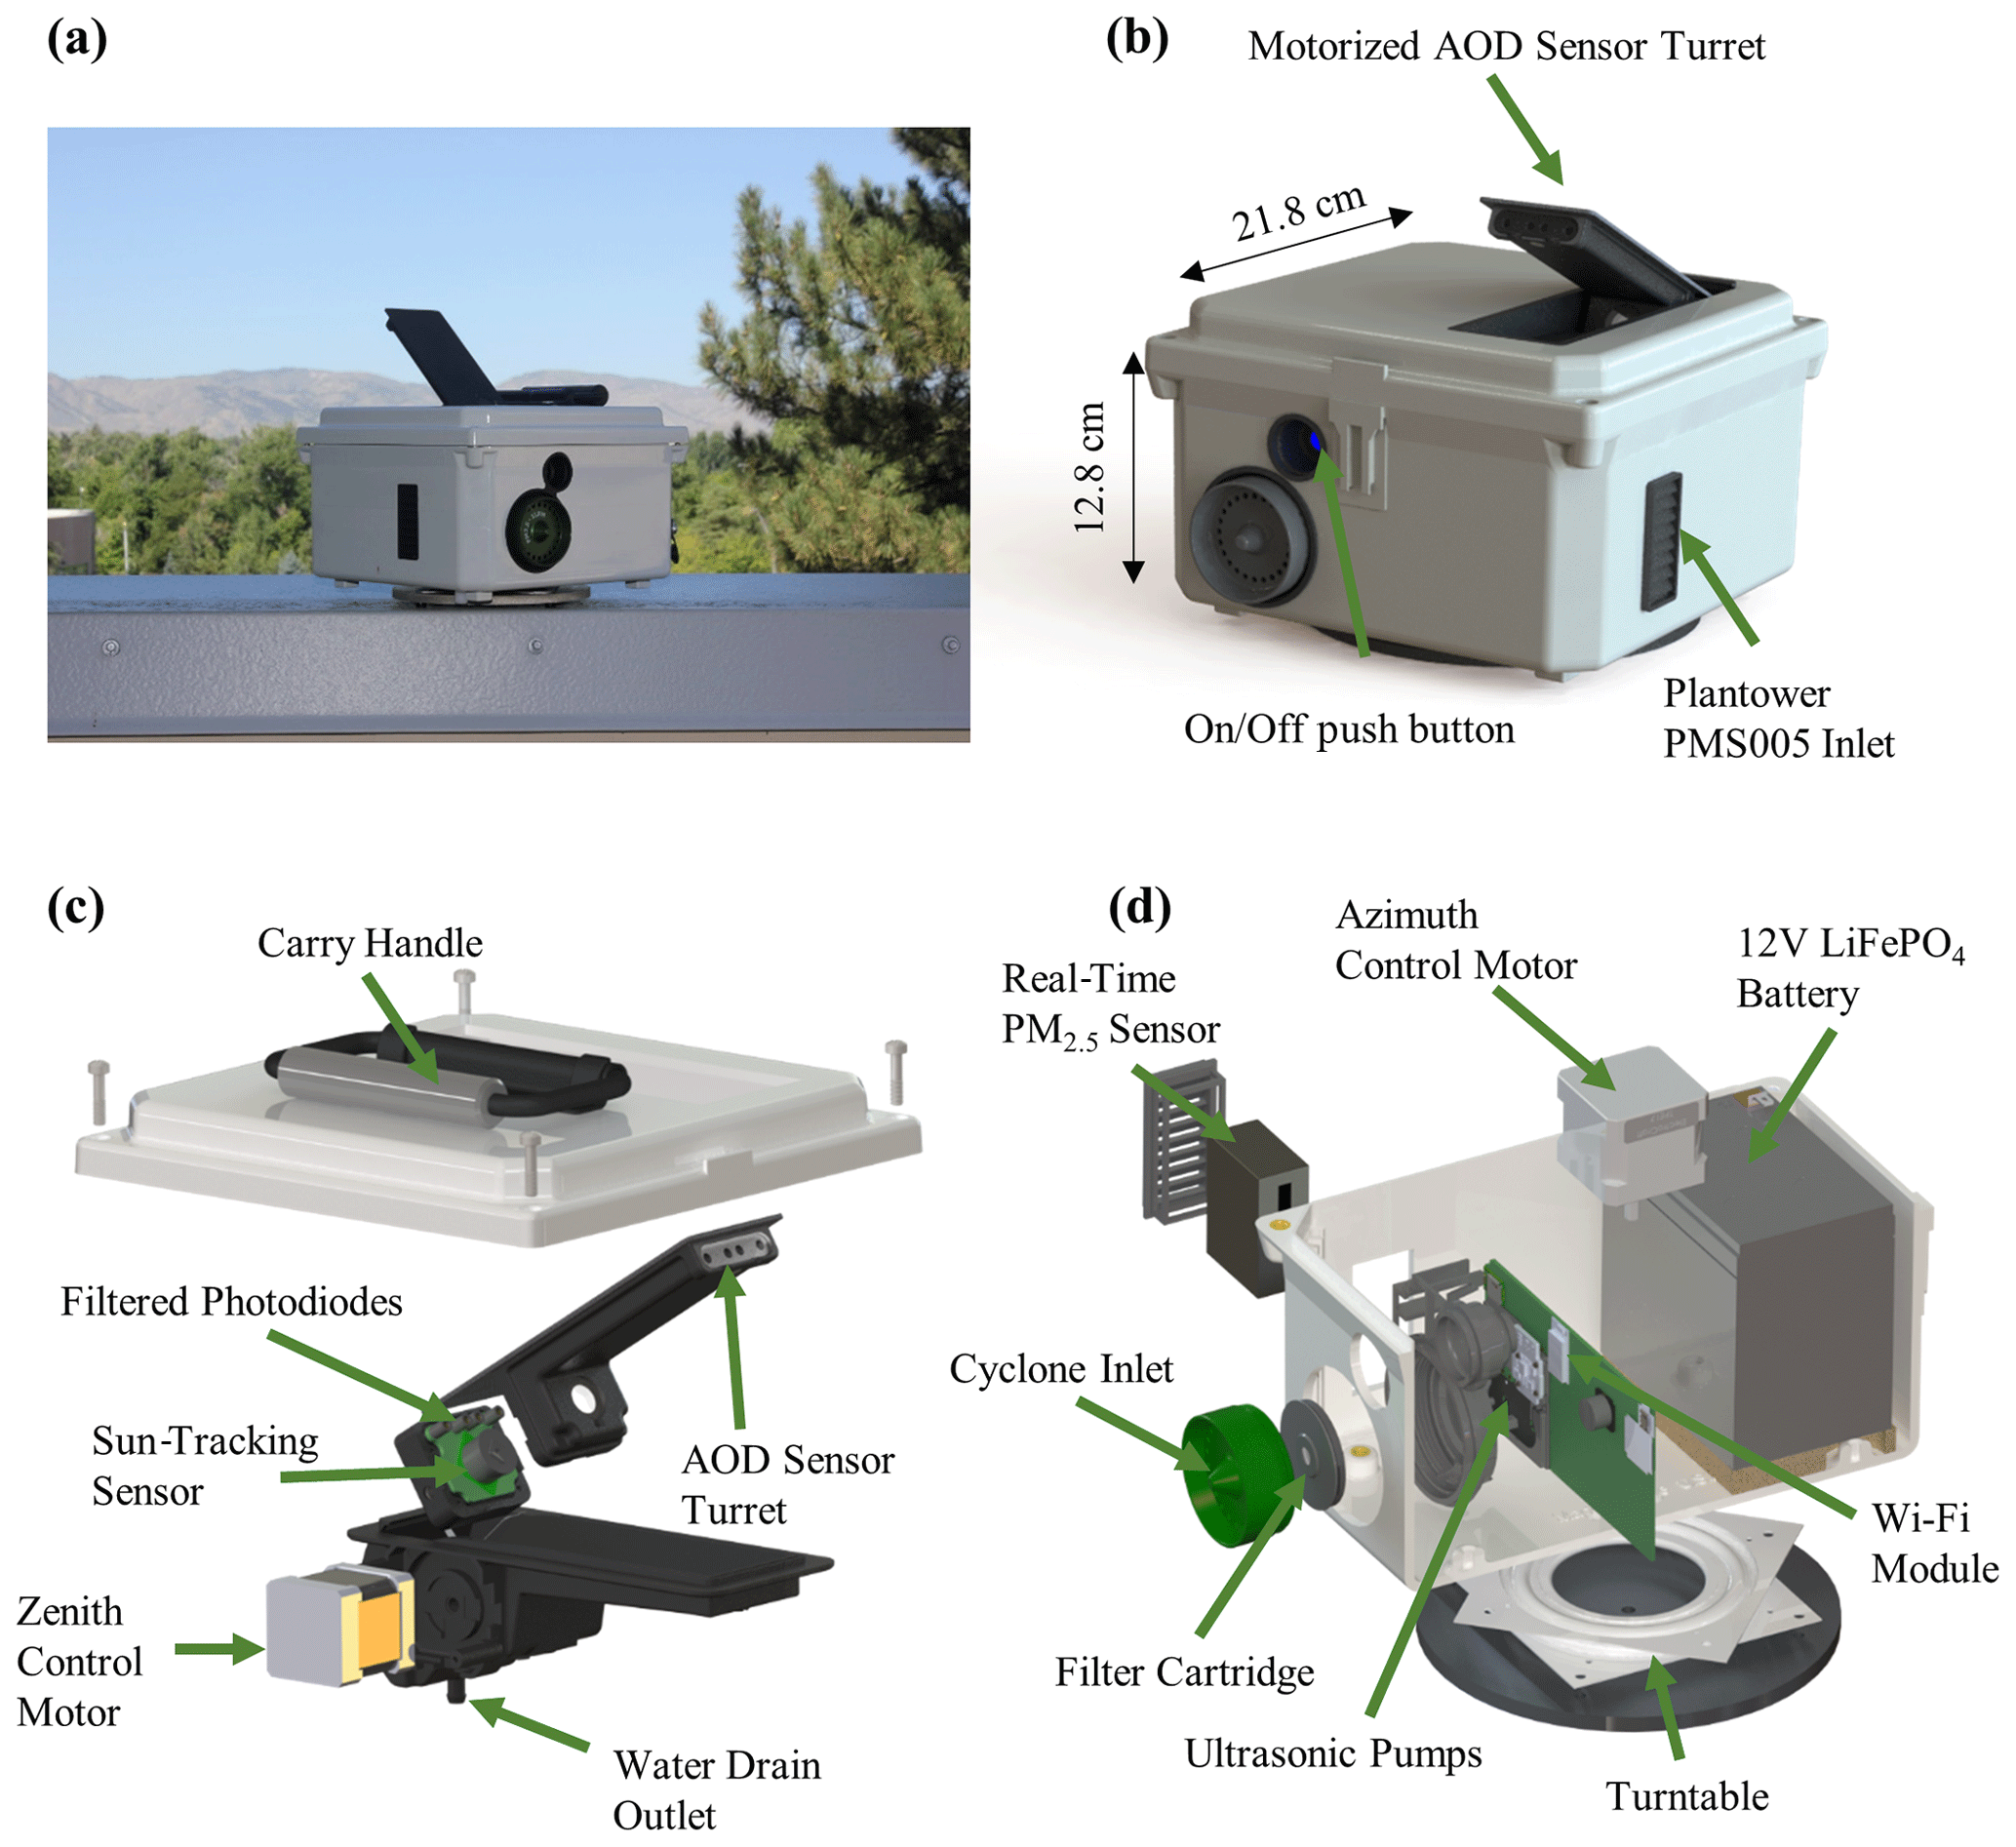
Figure 1Images detailing the external and internal AMODv2 design and hardware: (a) photograph of the AMODv2 sampling outdoors; (b) external computer-animated rendering of AMODv2 features and dimensions; (c) computer-generated exploded view of the AOD measurement subsystem; (d) computer-generated exploded section view of the PM2.5 sampling, wireless data transfer, and power subsystems.
The AMODv2 measures AOD at 440, 500, 675, and 870 nm using optically filtered photodiodes (Intor Inc., Socorro, NM, USA) with narrow bandwidth (< 15 nm at full width at half maximum signal). The measurement process is fully automated using a solar tracking system (Sect. 2.3), reducing the potential for misalignment due to user error. Movement in the zenithal plane is achieved using a custom turret module embedded in the interior of the AMODv2 enclosure (Fig. 1a). The module was designed in SOLIDWORKS® (ANSYS, Inc., Canonsburg, PA, USA) and built using multi-jet fusion printing. The module houses a custom-printed circuit board containing the solar tracking sensors and the filtered photodiodes. Light enters the turret through four, 4 mm apertures and passes through 112 mm tubes to reach the filtered photodiodes (Fig. 1c). These proportions yield a viewing angle of approximately 2∘ for each photodiode sensor element. A stepper motor (Stepper Online 17HS10-0704S-C2, Nanjing City, China), fixed to the turret, actuated the zenithal rotation. Movement in the azimuthal plane is actuated using a second stepper motor (Stepper Online 17HS19-1684S-C6, Nanjing City, China) fixed to a turntable and baseplate assembly (McMaster-Carr 6031K16, Elmhurst, IL, USA), which enables 360∘ rotation of the AMODv2. The angular resolution of each stepper motor is tuned to 0.056∘ using programmable drivers (Texas Instruments DRV8834RGER, Dallas, Texas, USA). Active tracking is accomplished using closed-loop control enabled by a three-axis accelerometer (STMicroelectronics LSM6DSM, Geneva, Switzerland), a GPS module (u-blox CAM-M8, Thalwil, Switzerland), and a quadrant photodiode solar tracking sensor (Solar MEMS NANO-ISS5, Seville, Spain).
The AMODv2 measures PM2.5 using both real-time and time-integrated techniques. Real-time PM2.5 concentrations are measured and streamed using a light-scattering PM2.5 sensor (Plantower PMS5003, Beijing, China). A 3D-printed fixture secured the sensor in position to sample ambient air, while downward sloping vents protected the sensor from water ingress (Fig. 1d). PM2.5 concentrations are evaluated on the PMS5003 chip via a manufacturer proprietary algorithm. The AMODv2 reports the PM2.5 values corrected by Plantower's proprietary atmospheric correction. These values are accessed by the AMODv2 microcontroller via serial communication. A flowchart detailing the PM2.5 measurement protocol is provided in Fig. S1 in the Supplement File S1.
For time-integrated PM2.5 mass concentration measurement, we leveraged a PM2.5 cyclone design from prior studies (Volckens et al., 2017; Kelleher et al., 2018; Wendt et al., 2019). The main circuit board features three ultrasonic pumps (Murata MZBD001, Nagaokakyo, Japan) and a mass flow sensor (Honeywell Omron D6F, Charlotte, NC, USA) to control the flow of air through a custom aluminum cyclone and filter cartridge with a 50 % cut point of 2.5 µm (Fig. 1d). The gravimetric sample is collected on a 37 mm Teflon filter secured within a filter cartridge. Sampled particles are collected on a single filter that is pre- and post-weighed for each sample. During deployment, a field blank is carried along with the sampler to correct for incidental mass contamination or drift.
The AMODv2 is powered using a 12 V, 10 Ah LiFePO4 battery (Dakota Lithium, Grand Fork, ND, USA) with a secondary 12 V, 3.3 Ah LiFePO4 (Battery Space, LFH4S4R1WR-C5, Richmond, CA, USA) battery in parallel. The battery is charged using a barrel plug inlet accessible on the side of the enclosure. A detachable rubber plug seals the inlet from the outside environment when not charging. Charging circuitry supports charging at a rate of 3.0 A, enabling a full charge in approximately 8 h. A full charge can power the AMODv2 for over 120 h.
The AMODv2 records and wirelessly transfers meteorological and quality control data in real time. Meteorological data include ambient temperature (∘C), ambient pressure (hPa), and relative humidity (%). Quality control metrics include sample duration (s), sample flow rate (L min−1), total sampled volume (L), battery temperature (∘C), battery voltage (V), battery state of charge (%), current draw (mA), and wireless signal strength (RSSI).
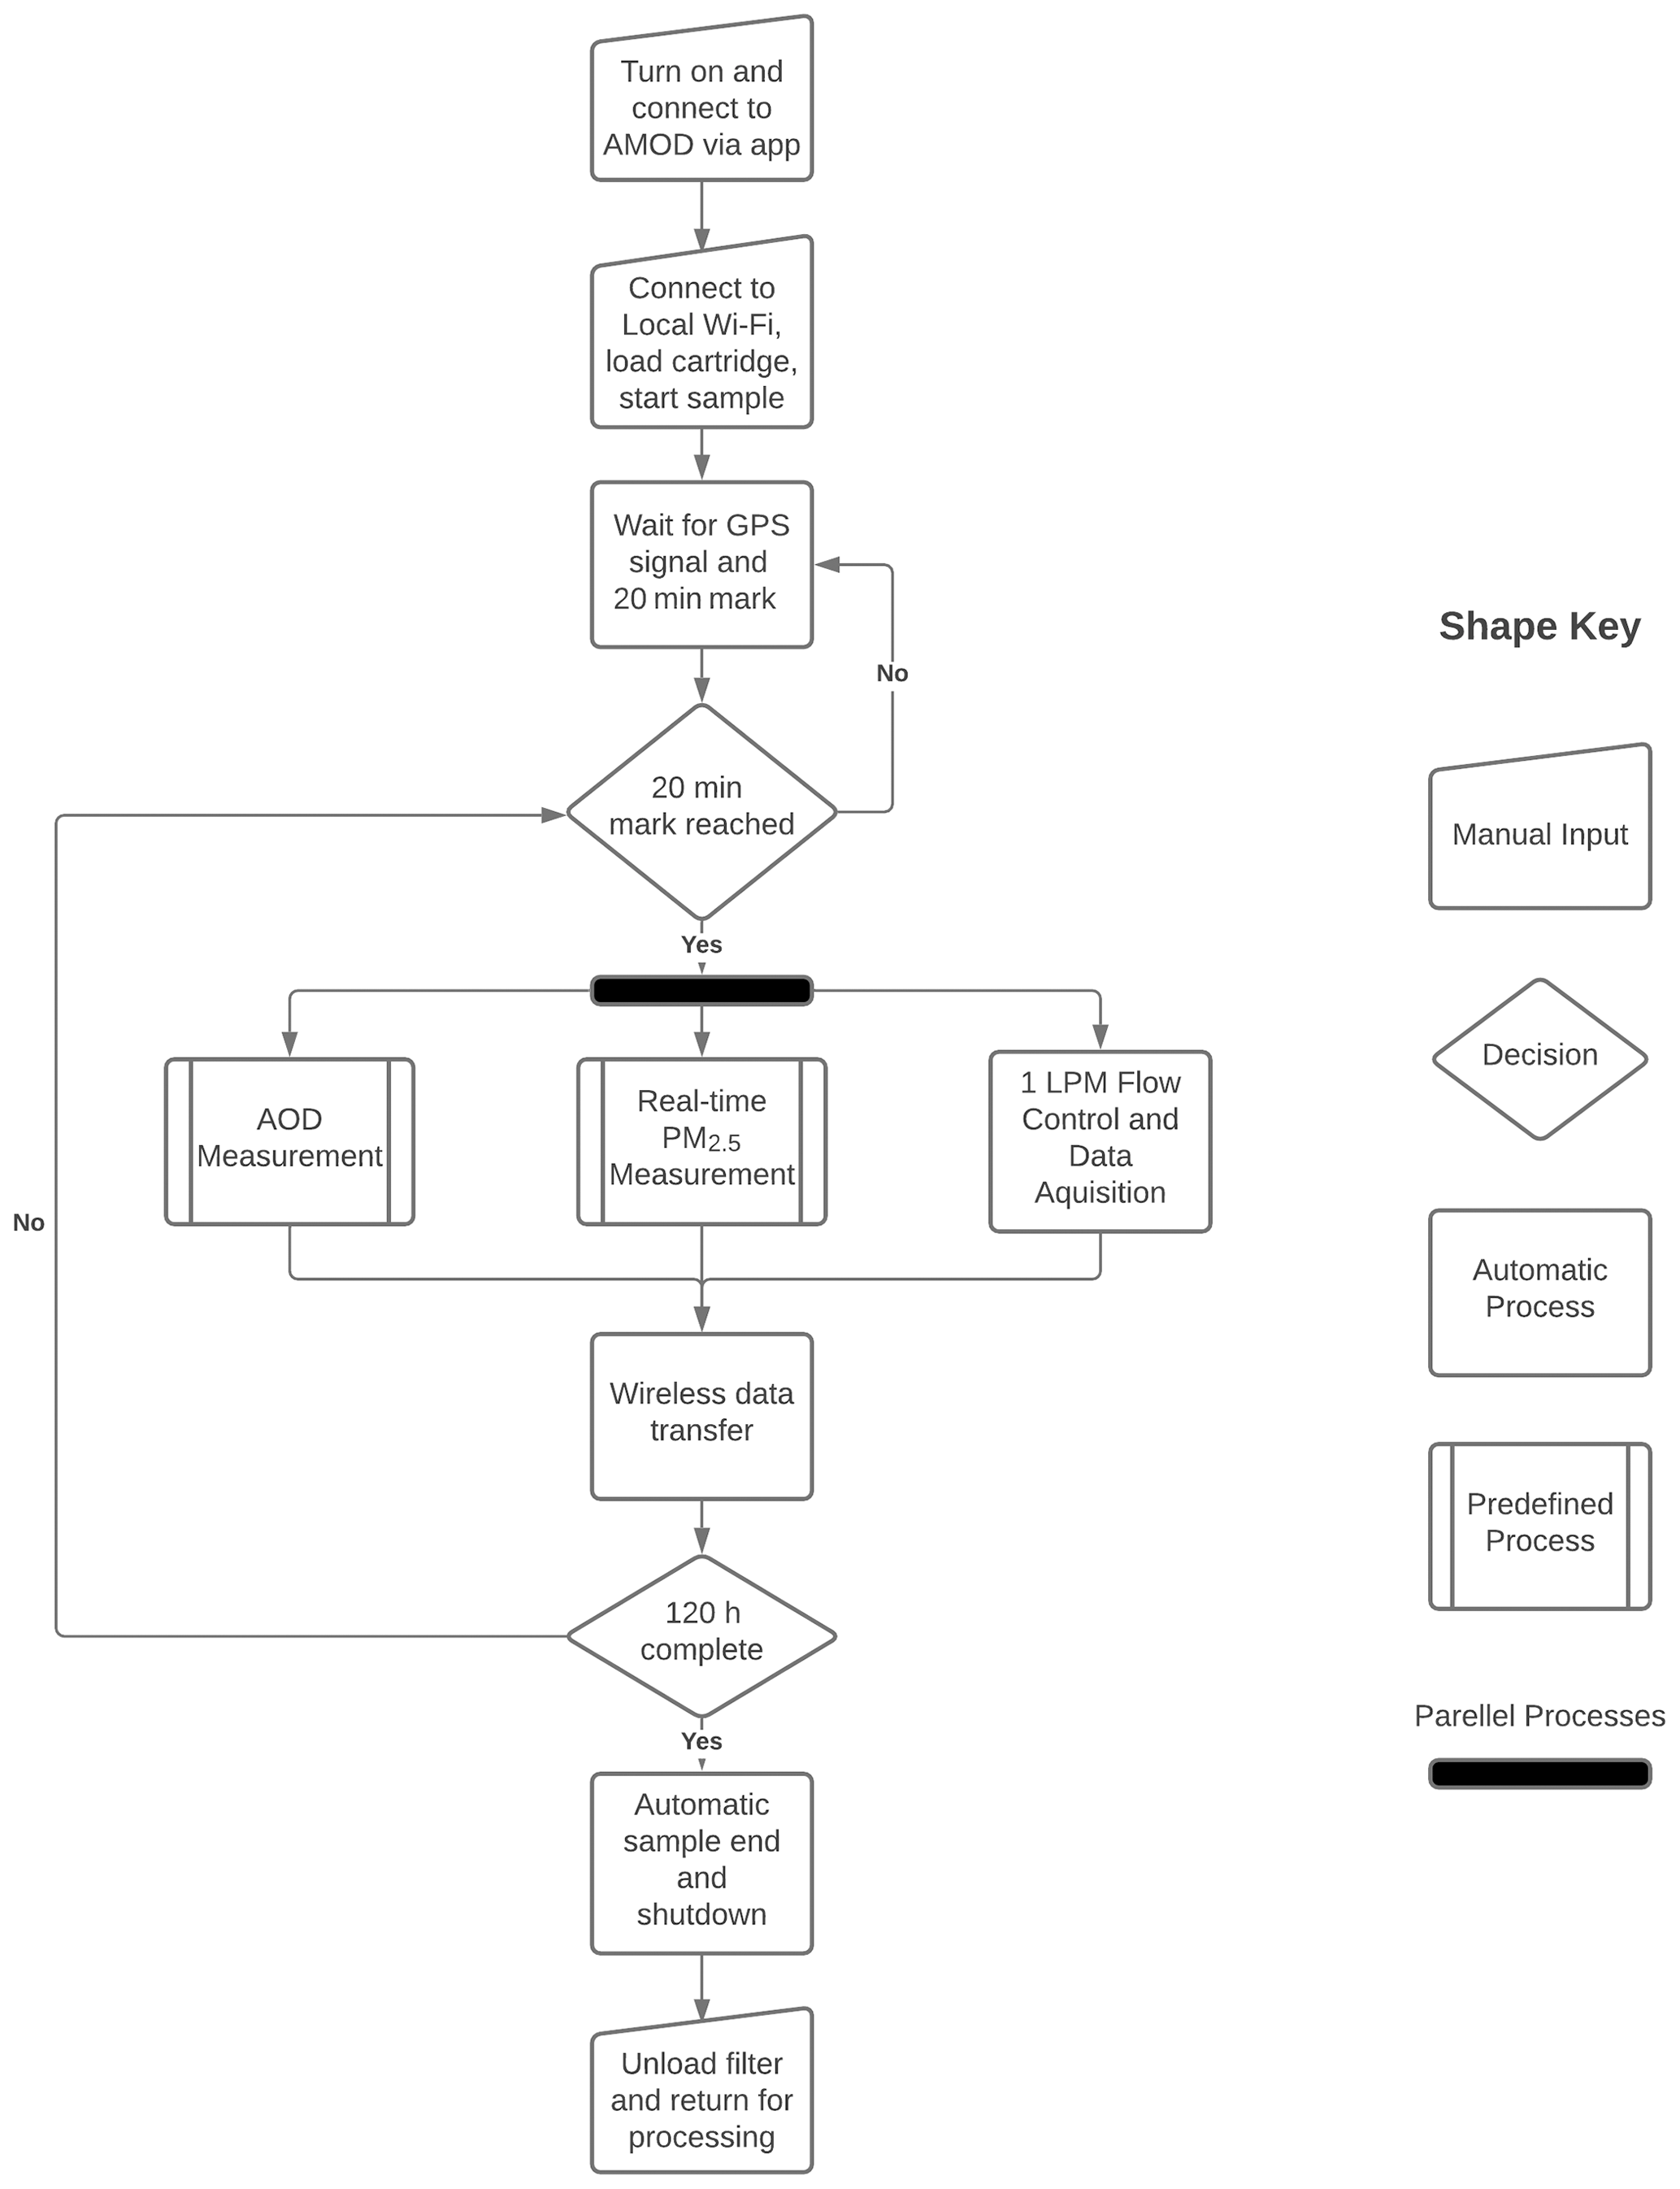
Figure 2Overall device operation flow diagram for a single sample. After each sample, the AMODv2 must be recharged for at least 8 h. Manual inputs require operator intervention. Automatic processes are executed with no operator intervention. Predefined processes are detailed in Figs. S1–S6. Parallel processes are executed pseudo-simultaneously using a real-time operating system.
The external housing of the AMODv2 (Fig. 1b) is made from a weather-resistant National Electrical Manufacturer Association (NEMA) electrical enclosure (Polycase, YQ-080804, Avon, Ohio, USA). The dimensions of a fully assembled AMODv2 are 21.8 cm (width) × 21.8 cm (length) × 12.8 cm (height), with a weight of 3.1 kg. A folding carry handle is fixed to the upper surface of the enclosure to aid transport (Fig. 2b). The total cost of the AMODv2 was USD 1175 per unit, for a production run of 100 units (Table S1). This tabulation includes an estimated 3 h of assembly at a rate of USD 25 per hour.
We developed the AMODv2 control software using an online, open-source platform (Mbed™; Arm® Ltd., Cambridge, UK). The software was written in C++ and executed by a 64-bit microcontroller (STMicroelectronics STM32L476RG, Geneva, Switzerland). We implemented wireless data transfer using a Wi-Fi and Bluetooth™ module (Espressif Systems ESP32-C3-WROOM, Shanghai, China). A microSD card stores all data for data backup or offline deployment (Molex 5031821852, Lisle, IL, USA). We integrated software modules for AOD, real-time PM2.5, gravimetric PM2.5, data logging, and wireless data transfer using a real-time operating system (RTOS) for pseudo-simultaneous software execution.
2.2 AOD measurement and solar tracking
The AMODv2 applies the Beer–Lambert–Bouguer law to calculate AOD (τa). This relationship, expressed in terms of measurable parameters, is as follows:
where m is the unitless air mass factor, which accounts for the increased air mass that light passes through as the Sun approaches the horizon; R is the Earth–Sun distance (in astronomical units, AU); V is the signal produced by the light detector (in volts); τR accounts for Rayleigh scattering by air molecules; p is the pressure at the sensor (in Pa); λ is the sensor wavelength (in m); accounts for ozone absorption; and V0 is the extraterrestrial constant (in volts), which is the sensor signal if measured at the top of the atmosphere and is determined via calibration. AOD values at 440, 500, 675, and 870 nm are calculated using Eq. (2). The Earth–Sun distance, R, is computed directly from GPS data and the solar positioning algorithm. V is the signal produced by the photodiode, and V0 is accessed from on-chip memory. The relative optical air mass factor is computed as a function of solar zenith angle (θ) as follows (Young, 1994):
The contribution of total optical depth from Rayleigh scattering, τR, is calculated based on wavelength and ambient pressure measured by an ambient pressure sensor mounted on the circuit board with the AOD sensors (Bosch Sensortec BMP280, Kusterdingen, Germany) (Bodhaine et al., 1999). The ozone concentration is estimated using an empirical model based on time of year and location, and converted to using wavelength-specific ozone absorption coefficients (Griggs, 1968; Van Heuklon, 1979). With all parameters known, Eq. (2) is applied to calculate AOD.
We implemented automatic solar tracking capabilities using a suite of low-cost sensors and a multistage algorithm. Detailed flowcharts of the AOD measurement protocol are provided in Figs. S2–S6. The open-loop stage is initiated when the microcontroller requests an AOD measurement and the GPS time and location is computed. Using this information, the AMODv2 applies a solar positioning algorithm from the National Renewable Energy Laboratory (NREL) to compute the solar elevation angle (Reda and Andreas, 2008). The calculated solar zenith angle is then compared with the pitch of the AOD turret relative to horizontal. The turret stepper motor rotates the turret in the direction of the Sun until the elevation angle of the AOD turret is approximately equal to that of the Sun. The base motor rotates counterclockwise in order to achieve approximate azimuth alignment. After every 10∘ of azimuthal rotation, the total signal of the Sun tracking quadrant photodiode is compared with an empirical threshold. If the threshold is exceeded, the AMODv2 enters closed-loop tracking. If the threshold is not exceeded on the first revolution, the AMODv2 executes a second revolution before ending the search protocol.
In the closed-loop tracking stage, the rotation of the motors is controlled using the zenithal and azimuthal error signals produced by the quadrant photodiode. The quadrant photodiode is mounted in a diamond orientation, with two quadrants forming a vertical axis and two forming a horizontal axis. The vertical error signal is the ratio of the top and bottom quadrants, and the horizontal error signal is the ratio of the right and left quadrants. The stepper motors rotate independently until each error signal is reduced within an experimentally determined threshold. The motors then lock in place while an AOD measurement is recorded. The AMODv2 measures AOD as triplet sets. Between each measurement, both motors disengage for 30 s to conserve power. After 30 s, the AMODv2 executes the tracking algorithm and records an AOD measurement. This process is repeated until the triplet set is completed or until 3 min have elapsed since the initial measurement request was made by the processor.
Real-time quality control is performed on each measurement triplet. Empty or incomplete triplets are flagged and assigned an error code. Completed triplets are screened for cloud contamination using the AERONET triplet cloud-screening algorithm (Smirnov et al., 2000; Giles et al., 2019). The algorithm takes the maximum deviation of any two measurements within a triplet and applies thresholds to mark triplets as clear or contaminated by cloud (Smirnov et al., 2000; Giles et al., 2019). Large deviations of AOD within a triplet are more likely due to cloud contamination than changes in aerosol loading (Smirnov et al., 2000; Giles et al., 2019). Measurements identified as cloud contaminated are flagged with a unique numerical code. Measurements with incomplete triplets are also flagged with a unique numerical code.
2.3 AOD calibration procedure
The extraterrestrial constants for all AMODv2s were evaluated via calibration relative to AERONET Sun photometers (Cimel CE318, Paris, France) (Holben et al., 1998). AERONET instruments report AOD at 340, 380, 440, 500, 675, 870, 1020, and 1640 nm (Holben et al., 1998). We selected the four AMODv2 AOD wavelengths in part for direct comparison with AERONET instruments. We conducted calibrations at the MAXAR-FUTON site in Fort Lupton, Colorado (40.036∘ N, 104.885∘ W) between November 2019 and February 2020. AMODv2 units were co-located within 50 m of the AERONET instrument and sampled for 2 to 3 h at a rate of one sample every 2.5 to 3 min (note that the AERONET instruments are programmed to record AOD every 15 min, so we oversampled the AMODv2 to achieve sufficient temporal overlap with AERONET). AMODv2 and AERONET Level 1.0 measurements concurrent within 60 s of each other were included in the calibration data set (Holben et al., 1998). For each set of concurrent measurements, we calculated the extraterrestrial constant by applying Eq. (2) solved for V0, where V was the raw voltage reported by the AMODv2, and τa was the AOD reported by the AERONET instrument. The AMODv2 calibration constants were the average value of V0 for a given instrument and wavelength.
2.4 User operation and measurement procedure
We designed the AMODv2 to be operated by individuals without a background in aerosol sampling. We developed a standard procedure that is detailed in a user manual provided as the Supplement File S2 to this paper. After the initial setup, the AMODv2 requires no operator input for the duration of the sample. A flowchart outlining the manual and automatic steps to perform an AMODv2 measurement is provided in Fig. 2.
Materials needed to initiate a sample include an AMODv2, a cartridge loaded with a pre-weighed filter, and a smartphone with the AMODv2 control application installed (“CEAMS”; available on the Apple App Store and Google Play). A detailed description of the mobile application is given in the abovementioned user manual (see the Supplement File S2 to this work). After executing an initialization routine by selecting “Scan for Device”, the operator may connect to their device via Bluetooth™ using the mobile application. The operator can select a wireless network and input the proper credentials to connect the AMODv2 to the internet. The application then prompts the operator to scan the QR code on the back of the filter cartridge to link the filter with the upcoming sample in the data log. After the cartridge is manually loaded into the compartment behind the inlet (Fig. 1b), the AMODv2 should be placed on a flat surface with an unobstructed view of the Sun. The operator then starts the sample from the mobile application. After an initial data push, the sample begins at the next 20 min mark (e.g., 12:00, 12:20, or 12:40 MST). The AMODv2 begins sampling air through the inlet at 1 L min−1 and continues to do so for the remainder of the 120 h sampling period. Real-time PM2.5 and AOD measurements are initiated at each 20 min mark from the start of the sample. The PM2.5 reported at each 20 min interval is the average of measurements taken every 10 s over a period of 3 min. If the Sun is less than 10∘ above the horizon, the motors do not activate and the solar tracking algorithm is not executed. After each AOD and PM2.5 measurement is completed, data are uploaded to the affiliated website (https://csu-ceams.com/), where real-time visualizations of AOD and PM2.5 are available. Data reported to the website are accessible with a map-based user interface. Quality control data are available to research staff via a private administrator portal. A snapshot example of the website is provided in Fig. S7. At the conclusion of a sample, the operator removes the filter cartridge. Upon receipt of the filters, the CEAMS team stored the filters in the refrigerator until mailed in order to minimize the loss of volatile compounds. Complete data files can be downloaded from the website or accessed via a microSD card. Individual measurements of AOD and PM2.5, from which averages are derived, are available in the complete file, facilitating post-sample uncertainty analysis of PM2.5 and AOD measurements.
2.5 Validation, stability, and reliability studies
We assessed the precision and bias of AMODv2 AOD sensors relative to an AERONET monitor at the NEON-CVALLA site in Longmont, Colorado (40.160∘ N, 105.167∘ W) between June 2020 and December 2020 (Holben et al., 1998). We co-located our instruments within 50 m of the reference instrument (and within 5 m of each other) on 9 separate days with varying atmospheric conditions (e.g., wildfire smoke and clean air) using a total of 14 unique AMODv2 units. Each test consisted of 2 to 4 h of sampling at a rate of one sample approximately every 3 min. The AERONET reference monitor sampled at a frequency of one sample approximately every 15 min. AMODv2 and AERONET measurements concurrent within 2 min were included in the validation data set. The accuracy of AMODv2 AOD measurements was assessed via Deming regression.
We evaluated the long-term stability of the AOD sensors by recalibrating a set of 16 AMODv2 units 15 months after their initial calibration. Original calibrations for the units tested were conducted at the MAXAR-FUTON site in Fort Lupton, Colorado, USA (40.036∘ N, 104.885∘ W) on 21 February 2020. Recalibrations were conducted at the NEON-CVALLA site on 27 May 2021 (The MAXAR-FUTON site was indefinitely nonoperational at the time of the second calibration).
We tested the reliability of AMODv2 instruments in a series of 5 d, outdoor samples on the roof of a Colorado State University laboratory facility (430 N College Avenue, Fort Collins, Colorado, USA). All units were co-located within a 10 m radius. We started tests on 16 January, 30 January, and 31 March 2021, which included 34, 27, and 15 unique AMODv2 units, respectively, for a total of 76 samples. We assessed the reliability of the AMOD according to the rate at which samples terminated prematurely. Samples that failed to reach at least 115 h of the intended 120 h sample duration were designated as premature terminations. We specifically assessed the mechanical robustness of AMODv2 units by visually inspecting failed units for evidence of water ingress and electrical component damage. We also analyzed the AOD data from these samples to evaluate the automatic solar alignment procedure and quality control algorithm.
Compared with our prior work (Wendt et al., 2019), we tested the AMODv2 AOD measurement system under a broader range of atmospheric conditions. A sizable portion of validation measurements were taken under heavy smoke caused by the Cameron Peak and East Troublesome fires of 2020. We conducted additional testing under more moderate smoke and clear conditions. AOD values reported by AERONET during validation experiments ranged from 0.035 ± 0.01 to 1.59 ± 0.01 at 440 nm, 0.030 ± 0.01 to 1.51 ± 0.01 at 500 nm, 0.021 ± 0.01 to 1.130 ± 0.01 at 675 nm, and 0.016 ± 0.01 to 0.770 ± 0.01 at 870 nm.
3.1 Summary of design improvements
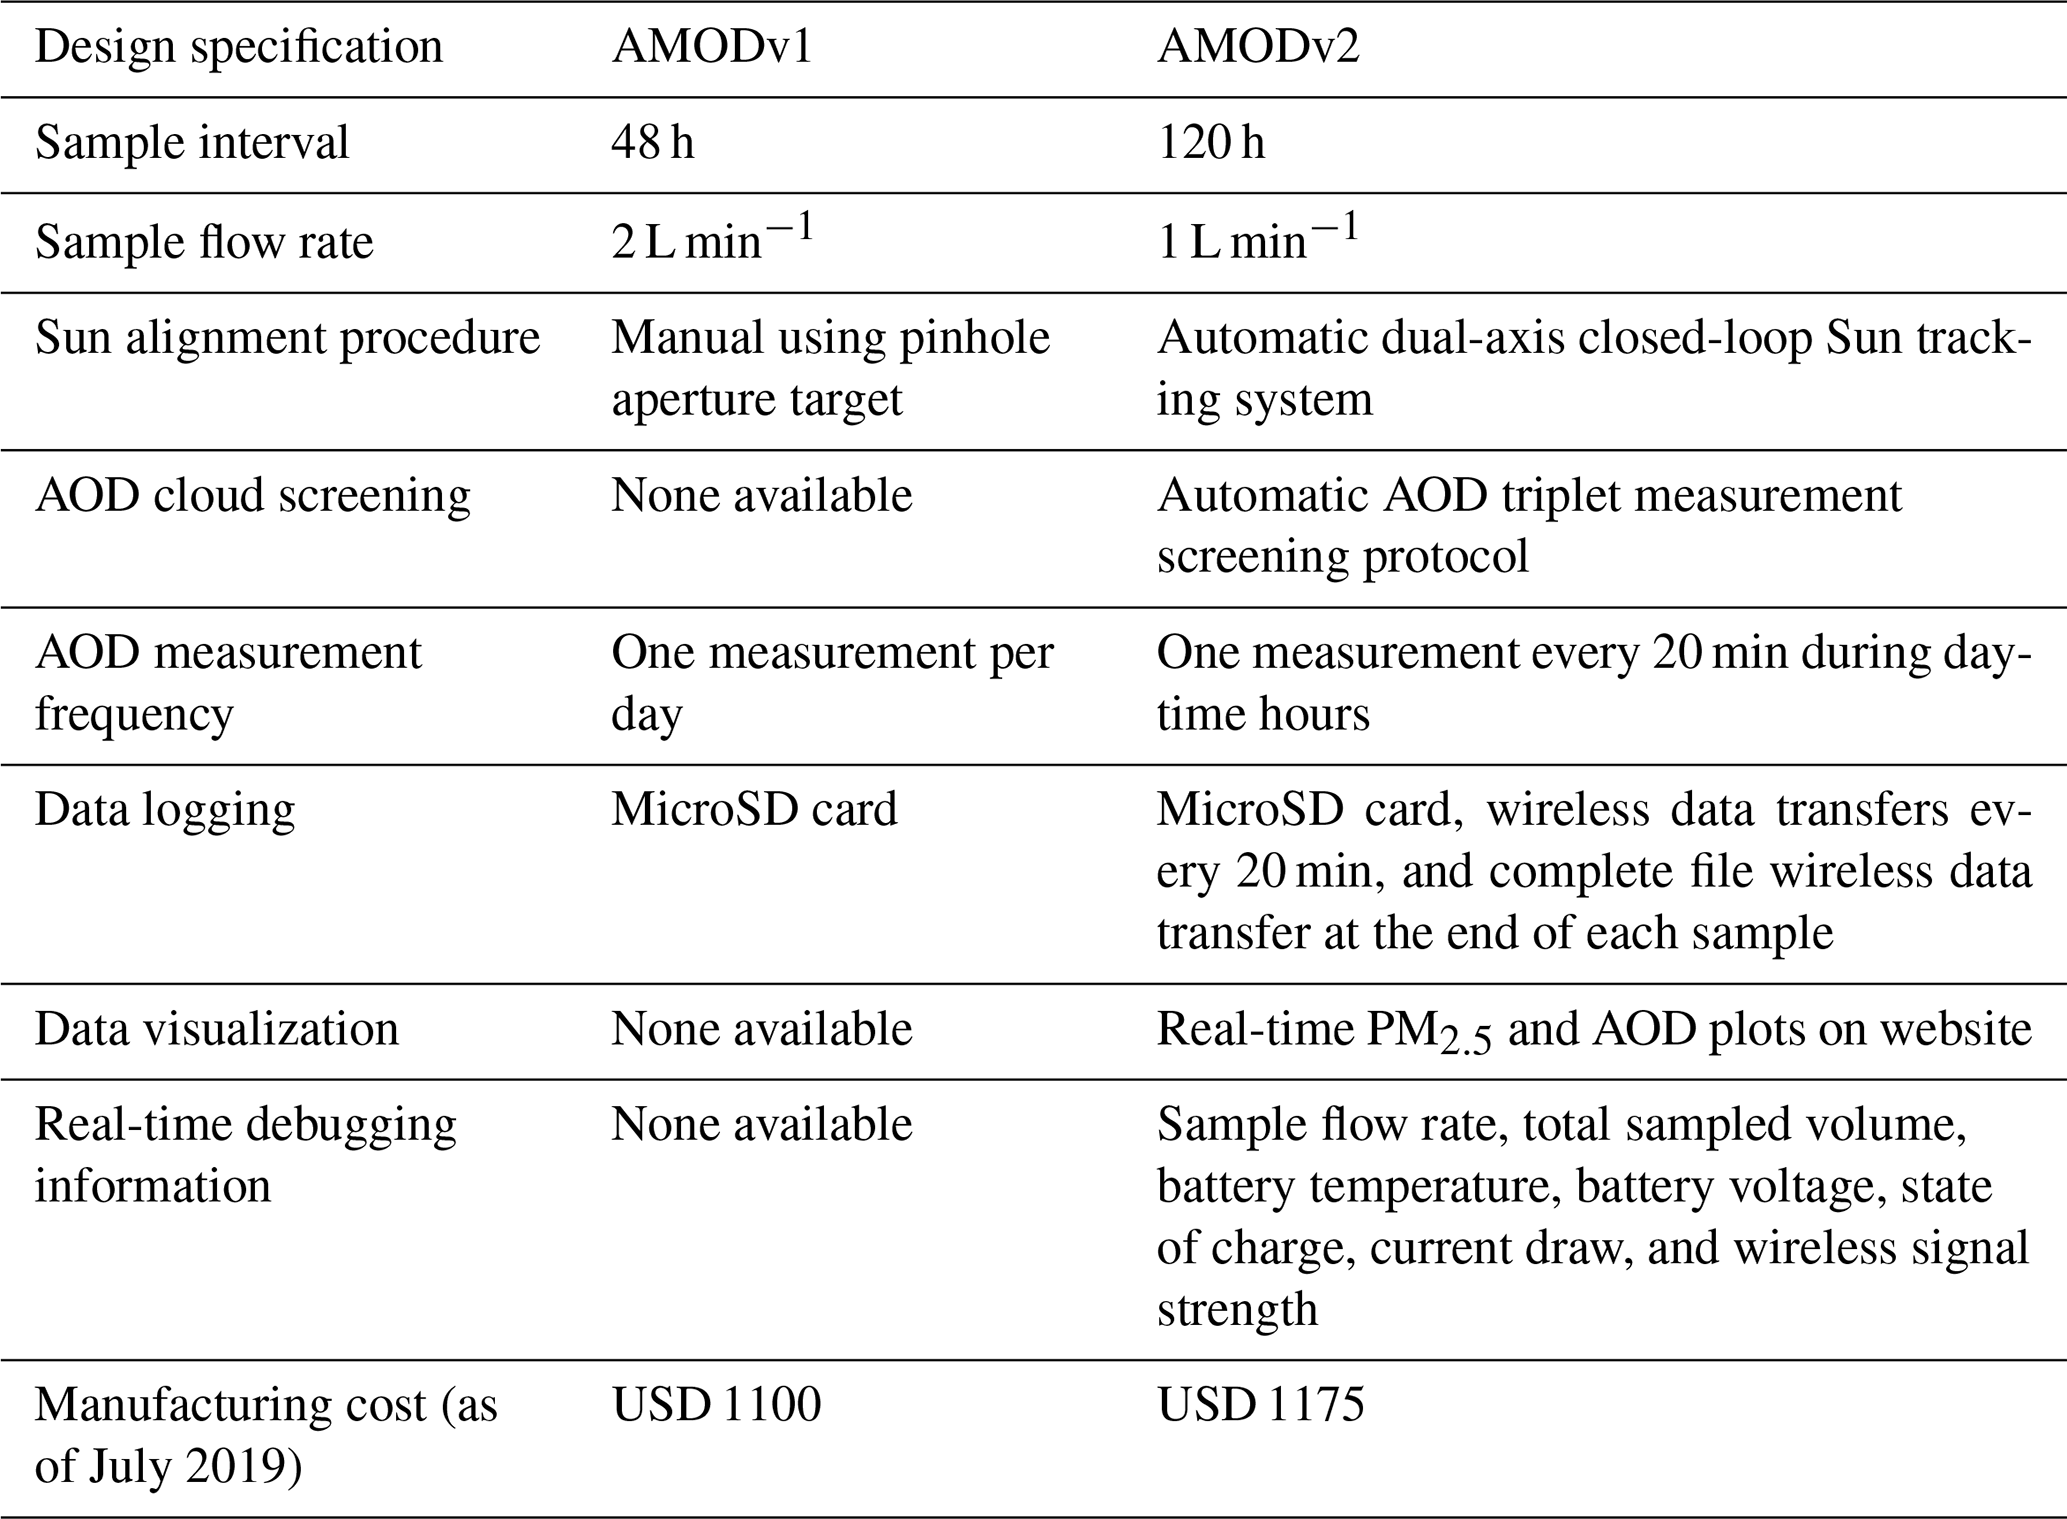
With the AMODv2 design presented here, we addressed the key shortcomings that we identified with AMODv1 enumerated in Sect. 1. First, AOD quality control was addressed with motorized solar tracking and a cloud-screening protocol. AMODv2 AOD measurements are taken as triplets, facilitating the application of screening protocols based on temporal variation (Smirnov et al., 2000; Giles et al., 2019). The availability of full data files at the end of each sample facilitates additional screening based on hourly and daily variations in AOD values, beyond the immediate quality controls applied to triplets. Second, insufficient temporal resolution was addressed by automating AOD measurement and increasing the sample rate. With automatic sampling in place, units measure every 20 min of daylight for up to 5 d. This updated protocol increases the likelihood that measurements will be available at the desired times of day (e.g., satellite overpass times). Third, we reduced the potential for operator error by eliminating the manual alignment requirement present in the prior design via solar tracking. Fourth, we improved data accessibility through the integration of a Wi-Fi module and a user-friendly website interface. These design changes were achieved while adding only USD 75 to the manufacturing cost, relative to AMODv1 (Table S2). The most important design changes from AMODv1 to AMODv2 are summarized in Table 1.
We conducted a sample deployment of 10 AMOD units during a wildfire smoke event in Fort Collins, Colorado, in October of 2020. The purpose of this deployment was to highlight the design advantages of the AMODv2 in the context of rapidly changing air quality. The results of the deployment are detailed in the Supplement File S1 (Figs. S8, S9).
3.2 AOD sensor validation and calibration stability
Here, we present results of co-located validation studies for the AOD measurement system. Our cyclone-based gravimetric PM2.5 sampling system has been validated extensively in prior work and has been shown to agree closely with reference PM2.5 monitors (Volckens et al., 2017; Arku et al., 2018; Kelleher et al., 2018; Pillarisetti et al., 2019; Wendt et al., 2019). Plantower light-scattering sensors have likewise been evaluated extensively in prior work (Kelly et al., 2017; Zheng et al., 2018; Levy Zamora et al., 2019; Sayahi et al., 2019; Wendt et al., 2019; Bulot et al., 2019; Tryner et al., 2020).
We observed close AOD agreement between AMODv2 and AERONET instruments. Correlation plots on the full set of measurement pairs are provided in Fig. 3 (n = 426 paired measurements per wavelength). Summary statistics calculated on the full set of measurement pairs across all measurement conditions are provided for each wavelength in Table 2.
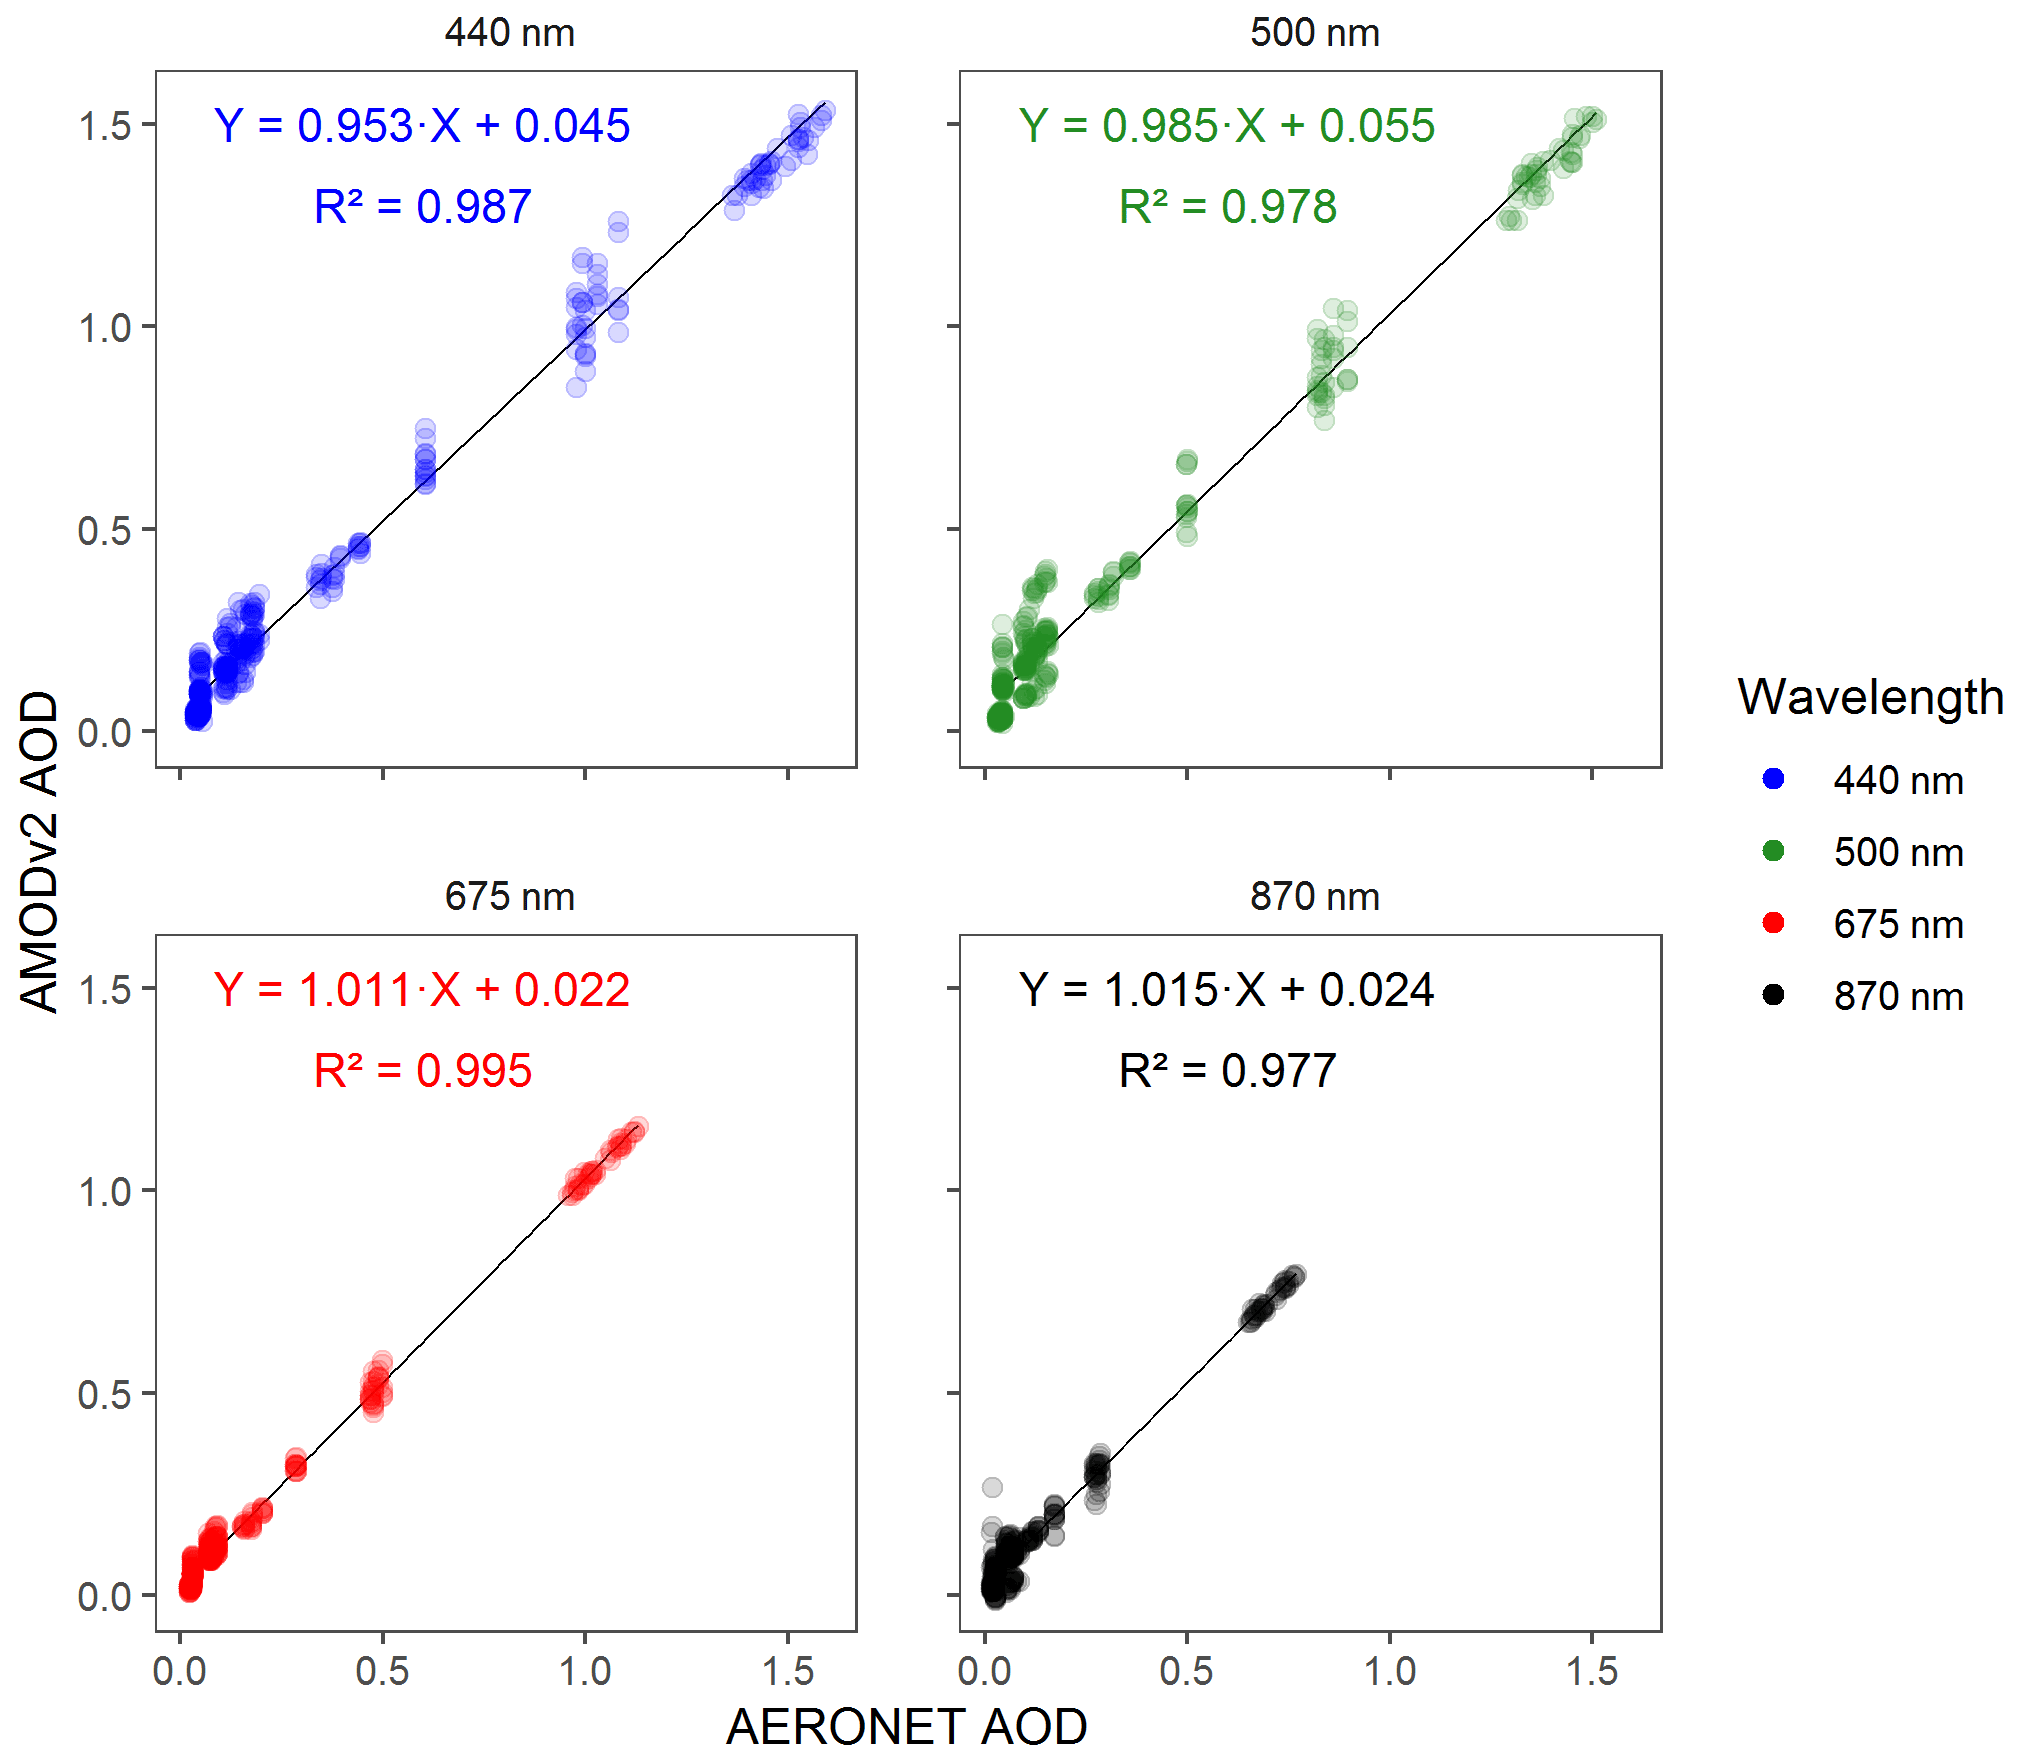
Figure 3AERONET (MAXAR-FUTON site in Fort Lupton, Colorado, USA) vs. AMODv2 AOD co-located comparison (n = 426) results, with panels separated by wavelength. Lines of best fit were calculated via Deming regression analysis.
Table 2Summary statistics for AMODv2 vs. AERONET co-located tests.
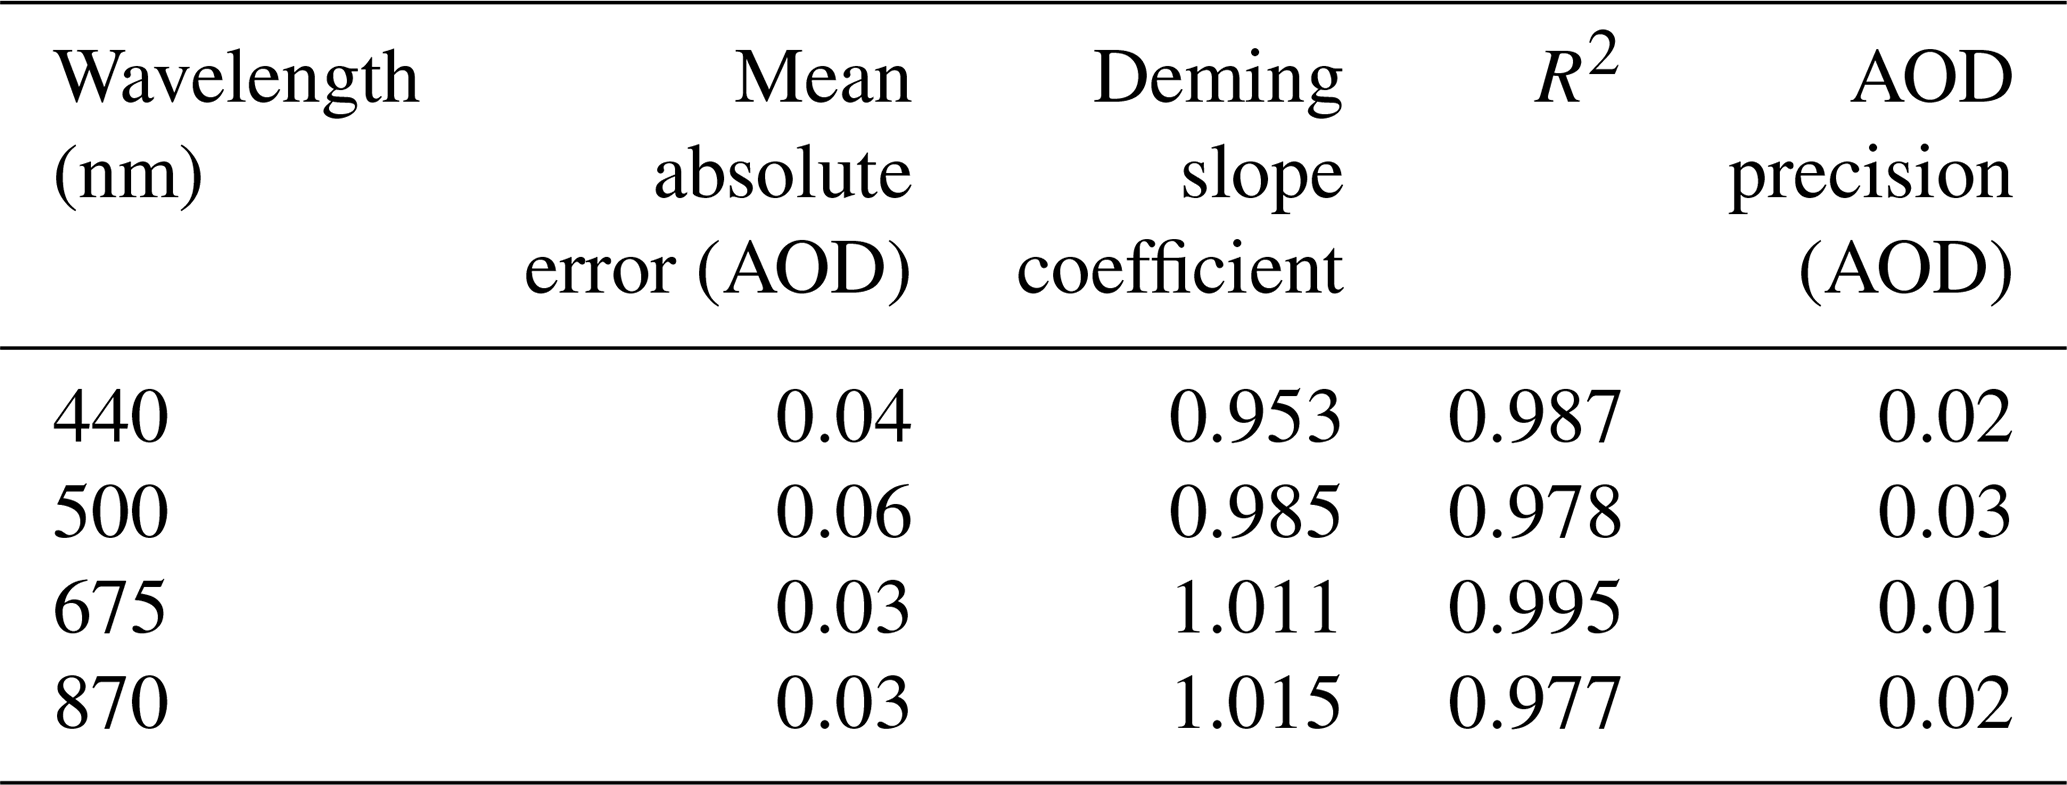
Summary statistics on the data set partitioned into clear and elevated-AOD samples are presented in Table S1. The definitions of clear and elevated-AOD samples are explained in the description of Table S1. The mean absolute errors for the full data set were 0.04, 0.06, 0.03, and 0.03 AOD units at 440, 500, 675, and 870 nm, respectively. The Deming regression slope coefficients were 0.953, 0.985, 1.011, and 1.015 at 440, 500, 675, and 870 nm, respectively. The squares of Pearson correlation coefficients were 0.987, 0.978, 0.995, and 0.977 at 440, 500, 675, and 870 nm, respectively. With respect to precision, the average differences from the mean for units measuring coincidentally (i.e., the average amount an individual unit deviated from the mean of all units measuring at the same time) were 0.02, 0.03, 0.01, and 0.02 AOD units at 440, 500, 675, and 870 nm, respectively. With respect to stability across AOD magnitude, the mean absolute error deviated by less than 0.011 between clear days and elevated-AOD days across all wavelengths (Table S1).
Due to the broad range of AOD levels during testing, global summary statistics do not fully capture how error and precision scales with increasing AERONET AOD, as these figures of merit are not constant across the range of measured AOD values (Fig. 4). Measurements at high AOD impact the mean absolute error disproportionately, whereas measurements at low AOD impact the mean percent error disproportionately. We derived expected error (EE) equations to constrain the error of AMODv2 measurements relative to AERONET as a function of AOD (following the form used in the validation of satellite AOD products compared to AERONET AOD). We derived the equations iteratively by adjusting the constant and linear terms until the bounds defined by Eqs. (4) through (7) each contained 85 % of the co-located measurement pairs for each wavelength.
A logarithmic plot illustrating how the error bounds scale with increasing AOD is provided in Fig. 4.
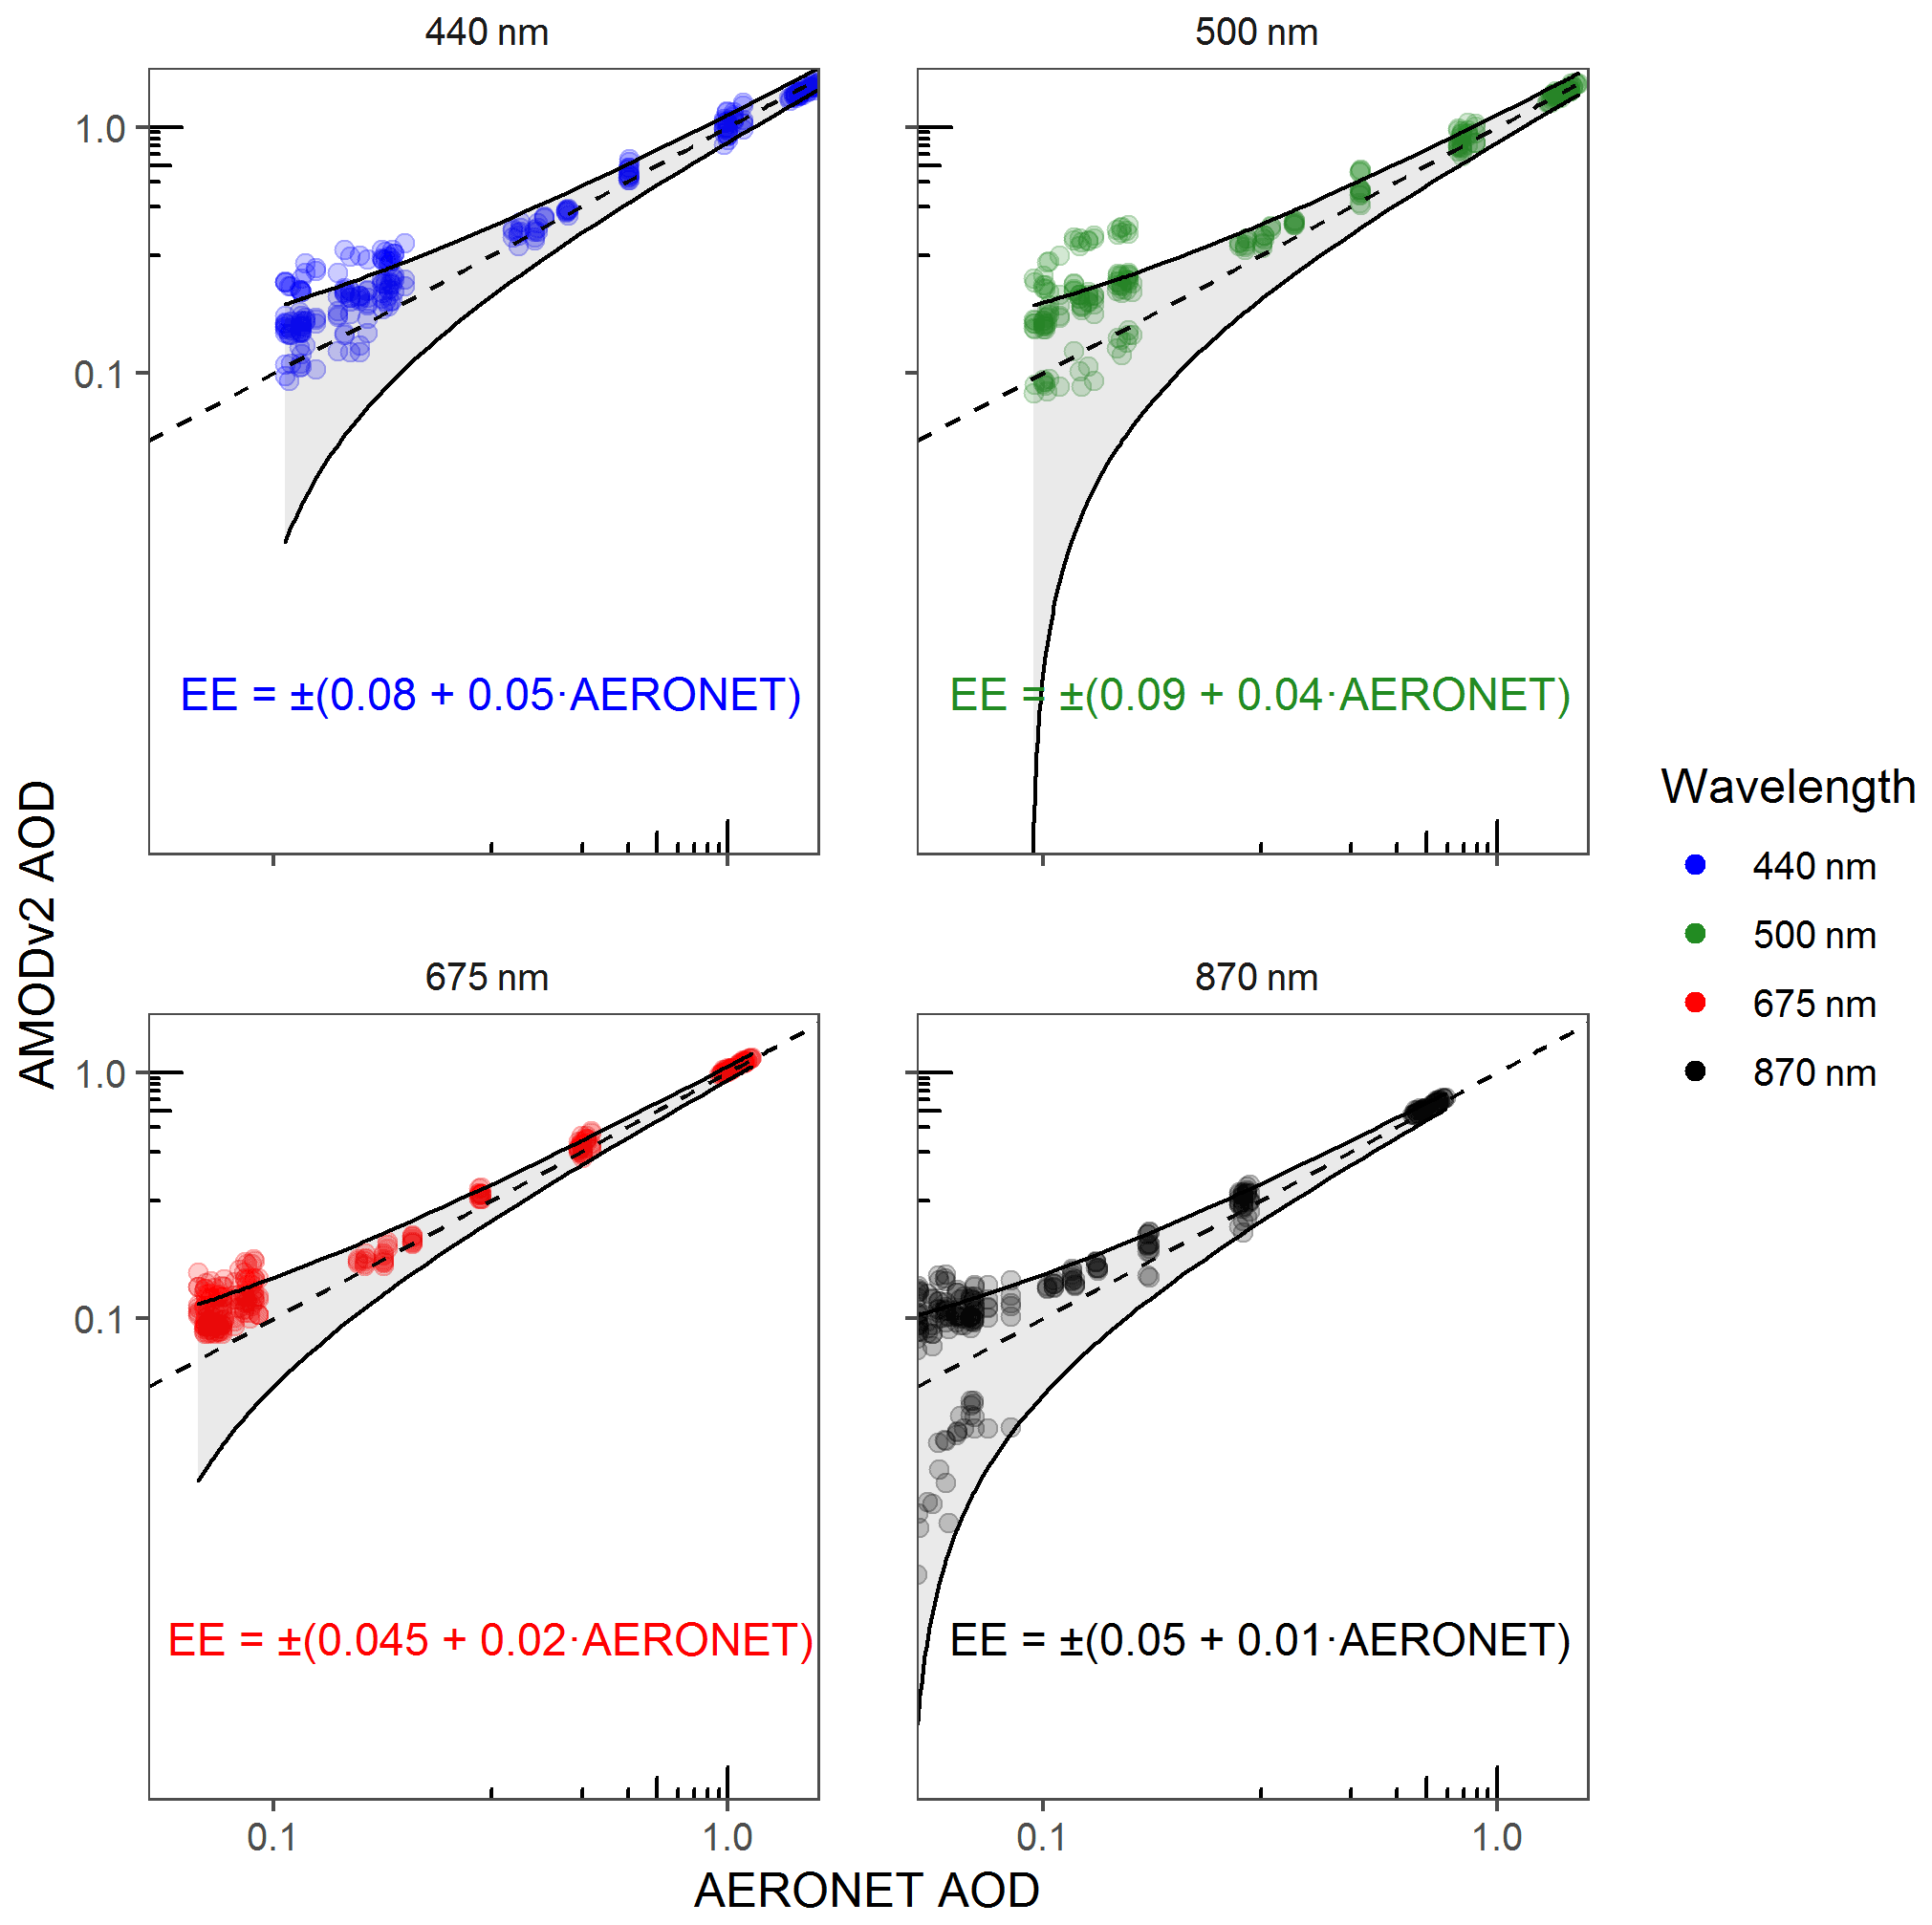
Figure 4Logarithmic AERONET vs. AMODv2 AOD co-located results with expected error (EE; AOD units) bounds, with panels separated by wavelength. Equation bounds contain 85 % of the co-located measurements.
Equations (4) through (7) indicate a low dependence of the AOD magnitude on the AMODv2 error relative to AERONET for all wavelengths. Existing error between AMODv2 and AERONET measurements was explained primarily by the constant term. These findings are consistent with the summary statistics presented in Table S1 and demonstrate the stability of AMODv2.
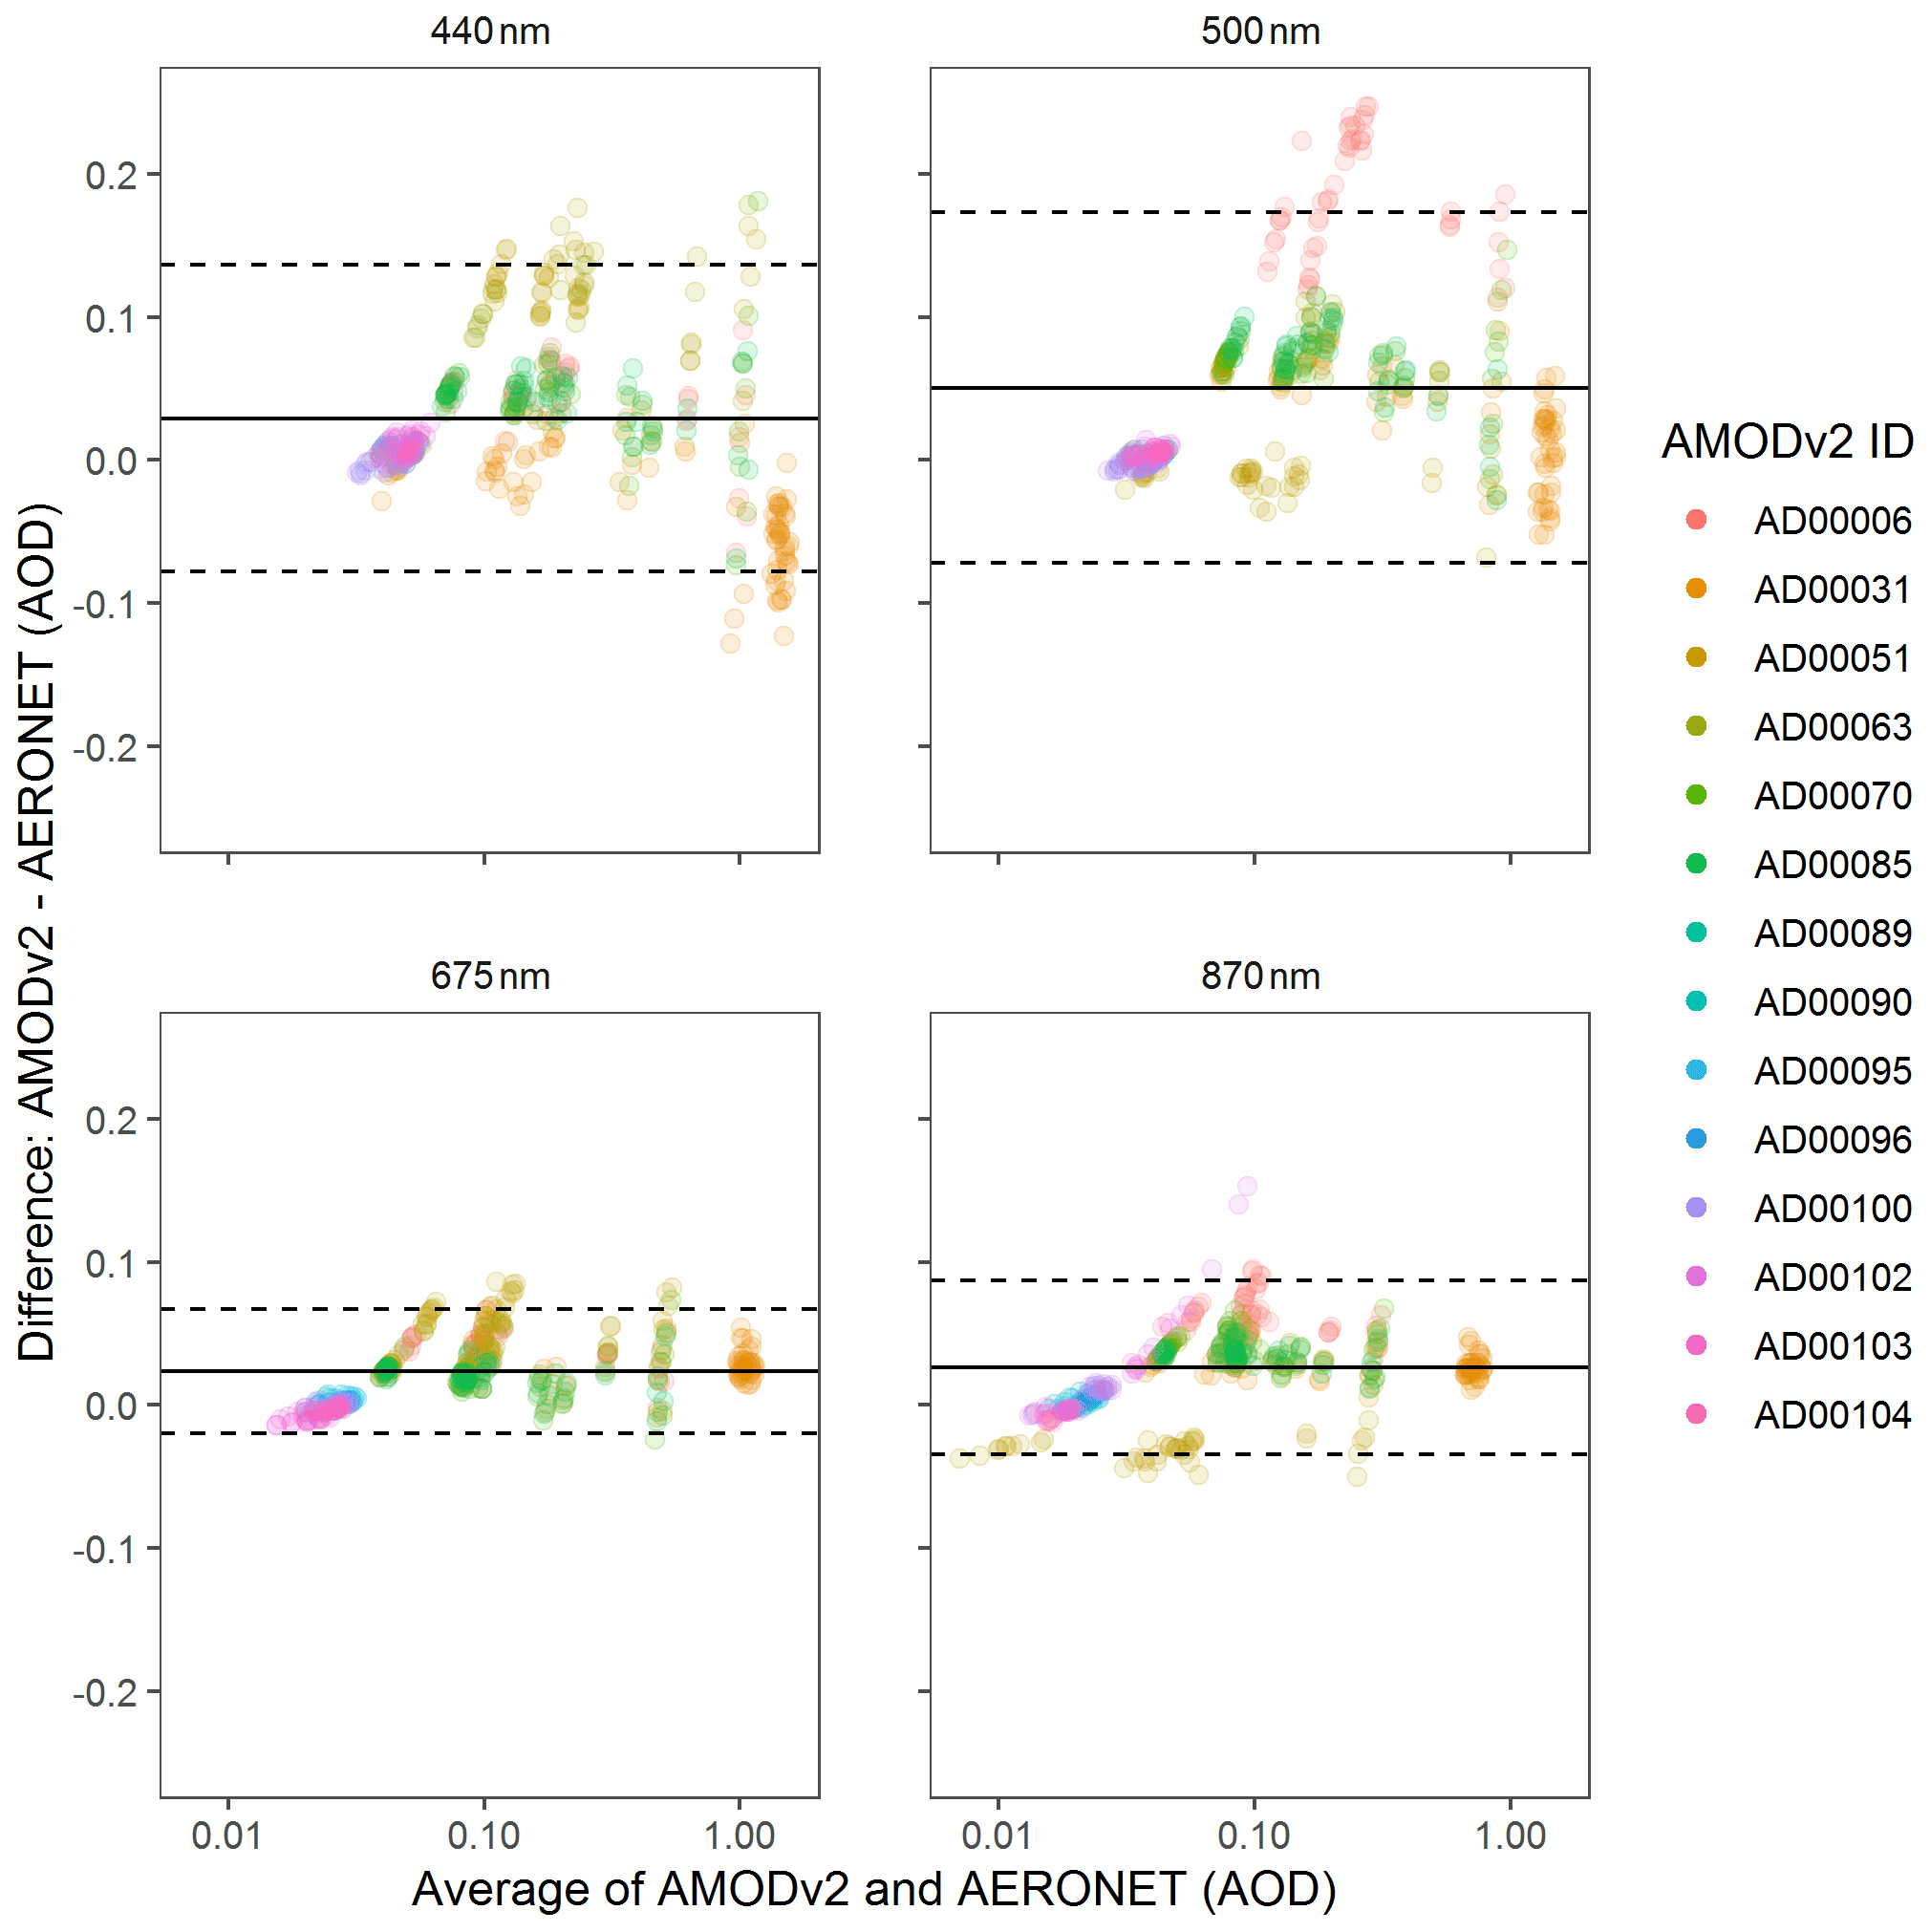
Figure 5Mean difference plot for measurements taken by AERONET and AMODv2 instruments, with panels separated by wavelength. Paired AERONET and AMODv2 under both clear and biomass burning conditions (as defined in Table S1) are included. Points represent paired AMODv2 and AERONET measurements, with the average of the measurement pair on the x axis on a log scale and the difference on the y axis. The top and bottom dashed lines represent the upper and lower limits of agreement, respectively, evaluated at 95 % confidence. The solid line between the limits of agreement is the mean difference between the two measurement techniques. Points are colored according to the AMODv2 unit ID.
AMODv2 bias relative to AERONET was primarily dependent on the specific unit, rather than systemic design uncertainty. A mean difference plot colored according to the AMODv2 unit ID is provided in Fig. 5.
Units AD00006 and AD00051 exhibited the highest bias at 440 and 500 nm, respectively. With units AD00006 and AD00051 removed from the data set, mean absolute errors were reduced by 0.011, 0.013, 0.008, and 0.004 AOD units at 440, 500, 675, and 870 nm, respectively. Bias from units AD00006 and AD00051 also impacted the EE derivations. With units AD00006 and AD00051 omitted, Eqs. (4), (5), (6), and (7) bound 92.5 %, 94.6 %, 97.6 %, and 92.2 % of the co-located pairs, respectively. Individual unit bias was most likely caused by faulty calibration or optical sensor drift over time.
Previous work has noted the tendency for optical interference filters to degrade over time, changing the accuracy of the most recent calibration (Brooks and Mims, 2001; Giles et al., 2019). We quantified the long-term stability of the AMODv2 AOD sensors by recalibrating 16 AMODv2 units 15 months after their initial calibration. Summary statistics quantifying the calibration constant (V0) changes are provided in Table 3.
Table 3Summary statistics for AMODv2 calibration stability test. All summary statistics refer to the change in V0 (Eq. 2). Note that the absolute value of the maximum change refers to the single unit with the highest percent change for each wavelength.
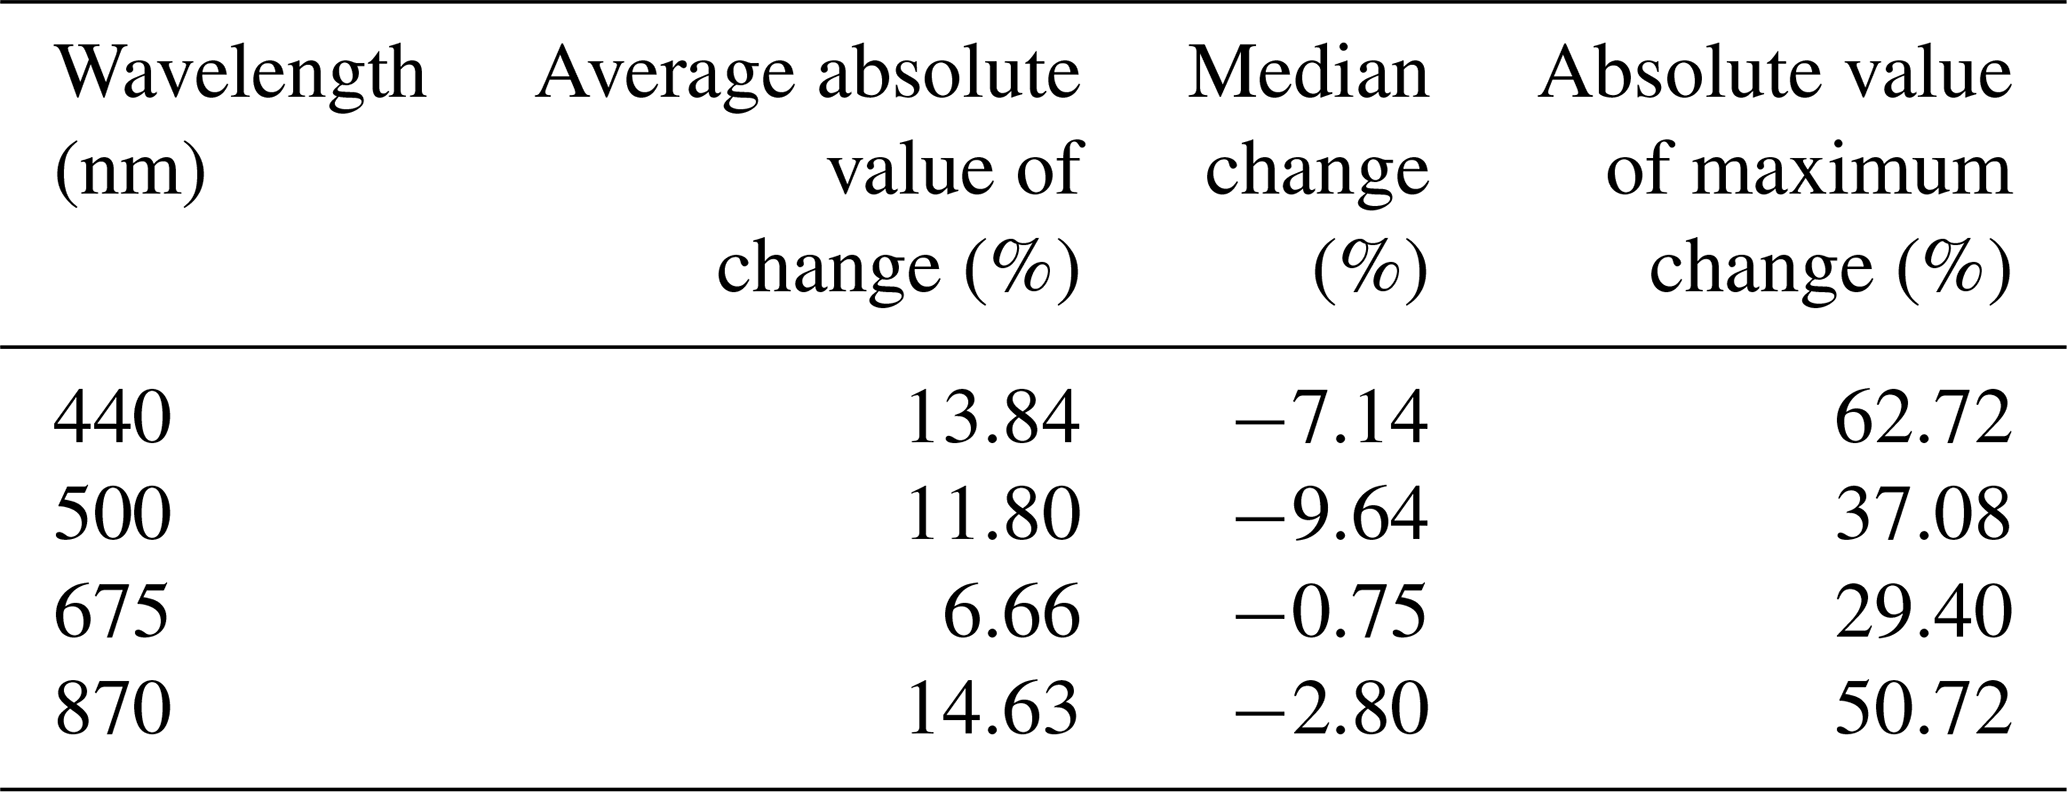
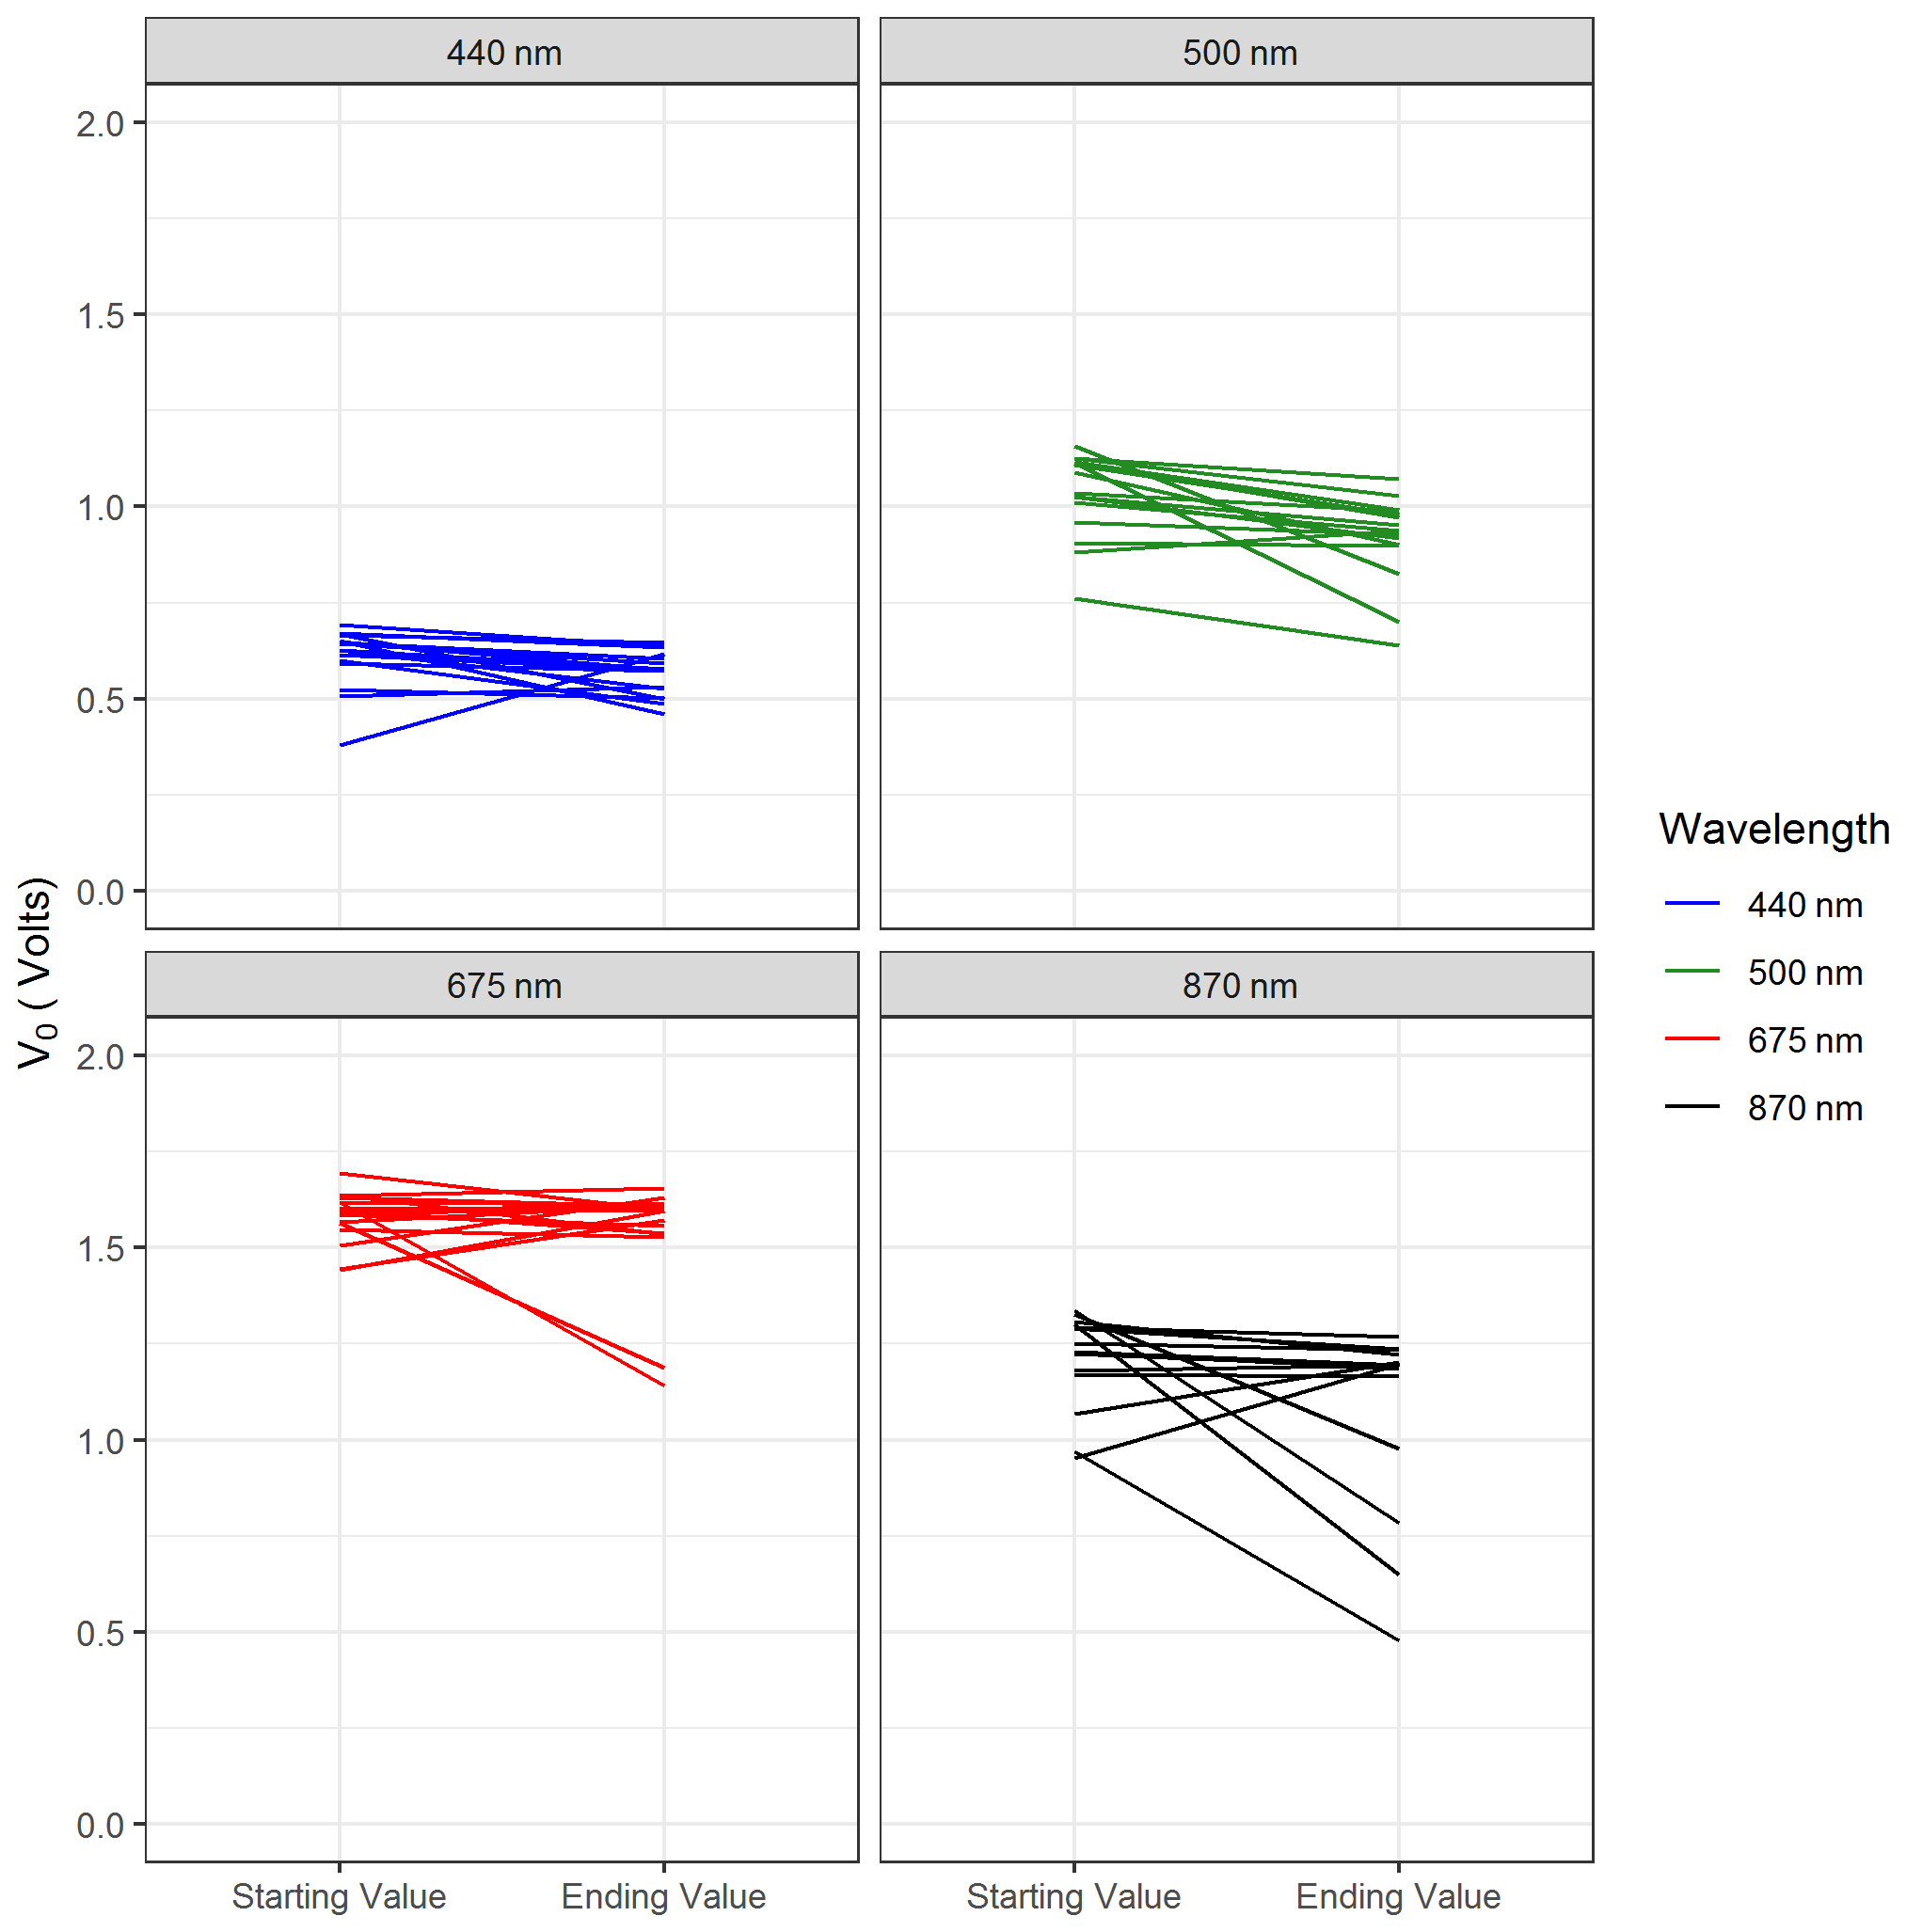
Figure 6Linear change plots illustrating the change in calibration voltage, V0 (Eq. 2), from the initial calibration to a follow-up test calibration of 16 AMODv2 units. Each instrument is represented by a separate line, with starting and ending calibration voltage values delineated on the x axis. Panels are separated by wavelength. Each line represents the change of a single wavelength channel of an AMODv2 unit after 15 months.
A plot illustrating the voltage change undergone by each of the 16 AMODv2 units is provided in Fig. 6. The results presented in Fig. 6 illustrate that the calibration constants (V0 in Eq. 2) remained relatively stable (changes of 5 % or less) for most AMODv2 units over the course of 15 months. However, several units exhibited relatively large changes (in excess of 30 %) in their calibration constants, indicating that calibration changes may vary considerably by unit. Boersma and de Vroom (2006) present theoretical analyses and conclude that the calculation of AOD is most sensitive to errors in the calibration constant, V0 (Boersma and de Vroom, 2006). Their theoretical analyses, combined with the results in Fig. 6, point to drift in V0 as a likely source of large unit-specific errors in AMODv2 AOD measurements. To limit errors due to calibration drift, we recommend that AMODv2 V0 values be recalibrated on an annual basis. Determining the source of changes to the calibration constants of some AMODv2 units is the subject of ongoing investigation. Potential sources include changes in sensitivity or drift of the photodiode sensor element, degrading of the optical interference filters, and/or clouding of the protective glass window element in the light path of the sensors.
3.3 Reliability testing
AMODv2 sensor validation results from this work and prior work indicate that the instrument can accurately measure AOD and PM2.5 when operating properly. However, for effective large-scale deployments, AMODv2 units must reliably complete their intended sampling protocol when deployed outdoors for 120 h. Potential causes of premature sample failure included premature battery drainage, damage to mechanical or electrical components (e.g., water ingress into motors or sensors), and firmware-related crashes (e.g., memory overflow errors). In a series of reliability tests on the rooftop of our laboratory facility, we found that 75 % of 76 attempted samples were successfully completed: 16 % failed due to premature battery drainage, 8 % failed due to water damage, and 1 % (one unit) failed due to a firmware crash. To address failures due to premature battery drainage, we replaced batteries that would not fully charge and replaced motors that were drawing excess current. To address failures due to water damage, we replaced damaged boards and applied additional sealant to key mechanical interfaces. We addressed the firmware crash issue by reconfiguring the memory allocation to grant more memory to the wireless data push functionality, which proved to be the most memory-intensive subsystem. Overheating was not an issue in the testing discussed here, as the testing was conducted in winter months. We will test the AMODv2 under warmer conditions to evaluate heating effects on the performance of the instrument.
We also verified that AMODv2 units were attempting AOD measurements and applying the prescribed data screening protocols. In the 76 test samples, AMODv2 units attempted 22 419 AOD measurements per wavelength. Units detected the Sun and took at least one measurement toward forming a triplet 4763 times per wavelength. The results partitioned by quality control designation are provided in Table 4. Instances where an AMODv2 reported a numerical AOD value were considered valid AOD measurements. Instances where an AMODv2 failed to acquire three AOD measurements for a single measurement sequence (Fig. S6) were designated as incomplete with a unique error code. Cloud-screened measurements were those where solar alignment was achieved for three measurements but the triplet failed to meet the acceptance criteria (Fig. S6).
Table 4Results from the AMODv2 quality control algorithm from 4763 AOD measurements taken during laboratory rooftop testing. Attempts where zero measurements were logged for a triplet attempt are omitted from the table.
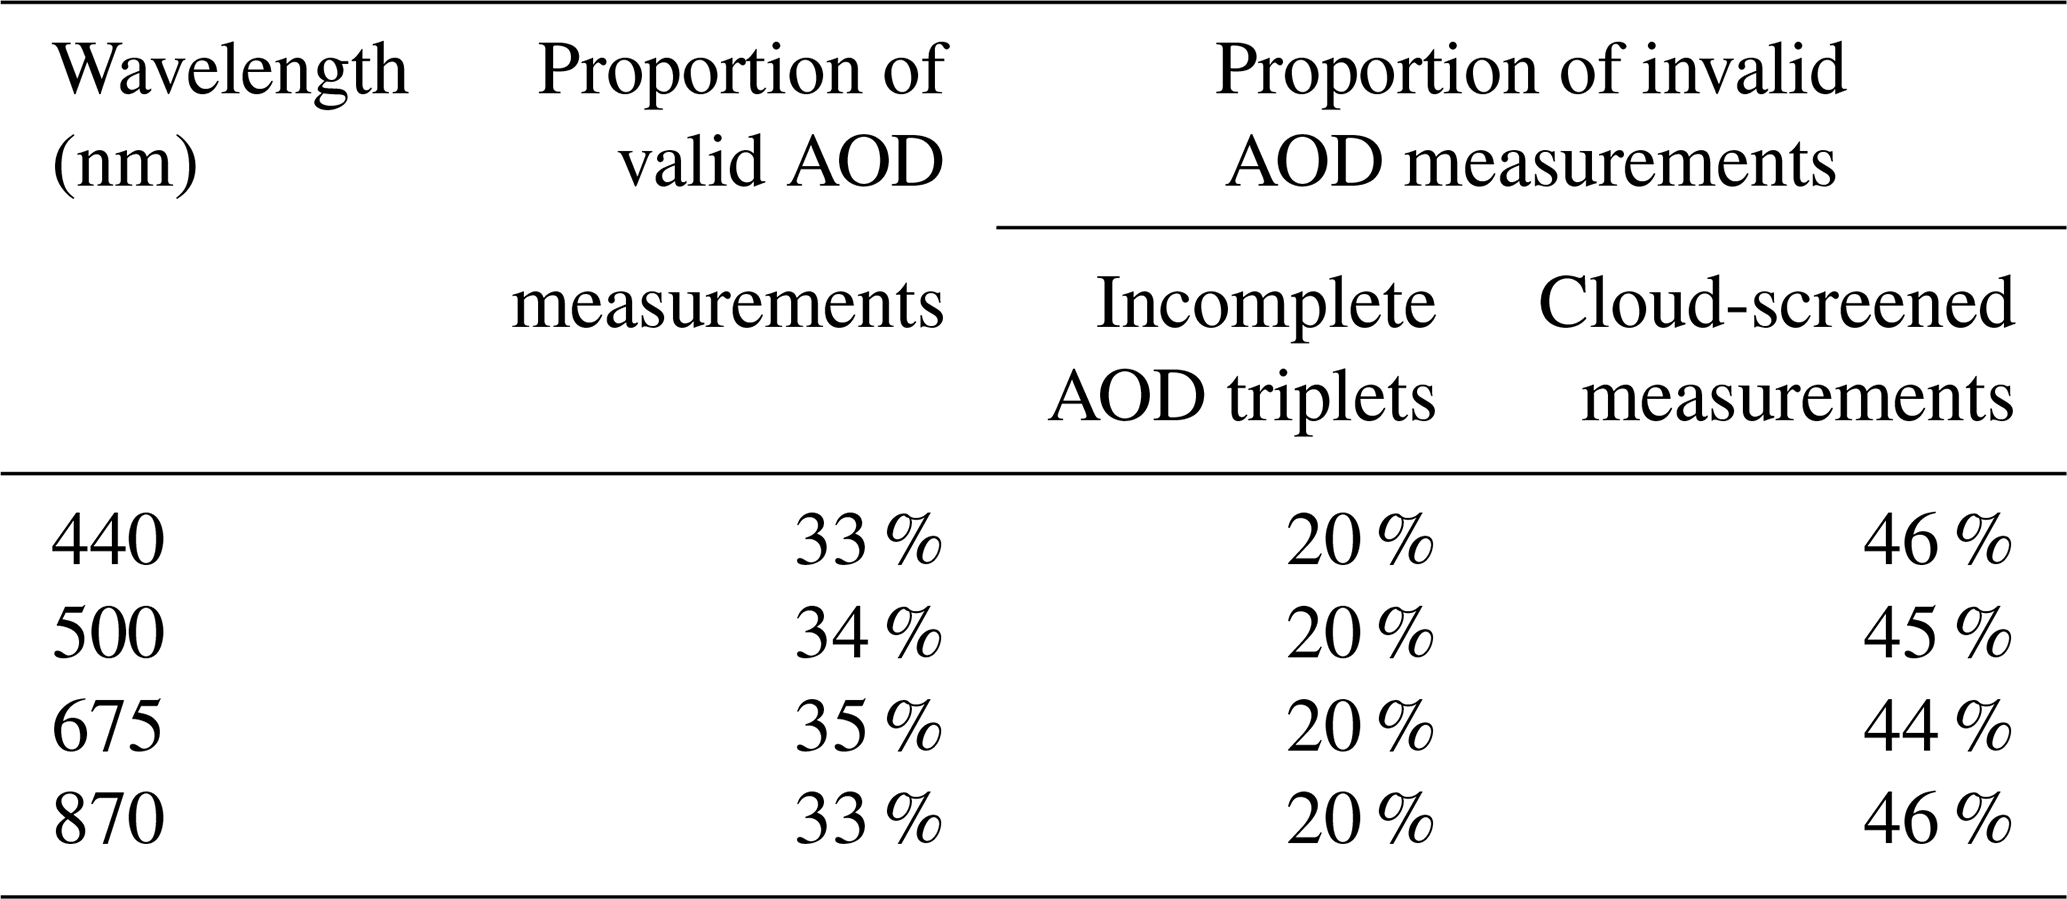
The results of this study indicate that the AMODv2 automatically acquired solar alignment for a complete measurement triplet in 80 % of attempted measurements. However, among the completed triplets, approximately 45 % of measurements were identified as cloud contaminated and were subsequently screened. The screening algorithm did not reach consistent results across all wavelengths, as evident by slight deviations in the proportion of screened data across wavelengths. In this work, we applied the same exclusion criteria to each wavelength (Fig. S6). These results indicate that unique exclusion criteria may be necessary for each wavelength in order to achieve consistent results, particularly when there is substantial deviation in magnitude between two measurement wavelengths (e.g., 440 nm AOD much higher than 870 nm AOD for a single measurement).
In the current study, we evaluated the AMODv2 under a wide range of atmospheric pollution levels and observed close agreement between the AMODv2 and AERONET AOD measurements, with mean absolute errors of 0.04, 0.06, 0.03, and 0.03 AOD units at 440, 500, 675, and 870 nm, respectively. The agreement between AMODv2 and AERONET was stable across AOD levels ranging from 0.016 ± 0.01 to 1.590 ± 0.01. We identified unit-specific changes to AOD calibration constants over time as a potential source of error in AOD measurements and recommended annual recalibration (in line with recommendations for AERONET instruments) to mitigate those errors. While the AMODv2 was designed to be deployed by citizens, here the evaluation was done with data collected by team members. Wendt et al. (2019) and Ford et al. (2019) noted that there could be potential user errors that may impact the data quality. These were not analyzed in the present study. Even though the AMODv2 was designed to reduce these errors by automating the AOD process, there is still the potential for errors (i.e., improper placement). Future work describing the deployment of AMODv2 units by citizen scientists should also include the analysis of these issues.
The AMOD was designed to be a low-cost, user-friendly, and high-performance instrument for PM2.5 and AOD measurements to be deployed in citizen-science campaigns. Citizen-led sampling is a promising approach to produce large-scale data sets to quantify air pollution concentrations at a spatiotemporal resolution unachievable by higher-priced reference monitors (e.g., Brooks and Mims, 2001; Boersma and de Vroom, 2006; Ford et al., 2019). Wendt et al. (2019) and Ford et al. (2019) detailed the design and deployment of the AMODv1. In these previous studies, we noted several limitations of the instrument design that limited the amount of data (specifically AOD) collected by participants. Here, we present the improvements made to the AMOD measurement system and the implementation of wireless data transfer and real-time visualization, which were the primary areas of improvement compared with the previous design. The new design of the AMODv2 allows for unsupervised measurement and quality control protocols that reduce the operational demands on a study volunteer, particularly compared with AMODv1 and other low-cost AOD sensors, while increasing the amount of data that can be collected. Deployments with citizen scientists are ongoing, and data from those campaigns will be the subject of future studies. The portability, performance, and low cost of the AMODv2 make it a practical option to establish spatially dense PM2.5 and AOD measurement networks. Applied in these networks, the AMODv2 will close gaps in the existing global aerosol measurement infrastructure of ground-based and satellite-based observations.
All AMODv2 data collected and used in this study are available at https://doi.org/10.25675/10217/225291 (Wendt, 2021).
The supplement related to this article is available online at: https://doi.org/10.5194/amt-14-6023-2021-supplement.
JV, JRP, SHJ, ML, and BF designed the study and concept for which the AMODv2 was designed. EAW, CQ, DDML, CL'O, and JV designed the AMODv2 instrument. EAW, CL'O, MC, and JM manufactured units. EAW, BF, MC, ZR, CL'O, and JM designed validation experiments and analyzed validation data. CQ designed the mobile application. DHH developed the companion website. ZR, BF, ML, and EAW wrote the user manual. EAW wrote the paper with support from BF, JRP, SHJ, and JV. All co-authors contributed to the interpretation of results and paper editing.
The authors declare that they have no conflict of interest.
Publisher’s note: Copernicus Publications remains neutral with regard to jurisdictional claims in published maps and institutional affiliations.
The authors wish to thank Mollie Phillips, Nick Trammel-Jamison, and Todd Hochwitz (Zebulon Solutions LLC, Longmont, CO, USA) for their contributions to this work. The authors also thank Michele Kuester of Digital Globe and Janae Csavina of NEON for their help securing AERONET co-location sites.
This research has been supported by the National Aeronautics and Space Administration (grant no. 80NSSC18M0120).
This paper was edited by Anna Novelli and reviewed by two anonymous referees.
Arku, R. E., Birch, A., Shupler, M., Yusuf, S., Hystad, P., and Brauer, M.: Characterizing exposure to household air pollution within the Prospective Urban Rural Epidemiology (PURE) study, Environ. Int., 114, 307–317, https://doi.org/10.1016/j.envint.2018.02.033, 2018.
Badura, M., Sówka, I., Szymański, P., and Batog, P.: Assessing the usefulness of dense sensor network for PM2.5 monitoring on an academic campus area, Sci. Total Environ., 722, 137867, https://doi.org/10.1016/j.scitotenv.2020.137867, 2020.
Bodhaine, B. A., Wood, N. B., Dutton, E. G., and Slusser, J. R.: On Rayleigh Optical Depth Calculations, J. Atmos. Ocean. Tech., 16, 1854–1861, 1999.
Boersma, K. F. and de Vroom, J. P.: Validation of MODIS aerosol observations over the Netherlands with GLOBE student measurements, J. Geophys. Res., 111, D20311, https://doi.org/10.1029/2006JD007172, 2006.
Brauer, M., Freedman, G., Frostad, J., van Donkelaar, A., Martin, R. V., Dentener, F., Dingenen, R. van, Estep, K., Amini, H., Apte, J. S., Balakrishnan, K., Barregard, L., Broday, D., Feigin, V., Ghosh, S., Hopke, P. K., Knibbs, L. D., Kokubo, Y., Liu, Y., Ma, S., Morawska, L., Sangrador, J. L. T., Shaddick, G., Anderson, H. R., Vos, T., Forouzanfar, M. H., Burnett, R. T., and Cohen, A.: Ambient Air Pollution Exposure Estimation for the Global Burden of Disease 2013, Environ. Sci. Technol., 50, 79–88, https://doi.org/10.1021/acs.est.5b03709, 2016.
Brooks, D. R. and Mims, F. M.: Development of an inexpensive handheld LED-based Sun photometer for the GLOBE program, J. Geophys. Res.-Atmos., 106, 4733–4740, https://doi.org/10.1029/2000JD900545, 2001.
Bulot, F. M. J., Johnston, S. J., Basford, P. J., Easton, N. H. C., Apetroaie-Cristea, M., Foster, G. L., Morris, A. K. R., Cox, S. J., and Loxham, M.: Long-term field comparison of multiple low-cost particulate matter sensors in an outdoor urban environment, Sci. Rep., 9, 7497, https://doi.org/10.1038/s41598-019-43716-3, 2019.
Chadwick, E., Le, K., Pei, Z., Sayahi, T., Rapp, C., Butterfield, A. E., and Kelly, K. E.: Technical note: Understanding the effect of COVID-19 on particle pollution using a low-cost sensor network, J. Aerosol Sci., 155, 105766, https://doi.org/10.1016/j.jaerosci.2021.105766, 2021.
Diner, D. J., Beckert, J. C., Reilly, T. H., Bruegge, C. J., Conel, J. E., Kahn, R. A., Martonchik, J. V., Ackerman, T. P., Davies, R., Gerstl, S. A. W., Gordon, H. R., Muller, J., Myneni, R. B., Sellers, P. J., Pinty, B., and Verstraete, M. M.: Multi-angle Imaging SpectroRadiometer (MISR) instrument description and experiment overview, IEEE Trans. Geosci. Remote Sens., 36, 1072–1087, https://doi.org/10.1109/36.700992, 1998.
Feng, S., Gao, D., Liao, F., Zhou, F., and Wang, X.: The health effects of ambient PM2.5 and potential mechanisms, Ecotoxicol. Environ. Saf., 128, 67–74, https://doi.org/10.1016/j.ecoenv.2016.01.030, 2016.
Ford, B. and Heald, C. L.: Exploring the uncertainty associated with satellite-based estimates of premature mortality due to exposure to fine particulate matter, Atmos. Chem. Phys., 16, 3499–3523, https://doi.org/10.5194/acp-16-3499-2016, 2016.
Ford, B., Pierce, J. R., Wendt, E., Long, M., Jathar, S., Mehaffy, J., Tryner, J., Quinn, C., van Zyl, L., L'Orange, C., Miller-Lionberg, D., and Volckens, J.: A low-cost monitor for measurement of fine particulate matter and aerosol optical depth – Part 2: Citizen-science pilot campaign in northern Colorado, Atmos. Meas. Tech., 12, 6385–6399, https://doi.org/10.5194/amt-12-6385-2019, 2019.
Forouzanfar, M. H., Afshin, A., Alexander, L. T., et al.: Global, regional, and national comparative risk assessment of 79 behavioural, environmental and occupational, and metabolic risks or clusters of risks, 1990–2015: a systematic analysis for the Global Burden of Disease Study 2015, Lancet, 388, 1659–1724, https://doi.org/10.1016/S0140-6736(16)31679-8, 2016.
Garay, M. J., Kalashnikova, O. V., and Bull, M. A.: Development and assessment of a higher-spatial-resolution (4.4 km) MISR aerosol optical depth product using AERONET-DRAGON data, Atmos. Chem. Phys., 17, 5095–5106, https://doi.org/10.5194/acp-17-5095-2017, 2017.
Giles, D. M., Sinyuk, A., Sorokin, M. G., Schafer, J. S., Smirnov, A., Slutsker, I., Eck, T. F., Holben, B. N., Lewis, J. R., Campbell, J. R., Welton, E. J., Korkin, S. V., and Lyapustin, A. I.: Advancements in the Aerosol Robotic Network (AERONET) Version 3 database – automated near-real-time quality control algorithm with improved cloud screening for Sun photometer aerosol optical depth (AOD) measurements, Atmos. Meas. Tech., 12, 169–209, https://doi.org/10.5194/amt-12-169-2019, 2019.
Griggs, M.: Absorption Coefficients of Ozone in the Ultraviolet and Visible Regions, J. Chem. Phys., 49, 857–859, https://doi.org/10.1063/1.1670152, 1968.
Hammer, M. S., van Donkelaar, A., Li, C., Lyapustin, A., Sayer, A. M., Hsu, N. C., Levy, R. C., Garay, M. J., Kalashnikova, O. V., Kahn, R. A., Brauer, M., Apte, J. S., Henze, D. K., Zhang, L., Zhang, Q., Ford, B., Pierce, J. R., and Martin, R. V.: Global Estimates and Long-Term Trends of Fine Particulate Matter Concentrations (1998–2018), Environ. Sci. Technol., 54, 7879–7890, https://doi.org/10.1021/acs.est.0c01764, 2020.
Holben, B. N., Eck, T. F., Slutsker, I., Tanré, D., Buis, J. P., Setzer, A., Vermote, E., Reagan, J. A., Kaufman, Y. J., Nakajima, T., Lavenu, F., Jankowiak, I., and Smirnov, A.: AERONET – A Federated Instrument Network and Data Archive for Aerosol Characterization, Remote Sens. Environ., 66, 1–16, https://doi.org/10.1016/S0034-4257(98)00031-5, 1998.
Janssen, N. A. H., Fischer, P., Marra, M., Ameling, C., and Cassee, F. R.: Short-term effects of PM2.5, PM10 and PM2.5–10 on daily mortality in the Netherlands, Sci. Total Environ., 463–464, 20–26, https://doi.org/10.1016/j.scitotenv.2013.05.062, 2013.
Jin, X., Fiore, A. M., Curci, G., Lyapustin, A., Civerolo, K., Ku, M., van Donkelaar, A., and Martin, R. V.: Assessing uncertainties of a geophysical approach to estimate surface fine particulate matter distributions from satellite-observed aerosol optical depth, Atmos. Chem. Phys., 19, 295–313, https://doi.org/10.5194/acp-19-295-2019, 2019.
Kelleher, S., Quinn, C., Miller-Lionberg, D., and Volckens, J.: A low-cost particulate matter (PM2.5) monitor for wildland fire smoke, Atmos. Meas. Tech., 11, 1087–1097, https://doi.org/10.5194/amt-11-1087-2018, 2018.
Kelly, K. E., Whitaker, J., Petty, A., Widmer, C., Dybwad, A., Sleeth, D., Martin, R., and Butterfield, A.: Ambient and laboratory evaluation of a low-cost particulate matter sensor, Environ. Pollut., 221, 491–500, https://doi.org/10.1016/j.envpol.2016.12.039, 2017.
Kim, I., Lee, K., Lee, S., and Kim, S. D.: Characteristics and health effects of PM2.5 emissions from various sources in Gwangju, South Korea, Sci. Total Environ., 696, 133890, https://doi.org/10.1016/j.scitotenv.2019.133890, 2019.
Lee, C.: Impacts of multi-scale urban form on PM2.5 concentrations using continuous surface estimates with high-resolution in U.S. metropolitan areas, Landsc. Urban Plan., 204, 103935, https://doi.org/10.1016/j.landurbplan.2020.103935, 2020.
Levy Zamora, M., Xiong, F., Gentner, D., Kerkez, B., Kohrman-Glaser, J., and Koehler, K.: Field and Laboratory Evaluations of the Low-Cost Plantower Particulate Matter Sensor, Environ. Sci. Technol., 53, 838–849, https://doi.org/10.1021/acs.est.8b05174, 2019.
Li, J., Liu, H., Lv, Z., Zhao, R., Deng, F., Wang, C., Qin, A., and Yang, X.: Estimation of PM2.5 mortality burden in China with new exposure estimation and local concentration-response function, Environ. Pollut., 243, 1710–1718, https://doi.org/10.1016/j.envpol.2018.09.089, 2018.
Li, J., Zhang, H., Chao, C.-Y., Chien, C.-H., Wu, C.-Y., Luo, C. H., Chen, L.-J., and Biswas, P.: Integrating low-cost air quality sensor networks with fixed and satellite monitoring systems to study ground-level PM2.5, Atmos. Environ., 223, 117293, https://doi.org/10.1016/j.atmosenv.2020.117293, 2020.
Lin, C., Labzovskii, L. D., Leung Mak, H. W., Fung, J. C. H., Lau, A. K. H., Kenea, S. T., Bilal, M., Vande Hey, J. D., Lu, X., and Ma, J.: Observation of PM2.5 using a combination of satellite remote sensing and low-cost sensor network in Siberian urban areas with limited reference monitoring, Atmos. Environ., 227, 117410, https://doi.org/10.1016/j.atmosenv.2020.117410, 2020.
Liu, Y., Sarnat, J. A., Kilaru, V., Jacob, D. J., and Koutrakis, P.: Estimating Ground-Level PM 2.5 in the Eastern United States Using Satellite Remote Sensing, Environ. Sci. Technol., 39, 3269–3278, https://doi.org/10.1021/es049352m, 2005.
Lu, X., Lin, C., Li, W., Chen, Y., Huang, Y., Fung, J. C. H., and Lau, A. K. H.: Analysis of the adverse health effects of PM2.5 from 2001 to 2017 in China and the role of urbanization in aggravating the health burden, Sci. Total Environ., 652, 683–695, https://doi.org/10.1016/j.scitotenv.2018.10.140, 2019.
Lu, Y., Giuliano, G., and Habre, R.: Estimating hourly PM2.5 concentrations at the neighborhood scale using a low-cost air sensor network: A Los Angeles case study, Environ. Res., 195, 110653, https://doi.org/10.1016/j.envres.2020.110653, 2021.
Myhre, G., Shindell, D., Bréon, F.-M., Collins, W., Fuglestvedt, J., Huang, J., Koch, D., Lamarque, J.-F., Lee, D., Mendoza, B., Nakajima, T., Robock, A., Stephens, G., Takemura, T., and Zhang, H. : Anthropogenic and Natural Radiative Forcing, in: Climate Change 2013: The Physical Science Basis. Contribution of Working Group I to the Fifth Assessment Report of the Intergovernmental Panel on Climate Change, edited by: Stocker, T. F., Qin, D., Plattner, G.-K., Tignor, M., Allen, S. K., Boschung, J., Nauels, A., Xia, Y., Bex, V., and Midgley, P. M., Cambridge University Press, Cambridge, UK and New York, NY, USA, 2013.
Pillarisetti, A., Carter, E., Rajkumar, S., Young, B. N., Benka-Coker, M. L., Peel, J. L., Johnson, M., and Clark, M. L.: Measuring personal exposure to fine particulate matter (PM2.5) among rural Honduran women: A field evaluation of the Ultrasonic Personal Aerosol Sampler (UPAS), Environ. Int., 123, 50–53, https://doi.org/10.1016/j.envint.2018.11.014, 2019.
Pope, C. A. and Dockery, D. W.: Health Effects of Fine Particulate Air Pollution: Lines that Connect, J. Air Waste Manag. Assoc., 56, 709–742, https://doi.org/10.1080/10473289.2006.10464485, 2006.
Reda, I. and Andreas, A.: Solar Position Algorithm for Solar Radiation Applications (Revised), Technical Report, National Renewable Energy Lab. (NREL), Golden, CO, USA, https://doi.org/10.2172/15003974, 2008.
Salomonson, V. V., Barnes, W. L., Maymon, P. W., Montgomery, H. E., and Ostrow, H.: MODIS: advanced facility instrument for studies of the Earth as a system, IEEE Trans. Geosci. Remote Sens., 27, 145–153, https://doi.org/10.1109/36.20292, 1989.
Sayahi, T., Butterfield, A., and Kelly, K. E.: Long-term field evaluation of the Plantower PMS low-cost particulate matter sensors, Environ. Pollut., 245, 932–940, https://doi.org/10.1016/j.envpol.2018.11.065, 2019.
Sayer, A. M., Hsu, N. C., Bettenhausen, C., Jeong, M.-J., Holben, B. N., and Zhang, J.: Global and regional evaluation of over-land spectral aerosol optical depth retrievals from SeaWiFS, Atmos. Meas. Tech., 5, 1761–1778, https://doi.org/10.5194/amt-5-1761-2012, 2012.
Smirnov, A., Holben, B. N., Eck, T. F., Dubovik, O., and Slutsker, I.: Cloud-Screening and Quality Control Algorithms for the AERONET Database, Remote Sens. Environ., 73, 337–349, https://doi.org/10.1016/S0034-4257(00)00109-7, 2000.
Snider, G., Weagle, C. L., Martin, R. V., van Donkelaar, A., Conrad, K., Cunningham, D., Gordon, C., Zwicker, M., Akoshile, C., Artaxo, P., Anh, N. X., Brook, J., Dong, J., Garland, R. M., Greenwald, R., Griffith, D., He, K., Holben, B. N., Kahn, R., Koren, I., Lagrosas, N., Lestari, P., Ma, Z., Vanderlei Martins, J., Quel, E. J., Rudich, Y., Salam, A., Tripathi, S. N., Yu, C., Zhang, Q., Zhang, Y., Brauer, M., Cohen, A., Gibson, M. D., and Liu, Y.: SPARTAN: a global network to evaluate and enhance satellite-based estimates of ground-level particulate matter for global health applications, Atmos. Meas. Tech., 8, 505–521, https://doi.org/10.5194/amt-8-505-2015, 2015.
Tryner, J., L'Orange, C., Mehaffy, J., Miller-Lionberg, D., Hofstetter, J. C., Wilson, A., and Volckens, J.: Laboratory evaluation of low-cost PurpleAir PM monitors and in-field correction using co-located portable filter samplers, Atmos. Environ., 220, 117067, https://doi.org/10.1016/j.atmosenv.2019.117067, 2020.
van Donkelaar, A., Martin, R. V., and Park, R. J.: Estimating ground-level PM 2.5 using aerosol optical depth determined from satellite remote sensing, J. Geophys. Res., 111, D21201, https://doi.org/10.1029/2005JD006996, 2006.
van Donkelaar, A., Martin, R. V., Brauer, M., Kahn, R., Levy, R., Verduzco, C., and Villeneuve, P. J.: Global Estimates of Ambient Fine Particulate Matter Concentrations from Satellite-Based Aerosol Optical Depth: Development and Application, Environ. Health Perspect., 118, 847–855, https://doi.org/10.1289/ehp.0901623, 2010.
van Donkelaar, A., Martin, R. V., Pasch, A. N., Szykman, J. J., Zhang, L., Wang, Y. X., and Chen, D.: Improving the Accuracy of Daily Satellite-Derived Ground-Level Fine Aerosol Concentration Estimates for North America, Environ. Sci. Technol., 46, 11971–11978, https://doi.org/10.1021/es3025319, 2012.
van Donkelaar, A., Martin, R. V., Brauer, M., Hsu, N. C., Kahn, R. A., Levy, R. C., Lyapustin, A., Sayer, A. M., and Winker, D. M.: Global Estimates of Fine Particulate Matter using a Combined Geophysical-Statistical Method with Information from Satellites, Models, and Monitors, Environ. Sci. Technol., 50, 3762–3772, https://doi.org/10.1021/acs.est.5b05833, 2016.
van Donkelaar, A., Martin, R. V., Li, C., and Burnett, R. T.: Regional Estimates of Chemical Composition of Fine Particulate Matter Using a Combined Geoscience-Statistical Method with Information from Satellites, Models, and Monitors, Environ. Sci. Technol., 53, 2595–2611, https://doi.org/10.1021/acs.est.8b06392, 2019.
Van Heuklon, T. K.: Estimating atmospheric ozone for solar radiation models, Sol. Energy, 22, 63–68, https://doi.org/10.1016/0038-092X(79)90060-4, 1979.
Vohra, K., Vodonos, A., Schwartz, J., Marais, E. A., Sulprizio, M. P., and Mickley, L. J.: Global mortality from outdoor fine particle pollution generated by fossil fuel combustion: Results from GEOS-Chem, Environ. Res., 195, 110754, https://doi.org/10.1016/j.envres.2021.110754, 2021.
Volckens, J., Quinn, C., Leith, D., Mehaffy, J., Henry, C. S., and Miller-Lionberg, D.: Development and evaluation of an ultrasonic personal aerosol sampler, Indoor Air, 27, 409–416, https://doi.org/10.1111/ina.12318, 2017.
Wendt, E. A.: Data set associated with “A low-cost monitor for simultaneous measurement of fine particulate matter and aerosol optical depth – Part 3: Automation and design improvements”, Colorado State University [data set], https://doi.org/10.25675/10217/225291, 2021.
Wendt, E. A., Quinn, C. W., Miller-Lionberg, D. D., Tryner, J., L'Orange, C., Ford, B., Yalin, A. P., Pierce, J. R., Jathar, S., and Volckens, J.: A low-cost monitor for simultaneous measurement of fine particulate matter and aerosol optical depth – Part 1: Specifications and testing, Atmos. Meas. Tech., 12, 5431–5441, https://doi.org/10.5194/amt-12-5431-2019, 2019.
Young, A. T.: Air mass and refraction, Appl. Opt., 33, 1108, https://doi.org/10.1364/AO.33.001108, 1994.
Zheng, T., Bergin, M. H., Johnson, K. K., Tripathi, S. N., Shirodkar, S., Landis, M. S., Sutaria, R., and Carlson, D. E.: Field evaluation of low-cost particulate matter sensors in high- and low-concentration environments, Atmos. Meas. Tech., 11, 4823–4846, https://doi.org/10.5194/amt-11-4823-2018, 2018.
- Article
(2777 KB) - Full-text XML