the Creative Commons Attribution 4.0 License.
the Creative Commons Attribution 4.0 License.
 | 01 Oct 2021
A new zenith hydrostatic delay model for real-time retrievals of GNSS-PWV
Longjiang Li
Suqin Wu
Kefei Zhang
Xiaoming Wang
Wang Li
Zhen Shen
Dantong Zhu
Qimin He
Moufeng Wan
The quality of the zenith hydrostatic delay (ZHD) could significantly affect the accuracy of the zenith wet delay (ZWD) of the Global Navigation Satellite System (GNSS) signal, and from the ZWD precipitable water vapor (PWV) can be obtained. The ZHD is usually obtained from a standard model – a function of surface pressure at the GNSS station. When PWV is retrieved from the GNSS stations that are not equipped with dedicated meteorological sensors for surface pressure measurements, blind models, e.g., the global pressure and temperature (GPT) models, are commonly used to determine the pressures for these GNSS stations. Due to the limited accuracies of the GPT models, the ZHD obtained from the model-derived pressure value is also of low accuracy, especially in mid- and high-latitude regions. To address this issue, a new ZHD model, named GZHD, was investigated for real-time retrieval of GNSS-PWV in this study. The ratio of the ZHD to the zenith total delay (ZTD) was first calculated using sounding data from 505 globally distributed radiosonde stations selected from the stations that had over 5000 samples. It was found that the temporal variation in the ratio was dominated by the annual and semiannual components, and the amplitude of the annual variation was dependent upon the geographical location of the station. Based on the relationship between the ZHD and ZTD, the new model, GZHD, was developed using the back propagation artificial neural network (BP-ANN) method which took the ZTD as an input variable. The 20-year (2000–2019) radiosonde data at 558 global stations and the 9-year (2006–2014) COSMIC-1 (Constellation Observing System for Meteorology, Ionosphere, and Climate) data, which were also globally distributed, were used as the training samples of the new model. The GZHD model was evaluated using two sets of references: the integrated ZHD obtained from sounding data and ERA5 reanalysis data. The performance of the new model was also compared with GPT3, the latest version. Results showed the new model outperformed GPT3, especially in mid- and high-latitude regions. When radiosonde-derived ZHD was used as the reference, the accuracy, which was measured by the root mean square error (RMSE) of the samples, of the GZHD-derived ZHD was about 21 % better than the GTP3-derived ones. When ERA5-derived ZHD was used as the reference, the accuracy of the GZHD-derived ZHD was about 30 % better than GPT3-derived ZHD. In addition, the real-time PWV derived from 41 GNSS stations resulting from GZHD-derived ZHD was also evaluated, and the result indicated that the accuracy of the PWV was improved by 21 %.
- Article
(9313 KB) - Full-text XML
- BibTeX
- EndNote


Water vapor plays an important role in both the energy budget and hydrological cycle of the earth, although it only makes up ∼0.1 %–4 % of the atmosphere. Therefore, accurate acquisition of water vapor is critical for both weather forecasting and climatology. During the last three decades, Global Navigation Satellite System (GNSS) has been used to retrieve precipitation water vapor (PWV) due to its high spatial-temporal resolution and all-weather, nearly real-time, high-accuracy, and low-cost features. The usual procedure for obtaining GNSS-derived PWV is as follows (Bevis et al., 1992): (1) estimating the zenith total delay (ZTD) of GNSS signals for each GNSS station; (2) using an empirical or standard model together with surface meteorological measurements to calculate the zenith hydrostatic delay (ZHD) for the GNSS station, then subtracting it from the ZTD to obtain the zenith wet delay (ZWD) of the GNSS signals for the station; and (3) converting the ZWD into PWV by multiplying the ZWD by a conversion factor which is a function of the water-vapor-weighted mean temperature (Tm) at the station. Tm can be calculated by the approximation introduced by Askne and Nordius (1987) or from a Bevis-type model (Bevis et al., 1992; Ross and Rosenfeld, 1997; Singh et al., 2014; Yao et al., 2014) and a blind model (Ding, 2018; He et al., 2017; Yao et al., 2012; Sun et al., 2021a). The accuracies of the three types of models were analyzed in several works (Wang et al., 2016; Zhang et al., 2017).
Usually, the ZHD can be determined at a millimeter level by a standard model such as the most common model: the Saastamoinen model, under the condition that the surface pressure used in the model is measured by meteorological sensors (Bosser et al., 2007). However, not all GNSS stations are equipped with meteorological sensors, and the majority of GNSS stations are not close to any weather stations. In this case, two alternative methods are used (Wang et al., 2017): (1) using a blind model, e.g., global pressure and temperature (GPT) models (Böhm et al., 2007), to obtain surface meteorological parameters for the GNSS stations; (2) using reanalysis data, e.g., ERA-Interim (Wang et al., 2017), ERA5 (Zhang et al., 2019), or NCEP (Jiang et al., 2016), to interpolate surface meteorological parameters for the GNSS stations. In real-time retrieval of GNSS-PWV, the forecast pressures from reanalysis data need to be downloaded in advance, which increases the complexity of data processing, not to mention the fact that the forecast data may not be available due to various reasons, e.g., problems of some servers or agencies. In contrast, blind models such as the GPT models, which are commonly adopted, are simple and effective (Charoenphon and Satirapod, 2020; Gurbuz et al., 2020).
GPT, first proposed for geodetic applications by Böhm in 2007, can provide pressure and temperature at any geographical location on the earth's surface and at any time (Böhm et al., 2007). Lagler et al. (2013) developed GPT2 by combining GPT with the Global Mapping Function (GMF), which can provide the values for more parameters than GPT, e.g., the coefficients of the GMF. In 2015, based on GPT2, Böhm et al. (2015) developed GPT2w by adding the determination of the ZWD. The latest version, i.e., GPT3, was developed by Landskron and Böhm (2018), which can provide not only the parameters from GPT2w but also an empirical gradient grid.
Since these models can provide pressure and temperature at any location on the earth's surface and at any time, the blind models have been widely applied to real-time retrieval of GNSS-PWV. However, the main issue using the blind models to determine the ZHD is their limited accuracy. Wang et al. (2017) evaluated the accuracy of pressure derived from GPT2w at 108 global GNSS stations and found the root mean square errors (RMSEs) of the pressure samples were above 7 hPa in mid- and high-latitudes regions, which resulted in large errors in PWV. A similar conclusion was made by Zhang Di (2016).
The above-mentioned blind models, similar to any other empirical models, are based on the trend of the spatial-temporal variation in pressure (or the corresponding ZHD). Thus, the accuracies of the models are limited due to the dynamic feature of most atmospheric parameters. In fact, during GNSS data processing for the estimation of the ZTD and other unknown parameters, although a model-derived ZHD is sometimes used as the approximate value, it does not need to be highly accurate as the approximate value does not affect the accuracy of the final ZTD estimation results. However, when the PWV is converted from the ZWD, which is obtained from the subtraction of the ZHD from the ZTD, the ZHD needs to be as accurate as possible for an accurate ZWD. Due to the high accuracy of the ZTD estimate, it may be used to improve the ZHD models if the relationship between the ZHD and ZTD at the same station is known.
As is mentioned in the literature (e.g., Luo et al., 2013; Zhang et al., 2016), the ZHD and ZWD account for about 90 % and 10 % of the ZTD, respectively. However, the ratio of the ZHD to ZTD cannot be assumed to be about 0.9:1. In this study, the ratio of the ZHD to ZTD was investigated using sounding data at 505 globally distributed radiosonde stations during the 20-year period of 2000–2019. Then, based on the relationship between the ZHD and ZTD, a new ZHD model with a good temporal resolution required by real-time retrieval of PWV was developed using the back propagation artificial neural network (BP-ANN) technique. The new model took into account not only the spatial-temporal variation in the ZHD, as current blind models do, but also the ratio of the ZHD to ZTD (i.e., the GNSS-derived ZTD was used as an input variable of the new model). This study mainly aims to provide such a new method that is more accurate than blind models and more convenient in applications than reanalysis data for the determination of the ZHD. The ZHD can be applied to the retrieval of GNSS-PWV.
The outline of this paper is as follows. The data used in this study are briefly introduced in Sect. 2.1. The investigation into the ratio of the ZHD to ZTD based on sounding data at 505 globally distributed radiosonde stations is presented in Sect. 2.2, followed by a new ZHD model developed based on the ratio of the ZHD to ZTD in the section. In Sect. 3, the new model is validated using two sets of references: ZHDs derived from radiosonde data and ERA5 data; and the performance of the new model is also compared with that of GPT3. The influence of the new model on real-time PWV is also evaluated in this section. Conclusions are given in the last section.
2.1 Data
Four types of data were used in this study, including sounding data from radiosonde stations, radio occultation (RO) data from the Constellation Observing System for Meteorology, Ionosphere, and Climate (COSMIC) project, ERA5 reanalysis data from the European Centre for Medium-Range Weather Forecast (ECMWF), and GNSS data provided by the International GNSS Service (IGS). The radiosonde data were mainly used to estimate the ratio of the ZHD to ZTD and train the BP-ANN for the new ZHD model. The RO data were for improving the performance of the new model, especially over the ocean areas. The ERA5 reanalysis data were used as a reference for the evaluation of the new ZHD model developed. The GNSS data were used to evaluate the influence of the new ZHD model on GNSS-derived PWV. The distribution of the four data sets and some associated information are shown in Fig. 1.
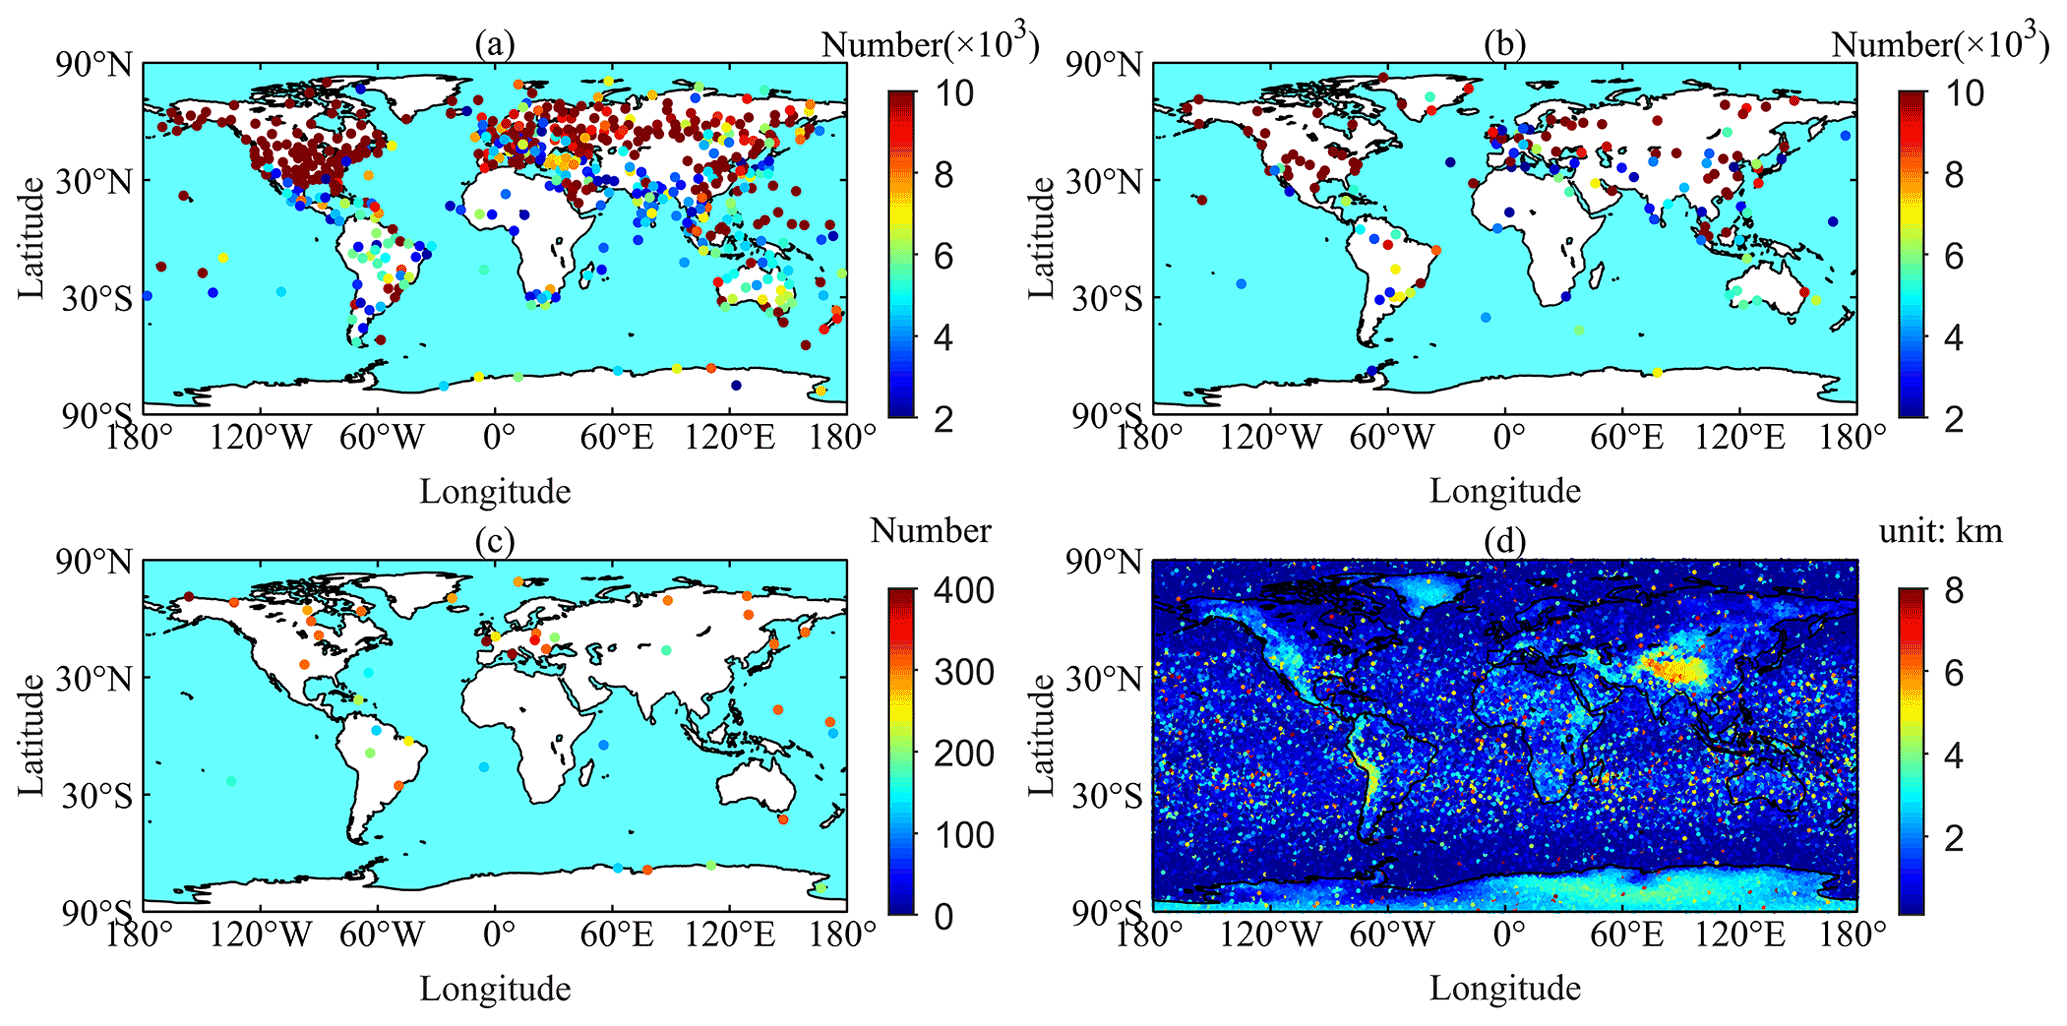
Figure 1(a) Radiosonde stations for the development of the new model. (b) Radiosonde stations for testing the new model. (c) GNSS stations for evaluating the effect of the new model on real-time GNSS-derived PWV. (d) Profiles selected from COSMIC RO data. The color bars in (a)–(c) indicate the number of samples at each station, and the color bar in (d) denotes the penetration depth of each profile.
2.1.1 Radiosonde
The 20-year (2000–2019) sounding data were from the Integrated Global Radiosonde Archive (IGRA), a high-quality radiosonde data set provided by the National Climate Data Center (NCDC). The temporal resolution of the data is usually twice per day (or four times at a few stations), and the distribution of the stations included in the data set is nonuniform (only about 1500 unevenly distributed stations are available around the world). The data set includes the observations of pressure, temperature, geopotential height, and pressure for water vapor at the standard, surface, tropopause, and significant levels (Durre et al., 2006). These observations form basic atmospheric profiles, based on which the ZHD and ZTD can be calculated by the following approximation to the definition of the integral (Davis et al., 1985):
where hs and ht are the heights of the bottom and top layers respectively (in units of mm, the same as the ZTD or ZHD), Pd (in hPa) is the partial pressure of the dry constituent, Pw (in hPa) is the partial pressure of water vapor, T (in K) is the partial temperature, and k1, k2, and k3 are the ideal gas constants from Thayer (1974).
Although a strict quality control process has been conducted on the radiosonde data from the IGRA, there still exist some missing and/or gross data in the data set; thus, further quality control schemes were carried out, according to the experiments and literature (He et al., 2017; Li et al., 2020), a profile must satisfy the following seven criteria: (1) the number of pressure levels in the profile must be over 10, (2) the pressure of water vapor at the top level of the profile must be under 0.1 hPa, (3) the maximum height of the profile must be over 10 km, (4) the difference in pressures between any two adjacent layers of the profile must be over 0 and under 200 hPa, (5) the difference in heights between any two adjacent layers must be over 0 and under 10 km, (6) the pressure levels in the profile must contain the mandatory and significant levels, and (7) the number of all profiles at the radiosonde station at which the profile was obtained must be above 2000. As a result, 695 unevenly distributed radiosonde stations over the world were identified and used in this study. Of the 695 stations, 558 stations were used as sample data (see Fig. 1a) to develop the new ZHD model, while the other stations (shown in Fig. 1b) were used to test the model developed. In addition, from the above 695 stations, 505 stations had more than 5000 profiles; thus the data from the 505 stations were used to analyze the ratio of the ZHD to ZTD. Finally, 371 of the 695 radiosonde stations had over 500 profiles in the 1-year period of 2020, during which no data were used in the construction (or training) of the new model. These out-of-sample data were also used to evaluate the performance of the new model.
2.1.2 COSMIC RO
The COSMIC initiative is one of the main RO missions, and contains COSMIC-1 and COSMIC-2 constellations. In this study, data from the COSMIC-1, which consists of six low-earth-orbit satellites at an 800 km altitude, were adopted. During the period of 2006 to 2014, more than 4 million profiles were acquired, and the data included temperature, pressure, and atmospheric density at various altitudes. Those profiles together with Eqs. (1) and (2) were used to calculate the ZTD and ZHD.
Traditional ZHD models such as blind models are based on harmonic functions, which need long time series data from the same station. However, RO profiles from COSMIC are unevenly distributed over the globe, i.e., long time series data from the same site are unavailable. Hence, the traditional models are not applicable. To overcome this problem, in this study, based on the BP-ANN technique, the RO profiles were used to improve the new model, especially over the ocean regions. Considering the gross error and penetration depth (i.e., the bottom altitude) of the profiles, two criteria for the selection of valid profiles were applied. First, the penetration depth of the profile must be under 8 km since the new model was mainly for the earth's surface. Secondly, if the difference between the ZHDs derived from COSMIC RO data and from reanalysis data (i.e., ERA5) was above 3 times the standard deviation of the mean of the differences, the profile was rejected. Consequently, 3 405 763 profiles were selected to develop the new ZHD model; see Fig. 1d for their distribution and penetration depth (indicated by the color bar).
2.1.3 ERA5
ERA5 is the latest reanalysis data set provided by ECMWF and contains various hourly atmospheric variable values, including pressure, temperature, geopotential height, and relative humidity at 37 pressure levels from 1000 to 1 hPa and at a specific horizontal resolution. Similar to radiosonde data, this data set can be also used to calculate the ZTD and ZHD using Eqs. (1) and (2).
In this study, the atmospheric data related to the ZTD and ZHD at the 37 pressure levels during the 20-year period from 2000 to 2019 over the globe were downloaded from https://doi.org/10.24381/cds.bd0915c6 (Hersbach et al., 2018), and the horizontal resolution of the data is 2.5∘. As a relatively accurate data set, it was used as a reference to evaluate the performance of the new model developed in this study and also that of GPT3 through a comparison of the two models. In addition, the ZHDs derived from ERA5 in the 9-year period from 2006 to 2014 were also used as the reference of the ZHDs derived from the selected COSMIC RO data for the gross error identification of the RO data. The ERA5 data in the 1-year period of 2020, which was different from the period of the training data (i.e., out-of-sample data), over the globe were also used to evaluate the accuracy of the new model.
2.1.4 GNSS
In April 2013, the IGS formally released the IGS real-time service (RTS) for provision of GNSS data, orbit, and clock products with latencies of a few seconds. The real-time data can be obtained and processed freely using the BKG Ntrip Client (BNC) software, which is a client software package allowing for precise point positioning (PPP) in real time. In this study, the modified BNC software used in Sun et al. (2021b) was used to receive the GNSS data stream from IGS data centers and process the GNSS data in real time to acquire real-time ZTD.
Since the PWV derived from sounding data is commonly regarded to be of high accuracy, the 41 IGS stations (shown in Fig. 1c) that are close to radiosonde stations (e.g., within 10 km), the so-called co-located stations, were selected as the samples to evaluate the effect of the new ZHD model, GZHD, on PWV derived from GNSS in real time. The real-time ZTDs in the 154 d period from 1 January to 30 June 2020 (note: ZTD data on some days were not received due to network problems) at the 41 IGS stations were converted into PWVs, and then these PWVs were compared against the PWVs derived from the sounding data of their co-located radiosonde stations (as the reference) for performance assessment.
2.2 Methodologies
In the section, the relationship between the ZHD and ZTD was first analyzed using the Lomb–Scargle periodogram at the aforementioned 505 globally distributed radiosonde stations. Then, a new ZHD model for the real-time retrieval of GNSS-PWV was constructed based on the relationship and the BP-ANN technique.
2.2.1 Ratio of the ZHD to ZTD
As mentioned in the literature (Luo et al., 2013; Zhang et al., 2016), the ratio of the ZHD to ZTD is commonly regarded as a constant around 90 %, which may not be true in some areas or cases. To investigate this, the ratios of the ZHD to ZTD derived from sounding data at the 505 selected globally distributed radiosonde stations during the period of 20-years from 2000 to 2019 were analyzed.
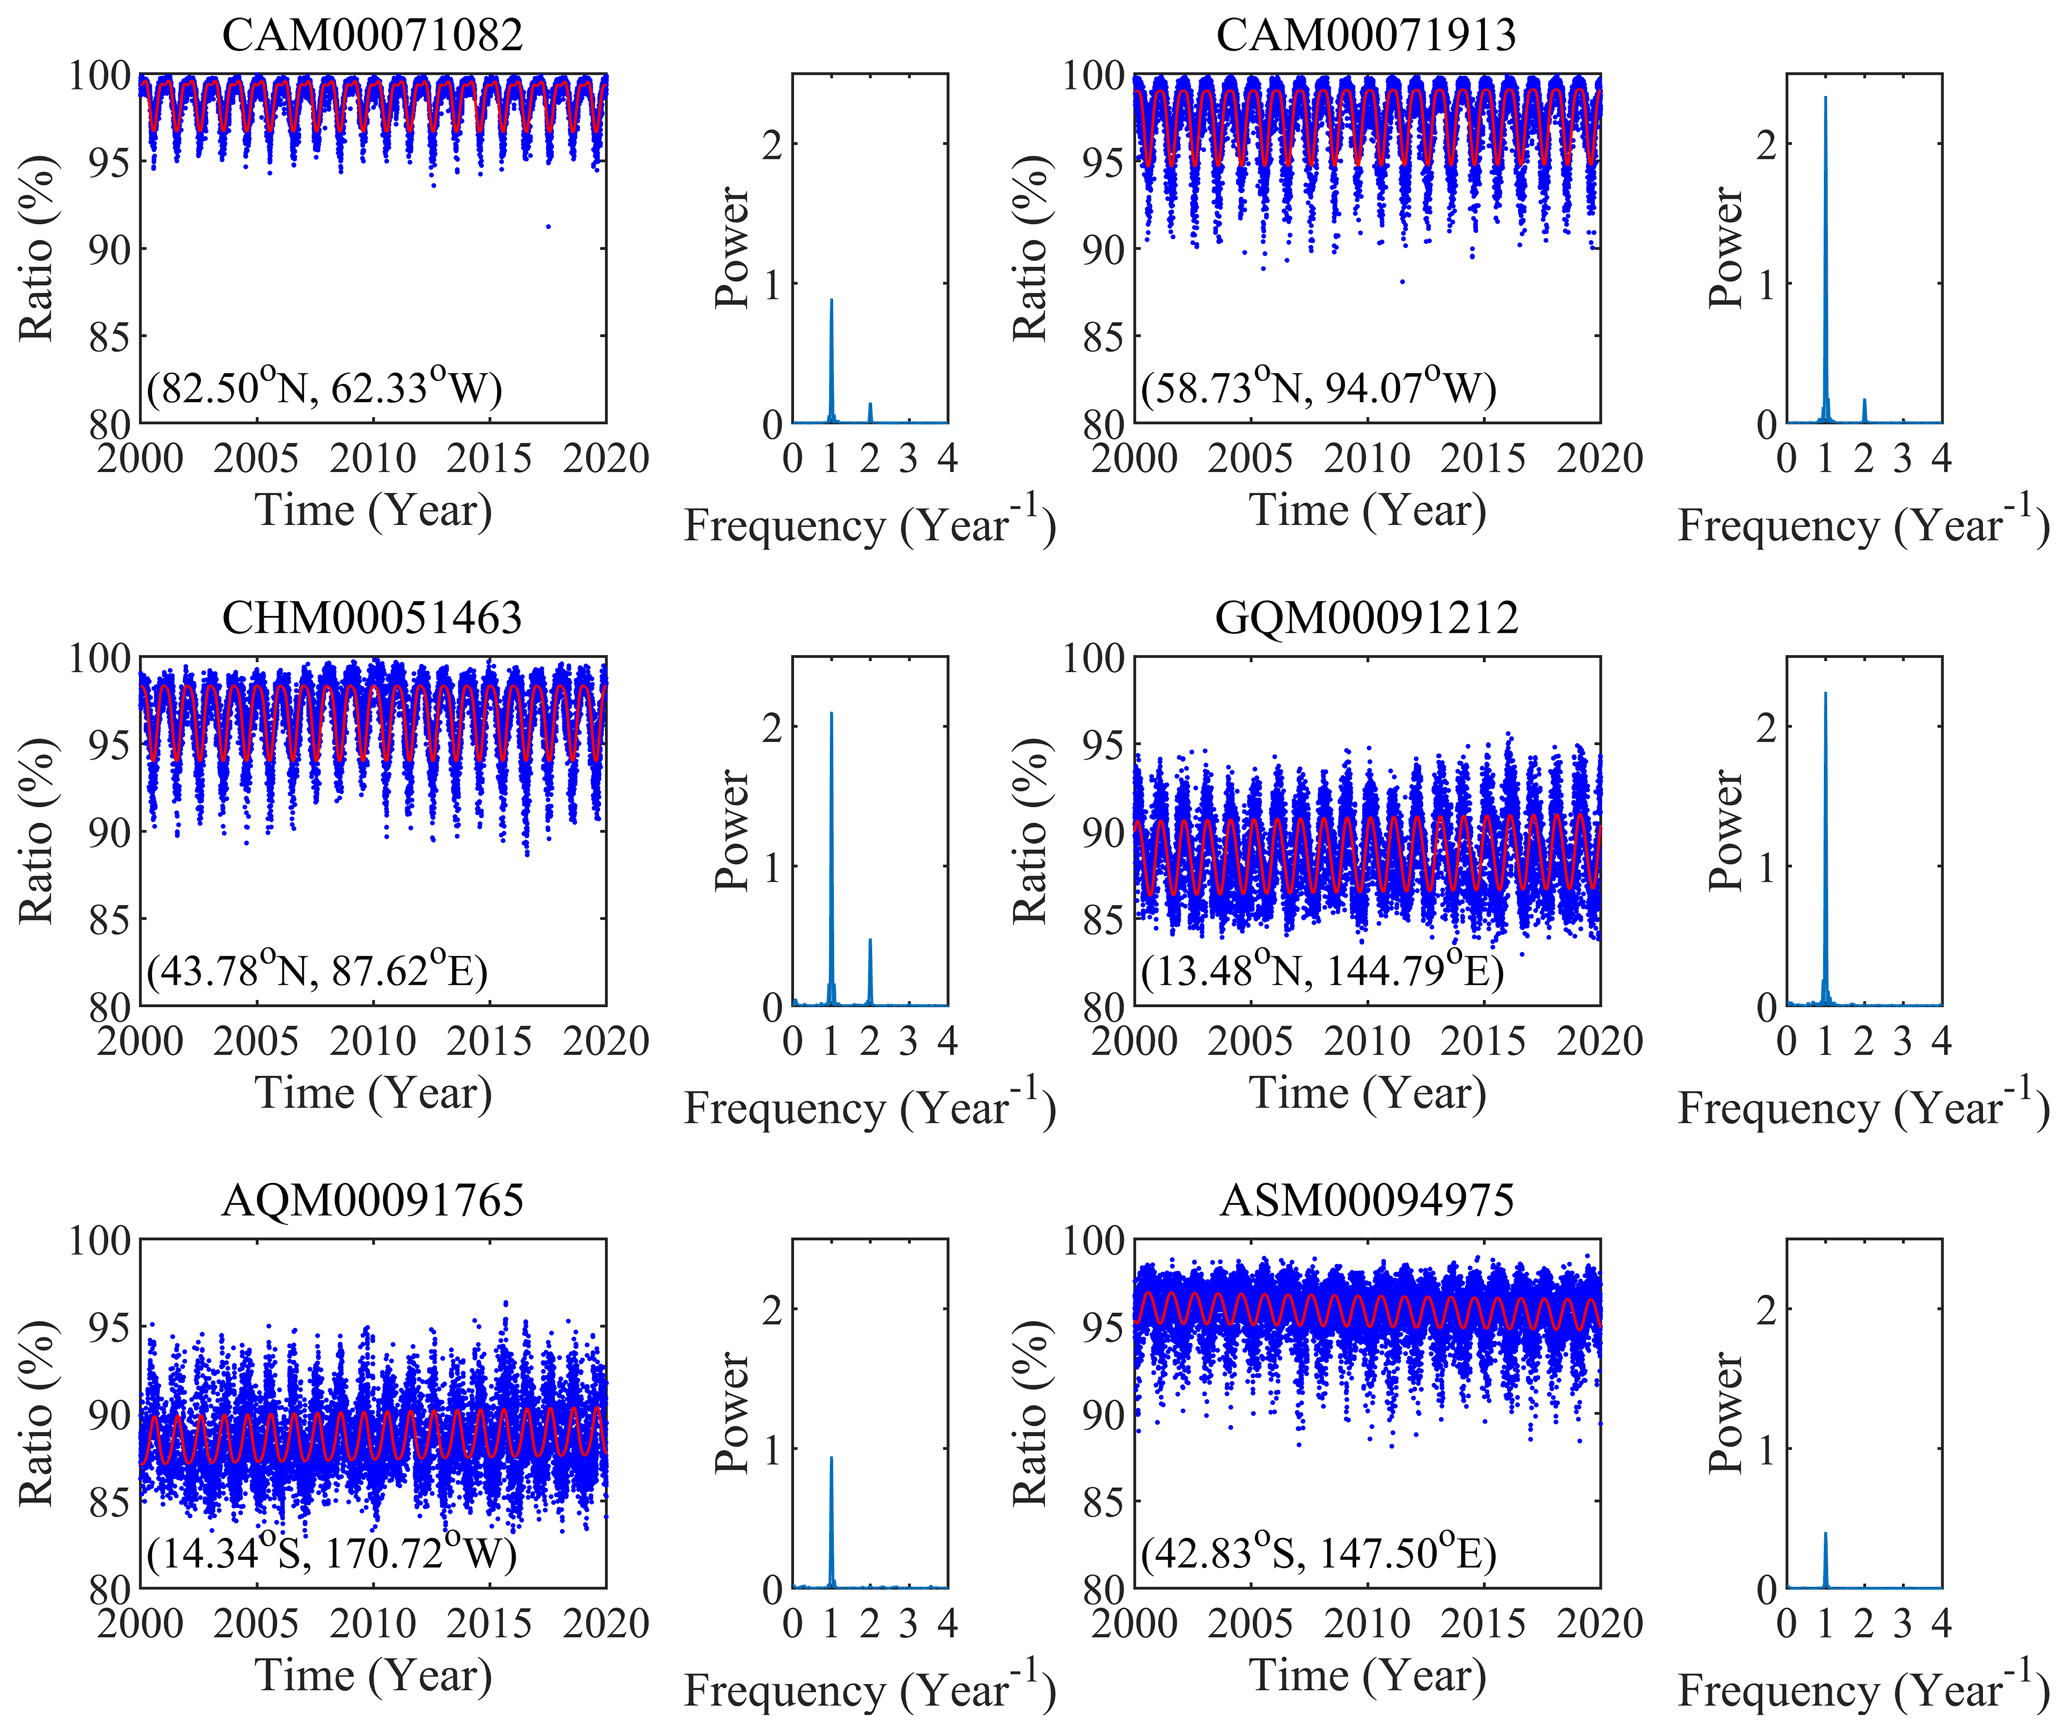
Figure 2Time series of the ratio of the ZHD to ZTD at six radiosonde stations located in different latitude regions.
Figure 2 shows the ratio results of six radiosonde stations located in different latitude regions and their power spectral density obtained from the Lomb–Scargle periodogram. We can see significant annual periodicity with large peaks from all the six examples and semiannual periodicity from three time series (see CAM00071082, CAM00071913, and CHM00051463) with the peaks much smaller than those of the annual periodicity. This implies that the temporal variation in the ratio is dominated by the annual periodicity. Different from the ZTD time series (W. Li et al., 2012) and ZHD time series (Wang et al., 2017), the ratio time series reached the maximum in winter and the minimum in summer, which agreed well with the fact that PWV is higher in summer than winter, leading to larger ZWD in summer. In addition, the interannual variations were obvious at the three stations that are located in the Equator region and Southern Hemisphere possibly due to the change in the trend of PWV (climate change) in these areas.
In order to estimate the annual and semiannual components in the ratio time series, the following model fitting the ratio time series at each radiosonde station was adopted:
where R is the ratio of the ZHD to ZTD, a0 is the mean of the ratio, a1 is the linear trend of the ratio, a2 and a3 are the amplitudes of the annual and semiannual components, respectively, D1 and D2 are the phases of the annual and semiannual components, respectively, and t is the number of the days starting from 1 January 2000. The six unknown parameters – ai , D1, and D2 – would be estimated using the least-squares method.
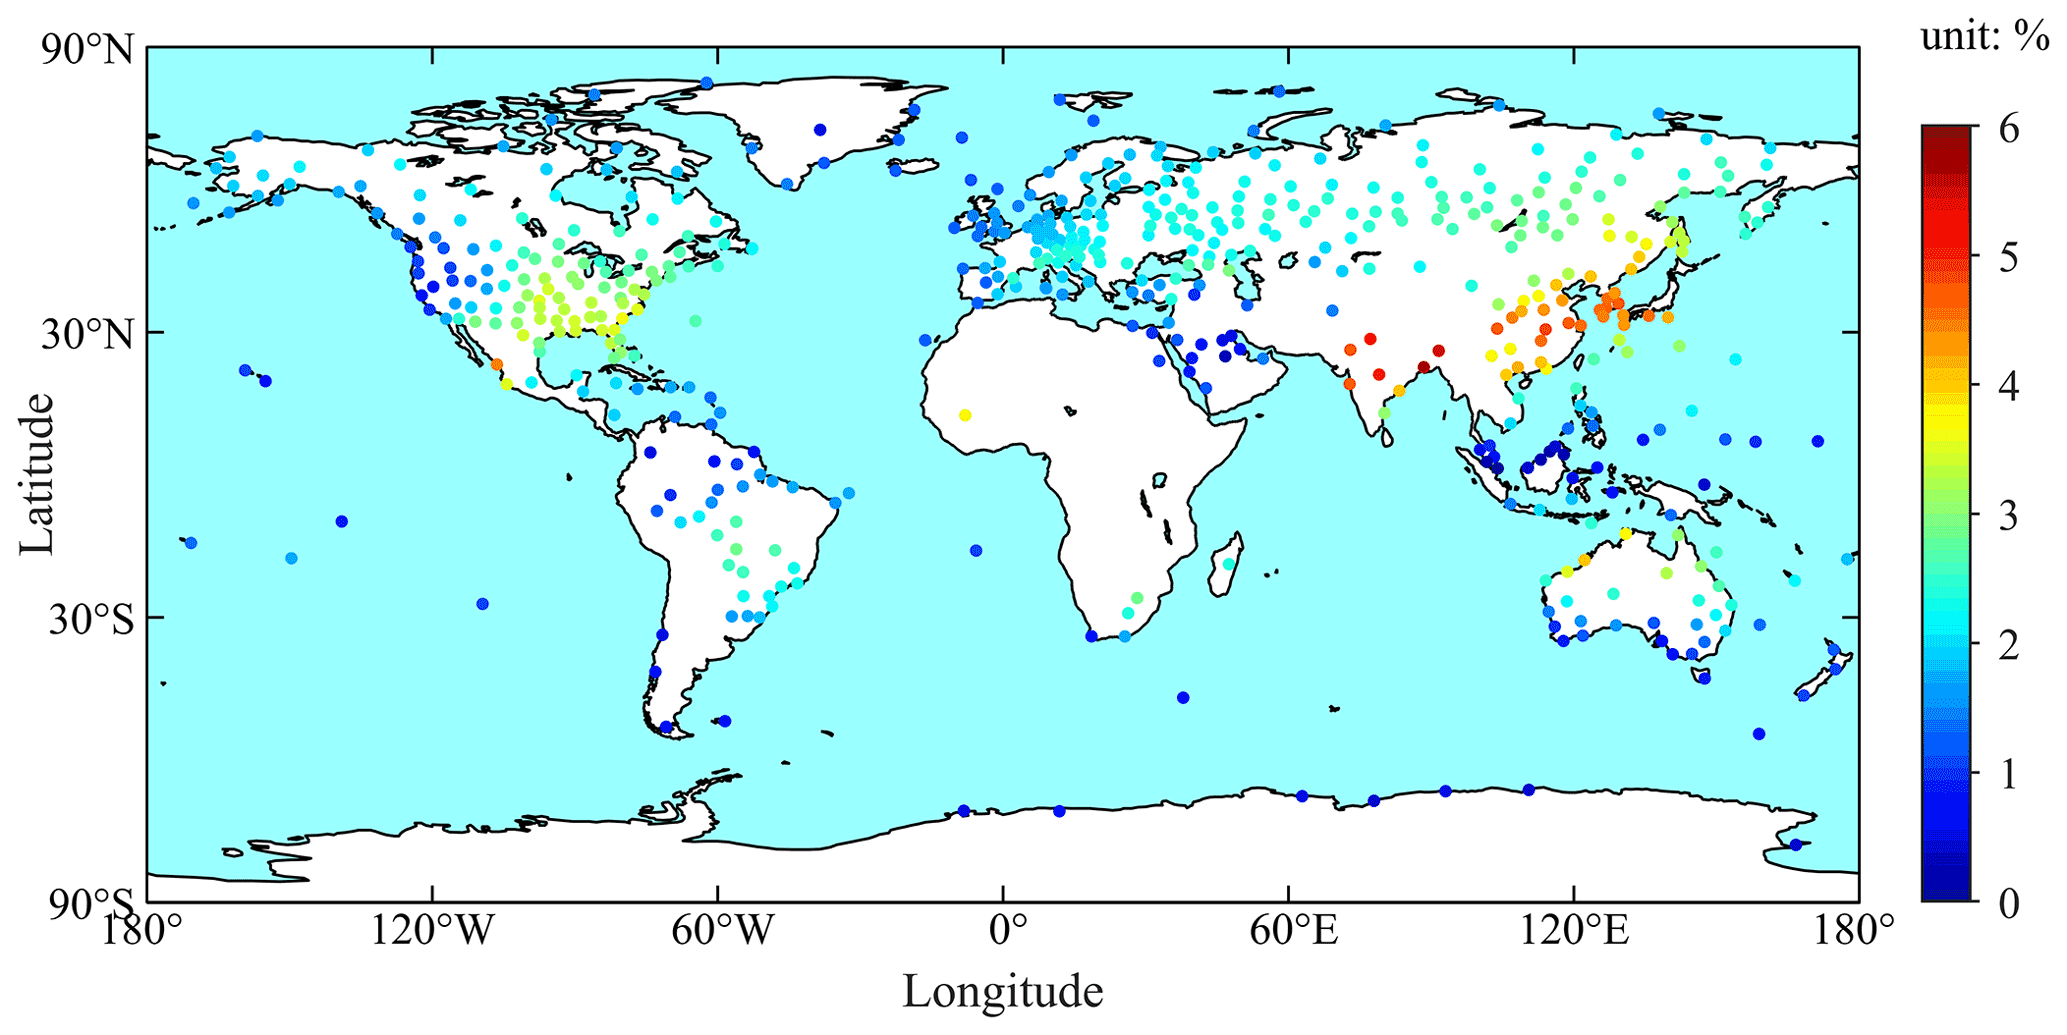
Figure 3Annual amplitude of the ratio of total and hydrostatic zenith delays at each of the 505 global radiosonde stations.
Figure 3 shows the annual amplitude at each of the 505 stations. One can see that the annual amplitude of a station was more dependent upon the climatic type rather than latitude of the station. Most of the large annual amplitudes were found in mid-latitude regions (near 30∘ in both the Northern Hemisphere and Southern Hemisphere), and small annual amplitudes were found in high-latitude and Equator regions. The annual amplitudes over the eastern Atlantic and the northeast Pacific coast were small, which was likely due to the effect of the ocean (Jin et al., 2007). The annual amplitudes at all the 505 stations ranged from 0.1 % to 5.7 % with the mean of 2.2 %. Based on the mean of the ratio of 2.2 %, if the ZTD is assumed to be 2000 mm, then the mean of the annual amplitudes in the ZHD variation is 44 mm. This is a large value and thus can considerably affect the accuracy of GNSS-derived PWV.
The fact that the noticeable annual periodicity and the large annual amplitudes in the ratio time series are related to the climatic type suggests that the ratio is not always a constant, e.g., the commonly regarded 90 % or any other values. Based on this characteristic, the ZHD can be obtained after the ZTD is obtained from the GNSS data processing. Thus, a new ZHD model was developed mainly for real-time retrieval of GNSS-PWV, and its validation will be presented in the following sections.
2.2.2 The new ZHD model
Similar to the biological neural system, the artificial neural network (ANN) is a complex network composed of many neurons or nodes connecting with each other (Katsougiannopoulos and Pikridas, 2009). Its working principle is to produce the target value according to the input data after being trained by the training data set. As one of the most common ANNs, the BP-ANN is a multi-layer feedback network trained according to the error back propagation algorithm (J. Li et al., 2012). It has been applied to several fields, e.g., functional approximation, pattern recognition, classification, and data compression. Due to its ability of multi-parameters nonlinear regression, this study used the BP-ANN to investigate a new ZHD model, named GZHD, mainly for the real-time retrieval of GNSS-PWV.
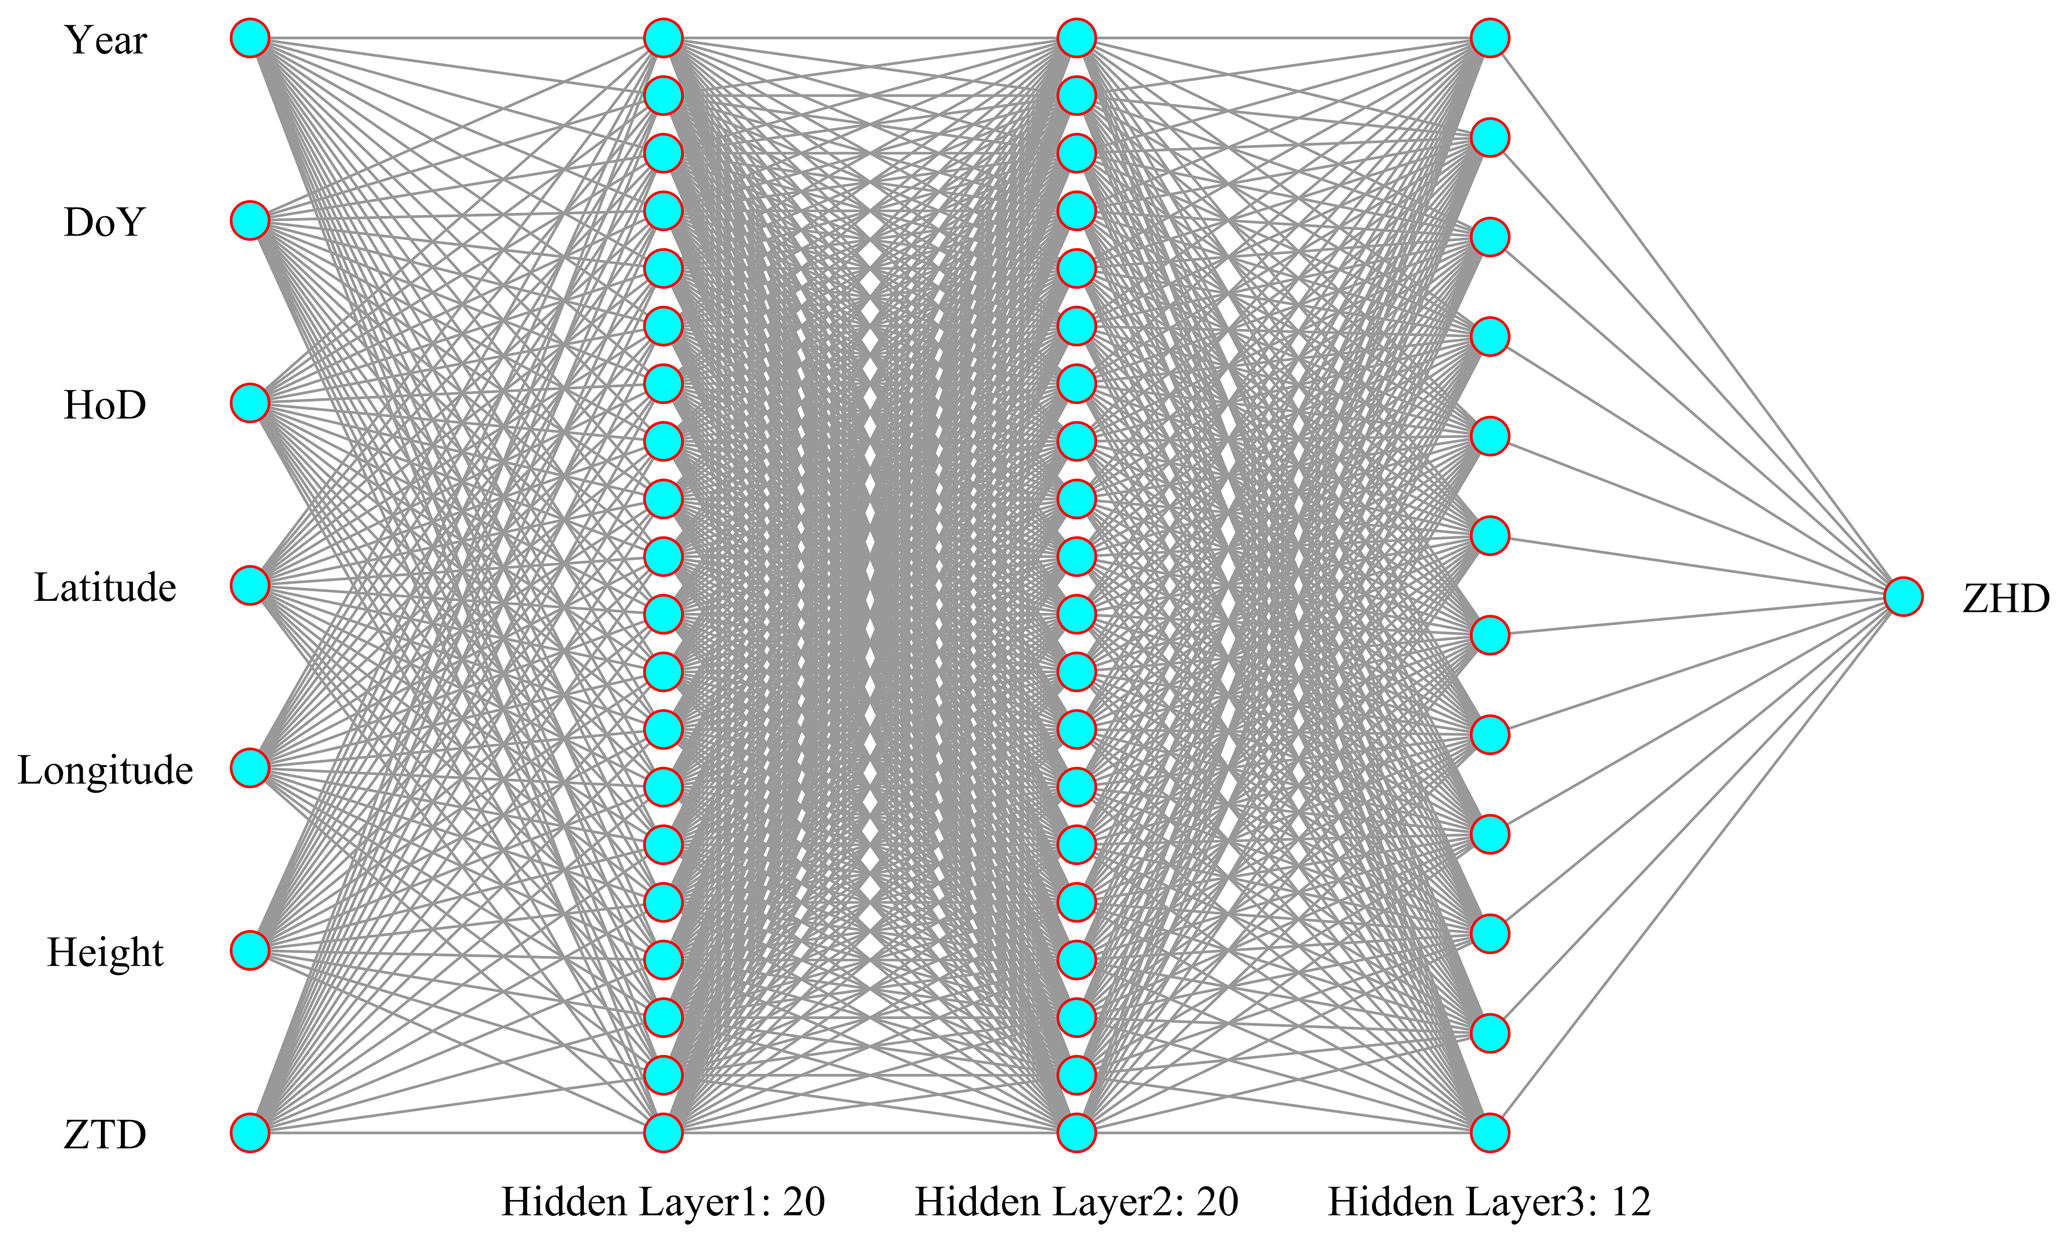
The output of GZHD is the ZHD, which is required in the conversion of the GNSS-ZTD into PWV, while the input variables must be independent from each other and also related to the output. Therefore, in this study, in addition to the common five variables, i.e., the day of year (DoY), the hour of day (HoD), latitude (φ), longitude (λ), and ellipsoidal height (H) of the station, the ZTD was also used as an input variable of GZHD based on the analysis in Sect. 2.2.1. Using the sample data for the input variables and the output ZHD and the BP-ANN technique, the GZHD model can be developed.
The BP-ANN used in this study contained three hidden layers, and the network for the new model was trained for thousands of times, depending on the number of the neurons and the activation function used in each hidden layer. From our tests, we found that the RMSE of the new model-derived ZHD varied slightly (at a sub-millimeter level) with the increase in the number of the neurons and the selection of the active function. Then, in consideration of both accuracy and efficiency of the network, the structure with 20, 20, and 12 neurons and the active functions of tansig, tansig, and logsig for the three hidden layers were adopted. The structure of the BP-ANN including the input variables, output ZHD, and three hidden layers is shown in Fig. 4.
For the development of GZHD, two data sets were used to train the network: one was the sounding data for a period of 20 years at the aforementioned 558 global radiosonde stations, and the other was the COSMIC-1 RO data around the globe for a period of 9 years. The former was taken as the main training data due to its high accuracy, while the latter was taken as auxiliary training data since the radiosonde stations were mainly deployed on continents. As mentioned before, COSMIC-1 RO profiles are unevenly distributed around the globe, which are not suitable for harmonic functions used in the traditional models since long time series data from the same site are not available. However, the uneven distribution of the RO data is beneficial for the BP-ANN technique, and the usage of the RO data means an increase in the number of the training samples, which is likely to improve the performance of GZHD, especially over the ocean regions. A total of 3 405 763 RO profiles were used to train the network.
The performance of the GZHD model was assessed using the sounding data from 137 global radiosonde stations and also global ERA5 data as two reference data sets. In addition, GZHD was also evaluated using the sounding data and ERA5 data in 2020, which were different from the training period and thus are out-of-sample data. For convenience, the ZHDs obtained from the integration expressed by Eq. (2) and the data from the above two data sources are named ZHD-RS and ZHD-ERA5, respectively, hereafter. The performance of GZHD was also compared with that of GPT3 by comparing the biases and RMSEs of the two model-derived ZHDs, named ZHD-GPT3 and ZHD-GZHD, respectively, based on the same reference data set. The formulas for the bias and RMSE of the differences between the model-derived ZHDs and the references are
where n is the number of the samples used for the evaluation, i is the index of the sample, and r and m denote the reference and model-derived, respectively. It was expected that the GZHD would outperform GPT3 since GPT3 is based on the global ZHD variation trend rather than using any actual measurements like the GZHD does (GNSS-derived ZTD is used as the input of GZHD).
3.1 Result using ZHD-RS as reference
ZHD-GZHD and ZHD-GPT3 calculated for each site of the above-mentioned 137 global radiosonde stations during the 20-year period from 2000 to 2019 were compared against the reference of the ZHD-RS at the same station. The bias and RMSE of the ZHD-GZHD and ZHD-GPT3 at each station are shown in Fig. 5.
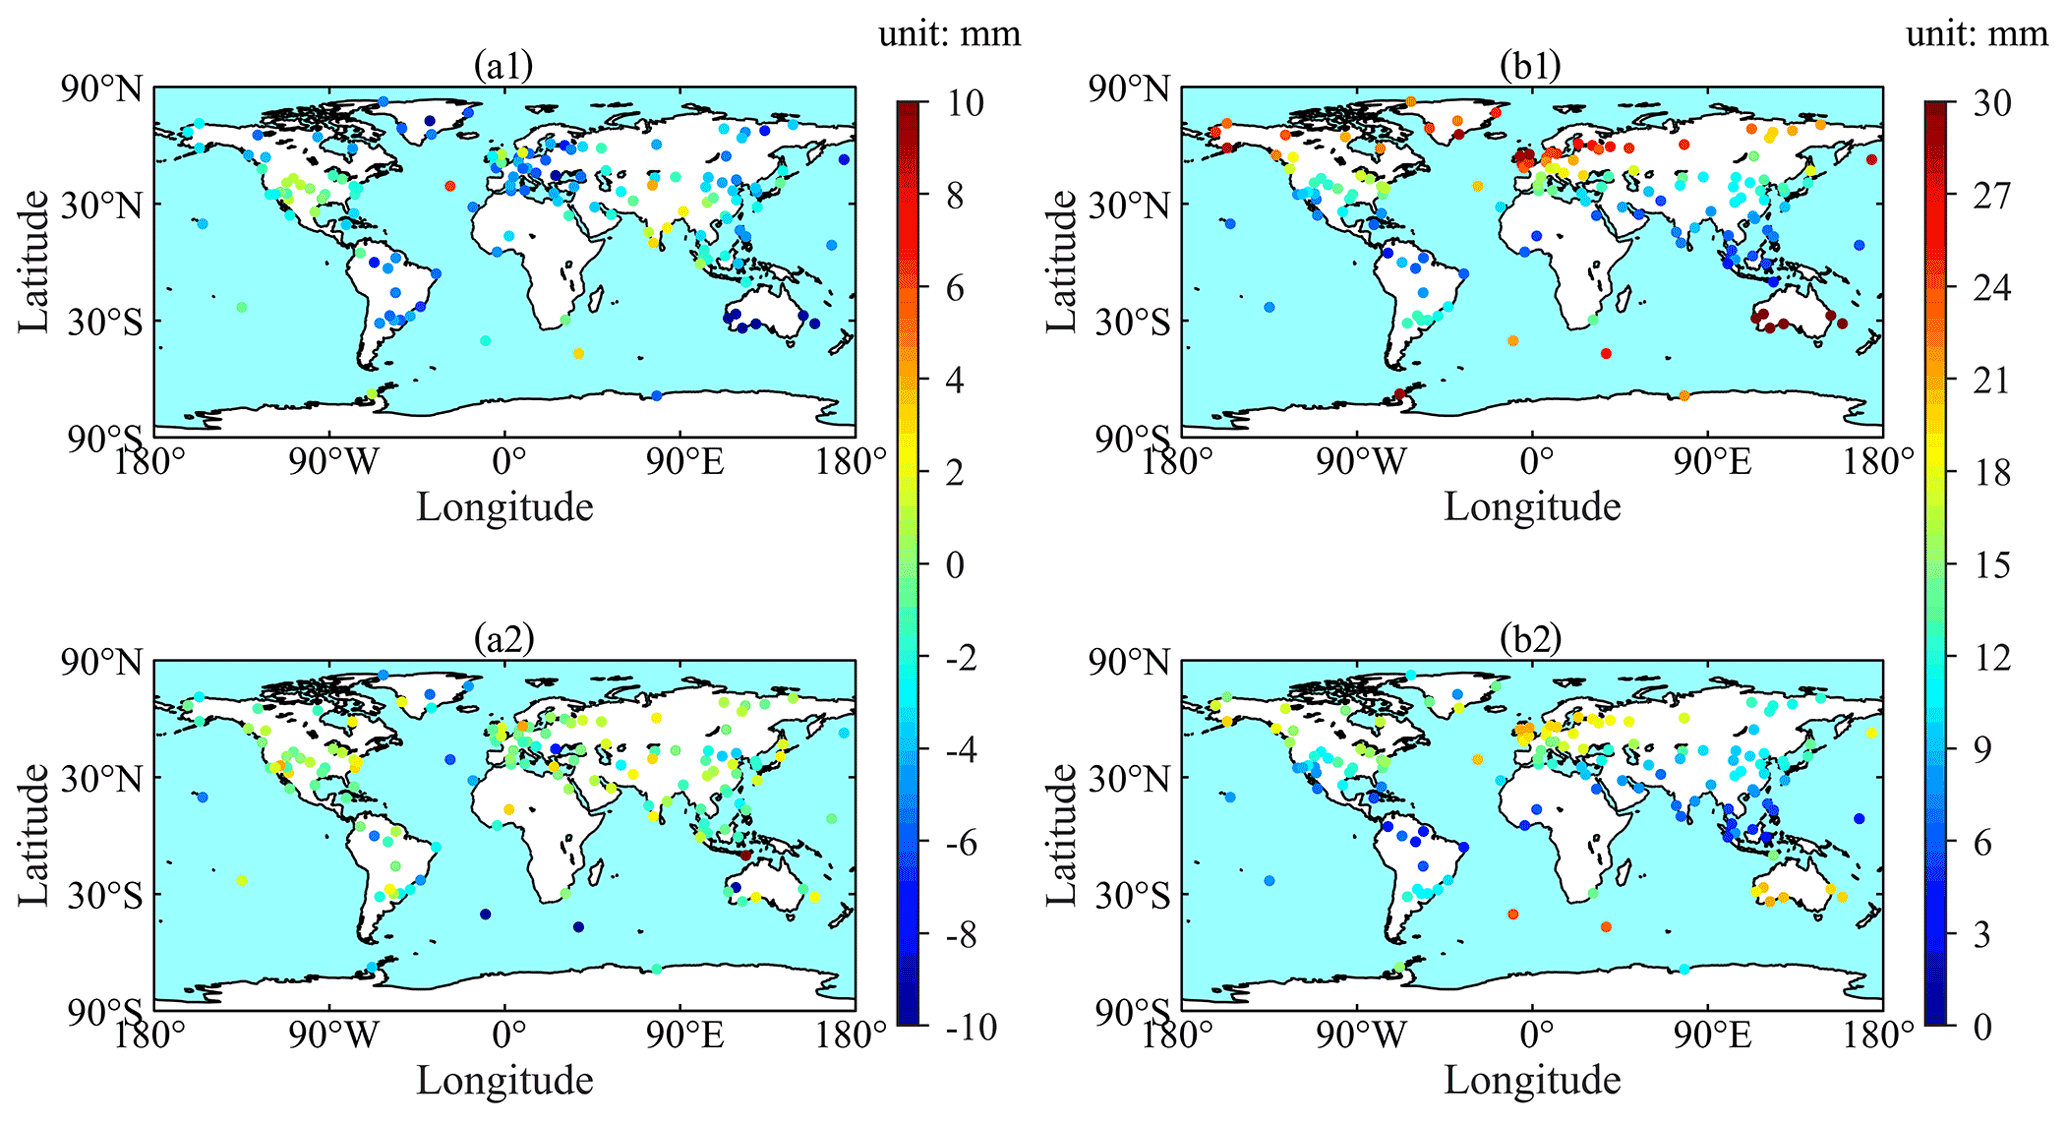
Figure 5Bias (a1) and RMSE (b1) of ZHD-GPT3 and bias (a2) and RMSE (b2) of ZHD-GZHD at each of the 137 radiosonde stations during the 20-year period of 2000–2019 (reference: ZHD-RS).
Figure 5a1 indicates that the biases of ZHD-GPT3 at most stations were negative, and the bias values were under 6 mm at 122 stations. However, the bias values at the radiosonde stations located in Australia were over 10 mm (negative) (which will be discussed later). Figure 5a2 shows that the bias values of ZHD-GZHD varied within ±6 mm at 132 radiosonde stations, while at the other stations the bias values were over 6 mm. Comparing Fig. 5a1 with a2, there are 111 radiosonde stations where the biases of ZHD-GZHD were smaller than the ones of ZHD-GPT3. Therefore, the new model significantly outperformed GPT3, in terms of biases.
In Fig. 5b1, the RMSE of ZHD-GPT3 appeared to be dependent upon latitude, and generally, the higher the latitude, the larger the RMSE. Most of the RMSEs in mid- and high-latitude regions were over 20 mm, which was different from the small values in the low-latitude region. Figure 5b2 also shows the latitude-dependent feature of the RMSE of ZHD-GZHD. However, the RMSE was smaller than that of ZHD-GPT3 at each of the 117 stations, and at the other 20 stations, which were mainly distributed in the low-latitude region (a total of 45 stations), the RMSE was slightly larger than that of ZHD-GPT3. In conclusion, the accuracy of GZHD was significantly better than that of GPT3, especially in mid- and high-latitude regions.
Table 1Maximum, minimum, and mean of the biases and RMSEs of all the 137 stations shown in the four panels in Fig. 5.
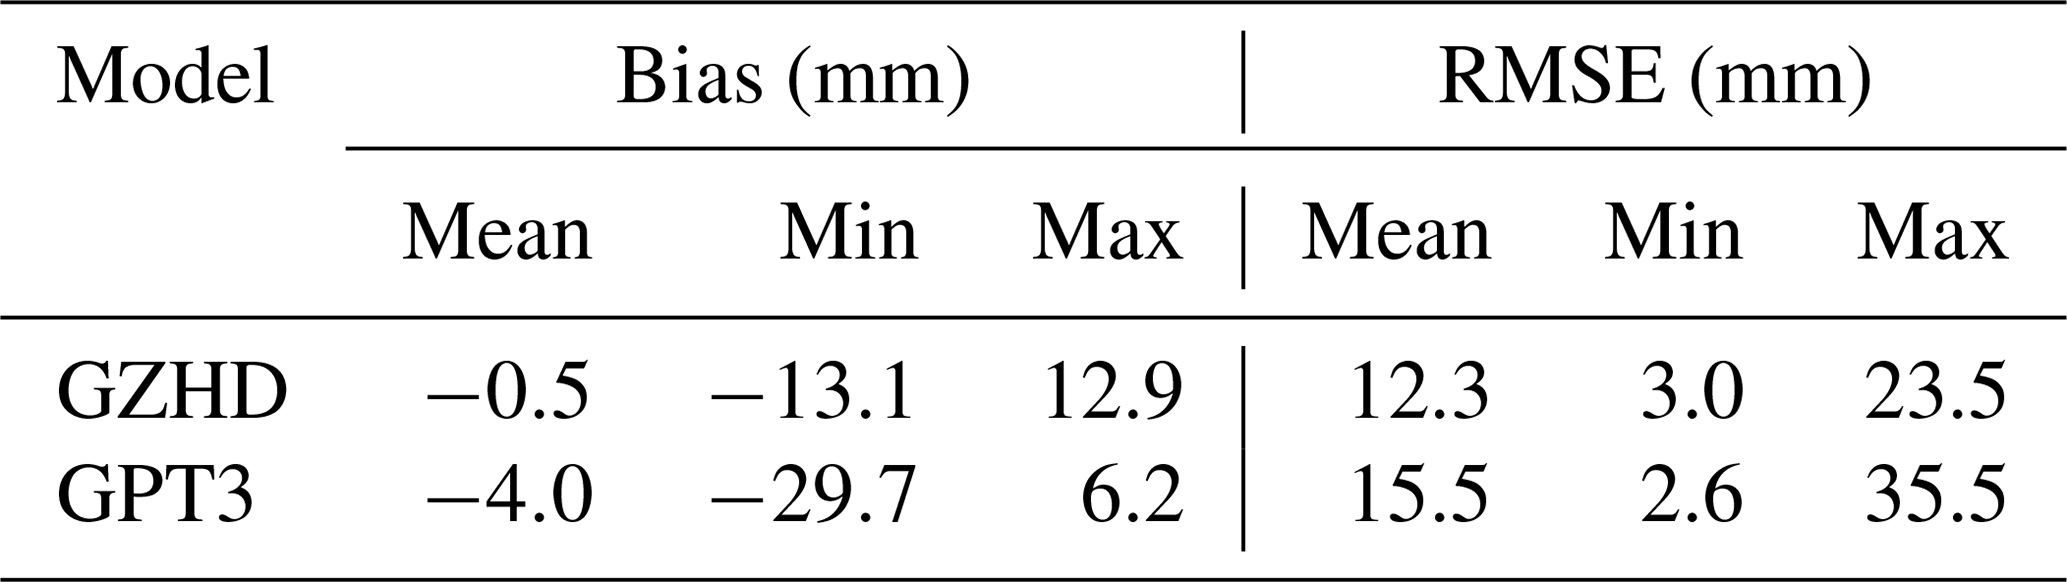
The maximum, minimum, and mean of the biases and RMSEs of all the 137 stations shown in the four panels in Fig. 5 are listed in Table 1. The result indicates that the mean of ZHD-GZHD was much smaller than that of ZHD-GPT3. This demonstrates significant improvements made by GZHD in comparison with GPT3. In addition, the mean bias of −4.0 mm of GPT3 implies an underestimation of the ZHD from the GPT3 model, and the mean bias of −0.5 mm from GZHD means a slight underestimation of the new model.
For further comparison of the two model-predicted ZHD time series with the ZHD-RS time series, six radiosonde stations were selected as examples. It is worth mentioning that the six stations are located on six continents, i.e., one radiosonde station in each of the six continents, except for Antarctica due to its very small population. The results are shown in Fig. 6, and Fig. 7 shows the correlations between the model-predicted ZHDs and ZHD-RS, named R-GZHD and R-GPT3, respectively, of the six stations.
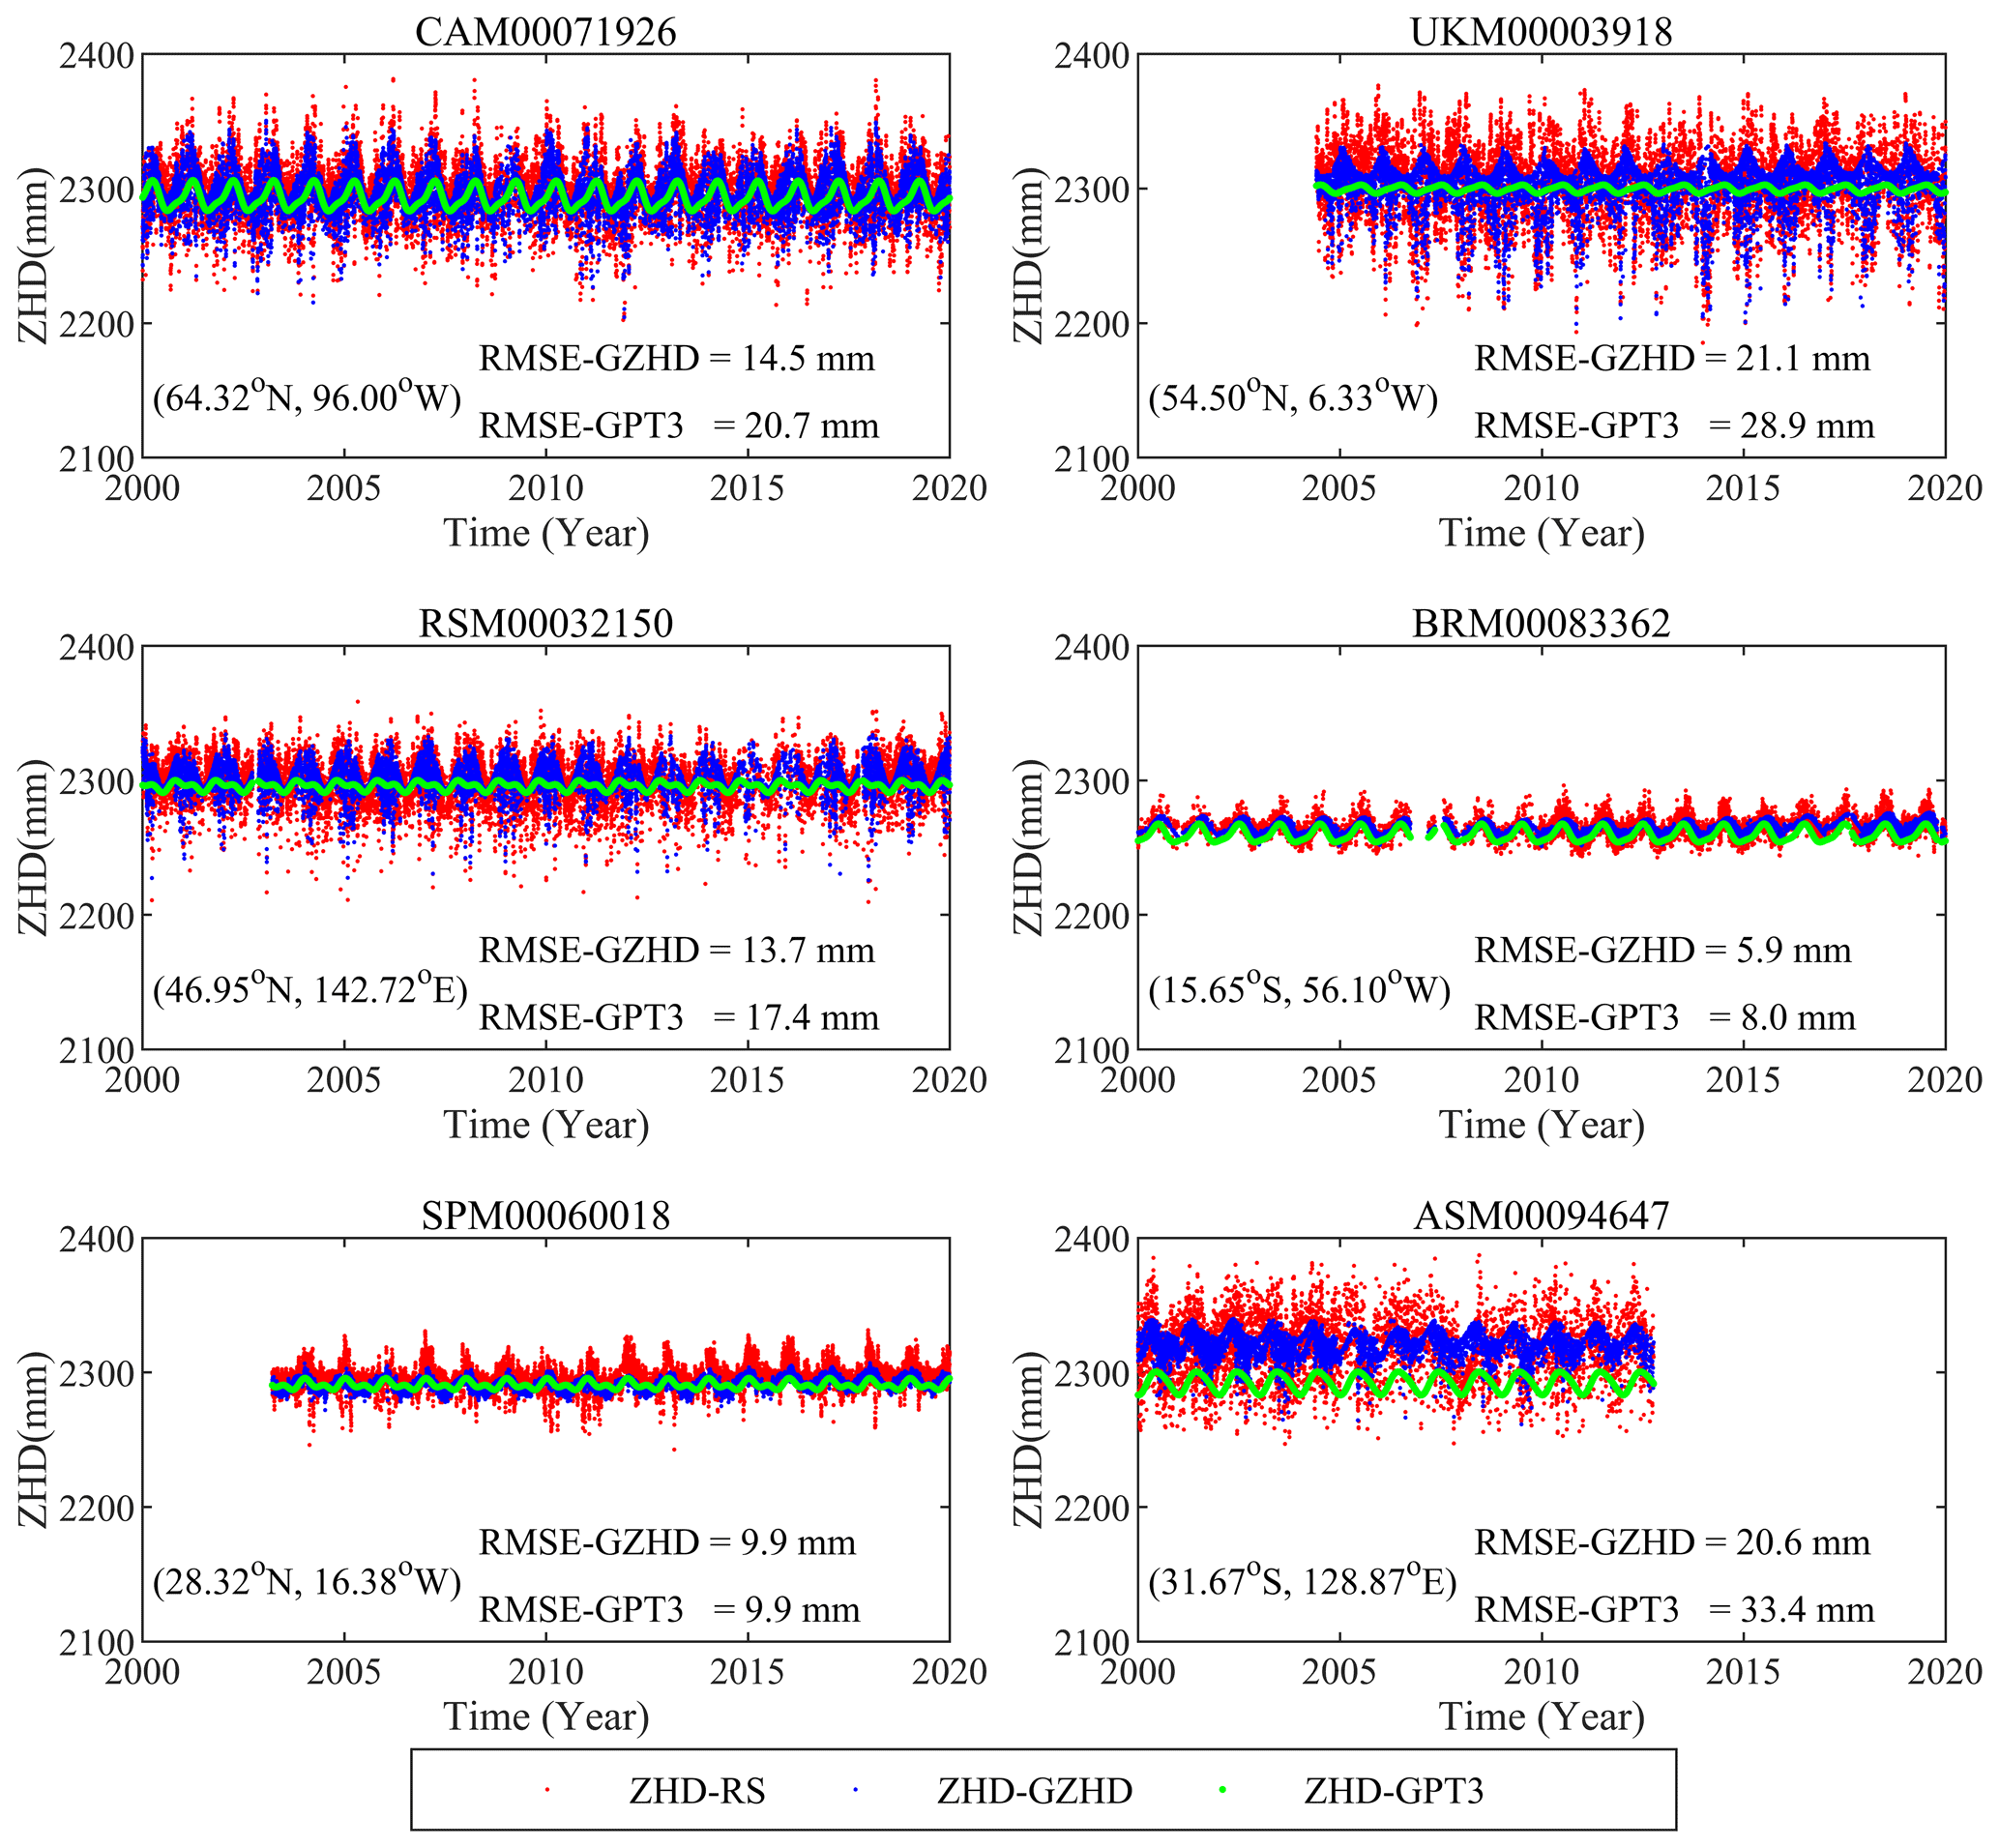
Figure 6Time series of ZHD-RS (red), ZHD-GZHD (blue), and ZHD-GPT3 (green) at six radiosonde stations located on six continents.
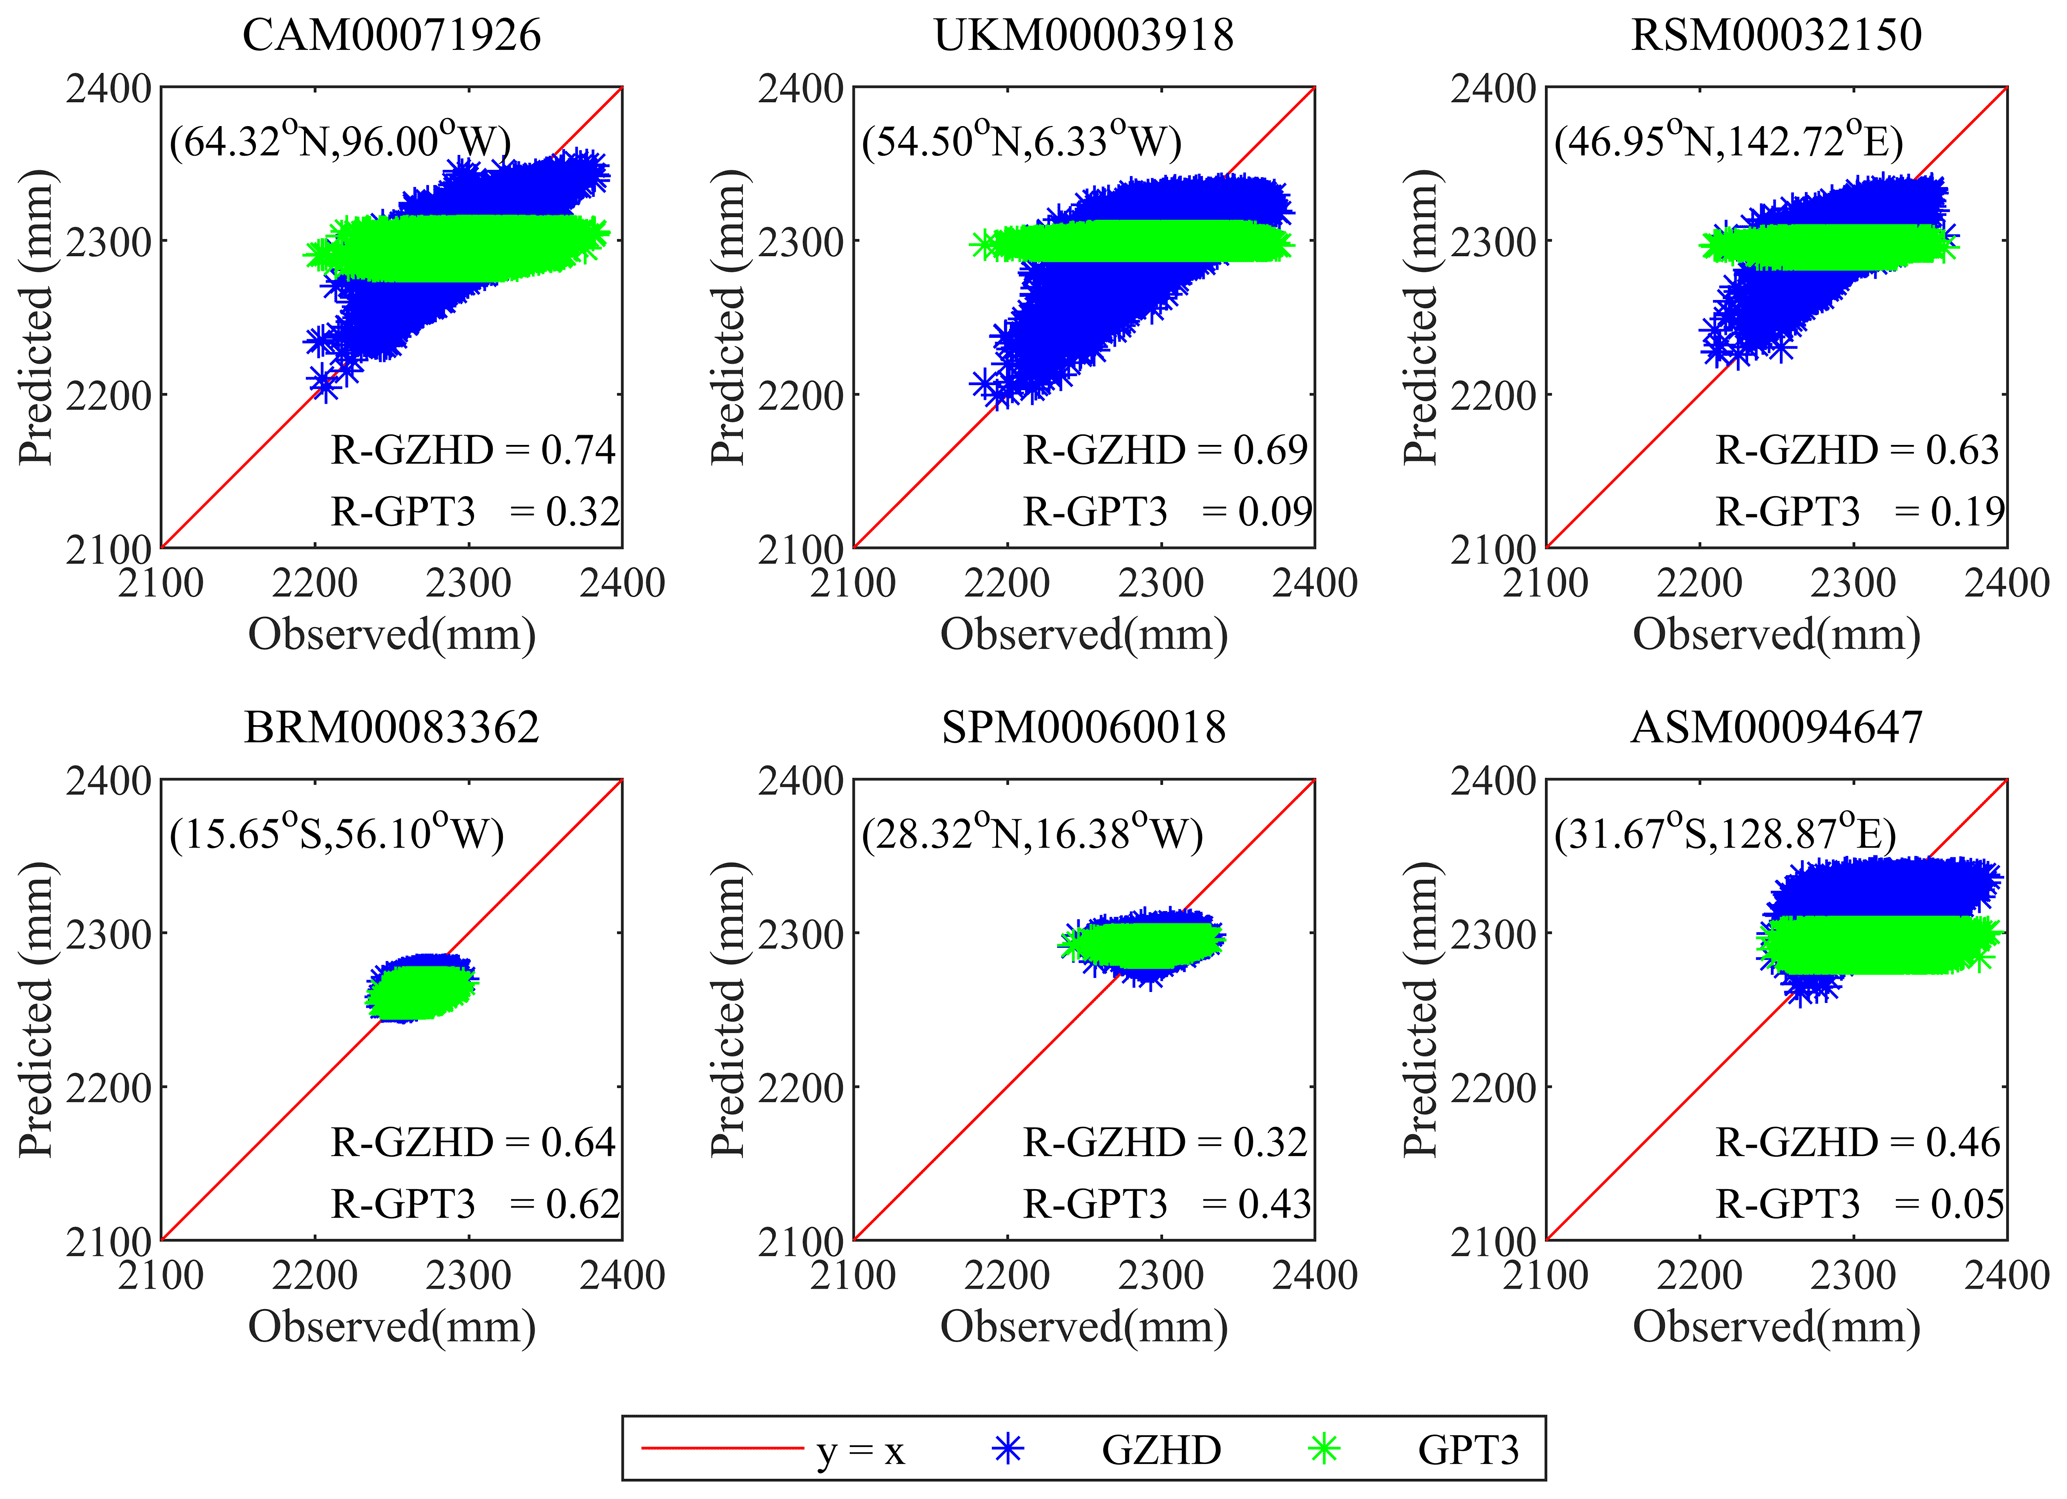
Figure 7Correlation between the two model-predicted ZHD time series, ZHD-GZHD (blue) and ZHD-GPT3 (green), shown on the vertical axis and ZHD-RS (i.e., observed, on the abscissa axis) at the six radiosonde stations shown in Fig. 6.
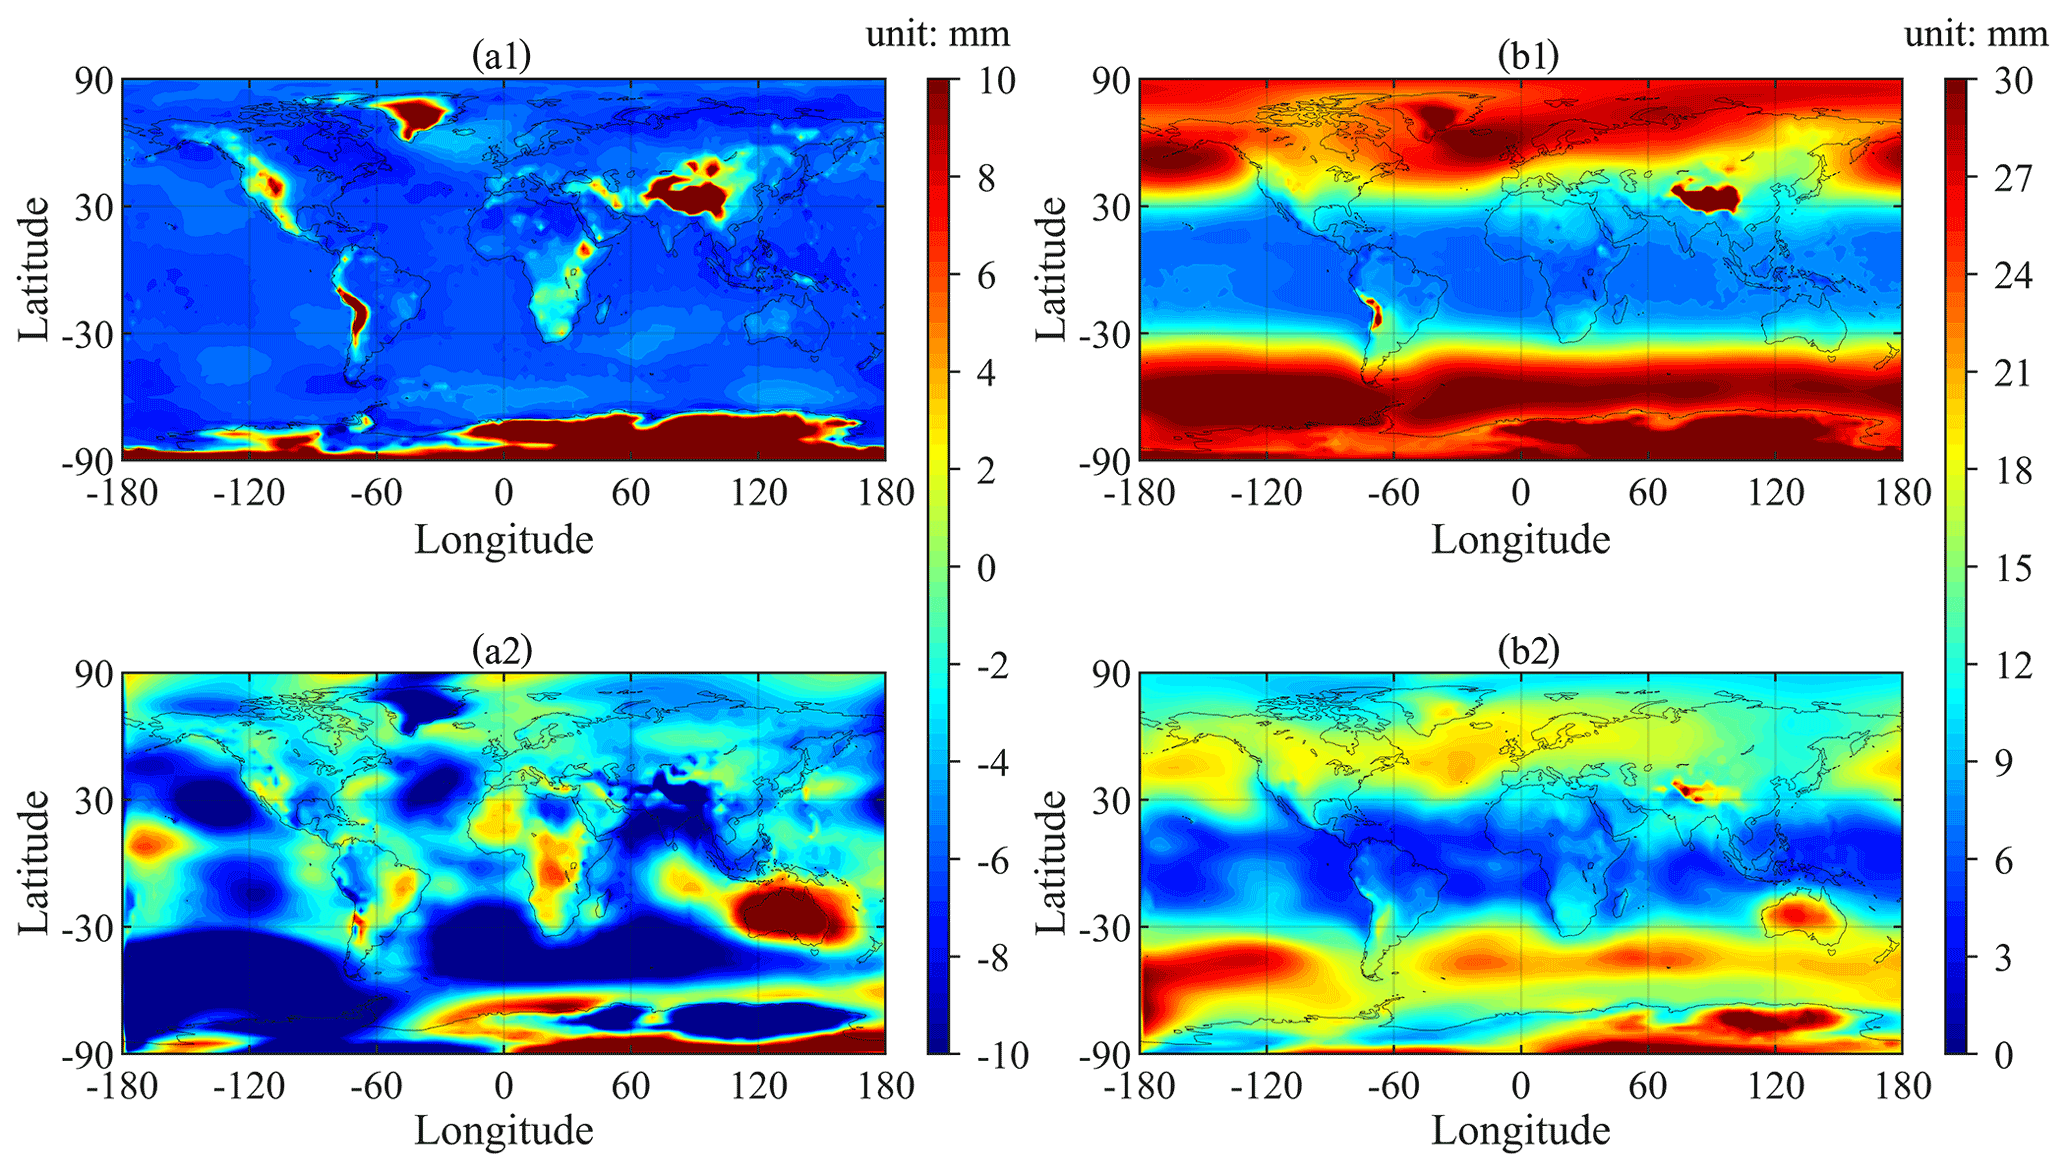
Figure 8Bias (a1) and RMSE (b1) of ZHD-GPT3 and bias (a2) and RMSE (b2) of ZHD-GZHD over each global grid point (the horizontal resolution: ) during the 19-year period of 2000–2019 (reference: ZHD-ERA5).
All the ZHD-GZHD (blue) time series in the six panels of Fig. 6 show not only annual and semiannual periodic variation characteristics but also high-frequency variations, which was closer to the observed (the truth) ones, compared with the ZHD-GPT3. This was because the GZHD model used the ZTD derived from sounding data as its input. In contrast, the reason for the ZHD-GPT3 time series only reflecting the annual and semiannual variations by smooth curves was that the model was constructed based on a harmonic function that only contains two periodic terms (Landskron and Böhm, 2018). Moreover, the high-frequency variations were more significant at the stations that are located in mid- and high-latitude regions (see the first three and the last panels) than the other two, which are located in low-latitude regions. This was why GZHD significantly outperformed GPT3, especially in mid- and high-latitude regions.
From Fig. 7, we can see that in each pane the blue dots (ZHD-GZHD) distributed around the red line and much closer to the red line than the green ones (ZHD-GPT3). The result indicates that the ZHD-GZHD agreed with ZHD-RS better than ZHD-GPT3. The correlation coefficient values of R-GZHD shown in the five panels, except for the middle one in the bottom row (which is located in Africa where only a few stations were used to construct the new model; see Fig. 1a), were larger than those of R-GPT3. This means an improvement was made by the new model. Furthermore, the improvement in a high-latitude region was more significant than a low-latitude region. For example, the R-GPT3 and R-GZHD at CAM00071926 (high-latitude) were 0.32 and 0.74, respectively, whilst the corresponding values at BRM00083362 (low-latitude) were 0.62 and 0.64, respectively.
3.2 Result using ZHD-ERA5 as reference
In this section, both ZHD-GZHD and ZHD-GPT3 calculated for each global grid point (with the horizontal resolution of ) during the 20-year period of 2000–2019 were compared against the ZHD-ERA5 (which was not used in the construction of the new model) over the same grid. The statistical results of the 20-year data over the globe are shown in Fig. 8.
Figure 8a1 shows noticeable biases in ZHD-GPT3. In most regions, the biases were negative, which was different from the fact that most biases in Antarctica and mountainous regions were positive, such as the Tibetan Plateau, Andes Mountains, Rocky Mountains, etc. This may be caused by the underestimation of pressure by GPT3 above the earth's surface (Li et al., 2021) and the overestimation of pressure below the earth's surface. Note that the lowest height of the grid points of ERA5 over the globe ranged from about −200 to 200 m, which is different from the true topography. Figure 8a2 indicates that small ZHD-GZHD biases were in most regions, while large biases were in Antarctica and its surrounding regions (latitude between 30 and 90∘ S). Compared to ZHD-GPT3 in Fig. 8a1, the biases of ZHD-GZHD in Fig. 8a2 were significantly smaller in most regions over the globe. In Antarctica, the poor performance of GZHD may be also due to the fact that not only was the number of the samples in the Southern Hemisphere considerably smaller than that in the Northern Hemisphere, but also ZHD-ERA5 was of low accuracy in Antarctica (Tetzner et al., 2019; Zhang et al., 2019).
In Fig. 8b1, the RMSEs of ZHD-GPT3 appeared to be latitude-dependent, and generally, the RMSEs were higher in mid- and high-latitude regions than those in low-latitude regions. Similar to the ZHD-GPT3 biases, the RMSEs were also very large in complex mountainous terrain. The poor performance of GPT3 in complex mountainous terrain is mainly because of the mismatch between the model and actual terrain (Zhang et al., 2013; Wang et al., 2017). In Fig. 8b2, although the RMSEs were slightly dependent upon latitude, the RMSEs of ZHD-GZHD were smaller than those of ZHD-GPT3 in most regions, except for Australia and its surrounding regions (which will be discussed later). In summary, the accuracy of the new ZHD model was higher than GPT3 in most regions when ZHD-ERA5 was used as the reference, especially in mid- and high-latitude regions.
Table 2Mean of the biases and RMSEs of ZHD-GZHD and ZHD-GPT3 during the 19-year period of 2000–2018 in different latitude ranges (with a 15∘ interval).
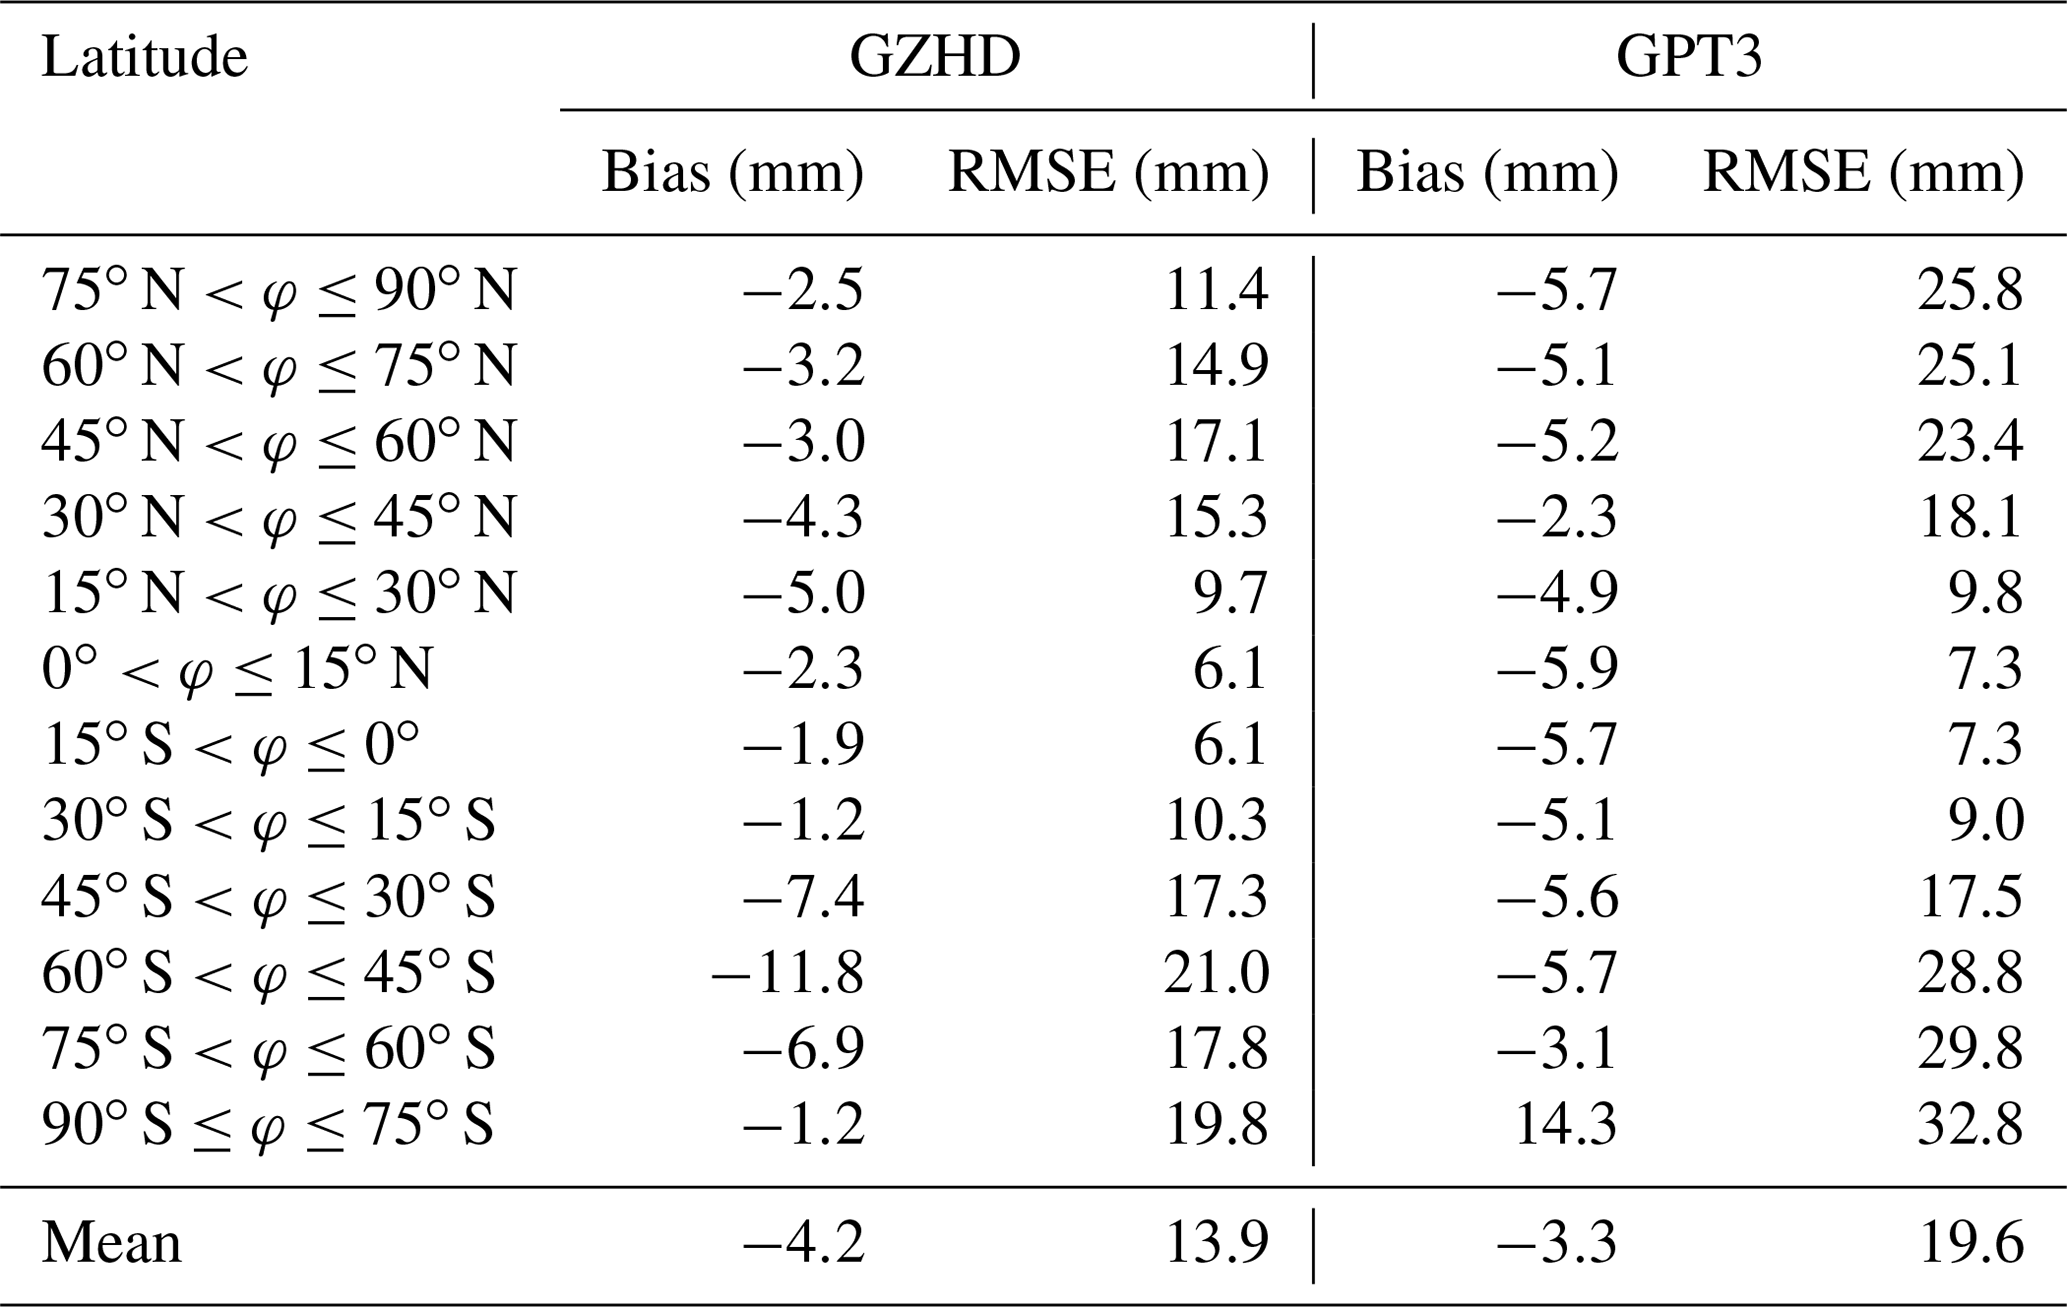
For further evaluation of the performance of the two models in different latitudes, the mean biases and RMSEs in 12 latitude regions (with a 15∘ interval) were compared, and corresponding results are listed in Table 2. Figure 9 is for a better-resolution (with a 2.5∘ interval) result. We can see that in most latitude ranges, the biases and RMSEs of ZHD-GZHD were smaller than those of ZHD-GPT3. In summary, the accuracy of ZHD-GZHD was improved by 29 % in comparison with ZHD-GPT3 when ZHD-ERA5 was used as the reference.
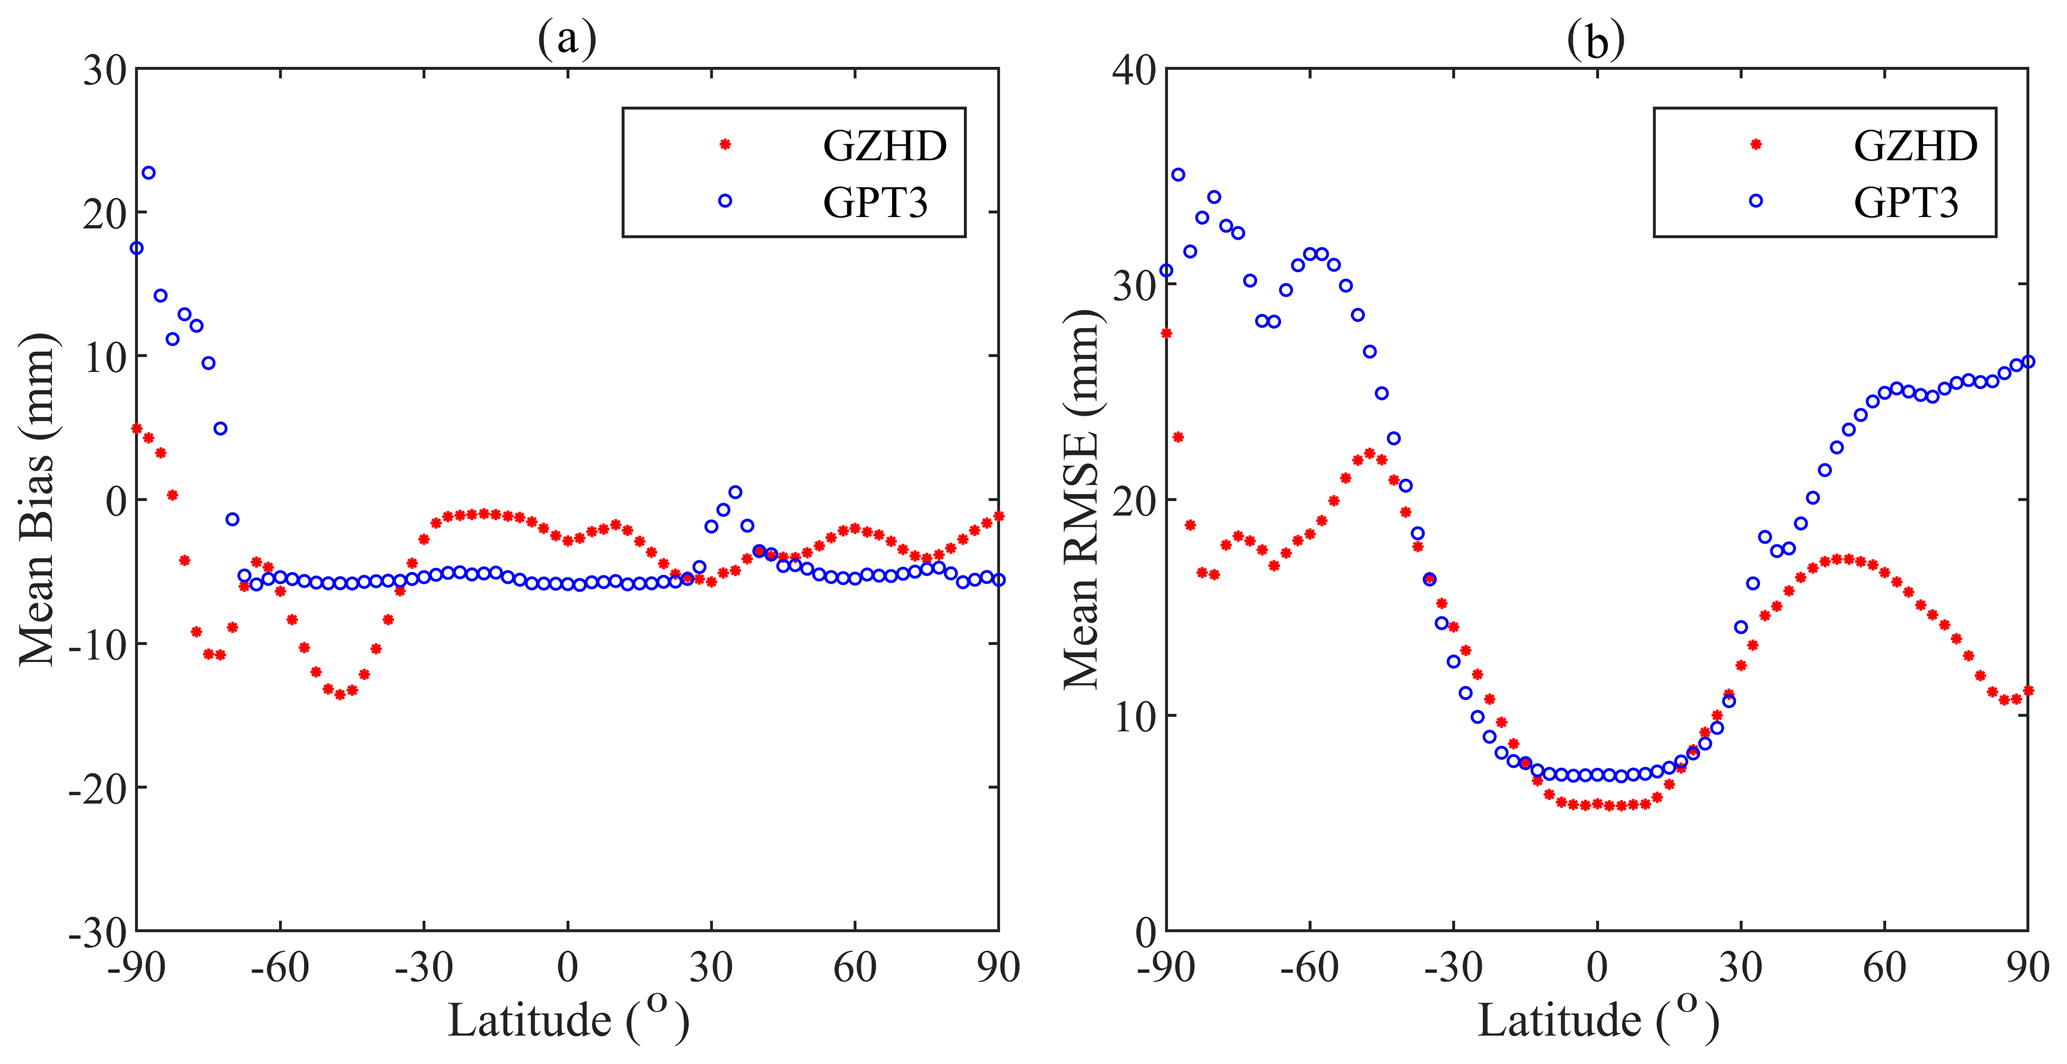
Figure 9Mean biases (a) and RMSEs (b) of two model-derived ZHDs during the 20-year period of 2000–2019 in different latitude ranges (with a 2.5∘ interval).
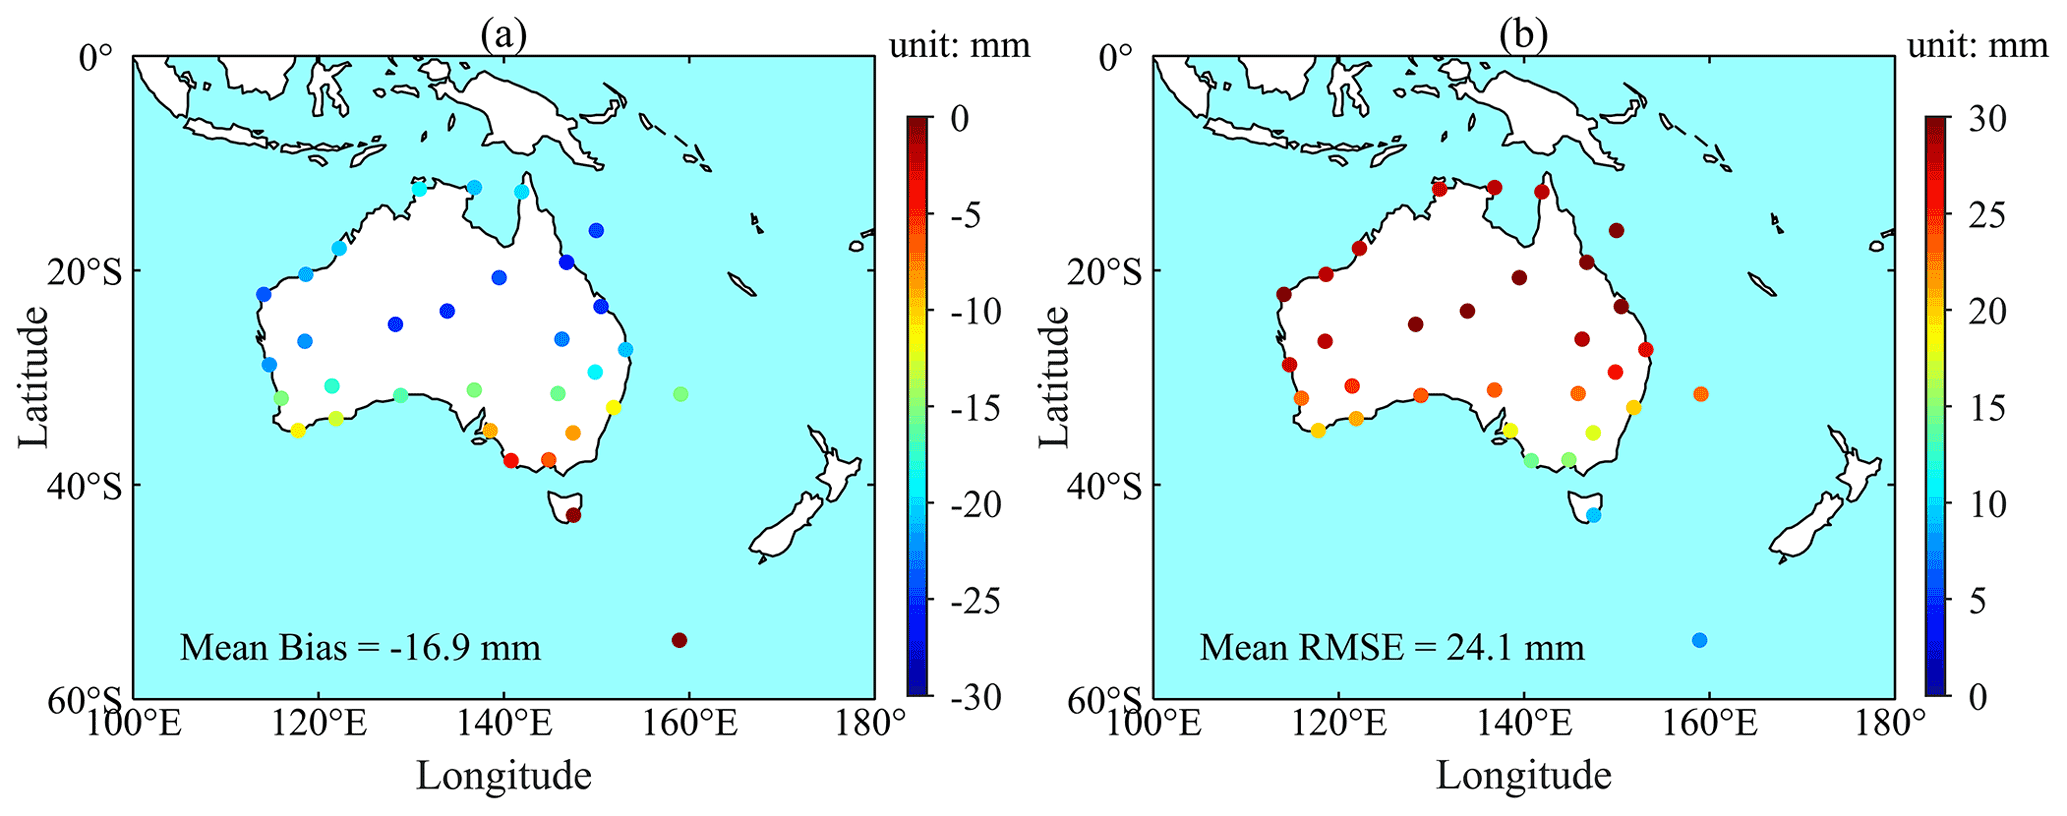
Figure 10Bias (a) and RMSE (b) between ZHD-ERA5 and ZHD-RS during the 19-year period of 2000–2019 at each of the 32 radiosonde stations located in Australia.
It is worth mentioning that, from the results of the above two sections, in Australia, when ZHD-ERA5 was used as the reference, the bias and RMSE of ZHD-GZHD were larger than those of ZHD-GPT3. However, when ZHD-RS was used as the reference, the result was completely different. To investigate the cause of the difference, the two sets of ZHD reference values at 32 radiosonde stations located in Australia were compared and results are shown in Fig. 10. It can be seen that both the bias (in a) and RMSE (in b) were large, at most stations the biases were negative with a (absolute) value above 10 mm, and the RMSEs at all stations were above 10 mm. The mean of all biases and RMSEs were −16.9 and 24.1 mm, respectively. The large negative biases suggest a significant underestimation of ZHD-ERA5 in the region. This might be caused by the assimilation algorithm and/or other assimilated data, although radiosonde data have been assimilated into ERA5. When ZHD-ERA5 was used as the reference, ZHD-GPT3 agreed well with ZHD-ERA5 and much better than the new model developed in this study since GPT3 was based on ERA-Interim data (the last generation of the reanalysis data set provided by ECMWF).
3.3 Results in different period
To evaluate the accuracy of the GZHD model, the ZHD-GZHD and ZHD-GPT3 at 371 radiosonde stations and each global grid point (with the horizontal resolution of ) during the 1-year period of 2020 were compared against the references of ZHD-RS and ZHD-ERA5, respectively. Results are shown in Figs. 11 and 12.

Figure 11Bias (a1) and RMSE (b1) of ZHD-GPT3 and bias (a2) and RMSE (b2) of ZHD-GZHD at each of the 371 radiosonde stations during the 1-year period of 2020 (reference: ZHD-RS, the dots stand for the radiosonde stations that were used in the construction of GZHD, while the triangles stand for the radiosonde stations that were not used in the construction of GZHD).
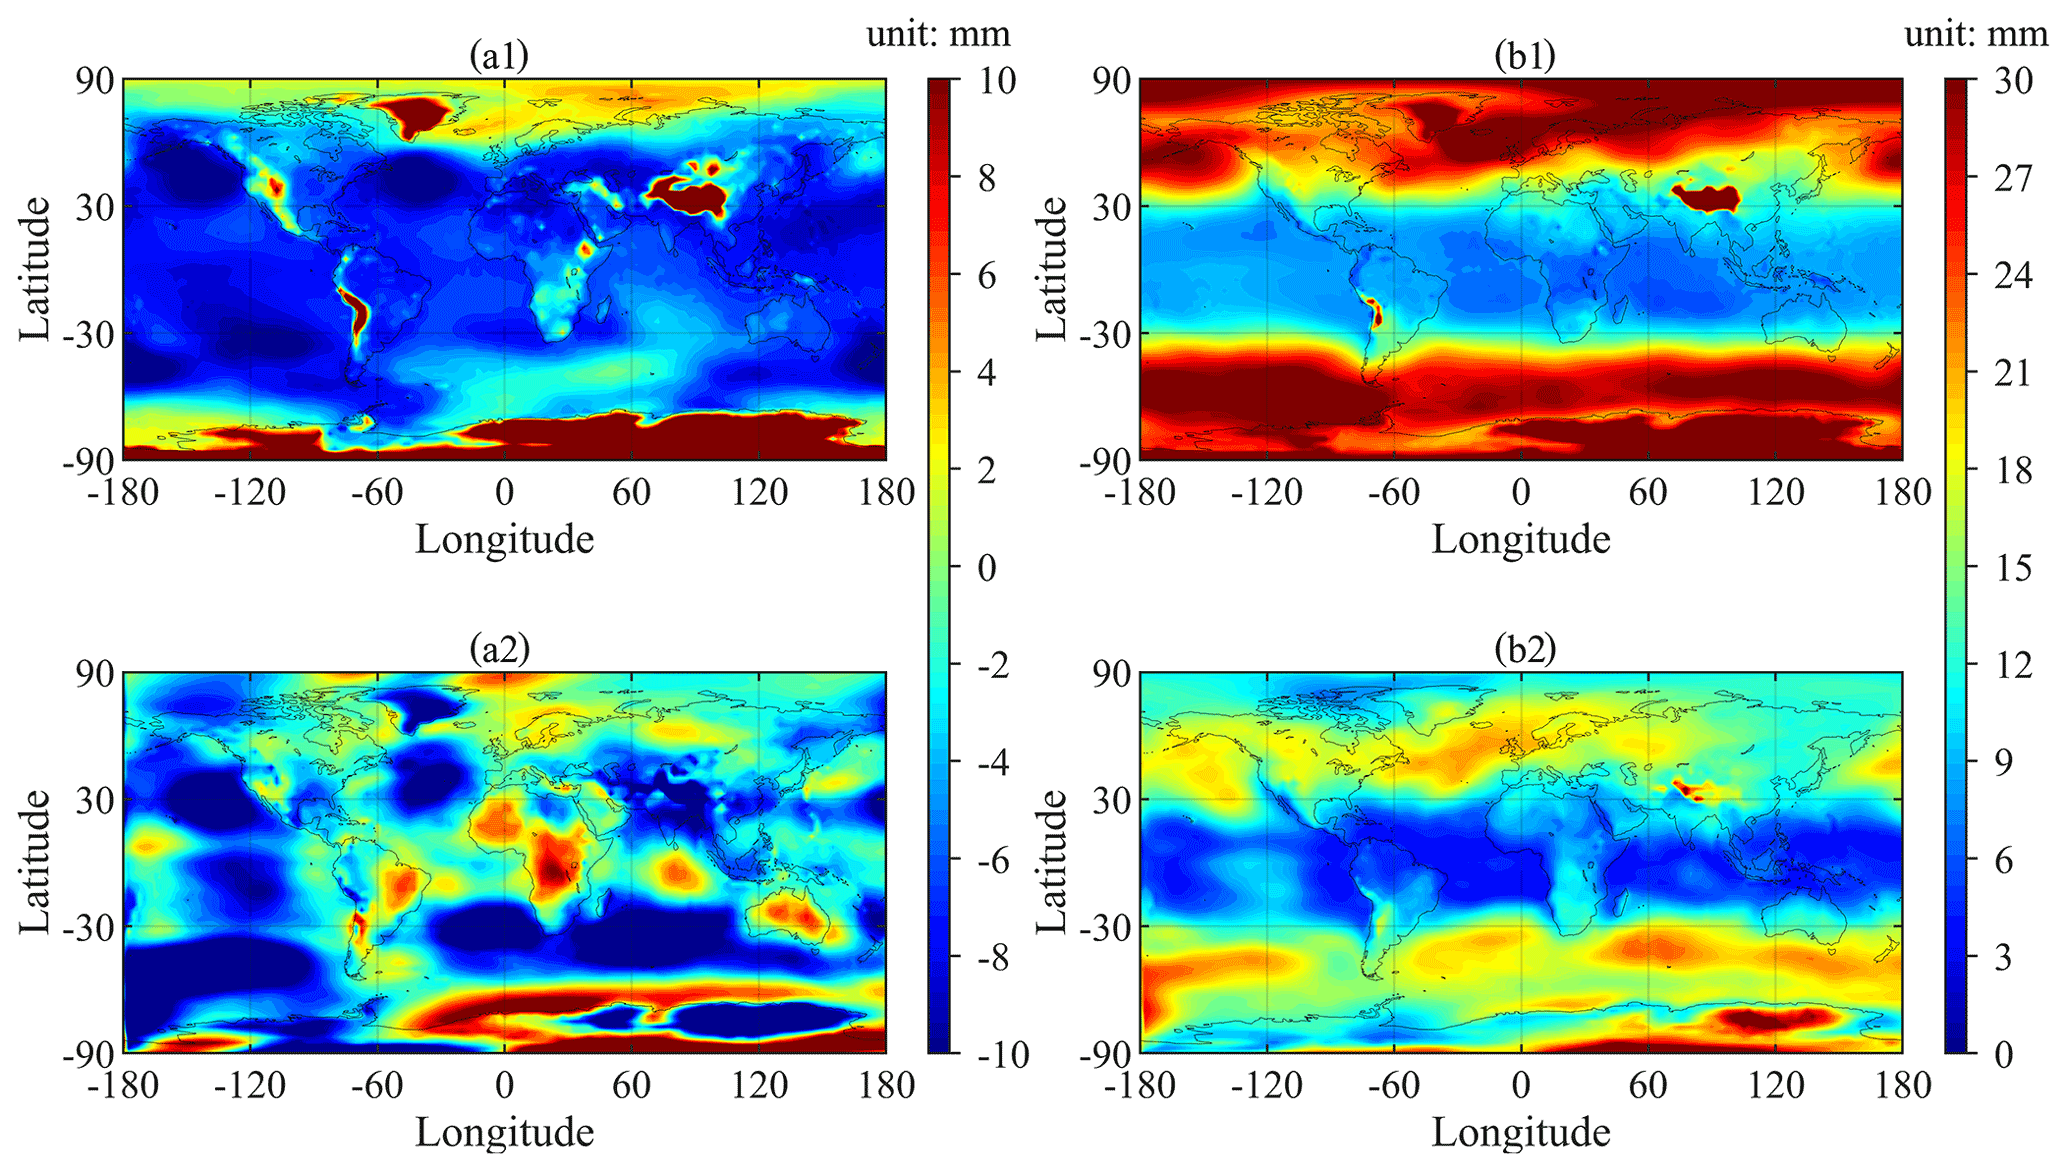
Figure 12Bias (a1) and RMSE (b1) of ZHD-GPT3 and bias (a2) and RMSE (b2) of ZHD-GZHD over each global grid point (the horizontal resolution: ) during the 1-year period of 2020 (reference: ZHD-ERA5).
In Fig. 11, the biases and RMSEs of ZHD-GZHD were smaller than those of ZHD-GPT3 at most radiosonde stations, which was similar to the results of Sect. 3.1, and Fig. 12 also shows the same results as Fig. 8. These results indicate that GZHD outperformed GPT3 in 2020 during which no data were used in the construction or training of the new model, i.e., the test data were out-of-sample data. In summary, when ZHD-RS was used as the reference, the mean RMSE of ZHD-GZHD in 2020 was 13.2 mm, while that of ZHD-GPT3 was 17.0 mm. When ZHD-ERA5 was used as the reference, the mean RMSE of ZHD-GZHD in 2020 was 13.4 mm, while that of ZHD-GPT3 was 20.6 mm.
3.4 Result of PWV
The effect of GZHD on PWV derived from GNSS in real time was assessed using data from 41 global IGS stations in the 154 d period from 1 January to 30 June 2020 since co-located radiosonde stations could be found for these GNSS stations. The PWV derived from sounding data of these radiosonde stations, named PWV-RS, was used as the reference in the evaluation of the PWVs resulting from the ZHDs derived from the two previously tested models – GZHD and GPT3, named PWV-GZHD and PWV-GPT3, respectively. It is noted that the ZTD estimated in real time and Tm derived from GGNTm, a new global grid-based empirical Tm model (Sun et al., 2021a), were used to retrieve the GNSS-derived PWVs. The bias and RMSE of the PWV-GZHD and PWV-GPT3 at each station are shown in Fig. 11.
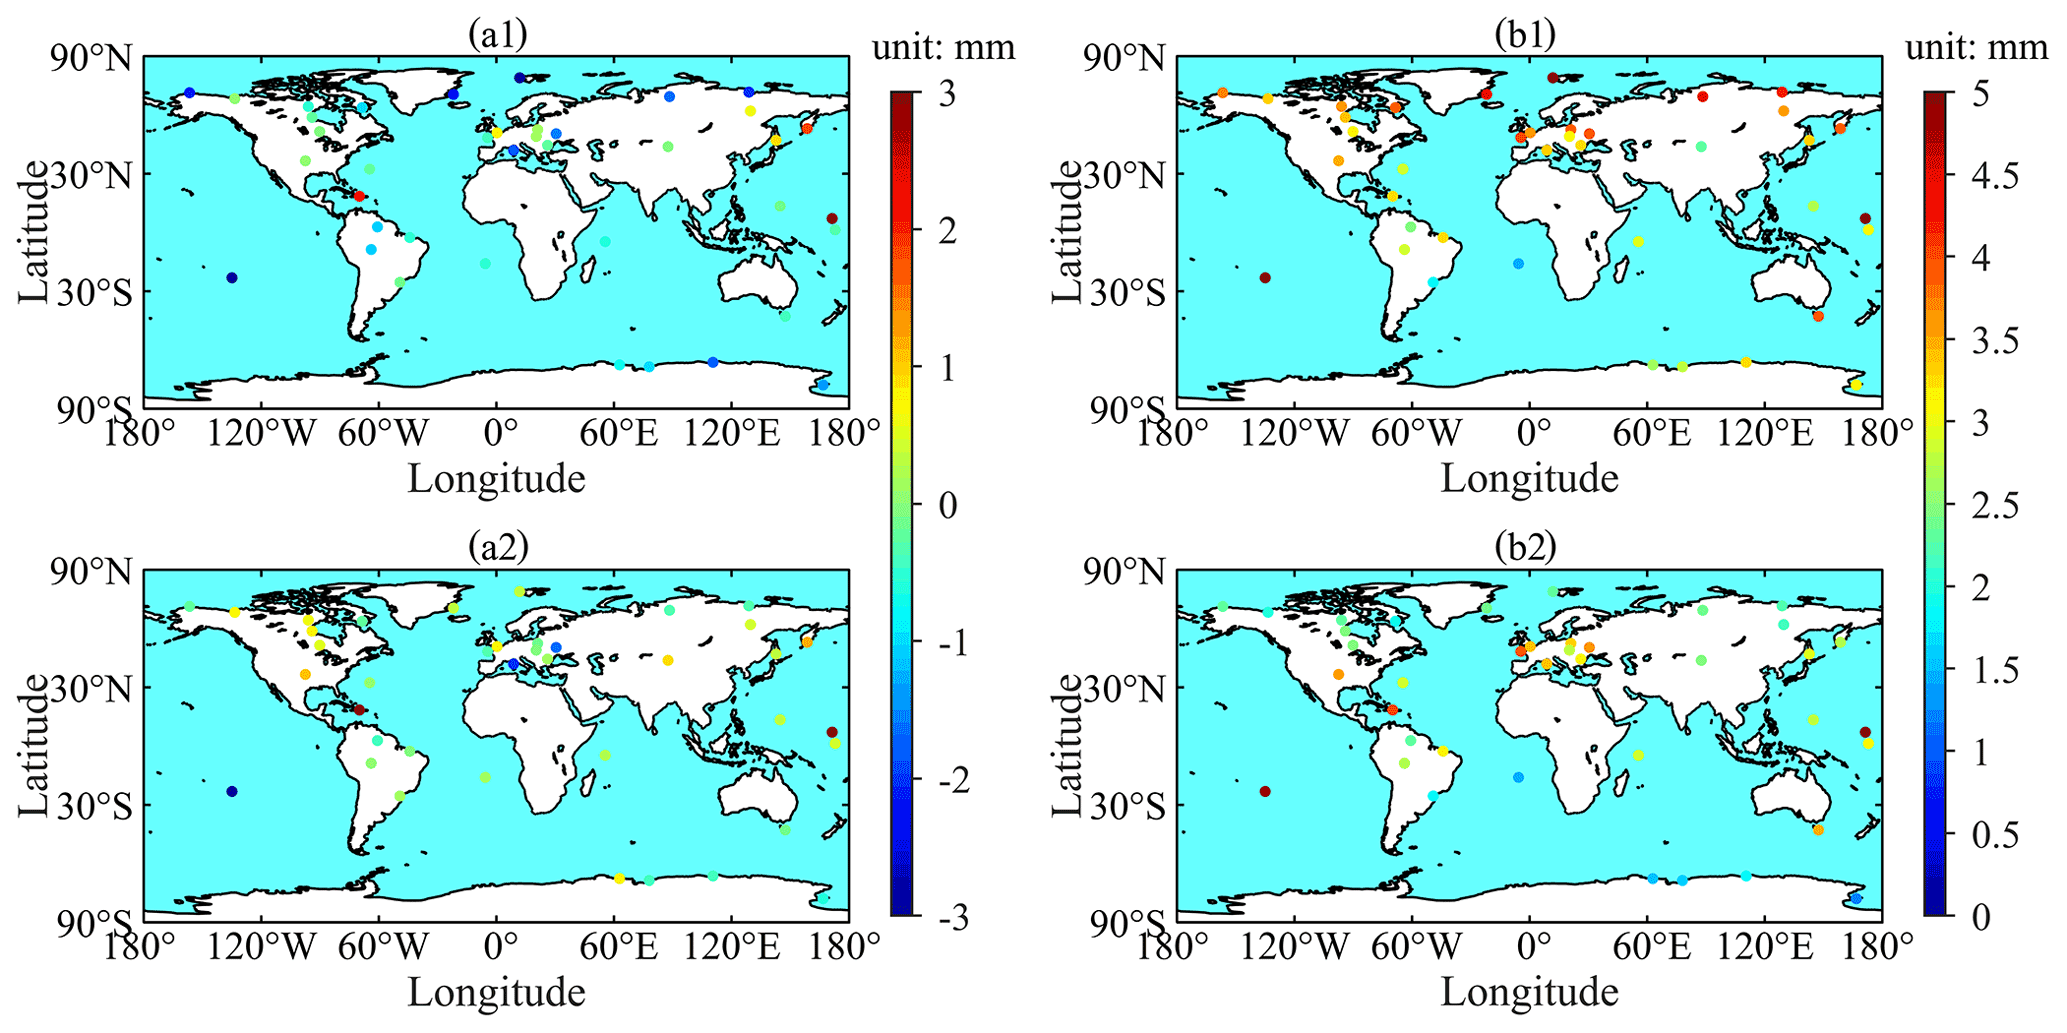
Figure 13Bias (a1) and RMSE (b1) of PWV-GPT3 and bias (a2) and RMSE (b2) of PWV-GZHD in the 154 d period from 1 January to 30 June 2020 at each of the 41 global IGS stations (reference: PWV-RS).
Figure 13a1 shows the biases of PWV-GPT3 ranged from −4.3 to 3.3 mm with the mean of −0.6 mm, and the biases of PWV-GZHD in a2 ranged from −3.2 to 4.0 mm with the mean of 0.2 mm. Comparing the two panels, one can find that at some stations the bias of PWV-GZHD was slightly larger than that of PWV-GPT3, and such a small difference can be neglected.
Figure 13b1 shows the RMSEs of PWV-GPT3 varied from 1.5 to 5.6 mm with the mean of 3.4 mm, and the stations where the RMSEs were large are mainly distributed in mid- and high-latitude regions. Figure 13b2 shows the RMSEs of PWV-GZHD varied from 0.8 to 5.6 mm with the mean of 2.7 mm. The RMSE of PWV-GZHD hardly had a dependency upon latitude, and it was less than that of PWV-GPT3 at most stations (33 of the 41 stations). In addition, at 28 of the 41 stations, the RMSEs of PWV-GZHD were less than 3 mm, which is the threshold suggested by the EUMETNET EIG GNSS water vapor program for the accuracy of PWV required for meteorological research (Offiler et al., 2020). However, there were only 11 stations where the RMSEs of PWV-GPT3 were less than the threshold. The improvement in the accuracy of the GNSS-derived PWV made by GZHD was 21 %, in comparison with GPT3, which is a significant improvement.
The accuracy of the ZHD could significantly affect the quality of the ZWD from which PWV is converted using a conversion factor. The ZHD is usually obtained from a standard model – a function of the surface pressure measured by a meteorological sensor at the site of the GNSS station, and the accuracy of the ZHD is generally as high as at a millimeter level. However, not all GNSS stations are equipped with such a meteorological sensor. In addition, a majority of GNSS stations are not close to any weather stations, and thus there are no surface pressure measurements available for these stations. In this case, blind models, such as a series of GPT models, are often used to obtain surface pressures. As a result, the accuracy of the model-derived ZHD is limited, especially in mid- and high-latitude regions. To address this issue, a new ZHD model was developed in this study using the following technique.
First, the ratio of the ZHD to ZTD was analyzed using the Lomb–Scargle periodogram at 505 global radiosonde stations at each of which the number of samples was over 5000. Their ratio time series showed significant annual and semiannual periodicities, and the annual amplitude was related to the geolocation of the station. Then, a new ZHD model, GZHD, was developed using the BP-ANN technique and sounding data from 558 global radiosonde stations, together with RO data from COSMIC-1. In the GZHD model, not only the seasonal and spatial variation in the ZHD but also the relationship between the ZHD and ZTD were taken into consideration. More specifically, the ZTD was used as an input variable for the network for the modeling.
The newly developed GZHD model was assessed using two sets of references, ZHD-RS and ZHD-ERA5, and the performance of the model was also compared with GPT3. Results showed that the new model significantly outperformed GPT3, especially in mid- and high-latitude regions, and the improvements in the accuracy of the ZHD-GZHD were about 21 % and 30 % in comparison with ZHD-GPT3 based on the references of ZHD-RS and ZHD-ERA5, respectively. In addition, the effect of the ZHD-GZHD on PWV retrieved from 41 global GNSS stations that are equipped with meteorological sensors was also evaluated using PWV-RS as the reference. Results showed that, compared with PWV-GPT3, the accuracy of the PWV-GZHD was improved by 21 %, which is significant. These results suggest the promising potential of the GZHD model for a better GNSS-derived PWV for the GNSS stations that are not equipped with meteorological sensors, especially for the real-time mode.
Our future work will be using ERA5 data in the construction of the new model to improve its performance in the Southern Hemisphere.
Radiosonde data can be downloaded from ftp://ftp.ncdc.noaa.gov/pub/data/igra/derived/derived-por/ (National Climate Data Center, 2021), COSMIC RO data are available via https://data.cosmic.ucar.edu/gnss-ro/cosmic1/repro2013/ (UCAR, 2020), ERA5 hourly data are provided by ECMWF via https://doi.org/10.24381/cds.bd0915c6 (Hersbach et al., 2018), and GNSS data are available from ftp://igs.gnsswhu.cn/pub/gps/data/daily/ (International GNSS Service, 2020).
LL designed the experiments and wrote the original draft. SW, KZ, XW, and WL reviewed and edited the manuscript. ZS, DZ, QH, and MW processed the RO data, radiosonde data, GNSS data, and the ERA5 reanalysis data, respectively.
The contact author has declared that neither they nor their co-authors have any competing interests.
Publisher's note: Copernicus Publications remains neutral with regard to jurisdictional claims in published maps and institutional affiliations.
We would like to thank ECMWF, NCDC, UCAR, and IGS for providing ERA5 reanalysis data, radiosonde data, RO data, and GNSS data, respectively.
This research has been supported by the National Natural Science Foundation of China (grant nos. 41730109, 41874040), the Natural Science Foundation of Jiangsu Province (grant no. BK20200646), the Jiangsu Planned Projects for Postdoctoral Research Funds (grant no. 2021K173B), the Fundamental Research Funds for the Central Universities (grant no. 2020QN31), and the Xuzhou Key Project (grant no. KC19111).
This paper was edited by Roeland Van Malderen and reviewed by two anonymous referees.
Askne, J. and Nordius, H.: Estimation of tropospheric delay for microwaves from surface weather data, Radio Sci., 22, 379–386, https://doi.org/10.1029/RS022i003p00379, 1987.
Bevis, M., Businger, S., Herring, T. A., Rocken, C., Anthes, R. A., and Ware, R. H.: GPS meteorology: Remote sensing of atmospheric water vapor using the global positioning system, J. Geophys. Res., 97, 15787, https://doi.org/10.1029/92JD01517, 1992.
Böhm, J., Heinkelmann, R., and Schuh, H.: Short Note: A global model of pressure and temperature for geodetic applications, J. Geodesy, 81, 679–683, https://doi.org/10.1007/s00190-007-0135-3, 2007.
Böhm, J., Möller, G., Schindelegger, M., Pain, G., and Weber, R.: Development of an improved empirical model for slant delays in the troposphere (GPT2w), GPS Solut., 19, 433–441, https://doi.org/10.1007/s10291-014-0403-7, 2015.
Bosser, P., Bock, O., Pelon, J., and Thom, C.: An Improved Mean-Gravity Model for GPS Hydrostatic Delay Calibration, IEEE Geosci. Remote S., 4, 3–7, https://doi.org/10.1109/LGRS.2006.881725, 2007.
Charoenphon, C. and Satirapod, C.: Improving the accuracy of realtime precipitable water vapour using country-wide meteorological model with precise point positioning in Thailand, J. Spat. Sci., 2020, 1–17, https://doi.org/10.1080/14498596.2020.1758969, 2020.
Davis, J. L., Herring, T. A., Shapiro, I. I., Rogers, A. E. E., and Elgered, G.: Geodesy by radio interferometry: Effects of atmospheric modeling errors on estimates of baseline length, Radio Sci., 20, 1593–1607, https://doi.org/10.1029/RS020i006p01593, 1985.
Ding, M.: A neural network model for predicting weighted mean temperature, J. Geodesy, 92, 1187–1198, https://doi.org/10.1007/s00190-018-1114-6, 2018.
Durre, I., Vose, R. S., and Wuertz, D. B.: Overview of the Integrated Global Radiosonde Archive, J. Climate, 19, 53–68, https://doi.org/10.1175/JCLI3594.1, 2006.
Gurbuz, G., Aktug, B., Jin, S., and Kutoglu, S. H.: A GNSS-based near real time automatic Earth Crust and Atmosphere Monitoring Service for Turkey, Adv. Space Res., 66, 2854–2864, https://doi.org/10.1016/j.asr.2020.07.026, 2020.
He, C., Wu, S., Wang, X., Hu, A., Wang, Q., and Zhang, K.: A new voxel-based model for the determination of atmospheric weighted mean temperature in GPS atmospheric sounding, Atmos. Meas. Tech., 10, 2045–2060, https://doi.org/10.5194/amt-10-2045-2017, 2017.
Hersbach, H., Bell, B., Berrisford, P., Biavati, G., Horányi, A., Muñoz Sabater, J., Nicolas, J., Peubey, C., Radu, R., Rozum, I., Schepers, D., Simmons, A., Soci, C., Dee, D., and Thépaut, J-N.: ERA5 hourly data on pressure levels from 1979 to present, Copernicus Climate Change Service (C3S) Climate Data Store (CDS) [data set], https://doi.org/10.24381/cds.bd0915c6, 2018.
International GNSS Service: GNSS data and products archive, International GNSS Service [data set], available at: ftp://igs.gnsswhu.cn/pub/gps/data/daily/, last access: 30 June 2020.
Jiang, P., Ye, S., Chen, D., Liu, Y., and Xia, P.: Retrieving Precipitable Water Vapor Data Using GPS Zenith Delays and Global Reanalysis Data in China, Remote Sens., 8, 389, https://doi.org/10.3390/rs8050389, 2016.
Jin, S., Park, J.-U., Cho, J.-H., and Park, P.-H.: Seasonal variability of GPS-derived zenith tropospheric delay (1994–2006) and climate implications, J. Geophys. Res., 112, D09110, https://doi.org/10.1029/2006JD007772, 2007.
Katsougiannopoulos, S. and Pikridas, C.: Prediction of zenith tropospheric delay by multi-layer perceptron, Journal of Applied Geodesy, 3, 223–229, https://doi.org/10.1515/JAG.2009.022, 2009.
Lagler, K., Schindelegger, M., Böhm, J., Krásná, H., and Nilsson, T.: GPT2: Empirical slant delay model for radio space geodetic techniques, Geophys. Res. Lett., 40, 1069–1073, https://doi.org/10.1002/grl.50288, 2013.
Landskron, D. and Böhm, J.: VMF3/GPT3: refined discrete and empirical troposphere mapping functions, J. Geodesy, 92, 349–360, https://doi.org/10.1007/s00190-017-1066-2, 2018.
Li, H., Wang, X., Wu, S., Zhang, K., Chen, X., Qiu, C., Zhang, S., Zhang, J., Xie, M., and Li, L.: Development of an Improved Model for Prediction of Short-Term Heavy Precipitation Based on GNSS-Derived PWV, Remote Sens., 12, 4101, https://doi.org/10.3390/rs12244101, 2020.
Li, J., Cheng, J., Shi, J., and Huang, F.: Brief Introduction of Back Propagation (BP) Neural Network Algorithm and Its Improvement, in: Advances in Computer Science and Information Engineering, vol. 169, edited by: Jin, D. and Lin, S., Springer, Berlin, Heidelberg, 553–558, https://doi.org/10.1007/978-3-642-30223-7_87, 2012a.
Li, T., Wang, L., Chen, R., Fu, W., Xu, B., Jiang, P., Liu, J., Zhou, H., and Han, Y.: Refining the empirical global pressure and temperature model with the ERA5 reanalysis and radiosonde data, J. Geodesy, 95, 31, https://doi.org/10.1007/s00190-021-01478-9, 2021.
Li, W., Yuan, Y., Ou, J., Li, H., and Li, Z.: A new global zenith tropospheric delay model IGGtrop for GNSS applications, Chinese Sci. Bull., 57, 2132–2139, https://doi.org/10.1007/s11434-012-5010-9, 2012b.
Luo, X., Heck, B., and Awange, J. L.: Improving the estimation of zenith dry tropospheric delays using regional surface meteorological data, Adv. Space Res., 52, 2204–2214, https://doi.org/10.1016/j.asr.2013.09.005, 2013.
National Climate Data Center: IGRA data, National Climate Data Center [data set], available at: ftp://ftp.ncdc.noaa.gov/pub/data/igra/derived/derived-por/, last access: 30 July 2021.
Offiler, D., Jones, J., Bennit, G., and Vedel, H.: EIG EUMETNET GNSS Water Vapour Programme (E-GVAP-II), Prod. Requir. Doc. MetOffice, available at http://egvap.dmi.dk/support/formats/egvap_prd_v10.pdf, last accessed: 19 July 2020.
Ross, R. J. and Rosenfeld, S.: Estimating mean weighted temperature of the atmosphere for Global Positioning System applications, J. Geophys. Res., 102, 21719–21730, https://doi.org/10.1029/97JD01808, 1997.
Singh, D., Ghosh, J. K., and Kashyap, D.: Weighted mean temperature model for extra tropical region of India, J. Atmos. Sol.-Terr. Phy., 107, 48–53, https://doi.org/10.1016/j.jastp.2013.10.016, 2014.
Sun, P., Wu, S., Zhang, K., Wan, M., and Wang, R.: A new global grid-based weighted mean temperature model considering vertical nonlinear variation, Atmos. Meas. Tech., 14, 2529–2542, https://doi.org/10.5194/amt-14-2529-2021, 2021a.
Sun, P., Zhang, K., Wu, S., Wang, R., and Wan, M.: An investigation of real-time GPS/GLONASS single-frequency precise point positioning and its atmospheric mitigation strategies, Meas. Sci. Technol., 32, 115018, https://doi.org/10.1088/1361-6501/ac0a0e, 2021b.
Tetzner, D., Thomas, E., and Allen, C.: A Validation of ERA5 Reanalysis Data in the Southern Antarctic Peninsula–Ellsworth Land Region, and Its Implications for Ice Core Studies, Geosciences, 9, 289, https://doi.org/10.3390/geosciences9070289, 2019.
Thayer, G. D.: An improved equation for the radio refractive index of air, Radio Sci., 9, 803–807, https://doi.org/10.1029/RS009i010p00803, 1974.
University Corporation for Atmospheric Research (UCAR): COSMIC RO data, University Corporation for Atmospheric Research, [data set], available at: https://data.cosmic.ucar.edu/gnss-ro/cosmic1/repro2013/, last access: 9 December 2020.
Wang, X., Zhang, K., Wu, S., Fan, S., and Cheng, Y.: Water vapor-weighted mean temperature and its impact on the determination of precipitable water vapor and its linear trend: Water Vapor-Weighted Mean Temperature, J. Geophys. Res. Atmos., 121, 833–852, https://doi.org/10.1002/2015JD024181, 2016.
Wang, X., Zhang, K., Wu, S., He, C., Cheng, Y., and Li, X.: Determination of zenith hydrostatic delay and its impact on GNSS-derived integrated water vapor, Atmos. Meas. Tech., 10, 2807–2820, https://doi.org/10.5194/amt-10-2807-2017, 2017.
Yao, Y., Zhu, S., and Yue, S.: A globally applicable, season-specific model for estimating the weighted mean temperature of the atmosphere, J. Geodesy, 86, 1125–1135, https://doi.org/10.1007/s00190-012-0568-1, 2012.
Yao, Y., Zhang, B., Xu, C., and Chen, J.: Analysis of the global Tm–Ts correlation and establishment of the latitude-related linear model, Chinese Sci. Bull., 59, 2340–2347, https://doi.org/10.1007/s11434-014-0275-9, 2014.
Zhang, D., Guo, J., Chen, M., Shi, J., and Zhou, L.: Quantitative assessment of meteorological and tropospheric Zenith Hydrostatic Delay models, Adv. Space Res., 58, 1033–1043, https://doi.org/10.1016/j.asr.2016.05.055, 2016.
Zhang, H., Pu, Z., and Zhang, X.: Examination of Errors in Near-Surface Temperature and Wind from WRF Numerical Simulations in Regions of Complex Terrain, Weather Forecast., 28, 893–914, https://doi.org/10.1175/WAF-D-12-00109.1, 2013.
Zhang, H., Yuan, Y., Li, W., Ou, J., Li, Y., and Zhang, B.: GPS PPP-derived precipitable water vapor retrieval based on Tm/Ps from multiple sources of meteorological data sets in China: GPS-PWV Retrieval on Multiple Data Sets, J. Geophys. Res. Atmos., 122, 4165–4183, https://doi.org/10.1002/2016JD026000, 2017.
Zhang, W., Zhang, H., Liang, H., Lou, Y., Cai, Y., Cao, Y., Zhou, Y., and Liu, W.: On the suitability of ERA5 in hourly GPS precipitable water vapor retrieval over China, J. Geodesy, 93, 1897–1909, https://doi.org/10.1007/s00190-019-01290-6, 2019.