the Creative Commons Attribution 4.0 License.
the Creative Commons Attribution 4.0 License.
 | 28 Jan 2021
Estimation of pollen counts from light scattering intensity when sampling multiple pollen taxa – establishment of an automated multi-taxa pollen counting estimation system (AME system)
Shigeto Kawashima
Laser optics have long been used in pollen counting systems. To clarify the limitations and potential new applications of laser optics for automatic pollen counting and discrimination, we determined the light scattering patterns of various pollen types, tracked temporal changes in these distributions, and introduced a new theory for automatic pollen discrimination. Our experimental results indicate that different pollen types often have different light scattering characteristics, as previous research has suggested. Our results also show that light scattering distributions did not undergo significant temporal changes. Further, we show that the concentration of two different types of pollen could be estimated separately from the total number of pollen grains by fitting the light scattering data to a probability density curve. These findings should help realize a fast and simple automatic pollen monitoring system.
- Article
(3798 KB) - Full-text XML
- BibTeX
- EndNote


Pollen counting is a time-consuming and labor-intensive task that requires professional skills. However, recent technological developments have made automatic pollen sampling and identification possible (Buters et al., 2018), for example, with recognition systems using microscopic images of pollen grains (Boucher et al., 2002; Ranzato et al., 2007; Oteros et al., 2015), pollen color patterns from pollen images (Landsmeer et al., 2009), fluorescence emission signals (Swanson and Huffman 2018; Mitsumoto et al., 2009; Mitsumoto et al., 2010; Richardson et al., 2019), light scattering (Crouzy et al., 2016; Šaulienė et al., 2019), holographic images (Sauvageat et al., 2020), size and morphological characteristics (O'Connor et al., 2013), real-time PCR (Longhi et al., 2009), texture and infrared patterns of microscopic images of pollen (Marcos et al., 2015; Gottardini et al., 2007; Chen et al., 2006), or a combination of several of these. Many studies applied machine learning algorithms to the problem (Punyasena et al., 2012; Tcheng et al., 2016; Crouzy et al., 2016; Gonçalves et al., 2016; Gallardo-Caballero et al., 2019; Šaulienė et al., 2019). These automated pollen identification methods have been applied not only to aerobiological research but also to palynological studies for the identification of fossilized pollen (France et al., 2000; Kaya et al., 2014; Li et al., 2004; Zhang et al., 2004; Rodríguez-Daminán et al., 2006).
Analysis using light scattering patterns has a particular focus, with several methods being developed for establishing an automatic aerosol or bioaerosol counting system (Huffman et al., 2016). For example, polarization signals can be used to discriminate Cryptomeria japonica from polystyrene spherical particles (Iwai, 2013). Studies applying machine learning algorithms have shown that light scattering patterns can be used for automatic classification and counting of multiple pollen taxa simultaneously (Crouzy et al., 2016; Sauliene et al., 2019). Other studies have applied statistical techniques to compare the light scattering data and number of multiple taxa pollen grains (Kawashima et al., 2007, 2017; Matsuda and Kawashima, 2018). Surbek et al. (2011) also studied the discrimination method for hazel, birch, willow, ragweed, and pine pollen showing that they have distinct characteristics in the backward and sideward light scattering patterns.
In the present study, light scattering patterns from various pollen taxa are investigated with a KH-3000-01 to verify whether they have different light scattering patterns. A novel method, the automated multi-taxa pollen counting estimation system (AME system), is also proposed to discriminate between two taxa with similar scattering patterns.
A protection cylinder (radius = 5 cm, height = 30 cm) was attached to the sampling tube of a KH-3000-01 laser-optics-based automatic pollen counter (Yamatronics, Japan). The KH-3000-01 is a widely used automatic pollen counting system (e.g. Wang et al., 2014; Takahashi et al., 2001; Miki et al., 2017, 2019; Kawashima et al., 2007, 2017; Matsuda and Kawashima 2018). A laser irradiates particles that pass through the sampling system and the forward and side scattering signals from each particle are recorded. In this study pollen grains from known taxa were injected through an injection tube in the wall of the protection cylinder and sampled in the KH-3000-01 (Fig. 1). The side and forward scattering intensities were evaluated by converting the light intensity into a voltage. The relationship between the light intensity and the physical properties, which are the size and roughness of the particle surface of sampled particle, was analyzed (Matsuda and Kawashima, 2018).
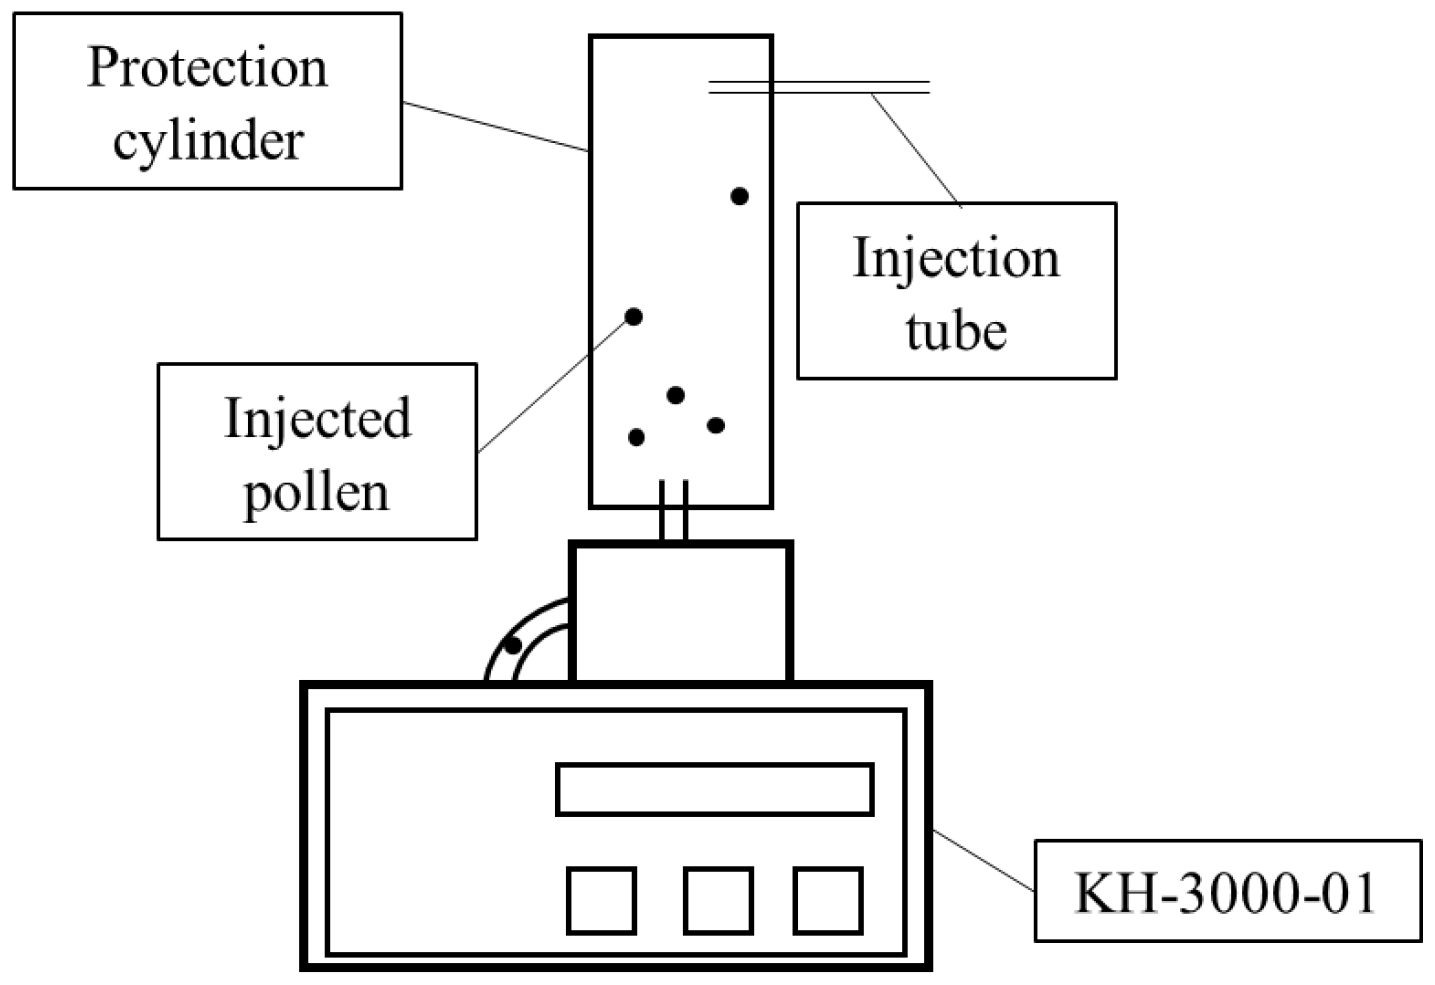
Figure 1Schematic drawing of device set-up. Laser irradiates pollen particles inside the KH-3000-01.
2.1 Temporal changes in light scattering patterns
Alnus pollen grains were directly sampled from catkins on a tree growing at the Swiss Federal Office of Meteorology and Climatology on a sunny morning on 28 February 2019. Light scattering measurements were taken using the fresh pollen grains soon after they were collected. The remaining pollen grains were stored in tubes, and scattering patterns were reevaluated after storing them for 1 h, 2 h, 6 h, and 10 d. Multiple comparisons using the Bonferroni method were performed on the side and forward scattering data to assess whether the light scattering distributions showed changes after storage. Bonferroni method is a multiple comparison method used for non-parametric data sets. In order to carry out the multiple comparisons, 316 scattering data of each taxa were picked up because the Bonferroni method requires the same amount of data of each taxa, and 316 scattering data were the smallest amount of data amongst each time step (10 d).
2.2 Light scattering patterns of different pollen taxa
Dried pollen grains from Alnus, Ambrosia, Artemisia, Betula, Castanea, Cedrus, Corylus, Fagus, Fraxinus, Helianthus, Olea, Phleum, Quercus, Taxus, and Zea were sampled in a similar way. These taxa are representative of the pollen types commonly observed in Europe. After collecting the light scattering distributions of each pollen type, multiple comparisons using the Bonferroni method were performed to evaluate whether these distributions differ significantly from each other. In order to carry out the multiple comparisons, 210 scattering data of each taxa were picked up based on the smallest amount of data amongst the taxon (Helianthus).
2.3 Automatic discrimination theory
To carry out simple and fast automatic pollen discrimination in an AME system, the number of pollen grains of each type from the total number of pollen grains was calculated as follows.
For two different types of pollen (A and B) in the side scattering intensity range a–b and in the forward scattering intensity range c–d, the following equation holds:
where P is the representative probability density function of the scattering intensity. p is the representative probability of the scattering intensity of each pollen grain lying in the integration intervals.
Next, the scattering intensity distribution that gives the number of pollen grains at each scattering intensity was fitted to a distribution function. In this experiment, the normal distribution was fitted to the number of pollen grains at every 100 mV step. The Gaussian function is written as follows:
where α and c are coefficients, μ is the mean, and σ is the standard deviation.
Fitting the data to the normal distribution function enables one to calculate the probability of a pollen grain showing a certain light scattering intensity. The probability density of the normal distribution function (P) is written as follows:
Fitting was performed by nonlinear optimization. The normal distribution was chosen so that we can handle the light scattering plots using a known function.
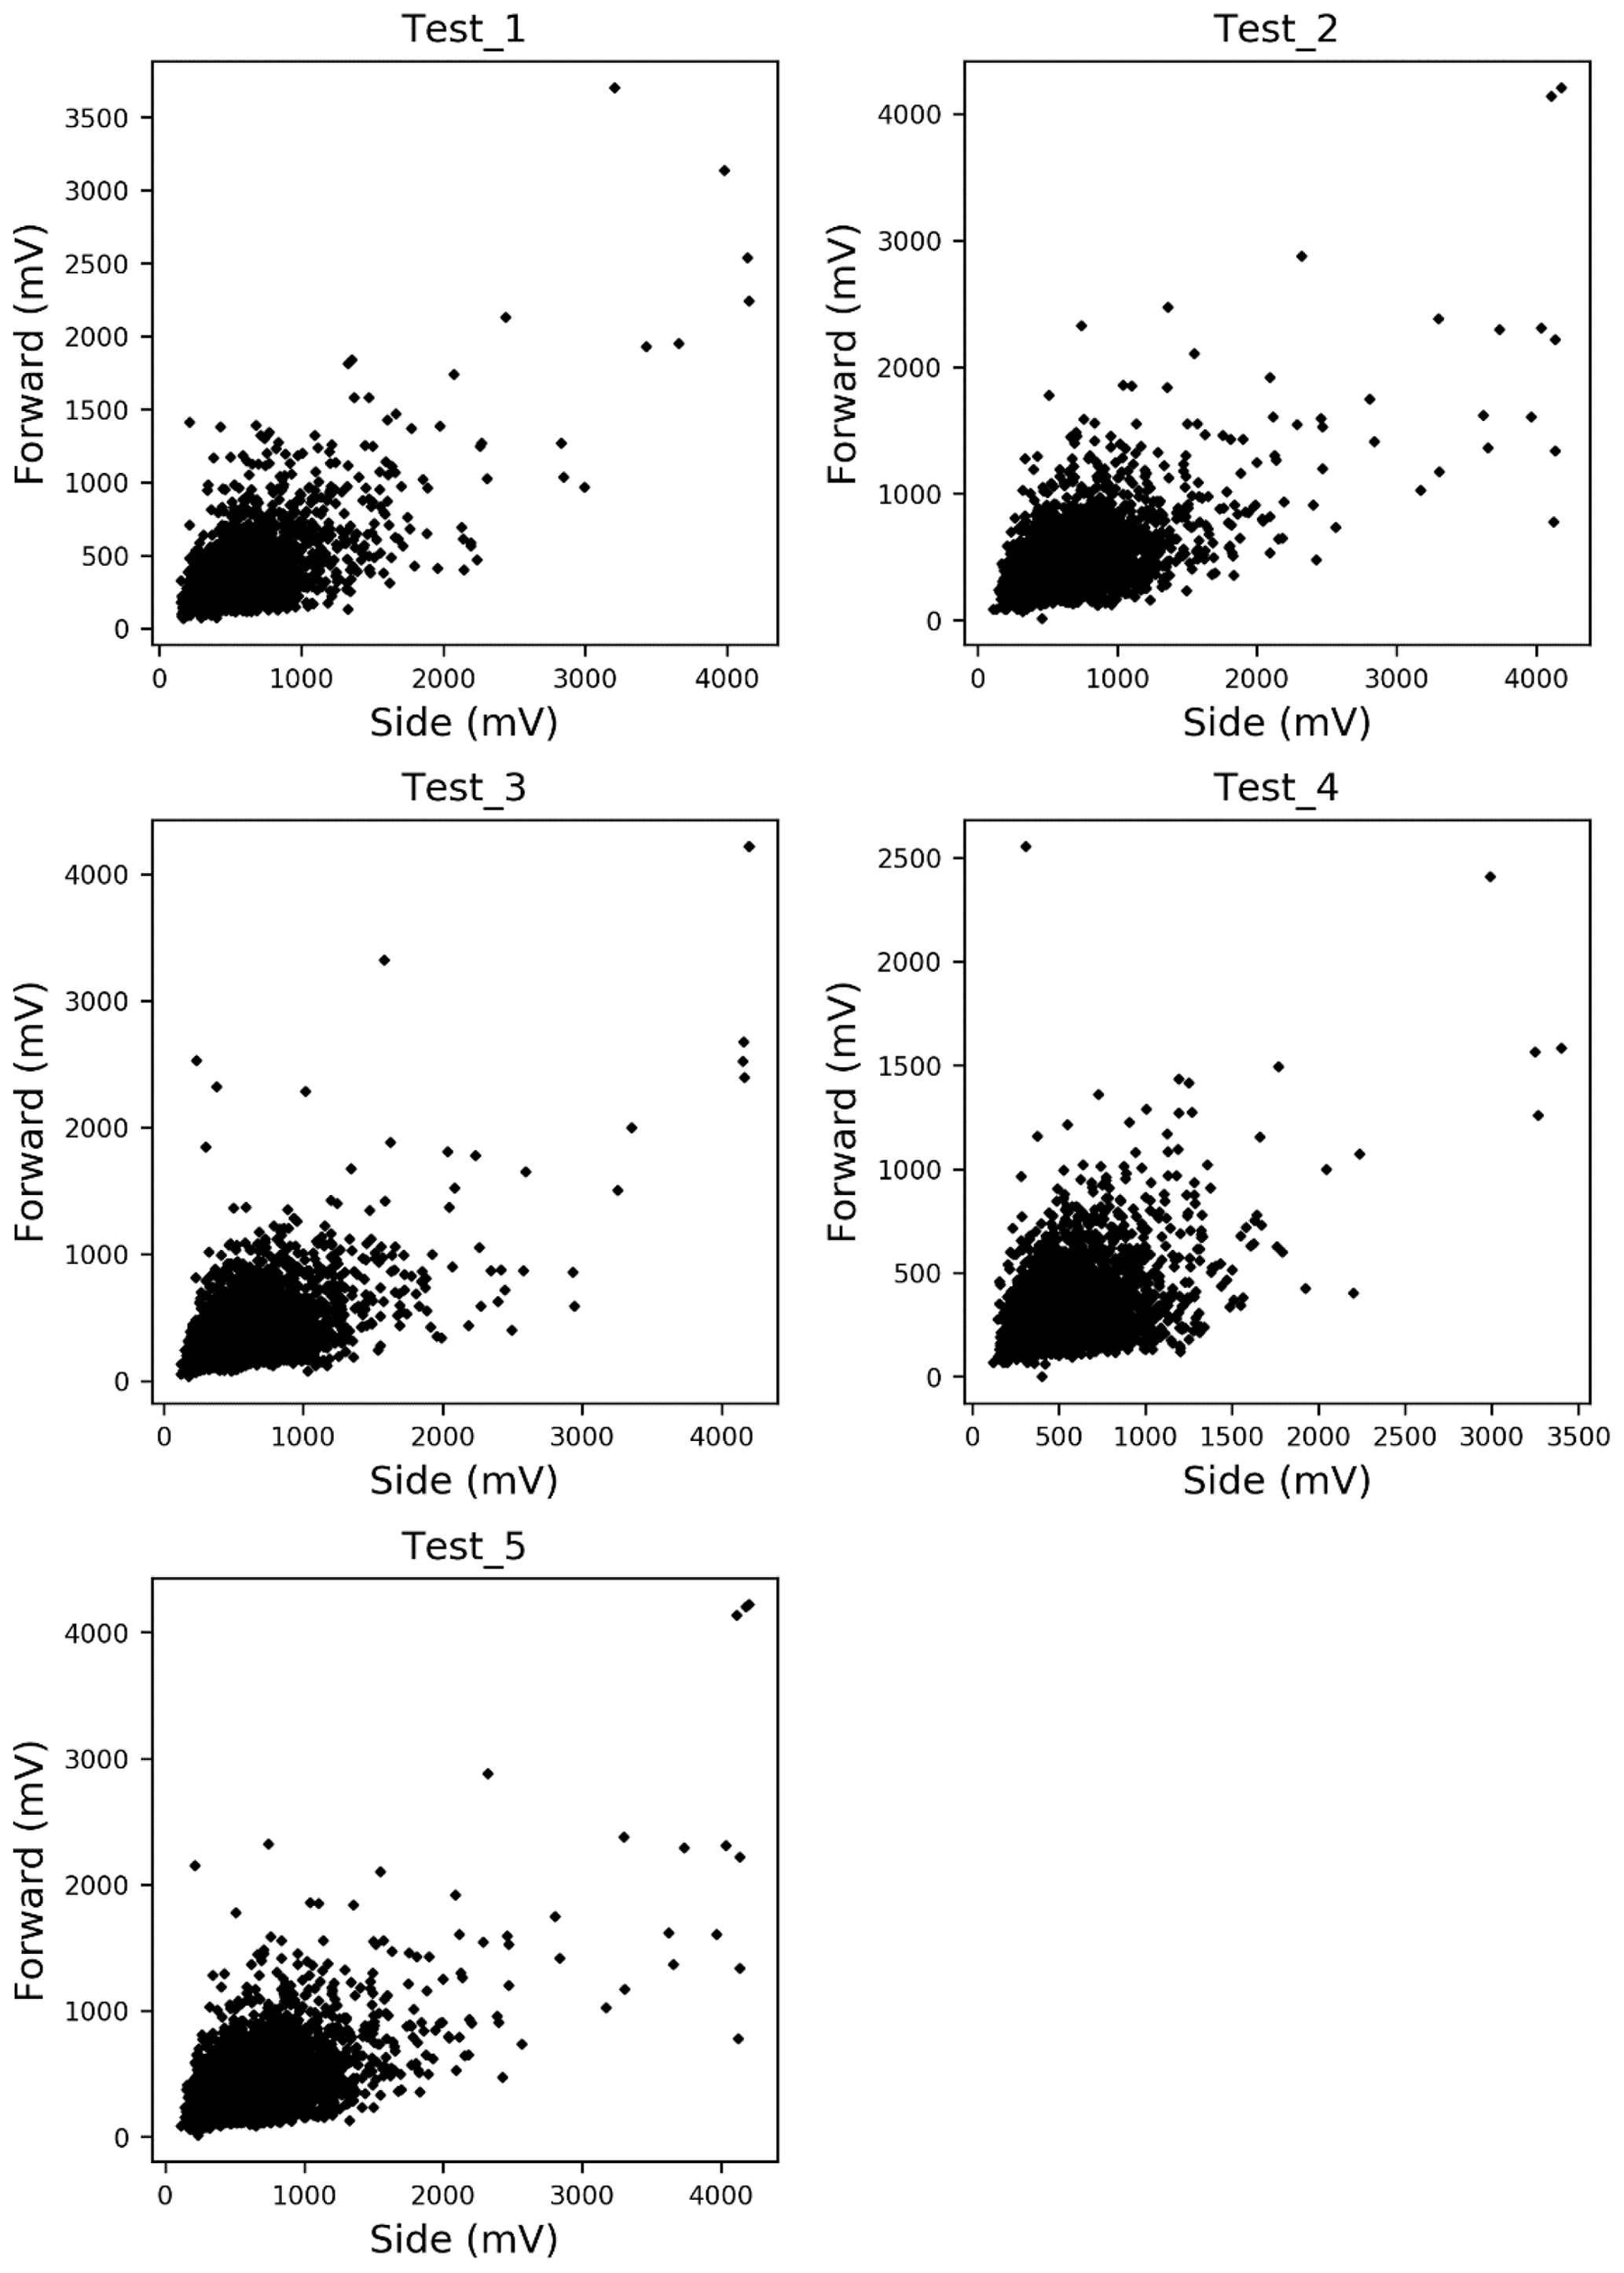
Figure 2Light scattering distribution data from Alnus and Artemisia used for the estimation test.
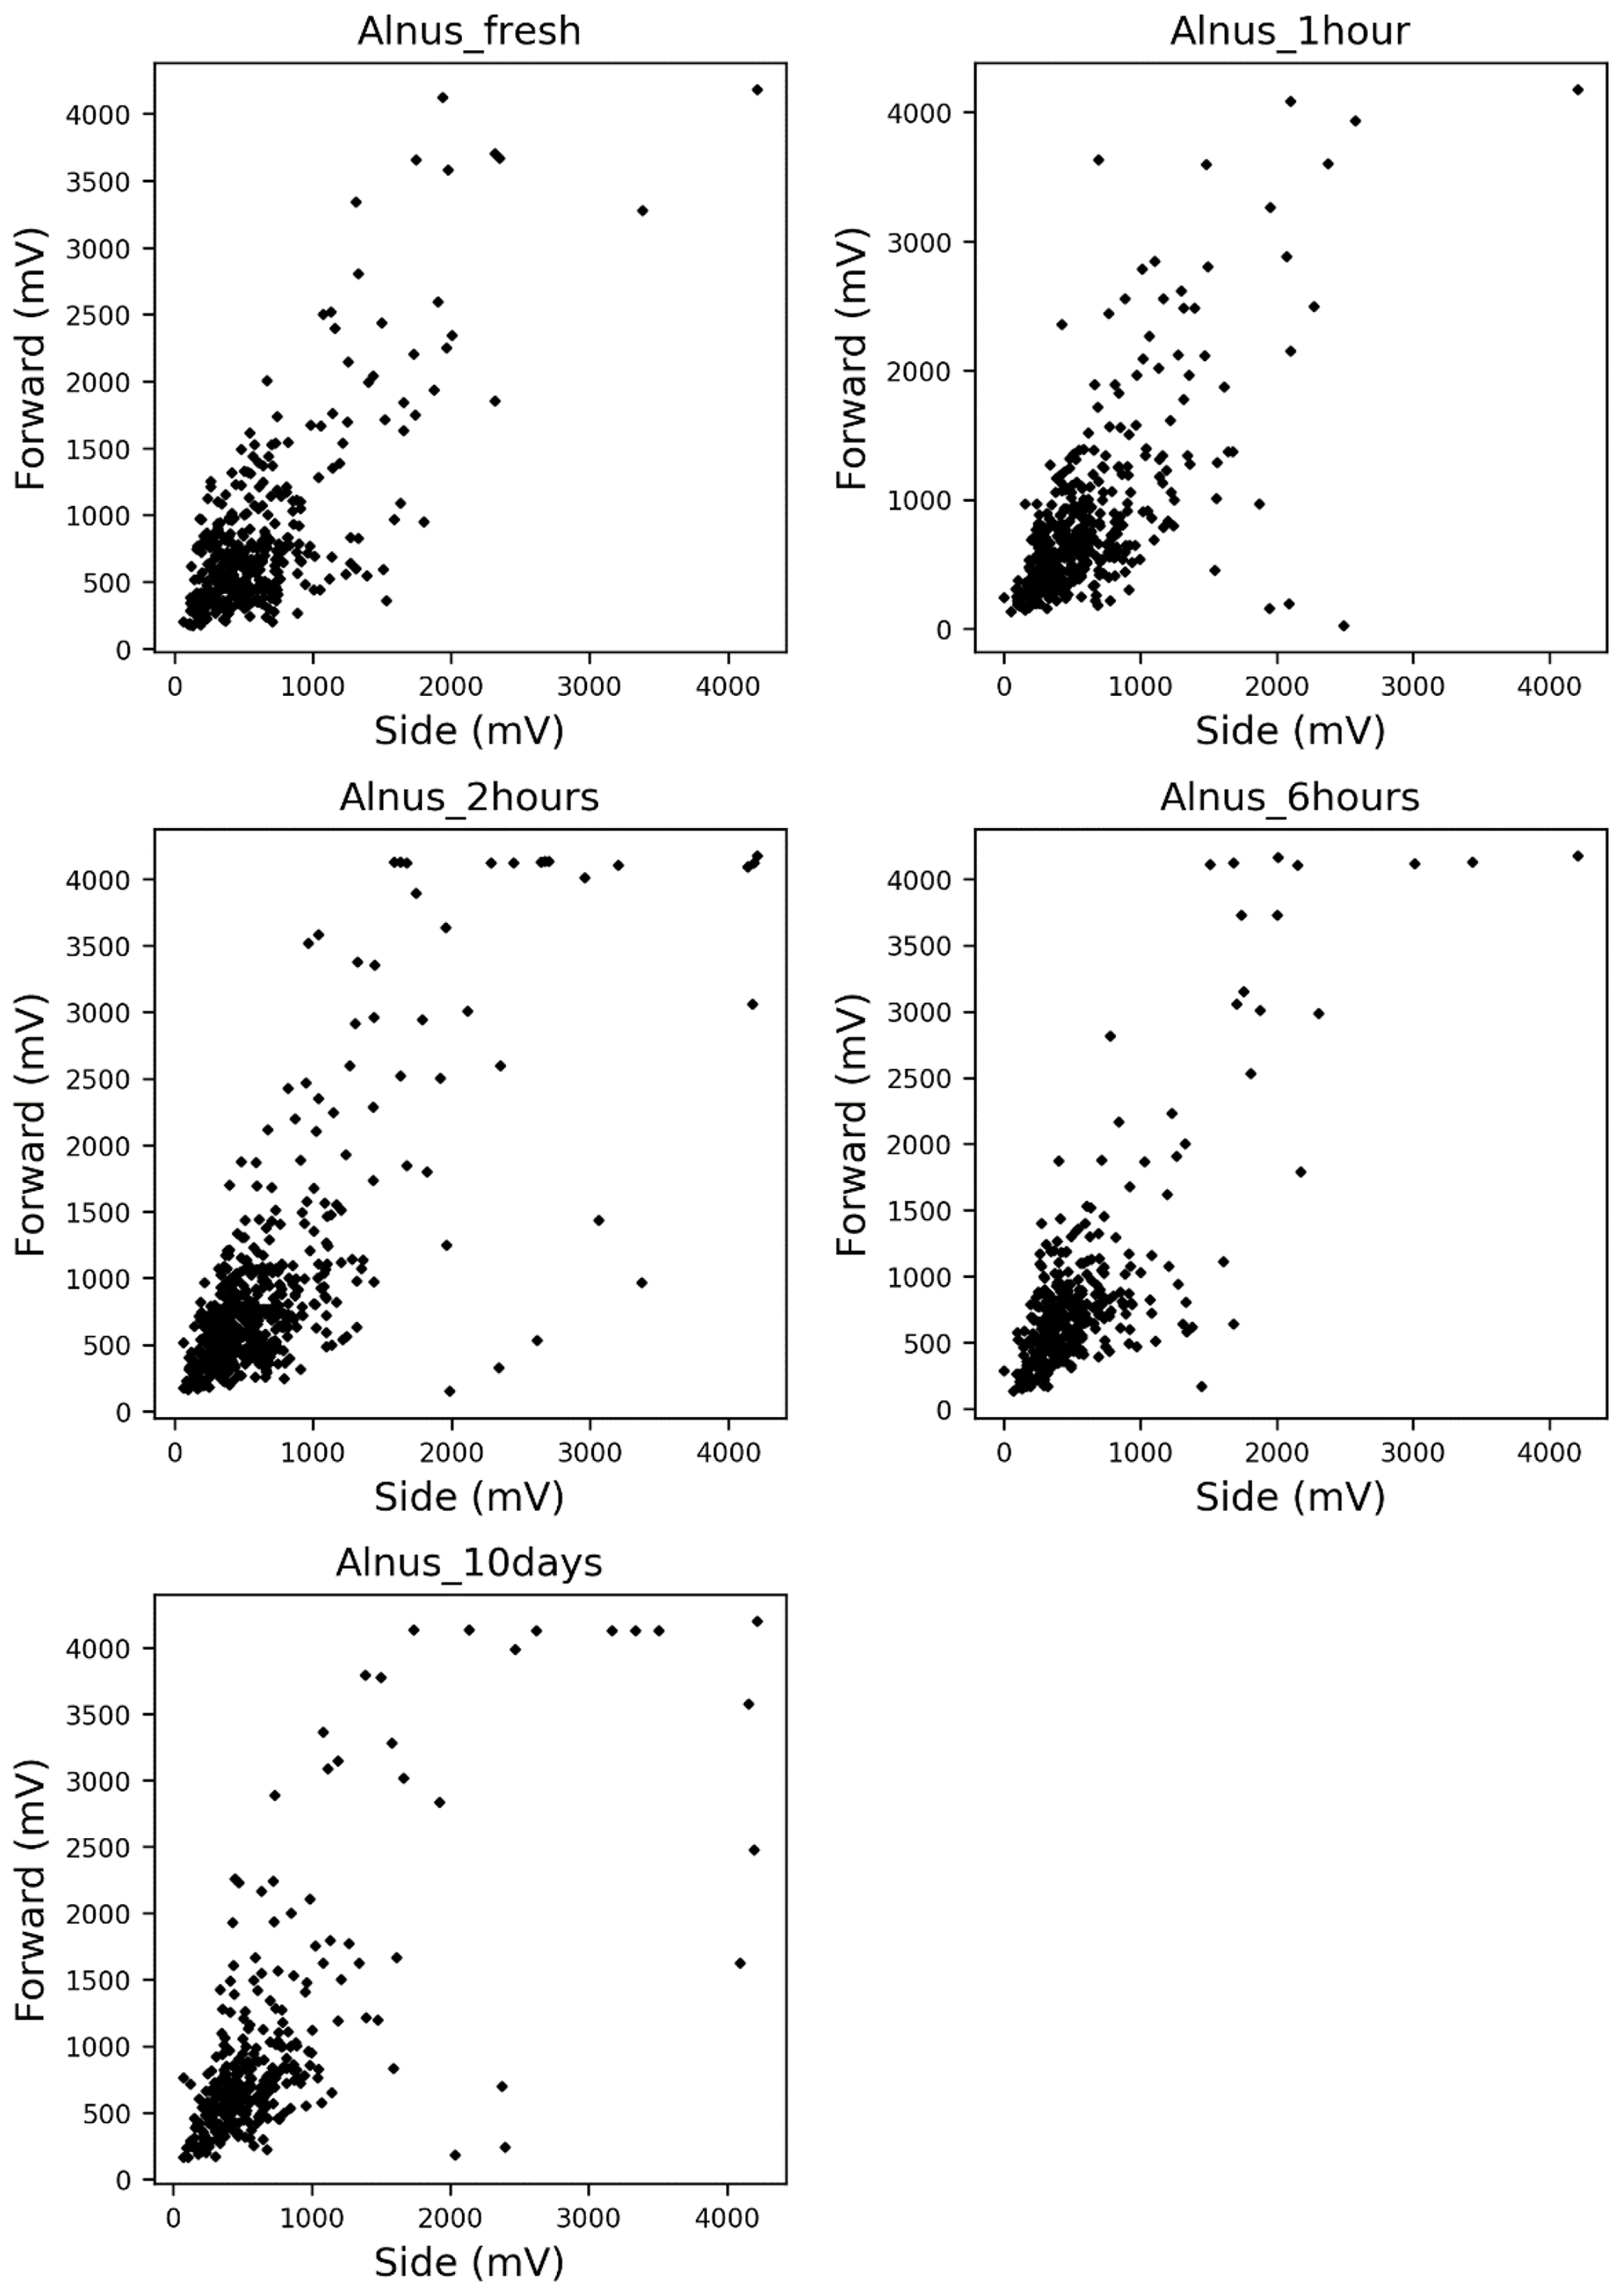
Figure 3Light scattering plots for Alnus pollen – fresh and after 1 h, 2 h, 6 h, and 10 d storage.
Equation (1) gives
Here, N is the number of sampled pollen grains of each pollen type, which are the values to be calculated. Ntotal is the total number of sampled pollen grains and n is the total number of sampled pollen grains in the integration interval, which are known numbers. C is the correction factor defined by the following equation:
C is needed for renormalization of the probability distribution because the device KH-3000-01 is able to detect the scattering intensity only in the range of 0–4500 mV.
By solving two equations in Eq. (4), NA and NB will be theoretically estimated.
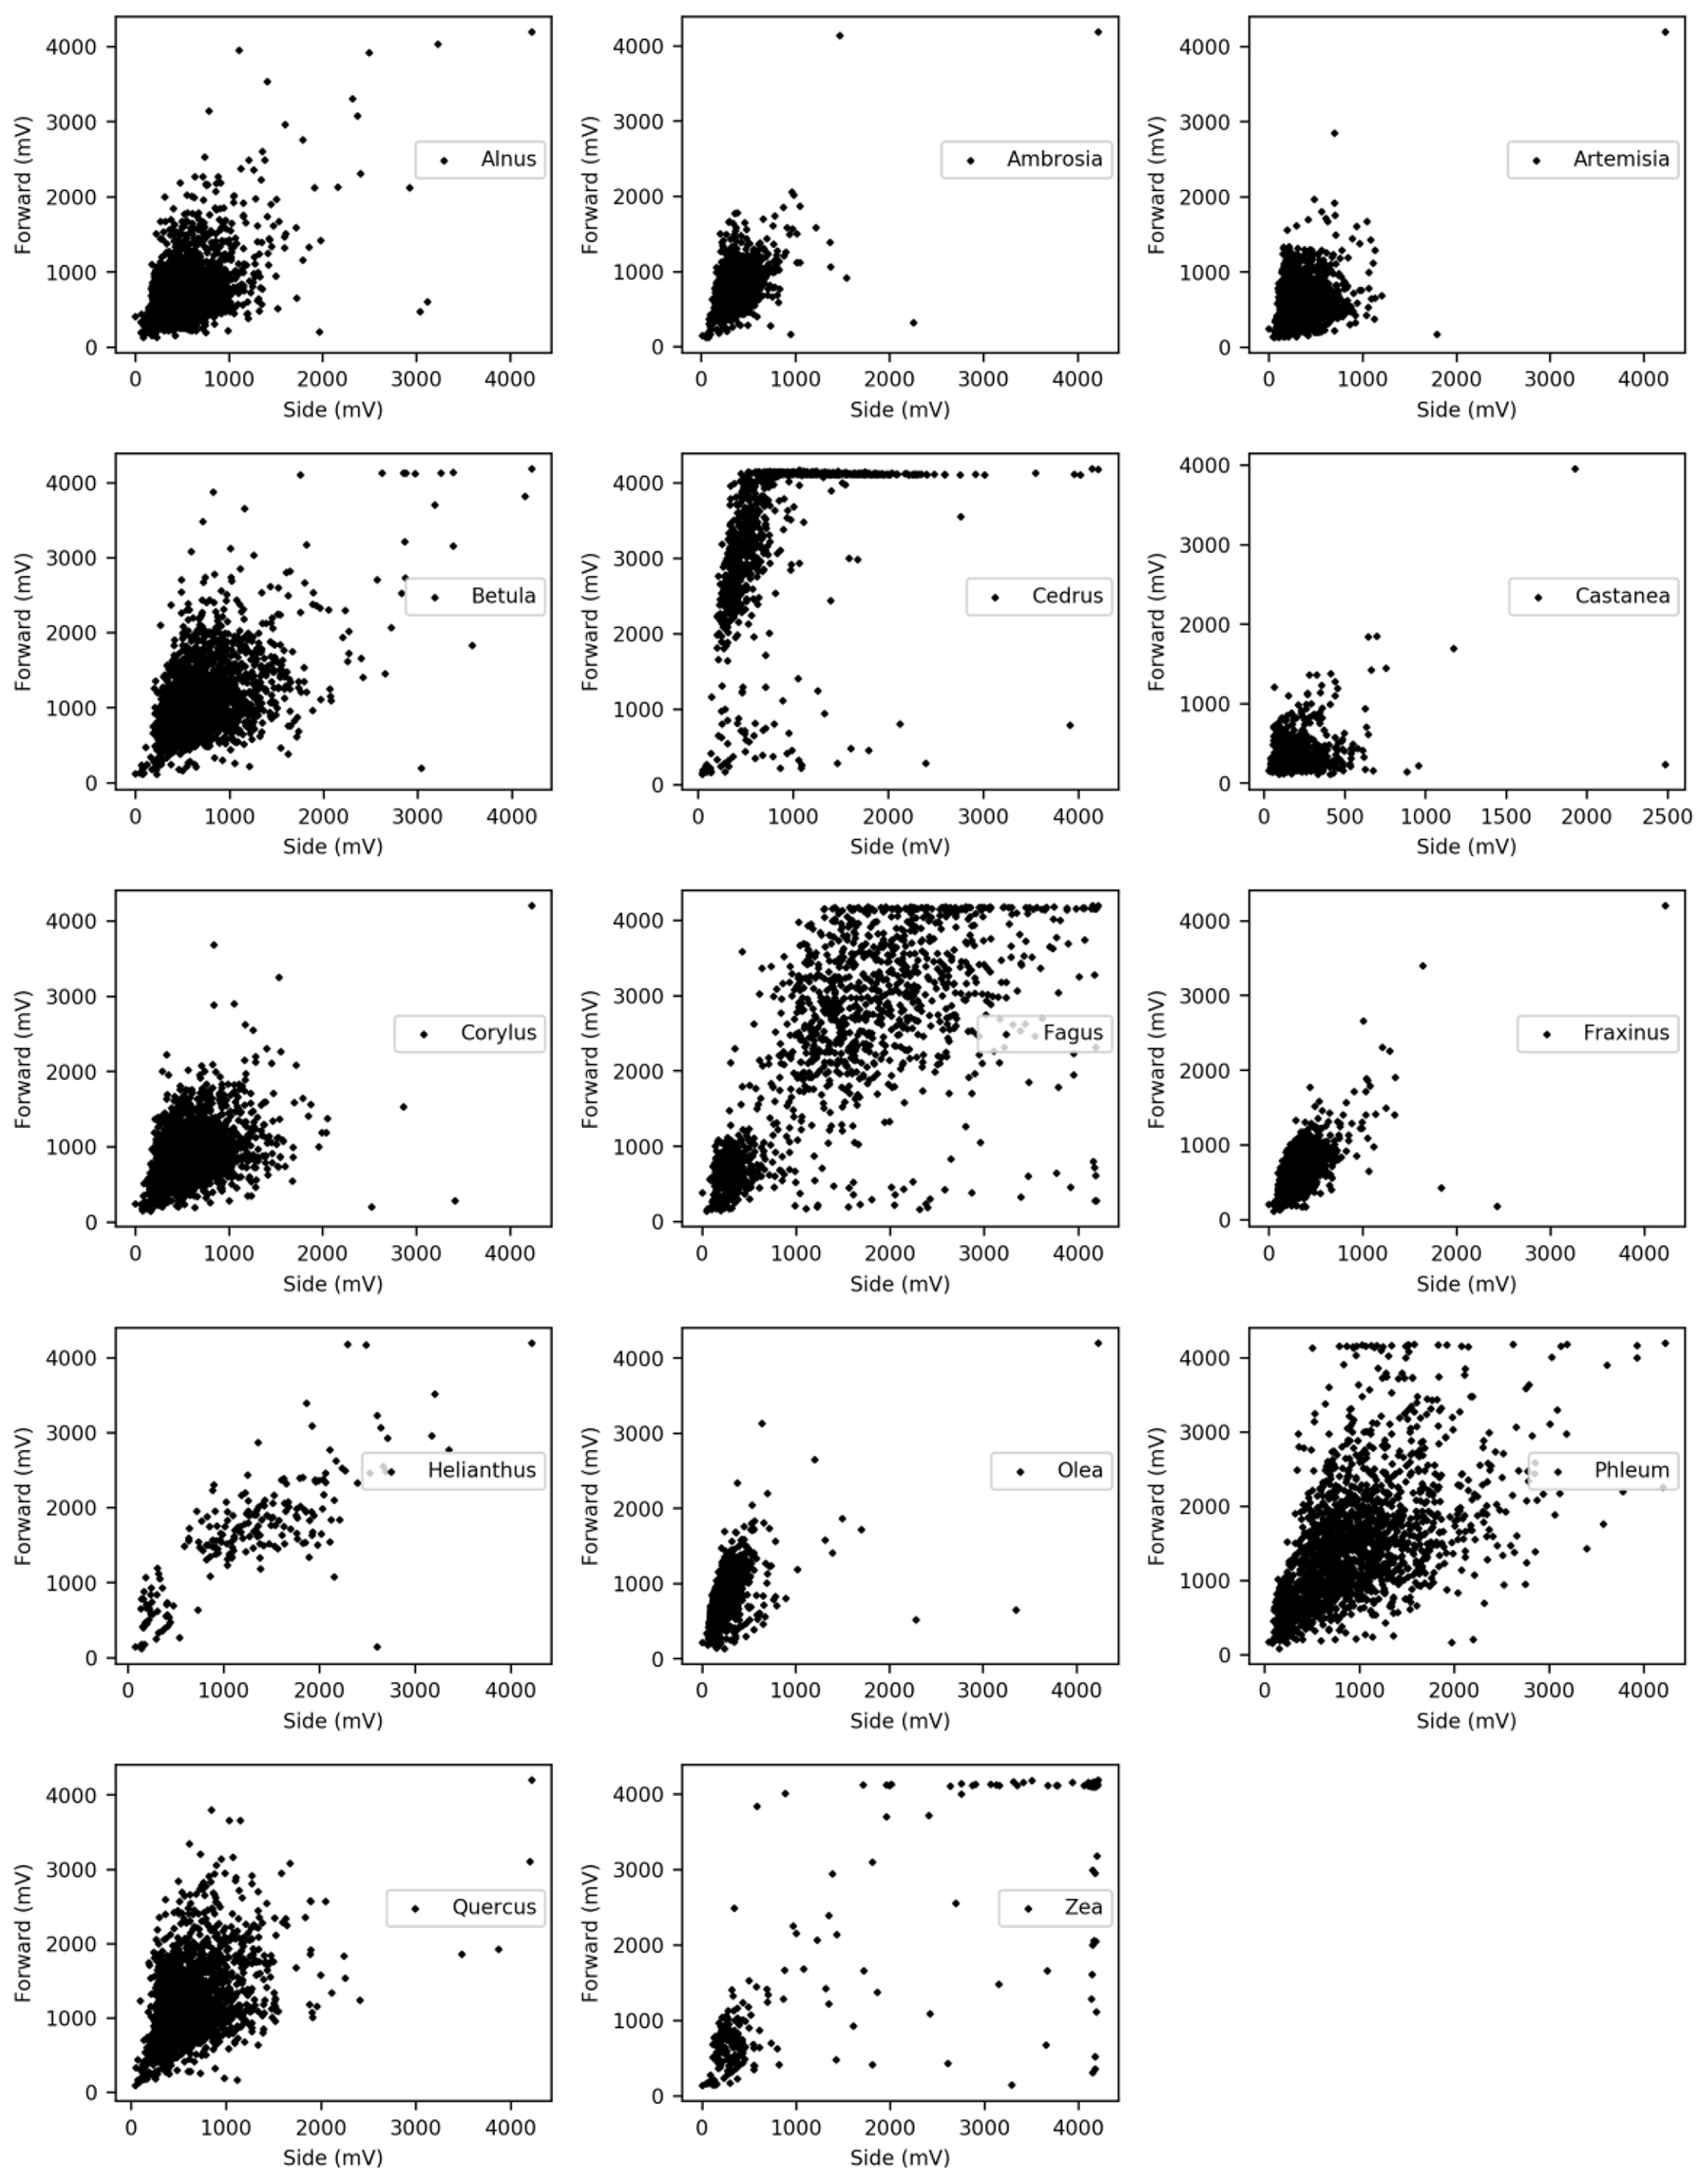
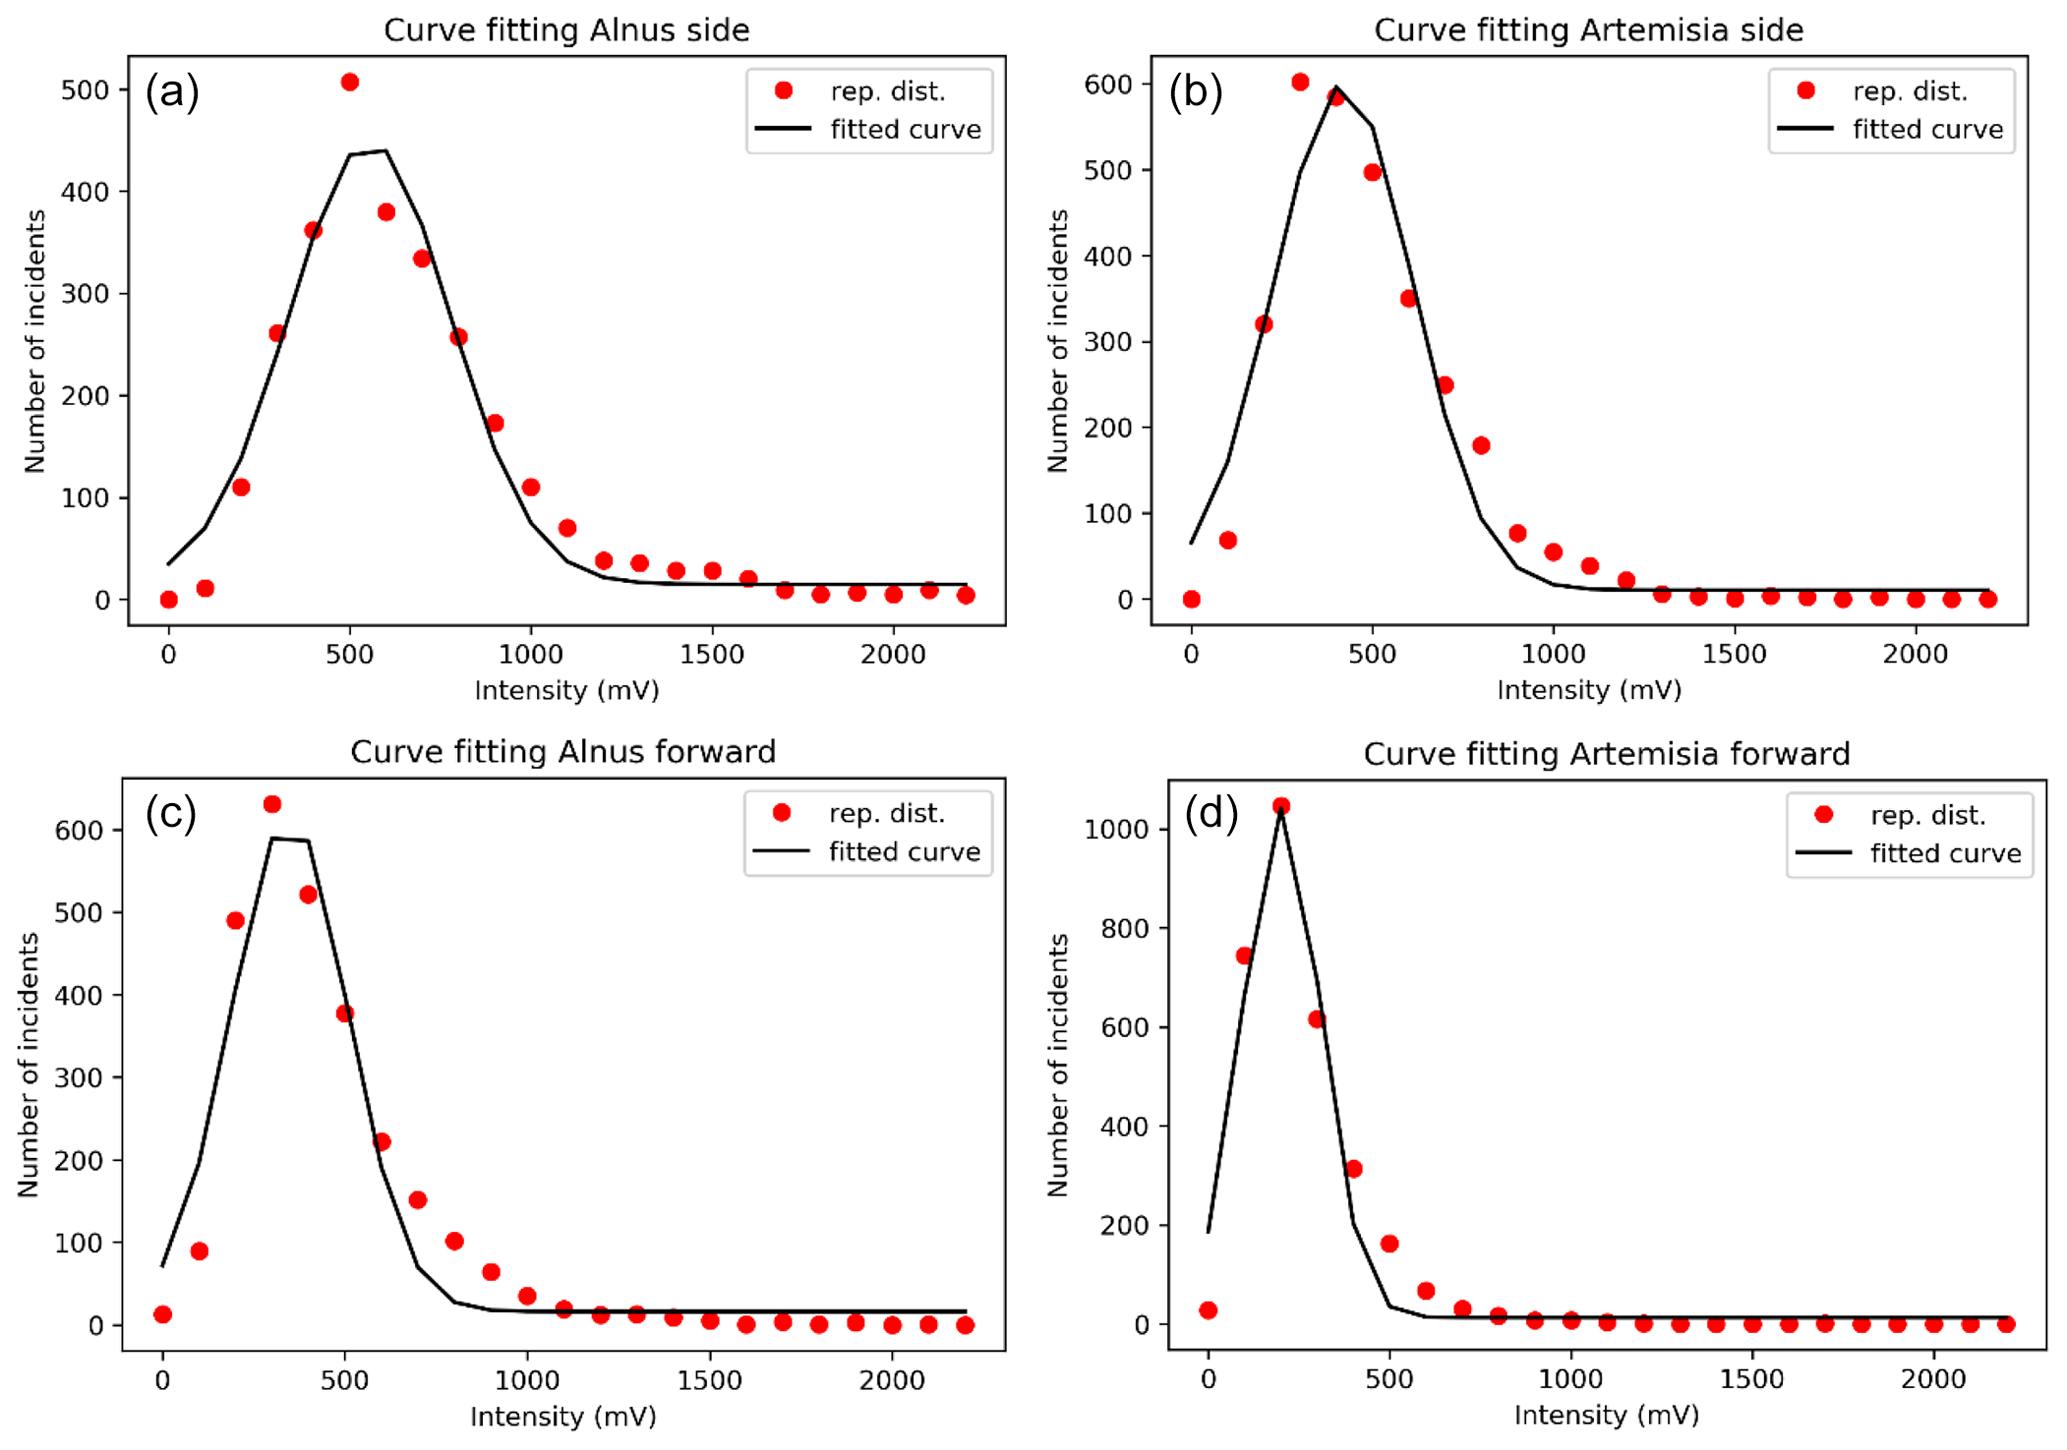
Figure 5A fitted curve for side scattering for (a) Alnus and (b) Artemisia and a fitted curve for forward scattering for (c) Alnus and (d) Artemisia.
In this paper, Alnus and Artemisia were chosen as examples to evaluate the usability of the theory above. Because fitting worked well in the range of 600–800 mV for the side scattering and 300–500 mV for the forward scattering, a=600, b=800, c=300, and d=500 were substituted in Eq. (4). The evaluation tests were carried out 5 times using the light scattering data for both Alnus and Artemisia (Fig. 2).
The magnitude of the estimation error is calculated as follows.
3.1 Temporal changes in light scattering pattern
The scattering distribution of Alnus pollen (Fig. 3) showed no significant temporal changes in scattering distributions in 10 d (Table 1).

3.2 Light scattering distributions of different pollen taxa
Pollen grains with smaller sizes tend to show smaller voltage values (Fig. 4). The results of the multiple comparisons (Table 2) indicated that there is always a significant difference between side and forward scattering between two different pollen types except between the following:
-
Side scattering: Alnus–Ambrosia, Alnus–Corylus, Alnus–Olea, Ambrosia–Fraxinus, Betula–Phleum, Betula–Quercus, Corylus–Olea, Fagus–Zea, Artemisia–Fraxinus, Helianthus–Zea, Phleum–Quercus;
-
Forward scattering: Alnus–Corylus, Alnus–Quercus, Ambrosia–Artemisia, Ambrosia–Fraxinus, Artemisia–Fraxinus, Betula–Phleum, Betula–Quercus, Castanea–Olea, Cedrus–Helianthus, Corylus–Quercus, Fagus–Helianthus, Fagus–Zea, Phleum–Quercus.
Table 2Multiple comparisons between each pollen taxon.
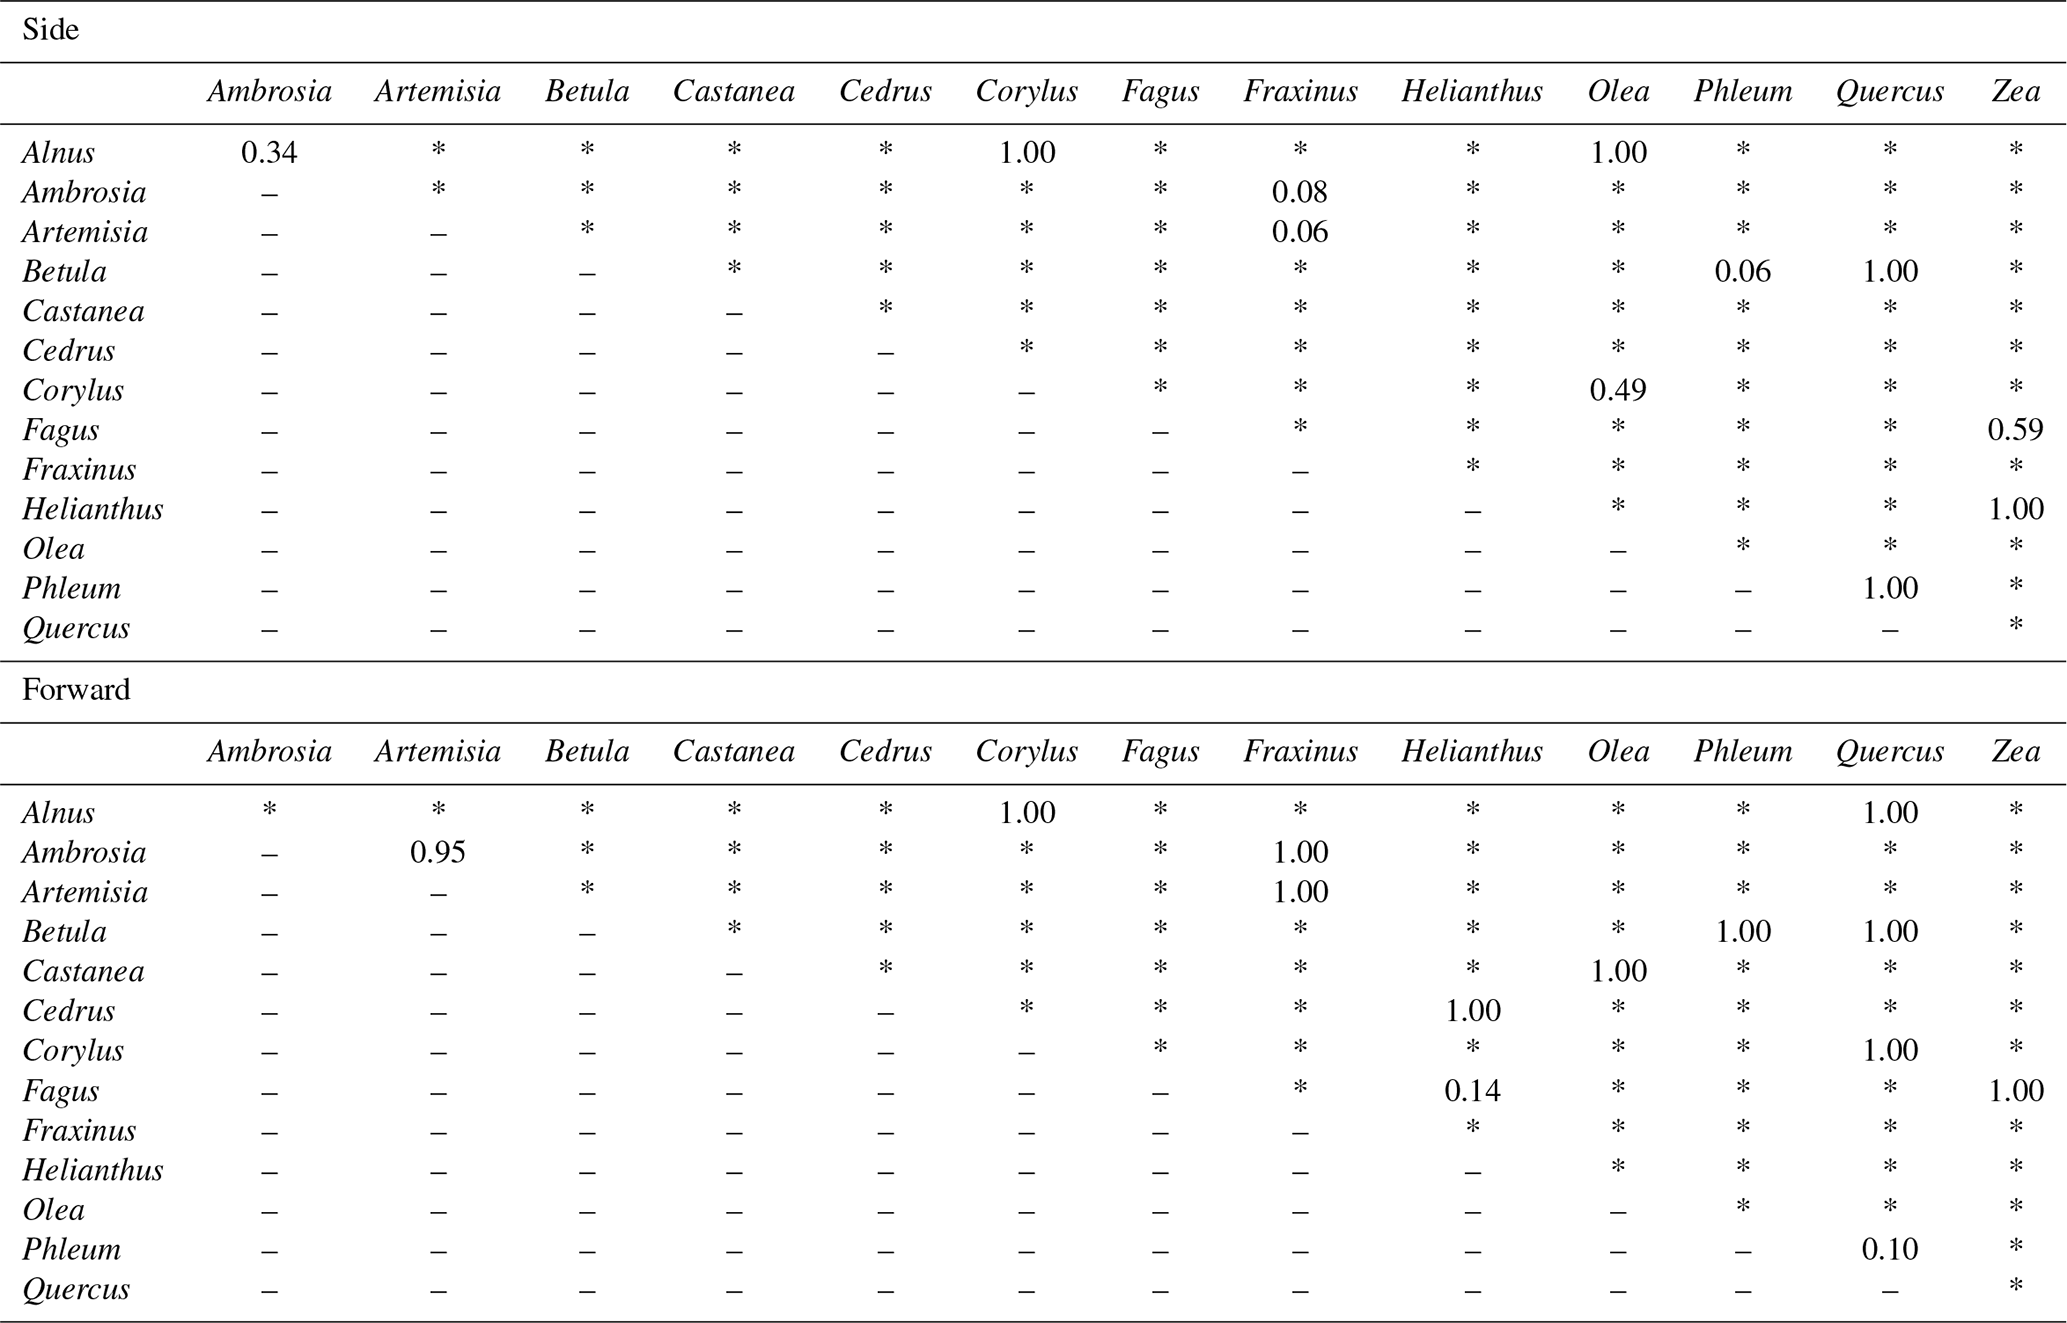
∗ p<0.05.
3.3 Automatic counting
Counting the number of pollen grains of each type can be carried out by solving the two equations from Eq. (4), side (nside a–b) and forward (nfront c–d), side (nside a–b) and total (Ntotal), and forward (nfront c–d) and total (Ntotal). The parameters of the probability density curve of the side and the forward (Fig. 5) light scattering distributions of Alnus and Artemisia were estimated as follows:
-
: ,
-
: ,
-
: ,
-
: .
The results (Fig. 6) show that the estimated number of pollen grains had average errors of 47 %, 34 %, and 39 % for Alnus and 31 %, 19 %, and 21 % for Artemisia (Table 3).
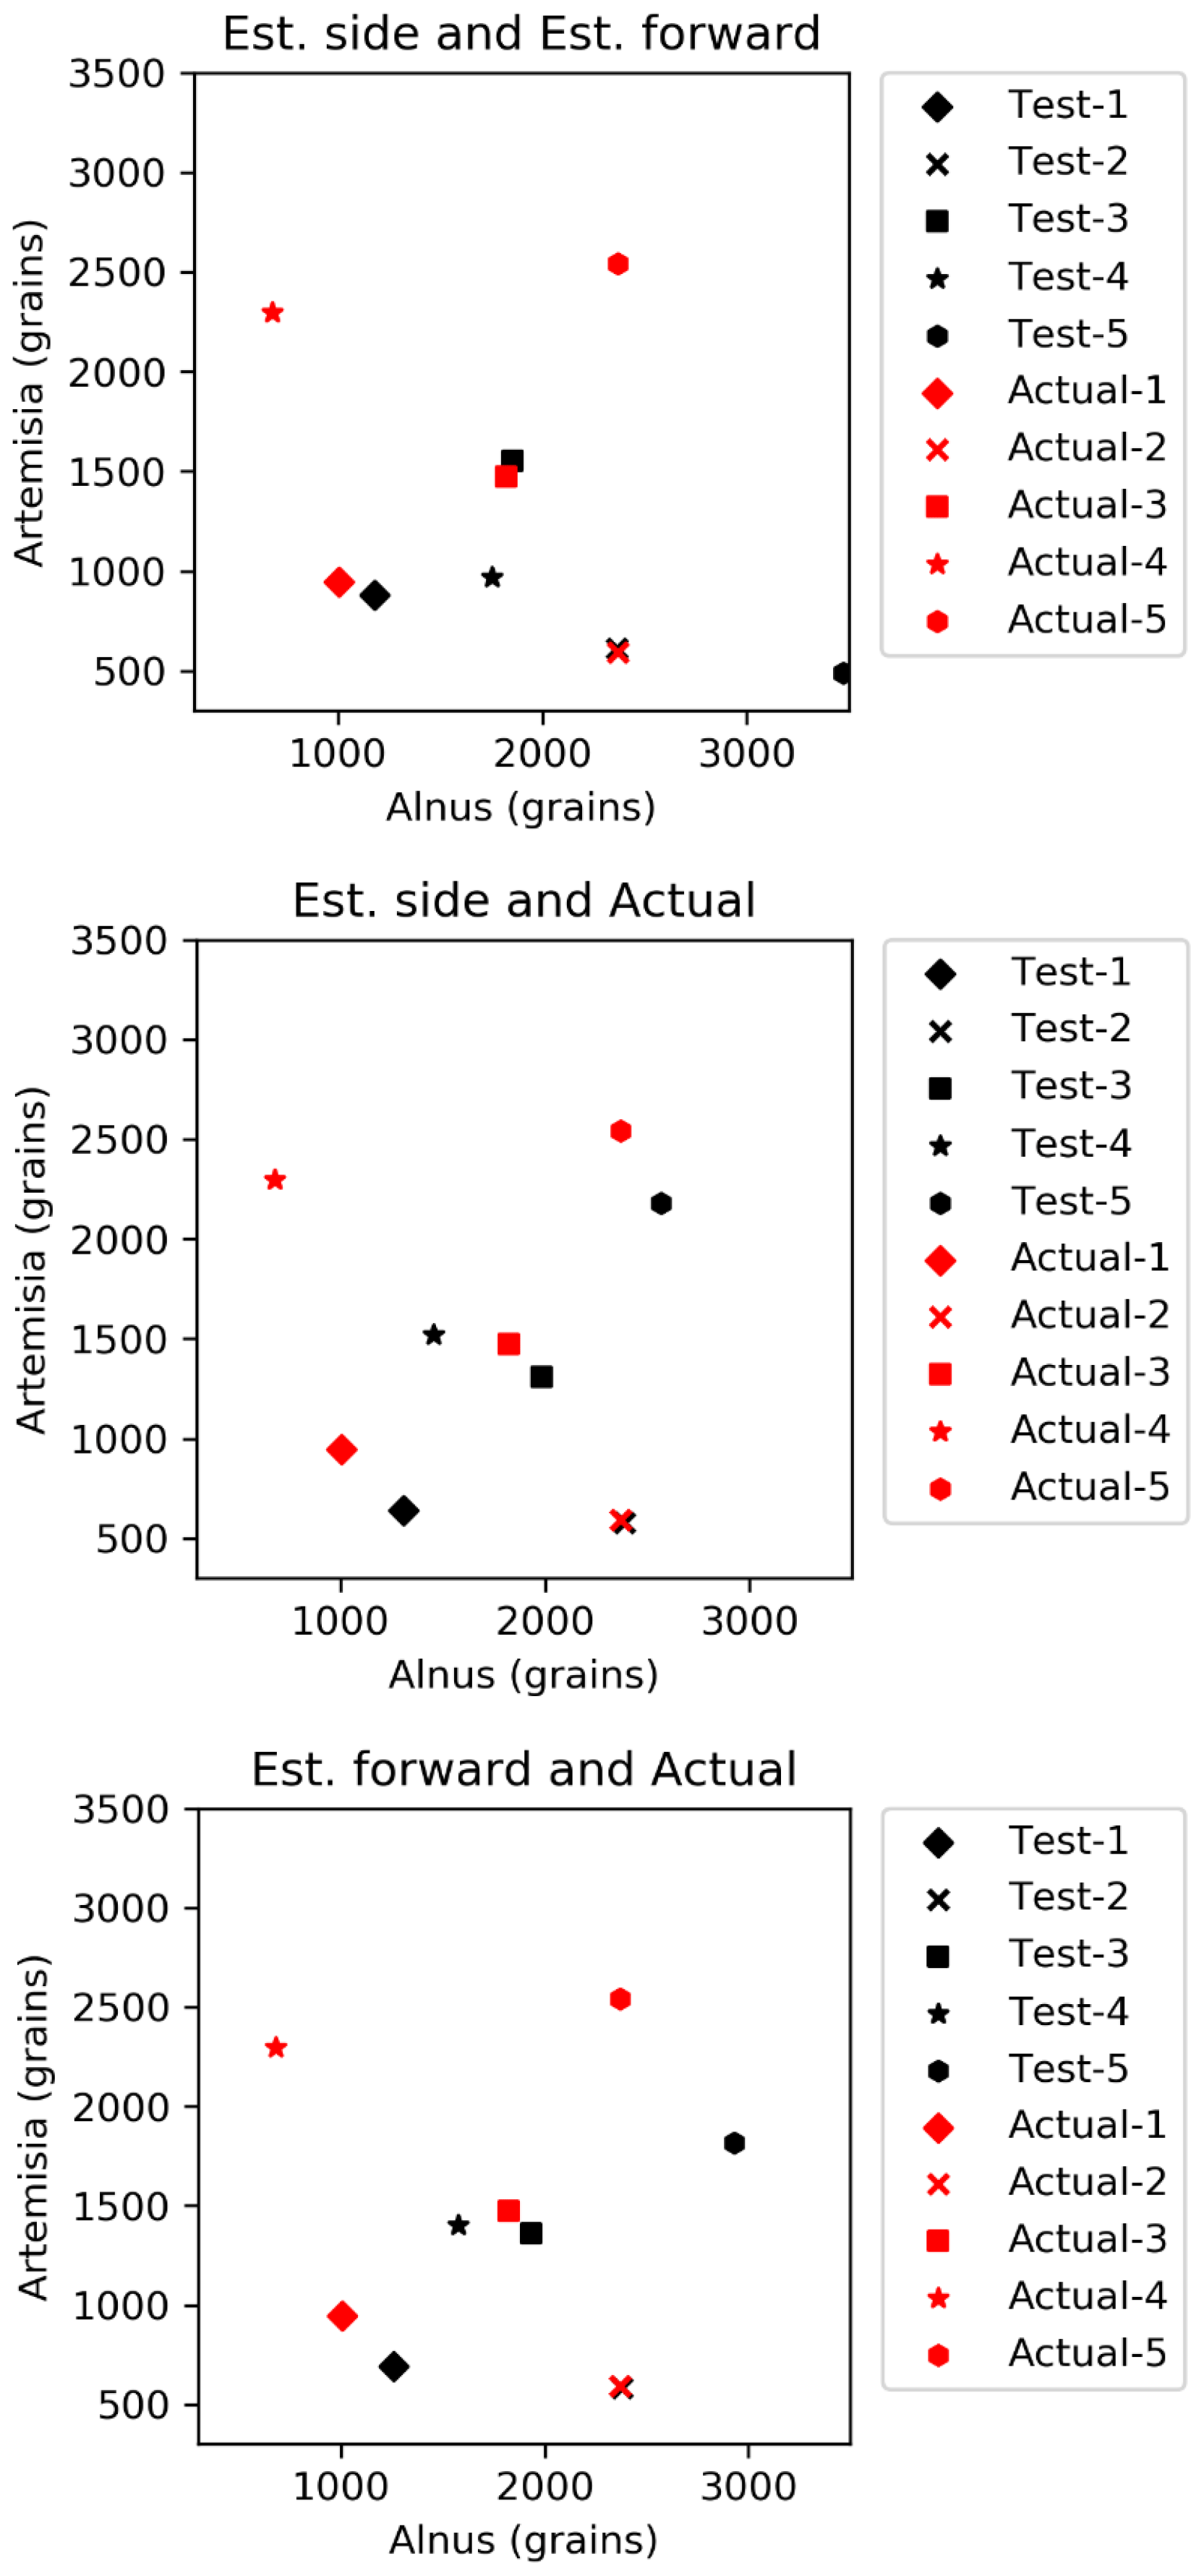
Figure 6Results of automatic counting of Alnus and Artemisia. Red and black dots represent actual and estimated numbers of pollen grains, respectively. The pairs of red and black dots with the same shape are in the same test set.
Table 3Results of the estimation of the number of pollen grains of Alnus and Artemisia and the errors of each estimation.

Temporal changes in the shapes of pollen grains are expected to affect the changes in light scattering patterns. However, our experimental data indicate that light scattering patterns show little to no changes over time (up to at least 10 d). Thus, there should be no problem using pollen grains that are either fresh or have been stored for several days for studies with the KH-3000-01. Further investigation is required to understand whether this is true for species other than Alnus and for longer periods of time. Understanding the morphological stability of each pollen type would be helpful to understand the temporal stability of light scattering patterns.
Light scattering data from various pollen taxa indicate that it is not possible to discriminate between the side scattering patterns of Alnus vs. Ambrosia, Alnus vs. Corylus, Alnus vs. Olea, Ambrosia vs. Fraxinus, Betula vs. Phleum, Betula vs. Quercus, Corylus vs. Olea, Fagus vs. Zea, Artemisia vs. Fraxinus, Helianthus vs. Zea, and Phleum vs. Quercus and the forward scattering patterns between Alnus vs. Corylus, Alnus vs. Quercus, Ambrosia vs. Artemisia, Ambrosia vs. Fraxinus, Artemisia vs. Fraxinus, Betula vs. Phleum, Betula vs. Quercus, Castanea vs. Olea, Cedrus vs. Helianthus, Corylus vs. Quercus, Fagus vs. Helianthus, Fagus vs. Zea, and Phleum vs. Quercus, all of which show similar scattering intensities. Although it is not clear if the classification theory introduced above is applicable to these groups, the theory should be applicable to other pairs as long as they have different scattering intensity distributions.
The estimation of the pollen counts of Alnus and Artemisia had average errors of approximately 40 % and 23 %, respectively. Test 4 had the largest error, with approximately 134 % for Alnus and approximately 44 % for Artemisia, which increased the average error. It is difficult to identify an obvious reason for these large values, but it is possible that the pollen samples were contaminated by dust or that pollen grains picked up for this experiment were biased in size or shape. Additionally, other estimations derived from the fitted curve of the forward and the side scattering distributions showed that even when the pollen counts are estimated only from scattering intensity data without using the total number of pollen grains, which is a known number, the pollen counts are able to be calculated accurately. The KH-3000-01 has been widely used to estimate airborne concentrations of Cryptomeria japonica. In this study, we found average errors of 20 %–40 % for Alnus and Artemisia, values which are also likely applicable to other taxa such as Cryptomeria japonica. Other taxa should, however, be investigated in future.
Pollen counts can be estimated by solving Eq. (4), which contains three equations, meaning that it is possible to make estimates for three different pollen taxa simultaneously. If more integration intervals were picked up from the probability density curve of the scattering intensity and added to the equation, in theory it would be possible to count more pollen taxa. It is possible, however, that the accuracy of the estimated values might decline due to the accuracy of the fitted curve. Therefore, narrowing down a target to two or three pollen types considering the season should be helpful to make accurate automatic counts of several pollen taxa simultaneously.
In this study, the normal distribution function was chosen for fitting because of its universal property. However, further consideration is required to determine the best function for fitting actual light scattering characteristics.
By applying the statistical analysis method, the Bonferroni method, to the scattering patterns of Alnus at each time step, our experiment showed that there seems to be no significant temporal changes in the light scattering patterns. We also confirmed that different pollen types do not always have different light scattering patterns. However, when two different pollen types have different light scattering patterns, it was possible to calculate the number of pollen grains of each taxa using these light scattering patterns by solving the probability density function of the pattern.
The authors confirm that the data supporting the findings of this study are available within the article. All the light scattering data used in this research are given in Figs. 2, 3, and 4. The code that was used for this experiment was established following the Eqs. (1)–(6).
KM established the system, performed the data analysis, and wrote the paper. SK arranged the experimental set-up and proofread the paper.
The authors declare that they have no conflict of interest.
The authors would like to express their gratitude to Yamatronics. The authors also would like to show their appreciation to Samuel Allen for proofreading our paper.
This research was supported by the Young Research Exchange Programme between Japan and Switzerland under the Japanese–Swiss Science and Technology Programme.
This paper was edited by Pierre Herckes and reviewed by two anonymous referees.
Boucher, A., Hidalgo, P. J., Thonnat, M., Belmonte, J., Galan, C., Bonton, P., and Tomczak, R.: Development of a semi-automatic system for pollen recognition, Aerobiologia, 18, 195–201, 2002.
Buters, J. T. M., Antunes, C., Galveias, A., Bergmann, K. C., Thibaudon, M., Galán, C., Schmidt-Weber, C., and Oteros, J.: Pollen and spore monitoring in the world, Clin. Transl. Allergy, 8, 9, https://doi.org/10.1186/s13601-018-0197-8, 2018.
Chen, C., Hendrinks, E. A., Duin, R. P. W., Reiber, J. H. C., Hiemstra, P. S., de Weger, L. A., and Stoel, B. C.: Feasibility study on automated recognition of allergenic pollen: grass, birch and mugwort, Aerobiologia, 22, 275–284, https://doi.org/10.1007/s10453-006-9040-0, 2006.
Crouzy, B., Stella, M., Konzelmann, T., Calpini, B., and Clot, B.: All-optical automatic pollen identification: Towards an operational system, Atmos. Environ., 140, 202–212, 2016.
France, I. Duller, A. W. G., Duller, G. A. T., and Lamb, H. F.: A new approach to automated pollen analysis, Quaternary Sci. Rev., 19, 537–546, 2000.
Gallardo-Caballero, R., García-Orellana, C. J., García-Manso, A., González-Velasco, H., Tormo-Molina, R., and Macías-Macías, M.: Precise pollen grain detection in bright field microscopy using deep learning technique, Sensors, 19, 3583, https://doi.org/10.3390/s19163583, 2019.
Gonçalves, A. B., Souza, J. S., de Silva, G. G., Cereda, M. P., Pott, A., Naka, M. H., and Pistori, H.: Feature extraction and machine learning for the classification of Brazilian savannah pollen grains, Plos One, 11, e0157044. https://doi.org/10.1371/journal.pone.0157044, 2016.
Gottardini, E., Rossi, S., Cristofolini, F., and Benedetti, L.: Use of Fourier transform infrared (FT-IR) spectroscopy as a tool for pollen identification, Aerobiologia, 23, 211–219, 2007.
Huffman, D. R., Swanson, B. E., and Huffman, J. A.: A wavelength-dispersive instrument for characterizing fluorescence and scattering spectra of individual aerosol particles on a substrate, Atmos. Meas. Tech., 9, 3987–3998, https://doi.org/10.5194/amt-9-3987-2016, 2016.
Iwai, T.: Polarization analysis of light scattered by pollen grains of Cryptomeria japonica. Jpn. J. Appl. Phys., 52, 062404. https://doi.org/10.7567/JJAP.52.062404, 2013.
Kaya, Y., Mesut Pinar, S., Emre Erez, M., Fidan, M., and Riding, J. B.: Identification of Onopordum pollen using the extreme learning machine, a type of artificaial neural network, Palynology, 38, 129–137. https://doi.org/10.1080/09500340.2013.868173, 2014.
Kawashima, S., Clot, B., Fujita, T., Takahashi, Y., and Nakamura, K.: An algorithm and a device for counting airborne pollen automatically using laser optics, Atmos. Environ., 41, 7987–7993, 2007.
Kawashima, S., Thibaudon, M., Matsuda, S., Fujita, T., Lemonis, N., Clot, B., and Oliver, G.: Automated pollen monitoring system using laser optics for observing seasonal changes in the concentration of total airborne pollen, Aerobiologia, 33, 351–362, 2017.
Landsmeer, S. H., Hendrinks, E. A., De Weger L. A., Reiber, J. H. C., and Stoel, B. C.: Detection of pollen grains in multifocal optical microscopy images of air samples. Microsc. Res. Techniq., 72, 424–430, 2009.
Li, P., Treloar, W. J., Flenley, J. R., and Empson, L.: Towards automation of palynology 2: the use of texture measures and neural network anaysis for automated identification of optical images of pollen grains, J. Quaternary Sci., 19, 755–762, https://doi.org/10.1002/jqs.874, 2004.
Longhi, S., Cristofori, A., Gatto, P., Cristofolini, F., and Grando, M. S., Gottardini, E.: Biomolecular identification of allergenic pollen: a new perspective for aerobiological monitoring? Ann. Allerg. Asthma Im., 103, 508–514, 2009.
Marcos, J. V., Nava, R., Cristóbal, G., Redondo, R., Escalante-Ramírez, B., Bueno, G., Déniz, Ó., González-Porto, A., Pardo, C., Chung, F., and Rodríguez, T.: Automated pollen identification using microscopic imaging and texture analysis, Micron, 68, 36–46, https://doi.org/10.1016/j.micron.2014.09.002, 2015.
Matsuda, S. and Kawashima, S.: Relationship between laser light scattering and physical properties of airborne pollen, J. Aerosol Sci., 124, 122–132, 2018.
Miki, K., Kawashima, S., Fujita, T., Nakamura, K., and Clot, B.: Effect of micro-scale wind on the measurement of airborne pollen concentrations using volumetric methods on a building rooftop, Atmos. Environ., 158, 1–10. https://doi.org/10.1016/j.atmosenv.2017.03.015, 2017.
Miki, K., Kawashima, S., Clot, B., and Nakamura, K.: Comparative efficiency of airborne pollen concentration evaluation in two pollen sampler designs related to impaction and changes in internal wind speed, Atmos. Environ., 203, 18–27, https://doi.org/10.1016/j.atmosenv.2019.01.039, 2019.
Mitsumoto, K., Yabusaki, K., and Aoyagi, H.: Classification of pollen species using autofluorescence image analysis, J. Biosci. Bioeng., 107, 90–94, 2009.
Mitsumoto, K., Yabusaki, K., Kobayashi, K., and Aoyagi, H.: Development of a novel real-time pollen-sorting counter using species-specific pollen autofluorescence, Aerobiologia, 26, 99–111, https://doi.org/10.1007/s10453-009-9147-1, 2010.
O'Connor, D. J., Healy, D. A., and Sodeau, J. R.: The on-line detection of biological particle emissions from selected agricultural materials using the WIBS-4 (Waveband Integrated Bioaerosol Sensor) technique, Atmos. Environ., 80, 415–425, https://doi.org/10.1016/j.atmosenv.2013.07.051, 2013.
Oteros, J., Pusch, G., Weichenmeier, I., Heimann, U., Möller, R., Röseler, S., Traidl-Hoffmann, C., Schmidt-Weber, C., and Buters, J. T. M.: Automatic and online pollen monitoring, Int. Arch. Allergy Imm., 167, 158–166, https://doi.org/10.1159/000436968, 2015.
Punyasena, S. W., Tcheng, D. K., Wesseln, C., and Mueller, P. G.: Classifying black and white spruce pollen using layered machine learning, New Phytol., 196, 937–944, https://doi.org/10.1111/j.1469-8137.2012.04291.x, 2012.
Ranzato, M., Taylor, P. E., House, J. M., Flagan, R. C., LeCun, Y., and Perona, P.: Automatic recognition of biological particles in microscopic images, Pattern Recogn. Lett., 28, 31–39, https://doi.org/10.1016/j.patrec.2006.06.010, 2007.
Richardson, S. C., Mytilinaios, M., Foskinis, R., Kyrou, C., Papayannis, A., Pyrri, I., Giannoutsou, E., and Adamakis, I. D. S.: Bioaerosol detection over Athens, Greece using the laser induced fluorescence technique, Sci. Total Environ., 696, 133906, https://doi.org/10.1016/j.scitotenv.2019.133906, 2019.
Rogríguez-Damián, M., Cernadas, E., Formella, A., Fernández-Delgado, M., and De Sá-Otero, P.: Automatic detection and classification of grains of pollen based on shape and texture, IEEE T. Syst. Man Cy.-S., 36, 531–542, https://doi.org/10.1109/TSMCC.2005.855426, 2006.
Šaulienė, I., Šukienė, L., Daunys, G., Valiulis, G., Vaitkevičius, L., Matavulj, P., Brdar, S., Panic, M., Sikoparija, B., Clot, B., Crouzy, B., and Sofiev, M.: Automatic pollen recognition with the Rapid-E particle counter: the first-level procedure, experience and next steps, Atmos. Meas. Tech., 12, 3435–3452, https://doi.org/10.5194/amt-12-3435-2019, 2019.
Sauvageat, E., Zeder, Y., Auderset, K., Calpini, B., Clot, B., Crouzy, B., Konzelmann, T., Lieberherr, G., Tummon, F., and Vasilatou, K.: Real-time pollen monitoring using digital holography, Atmos. Meas. Tech., 13, 1539–1550, https://doi.org/10.5194/amt-13-1539-2020, 2020.
Surbek, M., Esen, C., Schweiger, G., and Ostendorf, A.: Pollen characterization and identification by elastically scattered light. J. Biophotonics, 4, 49–56, https://doi.org/10.1002/jbio.200900088, 2011.
Swanson, B. E. and Huffman, J. A.: Development and characterization of an inexpensive single-particle fluorescence spectrometer for bioaerosol monitoring, Opt. Express, 26, 3646–3660, 2018.
Takahashi, Y., Kawashima, S., Fujita, T., Ito, C., Togashi, R., and Takeda, H.: Comparison between real-time pollen monitor KH-3000 and Burkard sampler, Arerugi, 50, 1136–1142, 2001.
Tcheng, D. K., Nayak, A. K., Fowlkes, C. C., and Punyasena, S. W.: Visual recognition software for binary classification and its application to spruce pollen identification, Plos One, 11, e0148879. https://doi.org/10.1371/journal.pone.0148879, 2016.
Wang, Q., Nakamura, S., Gong, S., Suzuki, M., Nakajima, D., Takai, Y., Lu, S., Sekiguchi, K., and Miwa, M.: Release behaviour of Cryptomeria japonica pollen allergenic cry j1 and cry j2 in rainwater containing air pollutants, Int. J. Sustain. Dev. Plann., 9, 42–53, https://doi.org/10.2495/SDP-V9-N1-42-53, 2014.
Zhang, Y., Fountain, D. W., Hodgson, R. M., Flenley, J. R., and Gunetileke, S.: Towards automation of palynology 3: pollen pattern recognition using Gabor transforms and digital moments. J. Quaternary Sci., 19, 763–768, https://doi.org/10.1002/jqs.875, 2004.