the Creative Commons Attribution 4.0 License.
the Creative Commons Attribution 4.0 License.
 | 05 Nov 2021
Calibration and evaluation of a broad supersaturation scanning (BS2) cloud condensation nuclei counter for rapid measurement of particle hygroscopicity and cloud condensation nuclei (CCN) activity
Najin Kim
Yafang Cheng
Nan Ma
Mira L. Pöhlker
Thomas Klimach
Thomas F. Mentel
Ovid O. Krüger
Ulrich Pöschl
For understanding and assessing aerosol–cloud interactions and their impact on climate, reliable measurement data on aerosol particle hygroscopicity and cloud condensation nuclei (CCN) activity are required. The CCN activity of aerosol particles can be determined by scanning particle size and supersaturation (S) in CCN measurements. Compared to an existing differential mobility analyzer (DMA) with CCN activity measurement, a broad supersaturation scanning CCN (BS2-CCN) system, in which particles are exposed to a range of S simultaneously, can measure the CCN activity with a high time resolution. Based on a monotonic relation between the activation supersaturation of aerosol particles (Saerosol) and the activated fraction (Fact) of the BS2-CCN measurement, we can derive κ, a single hygroscopicity parameter, directly. Here, we describe how the BS2-CCN system can be effectively calibrated and which factors can affect the calibration curve (Fact−Saerosol). For calibration, size-resolved CCN measurements with ammonium sulfate and sodium chloride particles are performed under three different thermal gradient (dT) conditions (dT=6, 8, and 10 K). We point out key processes that can affect the calibration curve and thereby need to be considered as follows: first, the shape of the calibration curve is primarily influenced by Smax, the maximum S in the activation tube. We need to determine appropriate Smax depending on the particle size and κ to be investigated. To minimize the effect of multiply charged particles, a small geometric mean diameter (Dg) and geometric standard deviation (σg) in number size distribution are recommended when generating the calibration aerosols. Last, Fact is affected by particle number concentration and has a decreasing rate of 0.02 per 100 cm−3 due to the water consumption in the activation tube. For evaluating the BS2-CCN system, intercomparison experiments between typical DMA-CCN and BS2-CCN measurements were performed with a laboratory-generated aerosol mixture and ambient aerosols. Good agreement of κ values between DMA-CCN and BS2-CCN measurements for both experiments shows that the BS2-CCN system can measure CCN activity well compared to the existing measurement method and can measure a broad range of hygroscopicity distributions with a high time resolution (∼1 s vs. a few minutes for a standard CCN activity measurement). As the hygroscopicity can be used as a proxy for the chemical composition, our method can also serve as a complementary approach for fast and size-resolved detection and estimation of aerosol chemical composition.
- Article
(5404 KB) - Full-text XML
-
Supplement
(981 KB) - BibTeX
- EndNote


Atmospheric aerosol particles affect global climate change in that aerosols alter the radiative balance by scattering and absorbing shortwave and longwave radiation directly. Additionally, by serving as cloud condensation nuclei (CCN), atmospheric aerosol particles influence the radiative budget by modulating the microphysical structure, lifetime, and coverage of the clouds. Although the direct and indirect effects of aerosols on climate change are widely accepted within the scientific community, the assessment of aerosol–cloud interactions and the quantification of their effect on climate still remain largely uncertain (IPCC, 2013). Notably, one of the underlying challenges is to determine the ability of aerosol particles that act as cloud droplets, CCN activity, which has come up as a rising issue over the past years (McFiggans et al., 2006; Andreae and Rosenfeld, 2008; Hiranuma et al., 2011; Paramonov et al., 2013).
The CCN activity, meaning the fraction at which aerosol particles can be activated to become CCN, can be determined by particle size and chemical composition at a given water vapor supersaturation (Charlson et al., 2001; Andreae et al., 2005, 2009; McFiggans et al., 2006; Cai et al., 2018) and can be parameterized by a single parameter, κ (Petters and Kreidenweis, 2007). The activation S of aerosol particles can be estimated from dry particle diameter (Dd) and water activity (Köhler, 1936; Su et al., 2010). Once determined, the parameter κ can greatly simplify descriptions of the chemical composition effect in models.
κ is closely linked to the chemical compositions of aerosol particles, especially the ratio of organic to inorganic compositions. Thus, κ is expected to and has been demonstrated to show a size dependence due to the change in chemical compositions at different size ranges. However, size-resolved κ data are still limited due to the relatively slow response of the commercial instrument when scanning both S and Dd (Robert and Nenes 2005; Dusek et al., 2006; Moore and Nenes, 2009; Petters et al., 2009; Svenningsson et al., 2006; Wex et al., 2009; Rose et al., 2011; Zhao et al., 2015). For example, measurements based on the continuous-flow streamwise thermal-gradient CCN counter (CCNC) from Droplet Measurement Technologies (DMT) complete a cycle of size-resolved κ in about an hour due to the slow temperature stabilization (approximately a few minutes to stabilize) for changing new S. To solve the low-time-resolution problem, other techniques have been developed such as scanning flow CCN analysis (SFCA) that changes flow rate over time in the growth chamber under a constant temperature gradient (Moore and Nenes, 2009) and an instantaneous CCN spectrometer with more than 40 channels of supersaturation resolution from 0.01 % to 1.0 % (Hudson, 1989). Zhang et al. (2021) introduced a novel measurement technique using a humidity-controlled fast integrated mobility spectrometer (HFIMS) to measure size-resolved κ rapidly under subsaturated conditions.
Su et al. (2016) introduced a new concept for the design of a CCN counter, the broad supersaturation scanning (BS2) approach, for the rapid measurement of particle hygroscopicity and CCN activity. Compared to the measurement system of DMT-CCNC that applies a single S at the centerline, aerosol particles of the BS2-CCN system are introduced with a wider inlet at a low sheath-to-aerosol flow ratio (SAR) and are exposed to a range of S simultaneously. Through this new design of the CCNC, we can obtain a monotonic relation between the activated fraction of aerosols (Fact) and critical activation supersaturation (Saerosol) and thereby calculate the size-resolved Saerosol as well as κ directly. A decrease in time required for scanning S with the BS2-CCN system makes it possible to derive κ with a high temporal and size resolution. Additionally, a constant temperature difference minimizes the bias from the potential volatilization of aerosols in the instrument (Moore and Nenes, 2009).
In this study, we introduce the experimental setup of a materialized BS2-CCN system, including the newly designed inlet, and describe how the BS2-CCN system can be effectively calibrated. To validate the performance of the BS2-CCN system, we perform an intercomparison with the existing DMA-CCN measurement method using a laboratory-generated aerosol mixture and ambient aerosols.
2.1 Concept of BS2-CCNC
The BS2-CCN counter, a modified commercial DMT-CCNC with a newly designed inlet system, measures the activation of size-resolved CCN with a high time resolution (Su et al., 2016). Aerosol particles are introduced with a low SAR by a wider inlet and distributed over a continuous range of S in the activation tube, whereas aerosol particles in a commercial DMT-CCNC are forced onto the centerline facing a single S. The BS2-CCN system reduces the time required for scanning S and thereby obtains κ with a high temporal and size resolution by using a monotonic Fact−Saerosol relation. Figure 1 shows the comparison of supersaturation distribution in the activation tube of the CCNC, denoted by Stube, between a typical CCNC and a modified CCNC for the BS2-CCN system. Stube(r) is a function of r, the radial distance to the centerline of the activation unit, and is the highest in the centerline (r=0). For a typical CCNC, aerosol particles pass through the centerline in the activation tube by a narrow inlet and laminar sheath flow (Fig. 1a). Particles can be activated as CCN (i.e., Fact=1) when Saerosol of particles is lower than Stube(r=0) or cannot be activated (i.e., Fact=0) when Saerosol is higher than Stube(r=0). For the modified CCNC for the BS2-CCN system, aerosol particles are introduced in a broad cross section of the activation tube through a wider inlet of a low sheath-to-aerosol flow ratio (Fig. 1b). Therefore, aerosol particles show a monotonic dependence between Fact and Saerosol based on Stube distribution as they are simultaneously exposed to a wide range of S. The κ value of certain Dd can be derived by the Fact−Saerosol relation directly based on κ–Köhler theory. This relation implies that Saerosol can be directly determined depending on Fact and, it is therefore essential to get an accurate calibration curve (i.e., Fact−Saerosol relation).
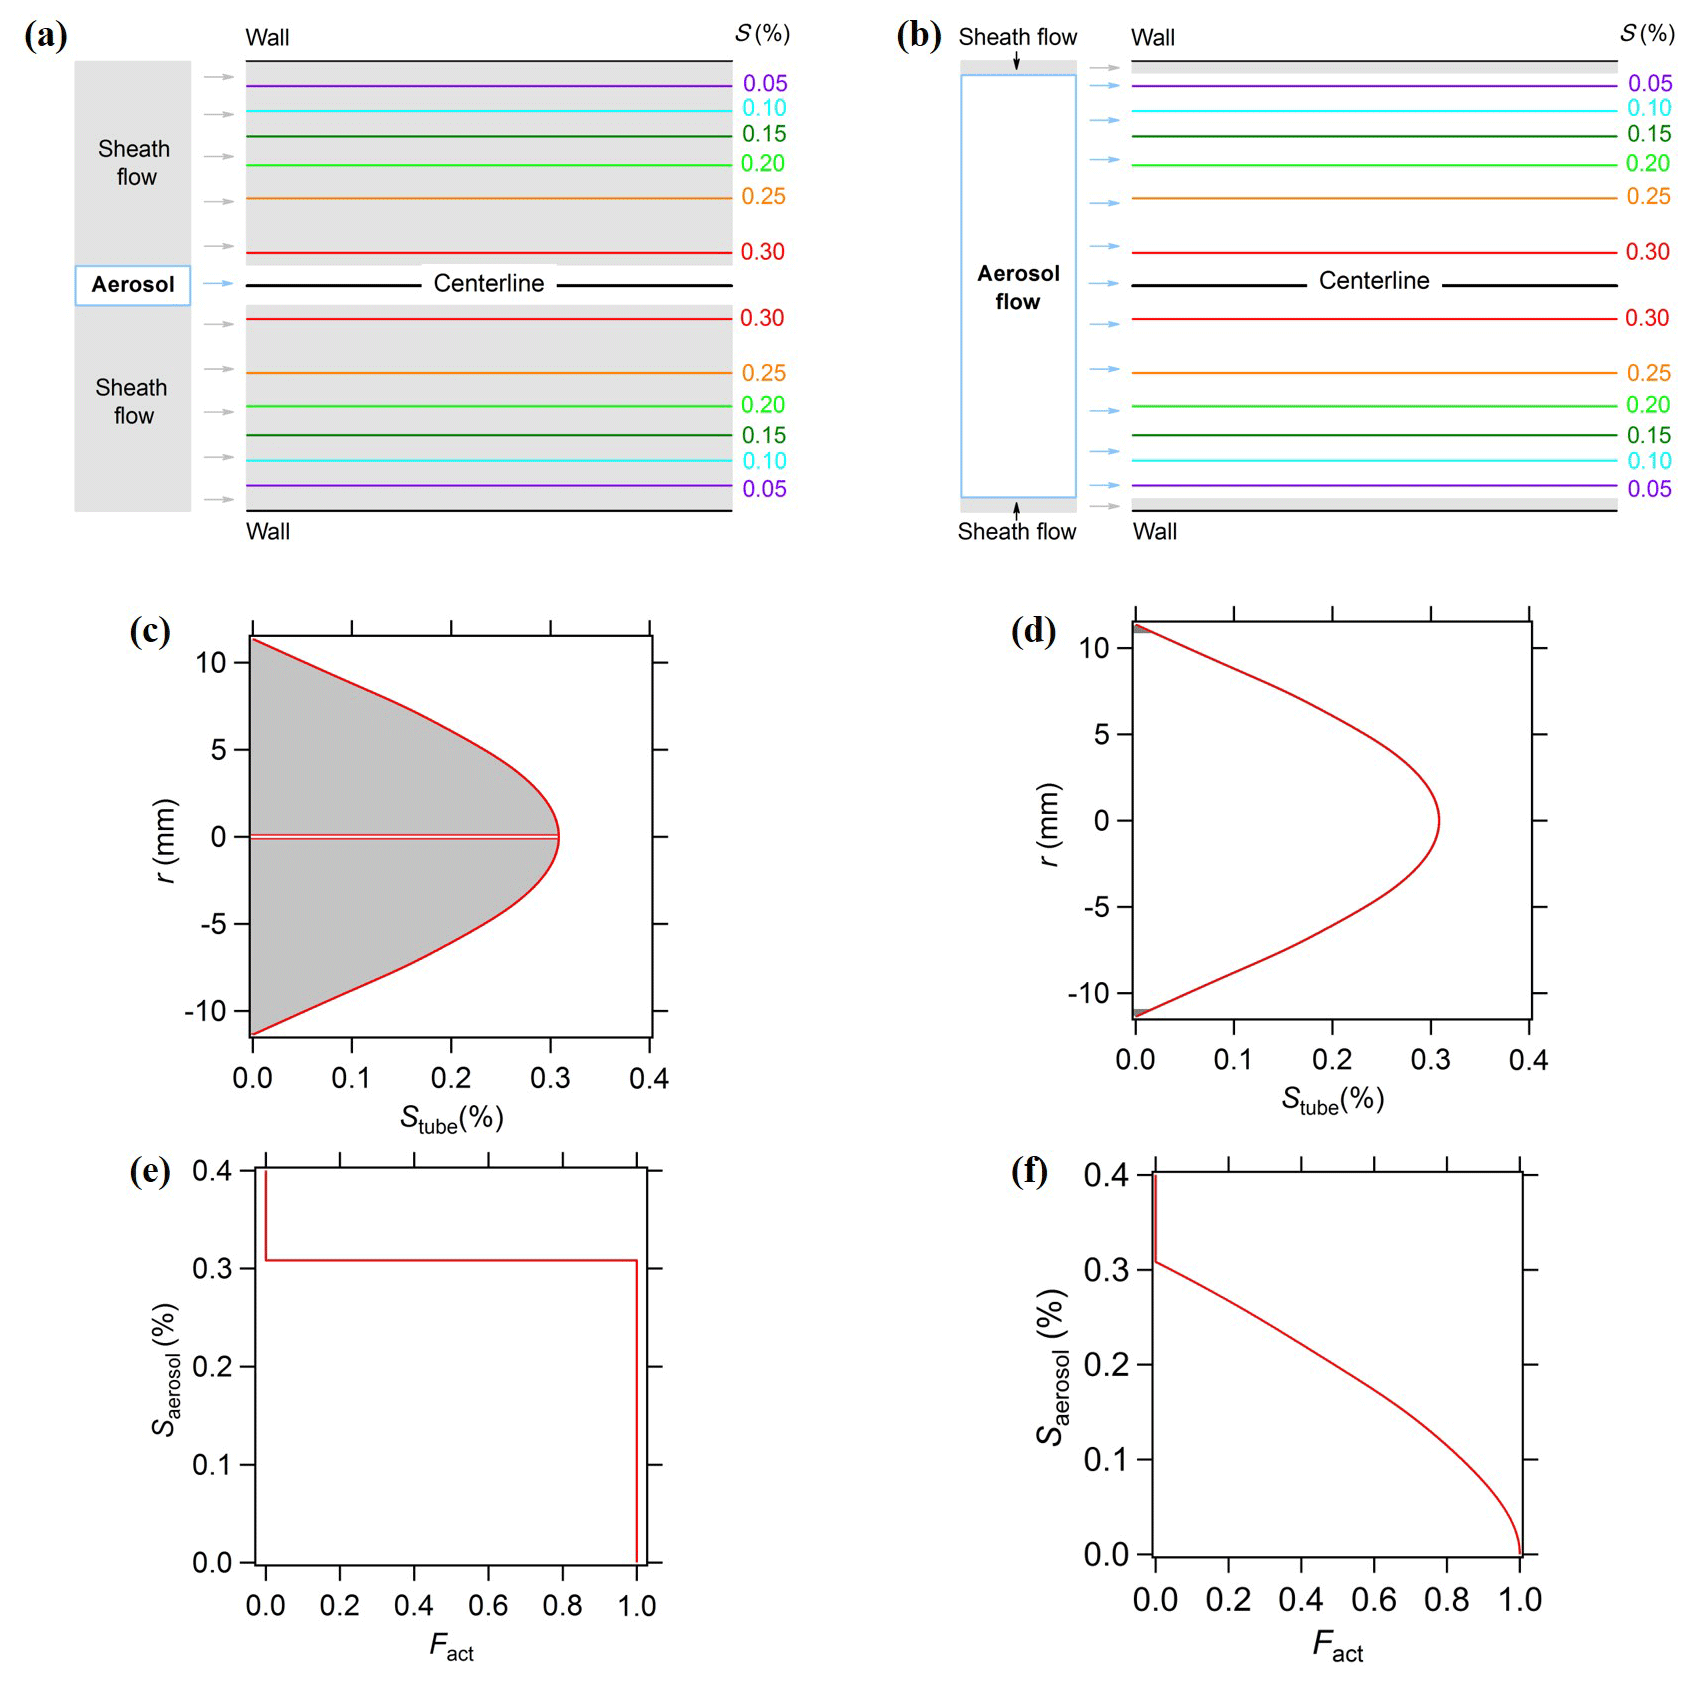
Figure 1Schematics of typical CCN (a, c, e) and BS2-CCN measurements (b, d, f). (a, b) Contour of supersaturation in the CCN activation unit and configuration of aerosol and sheath flow; (c, d) distribution of supersaturation in the activation unit (Stube). r is the radial distance to the centerline. The shaded areas represent the sheath flow part, and non-shaded areas represent the aerosol flow part. (e, f) Plot of the activation supersaturation of aerosol particles Stube against the activation fraction Fact. Reprinted from Su et al. (2016) under the Creative Commons Attribution 4.0 License.
2.2 Experimental setup
Figure 2 shows the schematic plot of the instrumental setup for the BS2-CCN system. The setup consists of an aerosol classifier, a condensation particle counter (CPC), a modified DMT-CCNC, and other components to maintain and monitor the working system. The aerosol sample is firstly dried to RH<30 % with an aerosol dryer before entering the aerosol classifier (TSI classifier 3080). A sensor to monitor the temperature (T), pressure (P), and RH of the aerosol sample is placed in the aerosol flow pathway. A Y-shaped splitter is mounted at the outlet of the aerosol classifier to split the selected monodispersed aerosols into two aerosol flows: CPC (TSI CPC 3772) and modified DMT-CCNC (CCN 100, DMT).
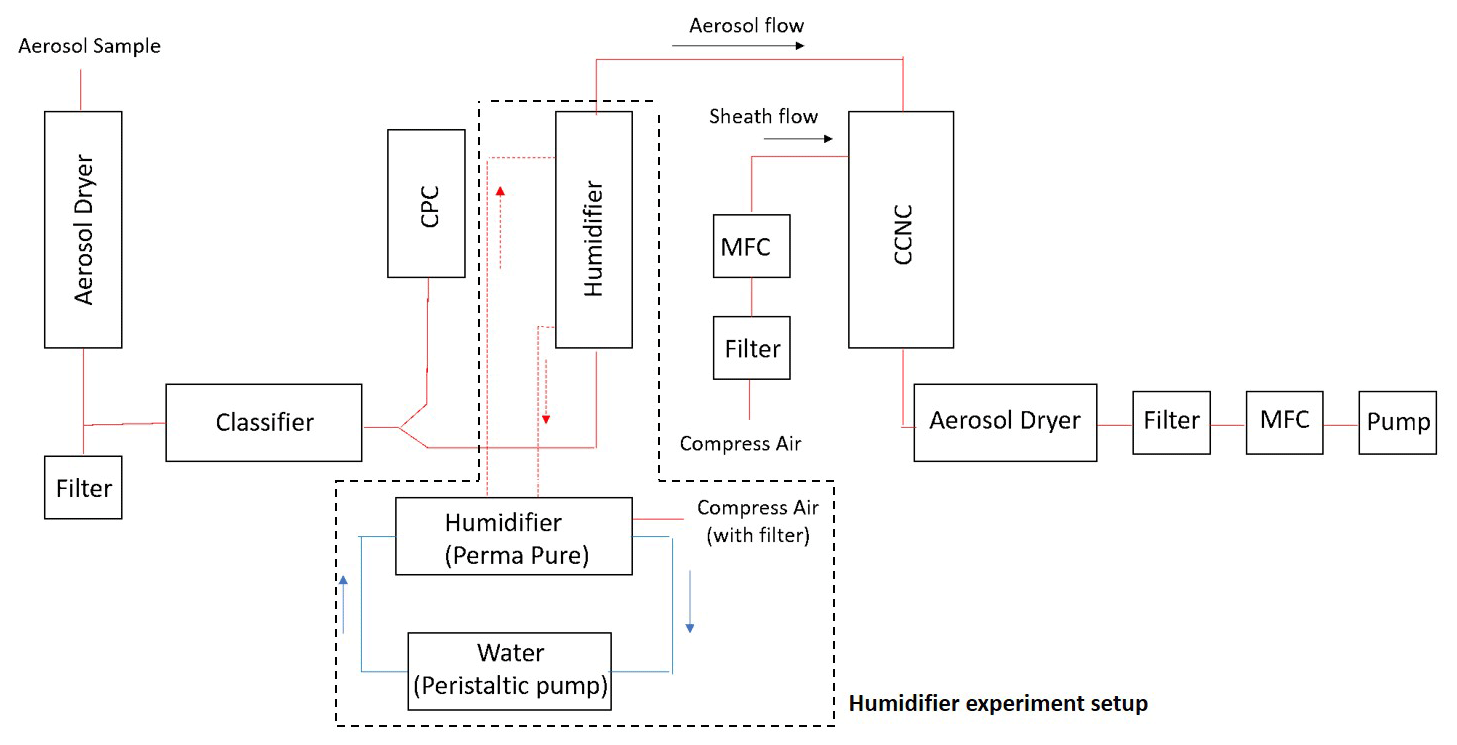
Figure 2Schematic plot of a broad scanning supersaturation cloud condensation nuclei counter (BS2-CCN) system. An additional setup marked with a dashed line is for a humidifier experiment.
Compared to the commercial DMT-CCNC, the modified DMT-CCNC has a redesigned inlet and flow-maintaining system. The newly designed diffusive inlet is used to distribute aerosol samples widely in the activation tube, as detailed in Appendix A and Fig. A1. According to the computational dynamic simulation result (COMSOL Multiphysics, version 5.6) of flow streamline and the relative particle concentration in Fig. A2, laminar flow inside the activation tube can be achieved with our new inlet design. Additionally, this new inlet allows for maintaining stable low sheath-to-aerosol flow ratios (SARs), for which a monotonic Fact−Saerosol relation can then be obtained. Compressed air is used to provide the sheath flow with a HEPA filter in-line to remove all particles in the flow. Its volume flow rate is controlled by a mass flow controller (MFC, Bronkhorst). The aerosol and sheath flows are set to 0.46 and 0.04 L min−1, respectively. The calibration curves with the different flow set in Fig. S1 in the Supplement show that, if the sample flow is set low, the slope between Fact and Saerosol gradually decreases due to the narrow S distribution in the activation tube, making it difficult to obtain a monotonic relationship. It is noted that the total flow in the modified DMT-CCNC is maintained at 0.5 L min−1 by a vacuum pump with an MFC and filter.
To avoid water depletion in the activation tube due to a high particle number concentration, an aerosol humidifier is placed in the aerosol flow pathway to pre-humidify the monodispersed aerosol before it enters the activation tube (dashed line in Fig. 2). Pure water is circulated between the humidifier and a water reservoir by the bath circulator (Thermo Scientific).
NCCN is recalculated with bin count data and sample flow as NCCN values recorded in the instrument software are different from what we measure due to the separated flow control system in the modified DMT-CCNC. It can be calculated as follows.
The 60 is a unit conversion factor since bin counts are given in particles per second, while sample flow is in . Particle number concentration (i.e., number concentration of condensation nuclei, NCN) is measured by the CPC. Fact is calculated as the ratio of NCN and NCCN. Figure S2 in the Supplement is an exemplary Dp scan with ammonium sulfate particles to examine the time resolution of the BS2-CCN system. Fact of each diameter is measured every 40 s including stabilization. It is noted that NCN and NCCN data have 1 s time resolution, and thereby Fact data with 1 s time resolution are initially available. For scanning, it takes up to 10 s to stabilize immediately after changing the particle size. Absolute deviation of Fact is mostly less than 0.05 except when Fact is higher than 0.85. In other words, we could get a reliable κ value, derived by Fact directly, in 1 s time resolution after stabilization for Dp scan measurements. Additionally, if we set a single particle size, we could derive a κ value in 1 s time resolution. However, in this study, for the calibration experiment, we use 1 min average data including stabilization time to calculate the Fact value corresponding to each Dd.
3.1 Calibrations
For the calibration of the BS2-CCN system, the goal is to determine the monotonic Fact−Saerosol relation, as discussed above. This can be obtained from size-resolved CCN measurement with pure calibration aerosols, e.g., ammonium sulfate and sodium chloride, in which hygroscopic properties are well known. A specific Saerosol corresponding to each Dd can be calculated from an approximate solution in Eq. (2).
The Fact value of each Dd can be measured by the size-resolved CCN measurement, and thereby we can get a calibration curve, Fact−Saerosol, relation. Figures 3 and 8 show exemplary calibration curves obtained in this study. We investigate the impact of several factors that may affect the calibration results.
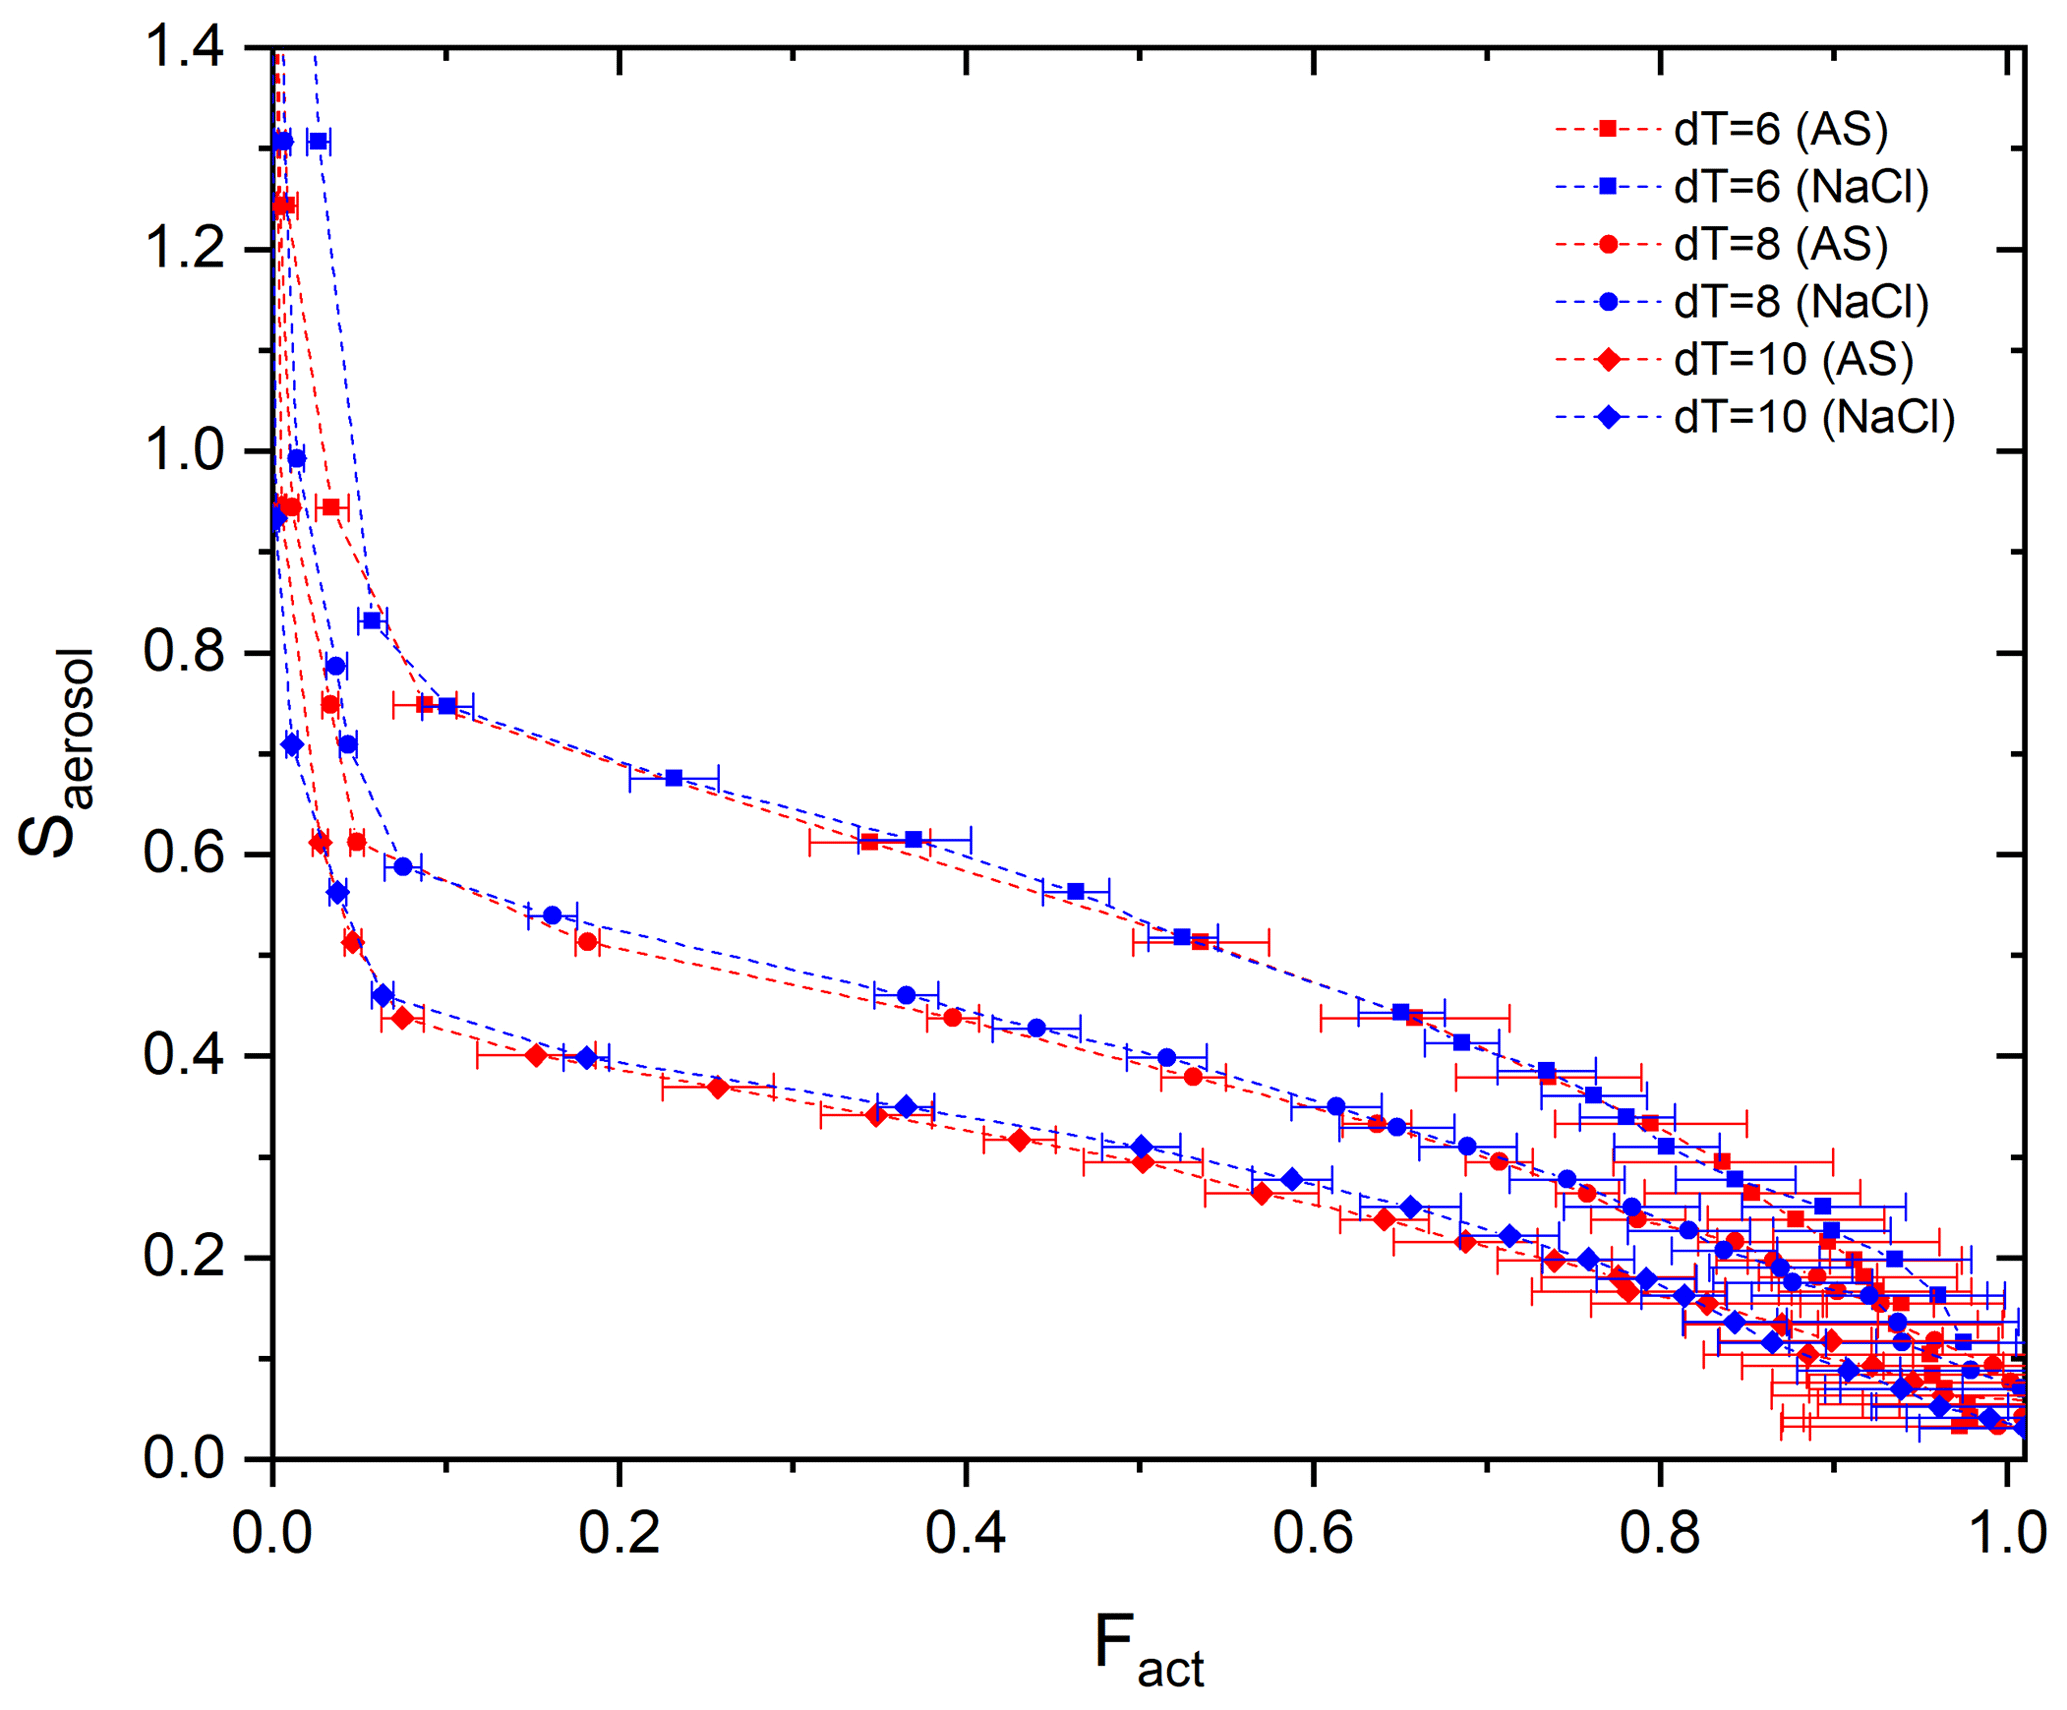
Figure 3Calibration curves (Fact−Saerosol) for three different T gradients (dT=6, 8, and 10 K) with ammonium sulfate (red) and sodium chloride (blue) particles.
3.1.1 Stube distribution
Stube distribution in the activation tube shows the maximum in the centerline (i.e., Smax) and the minimum at the edge (Fig. 1). Depending on the temperature gradient, controlled by the temperature difference (dT) between the top and the heated bottom of the activation tube, the distribution of Stube varies, resulting in different shapes of the calibration curve. Figure 3 shows the calibration curves depending on temperature gradients (dT=6, 8, and 10 K). For calibration experiments, we used an aerosol atomizer to generate particles with diameters of 20–300 nm of ammonium sulfate (purity >99.5 %, VWR Chemicals) and sodium chloride (purity >99.5 %, Sigma-Aldrich) solutions. According to Fig. 3, the monotonic Fact−Saerosol relation is confirmed by the investigated aerosol systems. Good agreement between the two calibration aerosols for all three dT conditions shows the reproducibility and stability of the BS2 system in measuring CCN activity, supporting its application in the real atmosphere. Large standard deviations at a high Fact range are mainly caused by the low particle counts NCN at large diameters (e.g., less than 20 cm−3).
Although the calibration curve covers the whole range of Fact, we suggest using only the center part of the curve from 0.1 to 0.9 of Fact. This is because a steeper slope at low Fact and the aforementioned low NCN at high Fact can introduce large uncertainties in the retrieved Saerosol and κ. Moreover, it is essential to determine an appropriate dT so that the supersaturation at the centerline, Smax, is higher than the highest Saerosol of aerosol particles for the investigated size range and environment. For the dependence of Saerosol, κ, and Dd, please refer to the κ–Köhler equation (Petters and Kreidenweis, 2007) and exemplary Fig. 2 in Wang et al. (2015).
3.1.2 Minimizing the effect of doubly or multiply charged aerosols
Particles of given electrical mobility passed through the DMA are not all singly charged as a DMA extracts particles with a narrow range of electrical mobility rather than a geometric diameter. Multiply (mostly doubly) charged particles with a larger size also penetrate the DMA, accompanying the singly charged particles with a targeted diameter. As the CCN activation of a particle strongly depends on its size, a high fraction of doubly charged particles can directly affect the calibration curve (i.e., Fact−Saerosol relation).
To solve this problem, Frank et al. (2006) suggested a correction method that subtracts the doubly charged particle distribution in the number size distribution of polydisperse calibration aerosol from under the assumption of a bipolar equilibrium charge distribution. Rose et al. (2008) proposed the simple alternative method that calculates the fraction of activated doubly charged particles from the lower level of the plateau in the CCN spectrum, assuming a constant fraction over the whole particle size range. However, these methods are for the CCN efficiency spectra of typical CCNC using a single S in the centerline of the activation tube. As BS2-CCNC has a wide range of S simultaneously in the activation tube and the number concentration of activated particles is different depending on S, it is quite complicated to apply existing methods to experimental data. Here, we compare CCNC responses with and without considering doubly charged aerosol particles and how it depends on the size distribution of calibration aerosols through calculation and experiment results.
We use an activation model that describes the CCNC response to the transferred polydisperse charge-equilibrated particles through an ideal DMA, similar to Petters et al. (2007). Considering electrical mobilities of particles classified by DMA and the fraction of particles carrying n charges (+1, +2) at charge equilibrium, this model calculates an idealized CCN instrument response with an assumed lognormal particle size distribution. When calculating the number of particles that activate as CCN, we need to consider the activation fraction for each aerosol particle size. As the aerosol particles in the BS2-CCN system are distributed in a broad cross section of the activation tube, the activation fraction is calculated by integrating the activation fraction function and flow velocity over the cross section of the aerosol flow. The detailed calculation procedure is described in Sect. S1 in the Supplement.
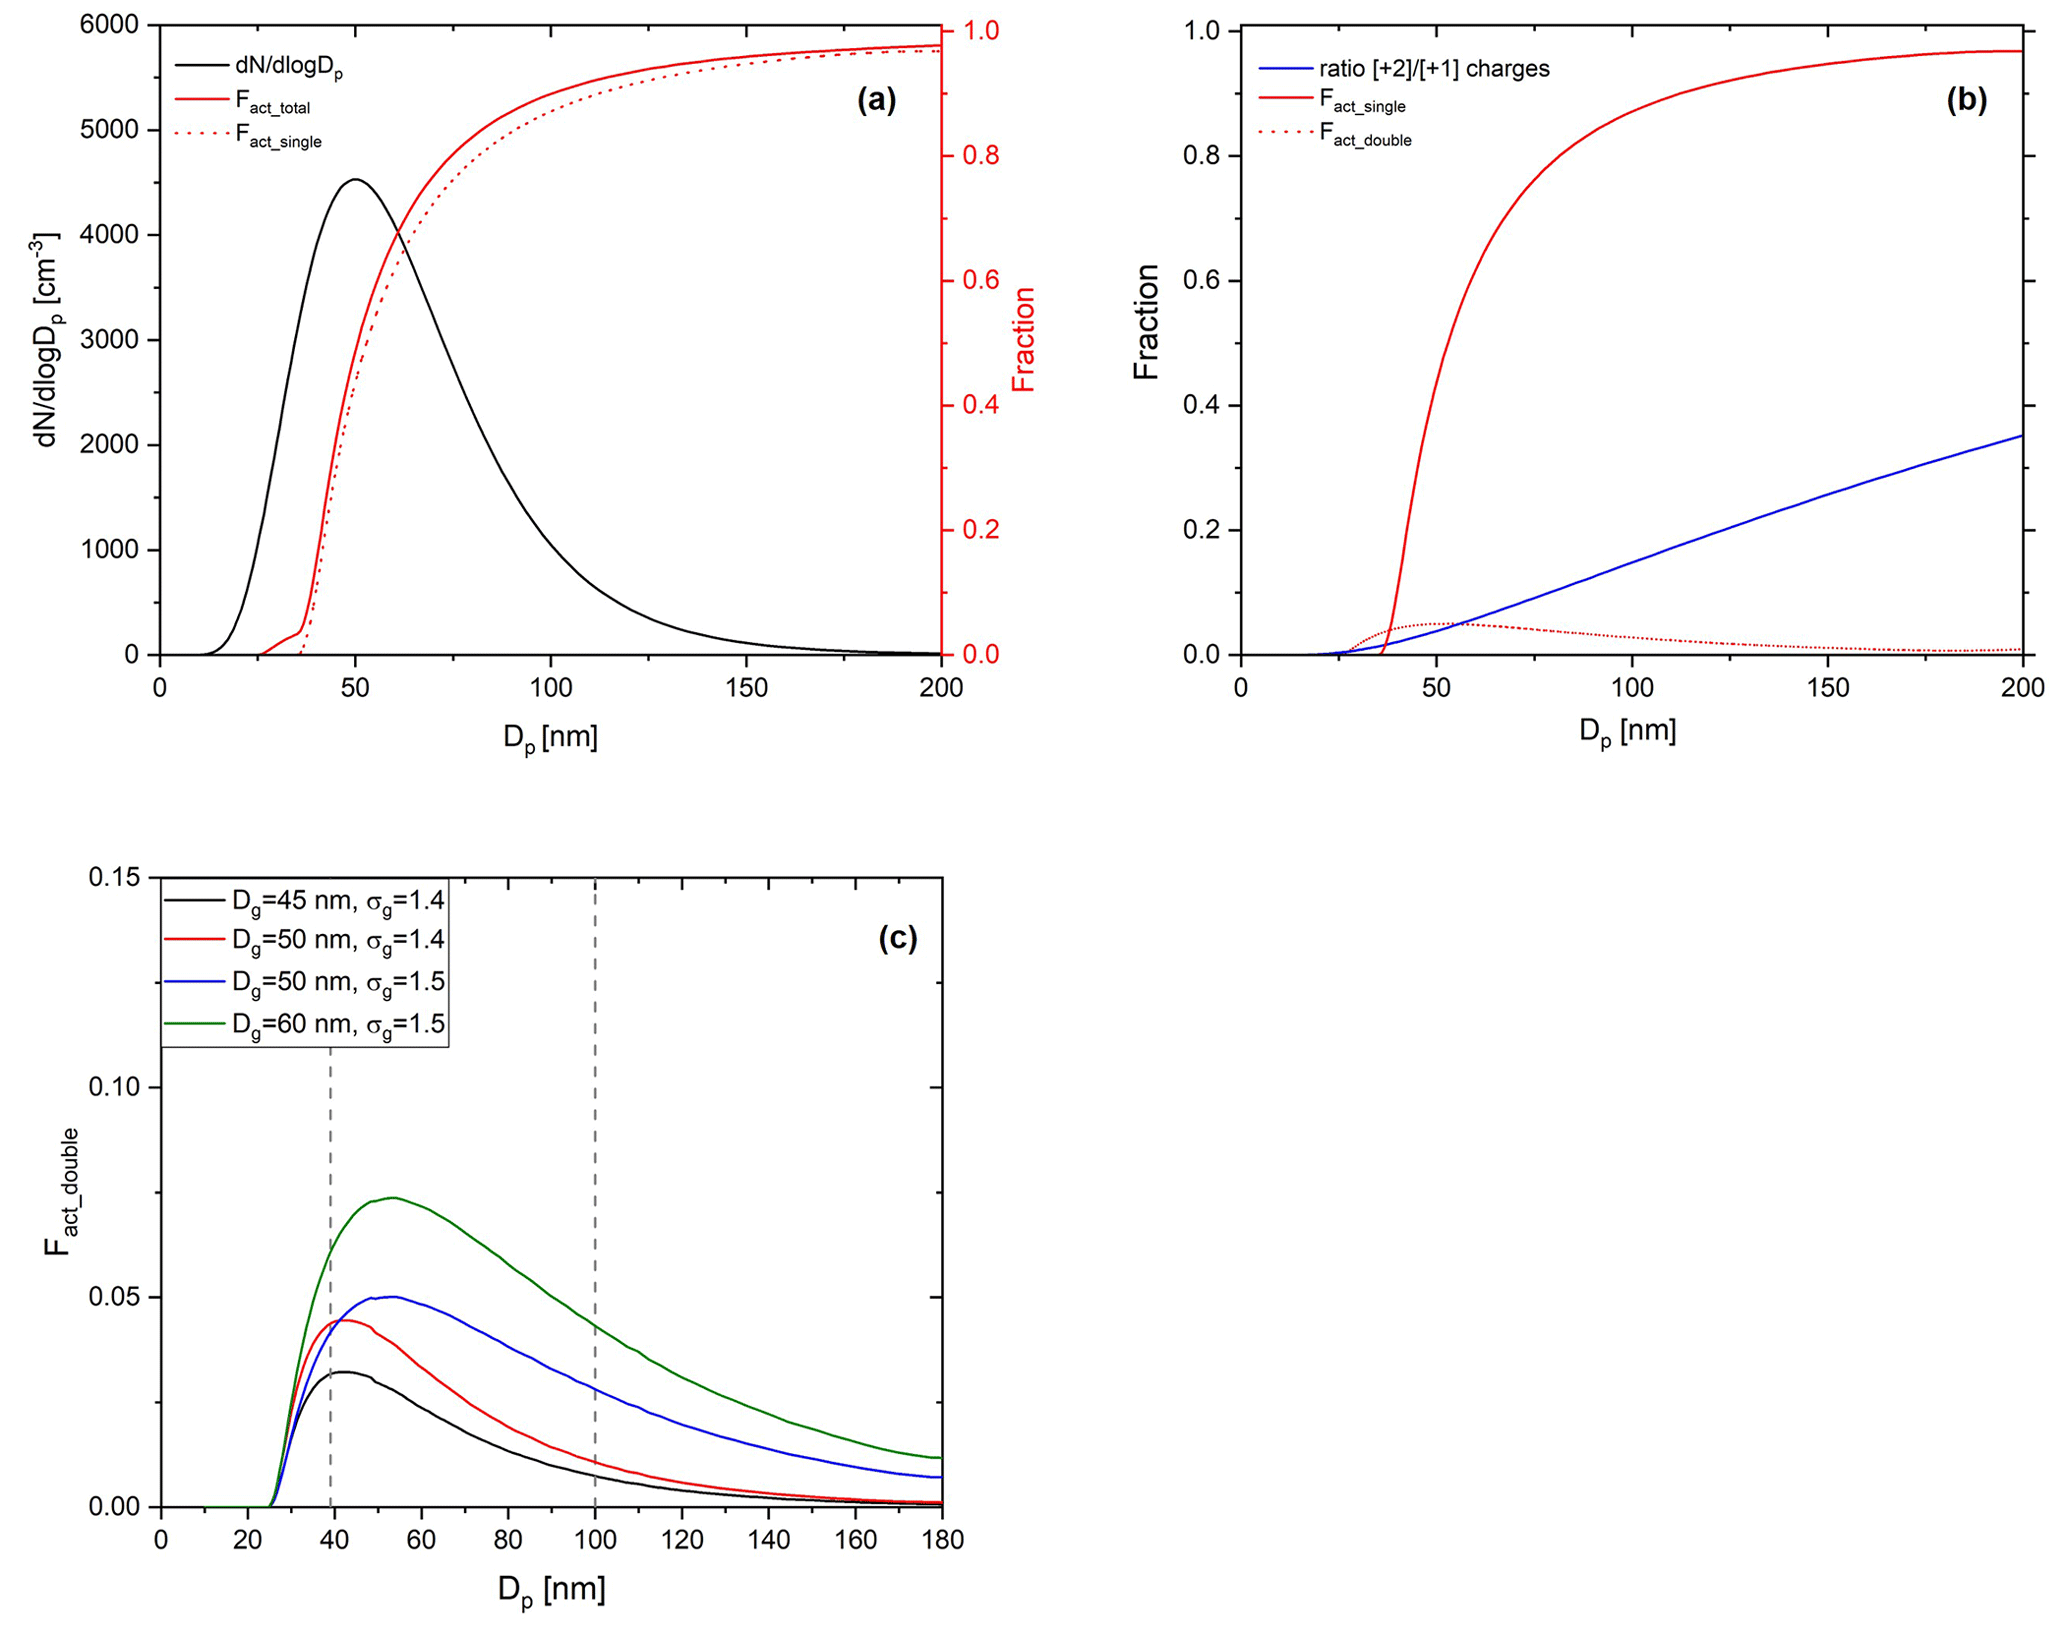
Figure 4Calculated ideal activation fraction for lognormally distributed, charge-equilibrated particles transmitted in the BS2-CCNC system. Shown are the (a) assumed lognormal particle size distribution (black solid line, left ordinate, , Dg=50 nm, and σg=15), total activation fraction (red solid line), activation fractions by singly charged particles (red dashed line), (b) activation fraction by singly charged particles (red solid line) and doubly charged particles (red dashed line), and the ratio of charges (blue solid line), which refers to with mobility diameter at charge equilibrium. f(D,n) is the fraction of particles carrying n charges at charge equilibrium by Wiedensohler (1988) and (c) activation fractions by doubly charged particles (Fact_double) for variant particle size distributions. Information on each particle size distribution is presented in the legend of the figure.
Figure 4 shows the calculated activation fraction ( for ammonium sulfate aerosols and the ratio of charges at charge equilibrium of an assumed lognormal size distribution with , and σg=1.5. Sheath flow (Qsh) and aerosol flow (Qa) of DMA were set to 10 and 1.5 L min−1, respectively, which are the same as the calibration experiment. It is noted that we used the physicochemical properties of ammonium sulfate for the calculation and set 0.63 % for Smax for the S distribution in the activation tube when calculating the activation fraction of aerosol particles. A small plateau exists in an area where the Fact is low (Dp<40 nm) due to doubly charged particles; however, the overall effect of multiply charged particles on Fact is not significant and is a small effect. The maximum Fact_double in the assumed particle size distribution is about 0.04. According to Fig. 4c, the Fact_double varies depending on the particle size distribution. The Fact_double not only increases as the value of Dg increases, but also increases as the σg increases, even if the Dg is the same. As the Fact directly affects the calculation of κ for the BS2-CCN system, the effect of particle size distribution still needs to be considered even though Fact_double<0.1 for the Dg=60 nm case. Therefore, when generating calibration aerosols, small Dg and σg in number size distribution are recommended to minimize the effect of multiply charged particles on the calibration curve. These effects can also be seen in the calibration experiment using sodium chloride. Figure 5 presents the calibration curves and number size distribution of NCN and NCCN of sodium chloride particles for dT=10 and 8 K. Sodium chloride that has a high κ value (κ=1.28) shows variant calibration curves depending on the particle number size distribution, whereas ammonium sulfate shows only small change in the calibration curves (Fig. S3). The Fact in the calibration curve is higher for larger peak diameter (Dpeak), and accordingly, the gap in the calibration curve between the ammonium sulfate and sodium chloride increases. Specifically, according to Fig. 5a (dT=10 K), the calibration curve of sodium chloride particles with Dpeak of 31 nm matches that of ammonium sulfate well. However, the calibration curve of sodium chloride with Dpeak of 37 and 52 nm is inconsistent with that of ammonium sulfate. This effect is more pronounced at higher supersaturation conditions. Both calculation and experiment results imply that the number size distribution of the generated particles should be considered, especially when using sodium chloride during calibration, and it is recommended to generate aerosols with Dpeak corresponding to an Fact less than 0.3. The number size distribution of generated calibration aerosols can be controlled by adjusting the particle concentration. Assuming the atmospherically relevant particle number size distribution with , Dg=80 nm, and σg=1.5 from Rose et al. (2011), Fact_double is up to 0.05 (Fig. S4 in the Supplement). It is noted that aerosol with κ of 0.3 is assumed to be internally mixed, and Smax is set to 0.2 %. Although the effect of doubly charged particles in Fig. S4 is not significant, the effect of doubly charged particles cannot be ignored if Dg or σg becomes large in specific environments or conditions.
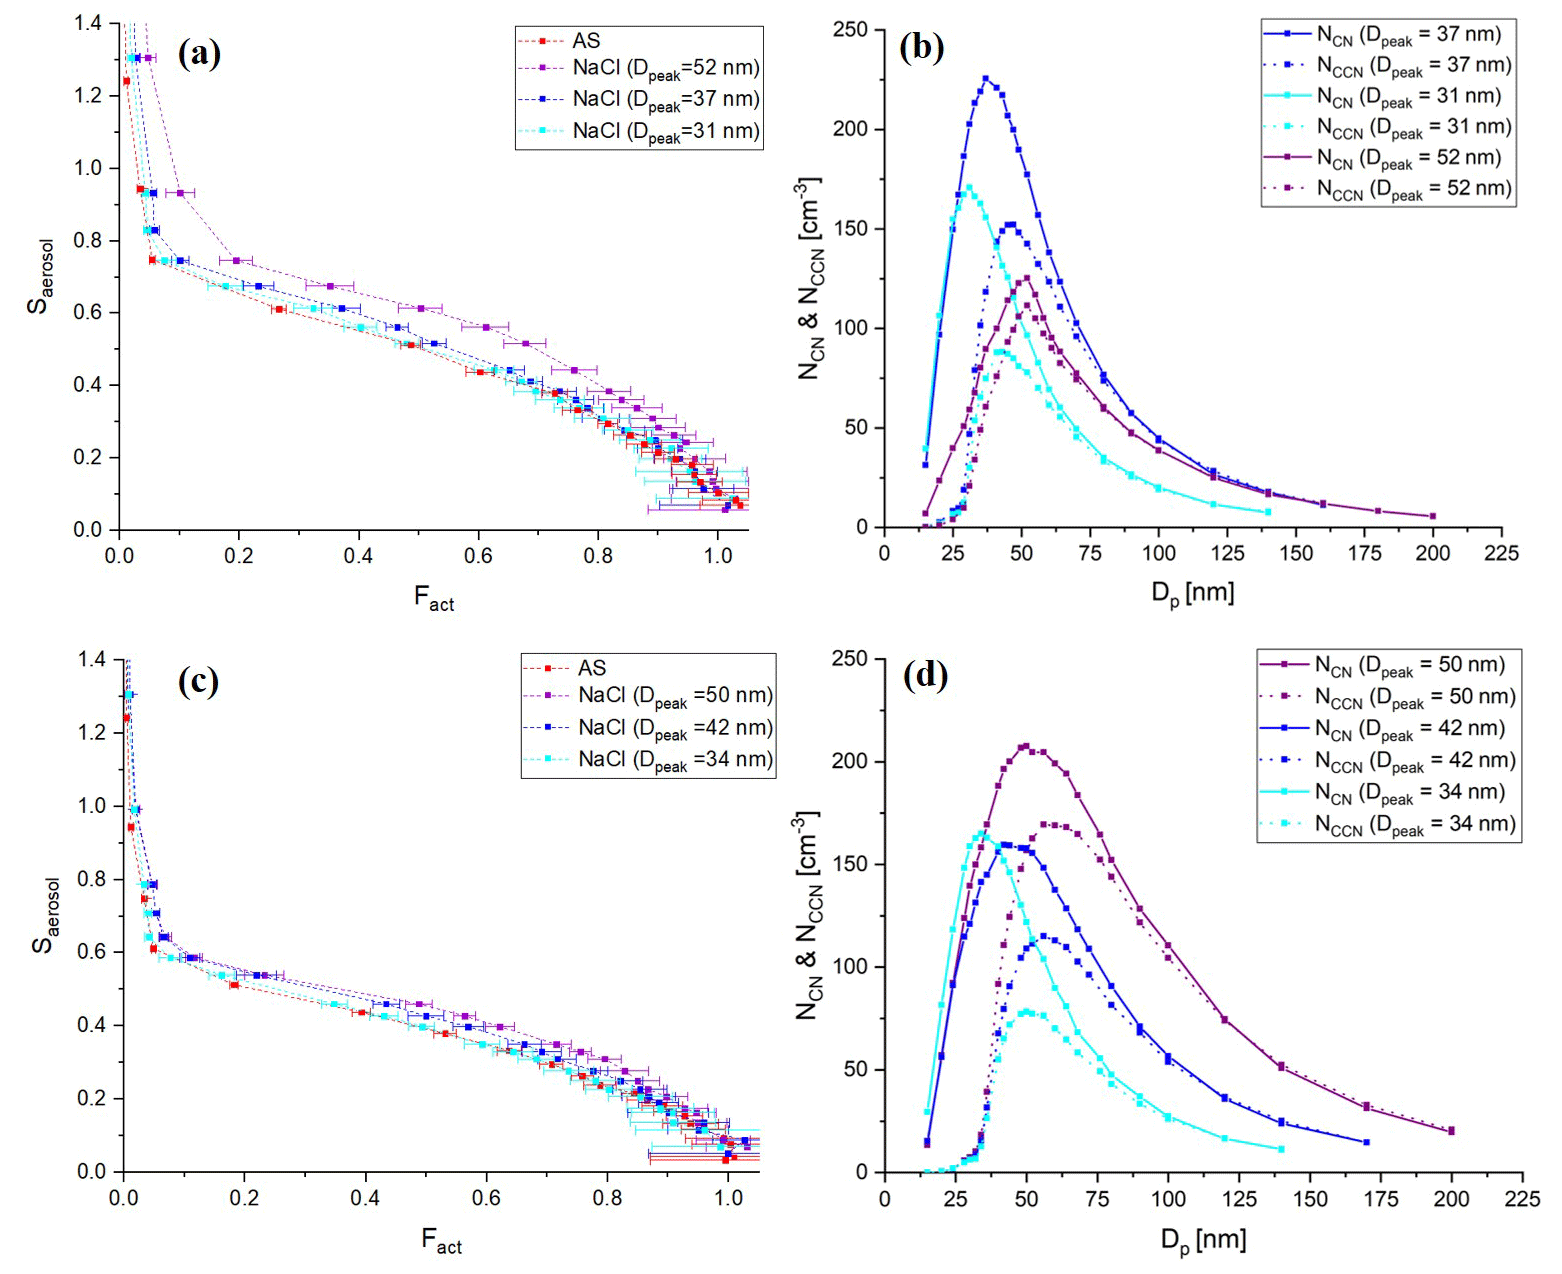
Figure 5Calibration curves of ammonium sulfate and sodium chloride for (a) dT=10 K and (c) dT=8 K as well as the number size distribution of NCN and NCCN for sodium chloride particles for (b) dT=10 K and (d) dT=8 K.
3.1.3 Effect of particle number concentration
As the modified CCNC enlarges the cross section of aerosol flow, more particles can enter the column compared to the standard DMT-CCNC. The consumption of water vapor in the column by a large number of particles can change the distribution of the supersaturation and thereby influence the measured number fraction of activated particles. Therefore, as a simple test, the Fact values of three different sizes of ammonium sulfate particles (60, 80, and 120 nm) are measured under the different particle number concentrations. In this experiment, dT is set to 7.7 (S=0.6 %). According to Fig. 6, we can see that Fact decreases with a rate of about 0.02 per 100 cm−3 with the increase in the particle number concentration. Specifically, Fact decreases by about 2.6 % (60 nm), 1.6 % (80 nm), and 1.1 % (120 nm) per increase of 100 cm−3 in the number of particles. It is noted that the decrease with particle number is calculated for a particle number concentration of 300 cm−3 of ammonium sulfate, and the decrease is expected to be greater if the number concentration increases. The decreasing rate increases slightly as the particle size decreases. These results imply that the number concentration of calibration aerosols can affect the calibration result, and we can get consistent results even in very low number concentrations from this BS2-CCNC setup.
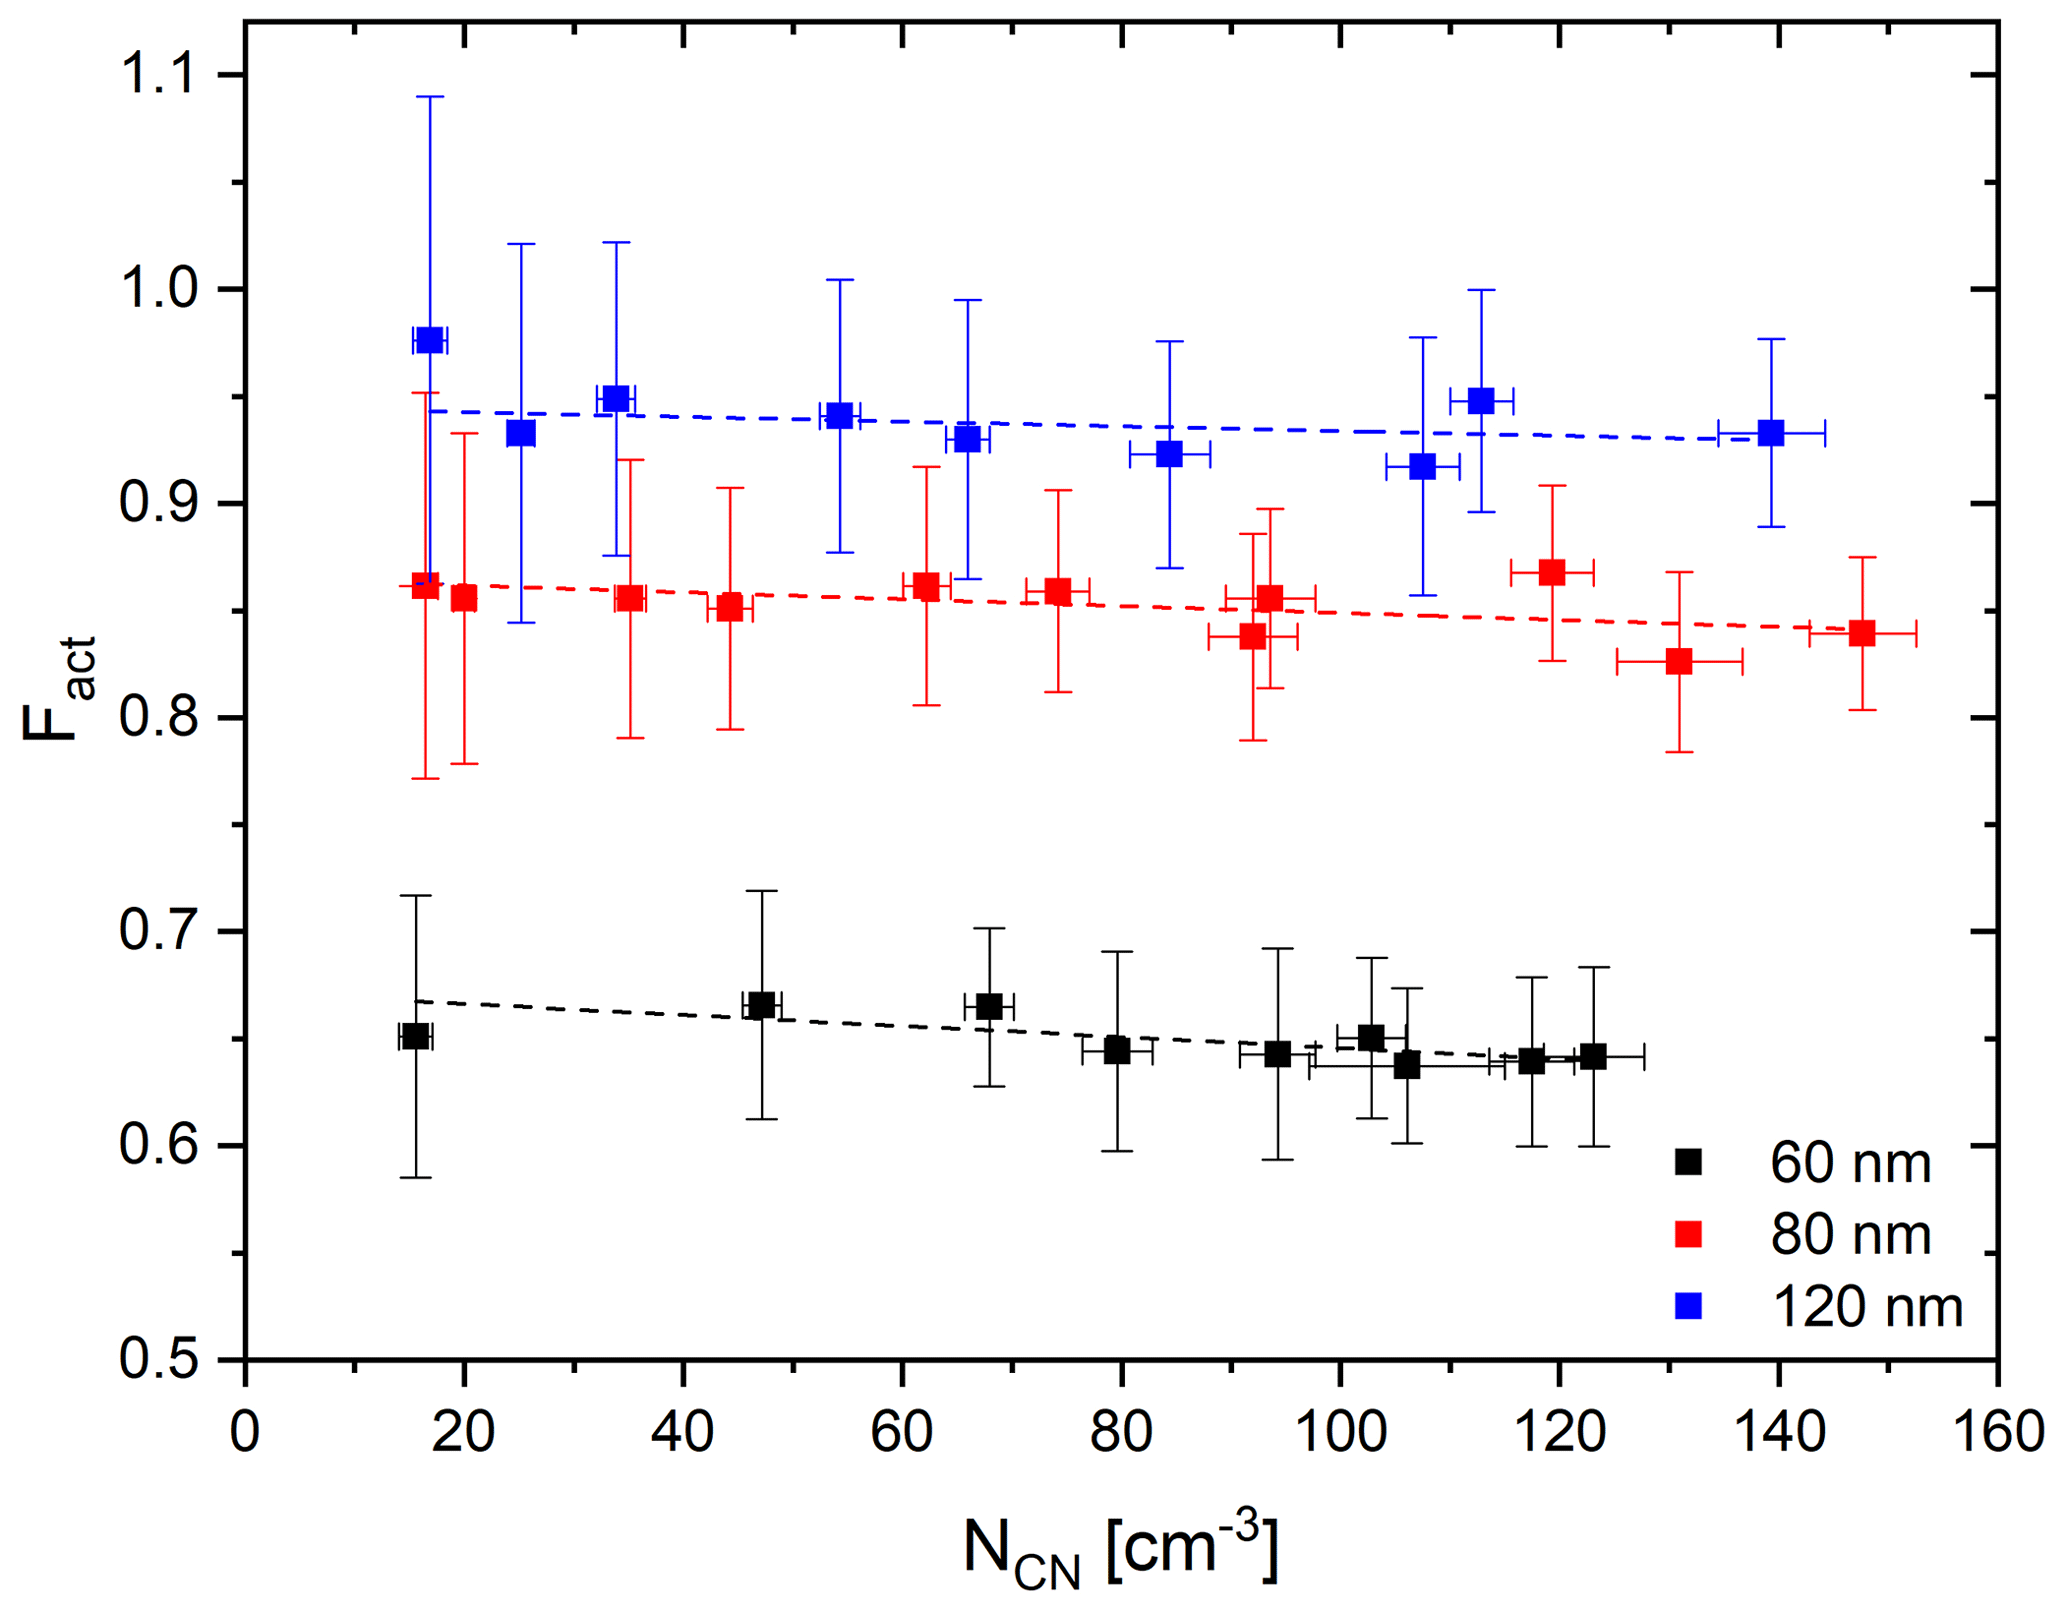
Figure 6Average and standard deviation (error bar) of Fact depending on the number concentration NCN for 60 (black), 80 (red), and 120 nm (blue) of ammonium sulfate particles under the dT=7.7 K (0.6 % S) condition. Dashed lines indicate linear regression lines.
To examine the necessity of a humidifier to avoid water consumption in the activation tube, an aerosol humidifier is additionally installed in the aerosol flow pathway. The setup is described in Fig. 2, and the part is marked by the blue dashed line. Monodispersed aerosols are pre-humidified by the humidifier that is composed of a Nafion tube and a bath circulator before the aerosol flow enters the BS2-CCN system. Particle number concentrations are controlled within the range of ∼300 cm−3. Figure 7 shows the calibration curves for three dT conditions (dT=6, 8, and 10 K) with a humidifier (blue dots) and without a humidifier (black dots). For dT=6 K, the calibration curves with the humidifier system (WH) and without the humidifier system (NH) are almost identical. Although Fact values of WH are slightly higher than those of NH under higher dT conditions (i.e., dT=8 and 10 K), differences are not significant as number concentrations of calibration aerosols are not so high. In other words, a compact instrumental setup without the pre-humidifier system is sufficient for the BS2-CCNC calibration experiment as well as the measurement if aerosol particles are kept below . Otherwise, we need a pre-humidifier system for conditions of high aerosol number concentration to avoid the decrease in Fact. It is noted that particle concentrations below are recommended to avoid counting errors for a calibration experiment with a typical DMT-CCNC (Rose et al., 2008). We usually observe a low number concentration for aerosol particles during size-resolved CCN measurements, and Fact is not highly variable within that range. However, we still need to consider this effect, especially for the region of high number concentration and/or high-number-concentration cases like new particle formation (NPF) events and the transport of pollution.
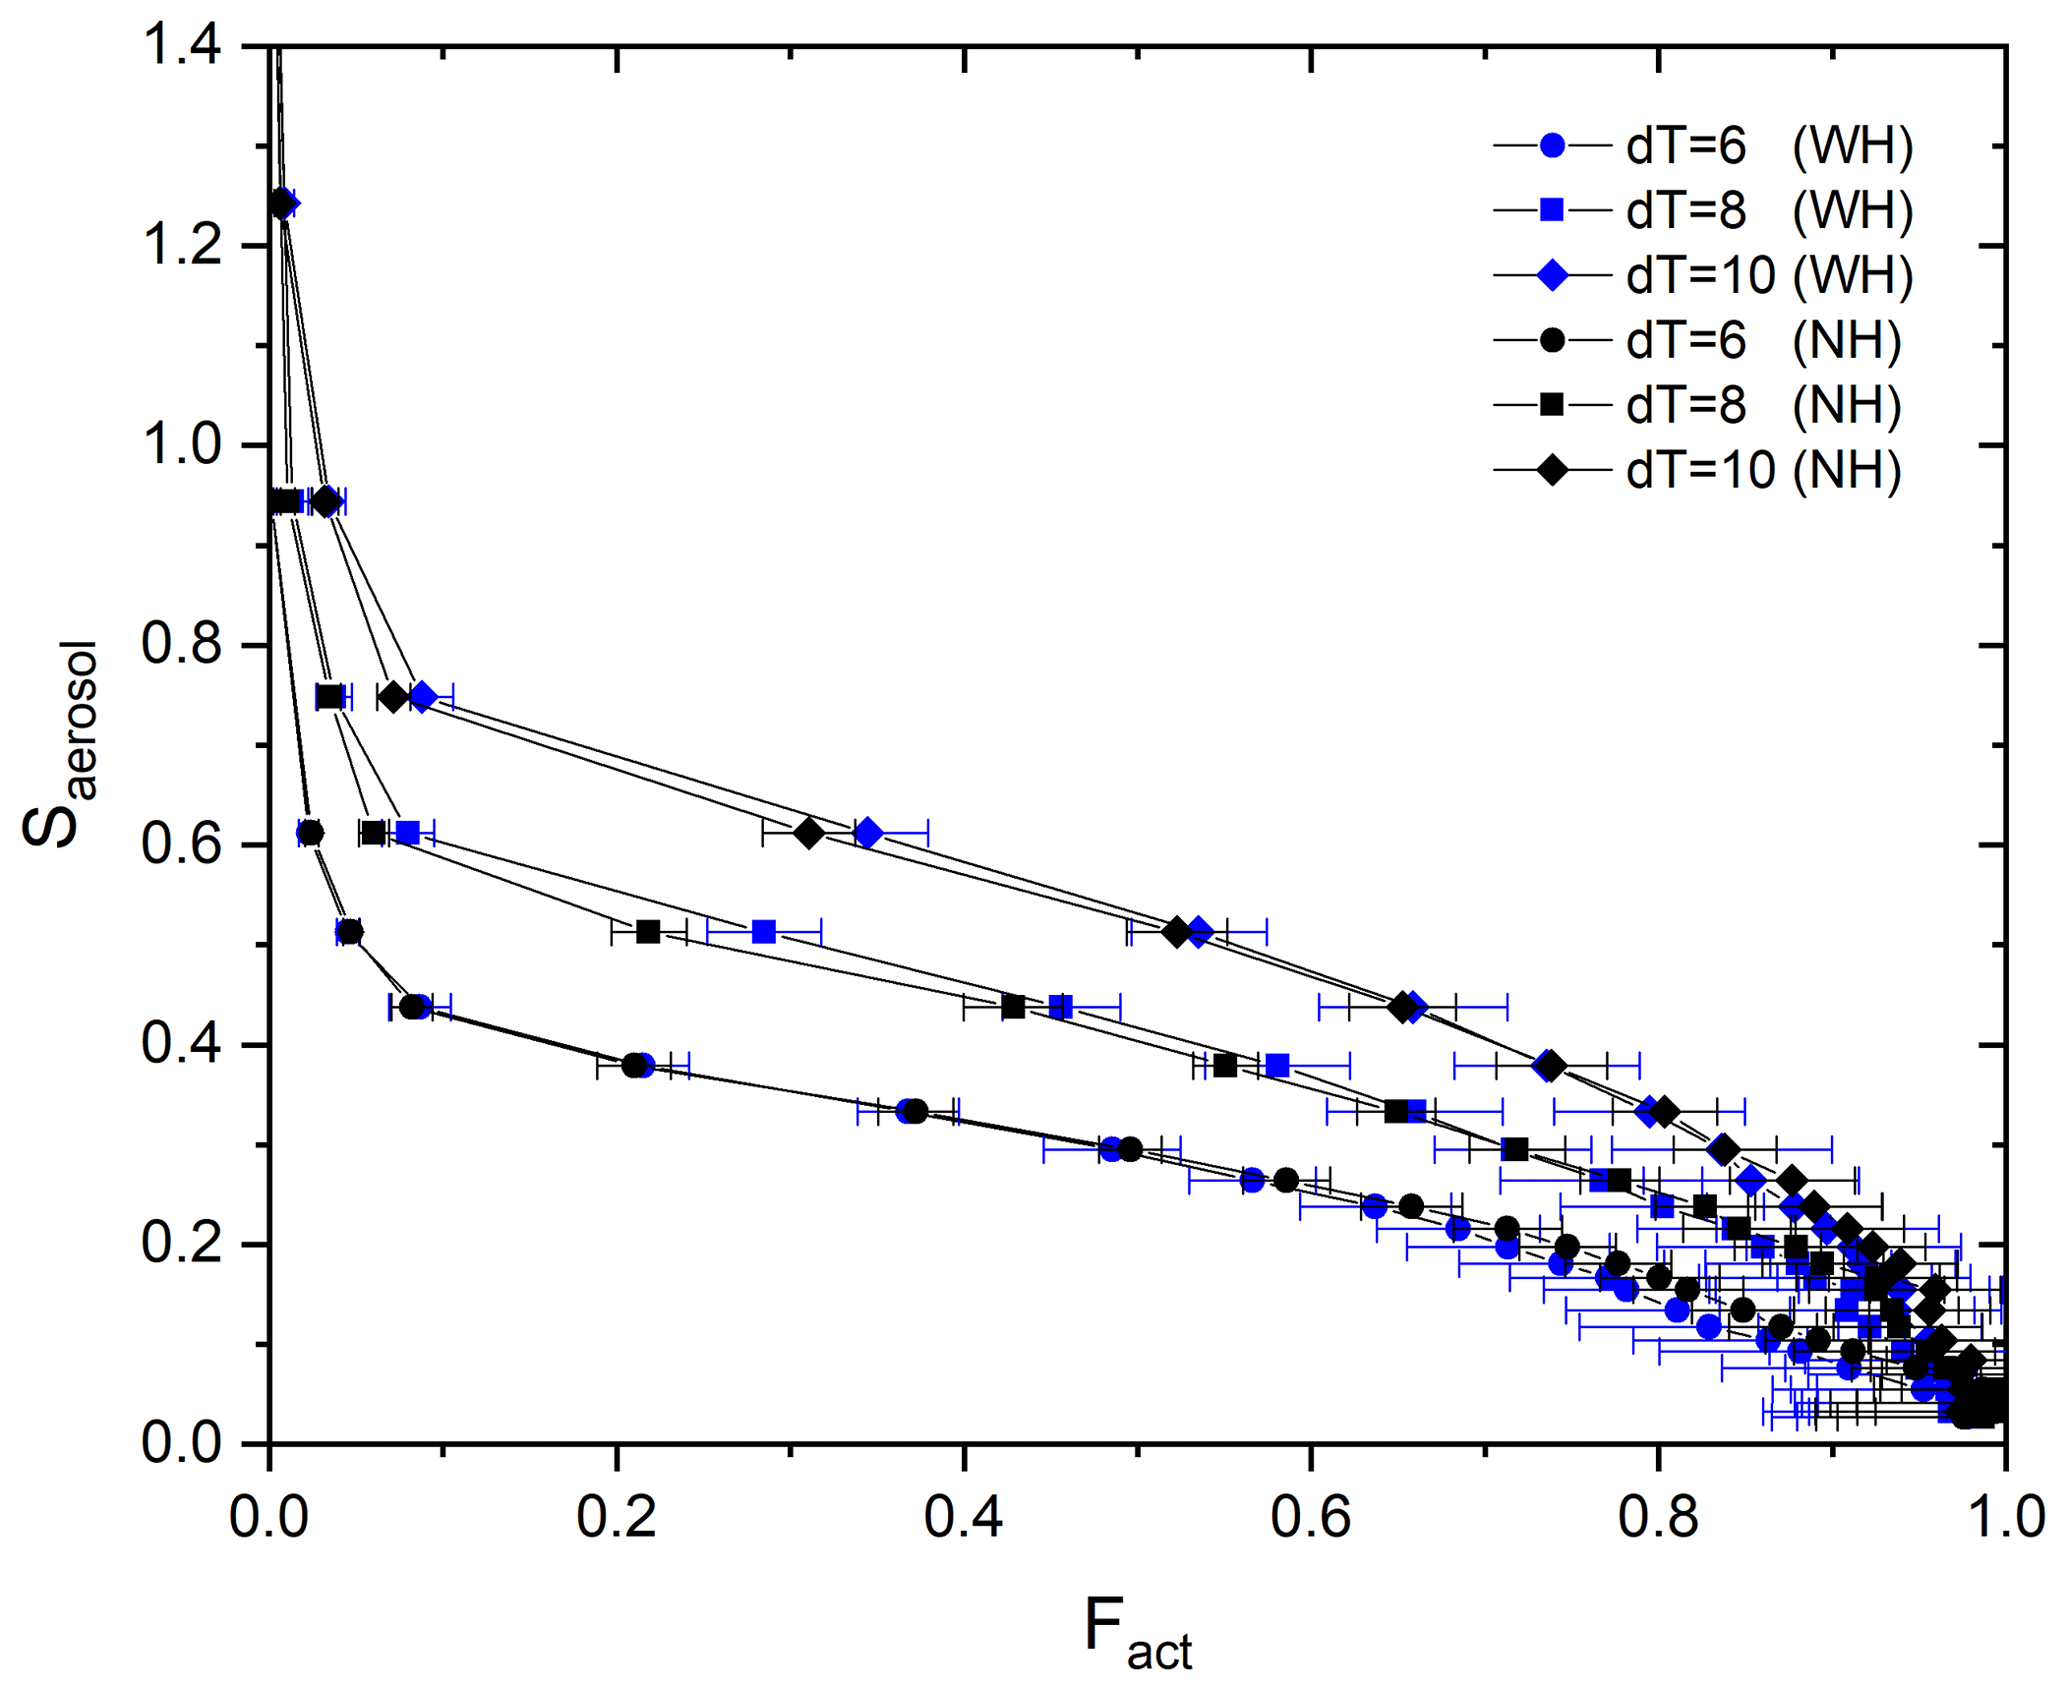
Figure 7Calibration curves (Fact−Saerosol) for three different T gradients: dT=6 (circle), 8 (square), and 10 K (diamond) with a humidifier system (WH) and without a humidifier system (NH).
3.2 Fitting procedure of calibration curve
As selected diameters for calibration are limited and cannot cover the whole range of Fact values, a curve fitting procedure is necessary. The equation for curve fitting (Eq. 3), the relationship between Fact and Saerosol, can be derived based on Eq. (S8) in the Supplement and the cosine function of Stube distribution in Sect. S1 in the Supplement.
F(x) and x correspond to Saerosol and Fact, respectively. Coefficients of a, b, and c are what we need to obtain from the curve fitting procedure. They are calculated using a nonlinear least square method (MATLAB curve fitting toolbox 3.5.8). It is noted that values lower than 0.05 for Fact, showing a large discrepancy between reference curves and experimental data, are excluded for curve fitting.
Figure 8 shows fitting curves and experimental data from ammonium sulfate particles for three dT conditions (dT=6, 8, and 10 K). Coefficients and goodness of fit for each curve are presented in Table 1. For assessing the goodness of fit, three statistical parameters were used: error sum of squares (SSE), coefficient of determination (R2), and root mean square error (RMSE). According to Fig. 8 and Table 1, fitting curves cover most of the experiment data, and good fitting results are shown for all three dT conditions. It implies that Eq. (3) covers the experimental data well and appears suitable for the calibration curve of the BS2-CCN system. Also, Saerosol corresponding to the Fact can be directly obtained through this curve. Furthermore, we can calculate the effective particle hygroscopicity parameter, κ, based on κ–Köhler theory (Petters and Kreidenweis, 2007). Figure S5 in the Supplement presents κ values that correspond to the Fact values of a particle ranging from 50 to 150 nm. They are calculated with a fitting curve equation of the dT=8 K condition shown in Fig. 8 and Table 1.
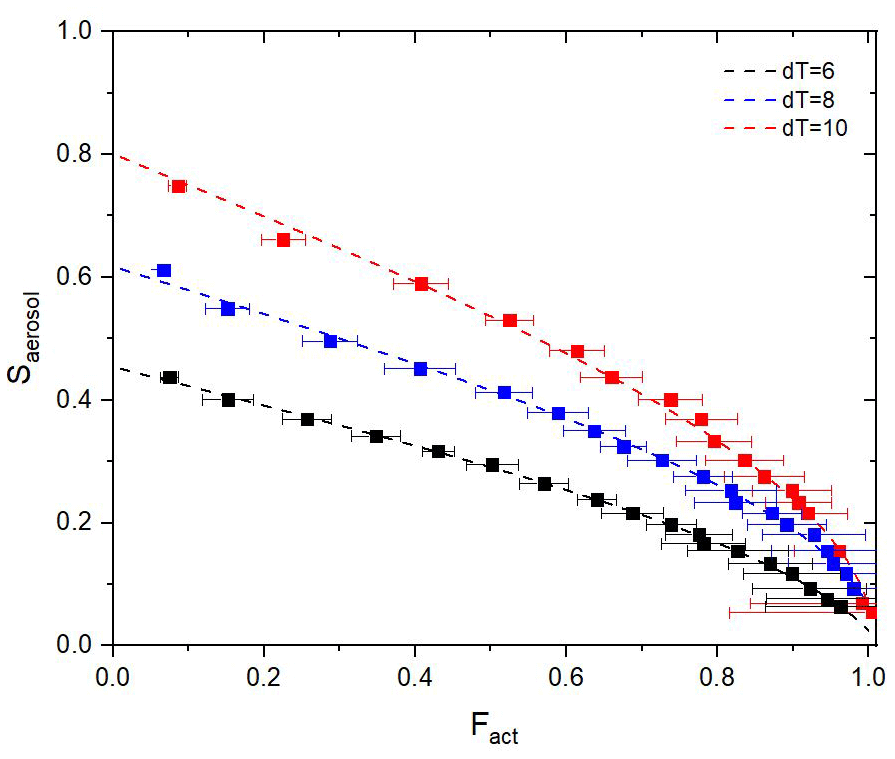
Figure 8Experimental data (square dot with error bar) and fitting curves (dashed lines) for three different dT conditions: dT=6 (black), 8 (blue), and 10 K (red). Ammonium sulfate particles are used for calibration.
Table 1Coefficients and goodness of fit for calibration curves for three different dT conditions (dT=10, 8, and 6 K). Three different statistical values, including error sum of squares (SSE), coefficient of determination (R2), and root mean square error (RMSE), are used to judge the goodness of fit.
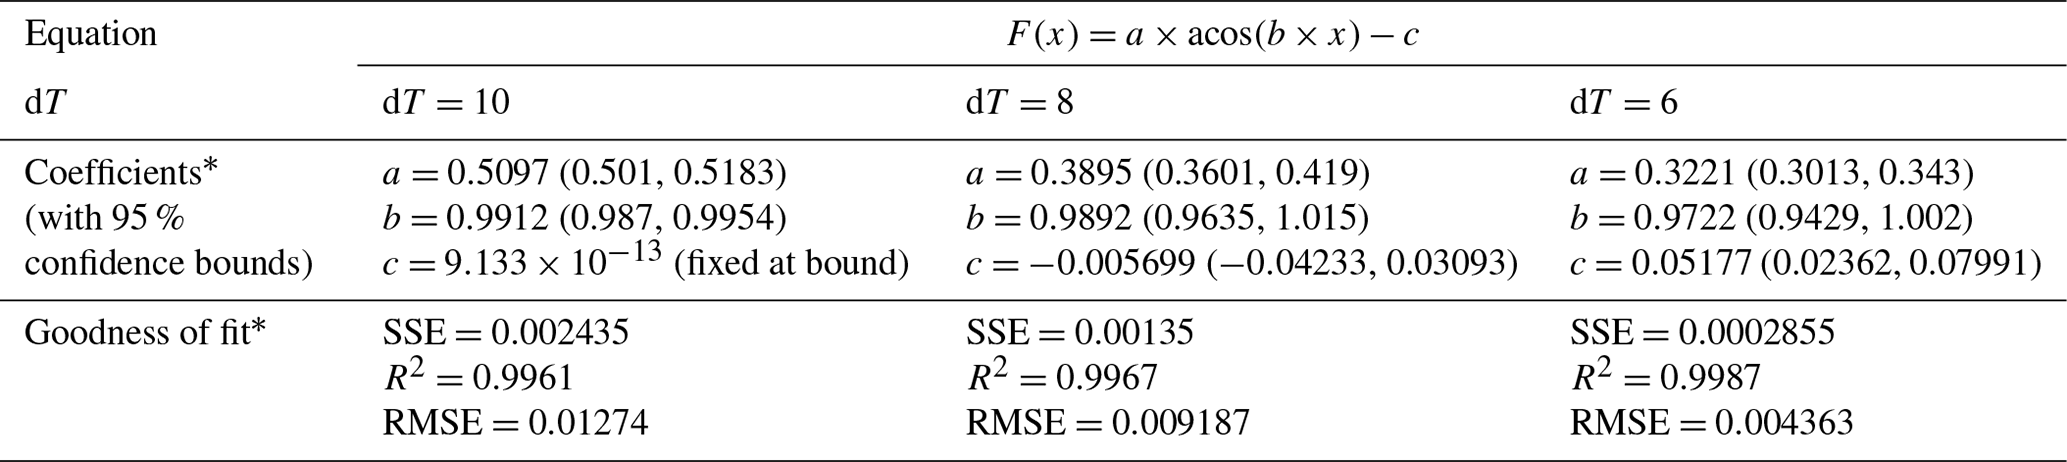
∗ Coefficients and goodness of fit were calculated by the MATLAB curve fitting toolbox 3.5.8.
As Fact values obtained from size-resolved CCN measurements use 1 min average data, the calibration curve could have a range and not a single curve line. To consider the range of Fact, we add two more calibration curve lines applying data points of Fact_low (average – standard deviation, μ−σ) and Fact_high (μ+σ). Figure S6 shows the range of the calibration curve for the dT=8 K condition. All of the calibration curves are obtained using Eq. (3) for curve fitting. When the Fact is measured at a certain Dp, three κ values, denoted as κhigh, κavg, and κlow, can be calculated based on these three curves. Specifically, κhigh is derived from the curve that is obtained from data points of Fact_low and vice versa.
To evaluate the BS2-CCN system, we performed two intercomparison experiments between BS2-CCN and standard DMA-CCN measurements (denoted as DMA-CCN) with a laboratory-generated aerosol mixture and ambient aerosols. The DMA-CCN is widely used for size-resolved CCN measurements in the aerosol community to examine CCN activity (Cai et al., 2018; Deng et al., 2011; Moore et al., 2011; Rose et al., 2011; Pöhlker et al., 2016, 2018; Thalman et al., 2017, and references therein). For DMA-CCN measurement, the critical diameter (Dc) at which Fact becomes 0.5 is determined by scanning Dp under a given constant supersaturation (i.e., Dp scan), and κ can be calculated with a given S and Dc based on κ–Köhler theory (Petters and Kreidenweis, 2007). In other words, in DMA-CCN measurement, we can obtain a single Dc value for each Dp scan and convert it to single κ, but in BS2-CCN measurement, we can obtain κ values at all selected particle sizes of each Dp scan by converting Fact values using the calibration curve. Figure S7 in the Supplement presents a schematic plot of the instrumental setup for intercomparison experiments. Specifically, selected monodisperse aerosol flows by the DMA (TSI classifier 3080) are split into three parallel lines and fed into the CPC, modified CCNC (CCN-100, DMT for BS2-CCNC), and DMT-CCNC (CCN-200, DMT for DMA-CCNC). Before entering the DMA, all aerosol particles are dried (RH<30 %) by the Nafion tube aerosol dryer and neutralized by a krypton-85 (Kr 85) bipolar charger. All instruments were installed in the laboratory at the Max Planck Institute for Chemistry, Mainz, Germany. A detailed set of experiments for each intercomparison experiment is described in the following section.
4.1 Ammonium sulfate and succinic acid mixture
We used an atomizer to generate internally mixed nanoparticles with diameters of 30–160 nm by spraying a mixed solution of succinic acid and ammonium sulfate; each pure component was completely dissolved in pure water obtained from a Milli-Q water purification system. This mixture was chosen to mimic a typical atmospheric aerosol composed of ammonium sulfate and organic acids. For the mixture, molar ratios of ammonium sulfate and succinic acid used in this study were 1:1, 3:1, and 1:3. The experiments were performed under the dT=8 K (0.63 % S) condition. The sample flow rates of CCNCs were 0.04 and 0.46 L min−1 for the DMA-CCN and BS2-CCN measurements, respectively. The total flow rate (sample + sheath) was 0.5 L min−1 for both instruments. As the κ of ammonium sulfate is higher than that of succinic acid (i.e., more hygroscopic), a mixture of ammonium sulfate and succinic acid in a ratio of 3:1 shows the highest κ value among the three mixtures and vice versa. Table 2 presents details of the comparison for all three solutions. The κ values of the DMA-CCN measurement for all three solutions are within the range of κ for the BS2-CCN measurement but are slightly lower (less than about 10 % of relative deviation) than the κavg. These results imply that we can measure κ of an aerosol mixture quantitatively well from BS2-CCN measurements compared to the existing measurement method with DMA-CCN.
Table 2κavg from DMA-CCN and κlow, κavg, and κhigh from BS2-CCN measurements for the dT=8 K (S=0.63 %) condition for mixtures of ammonium sulfate and succinic acid. κlow and κhigh are derived from the range of calibration curves in Fig. S6.
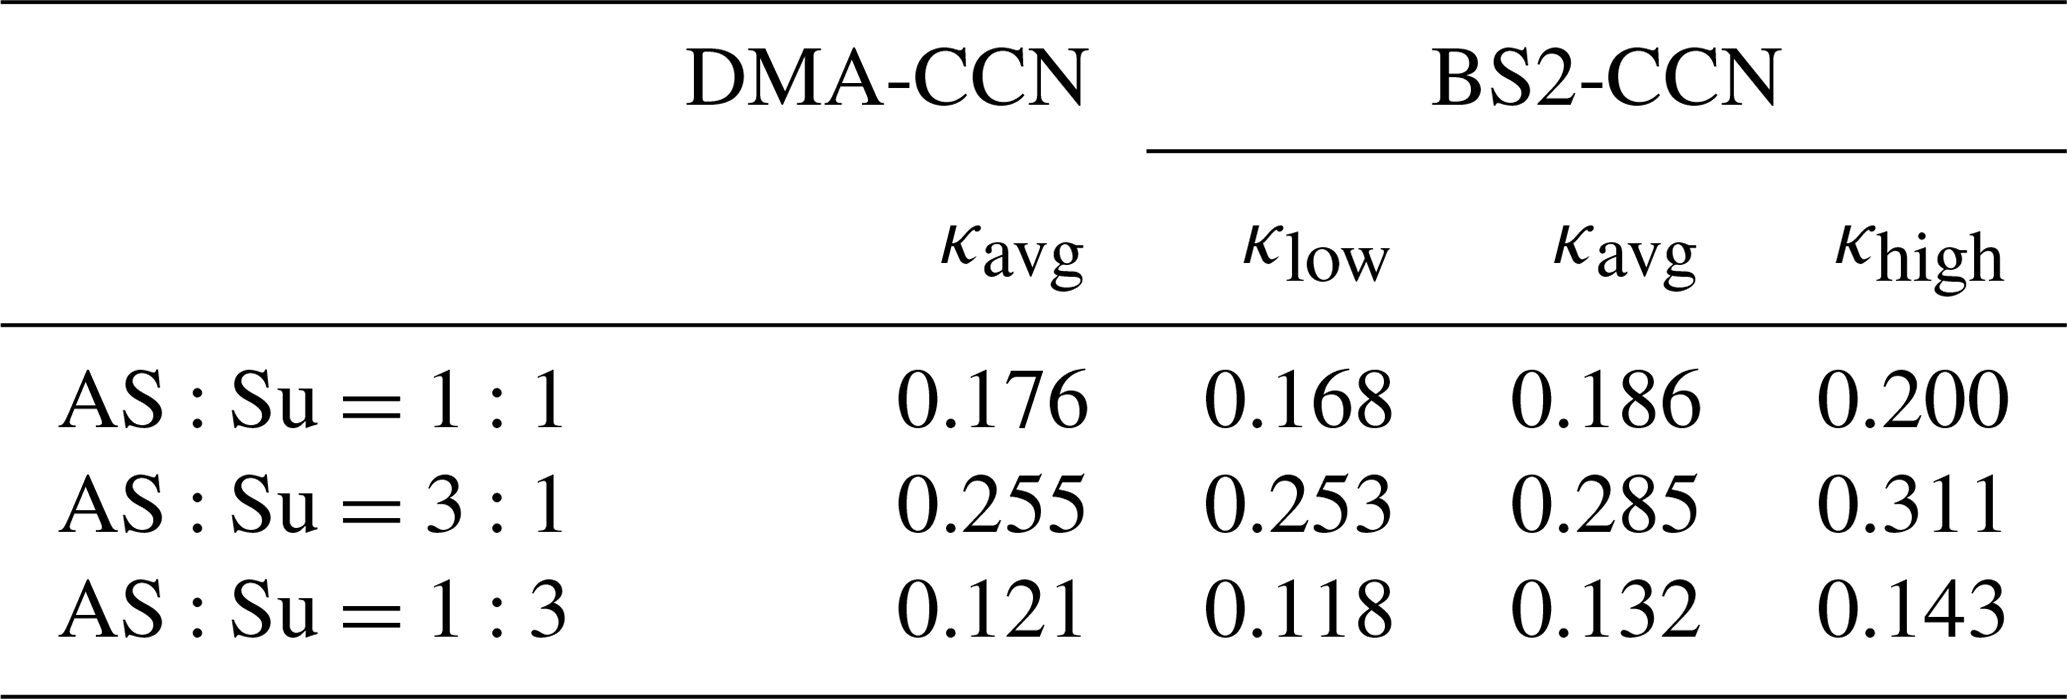
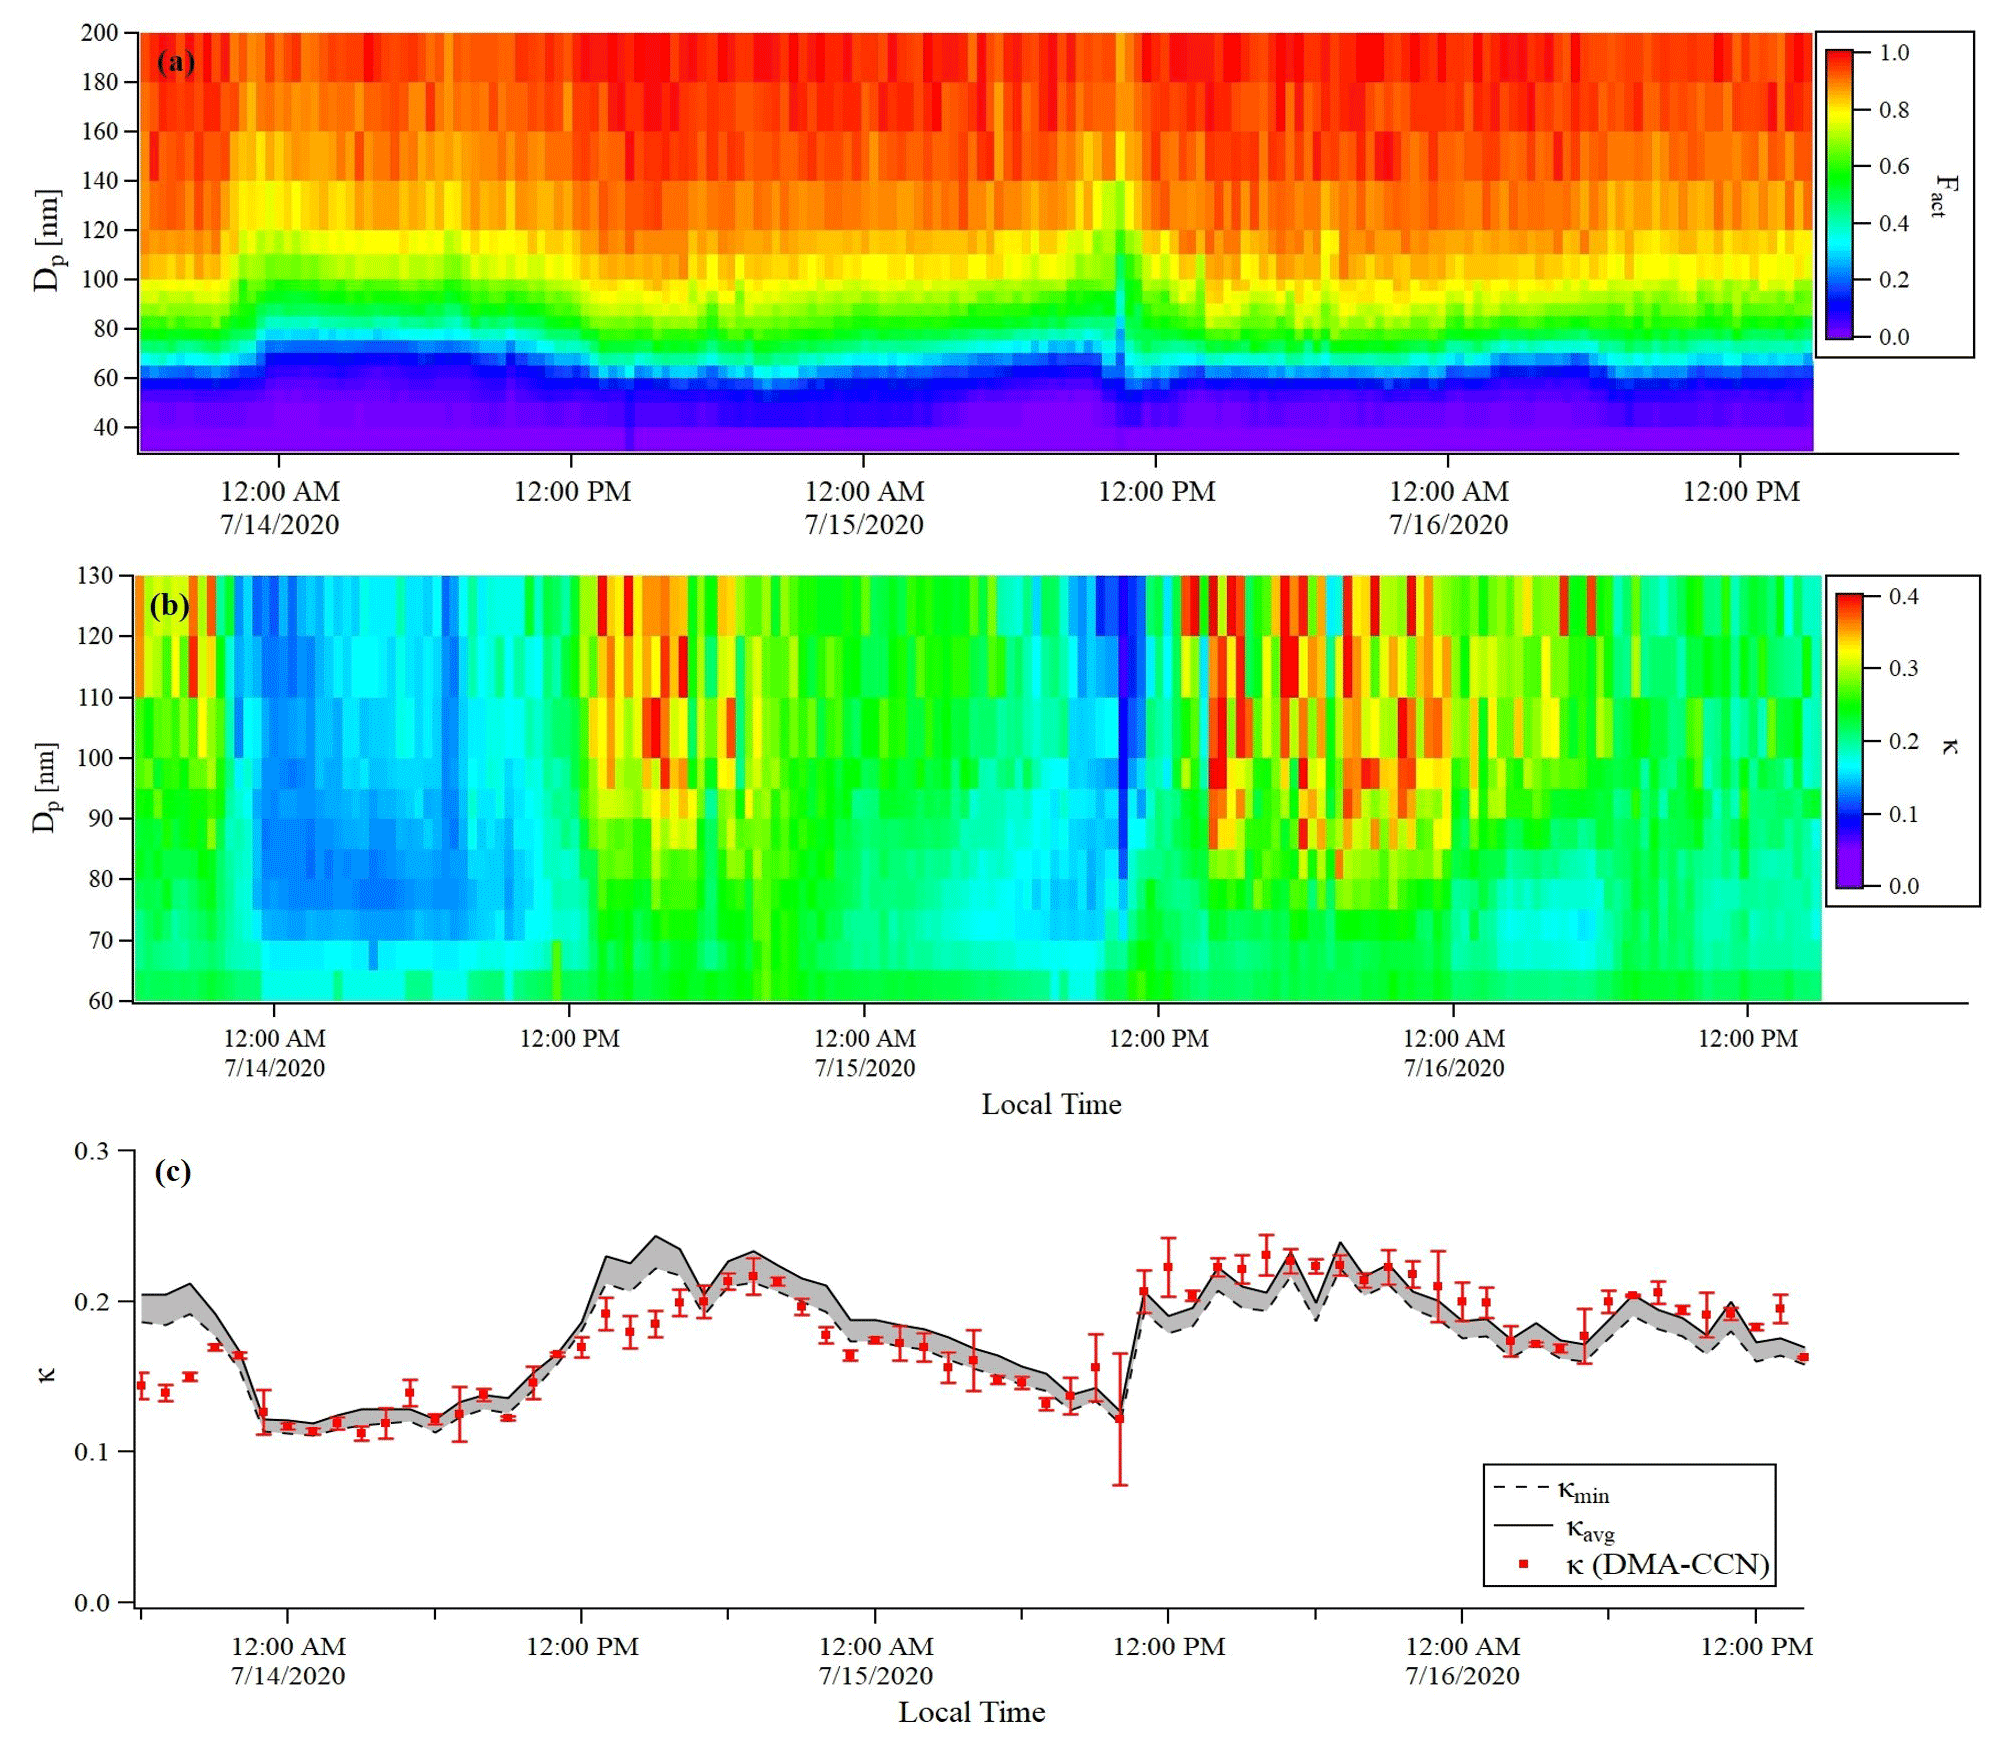
Figure 9Time series of (a) Fact, (b) κ distribution of BS2-CCN measurement for the 0.63 % S (dT=8 K) condition, and (c) hourly averaged κ values for DMA-CCN (red dots, bar indicates the standard deviation of κ) and BS2-CCN (grey shaded area for the range between κavg, indicated by the black solid line, and κlow, indicated by the black dashed line) measurements. The κhigh is excluded in this figure. Measurement period was 13 July–16 July 2020.
4.2 Ambient aerosol measurement
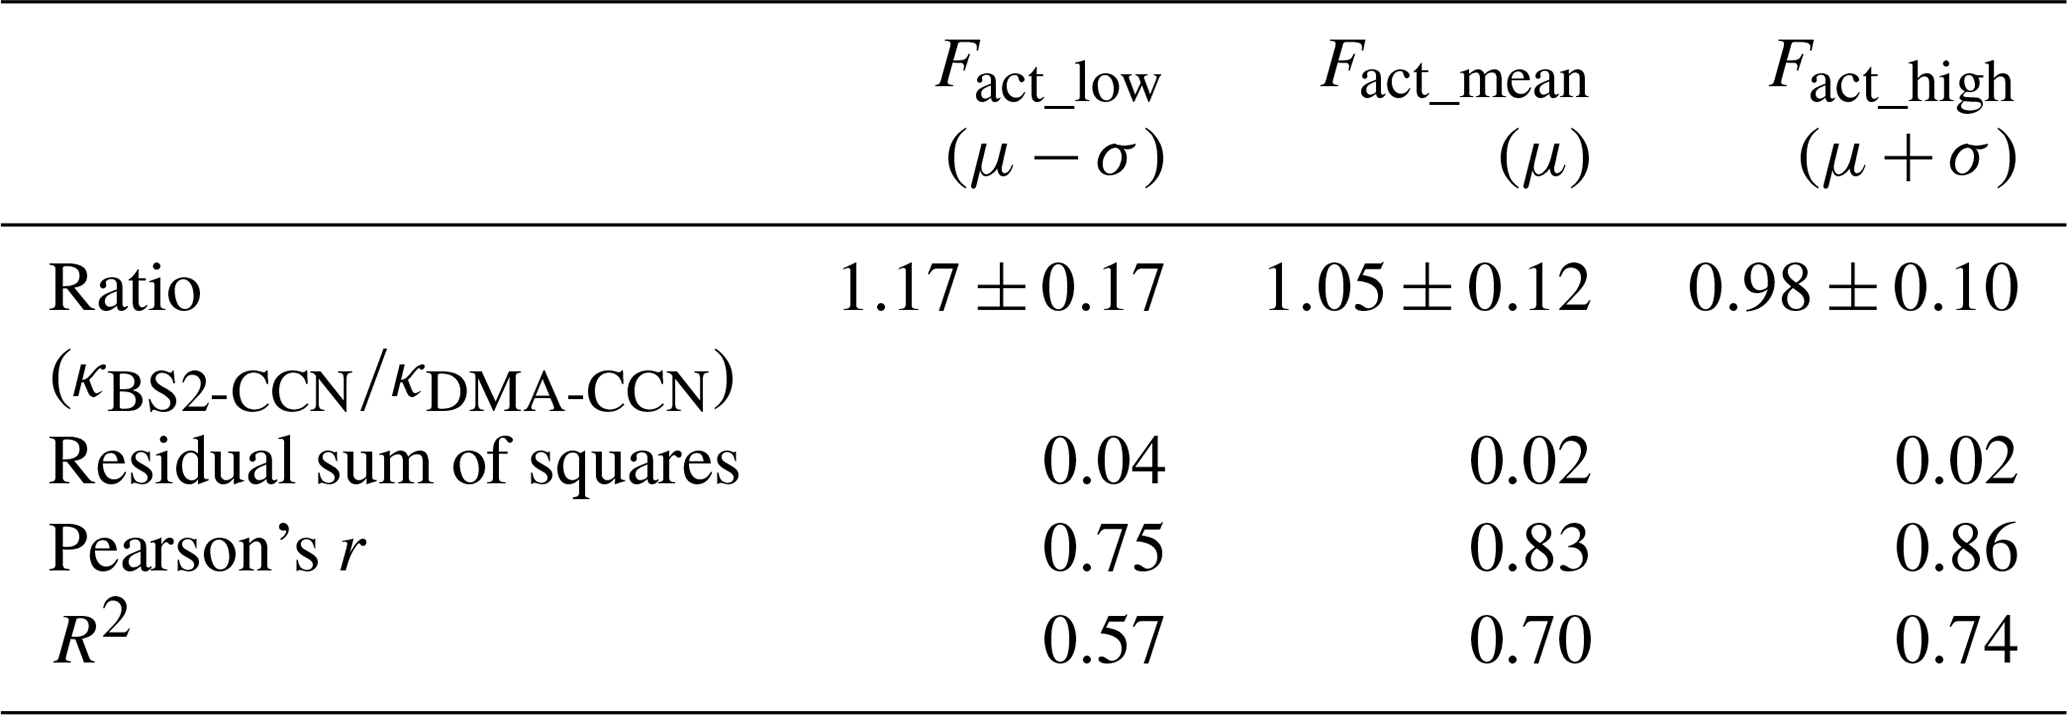
An intercomparison experiment with ambient aerosols was performed from 13 July to 16 July 2020. The instrumental setup and flow system were the same as in Sect. 3.1. For Dp scan (fixed S), 19 dry diameters of 40–250 nm were selected for each scan. Each scan took a total of 22 min, including 1 min for each diameter and 3 min for stabilization. The S of CCNC was set to 0.63 % (dT=8 K) for BS2-CCN measurement and 0.4 % for DMA-CCN measurement. The S from the DMA-CCN measurement was set slightly lower because the comparison with κ from the BS2-CCN measurement is difficult if the critical diameter is too small, which is obtained from the DMA-CCN measurement. It is noted that κ values from BS2-CCN measurement were calculated based on the fitting curve for dT=8 K, as shown in Fig. S6 and Table 1. The double-charge effect is not considered in the intercomparison experiment. Figure 9 shows the times series of Fact and κ distributions from the BS2-CCN measurement. Here κavg, derived from Fact_avg, is referred to as κ. For κ calculation, high-Fact (>0.85) and low-Fact (<0.1) data are excluded. Fact distribution showed a clear size dependency: low Fact for small particles and high Fact for large particles. Since the κ value is calculated based on the Fact value, the κ value appeared to be increasing at the time when the Fact was increased and vice versa. The average κ values of particles for the BS2-CCN measurement exhibit diurnal variability that increases during the daytime and decreases at nighttime within the range of 0.11 to 0.32 (Figs. 9 and S8 in the Supplement) and has an average value of 0.18. For DMA-CCN measurement, average Dc and κ were about 80 nm and 0.17, respectively, during the measurement under the 0.4 % S condition. Figure S9 in the Supplement presents the average CCN efficiency spectra and the cumulative particle hygroscopicity distribution, H(κ,Dd), from DMA-CCN measurements. Particularly, the κ values of a significant portion of particles were distributed between 0.1 and 0.3, which was consistent with the result of the BS2-CCN measurement. Figure 9c presents the hourly averaged κ value from BS2-CCN and DMA-CCN measurements. Unlike BS2-CCN measurement results, which show κ distribution of various particle sizes, DMA-CCN measurement allows a single κ value to be produced per each Dp scan cycle. Therefore, as shown in Fig. 9c, we used a κ value from the BS2-CCN measurement by selecting the particle diameter close to the average Dc from the DMA-CCN measurement for the intercomparison. Compared to the κ values from the DMA-CCN measurement, those from the BS2-CCN measurement showed good agreement, keeping up with the increasing and decreasing variability. Additionally, a direct intercomparison was carried out through the 1:1 scatterplot between the κ of BS2-CCN and DMA-CCN measurements in Fig. 10. All the detailed intercomparison results, including the ratio between κ of DMA-CCN and BS2-CCN measurements as well as the goodness of fit of the linear regression line for each scatterplot, are presented in Table 3. It is noted that κhigh, showing an excessively high value compared to that from the DMA-CCN measurement, is excluded in Figs. 9c and 10. Based on the good agreement on the κ value and the results of three different statistical values to judge the goodness of fitting, including a residual sum of squares, Pearson's r, and R2, we conclude that we can obtain reliable and quantitative κ data, as well as the κ variability, from BS2-CCN measurements compared to the existing DMA-CCN measurement method. The possible reason for the discrepancy in κ between BS2-CCN and DMA-CCN measurements is the multimode κ distribution. According to Fig. S9, we can infer that aerosols were externally mixed and not a single mode. The BS2-CCN system alone cannot resolve a bimodal or multimodal κ distribution, and thereby when particles at a certain size are externally mixed, lower Fact, resulting in lower κ, can be observed. In particular, κ values from the BS2-CCN measurement are slightly higher than those from the DMA-CCN measurement between 15 and 16 July when externally mixed aerosols were frequently observed. Su et al. (2016) pointed out through a simulation that BS2-CCN measurements can underestimate κ when particles are externally mixed. The uncertainty of Fact values for each measurement caused by the uncertainty of each CCNC can be another possible reason for the discrepancy. The Fact value is essential for both measurements as κ is directly determined by Fact for BS2-CCN, and Dc from a DMA-CCN measurement can be changed depending on Fact. The selected diameters from BS2-CCN measurements for comparison in Figs. 9c and 10 do not perfectly match the Dc from DMA-CCN measurements because Dc in this study is not fixed due to the Dp scan method, which scans Dp with a constant S. The difference of time resolution can also be a cause of the discrepancy, although the impact may not be significant in this study. As we use 1 min average data per particle size, we can obtain κ values for every 1 min for the BS2-CCN measurement but only every 19 min for the DMA-CCN measurement. Therefore, a difference in κ is expected if there are fast changes in the aerosol. Nevertheless, good correlation and correspondence of κ values between DMA-CCN and BS2-CCN measurements from both intercomparison experiments imply that we can obtain a high time resolution with reliable hygroscopicity data from the BS2-CCN system. These powerful advantages allow for applying the BS2-CCN system preferably to ship and aircraft measurements requiring high time resolution, as well as ground-based measurements for κ distribution with a broad particle size range.
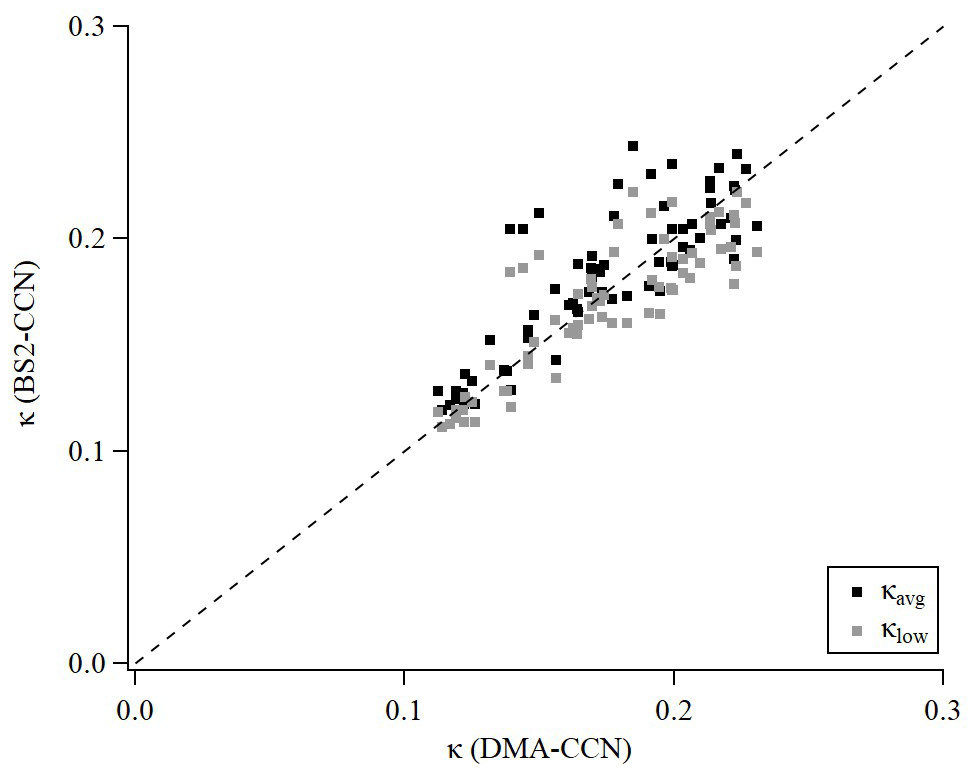
Figure 10Scatterplot of κ between DMA-CCN and BS-CCN measurements. The black square and grey square dots indicate κavg (calculated from the calibration curve of Fact, μ) and κlow (calculated from the calibration curve of Fact_high, μ+σ) for the BS2-CCN measurement, respectively. For comparison, the κ value from a BS2-CCN measurement at the diameter adjacent to the critical diameter obtained from the DMA-CCN measurement was selected. The black dashed line is a 1:1 line for clarity.
Table 3The average and standard deviation of the ratio between κ from the DMA-CCN and BS2-CCN measurement and the goodness of fit for the linear regression line. Three different statistical values are used to evaluate the goodness of fit: residual sum of squares, Pearson correlation coefficient, and coefficient of determination (R2).
In this study, we implement a new concept for the design of CCN counters, which is a broadening supersaturation scanning BS2-CCN system, for rapid hygroscopicity measurement and describe how to calibrate this system. Compared to typical CCN counters, particles are exposed to a range of S simultaneously in an activation tube with a newly designed inlet and low sheath-to-aerosol flow ratio (SAR). Through this system, we can obtain a monotonic relation between Fact and Saerosol. Based on the κ–Köhler theory, κ can be derived directly through the calibration curve (i.e., Fact−Saerosol relation) when we measure the Fact value at a certain S.
For calibration, ammonium sulfate and sodium chloride, which are representative calibration aerosols for CCNC, are used under three different dT conditions. It can be inferred from consistent results between the two calibration aerosols as well as reference curves for all three dT conditions that the experimental setting of the BS2-CCN system suggested in this study is appropriate and can apply to real measurements. We also examine factors that can affect the calibration curves. First, Smax, the maximum S in the activation tube, determines the Stube distribution in the activation tube, and the shape of the calibration curve changes accordingly. The range of particle sizes and κ values that we can measure depends on the Smax value. Specifically, a high Smax can cover a wide range of particle sizes and κ, but a steeper slope of the calibration curve can lead to high sensitivity of Saerosol corresponding to the measured Fact. Therefore, depending on the particle size and environment to be investigated, we need to determine an appropriate Smax. Calculation and experimental results confirm that multiply charged particles have a small but measurable effect on the Fact value and show that the effect depends on the size distribution of the particles. To minimize the effect of multiply charged particles, small Dg and σg in number size distribution are recommended when generating calibration particles. This effect is more pronounced for sodium chloride with very high hygroscopicity and/or higher dT conditions. Lastly, we examine the effect of particle number concentration on the calibration curve. The activated particle number fraction decreases with a rate of about 0.02 per 100 cm−3 within ∼300 cm−3 of ammonium sulfate particles, and the decreasing rate is expected to be much higher when the concentration is higher due to the water consumption in the activation tube. It implies that we need to generate fewer particles for the calibration experiment of the BS2-CCN system compared to that of a typical CCNC. Particles below are recommended for generating calibration aerosols. If the number of particles is high, the pre-humidifier system is helpful to avoid decreasing Fact.
As selected particles for the calibration experiment cannot cover the whole Fact range, a curve fitting procedure is essential. We propose the equation for curve fitting (Eq. 3) based on the equation of Stube distribution. It is noted that values lower than 0.05 for Fact are excluded. Good results of statistical parameters to judge the goodness of fit are shown for all three different dT conditions. With these curves, we performed two intercomparison experiments between DMA-CCN and BS2-CCN measurements for evaluation: a laboratory-generated aerosol mixture and ambient aerosol measurement. Firstly, κ values of the mixture of ammonium sulfate and succinic acid with three different molar ratios were compared. The κ values of the BS2-CCN measurements agree well with those of DMA-CCN measurements. For ambient aerosol measurement, S of CCNC was set to 0.63 % (dT=8 K) for BS2-CCN measurement and 0.4 % for DMA-CCN measurement. For BS2-CCN measurement, the κ distribution between 70 and 120 nm diameter showed a size dependency, with low κ for small particles and high κ for large particles, and a distinct diurnal variability that increases during the daytime and decreases during the nighttime. Also, the κ values from the BS2-CCN measurement corresponded to and correlated well with those from the DMA-CCN measurement. It can be concluded from these results that the BS2-CCN system can measure κ quantitatively well compared to the existing measurement method and can even measure a broad range of κ distributions with high time resolution.
The BS2-CCN system, a simple modification of the commercial design of a CCNC, uses constant supersaturation and flow during measurement, so it is technically simple, and thereby we can obtain stable data with a high time resolution. And the low SAR of the BS2-CCN system provides sufficient counting statistics for size-resolved measurement, in which particle concentrations are generally low. In addition, the calibration of the BS2-CCN system is not complicated and has many similarities compared to the existing method, so it is easy to apply. The advantages of the fast response and stability, as well as the relatively simple calibration method of the BS2-CCN system, make it possible to apply not only to long-term observations but also extensive measurements including aircraft, ship, and ground. Lastly, as the hygroscopicity can be used as a proxy for the chemical composition, our method can also serve as a complementary approach for fast and size-resolved estimation of aerosol chemical composition.
The newly designed diffusive inlet is comprised of the main body (101) and a sheath flow straightener (102), as shown in Fig. A1. The main body of the diffusive inlet is constructed from the conductive material. An aerosol inlet (103) is placed at the center top of the main body. Downstream of the aerosol inlet is a funnel-shaped region (105) where the cross section of the aerosol is smoothly expanded. The angle (106) of the wall of the funnel-shaped region is small enough to keep a laminar flow. The wall of the funnel-shaped region is polished to minimize air turbulence and particle deposition. The inlet of sheath air (104) is placed at the side of the main body. A flow straighter (102), located downstream of the sheath air inlet, is made up of a single or double screen of fine nylon mesh to straighten the sheath flow and lead to a laminar flow. This inlet is mounted at the top of the column of the activation tube. At the lower end of the main body, there are two rubber O-rings (107) to keep the activation tube airtight.
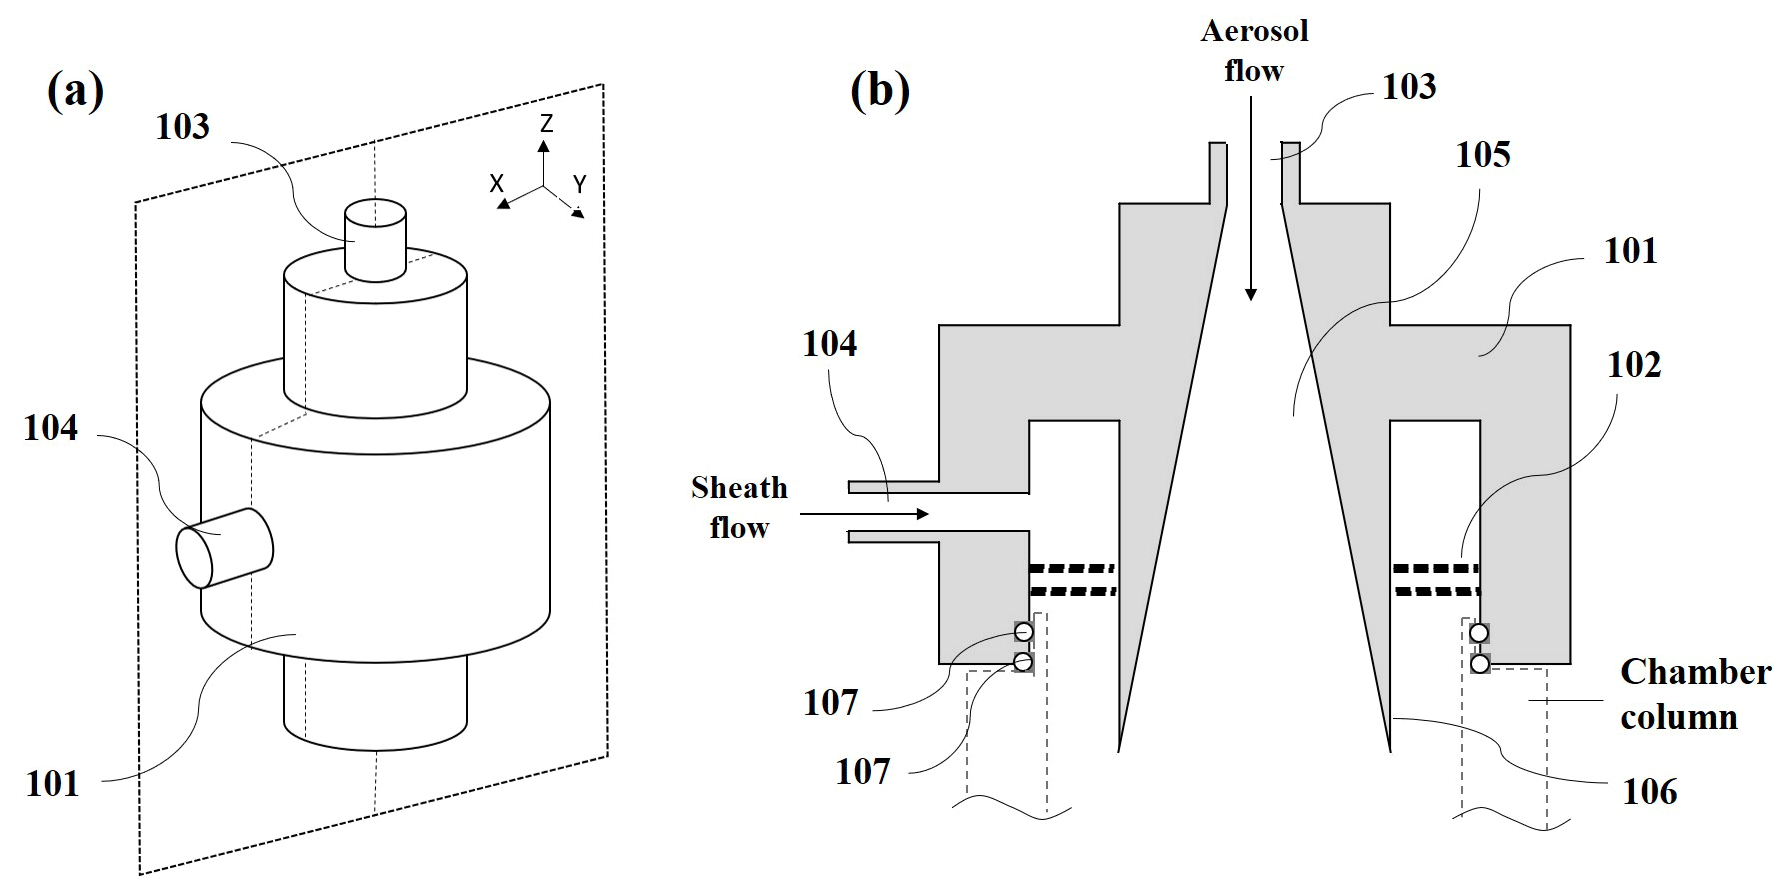
Figure A1(a) Front view of an embodiment of the diffusive inlet. (b) Longitudinal sectional (the cross section in X–Z surface) view of (a). Each number in the figure is as follows: main body (101), a sheath flow straightener (102), an aerosol inlet (103), a funnel-shaped region (105) where the cross section of the aerosol is smoothly expanded, the angle (106) of the wall of the funnel-shaped region, the inlet of sheath air (104) at the side of the main body, and two rubber O-rings (107) at the lower end of the main body to keep the activation tube airtight.
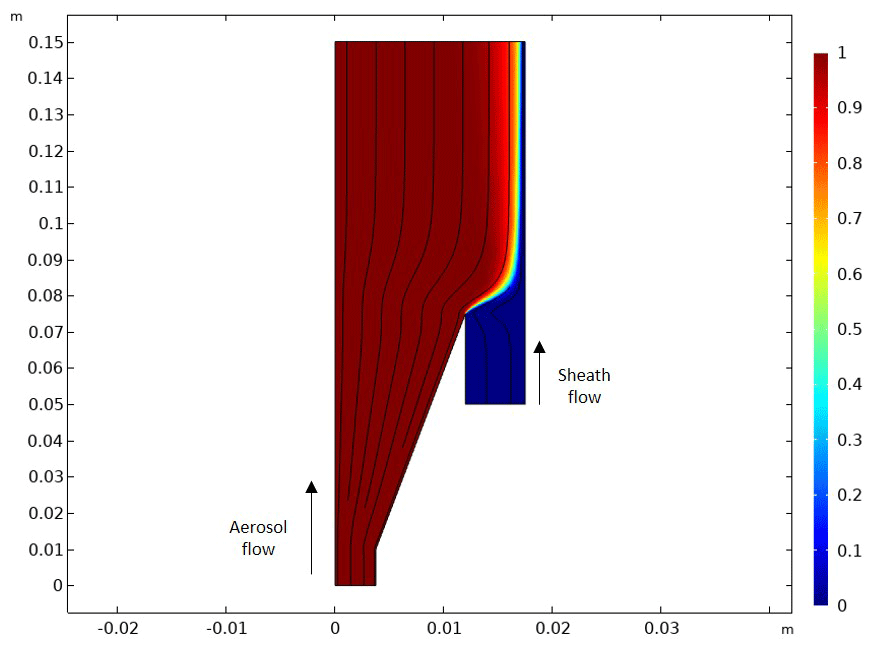
Figure A2Result of a computational fluid dynamics simulation with original inlet design. The figure presents the half-side of a longitudinal sectional view of Fig. A1b, and the x and y axes present the length of the inlet (units are meters). A solid black line and the color bar indicate the flow streamline in the velocity field and the relative particle concentration [mol m−3], respectively. It is noted that aerosol and sheath flow go from the bottom (−y) to the top (+y), as marked in the figure.
Data can be downloaded from Edmond, the open research data repository of the Max Planck Society (https://edmond.mpdl.mpg.de/imeji/collection/pohD2XdTlrMwzka7, Kim, 2021), and raw data are available upon request from the corresponding author (h.su@mpic.de).
The supplement related to this article is available online at: https://doi.org/10.5194/amt-14-6991-2021-supplement.
HS and YC had the initial idea, and HS, YC, and NM designed the BS2 instrument. TFM provided the CCNC instrument and discussed the new system. NK organized and performed all experiments. MLP provided the instrument for the intercomparison experiment. OK supported the intercomparison experiment. TK provided technical support for experiments and CFD simulation. NK wrote the paper. All coauthors discussed and results and commented on the paper.
The authors declare that they have no conflict of interest.
Publisher's note: Copernicus Publications remains neutral with regard to jurisdictional claims in published maps and institutional affiliations.
This work was supported by the Max Planck Society (MPG).
The article processing charges for this open-access publication were covered by the Max Planck Society.
This paper was edited by Pierre Herckes and reviewed by two anonymous referees.
Andreae, M. O. and Rosenfeld, D.: Aerosol-cloud-precipitation interactions. Part 1. The nature and sources of cloud-active aerosols, Earth-Sci. Rev., 89, 13–41, 2008.
Andreae, M. O., Jones, C. D., and Cox, P. M.: Strong present-day aerosol cooling implies a hot future, Nature, 435, 1187–1190, 2005.
Andreae M. O., Hegg, D., and Baltensperger U.: Sources and Nature of Atmospheric Aerosols, in: Aerosol Pollution Impact on Precipitation, edited by: Levin, Z. and Cotton W. R., Springer, Dordrecht, https://doi.org/10.1007/978-1-4020-8690-8_3, 2009.
Cai, M., Tan, H., Chan, C. K., Qin, Y., Xu, H., Li, F., Schurman, M. I., Liu, L., and Zhao, J.: The size-resolved cloud condensation nuclei (CCN) activity and its prediction based on aerosol hygroscopicity and composition in the Pearl Delta River (PRD) region during wintertime 2014, Atmos. Chem. Phys., 18, 16419–16437, https://doi.org/10.5194/acp-18-16419-2018, 2018.
Charlson, R. J., Seinfeld, J. H., Nenes, A., Kulmala, M., Laaksonen, A., and Facchini, M. C.: Reshaping the theory of cloud formation, Science, 292, 2025–2026, 2001.
Deng, Z. Z., Zhao, C. S., Ma, N., Liu, P. F., Ran, L., Xu, W. Y., Chen, J., Liang, Z., Liang, S., Huang, M. Y., Ma, X. C., Zhang, Q., Quan, J. N., Yan, P., Henning, S., Mildenberger, K., Sommerhage, E., Schäfer, M., Stratmann, F., and Wiedensohler, A.: Size-resolved and bulk activation properties of aerosols in the North China Plain, Atmos. Chem. Phys., 11, 3835–3846, https://doi.org/10.5194/acp-11-3835-2011, 2011.
Dusek, U., Frank, G. P., Hildebrandt, L., Curtius, J., Schneider, J., Walter, S., Chand, D., Drewnick, F., Hings, S., Jung, D., Borrmann, S., and Andreae, M. O.: Size Matters More Than Chemistry for Cloud-Nucleating Ability of Aerosol Particles, Science, 312, 1375–1378, https://doi.org/10.1126/science.1125261, 2006.
Frank, G. P., Dusek, U., and Andreae, M. O.: Technical note: A method for measuring size-resolved CCN in the atmosphere, Atmos. Chem. Phys. Discuss., 6, 4879–4895, https://doi.org/10.5194/acpd-6-4879-2006, 2006.
Hiranuma, N., Brooks, S. D., Gramann, J., and Auvermann, B. W.: High concentrations of coarse particles emitted from a cattle feeding operation, Atmos. Chem. Phys., 11, 8809–8823, https://doi.org/10.5194/acp-11-8809-2011, 2011.
Hudson, J. G.: An Instantaneous CCN Spectrometer, J. Atmos. Ocean. Tech., 6, 1055–1065, 1989.
IPCC: Climate Change: the physical science basis, Working Group I Contribution to the Fifth Assessment Report of the Intergovernmental Panel on Climate Change, Cambridge University Press, Cambridge, UK, New York, NY, USA, 2013.
Kim, N.: Data for BS2-CCN calibration experiment, available at: https://edmond.mpdl.mpg.de/imeji/collection/pohD2XdTlrMwzka7, last access: 22 September 2021.
Köhler, H.: The nucleus in and the growth of hygroscopic droplets, T. Faraday Soc., 32, 1152–1161, 1936.
McFiggans, G., Artaxo, P., Baltensperger, U., Coe, H., Facchini, M. C., Feingold, G., Fuzzi, S., Gysel, M., Laaksonen, A., Lohmann, U., Mentel, T. F., Murphy, D. M., O'Dowd, C. D., Snider, J. R., and Weingartner, E.: The effect of physical and chemical aerosol properties on warm cloud droplet activation, Atmos. Chem. Phys., 6, 2593–2649, https://doi.org/10.5194/acp-6-2593-2006, 2006.
Moore, R. H. and Nenes, A.: Scanning Flow CCN Analysis – A Method for Fast Measurements of CCN Spectra, Aerosol Sci. Tech., 43, 1192–1207, https://doi.org/10.1080/02786820903289780, 2009.
Moore, R. H., Bahreini, R., Brock, C. A., Froyd, K. D., Cozic, J., Holloway, J. S., Middlebrook, A. M., Murphy, D. M., and Nenes, A.: Hygroscopicity and composition of Alaskan Arctic CCN during April 2008, Atmos. Chem. Phys., 11, 11807–11825, https://doi.org/10.5194/acp-11-11807-2011, 2011.
Paramonov, M., Aalto, P. P., Asmi, A., Prisle, N., Kerminen, V.-M., Kulmala, M., and Petäjä, T.: The analysis of size-segregated cloud condensation nuclei counter (CCNC) data and its implications for cloud droplet activation, Atmos. Chem. Phys., 13, 10285–10301, https://doi.org/10.5194/acp-13-10285-2013, 2013.
Petters, M. D. and Kreidenweis, S. M.: A single parameter representation of hygroscopic growth and cloud condensation nucleus activity, Atmos. Chem. Phys., 7, 1961–1971, https://doi.org/10.5194/acp-7-1961-2007, 2007.
Petters, M. D., Prenni, A. J., Kreidenweis, S. M., and DeMott, P. J.: On measuring the critical diameter of cloud condensation nuclei using mobility selected aerosol, Aerosol Sci. Tech., 41, 907–913, 2007.
Petters, M. D., Carrico, C. M., Kreidenweis, S. M., Prenni, A. J., DeMott, P. J., Collett Jr., J. L., and Moosmuller, H.: Cloud condensation nucleation activity of biomass burning aerosol, J. Geophys. Res., 114, D22205, https://doi.org/10.1029/2009jd012353, 2009.
Pöhlker, M. L., Pöhlker, C., Ditas, F., Klimach, T., Hrabe de Angelis, I., Araújo, A., Brito, J., Carbone, S., Cheng, Y., Chi, X., Ditz, R., Gunthe, S. S., Kesselmeier, J., Könemann, T., Lavrič, J. V., Martin, S. T., Mikhailov, E., Moran-Zuloaga, D., Rose, D., Saturno, J., Su, H., Thalman, R., Walter, D., Wang, J., Wolff, S., Barbosa, H. M. J., Artaxo, P., Andreae, M. O., and Pöschl, U.: Long-term observations of cloud condensation nuclei in the Amazon rain forest – Part 1: Aerosol size distribution, hygroscopicity, and new model parametrizations for CCN prediction, Atmos. Chem. Phys., 16, 15709–15740, https://doi.org/10.5194/acp-16-15709-2016, 2016.
Pöhlker, M. L., Ditas, F., Saturno, J., Klimach, T., Hrabě de Angelis, I., Araùjo, A. C., Brito, J., Carbone, S., Cheng, Y., Chi, X., Ditz, R., Gunthe, S. S., Holanda, B. A., Kandler, K., Kesselmeier, J., Könemann, T., Krüger, O. O., Lavrič, J. V., Martin, S. T., Mikhailov, E., Moran-Zuloaga, D., Rizzo, L. V., Rose, D., Su, H., Thalman, R., Walter, D., Wang, J., Wolff, S., Barbosa, H. M. J., Artaxo, P., Andreae, M. O., Pöschl, U., and Pöhlker, C.: Long-term observations of cloud condensation nuclei over the Amazon rain forest – Part 2: Variability and characteristics of biomass burning, long-range transport, and pristine rain forest aerosols, Atmos. Chem. Phys., 18, 10289–10331, https://doi.org/10.5194/acp-18-10289-2018, 2018.
Roberts, G. C. and Nenes, A.: A Continuous-Flow Streamwise Thermal-Gradient CCN Chamber for Atmospheric Measurements, Aerosol Sci. Tech., 39, 206–221, 2005.
Rose, D., Gunthe, S. S., Mikhailov, E., Frank, G. P., Dusek, U., Andreae, M. O., and Pöschl, U.: Calibration and measurement uncertainties of a continuous-flow cloud condensation nuclei counter (DMT-CCNC): CCN activation of ammonium sulfate and sodium chloride aerosol particles in theory and experiment, Atmos. Chem. Phys., 8, 1153–1179, https://doi.org/10.5194/acp-8-1153-2008, 2008.
Rose, D., Gunthe, S. S., Su, H., Garland, R. M., Yang, H., Berghof, M., Cheng, Y. F., Wehner, B., Achtert, P., Nowak, A., Wiedensohler, A., Takegawa, N., Kondo, Y., Hu, M., Zhang, Y., Andreae, M. O., and Pöschl, U.: Cloud condensation nuclei in polluted air and biomass burning smoke near the mega-city Guangzhou, China – Part 2: Size-resolved aerosol chemical composition, diurnal cycles, and externally mixed weakly CCN-active soot particles, Atmos. Chem. Phys., 11, 2817–2836, https://doi.org/10.5194/acp-11-2817-2011, 2011.
Su, H., Rose, D., Cheng, Y. F., Gunthe, S. S., Massling, A., Stock, M., Wiedensohler, A., Andreae, M. O., and Pöschl, U.: Hygroscopicity distribution concept for measurement data analysis and modeling of aerosol particle mixing state with regard to hygroscopic growth and CCN activation, Atmos. Chem. Phys., 10, 7489–7503, https://doi.org/10.5194/acp-10-7489-2010, 2010.
Su, H., Cheng, Y., Ma, N., Wang, Z., Wang, X., Pöhlker, M. L., Nillius, B., Wiedensohler, A., and Pöschl, U.: A broad supersaturation scanning (BS2) approach for rapid measurement of aerosol particle hygroscopicity and cloud condensation nuclei activity, Atmos. Meas. Tech., 9, 5183–5192, https://doi.org/10.5194/amt-9-5183-2016, 2016.
Svenningsson, B., Rissler, J., Swietlicki, E., Mircea, M., Bilde, M., Facchini, M. C., Decesari, S., Fuzzi, S., Zhou, J., Mønster, J., and Rosenørn, T.: Hygroscopic growth and critical supersaturations for mixed aerosol particles of inorganic and organic compounds of atmospheric relevance, Atmos. Chem. Phys., 6, 1937–1952, https://doi.org/10.5194/acp-6-1937-2006, 2006.
Thalman, R., de Sá, S. S., Palm, B. B., Barbosa, H. M. J., Pöhlker, M. L., Alexander, M. L., Brito, J., Carbone, S., Castillo, P., Day, D. A., Kuang, C., Manzi, A., Ng, N. L., Sedlacek III, A. J., Souza, R., Springston, S., Watson, T., Pöhlker, C., Pöschl, U., Andreae, M. O., Artaxo, P., Jimenez, J. L., Martin, S. T., and Wang, J.: CCN activity and organic hygroscopicity of aerosols downwind of an urban region in central Amazonia: seasonal and diel variations and impact of anthropogenic emissions, Atmos. Chem. Phys., 17, 11779–11801, https://doi.org/10.5194/acp-17-11779-2017, 2017.
Wang, Z., Su, H., Wang, X., Ma, N., Wiedensohler, A., Pöschl, U., and Cheng, Y.: Scanning supersaturation condensation particle counter applied as a nano-CCN counter for size-resolved analysis of the hygroscopicity and chemical composition of nanoparticles, Atmos. Meas. Tech., 8, 2161–2172, https://doi.org/10.5194/amt-8-2161-2015, 2015.
Wex, H., Petters, M. D., Carrico, C. M., Hallbauer, E., Massling, A., McMeeking, G. R., Poulain, L., Wu, Z., Kreidenweis, S. M., and Stratmann, F.: Towards closing the gap between hygroscopic growth and activation for secondary organic aerosol: Part 1 – Evidence from measurements, Atmos. Chem. Phys., 9, 3987–3997, https://doi.org/10.5194/acp-9-3987-2009, 2009.
Wiedensohler, A.: An Approximation of the Bipolar Charge-Distribution for Particles in the Sub-Micron Size Range, J. Aerosol Sci. 19, 387–389, 1988.
Zhang, J., Spielman, S., Wang, Y., Zheng, G., Gong, X., Hering, S., and Wang, J.: Rapid measurement of RH-dependent aerosol hygroscopic growth using a humidity-controlled fast integrated mobility spectrometer (HFIMS), Atmos. Meas. Tech., 14, 5625–5635, https://doi.org/10.5194/amt-14-5625-2021, 2021.
Zhao, D. F., Buchholz, A., Kortner, B., Schlag, P., Rubach, F., Kiendler-Scharr, A., Tillmann, R., Wahner, A., Flores, J. M., Rudich, Y., Watne, Å. K., Hallquist, M., Wildt, J., and Mentel, T. F.: Size-dependent hygroscopicity parameter (κ) and chemical composition of secondary organic cloud condensation nuclei, Geophys. Res. Lett., 42, 10920–10928, https://doi.org/10.1002/2015GL066497, 2015.
- Abstract
- Introduction
- Method
- Results and discussion
- Evaluation and application of the BS2-CCN system
- Summary and conclusion
- Appendix A: Newly designed diffusive inlet
- Data availability
- Author contributions
- Competing interests
- Disclaimer
- Acknowledgements
- Financial support
- Review statement
- References
- Supplement