the Creative Commons Attribution 4.0 License.
the Creative Commons Attribution 4.0 License.
 | 19 Nov 2021
Importance of the Webb, Pearman, and Leuning (WPL) correction for the measurement of small CO2 fluxes
Katharina Jentzsch
Julia Boike
Thomas Foken
The WPL (Webb, Pearman, and Leuning) correction is fully accepted to correct trace gas fluxes like CO2 for density fluctuations due to water vapour and temperature fluctuations for open-path gas analysers. It is known that this additive correction can be on the order of magnitude of the actual flux. However, this is hardly ever included in the analysis of data quality. An example from the Arctic shows the problems, because the size of the correction is a multiple of the actual flux. As a general result, we examined and tabulated the magnitude of the WPL correction for carbon dioxide flux as a function of sensible and latent heat flux. Furthermore, we propose a parameter to better estimate possible deficits in data quality and recommend integrating the quality flag derived with this parameter into the general study of small carbon dioxide fluxes.
- Article
(785 KB) - Full-text XML
-
Supplement
(272 KB) - BibTeX
- EndNote


The WPL (Webb, Pearman, and Leuning) correction (Webb et al., 1980) has been fully accepted in the international scientific community for many years. After initial discussions on the derivation of the correction up to the beginning of the 2000s, no further discussions took place after the clarification by Leuning (2007, 2004). The correction is used in the textbook literature (Aubinet et al., 2012) and integrated in a similar form in all software packages for the calculation of eddy-covariance measurements and must be applied predominantly for open-path devices when the input variables are not measured as mixing ratios. The correction is necessary because fluctuations in temperature and humidity cause fluctuations in trace gas concentrations and can simulate a flux, for instance of CO2, or modify its size.
The size of the WPL correction on the CO2 flux is generally assumed to be a few 10 %, and on the latent heat flux it is only about 1 % (Liebethal and Foken, 2003, 2004), but for Bowen ratios Bo≫1 it can be up to 10 % (Foken, 1989) of the raw flux data. The absolute value of the correction is in the range from −2.5 to +10 µmol m−2 s−1 depending on the magnitude of the sensible and latent heat flux. This correction to the measured flux can be large, i.e. the additive correction may significantly change the CO2 flux calculated using the covariance of vertical velocity and partial density (Mauder et al., 2021). However, there is a lack of investigations under which circumstances the application of the WPL correction is uncritical and under which conditions it might produce physically impossible effects on the fluxes. However, it is obvious that CO2 fluxes on the order of 1 µmol m−2 s−1 can be significantly altered by the WPL correction.
In a recently published article on CO2 fluxes under Arctic conditions (Jentzsch et al., 2021), events with strong CO2 uptake and emission were investigated that were also found by other authors (e.g., Lüers et al., 2014). It was found that these events may be artefacts due to the WPL correction because the CO2 fluxes during the events are very strongly correlated with the sensible heat flux. These investigations provide the grounds for investigating the WPL correction under conditions of small CO2 fluxes in more detail.
Such low fluxes occur, for example, over burned areas (Oliveira et al., 2021) or over sandy deserts (Su et al., 2013). This paper uses an example from the Arctic (Jentzsch et al., 2021) to show that the WPL correction may well lead to misjudgements of water vapour and carbon dioxide measurements with an open-path gas analyser. The conditions under which the WPL correction has a considerable influence on the CO2 flux are shown with possible consequences. Errors in CO2 flux measurements in cold climate conditions have often been associated with the Burba correction (Burba et al., 2008; Kittler et al., 2017). This correction is relevant when convective processes occur at heated windows of the gas analyser. Because of the application of a low window temperature and an inclined position of the gas analyser, this correction was not applied in the following study.
The WPL correction is relevant for the measurement of the partial density, e.g. of CO2, with open-path gas analysers, and the basic equations are as follows: (Foken et al., 2012)
with the corrected flux of scalar quantity (CO2) Fc, the mass density of a scalar (CO2) quantity ρc, the mass density of dry air ρd, the density of water vapour ρw, the measured trace gas (CO2) flux , the water vapour flux , the sensible heat flux , and the mean temperature . This is paired with the following equation:
with the molar masses of dry air md and of water vapour mw. Equation (1) can be simplified for the correction of H2O flux (latent heat flux) as follows:
In Eqs. (1) and (3), and T′ represent fluctuations of water vapour and temperature inside the measurement volume of the open-path gas analyser.
Most quantities in Eq. (1) are temperature dependent. It is obvious to investigate whether there is a temperature dependence of the WPL correction. The relevant temperature-dependent quantities of the second term of Eq. (1) are and in the third term they are (essentially σand ); see Foken et al. (2021). Temperature effects in the terms partially compensate each other. For the sensible and latent heat flux in kinematic units there is no temperature dependence for temperatures > 0 ∘C. For negative temperatures, there is a dependence that provides up to 15 % higher correction at approx. −30 ∘C. If the heat fluxes are used in energetic units (correction with air density), there is no temperature dependency and only a few percent at temperatures above 20–30 ∘C. For more details, see the Supplement.
The measurements shown are from the Bayelva site located at N and E in the European High Arctic, about 2 km south west of the research settlement of Ny Ålesund in the northwest of the Svalbard archipelago. The eddy-covariance instruments relevant for this study are a sonic anemometer CSAT3 (Campbell Sci.) and an open-path gas analyser 7500A (LI-COR Biosciences). The data were calculated with the software package EddyPro (LI-COR Biosciences, 2017, Version 7.0.6). For more details on the site, instrumentation, and data analysis, see Jentzsch et al. (2021). The measurements of this site have been published by, e.g. Westermann et al. (2009) and Lüers et al. (2014).
Figure 1 shows a measurement example for short-term CO2 emission (positive flux) on 6 December 2015 (polar night). In comparison, the magnitude of the WPL correction is shown. In addition, the Burba correction (Burba et al., 2008) is shown and is well below 50 % of the corrected flux. During the short period around 09:00 CET (Central European Time), the sensible heat flux was about −70 W m−2, and the latent heat flux was about 35 W m−2. Evaporation and sublimation were also confirmed by gradient measurements (data not shown). The necessary energy for evaporation was supplied in the polar night by the downward-directed sensible heat flux.
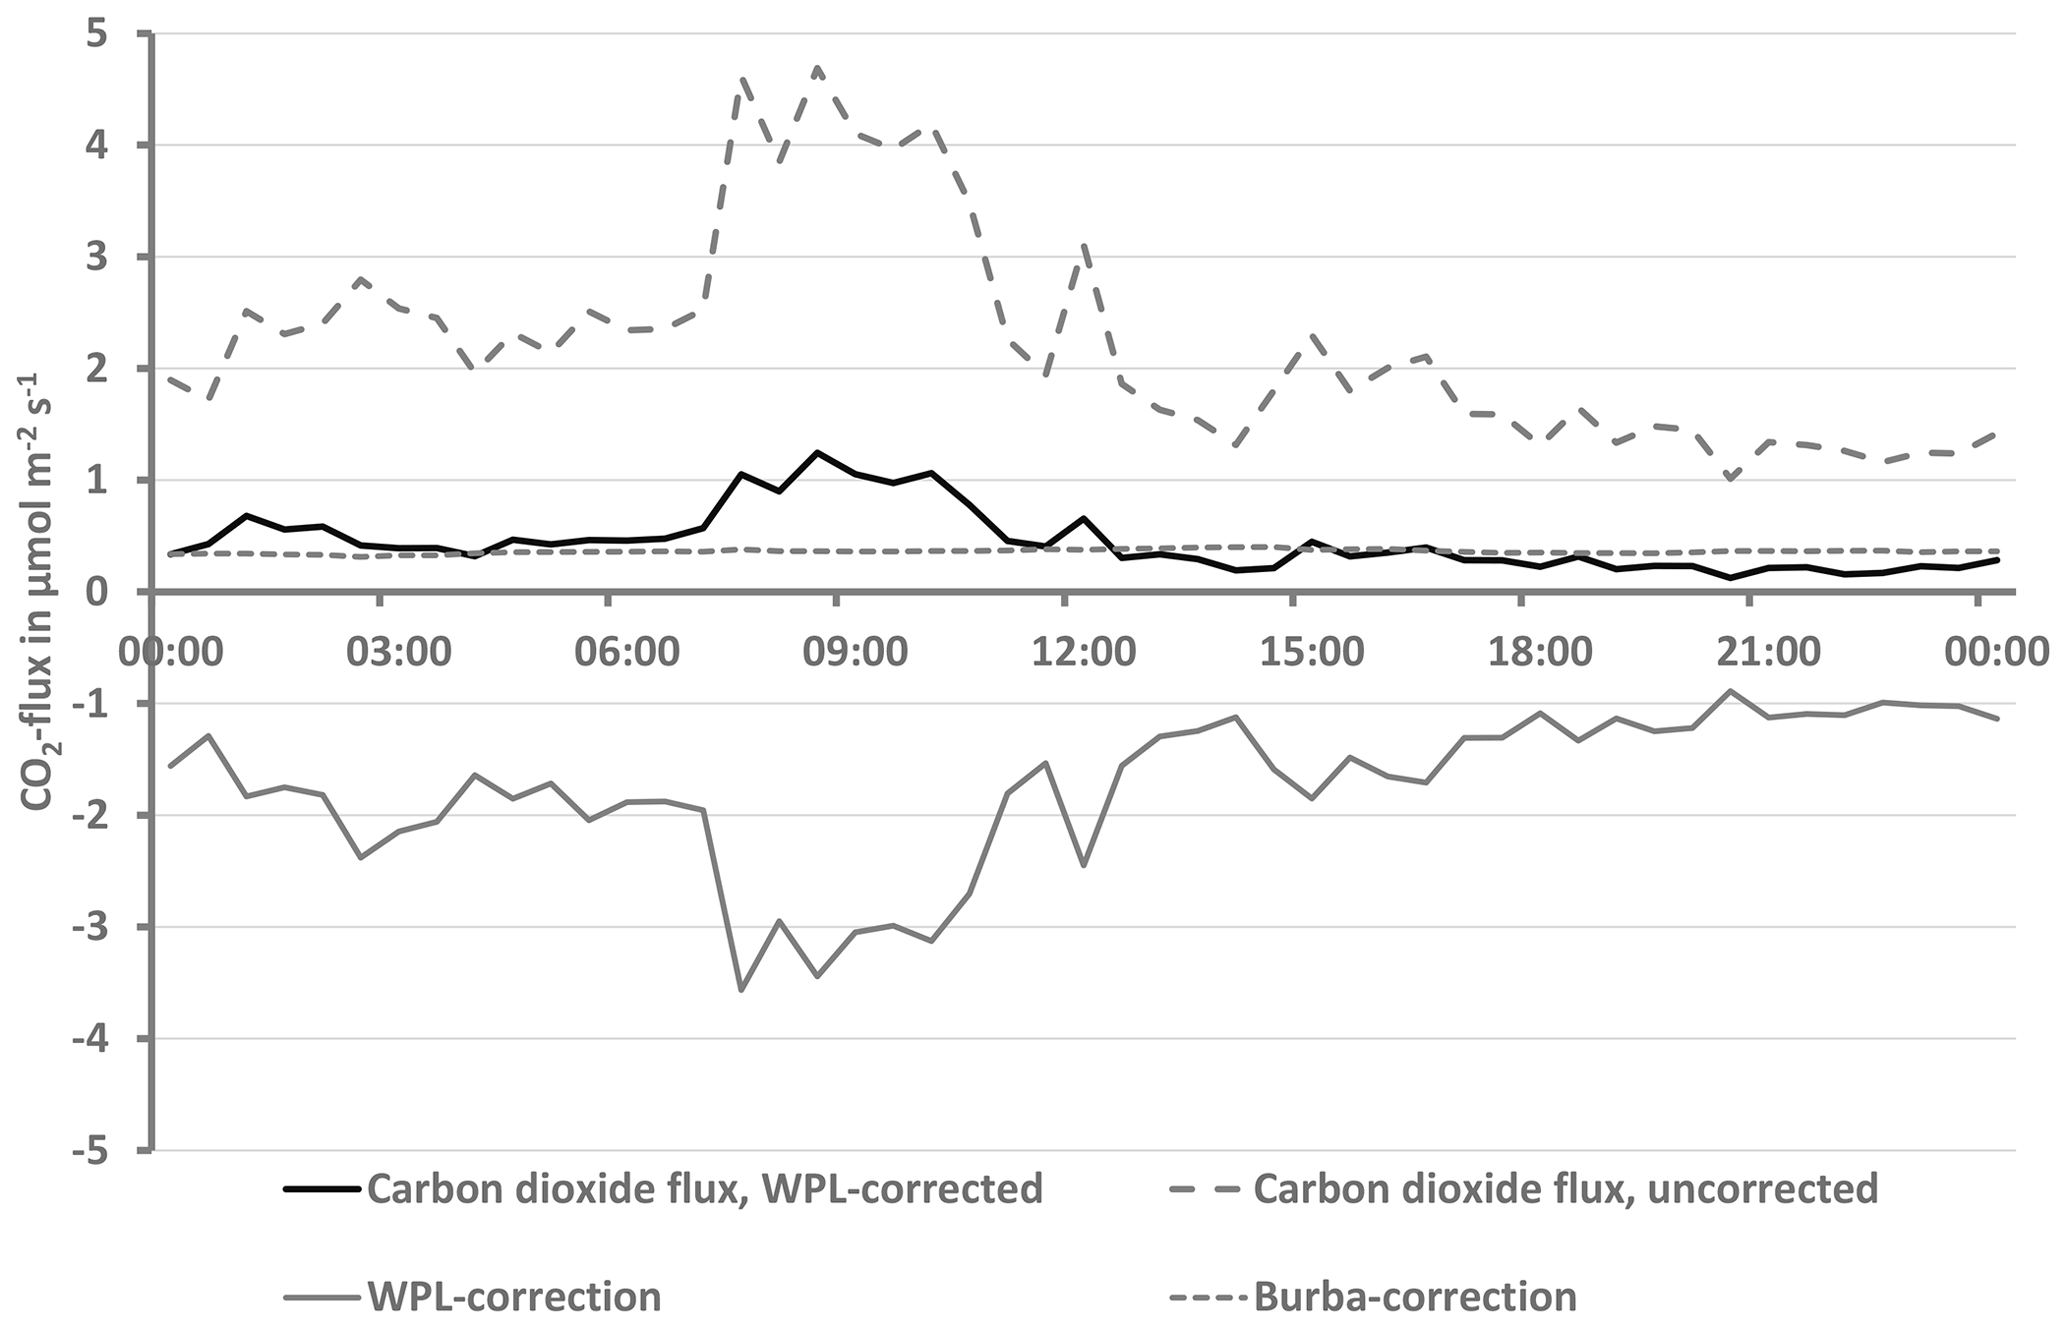
Figure 1Comparison of WPL-corrected and uncorrected CO2 flux together with the size of the WPL and Burba corrections on 6 December 2015 at the Bayelva site calculated with EddyPro, with a temperature range 268–270 K.
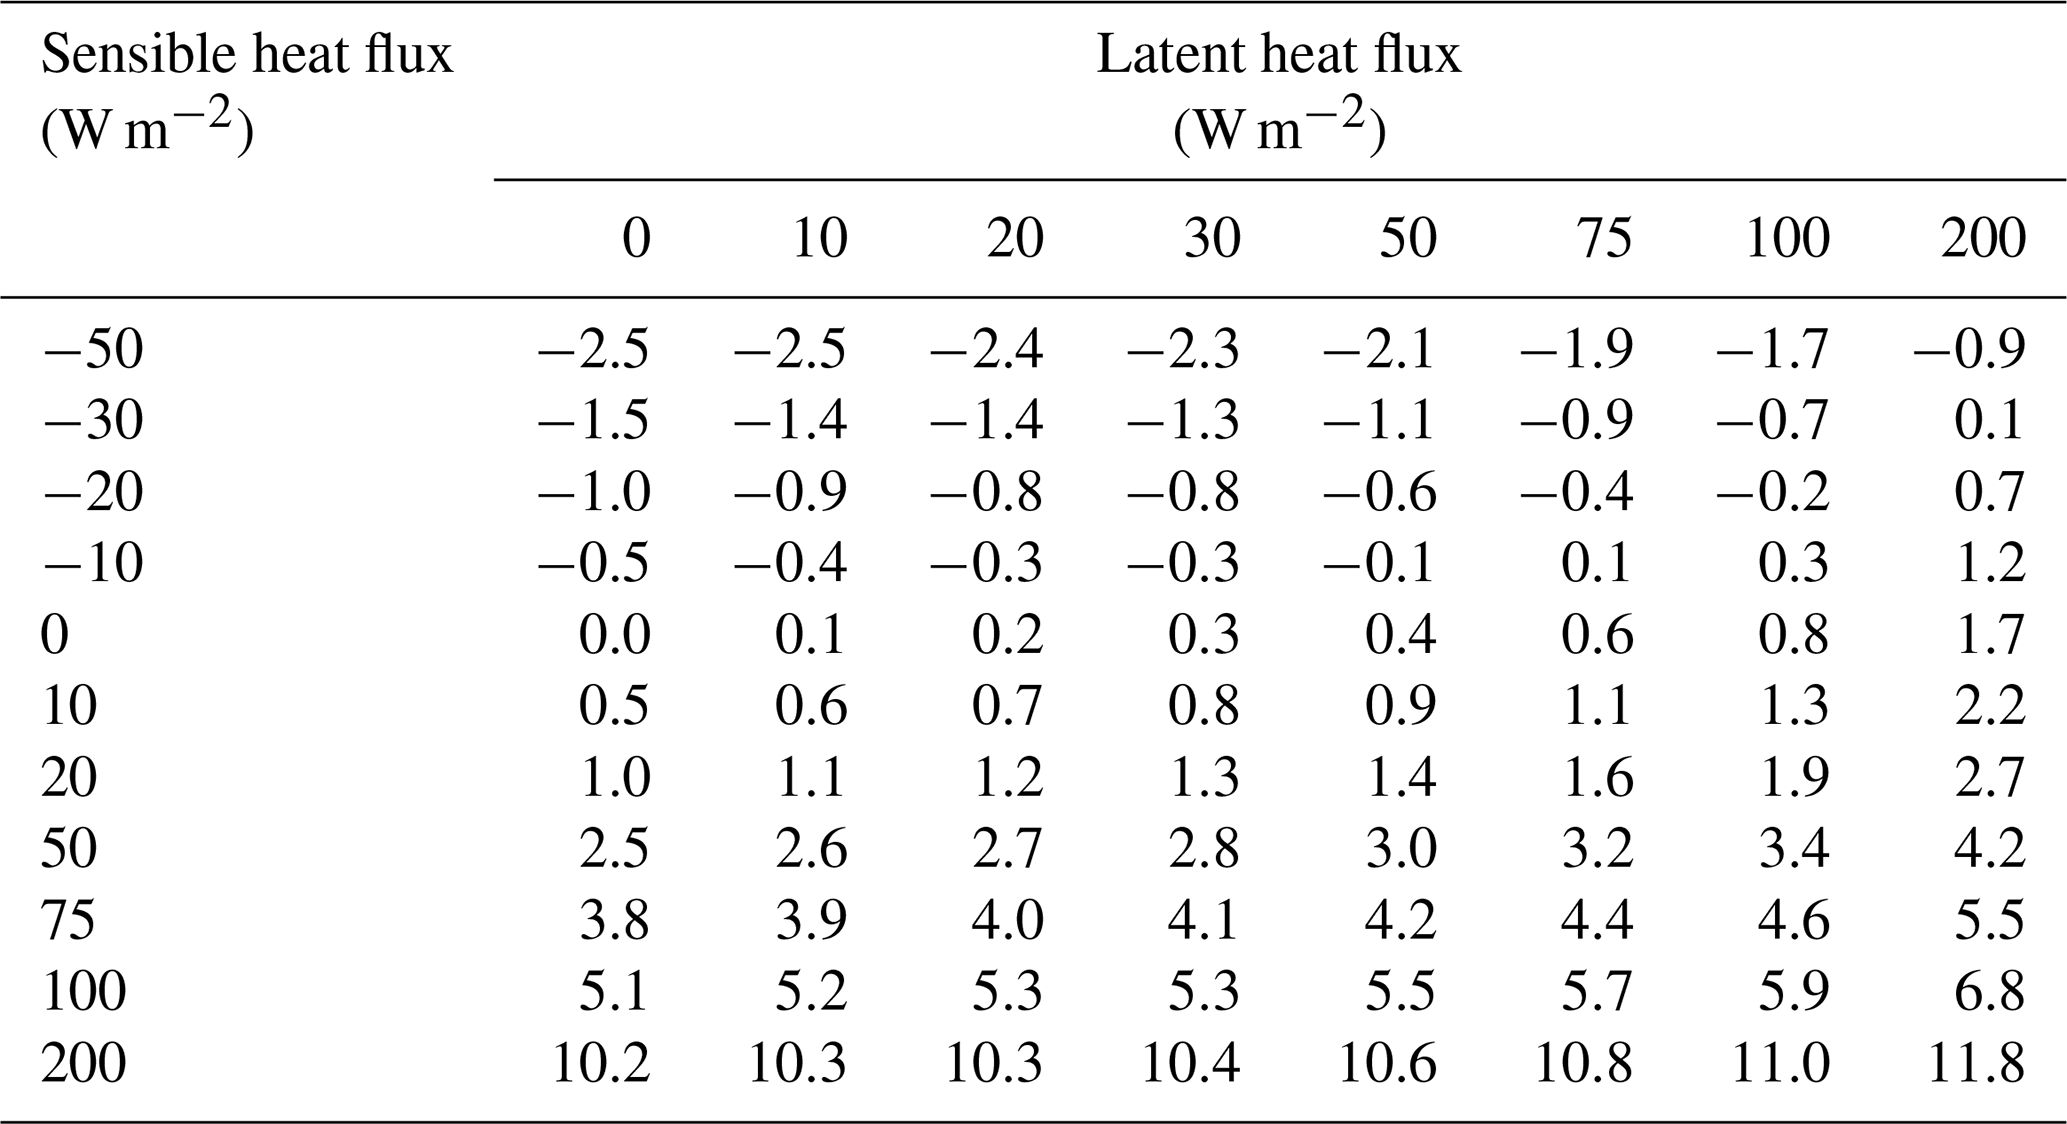
Table 1WPL correction (in ), using the second and third term of Eq. (1), as a function of sensible and latent heat flux for standard atmospheric conditions (1013 hPa, 15 ∘C), a CO2 concentration of 415 ppm, and 100 % relative humidity. At lower humidity values, the correction factor is a few percent lower in terms of the sensible heat flux.
In Fig. 2, both terms were explicitly calculated with the measured data and not by EddyPro with identical results. It is shown that temperature fluctuations have a much stronger influence on the size of the WPL correction.
In the case of a CO2 uptake (negative flux) with negative sensible heat flux, the absolute value of the flux would be even larger. In the case of positive sensible heat flux, the third term in Eq. (1) is also positive and an uptake would be reduced, while emissions would be increased.
The influence of the WPL correction on the latent heat flux is not shown. It is known to be relatively small, and in the present case for the period from 08:00 to 11:00 CET it was about 3 %; at all other times it was 1 %–2 %. This is below the typical flux measurement error (Foken et al., 2012) for most of the fluxes of about 10 %.
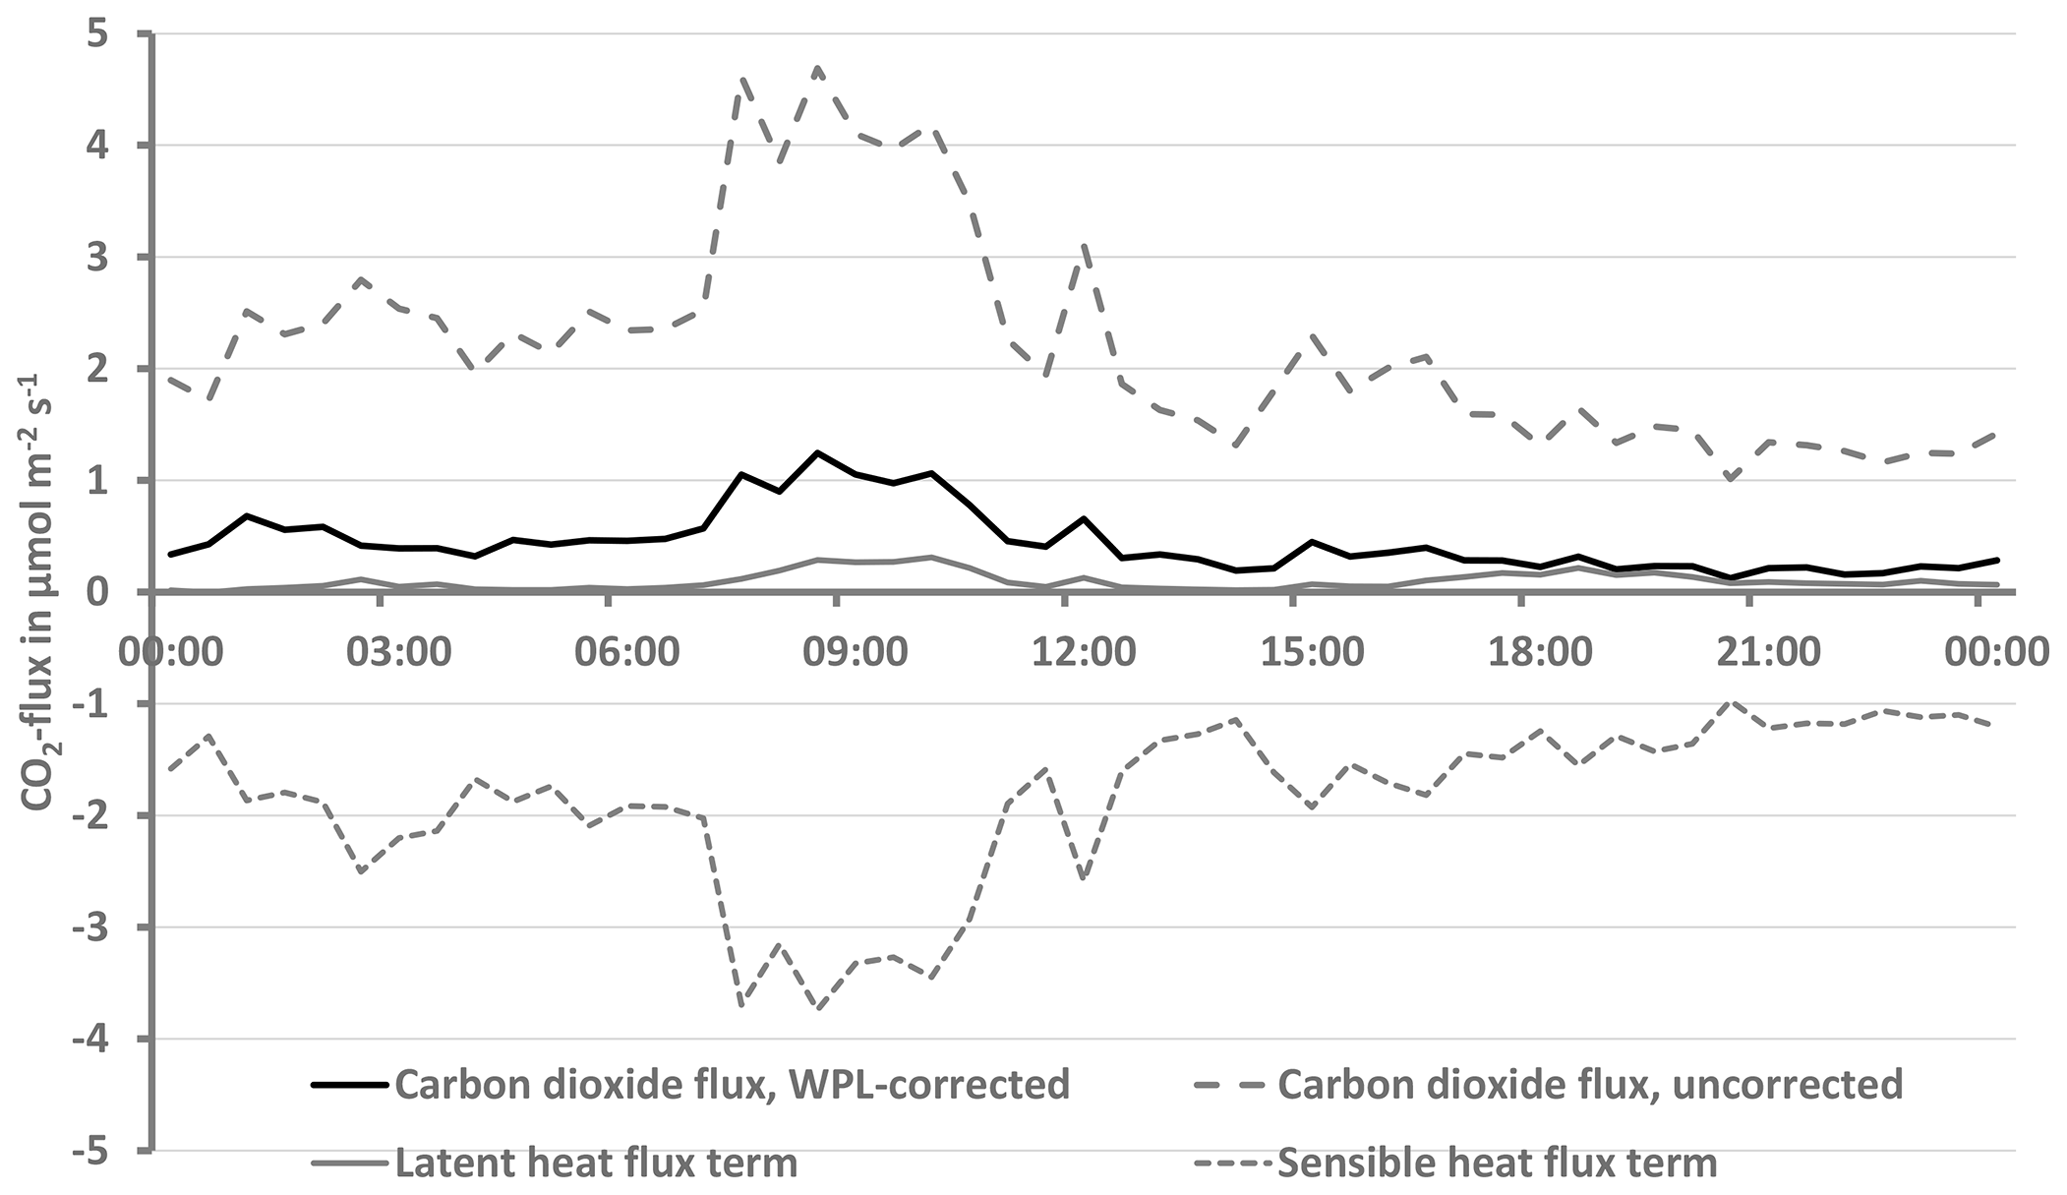
Figure 2Comparison of WPL-corrected and uncorrected CO2 flux together with the size of humidity fluctuation term (second term on the right-hand side of Eq. (1) and temperature fluctuation term (third term) for the data set shown in Fig. 1.
3.1 Size of the WPL correction
A variable CO2 density has a linear influence on the WPL correction since it is part in both terms. This can lead to an increase of the correction up to about a factor of 3 (for 1000 to 1500 ppm CO2 concentration) over strongly respiring surfaces under stable stratification. With strong assimilation, on the other hand, the concentration can go only slightly below the global average.
Table 1 shows the WPL correction as a function of the size of the sensible and latent heat flux for standard atmospheric conditions (1013 hPa, 15 ∘C) and a CO2 concentration of 415 ppm. The table hardly differs from Fig. 1 in Webb et al. (1980), who have already pointed out the considerable size of the correction (in kg m−2 s−1).
For small CO2 fluxes, the WPL correction is sometimes a multiple of the actual flux. Especially for fluxes < 5 µmol m−2 s−1, the interpretation of extraordinary events is very questionable. In the present case (Fig. 1), an absolute value of the sensible heat flux that increased by 20 W m−2, which is still within the error range, would no longer show a clear emission event. Since the event cannot be plausibly explained physically, it should be marked as faulty and excluded by a MAD test (absolute deviation from the median, Papale et al., 2006), which must be adapted to the respective process to be investigated.
Small errors could have a large impact on cumulative fluxes, especially if the errors have a bias. Therefore, the interpretation of such fluxes has to be done very carefully. However, in the case of a carbon uptake and positive sensible heat fluxes, these fluxes would be reduced and, as the above example has shown, emissions with negative sensible heat fluxes would also be reduced. This could compensate for the errors, but this would have to be shown in each individual case.
Furthermore, small CO2 fluxes often occur in connection with negative sensible heat fluxes. This is the case when evaporation takes place, but the energy required for this must be provided at least partially by a downwardly directed sensible heat flux. This is known as the so-called oasis effect (Foken, 2017; Stull, 1988), which occurs relatively often in the late afternoon. The case discussed here during the polar night can also be described as an oasis effect. Furthermore, a strong cooling of the surface by longwave radiation causes a compensation by a downward-directed sensible heat flux. This is particularly typical in the first half of the night, when the stratification is stable. Over land surfaces, small CO2 fluxes can always be considered reliable when the sensible heat flux is close to zero.
3.2 Quality flagging of the WPL correction
Since the specificity of possible errors in WPL correction is not taken into account by usual error analyses of eddy-covariance data (e.g. Mauder et al., 2013), measurement data with very large WPL corrections should be marked. A possible parameter could be the ratio of WPL correction and corrected CO2 flux:
Similar parameters could be defined separately for the term of humidity fluctuations QFw
and temperature fluctuations QFT
Figure 3 shows these parameters for the example given in Fig. 1. Here QFw is < 1 and therefore only has little influence on the correction, which is essentially determined by QFT. The parameter QFWPL should be sufficient for the quality identification of WPL-corrected CO2 flux. Following common systems with quality flags (Foken and Wichura, 1996; Foken et al., 2012), .5 could be classified as very good, 0. as good, and all values should be specially checked. It is useful to define maximum limit values for the WPL-corrected CO2 flux if the flux is below the detection limit because then the absolute values can be significantly higher than 5 (see Figs. 1 and 3 after 18:00 CET).
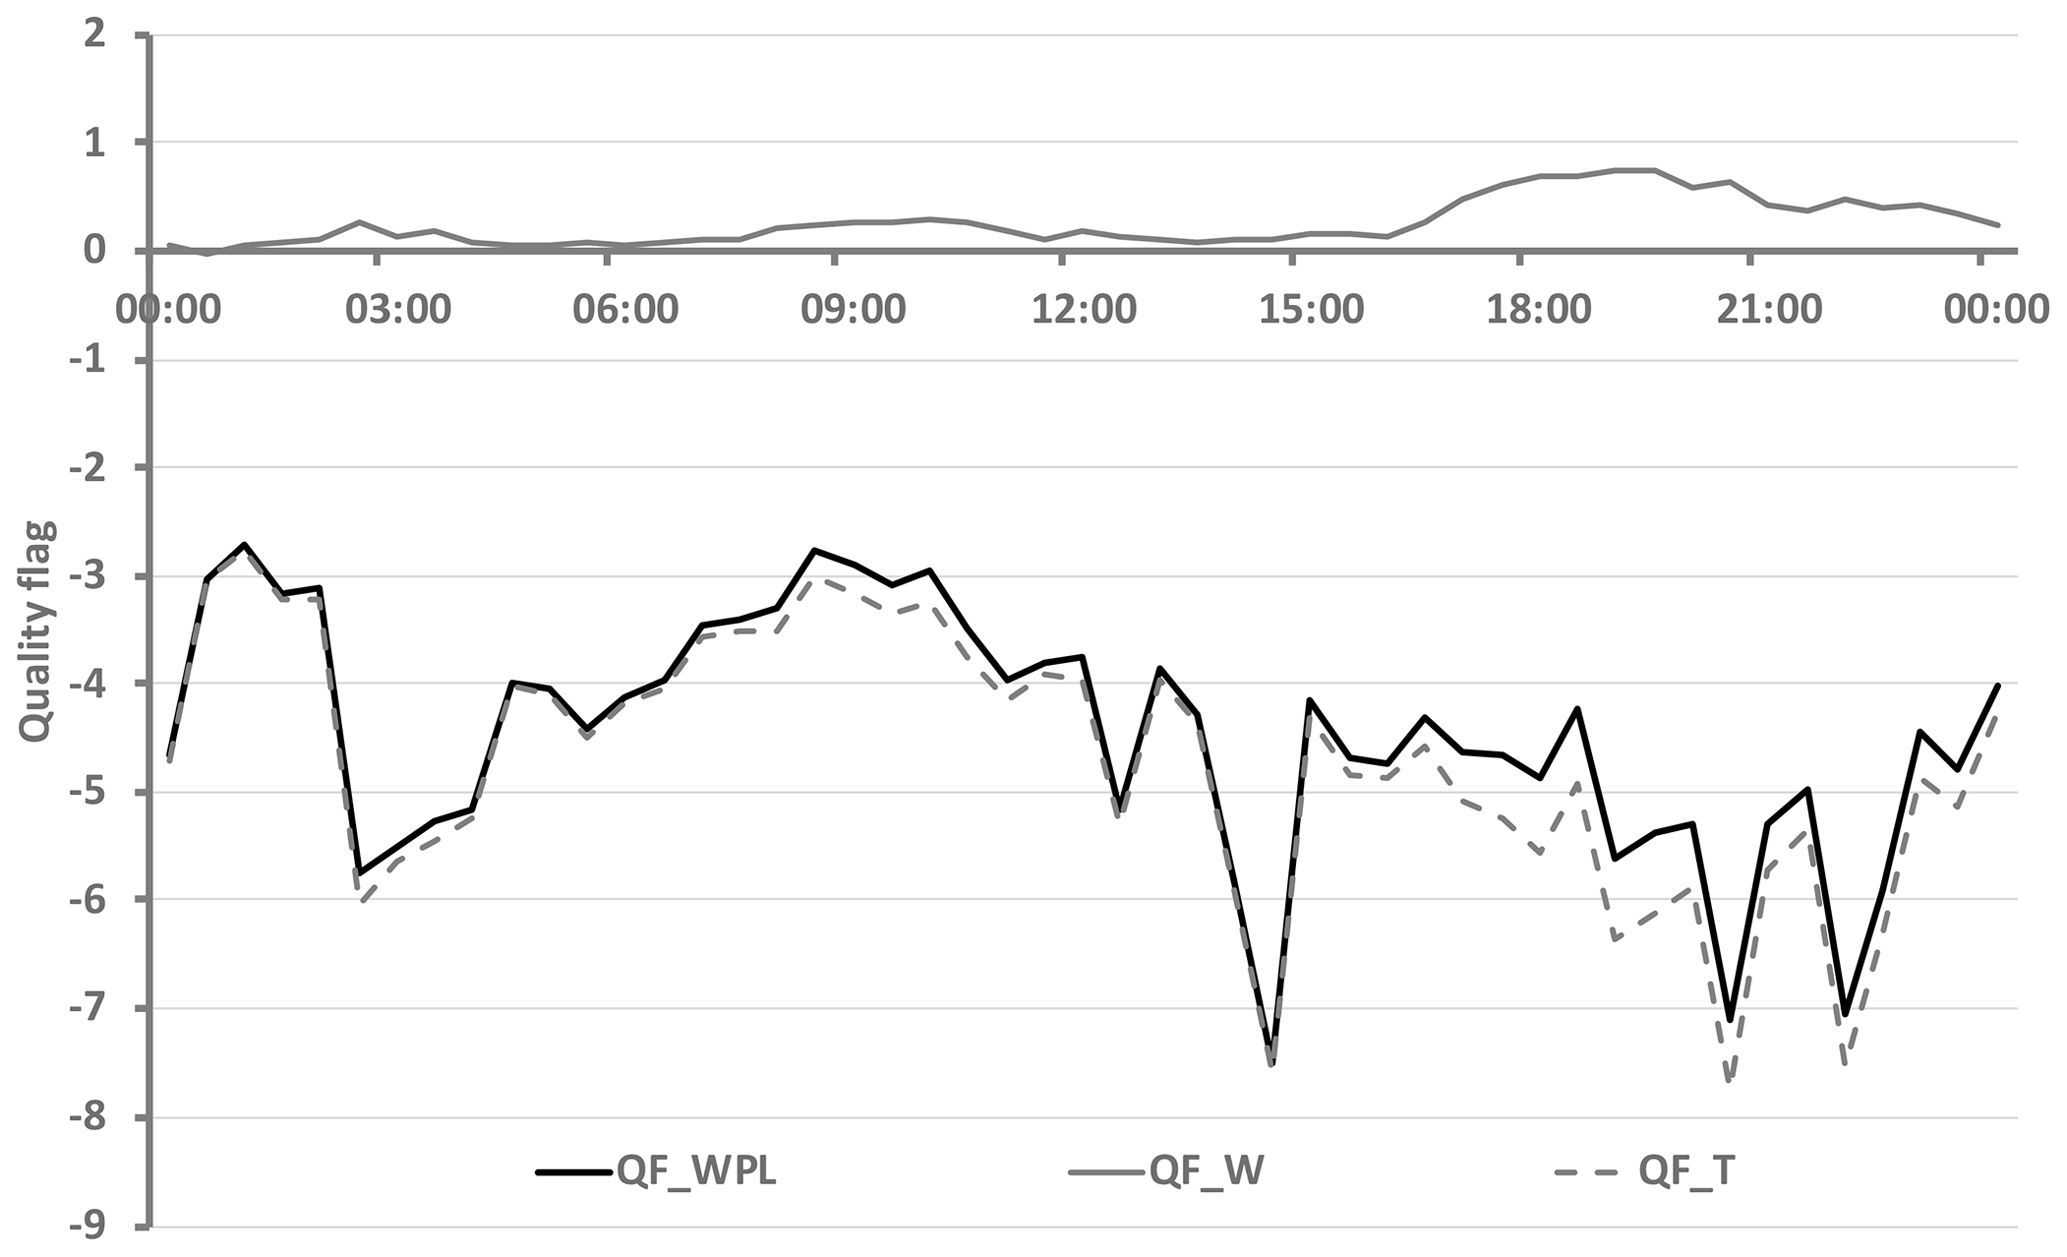
Figure 3Quality flags of the WPL correction according to Eq. (4) for the example given in Fig. 1.
Due to the significant problems with the additive WPL correction, other possible influencing factors, such as spectral cross-sensitivities between CO2 and water vapour (Kondo et al., 2014) and imperfect sensor calibrations are excluded from the discussion. Furthermore, the Burba correction (Burba et al., 2008), which is a modified WPL correction, should be re-examined under these conditions. This might explain Burba corrections in the summer half year that are difficult to interpret (Kittler et al., 2017). However, the correction should generally not be applied in the warm season.
According to the original work on the WPL correction (Webb et al., 1980), it should be noted that in some conditions the correction is expected to be on the same order of magnitude as the flux. This fact has only been given the necessary attention in a few works on the error analysis of CO2 fluxes or other trace gas fluxes (Burba et al., 2019), to which the above statements apply analogously, measured with open-path gas analysers. From the investigation of individual events of CO2 fluxes presented in this study, we have formulated the following conclusions.
- i.
We strongly suggest that the WPL correction should be subjected to a special quality analysis. For this purpose, the quality flag of the correction expressed in Eq. (4) or/and Eq. (6) could, for example, be explicitly output for all eddy-covariance software packages. At least for small fluxes it would have to be included in the quality considerations.
- ii.
We propose that special events in time series of trace gas fluxes should only be interpreted if the WPL quality flag is below a maximum limit values and can be clearly qualitatively and quantitatively assigned to physical processes. Otherwise, these data should be identified with a MAD analysis and interpolated if necessary.
- iii.
We suggest that respiration data for the derivation of the gap-filling algorithm (Lloyd and Taylor, 1994) should be obtained at times when the sensible heat flux is near 0 W m−2, i.e. if possible in the second half of the night and not at sunset because of the relatively large negative sensible heat fluxes. The quality criterion should be applied to these data.
- iv.
If CO2 fluxes < 5 µmol m−2 s−1 are expected at a site, we recommend the use of a closed-path gas analyser instead of an open-path gas analyser. However, it must be guaranteed that complete isothermal conditions are achieved in the measurement volume of the closed path sensor, otherwise the same problems as described above will occur.
- v.
In addition to the WPL correction, we recommend that all corrections used in the eddy-covariance method, which are made by adding correction terms to the measured flux, should be critically reviewed. This applies, for example, to the Burba correction for open-path gas analysers and the various corrections for closed-path devices. It may also be necessary to investigate whether errors in the application of the WPL correction and the above-mentioned corrections lead to a bias in accumulated fluxes for which appropriate simulations will probably have to be performed.
- vi.
These remarks suggest that a discussion on alternative measurement methods and minor imperfections in field calibrations should be continued. This includes the direct measurement of the mixing ratio (Kowalski and Serrano-Ortiz, 2007) as realized in closed-path instruments when complete isothermal condition is guaranteed in the measurement volume. This also means that density-averaged measurement of CO2 fluctuations (Kramm et al., 1995) according to the Hesselberg averaging (Hesselberg, 1926) should be reconsidered.
The eddy flux data are openly available under CC-BY-4.0 in the FLUXNET database (http://www.europe-fluxdata.eu/;ID:Sj-Blv, Boike, 2021).
The supplement related to this article is available online at: https://doi.org/10.5194/amt-14-7291-2021-supplement.
KJ made first investigations of the WPL term under Arctic conditions guided by JB. These first analyses were extended by TF to the present paper. After the discussion of the results, KJ, JB, and TF completed the paper.
The contact author has declared that neither they nor their co-authors have any competing interests.
Publisher's note: Copernicus Publications remains neutral with regard to jurisdictional claims in published maps and institutional affiliations.
This publication was funded by the German Research Foundation (DFG) and the University of Bayreuth under the open-access publishing funding programme.
This open-access publication was funded by the University of Bayreuth.
This paper was edited by Christian Brümmer and reviewed by George Burba and one anonymous referee.
Aubinet, M., Vesala, T., and Papale, D. (Eds.): Eddy covariance: A Practical Guide to Measurement and Data Analysis, Springer, Dordrecht, Heidelberg, London, New York, 438 pp., https://doi.org/10.1007/978-94-007-2351-1, 2012.
Boike, J.: FLUXNET database, available at: http://www.europe-fluxdata.eu/;ID:Sj-Blv, last access: 17 November 2021.
Burba, G., McDermitt, D. K., Grelle, A., Anderson, D. J., and Xu, L.: Addressing the influence of instrument surface heat exchange on the measurements of CO2 flux from open-path gas analyzers, Glob. Change Biol., 14, 1854–1876, https://doi.org/10.1111/j.1365-2486.2008.01606.x, 2008.
Burba, G., Anderson, T., and Komissarov, A.: Accounting for spectroscopic effects in laser-based open-path eddy covariance flux measurements, Glob. Change Biol., 2019, 14614, https://doi.org/10.1111/gcb.14614, 2019.
Foken, T.: Anmerkungen zur Problematik möglicher Fehler bei der Bestimmung turbulenter Austauschströme nach der Flux-Methode (Remarks on the problem of possible errors in the determination of turbulent exchange according to the flux method), Z. Meteorol., 39, 112–113, 1989.
Foken, T.: Micrometeorology, 2nd Edn., Springer, Berlin, Heidelberg, 362 pp., https://doi.org/10.1007/978-3-642-25440-6, 2017.
Foken, T. and Wichura, B.: Tools for quality assessment of surface-based flux measurements, Agr. Forest Meteorol., 78, 83–105, https://doi.org/10.1016/0168-1923(95)02248-1, 1996.
Foken, T., Leuning, R., Oncley, S. P., Mauder, M., and Aubinet, M.: Corrections and data quality in: Eddy Covariance: A Practical Guide to Measurement and Data Analysis, edited by: Aubinet, M., Vesala, T., and Papale, D., Springer, Dordrecht, Heidelberg, London, New York, 85–131, https://doi.org/10.1007/978-94-007-2351-1_4, 2012.
Foken, T., Hellmuth, O., Huwe, B., and Sonntag, D.: Physical quantities, in: Springer Handbook of Atmospheric Measurements, edited by: Foken, T., Springer Nature, Switzerland, 107–151, https://doi.org/10.1007/978-3-030-51171-4_5, 2021.
Hesselberg, T.: Die Gesetze der ausgeglichenen atmosphärischen Bewegungen, Beiträge zur Physik der freien Atmosphäre, 12, 141–160, 1926.
Jentzsch, K., Schulz, A., Pirk, N., Foken, T., Crewell, S., and Boike, J.: High levels of CO2 exchange during synoptic-scale events introduce large uncertainty into the Arctic carbon budget, Geophys. Res. Lett., 48, e2020GL092256, https://doi.org/10.1029/2020GL092256, 2021.
Kittler, F., Eugster, W., Foken, T., Heimann, M., Kolle, O., and Göckede, M.: High-quality eddy-covariance CO2 budgets under cold climate conditions, J. Geophys. Res.-Biogeo., 122, 2064–2084, https://doi.org/10.1002/2017JG003830, 2017.
Kondo, F., Ono, K., Mano, M., Miyata, A., and Tsukamoto, O.: Experimental evaluation of water vapour cross-sensitivity for accurate eddy covariance measurement of CO2 flux using open-path CO2/H2O gas analysers, Tellus B, 66, 23803, https://doi.org/10.3402/tellusb.v66.23803, 2014.
Kowalski, A. S. and Serrano-Ortiz, P.: On the relationship between the eddy covariance, the turbulent flux, and surface exchange for a trace gas such as CO2, Bound.-Lay. Meteorol., 124, 129–141, https://doi.org/10.1007/s10546-007-9171-z, 2007.
Kramm, G., Dlugi, R., and Lenschow, D. H.: A re-evaluation of the Webb correction using density weighted averages, J. Hydrol., 166, 293–311, https://doi.org/10.1016/0022-1694(94)05088-F, 1995.
Leuning, R.: Measurements of trace gas fluxes in the atmosphere using eddy covariance: WPL corrections revisited, in: Handbook of Micrometeorology: A Guide for Surface Flux Measurements and Analysis, edited by: Lee, X., Massman, W. J., and Law, B., Kluwer, Dordrecht, 119–132, https://doi.org/10.1007/1-4020-2265-4_6, 2004.
Leuning, R.: The correct form of the Webb, Pearman and Leuning equation for eddy fluxes of trace gases in steady and non-steady state, horizontally homogeneous flows, Bound.-Lay. Meteorol., 123, 263–267, https://doi.org/10.1007/s10546-006-9138-5, 2007.
Liebethal, C. and Foken, T.: On the significance of the Webb correction to fluxes, Bound.-Lay. Meteorol., 109, 99–106, https://doi.org/10.1023/A:1025421903542, 2003.
Liebethal, C. and Foken, T.: On the significance of the Webb correction to fluxes, Corrigendum, Bound.-Lay. Meteorol., 113, 301, https://doi.org/10.1023/B:BOUN.0000039451.75031.ce, 2004.
Lloyd, J. and Taylor, J. A.: On the temperature dependence of soil respiration, Funct. Ecol., 8, 315–323, https://doi.org/10.2307/2389824, 1994.
Lüers, J., Westermann, S., Piel, K., and Boike, J.: Annual CO2 budget and seasonal CO2 exchange signals at a high Arctic permafrost site on Spitsbergen, Svalbard archipelago, Biogeosciences, 11, 6307–6322, https://doi.org/10.5194/bg-11-6307-2014, 2014.
Mauder, M., Cuntz, M., Drüe, C., Graf, A., Rebmann, C., Schmid, H. P., Schmidt, M., and Steinbrecher, R.: A strategy for quality and uncertainty assessment of long-term eddy-covariance measurements, Agr. Forest Meteorol., 169, 122–135, https://doi.org/10.1016/j.agrformet.2012.09.006, 2013.
Mauder, M., Foken, T., Aubinet, M., and Ibrom, A.: Eddy-Covariance Measurements, in: Springer Handbook of Atmospheric Measurements, edited by: Foken, T., Springer Nature, Switzerland, 1473–1504, https://doi.org/10.1007/978-3-030-51171-4_55, 2021.
Oliveira, B. R. F., Schaller, C., Keizer, J. J., and Foken, T.: Estimating immediate post-fire carbon fluxes using the eddy-covariance technique, Biogeosciences, 18, 285–302, https://doi.org/10.5194/bg-18-285-2021, 2021.
Papale, D., Reichstein, M., Aubinet, M., Canfora, E., Bernhofer, C., Kutsch, W., Longdoz, B., Rambal, S., Valentini, R., Vesala, T., and Yakir, D.: Towards a standardized processing of Net Ecosystem Exchange measured with eddy covariance technique: algorithms and uncertainty estimation, Biogeosciences, 3, 571–583, https://doi.org/10.5194/bg-3-571-2006, 2006.
Stull, R. B.: An Introduction to Boundary Layer Meteorology, Kluwer, Dordrecht, 666 pp., https://doi.org/10.1007/978-94-009-3027-8, 1988.
Su, Y. G., Wu, L., Zhou, Z. B., Liu, Y. B., and Zhang, Y. M.: Carbon flux in deserts depends on soil cover type: A case study in the Gurbantunggute desert, North China, Soil Biol. Biochem., 58, 332–340, doi:https://doi.org/10.1016/j.soilbio.2012.12.006, 2013.
Webb, E. K., Pearman, G. I., and Leuning, R.: Correction of the flux measurements for density effects due to heat and water vapour transfer, Q. J. Roy. Meteor. Soc., 106, 85–100, https://doi.org/10.1002/qj.49710644707, 1980.
Westermann, S., Lüers, J., Langer, M., Piel, K., and Boike, J.: The annual surface energy budget of a high-arctic permafrost site on Svalbard, Norway, The Cryosphere, 3, 245–263, https://doi.org/10.5194/tc-3-245-2009, 2009.