the Creative Commons Attribution 4.0 License.
the Creative Commons Attribution 4.0 License.
 | 16 Dec 2021
Global evaluation of the precipitable-water-vapor product from MERSI-II (Medium Resolution Spectral Imager) on board the Fengyun-3D satellite
Wengang Zhang
Ling Wang
Yang Yu
Guirong Xu
Xiuqing Hu
Zhikang Fu
Chunguang Cui
Atmospheric water vapor plays a key role in Earth's radiation balance and hydrological cycle, and the precipitable-water-vapor (PWV) product under clear-sky conditions has been routinely provided by the advanced Medium Resolution Spectral Imager (MERSI-II) on board Fengyun-3D since 2018. The global evaluation of the PWV product derived from MERSI-II is performed herein by comparing it with PWV from the Integrated Global Radiosonde Archive (IGRA) based on a total of 462 sites (57 219 matchups) during 2018–2021. The monthly averaged PWV from MERSI-II presents a decreasing distribution of PWV from the tropics to the polar regions. In general, a sound consistency exists between PWV values of MERSI-II and IGRA; their correlation coefficient is 0.951, and their root mean squared error (RMSE) is 0.36 cm. The histogram of mean bias (MB) shows that the MB is concentrated around zero and mostly located within the range from −1.00 cm to 0.50 cm. For most sites, PWV is underestimated with the MB between −0.41 and 0.05 cm. However, there is also an overestimated PWV, which is mostly distributed in the area surrounding the Black Sea and the middle of South America. There is a slight underestimation of MERSI-II PWV for all seasons with the MB value below −0.18 cm, with the bias being the largest magnitude in summer. This is probably due to the presence of thin clouds, which weaken the radiation signal observed by the satellite. We also find that there is a larger bias in the Southern Hemisphere, with a large value and significant variation in PWV. The binned error analysis revealed that the MB and RMSE increased with the increasing value of PWV, but there is an overestimation for PWV smaller than 1.0 cm. In addition, there is a higher MB and RMSE with a larger spatial distance between the footprint of the satellite and the IGRA station, and the RMSE ranged from 0.33 to 0.47 cm. There is a notable dependency on solar zenith angle of the deviations between MERSI-II and IGRA PWV products.
- Article
(3853 KB) - Full-text XML
- BibTeX
- EndNote


Water vapor is an important component of the atmosphere and widely known as an important greenhouse gas, since it can significantly affect climate change, the radiation balance, and the hydrological cycle (Kiehl and Trenberth, 1997; Held and Soden, 2000; Dessler and Wong, 2009; Zhao et al., 2012). The spatiotemporal variations in water vapor are essential for understanding the formation of clouds, and mesoscale meteorological systems in those clouds and precipitation always rely on changes in water vapor (Trenberth et al., 2003). Furthermore, water vapor can also influence the atmospheric transmittance and the upward radiance measured by the satellite sensor. Therefore, the information about water vapor is required to correct atmospheric effects in the satellite-based retrieval algorithm for land surface temperature (Meng et al., 2017).
Considering the critical role of water vapor, technologies aiming at the measurement of atmospheric water vapor have been developed. Precipitable water vapor (PWV), which means the integrated water vapor contained in a vertical column of a cross-sectional area, is an important indicator of the total atmospheric-water-vapor condition. The two major methods used for measuring PWV are satellite-based and ground-based technologies. Several ground-based measurements, such as radiosonde (Durre et al., 2009), Global Positioning System (GPS) receivers (Bevis et al., 1992), microwave radiometers (MWRs) (Westwater, 1978), and Sun photometers (Alexandrov et al., 2009), have been deployed to monitor the variability of water vapor. However, the spatial coverage of ground-based measurements is limited and inhomogeneous, and it is difficult to obtain a wide range of observations from multiple sources to support studies for the distribution of PWV on both a regional and global scale. This is because the uncertainties of different measurements are not completely consistent, and they have distinct discrepancies and magnitudes (Chen and Liu, 2016; Wang et al., 2016). Different from ground-based measurements, a satellite-based measurement is more useful for the temporal analysis of PWV over a wide area. In particular, the polar-orbiting satellite-based measurements of water vapor have a considerable advantage due to their global coverage with satisfactory temporal and spatial resolutions. Therefore, the polar-orbiting satellite-based PWV product is widely used for understanding the global distribution of water vapor. As is commonly known, a good knowledge of global-water-vapor distribution is especially important for global atmospheric models aiming to predict weather or climate. Thus, the water vapor products retrieved via polar-orbiting satellites have become essential input parameters to sustain numerical models of the atmosphere, especially where global-water-vapor information is required within a short time span and the assimilation of PWV has been proven to help improve precipitation forecasts (Rakesh et al., 2009).
Over the past few decades, satellite-based PWV retrieval algorithms have been developed with observations from different sensors, which can be divided into four main types according to the spectral region: (1) visible (VIS), (2) near infrared (NIR), (3) thermal infrared (TIR), and (4) microwave (MW). There are three major satellite-borne sensors that can provide the global NIR PWV product. The Moderate Resolution Imaging Spectroradiometer (MODIS) on board the Terra and Aqua polar-orbiting satellite platforms is one of the most important instruments for obtaining global PWV and has been widely used for a few decades since the launching of the Terra spacecraft in 1999. The Medium Resolution Imaging Spectrometer (MERIS) is 1 of 10 instruments built in Envisat, which was launched on 1 March 2002, but the mission was terminated on 8 April 2012 due to the loss of contact with the satellite. For the Chinese Fengyun 3 (FY-3) meteorological series satellite, one of the major payloads on board is the Medium Resolution Spectral Imager (MERSI), which primarily monitors the ocean, land, atmosphere, etc. FY-3D is the second-generation Chinese polar-orbiting meteorological satellite; it is equipped with the advanced MERSI system (MERSI-II) and was launched on 15 November 2017. For MERIS, the PWV retrieval algorithm employs the ratio of top-of-atmosphere (TOA) radiance at one water vapor absorption channel (around 900 nm) to the TOA radiance at a atmospheric window channel such as 885 nm (Bennartz and Fischer, 2001). However, both the algorithms for NIR PWV derivation for MODIS and MERSI-II adopt the reflected-solar-radiance ratios between three NIR water vapor absorption channels and two non-absorption channels (Gao and Kaufman, 2003; Wang et al., 2021). The setup of non-absorption channels of MERSI-II is the same as that of MERSI, but the absorption channels of MERSI-II are similar to those of MODIS. Furthermore, the prelaunch and orbital calibration and characterization of MERSI-II were conducted to ensure the quality of its products (Xu et al., 2018).
It is necessary to evaluate the satellite-based PWV product ahead of its application in atmospheric-science research. PWV from MODIS has been extensively evaluated by comparing it with PWV derived from other measurements. GPS PWV is widely used for the evaluation of PWV derived from MODIS (Liu et al., 2006; Prasad and Singh, 2009; Lu et al., 2011). Ground-based MWR, which can measure integrated water vapor with high temporal resolution and has a reliable measurement under clear-sky conditions, is also used for the evaluation of MERIS PWV (Li et al., 2003). In addition, radiosonde PWV, calculated from the integration of specific humidity, has been recognized to be a useful benchmark, being used for the evaluation of MODIS PWV in China (Liu et al., 2015), the Iberian Peninsula (Sobrino et al., 2014), and Hong Kong (Liu et al., 2013). However, up to now, few studies have focused on the evaluation of MERSI-II PWV, and the lack of effective assessments greatly limits the application of the MERSI-II PWV product, since the accuracy of the product has not been fully acknowledged.
The Integrated Global Radiosonde Archive (IGRA) is the greatest and most comprehensive collection dataset of historical and near-real-time global quality-assured radiosonde observations. It has been used extensively in a variety of studies, including model verification, atmospheric processes, and climate research. Moreover, radiosonde PWV is also widely applied in the assessments of measurements from other platforms, especially satellite-derived PWV around the world (Adeyemi and Schulz, 2012; Antón et al., 2015; Kalakoski et al., 2016). Consequently, the IGRA data are selected for the evaluation of PWV derived from MERSI-II in this study.
The purpose of this paper is to evaluate MERSI-II PWV globally by comparing it with the global IGRA observations. We are seeking to explore the global performance of FY-3D MERSI-II PWV and analyze the influence factors in the evaluation. The structure of this paper is arranged as follows: data sources and details are discussed in Sect. 2. Section 3 presents the methodology of the merging procedures applied in the sample selection. The evaluation results of MERSI-II PWV against PWV from IGRA are presented in Sect. 4. In the final section, a discussion and conclusion of the aforementioned results are given.
The satellite-based PWV product used in this paper is derived from FY-3D MERSI-II, and the ground-based measurements are the PWV data derived from AERONET (Aerosol Robotic Network) and IGRA.
2.1 MERSI-II PWV
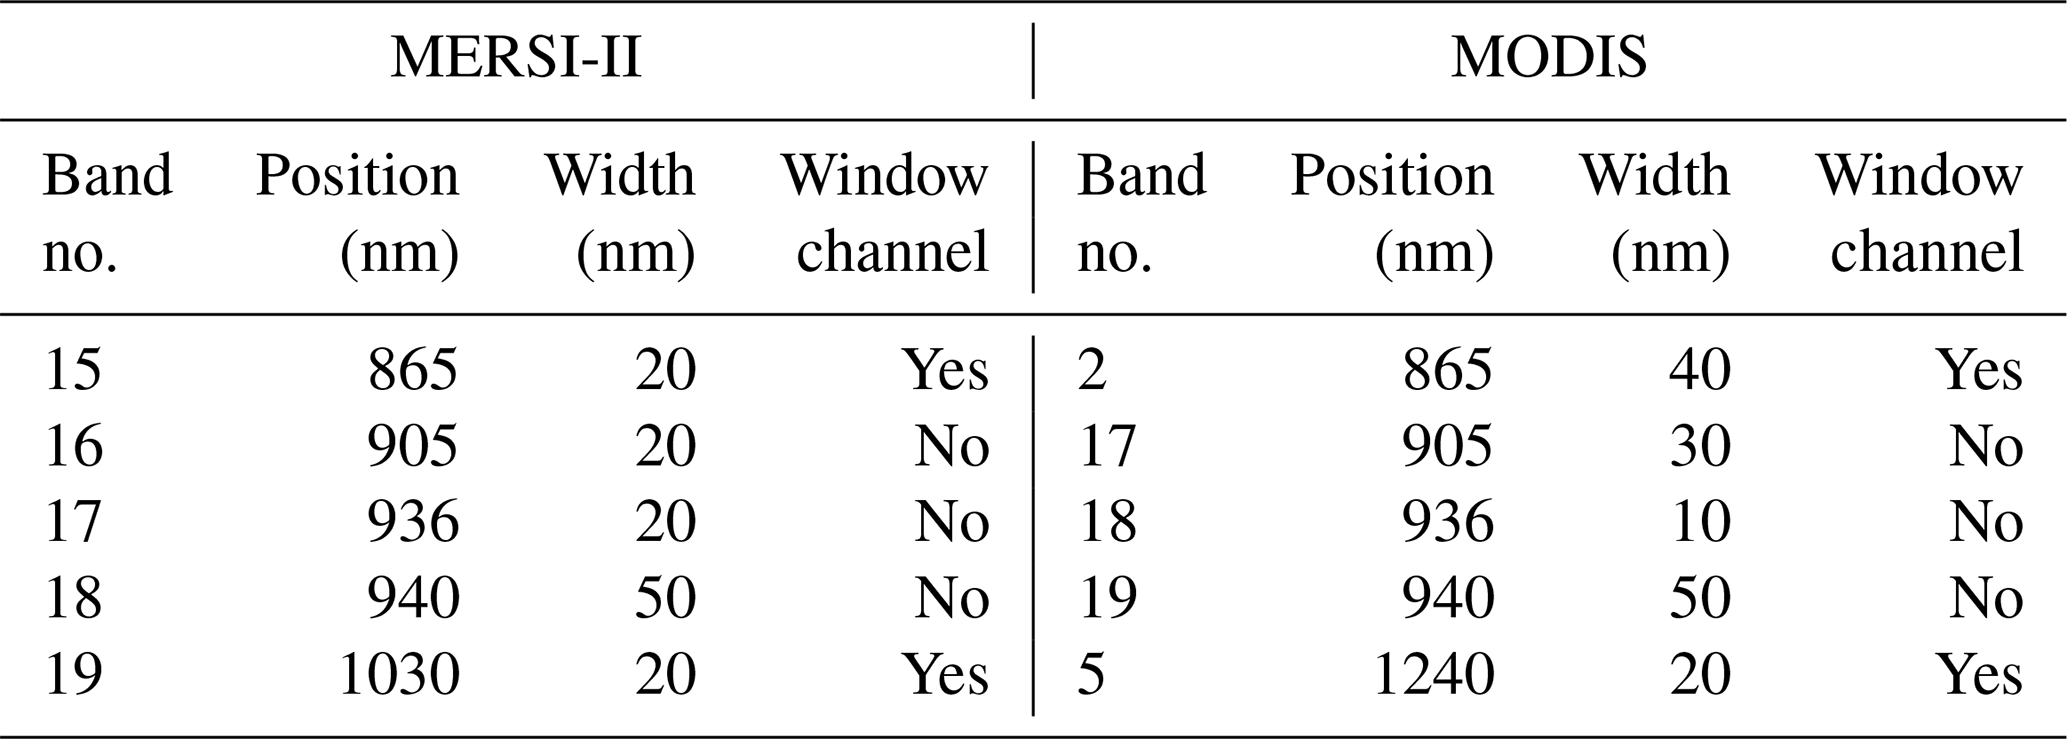
FY-3D, which was successfully launched on 15 November 2017, is the fourth and latest satellite of the second-generation Chinese polar-orbiting meteorological satellite series. It is operated in a Sun-synchronous orbit at an average altitude of 830.73 km, passing over the Equator at 13:40 LT (local time; Yang et al., 2019). A series of comprehensive prelaunch calibrations have been operated to ensure a high quality of the products from MERSI-II (Xu et al., 2018), which is an advanced version of MERSI and has been significantly improved with high-precision onboard calibration and lunar calibration capabilities (R. H. Wu et al., 2020). Besides, MERSI-II has 25 channels with a spectral coverage from 0.412 to 12.0 µm, and the NIR PWV products of FY-3D are retrieved with three water absorption channels (bands 16, 17, and 18) and two non-absorption channels (bands 15 and 19) in the 0.8–1.3 µm range with a spatial resolution of 1 km × 1 km at the nadir (Wang et al., 2021). The positions and widths of NIR channels used by MERSI-II and MODIS are given in Table 1. The water vapor absorption channels of MERSI-II, which are now similar to those of MODIS, are reselected because the three absorption bands have different sensitivities to various water vapor conditions. Therefore, MERSI-II is more useful in the retrieval of water vapor under different conditions (dry, medium, and humid).
Table 1Characteristics of NIR channels used in PWV retrievals of MERSI-II and MODIS.
For the NIR channels, the aerosol optical thickness is typically small, and the path scattered radiance can be ignored (Gao and Kaufman, 2003; Wang et al., 2021). Hence, the TOA radiance observed by a downward-looking satellite sensor can be calculated as the following:
where TOAλ, Tλ, and ρλ are the apparent reflectance, total atmospheric transmittance, and surface bidirectional reflectance at the channel with a wavelength of λ, respectively. The term T(λ) contains information about the total amount of water vapor in the Sun–surface–sensor path.
For five major soil types, a reflectance between 850 and 1250 nm changes approximately linearly with the wavelength; therefore, the transmittance of the absorption channel will be calculated by a three-channel ratio of the absorption channel with a combination of two window channels. For iron-rich soil, vegetation and snow, although the reflectance does not linearly correlate with the wavelength, reasonable estimates of water vapor transmittances over these surface types can also be given with the three-channel ratio techniques (Gao and Kaufman, 2003).
By using the MODerate resolution atmospheric TRANsmission (MODTRAN) code, the transmittances of the five MERSI-II channels as a function of the total water vapor amount under six different atmospheric conditions were calculated, according to the six standard atmospheric models defined in MODTRAN4.3. Furthermore, the results are defined as the transmittance–water vapor lookup table. Based on the solar zenith angle and surface temperature, the atmosphere model can be selected from the six standard atmospheric models, and then the combined two-way water vapor content is derived using a table-searching procedure. Note that there are no PWV retrievals in the region with a solar zenith angle above 72∘, which means the observation time is close to night, due to the weak energy at the satellite's entrance. Subsequently, the derived total water vapor amount will be converted to the vertical column water vapor amount based on the solar and observational geometries. The absorption coefficients of atmospheric water vapor are very different over the three absorption channels. As a result, the derived water vapor values from the three channels are different even under the same atmospheric condition. In order to solve this problem, a mean water vapor value is obtained from the water vapor values derived from three absorption channels, by multiplying it with the corresponding weight in each channel. A more detailed description of the algorithm of MERSI-II PWV can be found in Wang et al. (2021).
The NIR PWV products derived from MERSI-II have been routinely produced at the National Satellite Meteorological Center, China, and can be accessed on the website of http://satellite.nsmc.org.cn/PortalSite/Data/Satellite.aspx (last access: 5 July 2021). The operational NIR PWV products include the Level-2 5 min granule product and Level-3 global daily, 10 d, and monthly mean products. The Level-2 products are generated on a pixel-by-pixel basis (i.e., 1 km × 1 km) from standard MERSI-II L1B (Level-1B) radiance datasets and as ancillary data from the L1B geolocation and the cloud mask (CLM) product of MERSI-II. The outputs from the Level-2 product include the amount of total weighted column water vapor on a pixel-by-pixel basis, independently derived PWV from one of the water vapor absorption channels, and an associated quality assurance parameter that indicates whether the inversion algorithm has a two-channel or three-channel ratio and whether a pixel is clear or cloudy. The Level-2 5 min granule PWV product is evaluated in this study, and the data span is from September 2018 to June 2021 with a spatial resolution of 1 km × 1 km.
2.2 Radiosonde
The Integrated Global Radiosonde Archive (IGRA), which is a collection of historical and near-real-time global radiosonde observations, is archived and distributed by the National Centers for Environmental Information (NCEI), formerly known as the National Climatic Data Center (NCDC), and can be accessed at ftp://ftp.ncdc.noaa.gov/pub/data/igra (last access: 5 July 2021). Version 2 of IGRA (IGRA 2) is used in this study. A total of 33 data sources, including 10 out of 11 source datasets used in IGRA 1, have been integrated into IGRA 2, which was fully operational on 15 August 2016 and has a higher spatial and temporal coverage. Therefore, compared to IGRA 1, IGRA 2 contains nearly twice as many sounding stations and 30 % more soundings. Sounding-derived parameters are recorded according to separated station files and continue to be updated daily, and PWV is one of the derived parameters. PWV will be calculated if the pressure, temperature, and dew point depression are available from the surface to a level of 500 hPa (Durre et al., 2009). The calculation involves the acquirement of specific humidity at each observation level and then the integration of specific humidity between the surface and the level of 500 hPa so that IGRA-derived PWV is recognized as surface-to-500 hPa PWV. As discussed by Turner et al. (2003), PWV obtained from radiosonde has an approximately 5 % dry bias compared to that derived from MWR. Therefore, there is an underestimation of PWV evaluation for taking the IGRA-derived PWV as a reference, and the bias found in the tropical area is ∼ 9 % (Zhang et al., 2018). Due to the time range of IGRA data, there are only 462 out of 1535 global IGRA stations that can be matched with the FY-3D MERSI-II PWV products.
2.3 AERONET
The federated Aerosol Robotic Network (AERONET) is a network of ground-based Cimel Electronique Sun photometers which can measure beam irradiance and directional sky radiance routinely during the daytime in clear conditions (Holben et al., 1998). AERONET was established by NASA and PHOTONS (PHOtométrie pour le Traitement Opérationnel de Normalisation Satellitaire), primarily aiming to provide a public-domain dataset of global aerosol optical and microphysical properties. In addition, based on the measurements at the 940 nm water vapor channel and the atmospheric window bands centered at 870 and 1020 nm, PWV was also calculated (Che et al., 2016). The AERONET version 3 database provides three levels of data: Level 1.0 (unscreened), Level 1.5 (cloud-screened), and Level 2.0 (cloud-screened and quality-assured). It can be accessed at https://aeronet.gsfc.nasa.gov (last access: 11 October 2020). The Level 2.0 dataset, which is used in this study, signifies an automatically cloud-cleared, manually quality-controlled dataset with pre- and post-field calibrations applied. All instruments in AERONET are annually calibrated with reference to the world standard: the Mauna Loa Observatory (Van Malderen et al., 2014). Thus, the measurement accuracies of different AERONET stations are accurate and consistent (Liu et al., 2013). As discussed by Pérez-Ramírez et al. (2014), PWV obtained from AERONET has a dry bias of approximately 0.16 cm against the radiosonde PWV, and it is reasonable for meteorological studies.
3.1 Statistical indicators
Common statistical indicators, such as the mean bias (MB, perfect value = 0), the mean relative bias (MRB, perfect value = 0), correlation coefficient (CC, perfect value = 1), and the root mean squared error (RMSE, perfect value = 0), are used to evaluate the precision of the retrieved PWV from MERSI-II. All calculations of indicators are presented as follows:
where PWVs is the MERSI-II PWV product, PWVg is the IGRA PWV product, and N is the total number of matchups.
3.2 Collocation strategy
As we have mentioned above, FY-3D is operated in a Sun-synchronous orbit with an Equator crossing time of 13:40 LT. However, the radiosonde is released at 00:00 and 12:00 UTC, and there is a significant temporal discrepancy between satellites and radiosondes at most sites. Furthermore, the distribution of radiosonde sites is sparse over the globe. An evaluation of PWV from global reanalysis models with a temporal resolution of 6 h, temporal window of ±3 h, and distance of ±50 km is employed in the comparison with PWV from Maritime Aerosol Network (Pérez-Ramírez et al., 2019).
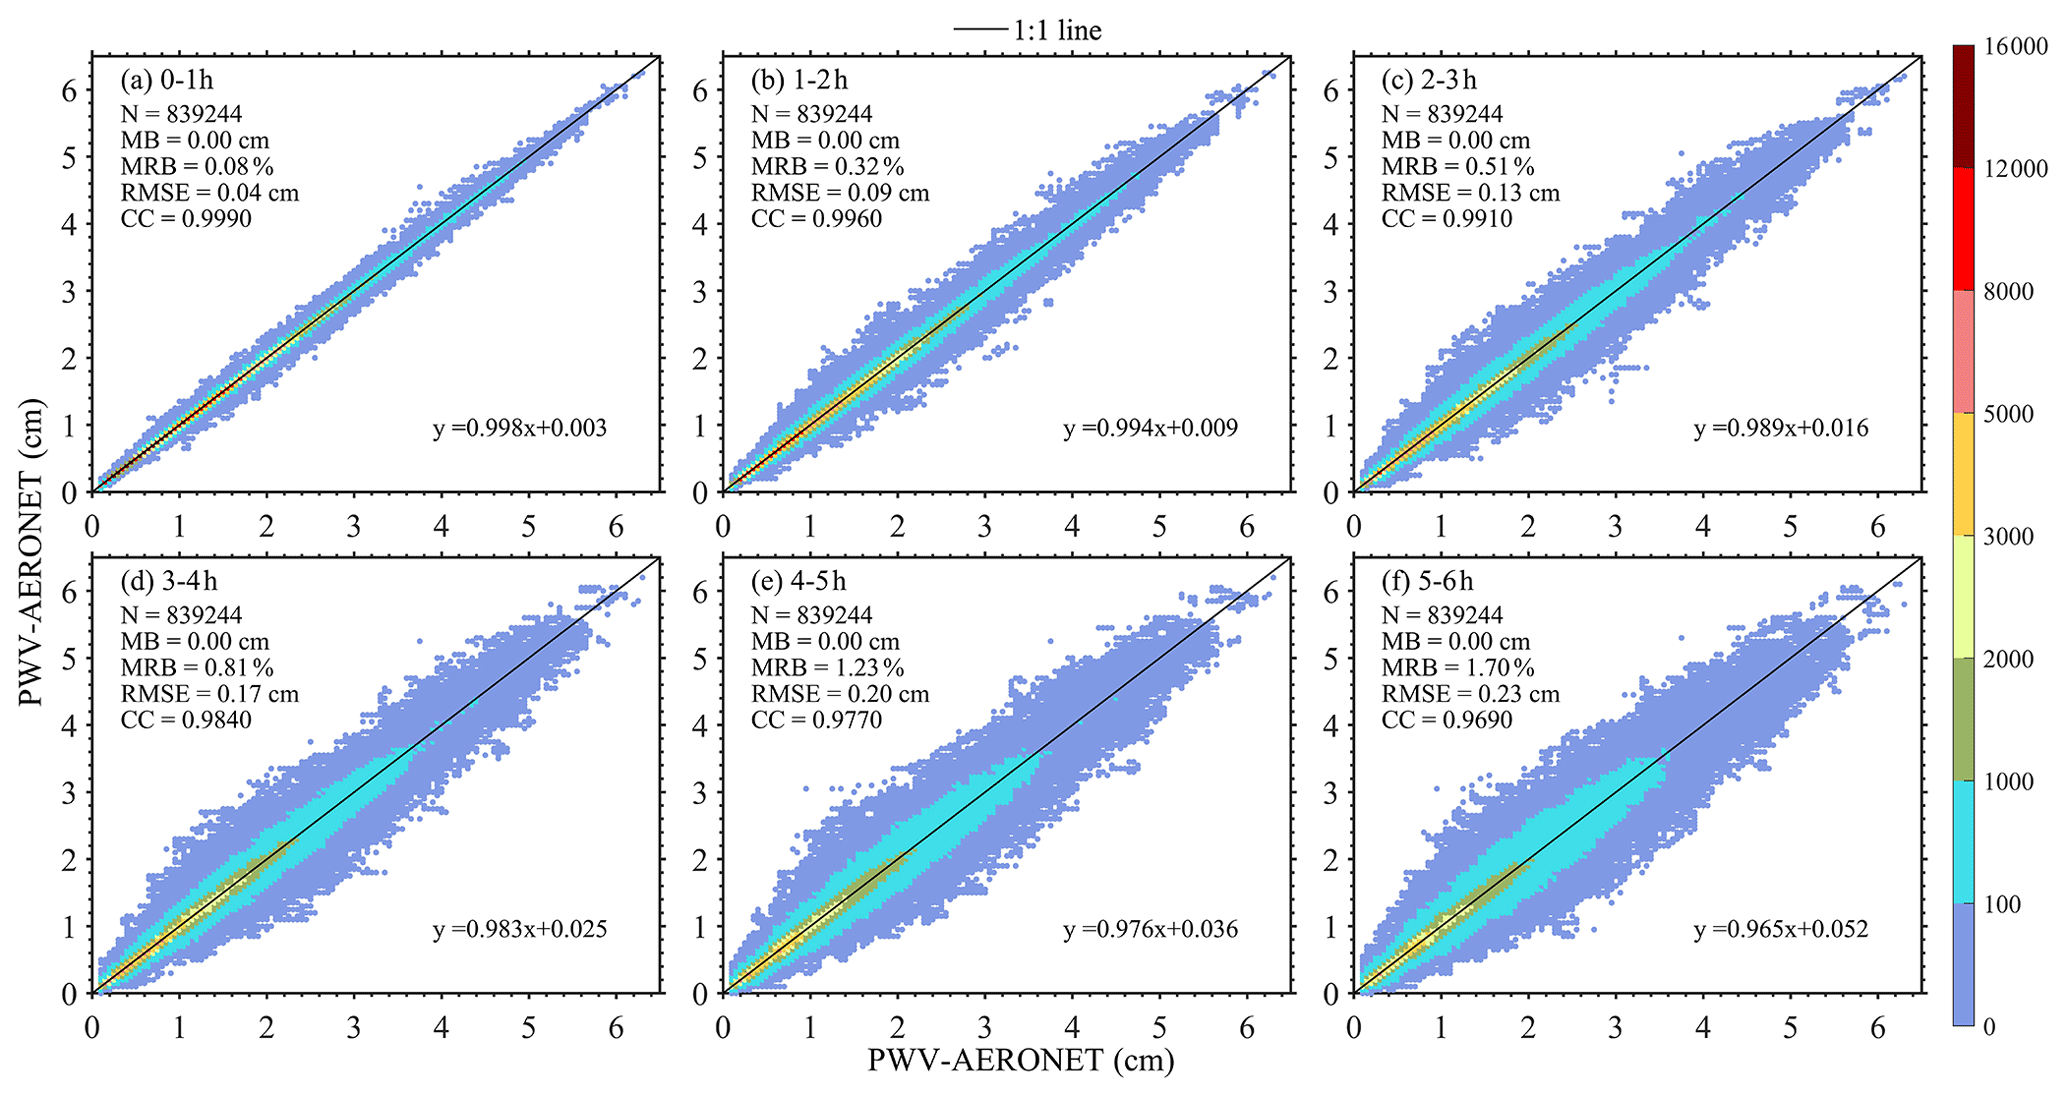
Figure 1Scatterplots of PWV derived from AERONET in different temporal discrepancy intervals; panels (a)–(f) present the temporal discrepancy of 0–1, 1–2, 2–3, 3–4, 4–5, and 5–6 h, respectively. The solid line represents the 1 : 1 line. The color bar depicts the number density of matchups for each bin of PWV in a 0.01 cm × 0.01 cm grid.
In order to determine the temporal collocation window that can adequately match the satellite observations with the ground-based measurements, the consistencies between the existing AERONET PWV and the temporally averaged AERONET PWV in various temporal discrepancy intervals from 1 to 6 h with a step of 1 h, that is, 0–1, 1–2 h, etc., are analyzed, respectively. In processing, only the existing AERONET PWV, which has the matching averaged AERONET PWV in each temporal discrepancy interval, is selected for the determination of the temporal collocation window. Therefore, there is the same number of collocations for all the temporal discrepancy intervals. The results are presented in Fig. 1, and as shown, there is a good consistency in all situations with the CC larger than 0.969 and the slope larger than 0.965. Although the MRB and RMSE become larger with the increasing temporal interval, their values are less than 1.7 % and 0.23 cm, respectively. Moreover, it can be observed that the MB values of all comparisons are 0.00 cm, which suggests that the biases are distributed equally around zero. Therefore, we conclude that the temporal collocation window for PWV evaluation can be set to 6 h.
For MERSI-II, the spatial resolution at the nadir is 1 km × 1 km for NIR bands, which are used for the retrieval of PWV. It is not perfectly justifiable that PWV in an image pixel represents the surrounding averaged PWV (Ichoku et al., 2002), and during the ascending of balloon, its lateral drift should also be considered. Therefore, the spatially averaged PWV within a box of 9 pixels × 9 pixels was calculated. Furthermore, only when all pixels within the box are confidently proved to be clear by the MERSI-II CLM product, the pixel is marked as reliable, and PWV of the central pixel is replaced by the spatially averaged PWV value. Otherwise, the pixel is marked as unreliable and will not be selected for the comparison. Unfortunately, there is no cloud measurement in the radiosonde observation, so the cloud detection method with the relative humidity threshold of sounding is employed here (Zhang et al., 2010), and then the cloudless radiosonde PWV dataset is established.

Figure 2Number of matchups between MERSI-II and IGRA PWV observations for each site from 2018–2021.
In this study, the threshold of the horizontal distance between an IGRA station and the footprint of MERSI-II is set to be 50 km (Qin et al., 2012; Pérez-Ramírez et al., 2019). In processing, all the reliable PWV retrievals derived from MERSI-II within ±6 h of the radiosonde release time are collected, and only the spatially closest PWV retrieval within a 50 km distance from the IGRA site is selected and matched with the IGRA-derived PWV. Figure 2 illustrates the available sample numbers of radiosonde sites over the globe from 2018–2021, with a total of 462 sites. The sample numbers of all sites vary from 15 to 418, and observations are concentrated in the Northern Hemisphere. Around the Equator, few samples are obtained due to the high occurrence frequency of clouds and precipitation. The most frequently sampled places are China, Europe, and North America, where IGRA sites are densely distributed, while there are few matchups in Africa, since radiosonde stations associated with IGRA in this region are sparse (Durre et al., 2018).
4.1 Global evaluation of PWV derived from MERSI-II
Figure 3 illustrates the global monthly averaged PWV obtained from MERSI-II for the month of July 2020 under clear-sky conditions. In general, the averaged PWV derived from MERSI-II shows a decreasing distribution of PWV with increasing latitude, and high PWV values are mostly found in the tropics and rarely in high latitudes. High PWV values (> 3.0 cm) are mostly detected in the Amazon rainforest of South America, western and southern Asia, southeastern China, Southeast Asian islands, and central Africa. The significantly high PWV center in western Asia is mainly contributed by the Indian monsoon during the summer season. The PWV contents over the Qinghai–Tibet Plateau and Greenland are small because of the high altitude and high latitude, respectively. Furthermore, due to the winter season of July in the Southern Hemisphere, small PWV contents are also presented over the southern parts of South America and Africa, as well as Australia.

Figure 3Global averaged Level-3 NIR precipitable-water-vapor (PWV) image derived from Fengyun-3D MERSI-II in July 2020 under clear-sky conditions.

Figure 4(a) Total density scatterplot of PWV derived from MERSI-II against that of IGRA for each bin of PWV in a 0.05 cm × 0.05 cm grid. The solid line represents the 1 : 1 line. (b) Frequency histogram of MB between MERSI-II and IGRA PWV superimposed on a cumulative distribution curve.
Figure 4a shows the scatterplot of PWV derived from MERSI-II against IGRA observations. There are 57 219 matchups in total, and MERSI-II (IGRA) PWV ranges from 0.11 (0.05) to 6.07 (6.78) cm, with a high number density between 0.20 and 2.00 cm. Moreover, it is found that the MERSI-II and IGRA PWV measurements are well correlated with a CC of 0.951, while the retrieved PWV from MERSI-II is slightly underestimated, with an MB of −0.11 cm and an MRB of −2.2 %. Furthermore, the RMSE is 0.36 cm, and the statistical biases are slightly larger than those from the evaluation of MODIS over the globe by comparing with the observations of AERONET (Martins et al., 2019). It is considered that the satellite has a larger temporal discrepancy with radiosonde than AERONET, which has a high temporal resolution of about 1 min, and from the discussion in Sect. 3.2, a large temporal discrepancy will cause an increasing bias in the evaluation of the PWV product. Figure 4b reveals the distribution of the MB between FY-3D MERSI-II and IGRA with a bin width of 0.05 cm, and notably, the MB is concentrated around zero, and there is a small flattening towards negative values. Moreover, there are 20.8 % of all points within the interval from −0.05 to 0.05 cm, and the standard deviation (SD) of MB is 0.34 cm. It can be concluded that there is a high accuracy for the MERSI-II PWV product, as evidenced by the low MB and SD, which are similar to those in the evaluation of ground-based GPS PWV against radiosonde PWV (Wang et al., 2007). Although the MB is mainly distributed between −1.00 and 0.50 cm, it is observed that there are also some points with a high MB value. As presented in Fig. 4b, the large MB is mostly with a negative value, and this is mainly due to the different situations observed by the radiosonde and satellite because of the radiosonde drift and the large temporal discrepancy between MERSI-II and IGRA observations. Due to the lack of cloud measurement in the radiosonde observation, PWV from IGRA possibly contains the point in cloudy conditions, which is proved to have a larger water content than clear conditions (Zhang et al., 2015). For most large positive MRB values, there is a large temporal discrepancy of more than 4 h, and this is recognized as the primary reason for the high positive MRB.
4.2 Evaluation of the MERSI-II PWV product in different locations
Figure 5 shows the geographical distributions of PWV comparison statistics of 462 sites between MERSI-II and IGRA over the globe. In order to equally present the statistical indicators, all sites are separated into approximately 10 equal parts; that is, the site number of each part is ∼ 43. Consequently, the steps of comparison statistics are not equidistant in the presentation. As we can see from the MB distribution in Fig. 5a, the MB mostly presents a low value between −0.41 and 0.05 cm. About 80 % of all sites have negative MB values, and this indicates that PWVs derived from MERSI-II are primarily underestimated compared with IGRA PWV values. Most sites with an MB value larger than −0.41 cm are distributed in the west and south of Asia, with a large mean PWV content but a small number of matchups. Furthermore, attributed to the monsoon climate, there is a large seasonal variation over this region, particularly in the southern foothills of the Himalayas (Chen and Liu, 2016). Those sites with overestimated PWV values of MERSI-II are mostly distributed in the areas surrounding the Black Sea and central South America, and most of them have MB values larger than 0.05 cm. It is also found in the evaluation of the PWV product derived from MODIS on board Terra that the MB of MERSI-II is slightly smaller (Martins et al., 2019). In general, the distribution of the MRB (Fig. 5b) is similar to that of the MB at most sites. However, there are two areas that have slight discrepancies between them. One area is in eastern Russia and northeastern China, where there are some sites with a high MRB value above 3.3 %, although with a low MB value ranging from −0.10 to 0.05 cm. As we can see from Fig. 3, there is a low averaged PWV value in this region, and this is the dominant reason for the high MRB values but with low MB values over this area. Another area is central South America, where the sites have high MB values and comparatively low MRB values, and this is because of the high mean PWV values in this region. The larger evaluation bias of PWV derived from MODIS and reanalysis products has also been found in the middle of South America, with most sites having the MB and RMSE both larger than 0.40 cm (Lu, 2019; Wang et al., 2020). Figure 5c depicts the distributions of the RMSE for all sites, and most sites have a low RMSE below 0.48 cm. The high RMSE values are primarily found at low latitudes, mostly in South and Southeast Asia. However, in the east of Europe, there is a low RMSE with values below 0.21 cm at most sites. In general, there is a good agreement between MERSI-II and IGRA PWV at most sites with the CC value above 0.873. The highly correlated sites are mainly distributed around the east of Europe and have CC values larger than 0.958, while low CC values smaller than 0.814 are predominantly concentrated around the Equator. There are large biases but low CC values over the Equator, and that is possibly due to the following: (1) large residual IGRA PWV above 500 hPa (Boukabara et al., 2010), (2) high content and variation in PWV (Chen and Liu, 2016), (3) a covered surface with reflectance which does not linearly correlate with the wavelength (Gao and Kaufman, 2003), and (4) a small number of samples. In addition, the temporal discrepancy can also lead to bias because the discrepancy in the equatorial region is slightly larger than in other regions overall. As discussed by Alraddawi et al. (2018), for MODIS PWV, there are also noteworthy latitudinal decreases for the MB, MRB, and RMSE.

Figure 5The geographical distributions of PWV comparison statistics between MERSI-II and IGRA: (a) MB, (b) MRB, (c) RMSE, and (d) CC.
4.3 The annual performance of the MERSI-II PWV product
As we mentioned above, PWV presents a notable temporal variation. Therefore, the annual performance of the MERSI-II PWV product by season was evaluated, and the results are given in Table 2. It is noted that the number of samples in each season is significantly different.
Table 2Seasonal statistics of comparison between PWVs derived from MERSI-II and IGRA in the Northern (Southern) Hemisphere. MAM: March–April–May. JJA: June–July–August. SON: September–October–November. DJF: December–January–February.
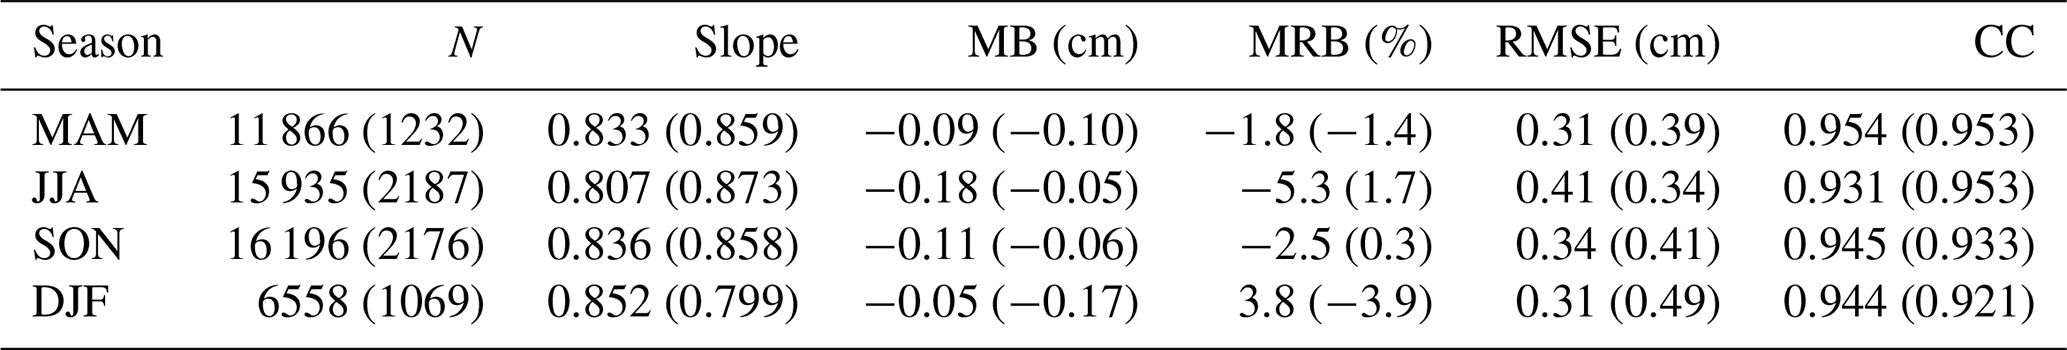
The number of matchups ranges from 6558 (1069) to 16 196 (2187) in the Northern (Southern) Hemisphere for all seasons. In all seasons, the slope values are all less than 0.873, which is the fit slope in winter in the Southern Hemisphere. The MERSI-II PWV is underestimated for all seasons, and the MB is less than −0.18 cm. The MB is obviously large in the warm season, and it is more significant during the summer. With abundant water vapor in summer, clouds are easily to form; however, thin clouds are difficult to be measured by satellites due to their low optical depth (Solbrig, 2009; Naumann and Kiemle, 2020). Therefore, the higher underestimation of PWV in summer is probably triggered by the weakened or covered radiation signal under the thin cloud. For MRB, the variation is within a large range, and the largest MRB is in summer over both the Northern Hemisphere and Southern Hemisphere, with values of −5.3 % and −3.9 %, respectively. For the largest MRB during winter in the Northern Hemisphere, this might be related to the points with a low PWV value but a high positive MB, because we firstly calculate the MRB for each matchup and then average all MRB values in seasons. In addition, the MRB is mostly negative during the warm season but positive in the cold season. The RMSE in the Northern Hemisphere is slightly smaller than that in the Southern Hemisphere, where the greatest RMSE value is 0.49 cm in summer. There is a large oceanic coverage in the Southern Hemisphere, with a larger mean PWV than that in the Northern Hemisphere (Chen and Liu, 2016). Thus, this is a possible reason accounting for a large RMSE in the Southern Hemisphere, considering the increasing bias of the remote sensing PWV with the higher PWV value. Moreover, there is an improved correlation between PWV derived from MERSI-II and IGRA, and all CC values are larger than 0.921.
4.4 Influencing factors on evaluation
As mentioned above, there is a higher bias with the larger PWV value, and this is found in the evaluation of the MODIS PWV product (Martins et al., 2019). Furthermore, the impact of the spatial distance between the footprint of the satellite and the IGRA station on the evaluation of PWV is also considered in the validation of Haiyang-2A Calibration Microwave Radiometer (HY-2A CMR) PWV (Z. Wu et al., 2020). A strong dependence on the solar zenith angle (SZA) was also found in the comparisons of MODIS and GOME-2 (Global Ozone Monitoring Experiment) integrated water vapor products with GPS measurements in the Iberian Peninsula (Román et al., 2015; Vaquero-Martínez et al., 2017). In this section, influencing factors such as the value of IGRA PWV, the spatial distance between the footprint of the satellite and the IGRA station, and the SZA are all explored in order to quantify their effects on the evaluation of MERSI-II PWV. Table 3 illustrates the evaluation results of MERSI-II PWV in different intervals of IGRA PWV, spatial distance, and the SZA. All metrics are calculated using all matchups.
Table 3Statistics of the global evaluation of MERSI-II PWV in different PWV and distance ranges.
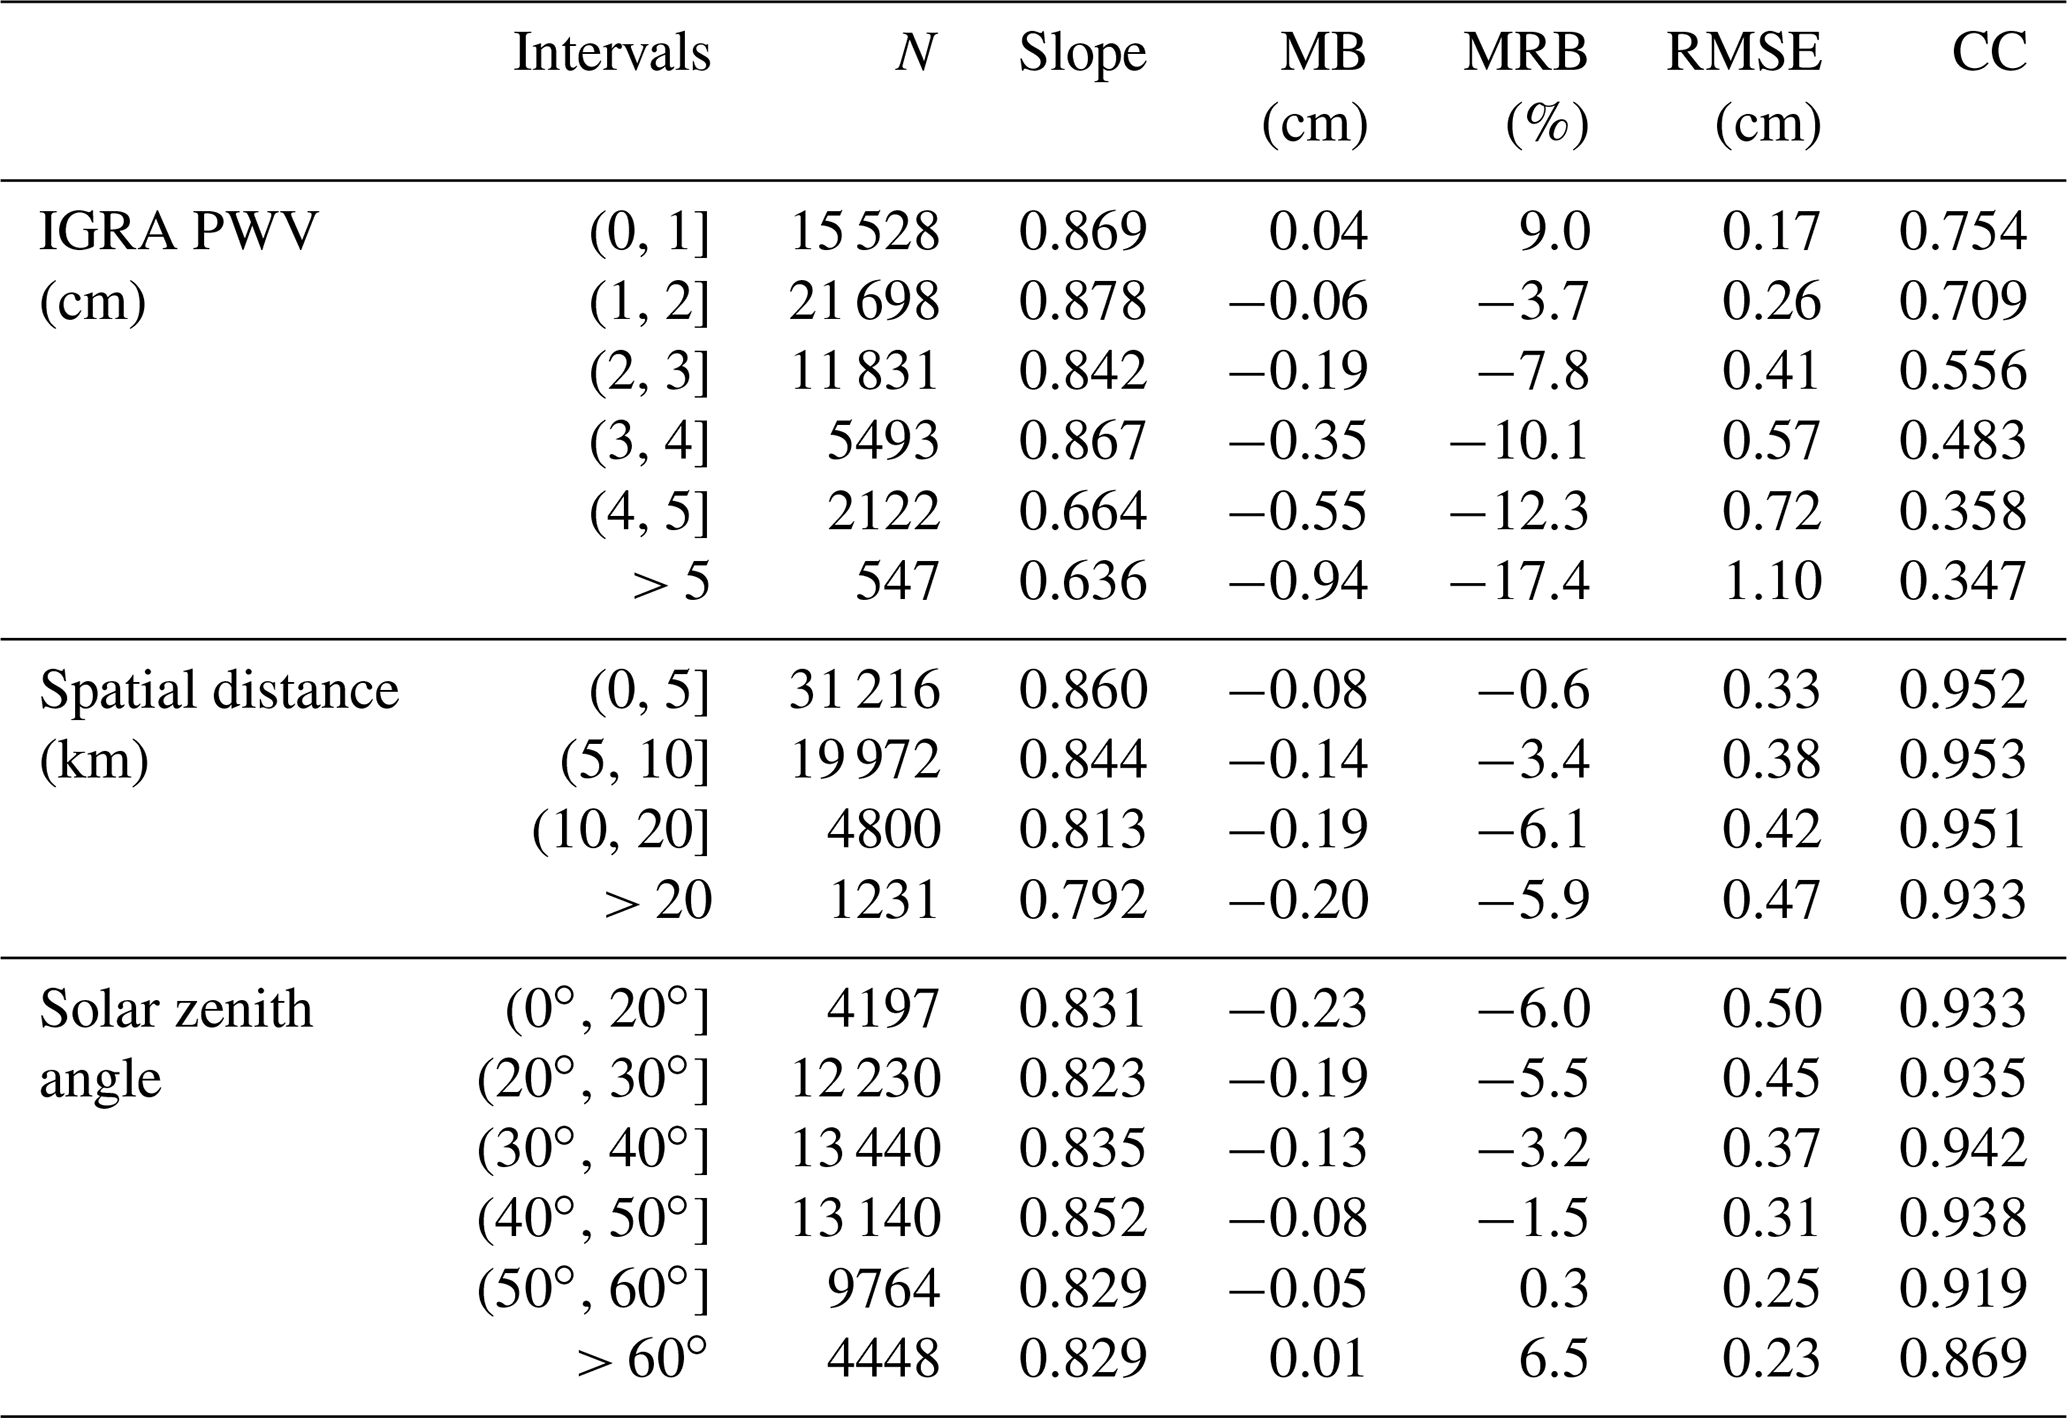
Firstly, IGRA PWV is binned and compared with MERSI-II PWV. Most matchups are located at an IGRA PWV interval ranging from 1.0 to 2.0 cm, and there are not many samples above 5.0 cm. The MB and RMSE gradually increase with the increasing content of PWV, from 0.04 and 0.17 to −0.94 and 1.10 cm, respectively. Moreover, the fit-slope value generally decreases with the increasing content of PWV, and it can be concluded that there is an obvious underestimation when PWV is larger than 5.0 cm. This result is similar to the conclusion drawn by Martins et al. (2019) in the evaluation of PWV from MODIS; however, the slope is smaller. There is a good agreement between IGRA PWV and MERSI-II PWV for dry conditions (< 1.0 cm), with the highest CC value of 0.754. However, a slightly large discrepancy is observed in wet conditions (> 5.0 cm). For the MRB, there is a positive value of 9.0 % in the 0.0–1.0 cm interval, and this is also caused by the low PWV value. In contrast, all MRB values are negative, and the MRB value increases with the content of PWV above 1.0 cm.
The results of the MERSI-II PWV and IGRA PWV comparison in different distance intervals are also presented in Table 3. Most points are located within the 0–5 km distance interval, and the number of points is 31 216 out of all 57 219 points. The MB increases with the extension of the distance between the IGRA station and the footprint of MERSI-II, and the largest MB is −0.20 cm when the distance is larger than 20 km. For the MRB, a more obvious difference is present within the 0–20 km distance range, as the value increases from −0.6 % to −6.1 % with the increasing distance. However, there is a slightly smaller MRB when the distance is larger than 20 km, and this probably has a relationship with the small number of samples. The RMSE has a value ranging from 0.33 to 0.47 cm and becomes larger with the increasing distance. The large RMSE in the distance above 20 km is mainly caused by the obvious underestimation of MERSI-II PWV at some points. Overall, a good correlation exists between MERSI-II PWV and IGRA PWV with the CC value larger than 0.933.
The solar radiation changes with the SZA, and the performance of MERSI-II PWV product during different SZA intervals is studied in this section. It can be seen from the Table 3 that there are the greatest number of matchups with the SZA ranging from 20 to 50∘, and the deviations between MERSI-II and IGRA PWV highly depend on the SZA. The MB presents the decreasing tendency with the increasing SZA, from −0.23 to 0.01 cm. For the MRB, there is large value both in small- (< 20∘) and large-SZA (> 60∘) conditions, with the values of −6.0 % and 6.5 %, respectively. In small-SZA (< 20∘) conditions, a large RMSE is found with the value of 0.50 cm, and it is probable due to the large SD of MB, which was also presented by Román et al. (2015) in the comparison between GOME-2 PWV and radiosonde measurements. However, the slope value and CC value are similar at each SZA interval.
In this paper, we evaluated the global clear-sky PWV product derived from FY-3D MERSI-II by comparing it with PWV from 462 IGRA stations, with 57 219 matchups during the period from September 2018 to June 2021. The monthly averaged PWV derived from MERSI-II shows a distribution of decreasing values with an increasing latitude.
Overall, PWVs derived from MERSI-II and IGRA are in good agreement with the CC value of 0.951. However, there is a slight underestimation for FY-3D MERSI-II PWV, and the values of the MB and MRB are −0.11 cm and −2.2 %, respectively, while the RMSE is 0.36 cm. The MB histogram indicates that an MB value approaches zero and mostly distributes between −1.00 and 0.50 cm with a left-skewed distribution pattern.
For all sites, the MB value is low, and most sites have a value between −0.41 and 0.05 cm. In the west and south of Asia, MERSI-II PWV is obviously underestimated with an MB value larger than −0.41 cm. However, overestimated PWV values are mostly distributed in the areas surrounding the Black Sea and central South America. High MRB values are mostly located in eastern Russia, northeastern China, and central South America. Most sites have a small RMSE below 0.48 cm with CC values above 0.873. Lastly, it is observed that there are high MB and RMSE values, while there are small CC values around the Equator, especially in southern Asia and Southeast Asia.
MERSI-II PWV is in good agreement with PWV obtained from IGRA with all CC values larger than 0.921. There is a slight underestimation of MERSI-II PWV for all seasons with an MB value below −0.18 cm, and it is significant in the summer. In addition, the MRB and RMSE also have the largest magnitude in summer. The underestimation of PWV in summer is probably due to the presence of thin clouds, which weaken the radiation signal observed by the satellite. We found that the MRB had a positive value in the winter, and this is mainly due to the low PWV then. For the RMSE, there is a larger value in the Southern Hemisphere, and the greatest RMSE value is 0.49 cm in summer.
In addition, the influencing factors on the evaluation are also discussed. First of all, there is an obvious effect of binned IGRA PWV on the evaluation, and in general, the MB and RMSE are both increasing with IGRA PWV. In dry conditions (< 1.0 cm), there is a positive MRB value of 9.0 %, and this is also mainly due to the low PWV value. Nevertheless, the MRB is all negative and increases with an IGRA PWV value above 2.0 cm. Subsequently, the evaluations within different distance intervals are presented in order to reveal the effect of distance between the footprint of a satellite and an IGRA site location. The MB varies positively with the increasing distance, and the largest MB is −0.20 cm within the distance above 20 km. The MRB increases from −0.6 % to −6.1 % as the distance increases from 0 to 20 km. The RMSE also increases with the distance increased, and the large RMSE is mainly caused by the obvious underestimation of MERSI-II PWV at some points with a spatial distance larger than 20 km. The MB decreases with the increasing SZA, from −0.23 to 0.01 cm. There are high MRB values both in small- (< 20∘) and large-SZA (> 60∘) conditions, and the largest RMSE appears in small-SZA (< 20∘) conditions.
The global evaluation of the MERSI-II PWV product can explore a wide variety of applications of this product, and the analysis of the influencing factors on the evaluation can be helpful for improving the PWV retrieval algorithm. Although we have partially explained the underestimation of PWV from MERSI-II, other influencing factors, such as the precision of the transmittance calculation and the uncertainty of the radiation signals should be studied in the future. Furthermore, how to quantitate the influence of aerosols (e.g., dust and haze) and thin cirrus clouds on the PWV retrieval is also a key problem that should be explored in the application of the PWV product.
The MERSI-II PWV product is available from http://satellite.nsmc.org.cn/PortalSite/Data/Satellite.aspx (NSMC, 2021); the IGRA data are available from ftp://ftp.ncdc.noaa.gov/pub/data/igra (NCEI, 2021); and the global AERONET data are provided at https://aeronet.gsfc.nasa.gov/data_push/V3/AOD/AOD_Level20_All_Points_V3.tar.gz (NASA, 2020). The processed data are available from Zenodo (https://doi.org/10.5281/zenodo.5656797, Zhang, 2021).
WZ and LW conceptualized the project. LW, YY, ZF, and XH curated the data. WZ, YY, ZF, and GX produced the formal analysis. WZ prepared the original draft of this paper. WZ and LW reviewed and edited the paper. GX and XH supervised the project. GX and CC acquired funding for the project. All authors have reviewed and agreed on the final version of the paper.
The contact author has declared that neither they nor their co-authors have any competing interests.
Publisher's note: Copernicus Publications remains neutral with regard to jurisdictional claims in published maps and institutional affiliations.
This article is part of the special issue “Analysis of atmospheric water vapour observations and their uncertainties for climate applications (ACP/AMT/ESSD/HESS inter-journal SI)”. It is not associated with a conference.
This work is supported by the Second Tibetan Plateau Scientific Expedition and Research (STEP) program (grant no. 2019QZKK0105), the National Natural Science Foundation of China (NSFC; grant nos. 41620104009, 41705019, and 91637211), and the Hubei Meteorological Bureau (grant no. 2018Q04). We acknowledge the National Satellite Metrological Center of China Meteorological Administration (CMA) for providing the MERSI-II PWV product, the National Climatic Data Center (NCDC) for providing IGRA data, and the principal investigators and their staff for establishing and maintaining the AERONET sites used in this study.
This research has been supported by the Second Tibetan Plateau Scientific Expedition and Research (STEP) program (grant no. 2019QZKK0105), the National Natural Science Foundation of China (NSFC; grant nos. 41620104009, 41705019, and 91637211), and the Hubei Meteorological Bureau (grant no. 2018Q04).
This paper was edited by Daniel Perez-Ramirez and reviewed by three anonymous referees.
Adeyemi, B. and Schulz, J.: Analysis of water vapor over nigeria using radiosonde and satellite data, J. Appl. Meteor. Climatol, 51, 1855–1866, https://doi.org/10.1175/JAMC-D-11-0119.1, 2012.
Alexandrov, M. D., Schmid, B., Turner, D. D., Cairns, B., Oinas, V., Lacis, A. A., Gutman, S. I., Westwater, E. R., Smirnov, A., and Eilers J.: Columnar water vapor retrievals from multifilter rotating shadow band radiometer data, J. Geophys. Res.-Atmos., 114, D02306, https://doi.org/10.1029/2008JD010543, 2009.
Alraddawi, D., Sarkissian, A., Keckhut, P., Bock, O., Noël, S., Bekki, S., Irbah, A., Meftah, M., and Claud, C.: Comparison of total water vapour content in the Arctic derived from GNSS, AIRS, MODIS and SCIAMACHY, Atmos. Meas. Tech., 11, 2949–2965, https://doi.org/10.5194/amt-11-2949-2018, 2018.
Antón, M., Loyola, D., Román, R., and Vömel, H.: Validation of GOME-2/MetOp-A total water vapour column using reference radiosonde data from the GRUAN network, Atmos. Meas. Tech., 8, 1135–1145, https://doi.org/10.5194/amt-8-1135-2015, 2015.
Bennartz, R. and Fischer, J.: Retrieval of columnar water vapour over land from back-scattered solar radiation using the Medium Resolution Imaging Spectrometer (MERIS), Remote Sens. Environ., 78, 274–283, https://doi.org/10.1016/S0034-4257(01)00218-8, 2001.
Bevis, M., Businger, S., Herring, T. A., Rocken, C., Anthes, R. A., and Ware, R. H.: GPS meteorology: Remote sensing of atmospheric water vapor using the Global Positioning System, J. Geophys. Res.-Atmos., 97, 15787–15801, https://doi.org/10.1029/92JD01517, 1992.
Boukabara, S., Garrett, K., and Chen, W.: Global Coverage of Total Precipitable Water Using a Microwave Variational Algorithm, IEEE T. Geosci. Remote, 48, 3608–3621, https://doi.org/10.1109/TGRS.2010.2048035, 2010.
Che, H. Z., Gui, K., Chen, Q. L., Zheng, Y., Yu, J., Sun, T. Z., Zhang, X. Y., and Shi, G. Y.: Calibration of the 936 nm water-vapor channel for the China aerosol remote sensing NETwork (CARSNET) and the effect of the retrieval water-vapor on aerosol optical property over Beijing, China, Atmos. Pollut. Res., 7, 743–753, https://doi.org/10.1016/j.apr.2016.04.003, 2016.
Chen, B. and Liu, Z.: Global water vapor variability and trend from the latest 36 year (1979 to 2014) data of ECMWF and NCEP reanalyses, radiosonde, GPS, and microwave satellite, J. Geophys. Res.-Atmos., 121, 11442–11462, https://doi.org/10.1002/2016JD024917, 2016.
Dessler, A. E. and Wong, S.: Estimates of the water vapor climate feedback during El Niño–Southern Oscillation, J. Climate, 22, 6404–6412, https://doi.org/10.1175/2009JCLI3052.1, 2009.
Durre, I., Williams Jr., C. N., Yin, X. G., and Vose, R. S.: Radiosonde-based trends in precipitable water over the Northern Hemisphere: An update, J. Geophys. Res.-Atmos., 114, D05112, https://doi.org/10.1029/2008JD010989, 2009.
Durre, I., Yin, X., Vose, R. S., Applequist, S., and Arnfield, J.: Enhancing the Data Coverage in the Integrated Global Radiosonde Archive, J. Atmos. Ocean. Tech., 35, 1753–1770, https://doi.org/10.1175/JTECH-D-17-0223.1, 2018.
Gao, B. C. and Kaufman, Y. J.: Water vapor retrievals using Moderate Resolution Imaging Spectroradiometer (MODIS) near-infrared channels, J. Geophys. Res.-Atmos., 108, 4389, https://doi.org/10.1029/2002JD003023, 2003.
Held, I. M. and Soden, B. J.: Water vapor feedback and global warming, Annu. Rev. Energy Environ., 25, 441–475, https://doi.org/10.1146/annurev.energy.25.1.441, 2000.
Holben, B. N., Eck, T. F., Slutsker, I., Tanré, D., Buis, J. P., Setzer, A., Vermote, E., Reagan, J. A., Kaufman, Y. J., Nakajima, T., Lavenu, F., Jankowiak, I., and Smirnov, A.: AERONET – A federated instrument network and data archive for aerosol characterization, Remote Sens. Environ., 66, 1–16, https://doi.org/10.1016/S0034-4257(98)00031-5, 1998.
Ichoku, C., Chu, D. A., Mattoo, S., Kaufman, Y. J., Remer, L. A., Tanre, D., Slutsker, I., and Holben, B. N.: A spatio-temporal approach for global validation and analysis of MODIS aerosol products, Geophys. Res. Lett., 29, MOD1-1–MOD1-4, https://doi.org/10.1029/2001GL013206, 2002.
Kalakoski, N., Kujanpää, J., Sofieva, V., Tamminen, J., Grossi, M., and Valks, P.: Validation of GOME-2/Metop total column water vapour with ground-based and in situ measurements, Atmos. Meas. Tech., 9, 1533–1544, https://doi.org/10.5194/amt-9-1533-2016, 2016.
Kiehl, J. T. and Trenberth, K. E.: Earth's annual global mean energy budget, B. Am. Meteorol. Soc., 78, 197–208, https://doi.org/10.1175/1520-0477(1997)078<0197:EAGMEB>2.0.CO;2, 1997.
Li, Z. H., Muller, J. P., Cross, P., Albert, P., Hewison, T., Watson, R., Fischer, J., and Bennartz, R.: Validation of MERIS near IR water vapour retrievals using MWR and GPS measurements, MERIS user workshop, ESA ESRIN, 10–13 November 2003, Frascati, Italy, 2003.
Liu, H. L., Tang, S. H., Zhang, S. L., and Hu, J. Y.: Evaluation of MODIS water vapour products over China using radiosonde data, Int. J. Remote Sens., 36, 680–690, https://doi.org/10.1080/01431161.2014.999884, 2015.
Liu, J. M., Liang, H., Sun, Z. A., and Zhou, X. J.: Validation of the Moderate-Resolution Imaging Spectroradiometer precipitable water vapor product using measurements from GPS on the Tibetan Plateau, J. Geophys. Res.-Atmos., 111, D14103, https://doi.org/10.1029/2005JD007028, 2006.
Liu, Z. Z., Wong, M. S., Nichola, J., and Chan, P. W.: A multi-sensor study of water vapour from radiosonde, MODIS and AERONET: a case study of Hong Kong, Int. J. Climatol., 33, 109–120, https://doi.org/10.1002/joc.3412, 2013.
Lu, N.: Biases and abrupt shifts of monthly precipitable water from Terra MODIS, Remote Sens., 11, 1315, https://doi.org/10.3390/rs11111315, 2019.
Lu, N., Qin, J., Yang, K., Gao, Y., Xu, X. D., and Koike, T.: On the use of GPS measurements for Moderate Resolution Imaging Spectrometer precipitable water vapor evaluation over southern Tibet, J. Geophys. Res.-Atmos., 116, D23117, https://doi.org/10.1029/2011JD016160, 2011.
Martins, V. S., Lyapustin A., Wang, Y. J., Giles, D. M., Smirnov, A., Slutsker, I., and Korkin, S.: Global validation of columnar water vapor derived from EOS MODIS-MAIAC algorithm against the ground-based AERONET observations, Atmos. Res., 225, 181–192, https://doi.org/10.1016/j.atmosres.2019.04.005, 2019.
Meng, X. C., Cheng, J., and Liang, S. L.: Estimating land surface temperature from Feng Yun-3C/MERSI data using a new land surface emissivity scheme, Remote Sens., 9, 1247, https://doi.org/10.3390/rs9121247, 2017.
National Aeronautics and Space Administration (NASA): Global AERONET data, available at: https://aeronet.gsfc.nasa.gov/data_push/V3/AOD/AOD_Level20_All_Points_V3.tar.gz, last access: 11 October 2020.
National Centers for Environmental Information (NCEI): IGRA data, available at: ftp://ftp.ncdc.noaa.gov/pub/data/igra, last access: 5 July 2021.
National Satellite Meteorological Center (NSMC): MERSI-II PWV product, available at: http://satellite.nsmc.org.cn/PortalSite/Data/Satellite.aspx, last access: 5 July 2021.
Naumann, A. K. and Kiemle, C.: The vertical structure and spatial variability of lower-tropospheric water vapor and clouds in the trades, Atmos. Chem. Phys., 20, 6129–6145, https://doi.org/10.5194/acp-20-6129-2020, 2020.
Pérez-Ramírez, D., Whiteman, D. N., Smirnov, A., Lyamani, H., Holben, B. N., Pinker, R., Andrade, M., and Alados-Arboledas, L.: Evaluation of AERONET precipitable water vapor versus microwave radiometry, GPS, and radiosondes at ARM site, J. Geophys. Res.-Atmos., 119, 9596–9613, https://doi.org/10.1002/2014JD021730, 2014.
Pérez-Ramírez, D., Smirnov, A., Pinker, R. T., Petrenko, M., Román, R., Chen, W., Ichoku, C., Noël, S., Abad, G. G., Lyamani, H., and Holben, B. N.: Precipitable water vapor over oceans from the Maritime Aerosol Network: Evaluation of global models and satellite products under clear sky conditions, Atmos. Res., 215, 294–304, https://doi.org/10.1016/j.atmosres.2018.09.007, 2019.
Prasad, A. K. and Singh, R. P.: Validation of MODIS Terra, AIRS, NCEP/DOE AMIP-II Reanalysis-2, and AERONET Sun photometer derived integrated precipitable water vapor using ground-based GPS receivers over India, J. Geophys. Res.-Atmos., 114, D05107, https://doi.org/10.1029/2008JD011230, 2009.
Qin, J., Yang, K., Koike, T., Lu, H., Ma, Y. M., and Xu, X. D.: Evaluation of AIRS precipitable water vapor against ground-based GPS measurements over the Tibetan Plateau and its surroundings, J. Meteorol. Soc. Jpn., 90, 87–98, https://doi.org/10.2151/jmsj.2012-C06, 2012.
Rakesh, V., Randhir, S., Pal, P. K., and Joshi, P. C.: Impacts of satellite-observed winds and total precipitable water on WRF short-range forecasts over the Indian region during the 2006 summer monsoon, Weather Forecast., 24, 1706–1731, https://doi.org/10.1175/2009WAF2222242.1, 2009.
Román, R., Antón, M., Cachorro, V. E., Loyola, D., Ortiz de Galisteo, J. P., de Frutos, A., and Romero-Campos, P. M.: Comparison of total water vapor column from GOME-2 on MetOp-A against ground-based GPS measurements at the Iberian Peninsula, Sci. Total Environ., 533, 317–328, https://doi.org/10.1016/j.scitotenv.2015.06.124, 2015.
Sobrino, J. A., Juan, C. J., Cristian, M., and Guillem, S.: Evaluation of Terra/MODIS atmospheric profiles product (MOD07) over the Iberian Peninsula: a comparison with radiosonde stations, Int. J. Digit. Earth, 8, 1–13, https://doi.org/10.1080/17538947.2014.936973, 2014.
Solbrig, J. E.: Thin cloud length scales using CALIPSO and CloudSat data, MS thesis, Department of Atmospheric Sciences, Texas A&M University, San Antonio, Texas, USA, 62 pp., 2009.
Trenberth, K. E., Dai, A. G., Rasmussen, R. M., and Parsons, D. B.: The changing character of precipitation, B. Am. Meteorol. Soc., 84, 1205–1218, https://doi.org/10.1175/BAMS-84-9-1205, 2003.
Turner, D. D., Lesht, B. M., Clough, S. A., Liljegren, J. C., Revercomb, H. E., and Tobin, D. C.: Dry Bias and Variability in Vaisala RS80-H Radiosondes: The ARM Experience, J. Atmos. Ocean. Tech., 20, 117–132, https://doi.org/10.1175/1520-0426(2003)020<0117:DBAVIV>2.0.CO;2, 2003.
Van Malderen, R., Brenot, H., Pottiaux, E., Beirle, S., Hermans, C., De Mazière, M., Wagner, T., De Backer, H., and Bruyninx, C.: A multi-site intercomparison of integrated water vapour observations for climate change analysis, Atmos. Meas. Tech., 7, 2487–2512, https://doi.org/10.5194/amt-7-2487-2014, 2014.
Vaquero-Martínez, J., Antón, M., Ortiz de Galisteo, J. P., Cachorro, V. E., Costa, M. J., Román, R., and Bennouna, Y. S.: Validation of MODIS integrated water vapor product against reference GPS data at the Iberian Peninsula, Int. J. Appl. Earth Obs., 63, 214–221, https://doi.org/10.1016/j.jag.2017.07.008, 2017.
Wang, L., Hu, X. Q., Xu, N., and Chen, L.: Water vapor retrievals from near-infrared channels of the advanced Medium Resolution Spectral Imager instrument onboard the Fengyun-3D satellite, Adv. Atmos. Sci., 38, 1351–1366, https://doi.org/10.1007/s00376-020-0174-8, 2021.
Wang, J. H., Zhang, L. Y., Dai, A. G., Hove, T. V., and Baelen, J. V.: A near-global, 2-hourly data set of atmospheric precipitable water from ground-based GPS measurements, J. Geophys. Res.-Atmos., 112, D11107, https://doi.org/10.1029/2006JD007529, 2007.
Wang, J. H., Dai, A. G., and Mears, C.: Global water vapor trend from1988 to 2011 and its diurnal asymmetry based on GPS, radiosonde, and microwave satellite measurements, J. Climate, 29, 5205–5222, https://doi.org/10.1175/JCLI-D-15-0485.1, 2016.
Wang, S. M., Xu, T. H., Nie, W. F., Jiang, C. H., Yang, Y. G., Fang, Z. L., Li, M. W., and Zhang Z.: Evaluation of precipitable water vapor from five reanalysis products with ground-based GNSS observations, Remote Sens., 12, 1817, https://doi.org/10.3390/rs12111817, 2020.
Westwater, E. R.: The accuracy of water vapor and cloud liquid determination by dual-frequency ground-based microwave radiometry, Radio Sci., 13, 677–685, https://doi.org/10.1029/RS013i004p00677, 1978.
Wu, R. H., Zhang, P., Xu, N., Hu, X. Q., Chen, L., Zhang, L., and Yang, Z. D.: FY-3D MERSI on-orbit radiometric calibration from the lunar view, Sensors, 20, 4690, https://doi.org/10.3390/s20174690, 2020.
Wu, Z., Liu, Y., Liu, Y., Wang, J., He, X., Xu, W., Ge, M., and Schuh, H.: Validating HY-2A CMR precipitable water vapor using ground-based and shipborne GNSS observations, Atmos. Meas. Tech., 13, 4963–4972, https://doi.org/10.5194/amt-13-4963-2020, 2020.
Xu, N., Niu, X. H., Hu, X. Q., Wang, X. H., Wu, R. H., Chen, S. S., Chen, L., Sun, L., Ding, L., Yang, Z. D., and Zhang, P.: Prelaunch calibration and radiometric performance of the advanced MERSI II on FengYun-3D, IEEE T. Geosci. Remote, 56, 4866–4875, https://doi.org/10.1109/TGRS.2018.2841827, 2018.
Yang, Z. D., Zhang, P, Gu, S. Y.,Hu, X. Q.,Tang, S. H.,Yang, L. K., Xu, N., Zhen, Z. J., Wang L., Wu, Q., Dou, F. L., Liu, R. X., Wu, X., Zhu, L., Zhang, L. Y., Wang, S. J., Sun, Y. Q., and Bai, W. H.: Capability of Fengyun-3D satellite in earth system observation, J. Meteorol. Res.-PRC., 33, 1113–1130, https://doi.org/10.1007/s13351-019-9063-4, 2019.
Zhang, F. Z., Barriot, J.-P., Xu, G. C., and Yeh, T.-K.: Metrology assessment of the accuracy of precipitable water vapor estimates from GPS data acquisition in tropical areas: the Tahiti case, Remote Sens., 10, 758, https://doi.org/10.3390/rs10050758, 2018.
Zhang, J. Q., Chen, H. B., Li, Z. Q., Fan, X. H., Peng, L., Yu, Y., and Cribb, M.: Analysis of cloud layer structure in Shouxian, China using RS92 radiosonde aided by 95 GHz cloud radar, J. Geophys. Res.-Atmos., 115, D00K30, https://doi.org/10.1029/2010JD014030, 2010.
Zhang, W.: data-wengang20211109, Zenodo [data set], https://doi.org/10.5281/zenodo.5656797, 2021.
Zhang, W. G., Xu, G. R., Wan, R., He, W. H., and Feng, G. L.: Analysis of the characteristic of liquid water and water vapor detected by ground-based microwave radiometer, Torrential Rain and Disasters, 34, 367–374, 2015 (in Chinese with English abstract).
Zhao, T. B., Dai, A. G., and Wang, J. H.: Trends in tropo-spheric humidity from 1970 to 2008 over China from a homogenized radiosonde dataset, J. Climate, 25, 4549–4567, https://doi.org/10.1175/jcli-d-11-00557.1, 2012.