the Creative Commons Attribution 4.0 License.
the Creative Commons Attribution 4.0 License.
 | 04 Mar 2022
Aerosol models from the AERONET database: application to surface reflectance validation
Eric Vermote
Sergii Skakun
Emilie Murphy
Oleg Dubovik
Natacha Kalecinski
Bruno Korgo
Brent Holben
Aerosols play a critical role in radiative transfer within the atmosphere, and they have a significant impact on climate change. In this paper, we propose and implement a framework for developing an aerosol model using their microphysical properties. Such microphysical properties as the size distribution, the complex refractive index, and the percentage of sphericity are derived from the global AERosol RObotic NETwork (AERONET). These measurements, however, are typically retrieved when almucantar measurement procedures are performed (i.e., early mornings and late afternoons with clear sky) and might not have a temporal correspondence to a satellite overpass time, so a valid validation of satellite-derived products cannot be carried out. To address this problem of temporal inconsistency of satellite and ground-based measurements, we developed an approach to retrieve these microphysical properties (and the corresponding aerosol model) using the optical thickness at 440 nm, τ440, and the Ångström coefficient between 440 and 870 nm, α440–870. Such aerosol models were developed for 851 AERONET sites within the last 28 years. Obtained results suggest that empirically microphysical properties can be retrieved with uncertainties of up to 23 %. An exception is the imaginary part of the refractive index ni, for which the derived uncertainties reach up to 38 %. These specific parametric models of aerosol can be used for the studies when retrieval of microphysical properties is required as well as validation of satellite-derived products over land. Specifically, we demonstrate the usefulness of the aerosol models to validate surface reflectance records over land derived from optical remote sensing sensors. We then quantify the propagation of uncertainties in the surface reflectance due to uncertainties with the aerosol model retrieval that is used as a reference from radiative transfer simulations. Results indicate that individual aerosol microphysical properties can impact uncertainties in surface reflectance retrievals between 3.5 × 10⁻⁵ to 1 × 10⁻³ (in reflectance units). The overall impact of microphysical properties combined yields an overall uncertainty in surface reflectance < 0.004 (in reflectance units). That corresponds, for example, to 1 to 3 % of the retrieved surface reflectance in the red spectral band (620–670 nm) by the Moderate Resolution Imaging Spectroradiometer (MODIS) instrument. These uncertainty values are well below the specification (0.005 + 0.05ρ; ρ is the retrieved surface reflectance) used for the MODIS atmospheric correction.
- Article
(3224 KB) - Full-text XML
- BibTeX
- EndNote


Aerosols play a key role in the atmosphere as an important climate forcing in climate assessment (IPCC, 2018, 2019), and their better characterization would improve our knowledge of their properties for a better assessment of their impacts (e.g., Dubovik and King, 2000; Andreae et al., 2002; Dubovik et al., 2002b; Roger et al., 2009; Omar et al., 2005; Nousiainen, 2009; Dubovik et al., 2011; Ginoux et al., 2012; Boucher et al., 2013; Calvo et al., 2013; Lenoble et al., 2013; Boucher, 2015; Fuzzi et al., 2015; Derimian et al., 2016; Klimont et al., 2017; Torres et al., 2017; Bond et al., 2013; Contini et al., 2018; de Sá et al., 2019; Li et al., 2019; Mallet et al., 2020).
In general, the use of specific aerosol models depends on the temporal and spatial scales. Approximate models are generally adequate for long-term studies, when intra-annual or intra-seasonal variability in aerosols is of less importance; however, studies that require capturing aerosol variability in space and time would require a more specific and precise characterization.
The AERosol RObotic NETwork (AERONET) network (Holben et al., 1998) was created in the early 1990s and continues operation today. Over the last 30 years, this network has provided information on the aerosol characteristics for approximately 1000 globally distributed sites. AERONET estimates several microphysical properties of aerosols (i.e., the size distribution, the complex refractive index, and the percentage of sphericity). These parameters are derived during the almucantar measurement procedures, which are typically carried out early morning and late afternoon under clear-sky conditions. As a result, it is usually not possible to have these aerosol microphysical properties when an Earth observation satellite passes over an AERONET site. To address this problem, we propose a method to retrieve microphysical properties using a parametric model with two variables: the optical thickness at 440 nm, τ440, and the Ångström coefficient between 440 and 870 nm, α440–870. We selected these two parameters because they are widely accessible (e.g., from the AERONET network, which provides several measurements per clear-sky hour; from the satellite itself; or from climatology). We used 851 AERONET sites, for which the data were in a sufficient quantity and representative. Thus, we can derive a dynamic aerosol model for each of these AERONET sites. These parametric models of aerosol can be used for the studies when retrieval of microphysical properties is required as well as validation of satellite-derived products over land.
In the context of satellite product validation, the surface reflectance retrieval requires a good characterization of the aerosol properties, particularly for sensors with various and narrow spectral bands (Justice et al., 2013). Therefore, uncertainties in the aerosol models would impact uncertainties in the surface reflectance record derivation. By incorporating aerosol models into a radiative transfer model, one can generate reference surface reflectance, which can be used for validating satellite-derived surface reflectance. It is essential, in this case, that a careful validation be performed on a global and continuous basis, including a wide range of land and, consequently, reflectance conditions. One approach is the direct comparison with “ground truth” measurements, but this presents several challenges related to the scale and nature of the ground measurements and their representativeness at coarse and medium satellite pixel resolutions since the global representativeness of the pixel may differ from the point measurements. Nevertheless, at a finer spatial resolution (pixels less than 30 m), ground measurements may occur. Indeed, with a good protocol and good radiometry, direct ground truth measurements can be performed for validation (Helder and al., 2012; Czapla-Myers et al., 2015, 2016; Badawi et al., 2019; Bouvet et al., 2019). There are also other approaches. For example, we use an indirect approach for the validation of satellite products from MODIS (Moderate Resolution Imaging Spectroradiometer) and VIIRS (Visible Infrared Imager Radiometer Suite; Vermote et al., 2002, 2014), for the NASA Harmonized Landsat 8 Sentinel-2 project (Vermote et al., 2016; Claverie et al., 2018), or for the CEOS ACIX working group for atmospheric correction intercomparison (Doxani et al., 2018). In the former, we compare a surface reflectance retrieved from satellite data to a surface reflectance reference determined from the top-of-atmosphere (TOA) reflectance corrected using the accurate radiative transfer 6SV code (Vermote et al., 1997; Kotchenova et al., 2006, 2008; Kotchenova and Vermote, 2007) and detailed measurements of the atmosphere. An intermediate step consists of validating the aerosol optical thickness product derived from various sensors such as MODIS, MISR (Multi-angle Imaging Spectroradiometer), OMI (Ozone Monitoring Instrument), POLDER (Polarization and Directionality of the Earth's Reflectances), and Landsat, which is further used as an input to the atmospheric correction process. Numerous studies have applied this validation approach (e.g., Martonchik et al., 1998; Remer et al., 2005; Herman et al., 2005; Masek et al., 2006; Keller et al., 2007; Martonchik et al., 2009; Dubovik et al., 2011; Levy et al., 2013; Vermote et al., 2016; Levy et al., 2018; Doxani et al., 2018). In the last part of this paper, we evaluate the uncertainties in our aerosol microphysical properties according to the definition of the surface reflectance (to be used as reference) in the MODIS red band.
2.1 Aerosol microphysical description
There are two ways to describe an optical aerosol model: using optical properties or using the microphysical properties. The optical properties (scattering and absorbing coefficients, phase matrix) are derived from the following microphysical properties: the size distribution (which gives the diameter distribution of the aerosol population), the complex refractive index (which gives characteristics of the light scattered by the particle for the real part and the absorbing quality of the particle for the imaginary part), and the sphericity (which describes the aerosol shape and non-sphericity aspect) (Hansen and Travis, 1974; Van der Hulst, 1981; Lenoble, 1993; Liou, 2002; Mishchenko et al., 2002; Lenoble et al., 2013; Bohren et al., 2016). Thus, to avoid losing information about the microphysical properties (i.e., the aerosol composition), we prefer to describe the aerosol model using its microphysical properties rather than its optical properties (knowing that it will give us the possibility of computing the optical properties from the microphysical ones). The size distribution characterization may be variable in its chemical or optical description, i.e., mass and numbers, respectively. This results in a different shape and description of the size distribution. For an optical approach, the Gaussian distribution is widely used as the most appropriate model for the aerosol size distribution (Whitby, 1978; Shettle and Fenn, 1979; amongst other subsequent studies). In order to design an optical aerosol size distribution in its vertical description, a combination of a Gaussian law for each aerosol mode is suitable (the fine mode and the coarse mode identified hereafter by f and c), even if it can be much more complex at a small scale (Liou, 2002; Hsu et al., 2004; Roger et al., 2009; Dubovik and King, 2000; Dubovik et al., 2011; Lee et al., 2015). In this way, the particle volume size distribution can be described by the derivative of the particle volume at a specific radius V(r) by the natural logarithm of the radius:
where the six microphysical parameters that described this model are Cvf (the particle volume concentration of the fine mode), Cvc (the particle volume concentration of the coarse mode), and (the particle median volume radius of the fine and coarse mode, respectively), and σf and σc (the standard deviation of the Gaussian law of the fine and coarse mode).
The phase function of aerosols is usually normalized (Lenoble, 1985); thus the size distribution does not need to be defined in an absolute manner. We then may define the relative volume concentration %Cvf and %Cvc (scaled between 0 and 1) rather than Cvf and Cvc (discussed latter in this paper). The complex refractive index of the aerosol, , is the second required microphysical parameter. The real part (nr) describes the scattering properties of the aerosol, while the imaginary one (ni) describes absorption properties. Both parts have to be known for a given wavelength. Finally, the percentage of sphericity %Sph can be considered as well to account for the non-sphericity of aerosols (Mishchenko et al., 2000; Dubovik et al., 2002b; Herman et al., 2005) in contrast to a “spherical approach” (Mie, 1908). This non-sphericity mostly applies the coarse mode.
2.2 Description of the dataset
Aerosol microphysical property data were extracted from the AERONET measurements (Holben et al., 1998; Dubovik and King, 2000; Dubovik et al., 2000; Sinyuk et al., 2007; Gilles et al., 2019). We used Level 2.0 (quality-assured) of the “Version 3 direct sun” and of the “Version 3.0 inversions”, except for the percentage of sphericity %Sph, for which we used Level 1.5 (in July 2021, Level 2.0 was not yet available for this parameter).
From these datasets, we selected all records corresponding to (1) aerosol optical thicknesses at four wavelengths (440, 675, 870, and 1020 nm); (2) aerosol Ångström coefficients between 440 and 870 nm, which allows us to determine the aerosol optical thickness at 550 nm; and (3) microphysical properties Cvf, Cvc, %Cvf, %Cvc, rvf, rvc, σr, σc, nr440, nr650, nr850, nr1020, ni440, ni650, ni850, ni1020, and %Sph.
A minimum threshold of 50 measurements of the inversion product was used to exclude all sites without a sufficient number of measurements. We also ensure that all seasons are represented in the dataset. As mentioned above, one possible application of our aerosol microphysical model is the validation of satellite products in an operational context, whereby the atmospheric correction is performed when the aerosol loading is not too high. Thus, we decided to limit the dataset to aerosol optical thicknesses at 550 nm lower than 0.8.
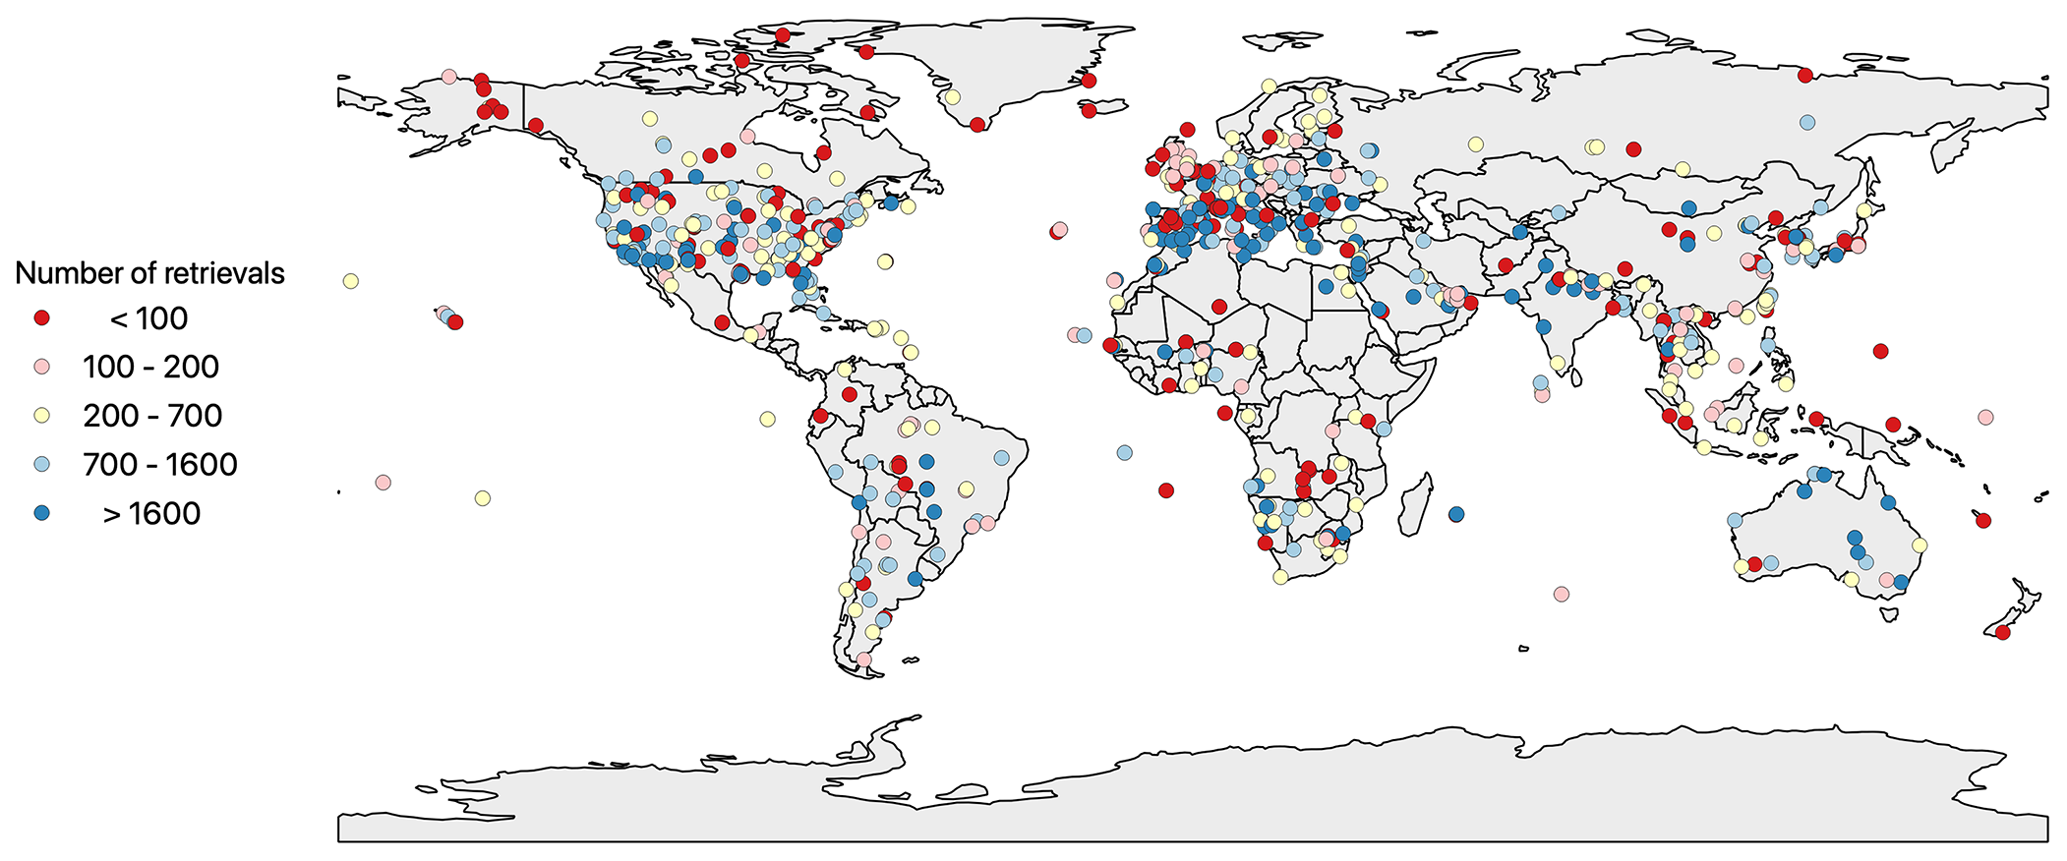
Figure 1Location of the 851 AERONET sites with their number of retrievals.
Out of 1139 available AERONET sites, we selected 851 globally distributed sites (Fig. 1), resulting in ∼ 1.3 million retrievals of aerosol microphysical properties. To characterize the representativeness of these sites, we analyzed the type of land cover surface around the selected AERONET sites. As shown in Fig. 2, urban (24 %), cropland (22 %), forest (17 %), grassland and shrubland (16 %), and coastal areas and islands (16 %) are more or less equally represented.
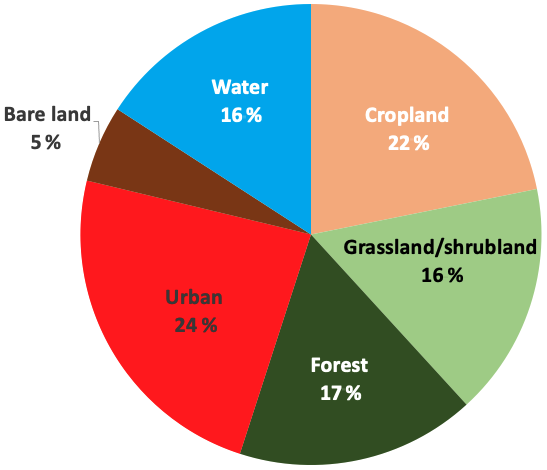
Figure 2Representativeness of land surface types around the selected AERONET sites for the entire selected dataset.
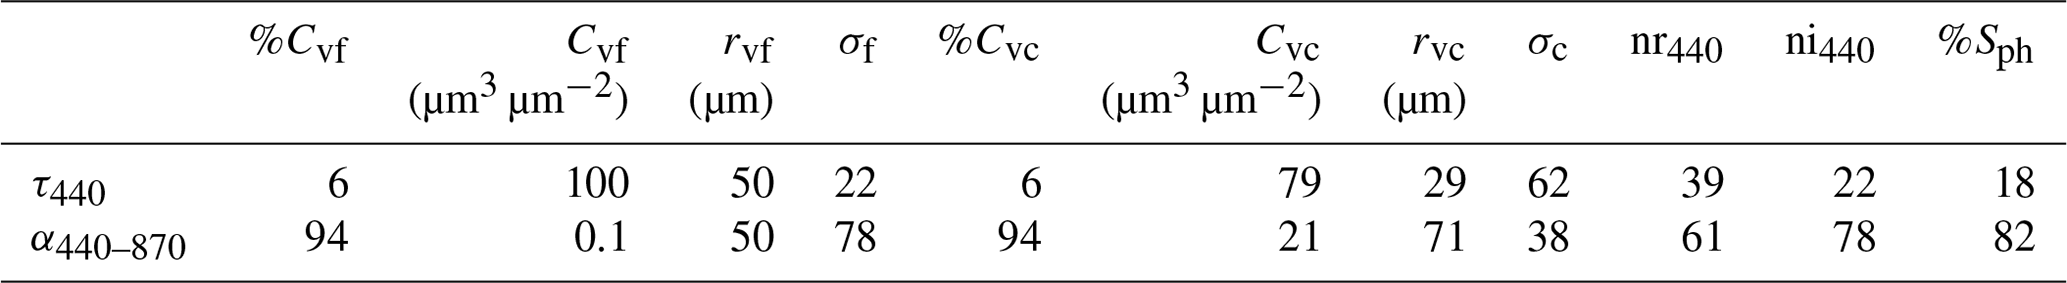
Table 1Description of the database of aerosol microphysical properties for aerosol optical thickness τ at 440 nm and the Ångström coefficient α (440, 870).
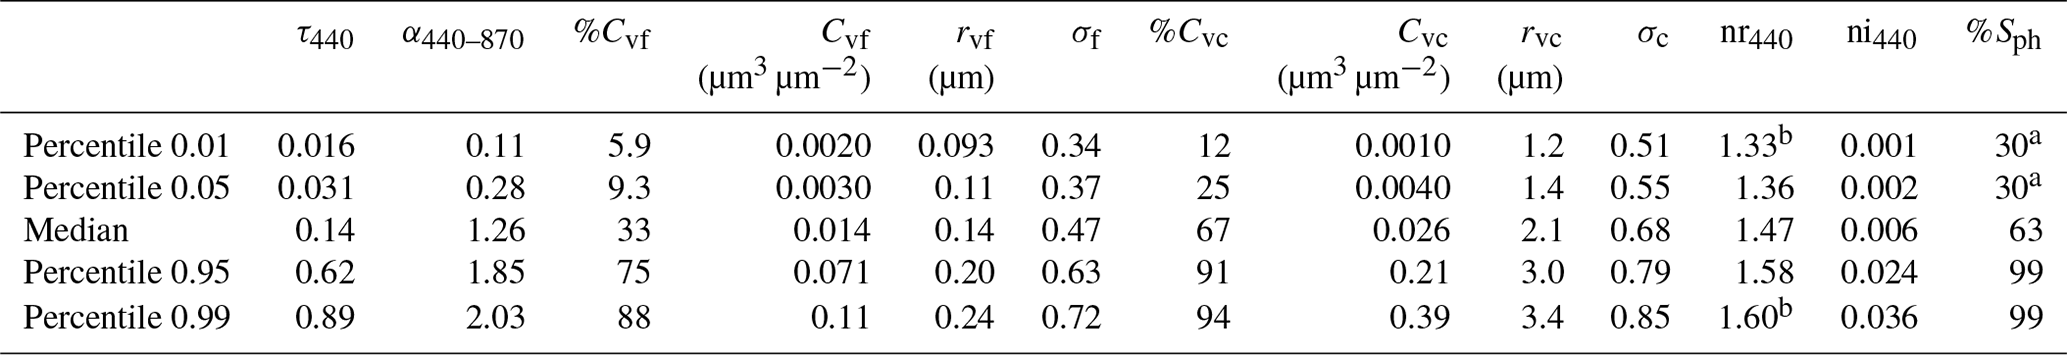
a According to our threshold at 30 %. b According to the AERONET threshold.
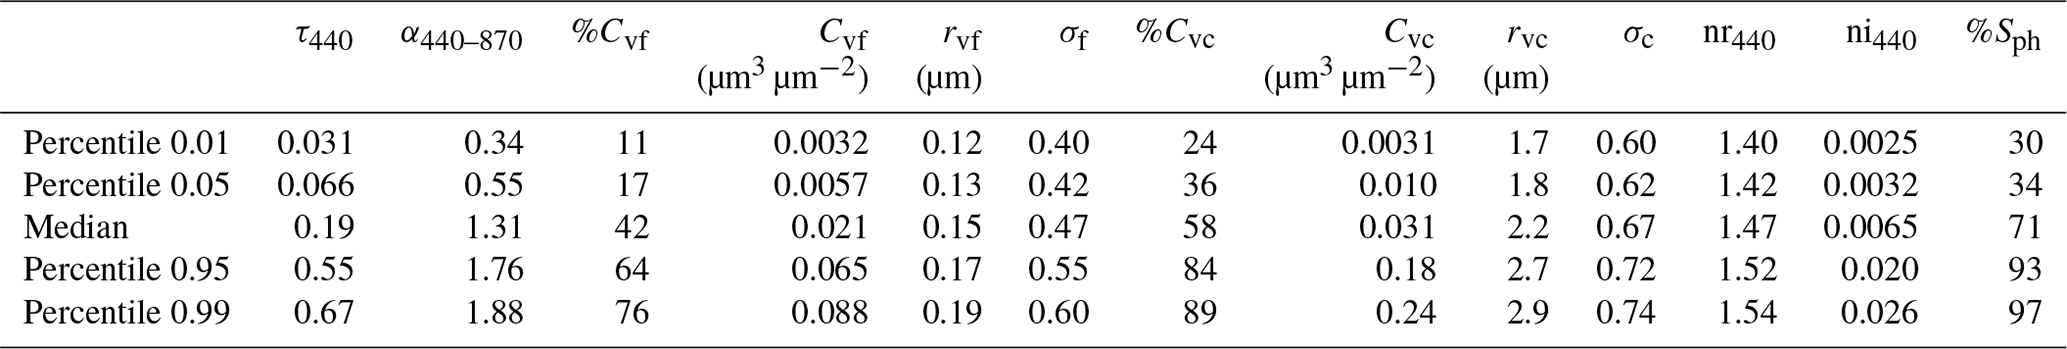
Table 2Same as Table 1 but by affecting one median value of each microphysical parameter per AERONET site and then by deriving the median value of the 851 sites (400 for refractive index) for each microphysical parameter.
For the measurements, AERONET instruments consist of two detectors mounted on robots, a system developed by Cimel: one for the measurement of solar (and now lunar) extinction, which provides the aerosol optical thicknesses (and then the Ångström coefficients) and the water vapor content, the other detector measuring the luminance of the day sky using two protocols – the almucantar and the principal plane (see Tables 1 and 2 in Holben et al., 1998). The almucantar procedure and measurements were used by Dubovik and King (2000) to derive the aerosol microphysical properties. Nevertheless, due to the observation protocol, the atmospheric condition (particularly its turbidity and homogeneity), the processing, and the retrieval purpose, the aerosol microphysical property retrievals are not provided within a single retrieval. There are three different sets of retrievals:
-
The size distribution (see Eq. 1) of Cvf, Cvc, %Cvf, %Cvc, rvf, rvc, σr, and σc is always available when aerosol microphysical property retrievals are performed by AERONET. For this study, this first block provides a little fewer than 1.3 million sets of retrievals for the whole 851 AERONET sites used.
-
The complex refractive index for four wavelengths – nr440, nr650, nr850, nr1020, ni440, ni650, ni850, ni1020 – has a lower occurrence in terms of retrievals, only 0.17 million sets of retrievals from 400 sites.
-
The percentage of sphericity %Sph is available for the same 851 sites as (1) and provides a little fewer than 1.3 million sets of retrievals. We decided to limit the non-sphericity at a 30 % minimum. Indeed, deriving the non-sphericity integrated over the whole atmospheric column is challenging. Indeed, in almost all cases, particles are randomly oriented, and the accumulation of all orientation along the vertical column generates a minimum of sphericity.
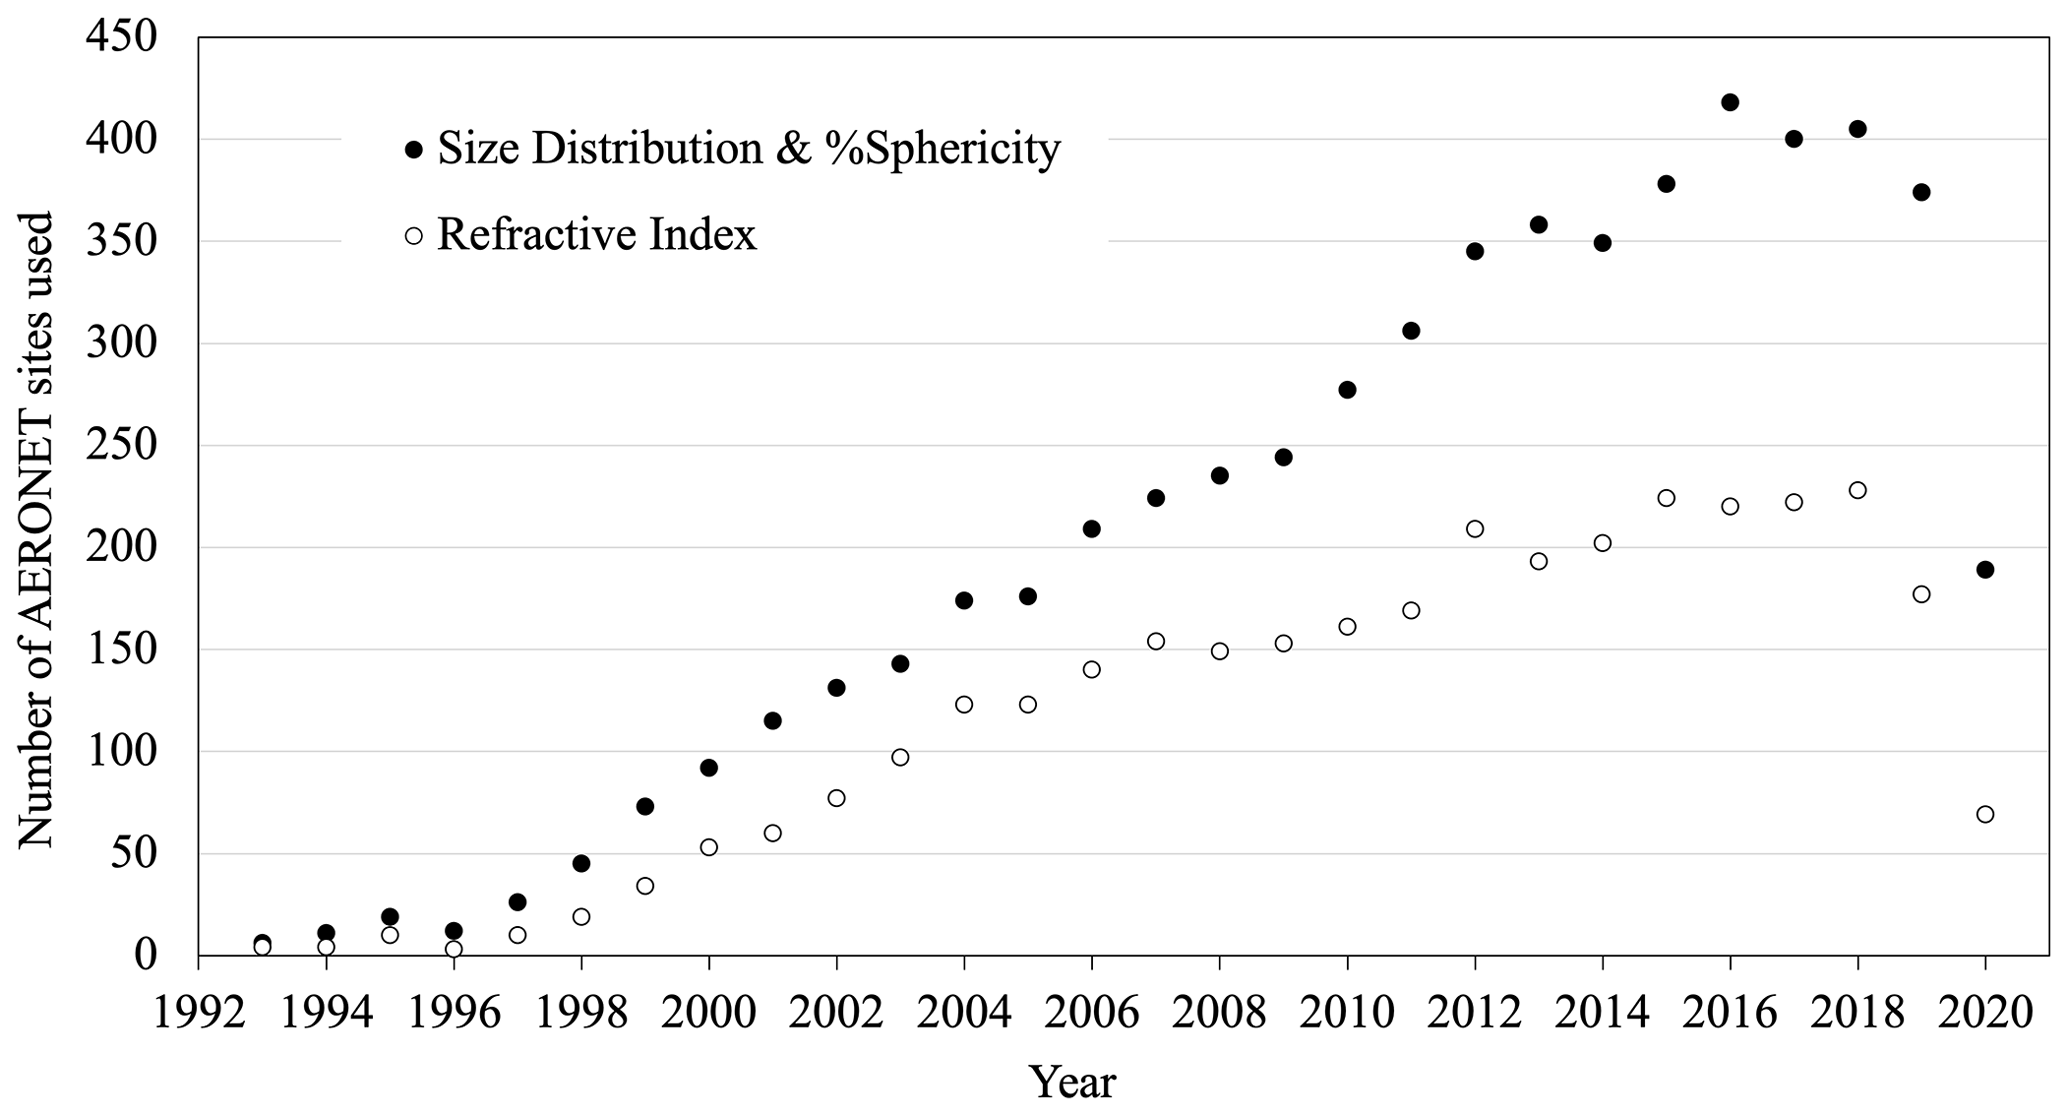
Figure 3Number of AERONET sites selected for this study over the years. The size distribution and the refractive index are Level 2.0, while the sphericity is Level 1.5 (see text). The decrease in 2020 is because all data have yet to be validated.
The AERONET network has existed since 1993. Figure 3 shows the number of AERONET sites we used for this study since 1993. For the last 9 years, we used more than 350 sites, 250 sites, and 350 sites, respectively, for characterizing the size distribution, the refractive index, and the sphericity. The decrease observed in 2020 is because all data have not yet been validated.
A technical description of values for all aerosol microphysical properties for the 851 AERONET sites is presented Table 1, showing the percentile at 1 %, 5 %, 95 %, and 99 % and the median value for each of the properties. This gives a global overview of aerosol microphysical properties over land.
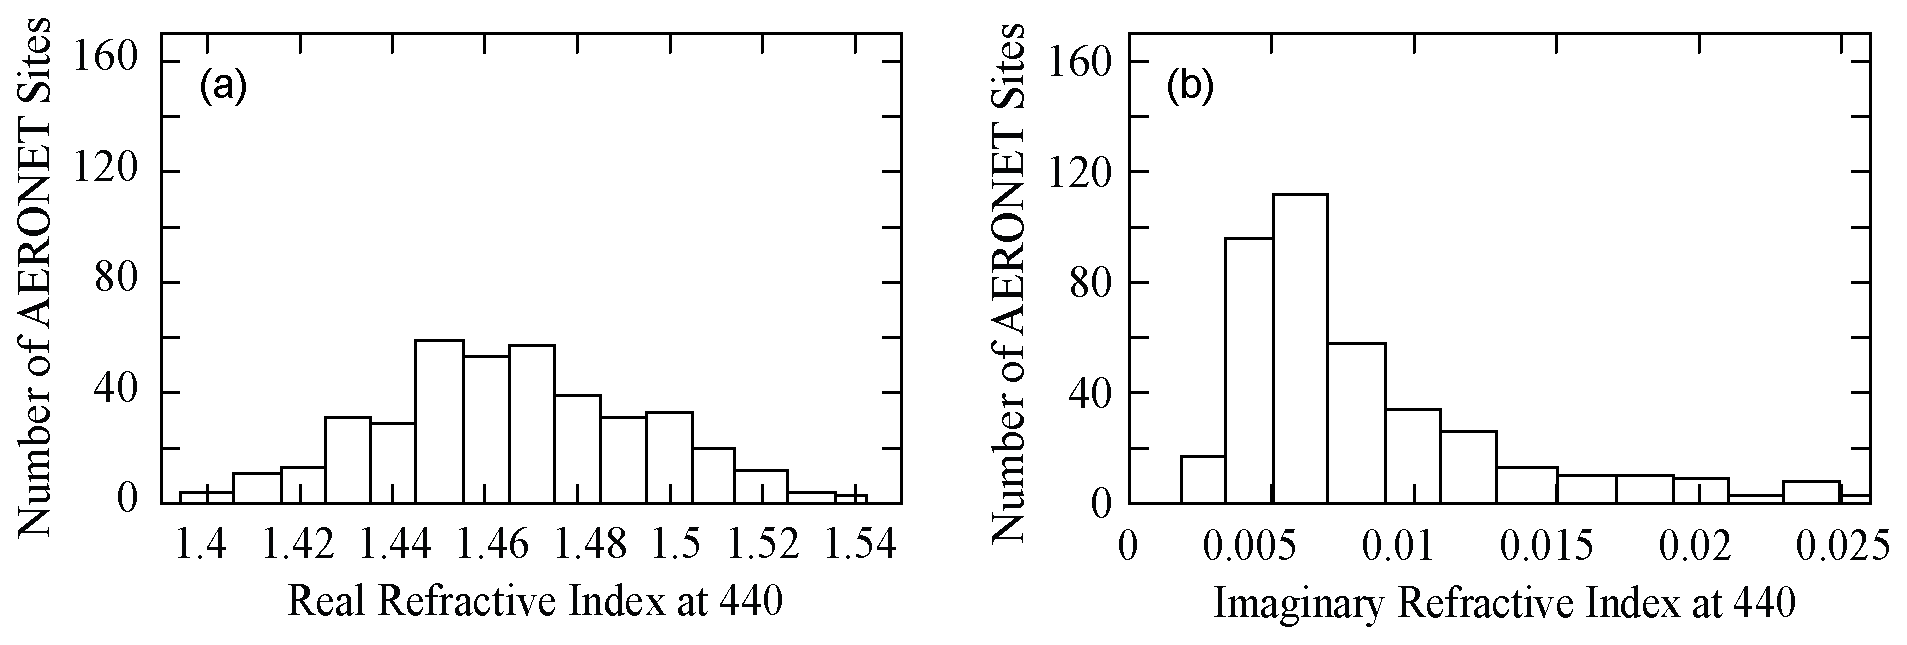
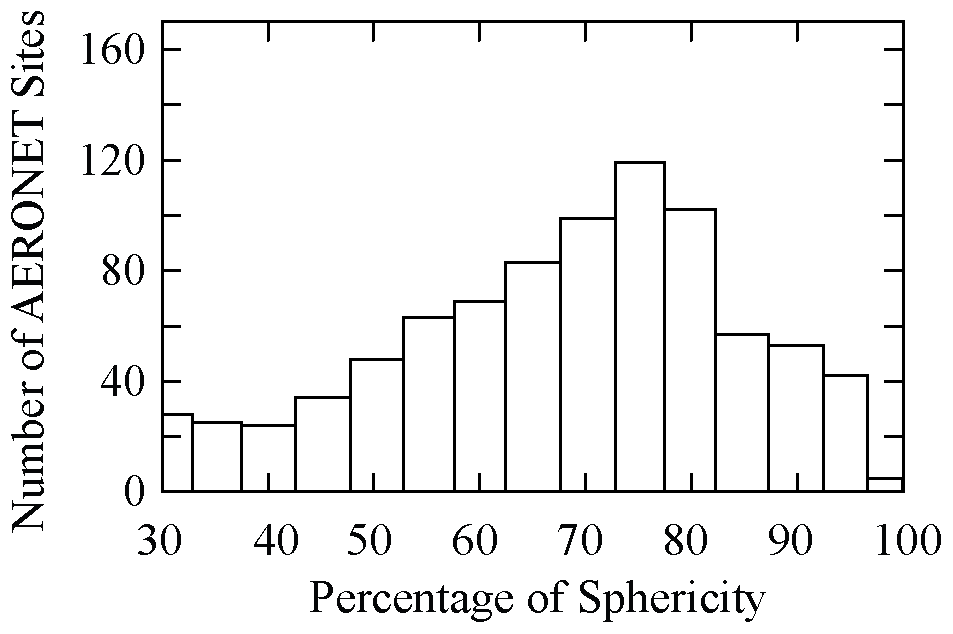
AERONET sites do not have the same number of observations (see Fig. 4). In the database we developed, one site may contain several thousands of selected retrievals for each aerosol microphysical property. For example, 8 sites provided more than 10 000 sets of retrievals for the size distribution, i.e., Sede Boker (Israel), Solar Village (Saudi Arabia – no longer in the network), GSFC (USA), Burjassot (Spain), El_Arenosillo (Spain), Carpentras (France – no longer in the network), Sevilleta (USA), and Granada (Spain). On the other hand, one site may contain fewer than 100 sets (this is the case for 138 sites). This means that one site may represent the equivalent of hundreds of other sites. To avoid the impact of those too well-represented sites, we show in Table 2 another way to present similar information as Table 1. By applying a single median value per AERONET site for each aerosol microphysical parameter retrieval, we have 651 values for each microphysical parameter (400 for the refractive index). Then, we derive a median value reported in Table 2. In this case, the median values do not change much (except for %Sph), but the range between both percentiles is reduced by 20 % to 50 %. With the assumption of a median value per site, Fig. 5 shows the frequency of τ440 and α440–870, while Figs. 6, 7, and 8 show the frequencies of each aerosol microphysical property from our selected dataset.
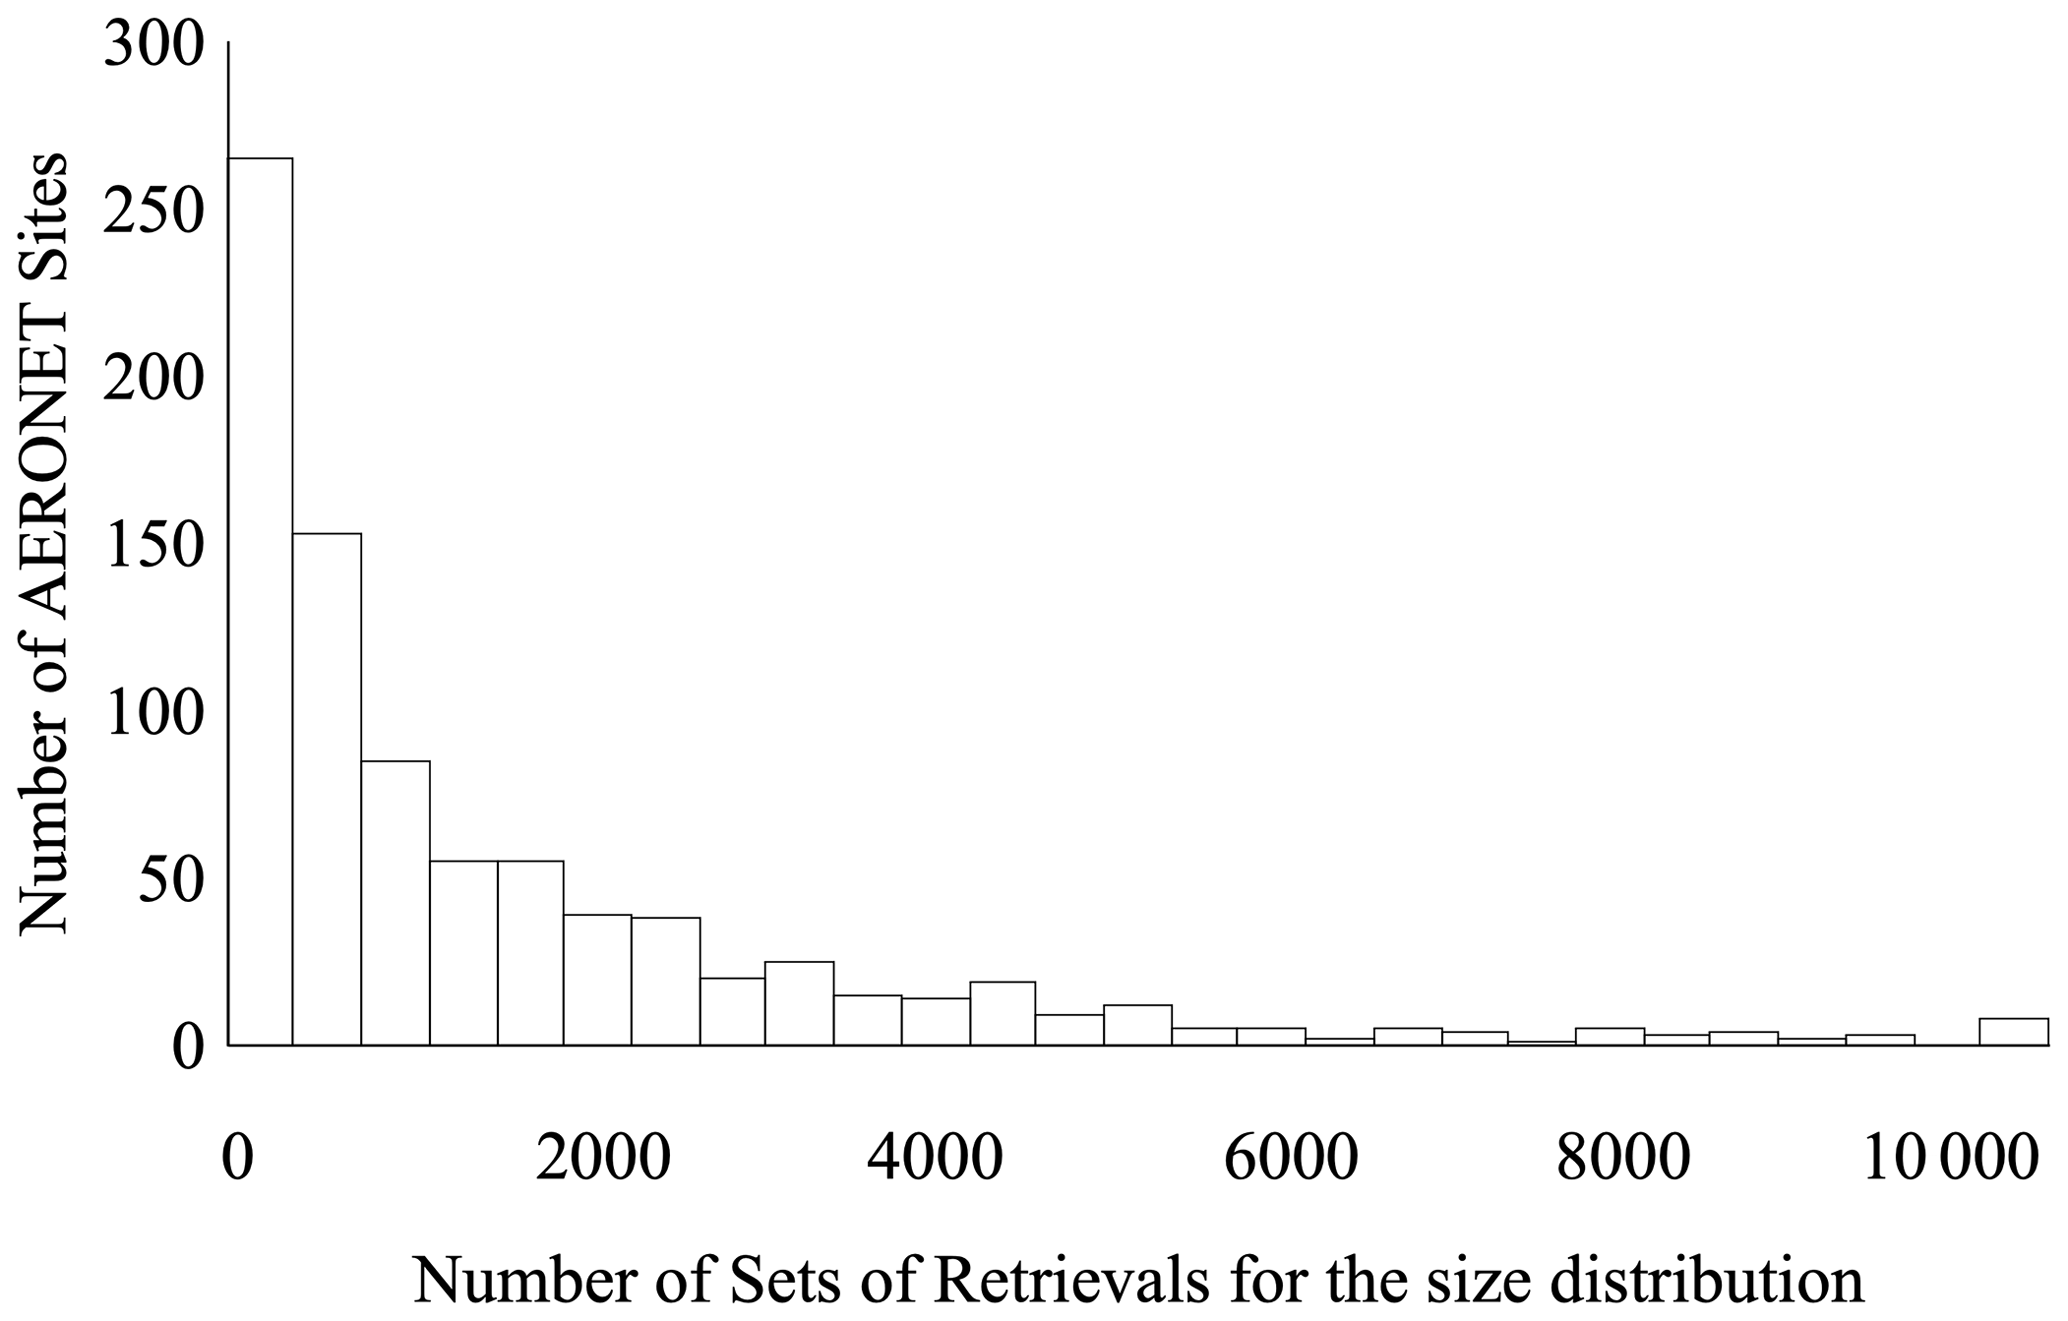
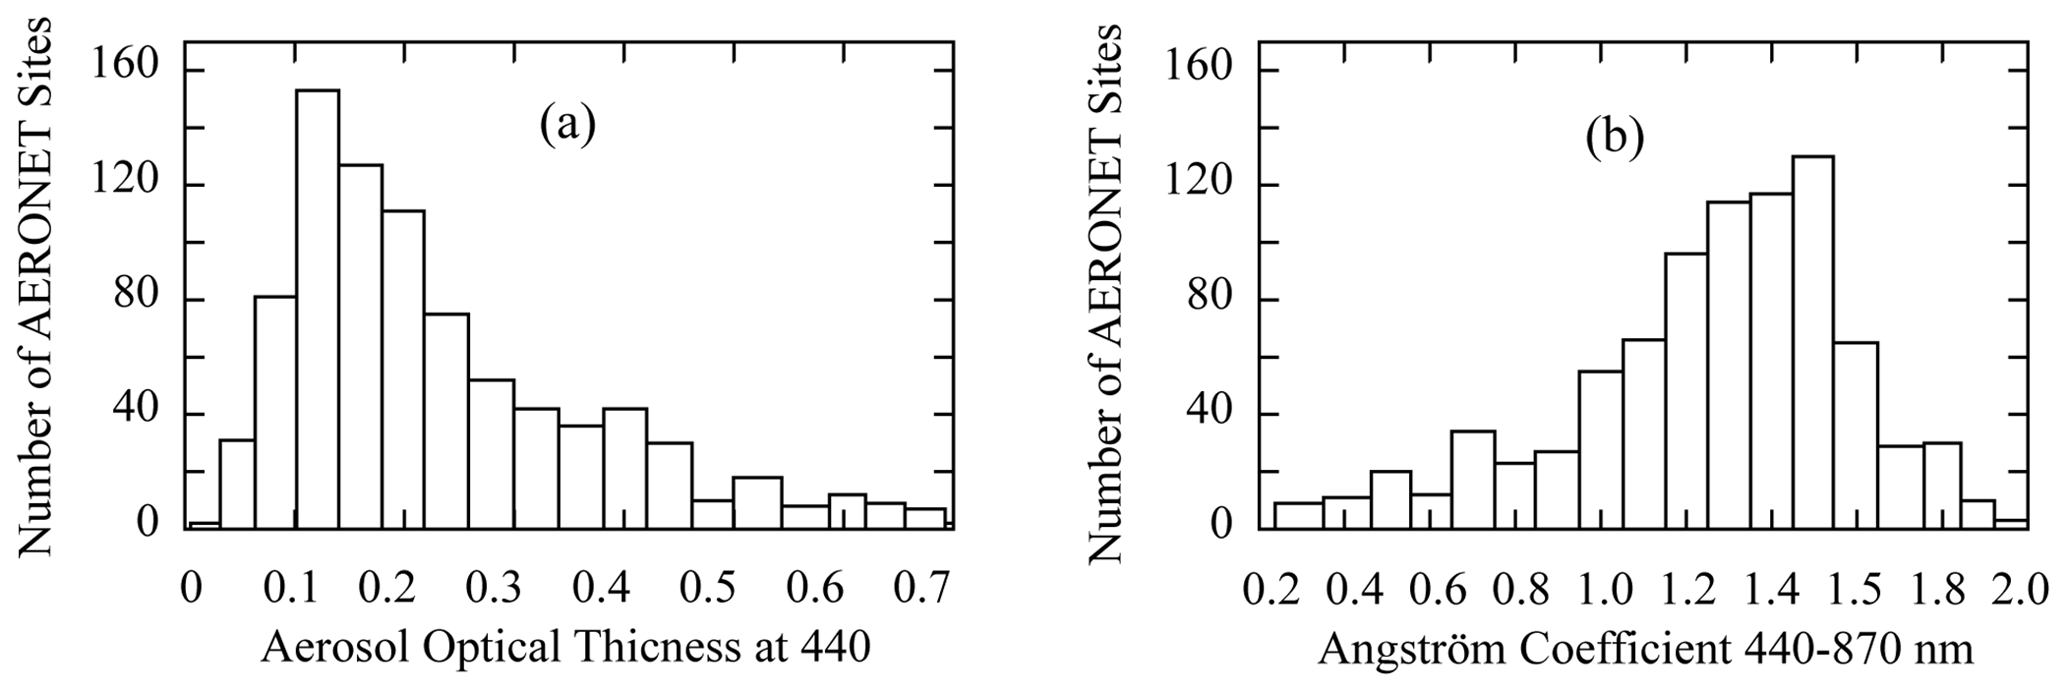
Figure 5Aerosol optical thickness at 440 nm frequency (a) and the Ångström coefficient frequency (b).
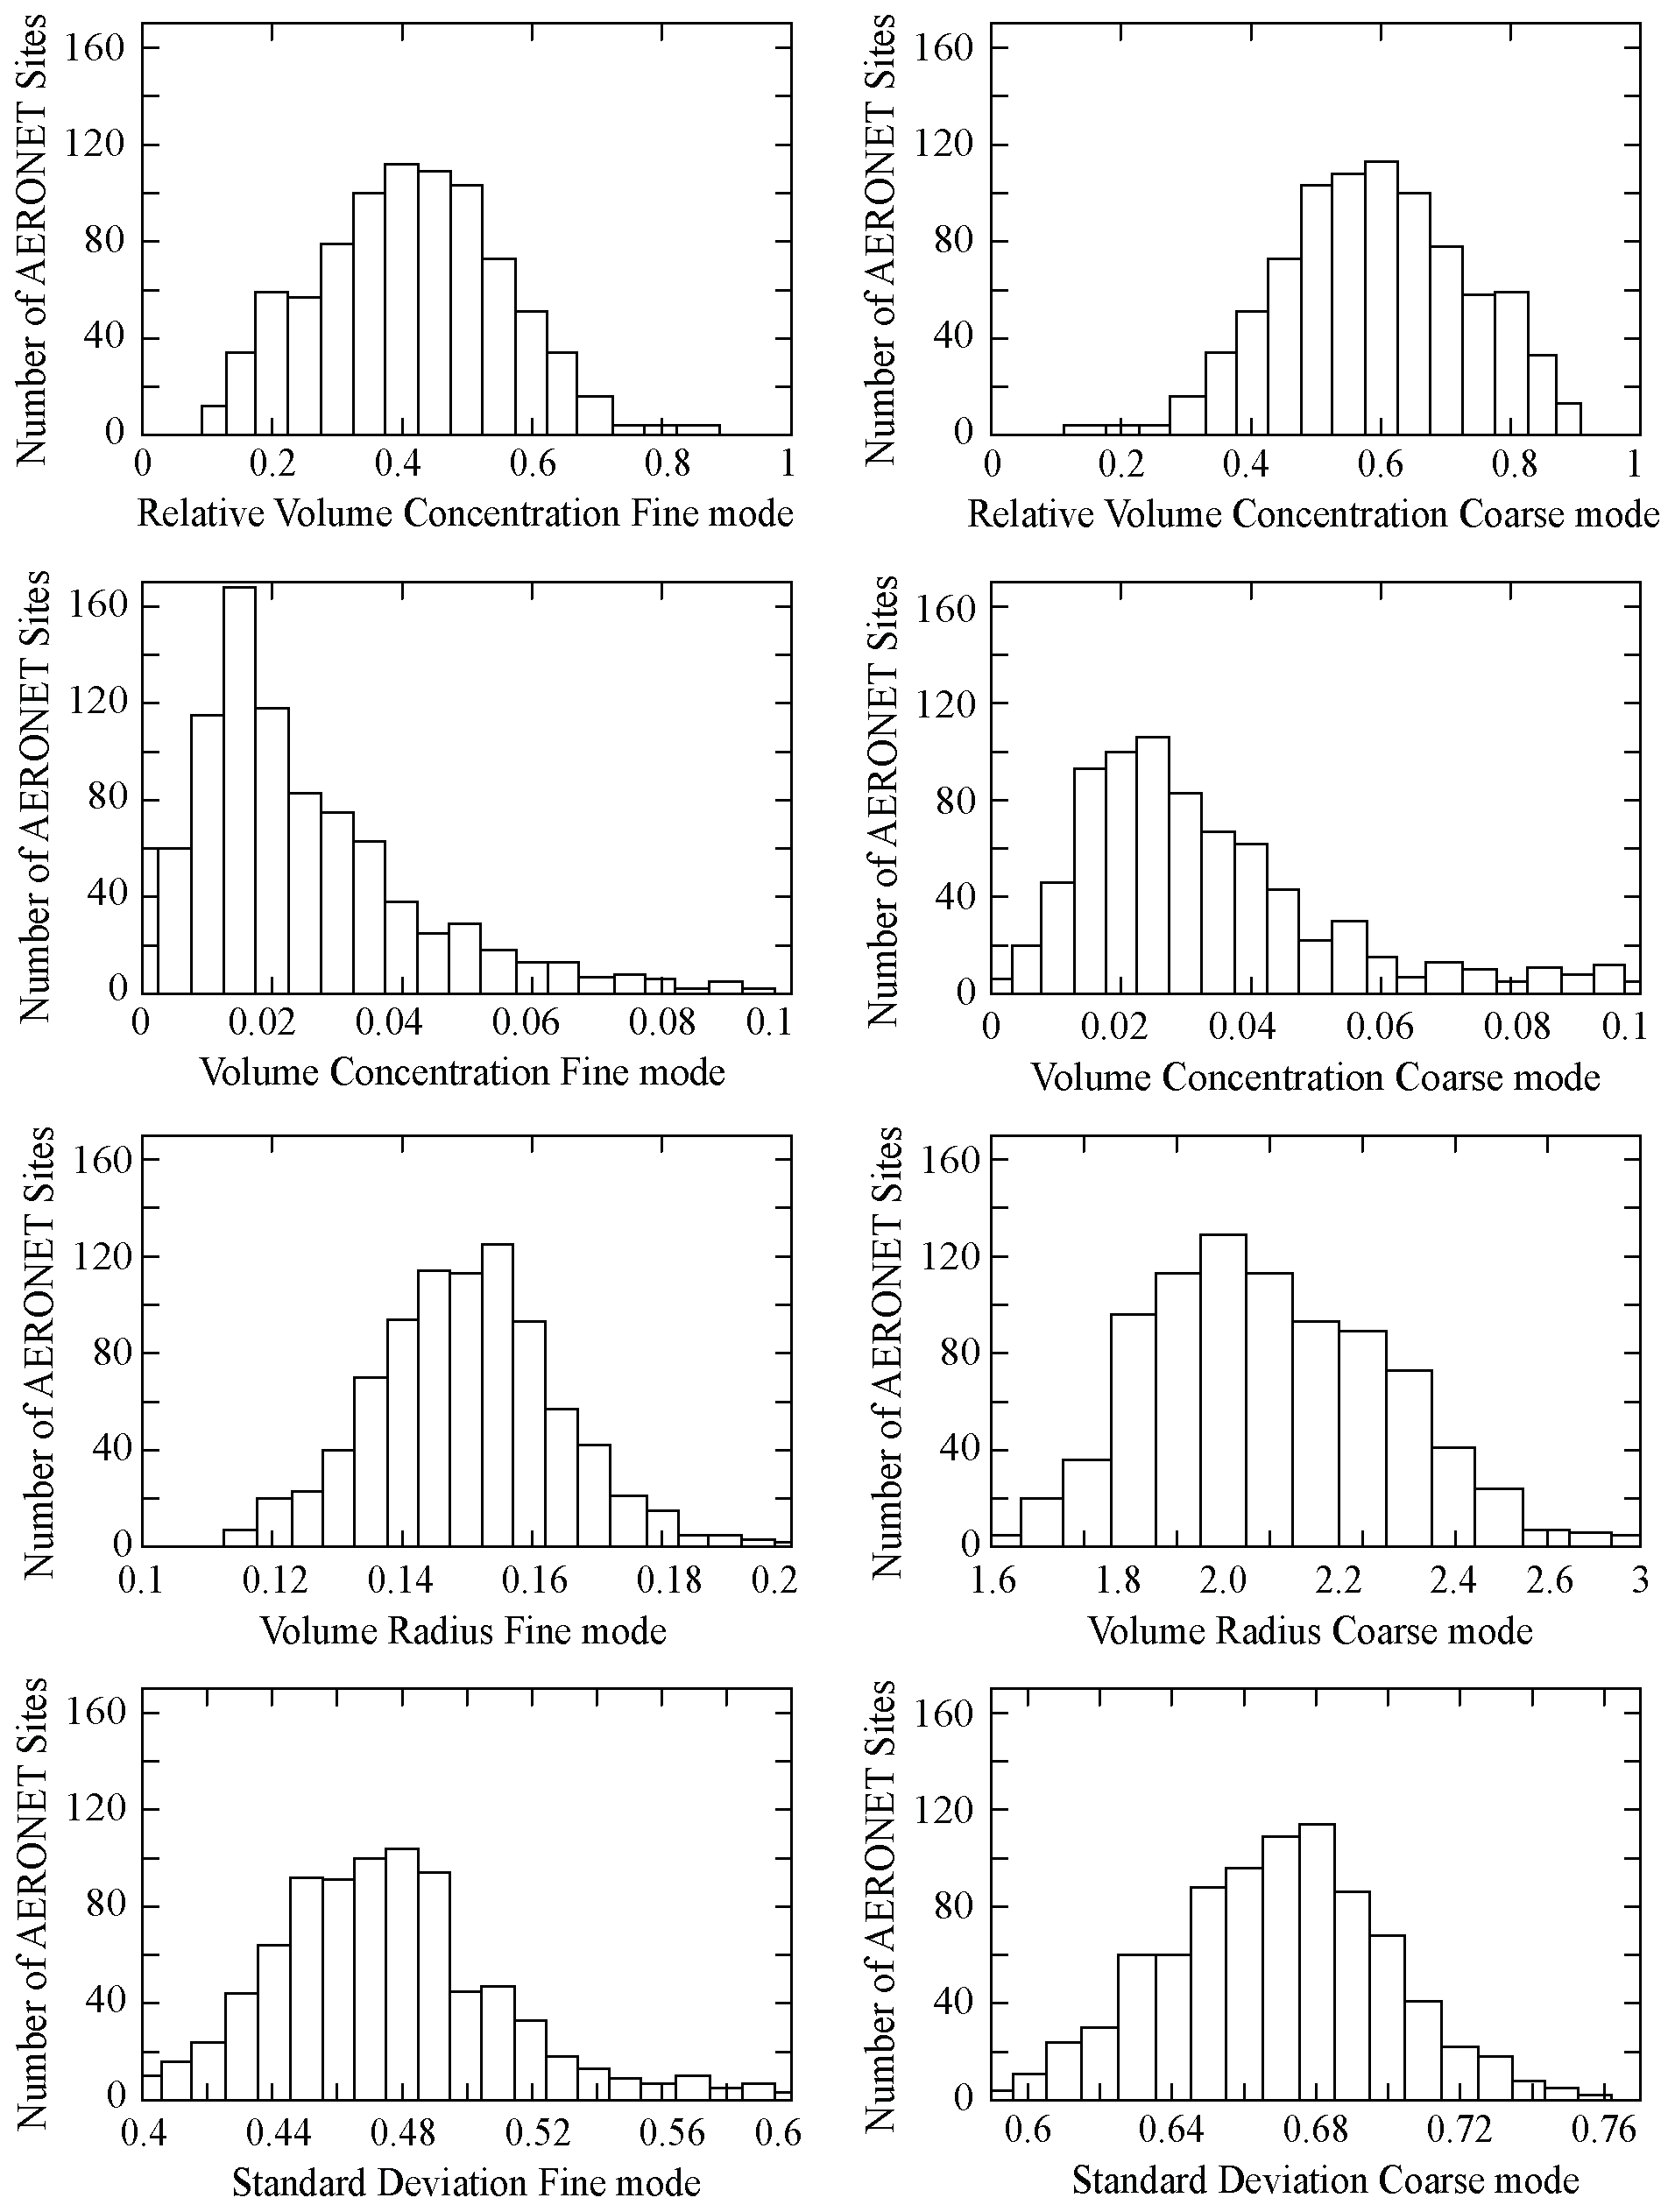
Figure 6Size distribution parameter frequency for the fine mode (left) and the coarse mode (right).
2.3 Metrics used
The results of the retrievals are evaluated using three performance metrics – accuracy (A), precision (P), and uncertainty (U):
-
The accuracy A represents the average bias of the estimates;
-
The precision P is the deviation around the mean value;
-
The uncertainty U encompasses all errors and is derived from A and P;
where Ci is the computed value with our proposed model, Ri is the reference values, and N is the number of data.
The relative uncertainty is defined here as , where V can be the mean value of a specific site or of the whole set of a specific parameter.
3.1 Parameterization of the aerosol microphysical properties
Two measurements protocols are followed to acquire AERONET data. The aerosol optical thicknesses (AOT) is regularly measured every 15 min following a direct measurement of the sun when cloud-free. For the retrieval of the aerosol model microphysical properties, as specified above, the protocol required an almucantar measurement (Holben et al., 1998; Dubovik and King, 2000), which is performed early in the morning or late afternoon. The main issue is that this AERONET measurement might not be coincident with the Earth observation satellites' overpass times. Moreover, for various reasons (e.g., inhomogeneous sky, small clouds, calibration procedure) some measurements might be missing. We can obviously interpolate data between two available measurements, but we miss the variability in the considered aerosols. As an illustration, Fig. 9 shows an example of the impact of changing the aerosol model for size distribution from early morning (07:21:30 local time, LT) to late afternoon (16:28:45 LT). In this example, there is an increase in coarse aerosols between the morning and the evening, but we do not exactly know when that occurred.
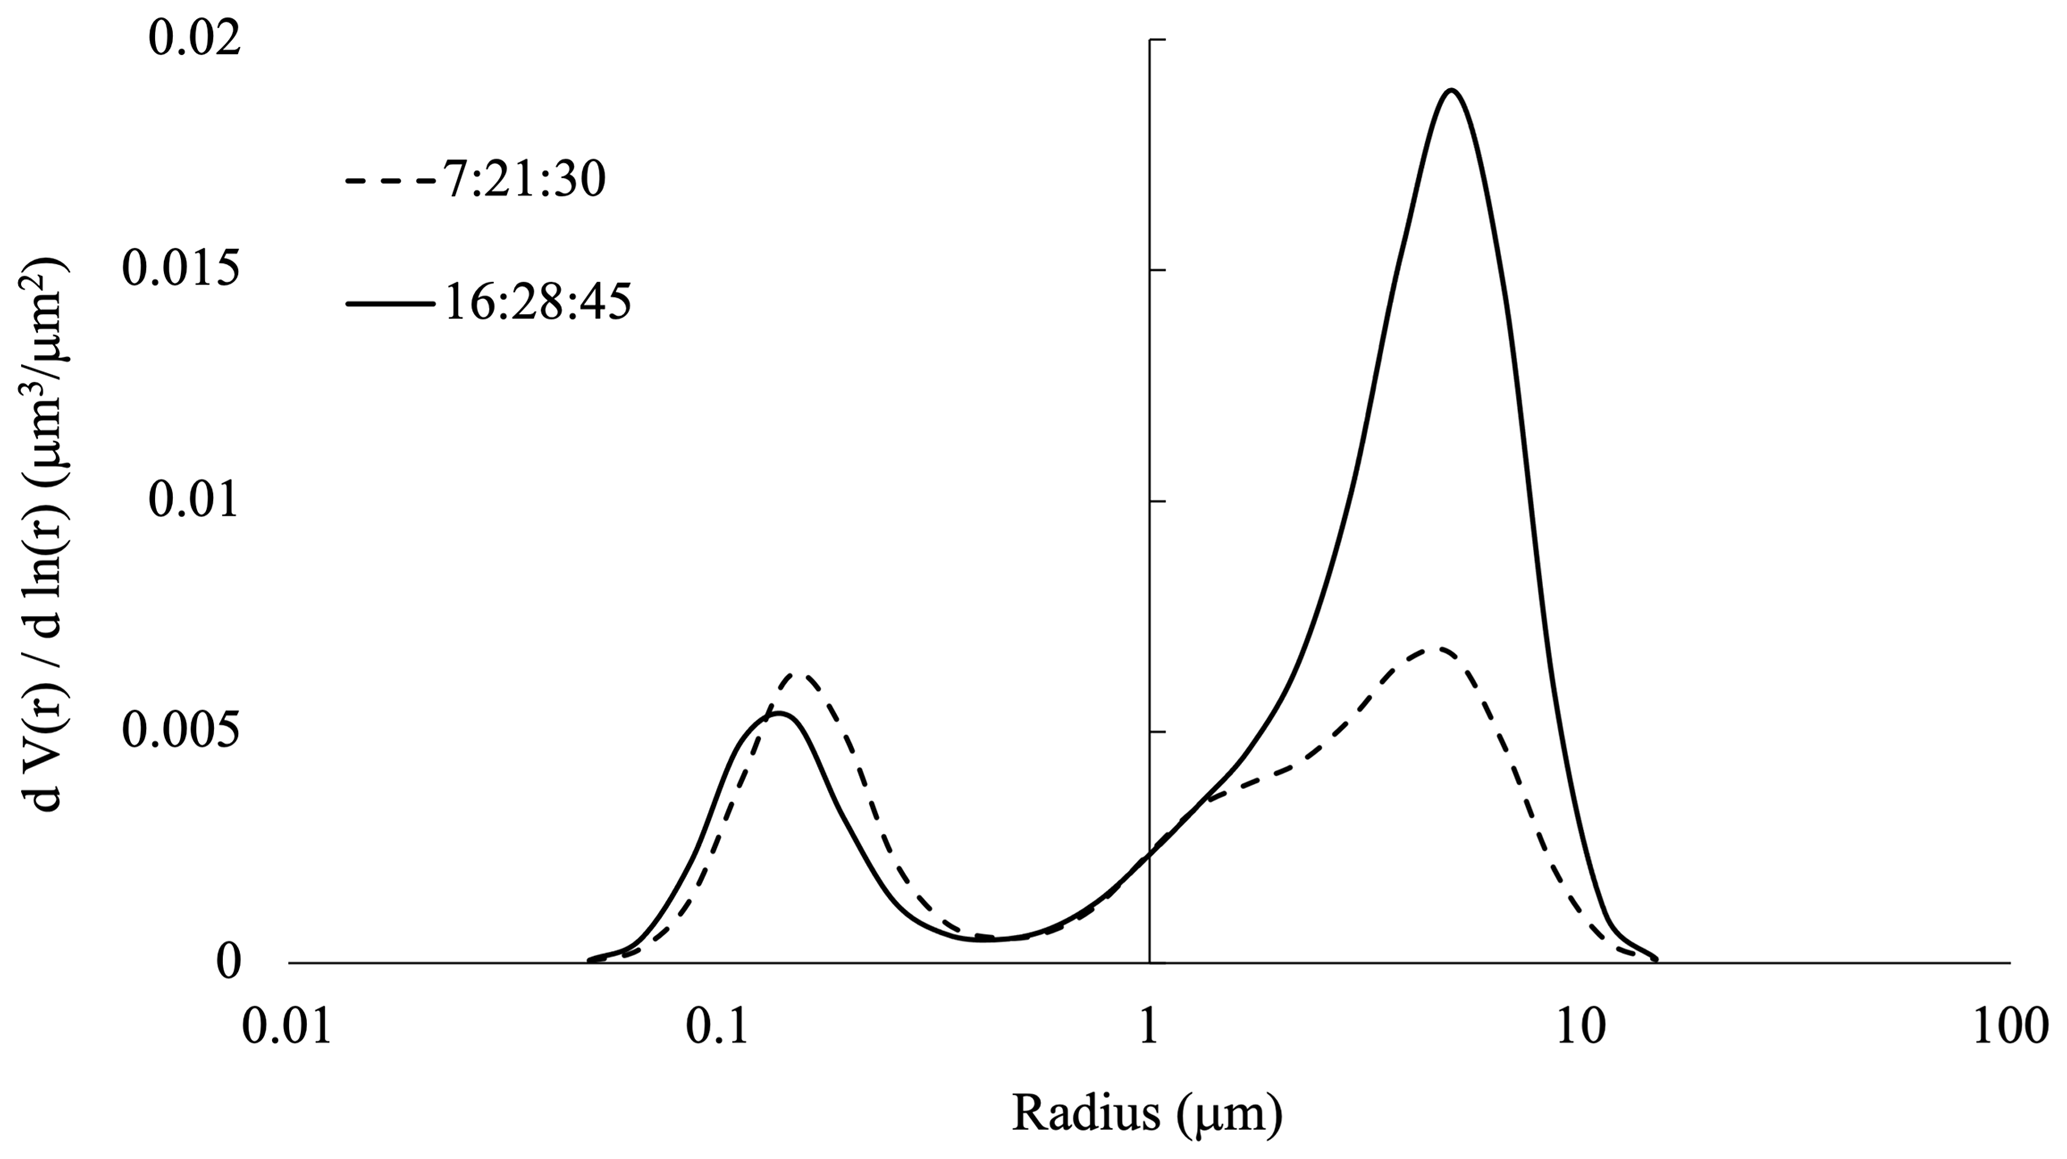
Figure 9Example of an aerosol size distribution from AERONET with a change between two almucantar procedures occurring between the early-morning and late-afternoon observations (data acquired at the Aubiere site in July 2014).
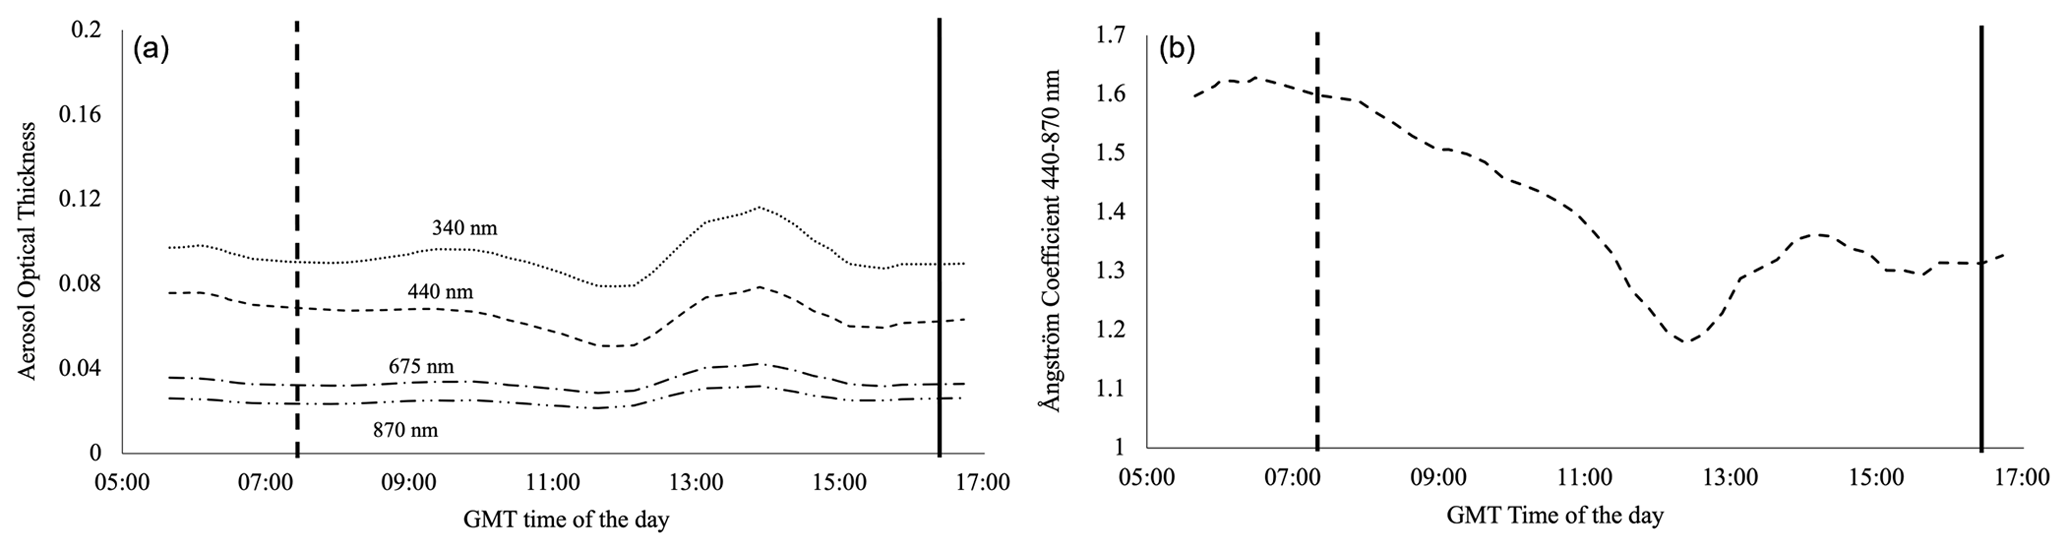
Figure 10Daily variability in the aerosol optical thickness (a) and of the Ångström coefficient between 440–870 nm (b) for the example of Fig. 9 (data acquired at the Aubiere site in July 2014).
In 2002, Dubovik et al. (2002a) suggested to determine each microphysical parameter with a direct regression (Eq. 5) using the aerosol optical thickness at 440 nm from the AERONET dataset.
For each AERONET site, this approach has been used so far for the official validation of the MODIS and VIIRS surface reflectance products (Vermote et al., 2002, 2014), for the NASA HLS (Harmonized Landsat Sentinel-2) project (https://earthdata.nasa.gov/esds/harmonized-landsat-sentinel-2, last access: 1 March 2022; Claverie et al., 2018; Vermote et al., 2016), and for the CEOS ESA–NASA ACIX exercise (Doxani et al., 2018). Our objective here is to better account for the temporal and spatial variability in the aerosol microphysical parameters, which cannot be only related to the aerosol optical thickness itself. In an operational context, another possible and simple variable available for the aerosol description is the Ångström coefficient α (Ångström, 1929). Indeed, it is well accepted that this coefficient is related to the aerosol size (which is important in terms of light–matter interaction). If we take the example given in Fig. 9, we can see from Fig. 10 that the aerosol optical thickness does not change between the two almucantar procedures, while the Ångström coefficient does. The value of the latter decreases, indicating a bigger particle represented by a bigger coarse mode, which is consistent with Fig. 9. Another reason to select a multiplication of the optical thickness τ and the Ångström coefficient α is conceptual. The aerosol optical thickness τ is an extensive parameter, the Ångström coefficient α is an intensive parameter, and it is preferable to have a multiplication of a couple of intensive and extensive variables in physical parametrization as their multiplication remains an extensive parameter. Indeed, an intensive parameter can be used for identifying a sample, while an extensive parameter can be used for describing this sample.
We decided to select the Ångström coefficient for the 440 and 870 nm wavelengths, i.e., α440–870. Even if the Ångström coefficient has a dynamic behavior over the visible range, and it is not entirely constant, α440–870 is a good compromise between all values. At the end, we selected τ440 and α440–870 as variables of the regression. Within the AERONET network, these variables are available every 15 min under clear-sky conditions for all sites.
We can also use the water vapor content as it is a very important parameter in terms of the microphysical properties. Some aerosols are hydrophilic, and others are hydrophobic. Water vapor also modifies the size of the aerosol and its absorption capacity. We explored this option, but it did not improve the retrieval in terms of uncertainties. The aerosol optical thickness parameter already includes the effect of the water vapor over the aerosol size distribution, and it explains in part why there were no improvements.
One limited aspect of our approach is that these two parameters τ440 and α440–870 directly correspond to the aerosol scattering, and we may not properly characterize the aerosol absorption (Fraser and Kaufman, 1985; Vermote et al., 2007; Russell et al., 2010; Giles et al., 2012; Lenoble et al., 2013; Tsikerdekis et al., 2021). Therefore, the complexity of the radiative transfer through the atmosphere partially allows mitigation of this phenomenon. Indeed, coupling between the scattering and the absorption of light allows us to indirectly capture the aerosol absorption information.
With our AERONET database (over the 400 sites where we have all microphysical properties), we explored several mathematical formulations for a regression between an aerosol microphysical property, called AMP in the following equations, and the two variables τ440 and α440–870. We used a similar idea after Dubovik's law (Eq. 5). We first tested Eq. (5). Then, we tested a linear regression with the Ångström coefficient α440–870.
where i represents one of the microphysical properties (e.g., Cvf, Cvc, %Cvf, %Cvc, rvf, rvc, σr, σc, nr440, nr650, nr850, nr1020, ni440, ni650, ni850, ni1020, %Sph).
Table 3Percentage of occurrence for the aerosol optical thickness τ440 and the Ångström coefficient α440–870 as giving the regression coefficient for each microphysical parameter.
Finally, we tested several mathematical formulations using our two predicted variables, and we found that each aerosol microphysical parameter, AMP, can be optimally described by
In practice, to better use Eq. (7) and for the stability of retrievals, all six coefficients ai, bi, ci, di, ei, and fi are not derived with a single interaction. The aerosol microphysical parameters mainly depend on τ440 or on α440–870 (they rarely depend on both at the same level). Thus, to get a stable retrieval of the six coefficients, we used a so-called residue approach by checking which of the or is the most representative (i.e., with the best regression coefficient) regarding the behavior of the microphysical parameters. Following this procedure, we apply the first regression law or to derive () or (), respectively. Then, according to which one has the best correlation coefficient and using the remaining residue, we apply the second regression law or to derive the missing triplet of coefficients. Table 3 shows the percentage of occurrence for τ440 or α440–870 as the most representative variable for all microphysical parameters and for all available AERONET sites (see Fig. 2).
In Table 3, for 7 of the 11 parameters, α440–870 is more correlated with the microphysical parameter than τ440. This confirms that the use of α is pertinent to define these parameters. As expected, Cvf and Cvc are mostly driven by τ440 (Sinyuk et al., 2020), while %Cvf and %Cvc are driven by α440–870. Parameters Cvf and Cvc, which are extensive parameters, are directly related to the volume loading (mass) of the aerosol and, in the end, to the number of particles (accumulation of particles). Thus, it is not surprising that Cvf is more correlated to τ440 than Cvc. Indeed, we know that the fine mode optically reacts more efficiently in the visible light than the coarse mode in terms of extinction (Van der Hulst, 1981), considering that the number of particles present in the fine mode is usually much higher than the number of particles of the coarse mode. By the same reasoning, %Cvf and %Cvc, which are intensive parameters, are not sensitive to accumulation but rather to the spectral dependency of the aerosol extinction, meaning that %Cvf and %Cvc are more correlated to α440–870. In the AERONET processing, the complex refractive index is applied when the AOT is higher than 0.4 at 440 nm. This limits the variability in terms of AOT and probably artificially increases the occurrence for α440–870.
Table 4Mean relative uncertainties (in percent) for each retrieved aerosol microphysical properties modeled using several mathematical formulations over the whole dataset.
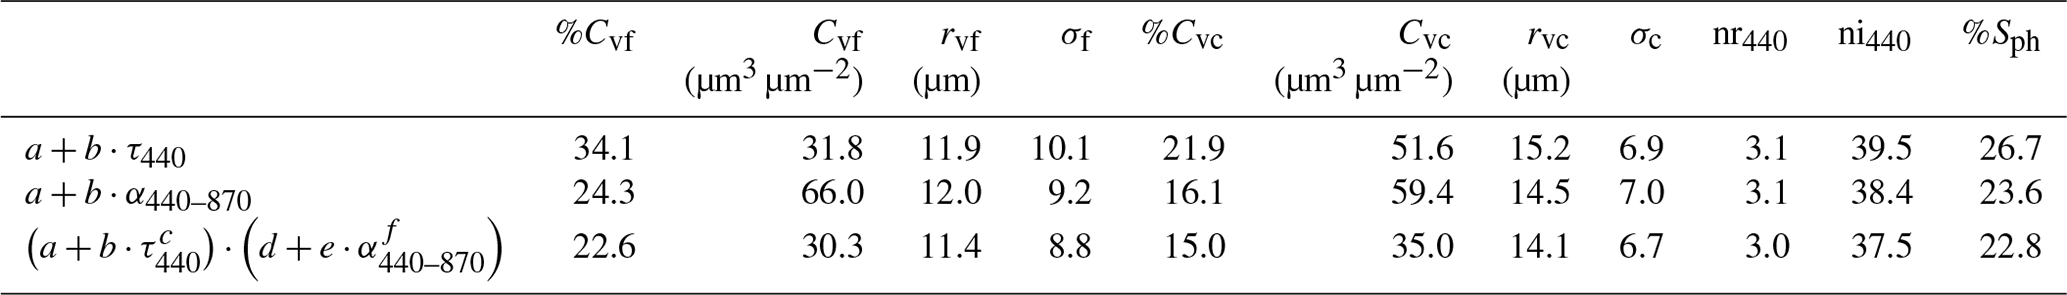
We applied our approach for the three mathematical formulations given by Eqs. (5), (6), and (7) over the whole selected dataset and present the results in Table 4.
In terms of accuracy A (Eq. 2), results show very low values. Except for Cvf, Cvc, and %Cvf, which present an accuracy up to 2 %, accuracies of all other microphysical parameters are below 0.1 %. For uncertainty U (Eq. 4), the third mathematical formulation gives the overall best results (Table 4). As expected, τ440 better represents Cvf, while in contrast α440–870 better represents the %Cvf. Finally, including both variables, we get a non-negligible improvement for both volume concentrations (absolute and relative). For the other microphysical properties, we do not observe much of an improvement, but Eq. (7) gives consistently better results. One point to be noted is that all microphysical properties provided by the AERONET network have lower uncertainties than those presented in Table 4 (Dubovik et al., 2000; Sinyuk et al., 2020).
As pointed out, %Cvf and %Cvc globally present a better uncertainty than for Cvf and Cvc, but for exactly 20 % of the sites the volume concentration of the fine-mode Cvf is more accurate than the relative volume concentration %Cvf (Fig. 11). We are unable to find a clear reason to explain that. The only tiny explanation is that aerosols over these sites present a tendency described by (1) lower concentrations than the average (both fine and coarse modes), meaning relatively low optical thickness; (2) a relatively lower Ångström coefficient; and (3) a relatively lower absorption. Nevertheless, according to the radiative transfer theory used to define the optical properties (phase matrix, scattering and absorption coefficients), the phase matrix is normalized at the end. Thus, either the couple of volume concentrations (Cvf, Cvc) or the couple of relative volume concentrations (%Cvf, %Cvc) can (it should be a couple) be used depending on the uncertainty for one AERONET site. It should be noted that, in all cases, the uncertainty U of %Cvc, , is always lower than that of Cvc, .
Table 5Uncertainties (in percent) for each retrieved aerosol microphysical property model (as for Table 4) but after selecting sites for %Cv with (a; 80 % of cases) and for Cv with (b; 20 % of cases).
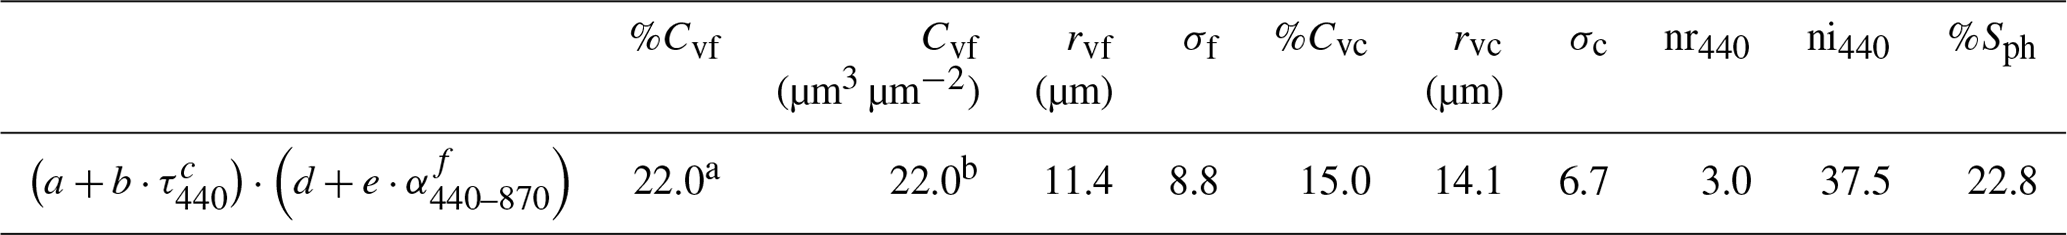
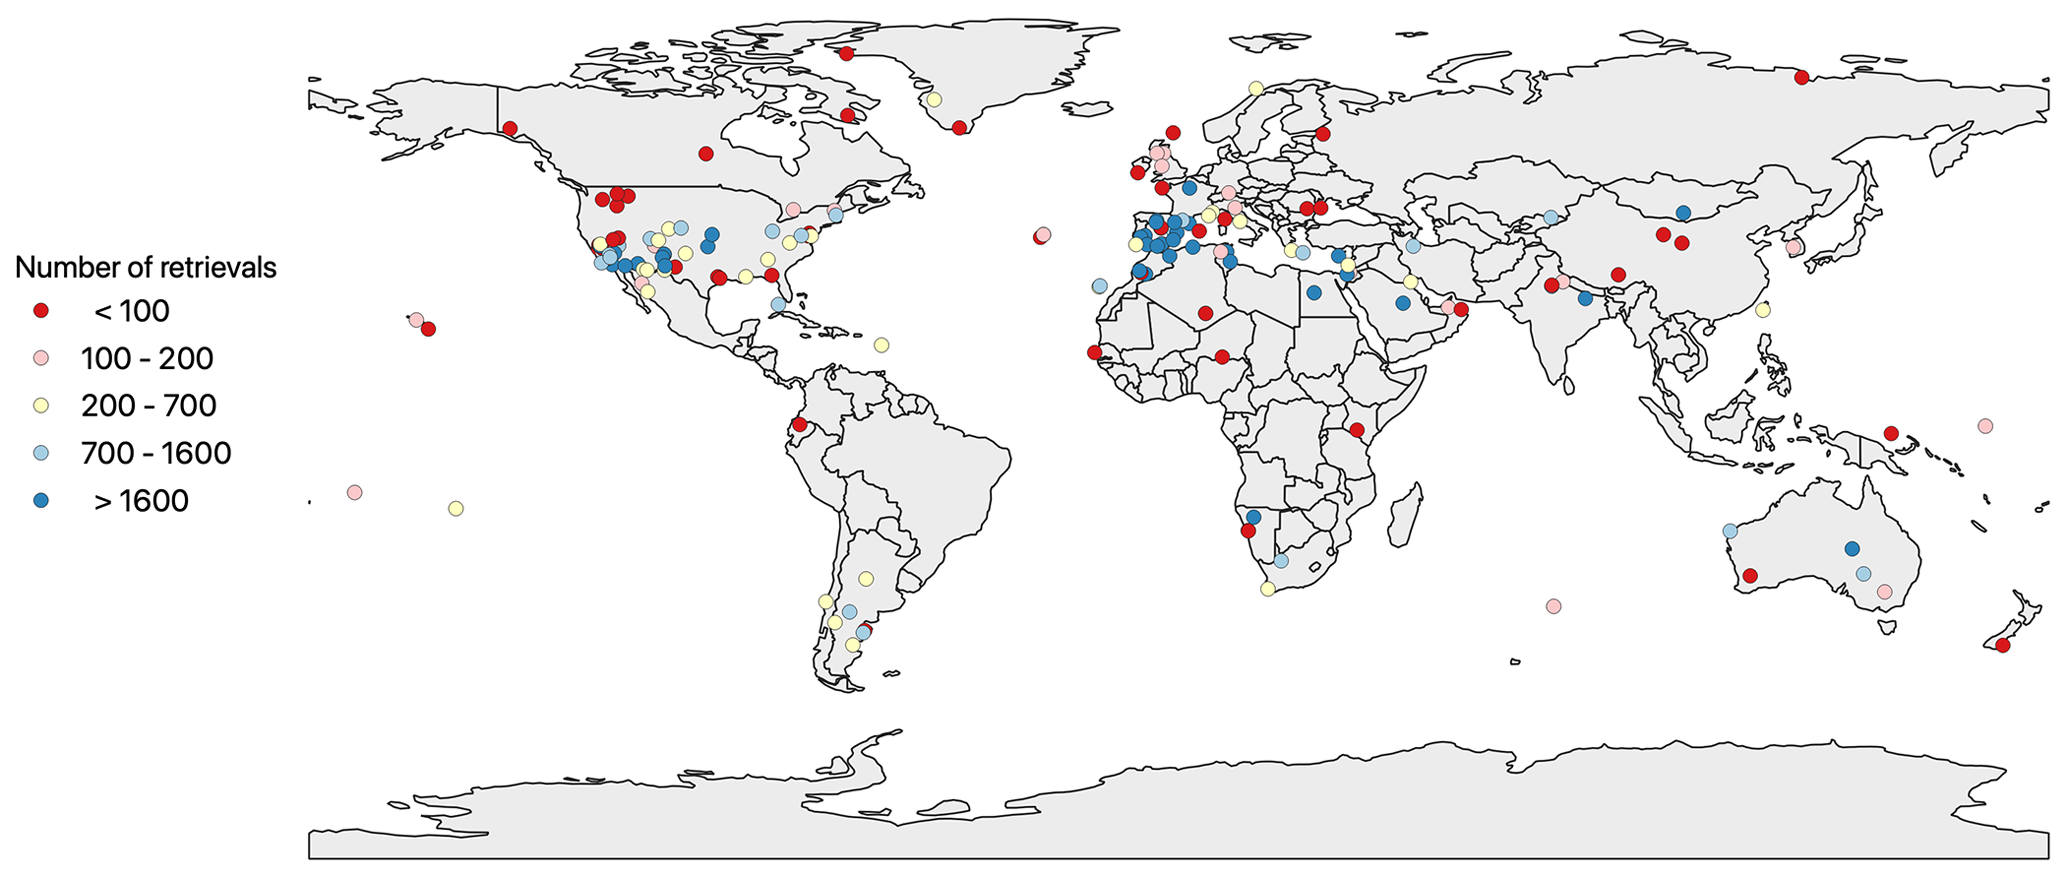
Figure 11AERONET sites for which Cvf is better represented than %Cvf.
Table 5 shows the new uncertainties U of %Cvf, , and the new uncertainties U of Cvf, , when we only select sites for which (80 % of cases) or (20 % of cases), respectively. The improvement is visible if we use both %Cvf and Cvf according to the lowest uncertainties.
As pointed out previously, we have 50 % of sites without any refractive indexes. One solution to improve the number of sites is to define mean parameters (a, b, c, d, e, f) for nr and ni by kind of environment (e.g., urban, urban coastal, forest, non-forest land, desert). In that context, we undertook a preliminary study which included all data independently of the site to retrieve mean parameters. It gave a relative uncertainty U of 3.0 % for nr with no change compared to Tables 4 and 5. In contrast, for ni, it showed a relative uncertainty of 52 % for ni, which is about 40 % higher than those shown in Tables 4 and 5, but this study includes all data without distinguishing the environment. If we are able to specifically define the environment of the missing sites, we should get a relative uncertainty closer to 37.5 % (as indicated in Tables 4 and 5) rather than 52 %. In both cases, the uncertainty remains acceptable.
3.2 Retrieved microphysical properties from the whole dataset
To expand on Table 4, Fig. 12 give the A, P, and U of the retrieved microphysical properties over the whole dataset versus τ440 and α440–870. The interesting point of these figures is the dependency of uncertainties with τ440 and α440–870. Indeed, except for Cvf and Cvc, uncertainties are quite stable with the aerosol optical thickness. In contrast, most uncertainties present variation with the Ångström coefficient. This confirms the importance of considering α440–870 in the regression. Another point is the correlation between Tables 4 and 5 and Fig. 12. When the variability in the uncertainty with α440–870 is important (Fig. 12), the variability in the microphysical properties is more important as well (Tables 4 and 5). It should be noted that for %Cvf and for Cvf, the A, P, and U are for selected sites only (see Table 5).

Figure 12A, P, and U for the retrieval of each microphysical parameter (from top to bottom: the eight parameters describing the size distribution of fine and coarse modes, the two parameters for the refractive index at 440 nm, and the parameter for the sphericity) versus the aerosol optical thickness at 440 nm (left) and the Ångström coefficient between 440 and 870 nm (right). “Total Unc” represents the total uncertainty in the microphysical parameter.
3.3 Retrieved microphysical properties considering each AERONET site
The use of α440–870 mostly improves the retrieval of both %Cvf and %Cvc (Tables 4 and 5). Figure 13 shows the comparison between uncertainties in %Cvf and %Cvc using Eq. (5) or (7) versus the mean value of %Cvf and %Cvc for each AERONET site (one dot represents one AERONET site). For %Cvf, we only consider sites where . These figures highlight the improvement of retrievals (about less). We can also point out that relative uncertainties are lower for high and low values of %Cvf.
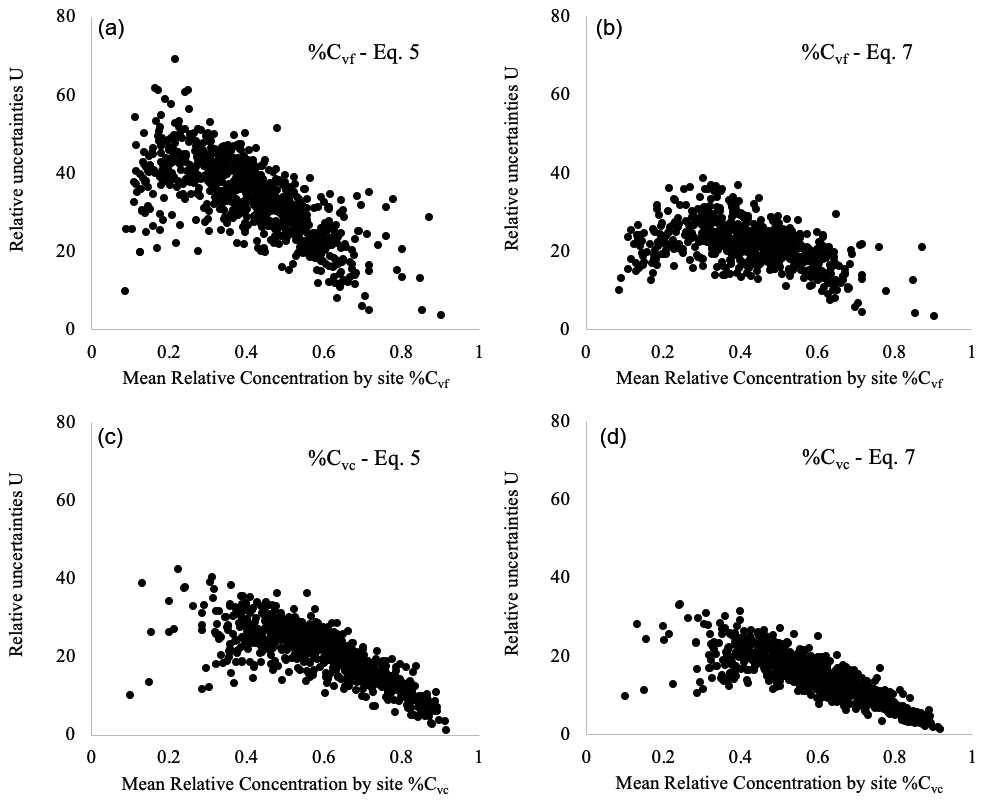
Figure 13Comparison of the relative uncertainties (%) when using Eq. (5) (a, c) and Eq. (7) (b, d) to derive %Cvf and %Cvc. One point corresponds to one AERONET site.
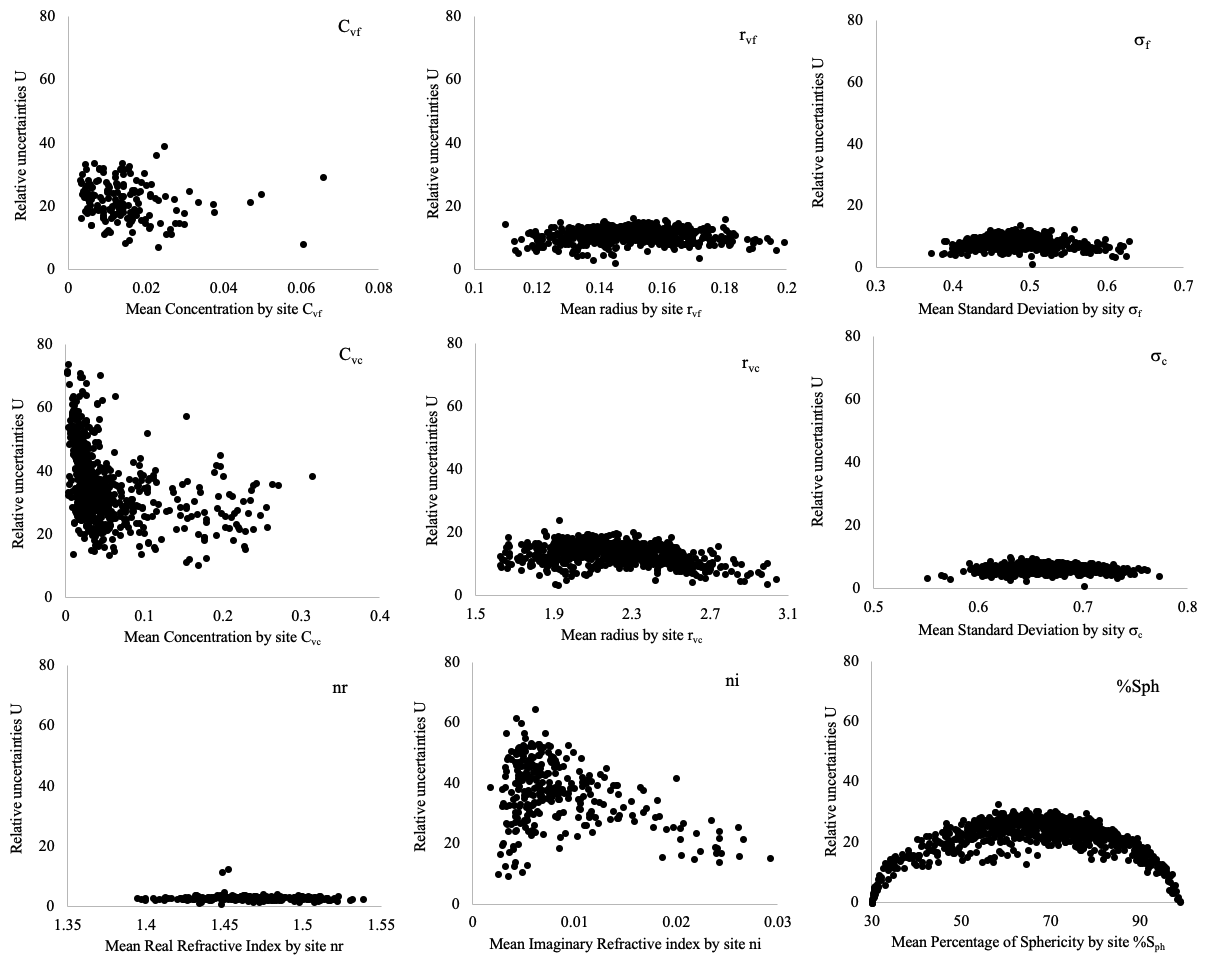
Figure 14Relative uncertainties in the aerosol microphysical properties versus the property itself using Eq. (7) (one point corresponds to one AERONET site).
Figure 14 gives the relative uncertainty for the other microphysical properties site by site, but only using Eq. (7) (for Cvf, we only consider sites where ). Again, except for the volume concentration Cvf and Cvc, we can notice the “arch” effect generating a lower relative uncertainty for lower values and for higher values of the considered properties. It is not shown here, but this arch effect is even more important with absolute uncertainties. At the end, we are able to characterize the uncertainties for each aerosol microphysical property and for each AERONET site.
3.4 Impact of the uncertainties on the surface reflectance product over land
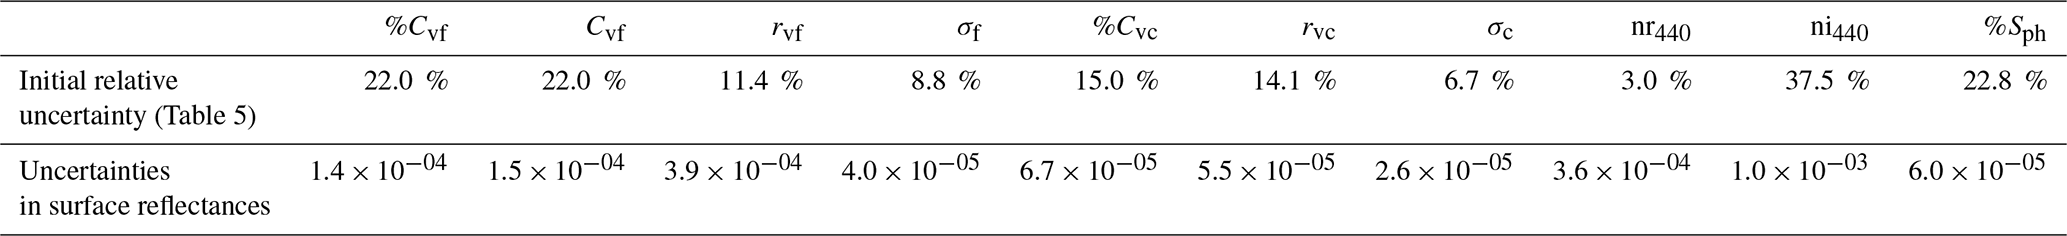
As previously mentioned, this work is meant to support atmospheric correction validation over land. Thus, one question is how the uncertainty in the retrieved aerosol microphysical property affects the surface reflectance product validation. To address this issue, we decided to define, for each aerosol microphysical property, the impact of its uncertainty (Table 5) on the atmospheric correction and the determination of the surface reflectance over land. For that purpose, we defined a synthetic database of TOA reflectances for each AERONET site and for each specific satellite band. To generate this database, we used the 6S code (Vermote et al., 1997; Kotchenova et al., 2006, 2008; Kotchenova and Vermote, 2007) with the following inputs: (1) a set of 80 viewing conditions (solar angle, view angle, azimuth angle) describing all satellite angular configurations possible, (2) a set of different atmospheres (pressure, temperature, water vapor), (3) a set of surface reflectances (from 0 to 0.6 depending on the wavelength), and (4) a set of 40 aerosol microphysical properties with associated τ440 and α440–870 picked up in the real AERONET database. Then, we applied the atmospheric scheme developed for the land surface reflectance code (LaSRC) algorithm for MODIS, VIIRS, Landsat 8, and Sentinel-2 (Vermote et al., 2002, 2014, 2016; Claverie et al., 2018; Doxani et al., 2018). First, using each set of inputs, we computed the TOA reflectance. Then, inducing 20 cases of random uncertainties for each aerosol microphysical property, we applied an atmospheric correction to get the surface reflectance ρsurf to be compared to the one used as input. Table 6 gives the uncertainties we get for the MODIS red channel (band 1, 620–670 nm). For example, %Cvf is generated with an uncertainty of 22.0 %. This uncertainty generates, once we proceed with an atmospheric correction scheme, an uncertainty of 0.00014 in the surface reflectance (in reflectance units). The main relative uncertainty appears for the uncertainty Uni440 of the imaginary part of the refractive index (relies on the aerosol absorption), 1.0 × 10⁻³ in terms of surface reflectance, followed by the uncertainty in the radius of the fine mode. In a decreasing order of magnitude, and appear around lower. Then, another step below, and appear.
Table 6Surface reflectance uncertainties (for the MODIS red channel) due to the initial aerosol model uncertainties (in reflectance units).
Many atmospheric correction schemes use a blue channel to retrieve the aerosol properties, so it is interesting to assess the impact of the aerosol model with the atmospheric reflectance in the blue channel. Figure 15 shows, for an example with the MODIS blue channel (band 3), the dependency between the uncertainties in ρsurf in the red channel and the atmospheric reflectance in the blue channel. This uncertainty is always low, below 0.005, for a range of reasonable atmospheric reflectance values. This figure also shows that this aerosol reflectance in the blue channel is almost linearly correlated to the uncertainties in the surface reflectance in the red channel. This means that a QA flag can be directly defined using the atmospheric reflectance in the blue channel rather than the optical thickness (Vermote et al., 2002, 2014).
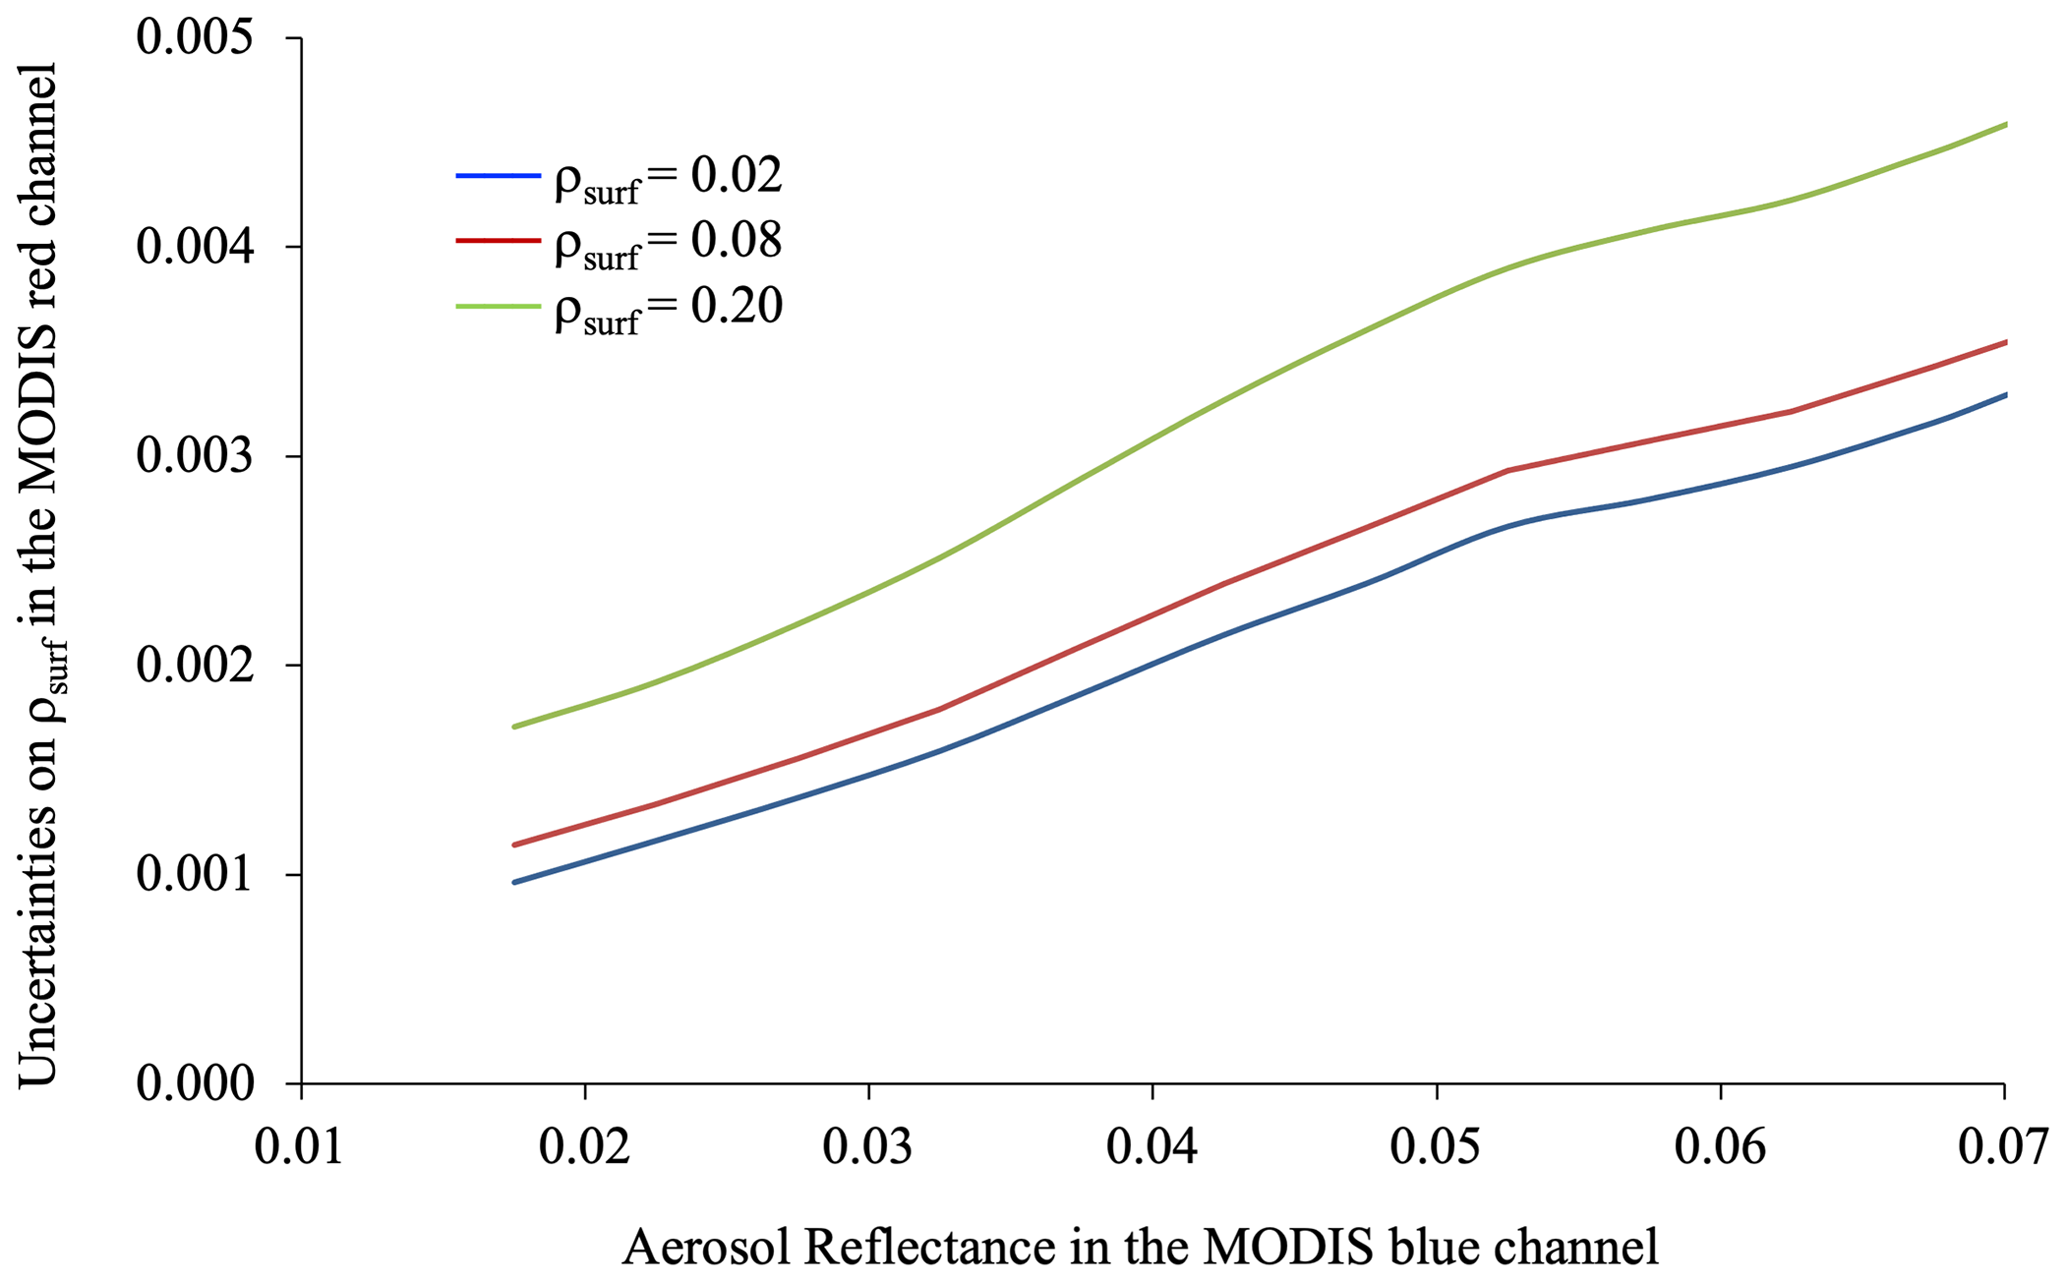
Figure 15Uncertainties in ρsurf in the MODIS red channel versus the aerosol reflectance in the MODIS blue channel.
Finally, Fig. 16 represents, in the end, the impact of the aerosol model uncertainties retrieved using Eq. (7) on the surface reflectance retrieval ρsurf in the MODIS red spectral band. Uncertainties, shown for two ranges of aerosol optical thicknesses at 550 nm (τ550; less than 0.25 and less than 0.50), are clearly always below the MODIS specification required for the surface reflectance (0.005 + 0.05∗ρsurf). For ρsurf ranged between 0.10 and 0.40, the uncertainty in ρsurf is relatively between 1 % and 2 %.
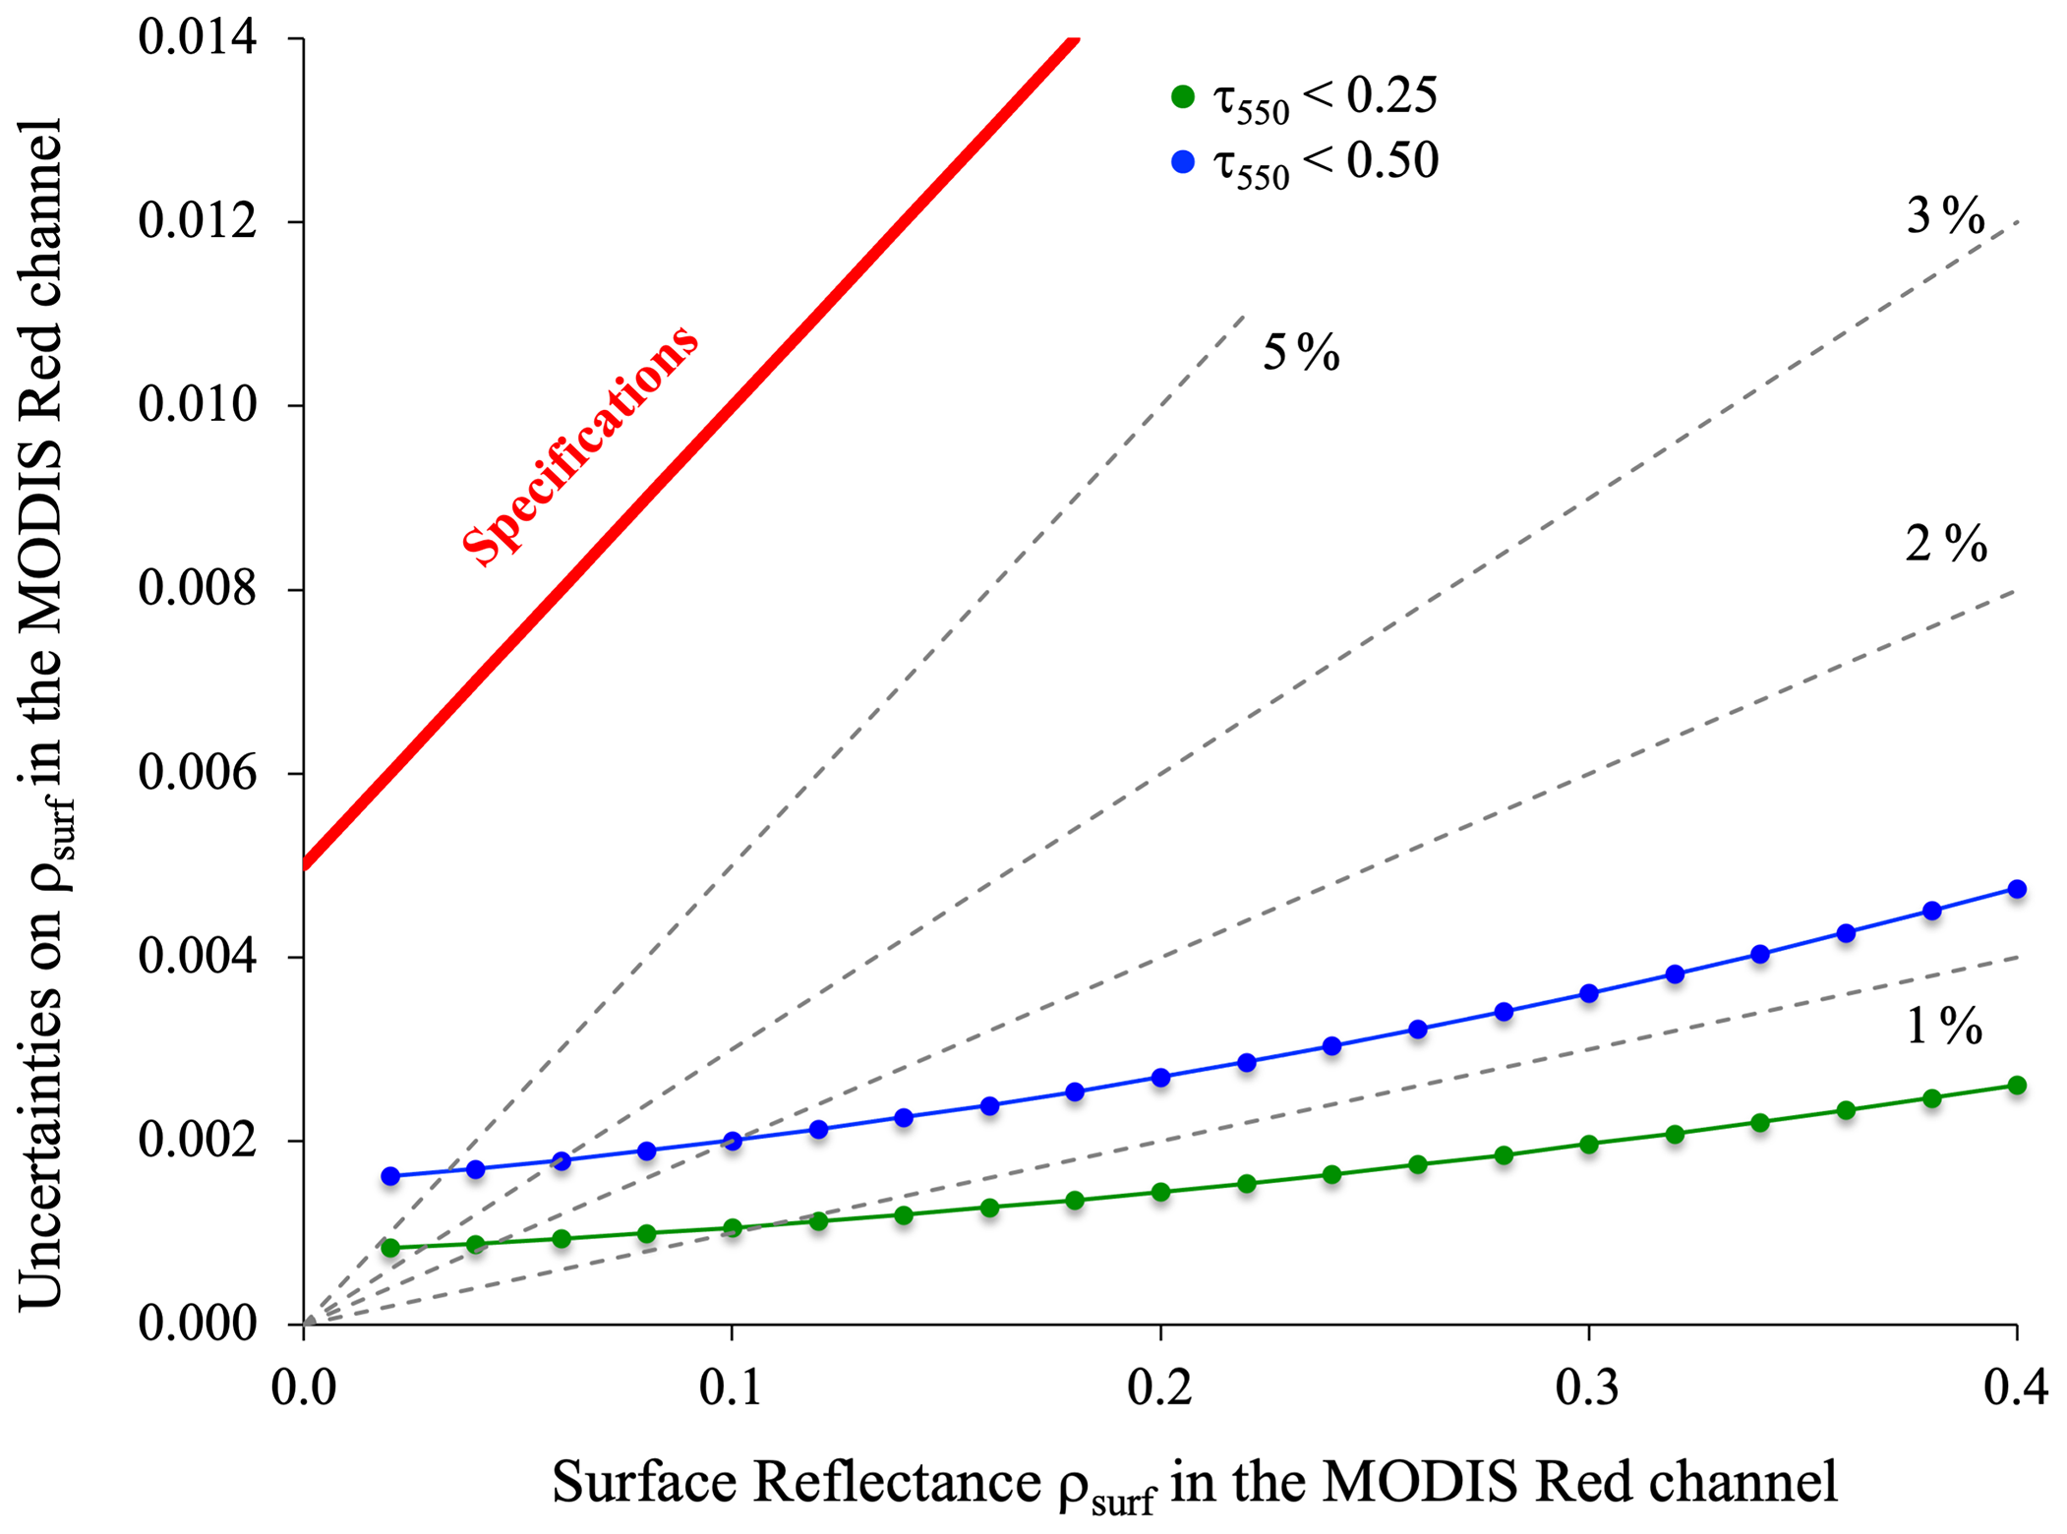
Figure 16Uncertainties in ρsurf versus ρsurf in the MODIS red channel. Green and blue lines correspond to the uncertainties for two ranges of aerosol optical thicknesses at 550 nm (< 0.25 and 0.5). Relative uncertainties in ρsurf (1 %, 2 %, 3 %, and 5 %) are highlighted in dotted lines. The red line indicates the MODIS specifications for surface reflectance retrieval.
This confirms that our aerosol model description for the AERONET sites can be used with good confidence for the satellite atmospheric correction.
This study was aimed at defining and building an aerosol model based on the microphysical parameters obtained for 851 AERONET sites. The AERONET network provides the aerosol microphysical parameters during the almucantar procedures (early morning, late afternoon), which might not be at the time when a satellite passes over an AERONET site. Thus, we upgraded the methodology used by Dubovik et al. (2002a) to define the aerosol microphysical parameters and then the aerosol optical properties. Using the optical thickness at 440 nm τ440 and the Ångström coefficients α440–870 of aerosols, we characterized each microphysical parameter of the aerosols (Cvf, Cvc, %Cvf, %Cvc, rvf, rvc, σr, σc, nr440, nr650, nr850, nr1020, ni440, ni650, ni850, ni1020, %Sph) for each AERONET site. Compared to initial values, retrievals of the microphysical parameters are done with an acceptable uncertainty (from 6.6 % to 20.7 %), with the imaginary part of the refractive index being the least well-rendered parameter (less than 40 %), which is not a surprise since this parameter is the most difficult to retrieve from optical measurements. The study shows different behaviors according to the value of each microphysical parameter, showing an arch effect resulting from lower uncertainty for the highest values and the lowest values of the microphysical parameters.
One use of this characterization is the validation of spaceborne remote sensing sensor products, in particular for the validation of the atmospheric correction over land, but this can be extended to other applications requiring aerosol information. In terms of atmospheric correction over land, this method can be used to define a surface reflectance reference as we do for the validation of surface reflectance products for sensors such as MODIS, VIIRS, Landsat, and Sentinel-2. An impact study of the uncertainties in each aerosol microphysical parameter showed that the aerosol models used to define a reference surface reflectance provide a maximum uncertainty always lower than 0.004 (in reflectance units) or of 1 % to 3 % (for surface reflectance higher than 0.05 in the MODIS red channel), well below the specifications often used for atmospheric correction. It is worth emphasizing that the imaginary part of the aerosol refractive index generates the more important uncertainties (0.001 in reflectance units) and corresponds to a major part of the total uncertainty. Nevertheless, it will be important to further test these findings using additional datasets for validation (number of sites and number of comparisons).
To test the ability of the optical thickness and the Ångström coefficient to be reliable for reproducing the aerosol models, we used a nonparametric approach. A random forest (RF) regression model was built with AOT and Ångström coefficient as inputs and all other parameters as outputs (dependent variables). The data were randomly split into training (50 %) and test sets. The split was done in order to analyze the robustness of the model. The performance of the model (A, P, and U diagram) was assessed on testing data. The RF model had 100 trees, and the maximum depth of the trees was limited to 15 to avoid overfitting.
Figure A1 gives examples of results of this nonparametric approach (for parameters describing the fine mode of the size distribution only, but the conclusion can be generalized to all microphysical parameters). Comparing to Fig. 12, we have similar results for presented examples of retrieved microphysical properties. This indicates that the use of the optical thickness τ440 and the Ångström coefficient α440–870 is consistent.
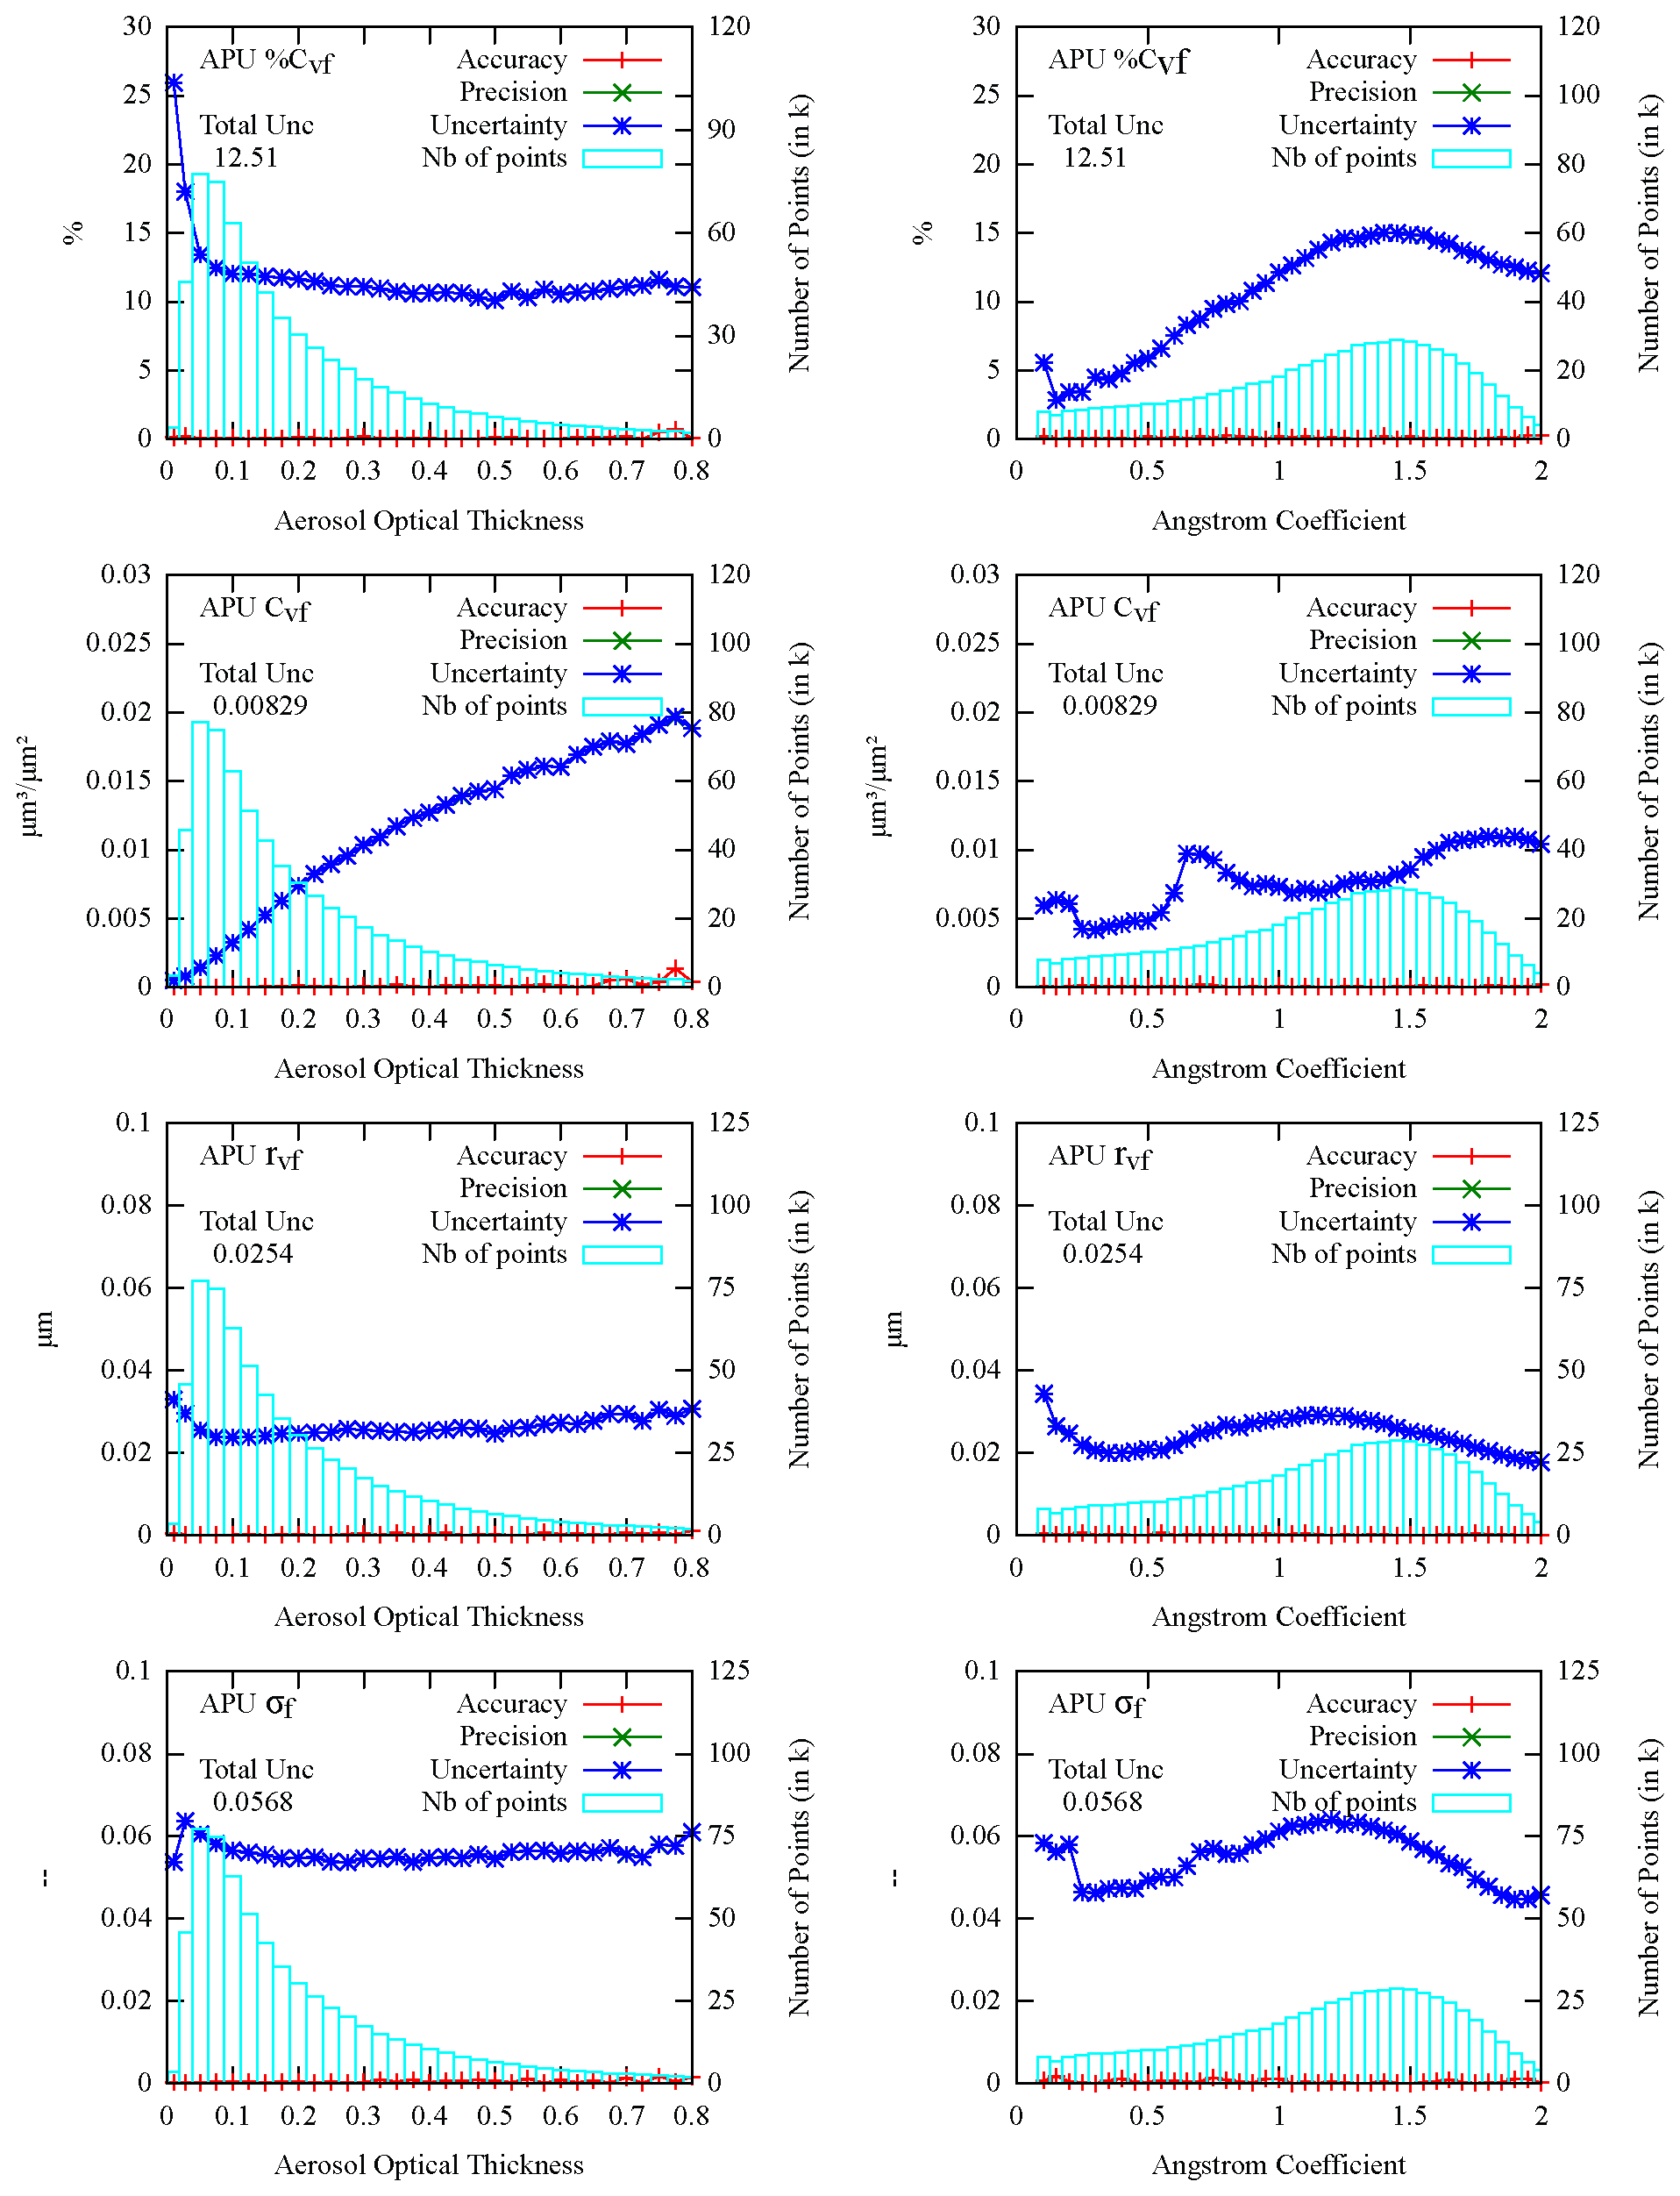
Figure A1A, P, and U for each microphysical parameter (fine mode of the size distribution only) retrieved from a random forest approach versus the aerosol optical thickness at 440 nm (left) and the Ångström coefficient between 440 and 870 nm (right).
Data and all ai, bi, ci, di, ei, and fi coefficients are currently available from our website at https://salsa.umd.edu (SALSA, 2022) and are also available on request to the correspondence author.
JCR and EV conceptualized the study and developed the methodology. JCR, SS, and EM processed the data. JCR, EV, SS, OD, NK, and BK contributed to the data analysis. BH provided the data. All contributed to an internal review of the manuscript.
At least one of the (co-)authors is a member of the editorial board of Atmospheric Measurement Techniques. The peer-review process was guided by an independent editor, and the authors also have no other competing interests to declare.
Publisher's note: Copernicus Publications remains neutral with regard to jurisdictional claims in published maps and institutional affiliations.
We thank all AERONET PIs and their staff for establishing and maintaining all sites used in this investigation. Thanks to Chris Justice, professor at the University of Maryland, for his helpful comments on drafts of the paper and for supporting this project.
This research has been supported by NASA (grant nos. NNX17AJ63A and 80NSSC19M0222).
This paper was edited by Marloes Penning de Vries and reviewed by two anonymous referees.
Andreae, M. O., Artaxo, P., Brandão, C., Carswell, F. E., Ciccioli, P., da Costa, A. L., Culf, A. D., Esteves, J. L., Gash, J. H. C., Grace, J., Kabat, P., Lelieveld, J., Malhi, Y., Manzi, A. O., Meixner, F. X., Nobre, A. D., Nobre, C., Ruivo, M. d. L. P., Silva-Dias, M. A., Stefani, P., Valentini, R., von Jouanne, J., and Waterloo, M. J.: Biogeochemical cycling of carbon, water, energy, trace gases, and aerosols in Amazonia: The LBA-EUSTACH experiments, J. Geophys. Res.-Atmos., 107, 8066, https://doi.org/10.1029/2001JD000524, 2002.
Ångström, A.: On the Atmospheric Transmission of Sun Radiation and on Dust in the Air, Geogr. Ann., 11, 156–166, https://doi.org/10.1080/20014422.1929.11880498, 1929.
Badawi, M., Helder, D., Leigh, L., and Jing, X.: Methods for Earth-Observing Satellite Surface Reflectance Validation, Remote Sens., 11, 1543, https://doi.org/10.3390/rs11131543, 2019.
Bohren, C. F., Huffmann, D. R., and Clothiaux, E. E.: Absorption and scattering of light by small particles, 2nd Edn., Wiley-Vch Verlag Gmbh, 700 pp., ISBN 978-3-527-40664-7, 2016.
Bond, T. C., Doherty, S. J., Fahey, D. W., Forster, P. M., Berntsen, T., DeAngelo, B. J., Flanner, M. G., Ghan, S., Kärcher, B., Koch, D., Kinne, S., Kondo, Y., Quinn, P. K., Sarofim, M. C., Schultz, M. G., Schulz, M., Venkataraman, C., Zhang, H., Zhang, S., Bellouin, N., Guttikunda, S. K., Hopke, P. K., Jacobson, M. Z., Kaiser, J. W., Klimont, Z., Lohmann, U., Schwarz, J. P., Shindell, D., Storelvmo, T., Warren, S. G., and Zender, C. S.: Bounding the role of black carbon in the climate system: A scientific assessment, J. Geophys. Res.-Atmos., 118, 5380–5552, https://doi.org/10.1002/jgrd.50171, 2013.
Boucher, O.: Atmospheric Aerosols: Properties and Climate Impacts, Springer, Dordrecht, 311 pp., https://doi.org/10.1007/978-94-017-9649-1, 2015.
Boucher, O., Randall, D., Artaxo, P., Bretherton, C., Feingold, G., Forster, P., Kerminen, V.-M., Kondo, Y., Liao, H., Lohmann, U., Rasch, P., Satheesh, S. K., Sherwood, S., Stevens, B., and Zhang, X. Y.: Clouds and Aerosols, in: Climate Change 2013: The Physical Science Basis. Contribution of Working Group I to the Fifth Assessment Report of the Intergovernmental Panel on Climate Change, edited by: Stocker, T. F., Qin, D., Plattner, G.-K., Tignor, M., Allen, S. K., Boschung, J., Nauels, A., Xia, Y., Bex, V., and Midgley, P. M., Cambridge University Press, Cambridge, 571–657, 2013.
Bouvet, M., Thome, K., Berthelot, B., Bialek, A., Czapla-Myers, J., Fox, N. P., Goryl, P., Henry, P., Ma, L., Marcq, S., Meygret, A., Wenny, B. N., and Woolliams, E. R.: RadCalNet: A Radiometric Calibration Network for Earth Observing Imagers Operating in the Visible to Shortwave Infrared Spectral Range, Remote Sens., 11, 2401, https://doi.org/10.3390/rs11202401, 2019.
Calvo, A. I., Alves, C., Castro, A., Pont, V., Vicente, A. M., and Fraile, R.: Research on aerosol sources and chemical composition: Past, current and emerging issues, Atmos. Res., 120–121, 1–28, https://doi.org/10.1016/j.atmosres.2012.09.021, 2013.
Claverie, M., Ju, J., Masek, J. G., Dungan, J. L., Vermote, E. F., Roger, J.-C., Skakun, S. V., and Justice, C.: The Harmonized Landsat and Sentinel-2 surface reflectance data set, Remote Sens. Environ., 219, 145–161, https://doi.org/10.1016/j.rse.2018.09.002, 2018.
Contini, D., Vecchi, R., and Viana, M.: Carbonaceous Aerosols in the Atmosphere, Atmosphere, 9, 181, https://doi.org/10.3390/atmos9050181, 2018.
Czapla-Myers, J., McCorkel, J., Anderson, N., Thome, K., Biggar, S., Helder, D., Aaron, D., Leigh, L., and Mishra, N.: The Ground-Based Absolute Radiometric Calibration of Landsat 8 OLI, Remote Sens., 7, 600–626, https://doi.org/10.3390/rs70100600, 2015.
Czapla-Myers, J., Ong, L., Thome, K., and McCorkel, J.: Validation of EO-1 Hyperion and Advanced Land Imager Using the Radiometric Calibration Test Site at Railroad Valley, Nevada, IEEE J. Sel. Top. Appl., 9, 816–826, https://doi.org/10.1109/JSTARS.2015.2463101, 2016.
Derimian, Y., Dubovik, O., Huang, X., Lapyonok, T., Litvinov, P., Kostinski, A. B., Dubuisson, P., and Ducos, F.: Comprehensive tool for calculation of radiative fluxes: illustration of shortwave aerosol radiative effect sensitivities to the details in aerosol and underlying surface characteristics, Atmos. Chem. Phys., 16, 5763–5780, https://doi.org/10.5194/acp-16-5763-2016, 2016.
de Sá, S. S., Rizzo, L. V., Palm, B. B., Campuzano-Jost, P., Day, D. A., Yee, L. D., Wernis, R., Isaacman-VanWertz, G., Brito, J., Carbone, S., Liu, Y. J., Sedlacek, A., Springston, S., Goldstein, A. H., Barbosa, H. M. J., Alexander, M. L., Artaxo, P., Jimenez, J. L., and Martin, S. T.: Contributions of biomass-burning, urban, and biogenic emissions to the concentrations and light-absorbing properties of particulate matter in central Amazonia during the dry season, Atmos. Chem. Phys., 19, 7973–8001, https://doi.org/10.5194/acp-19-7973-2019, 2019.
Doxani, G., Vermote, E., Roger, J.-C., Gascon, F., Adriaensen, S., Frantz, D., Hagolle, O., Hollstein, A., Kirches, G., Li, F., Louis, J., Mangin, A., Pahlevan, N., Pflug, B., and Vanhellemont, Q.: Atmospheric Correction Inter-Comparison Exercise, Remote Sens., 10, 352, https://doi.org/10.3390/rs10020352, 2018.
Dubovik, O. and King, M. D.: A flexible inversion algorithm for retrieval of aerosol optical properties from Sun and sky radiance measurements, J. Geophys. Res.-Atmos., 105, 20673–20696, https://doi.org/10.1029/2000JD900282, 2000.
Dubovik, O., Smirnov, A., Holben, B. N., King, M. D., Kaufman, Y. J., Eck, T. F., and Slutsker, I.: Accuracy assessments of aerosol optical properties retrieved from Aerosol Robotic Network (AERONET) Sun and sky radiance measurements, J. Geophys. Res.-Atmos., 105, 9791–9806, https://doi.org/10.1029/2000JD900040, 2000.
Dubovik, O., Holben, B., Eck, T. F., Smirnov, A., Kaufman, Y. J., King, M. D., Tanré, D., and Slutsker, I.: Variability of Absorption and Optical Properties of Key Aerosol Types Observed in Worldwide Location, J. Atmos. Sci., 59, 590–608, https://doi.org/10.1175/1520-0469(2002)059<0590:VOAAOP>2.0.CO;2, 2002a.
Dubovik, O., Holben, B. N., Lapyonok, T., Sinyuk, A., Mishchenko, M. I., Yang, P., and Slutsker, I.: Non-spherical aerosol retrieval method employing light scattering by spheroids, Geophys. Res. Lett., 29, 54-51–54-54, https://doi.org/10.1029/2001GL014506, 2002b.
Dubovik, O., Herman, M., Holdak, A., Lapyonok, T., Tanré, D., Deuzé, J. L., Ducos, F., Sinyuk, A., and Lopatin, A.: Statistically optimized inversion algorithm for enhanced retrieval of aerosol properties from spectral multi-angle polarimetric satellite observations, Atmos. Meas. Tech., 4, 975–1018, https://doi.org/10.5194/amt-4-975-2011, 2011.
Fraser, R. S. and Kaufman, Y. J.: The Relative Importance of Aerosol Scattering and Absorption in Remote Sensing, IEEE T. Geosci. Remote, GE-23, 625–633, https://doi.org/10.1109/TGRS.1985.289380, 1985.
Fuzzi, S., Baltensperger, U., Carslaw, K., Decesari, S., Denier van der Gon, H., Facchini, M. C., Fowler, D., Koren, I., Langford, B., Lohmann, U., Nemitz, E., Pandis, S., Riipinen, I., Rudich, Y., Schaap, M., Slowik, J. G., Spracklen, D. V., Vignati, E., Wild, M., Williams, M., and Gilardoni, S.: Particulate matter, air quality and climate: lessons learned and future needs, Atmos. Chem. Phys., 15, 8217–8299, https://doi.org/10.5194/acp-15-8217-2015, 2015.
Giles, D. M., Holben, B. N., Eck, T. F., Sinyuk, A., Smirnov, A., Slutsker, I., Dickerson, R. R., Thompson, A. M., and Schafer, J. S.: An analysis of AERONET aerosol absorption properties and classifications representative of aerosol source regions, J. Geophys. Res.-Atmos., 117, D17203, https://doi.org/10.1029/2012JD018127, 2012.
Giles, D. M., Sinyuk, A., Sorokin, M. G., Schafer, J. S., Smirnov, A., Slutsker, I., Eck, T. F., Holben, B. N., Lewis, J. R., Campbell, J. R., Welton, E. J., Korkin, S. V., and Lyapustin, A. I.: Advancements in the Aerosol Robotic Network (AERONET) Version 3 database – automated near-real-time quality control algorithm with improved cloud screening for Sun photometer aerosol optical depth (AOD) measurements, Atmos. Meas. Tech., 12, 169–209, https://doi.org/10.5194/amt-12-169-2019, 2019.
Ginoux, P., Prospero, J. M., Gill, T. E., Hsu, N. C., and Zhao, M.: Global-scale attribution of anthropogenic and natural dust sources and their emission rates based on MODIS Deep Blue aerosol products, Rev. Geophys., 50, RG3005, https://doi.org/10.1029/2012RG000388, 2012.
Hansen, J. E. and Travis, L. D.: Light scattering in planetary atmospheres, Space Sci. Rev., 16, 527–610, https://doi.org/10.1007/BF00168069, 1974.
Helder, D., Thome, K., Aaron, D., Leigh, L., Czapla-Myers, J., Leisso, N., Biggar, S., and Anderson, N.: Recent surface reflectance measurement campaigns with emphasis on best practices, SI traceability and uncertainty estimation, Metrologia, 49, S21–S28, https://doi.org/10.1088/0026-1394/49/2/s21, 2012.
Herman, M., Deuzé, J.-L., Marchand, A., Roger, B., and Lallart, P.: Aerosol remote sensing from POLDER/ADEOS over the ocean: Improved retrieval using a nonspherical particle model, J. Geophys. Res.-Atmos., 110, D10S02, https://doi.org/10.1029/2004JD004798, 2005.
Holben, B. N., Eck, T. F., Slutsker, I., Tanré, D., Buis, J. P., Setzer, A., Vermote, E., Reagan, J. A., Kaufman, Y. J., Nakajima, T., Lavenu, F., Jankowiak, I., and Smirnov, A.: AERONET – A Federated Instrument Network and Data Archive for Aerosol Characterization, Remote Sens. Environ., 66, 1–16, https://doi.org/10.1016/S0034-4257(98)00031-5, 1998.
Hsu, N. C., Si-Chee, T., King, M. D., and Herman, J. R.: Aerosol properties over bright-reflecting source regions, IEEE T. Geosci. Remote, 42, 557–569, https://doi.org/10.1109/TGRS.2004.824067, 2004.
IPCC: Global warming of 1.5 ∘C: an IPCC Special Report on the impacts of global warming of 1.5 ∘C above pre-industrial levels and related global greenhouse gas emission pathways, in the context of strengthening the global response to the threat of climate change, sustainable development, and efforts to eradicate poverty, edited by: Masson-Delmotte, V., Zhai, P., Pörtner, H. O., Roberts, D., Skea, J., Shukla, P. R., Pirani, A., Moufouma-Okia, W., Péan, C., Pidcock, R., Connors, S., Matthews, J. B. R., Chen, Y., Zhou, X., Gomis, M. I., Lonnoy, E., Maycock, T., Tignor, M., and Waterfield, T., World Meteorological Organization, Geneva, Switzerland, 2018.
IPCC: Climate Change and Land: an IPCC special report on climate change, desertification, land degradation, sustainable land management, food security, and greenhouse gas fluxes in terrestrial ecosystems, edited by: Shukla, P. R., Skea, J., Calvo Buendia, E., Masson-Delmotte, V., Pörtner, H.-O., Roberts, D. C., Zhai, P., Slade, R., Connors, S., van Diemen, R., Ferrat, M., Haughey, E., Luz, S., Neogi, S., Pathak, M., Petzold, J., Portugal Pereira, J., Vyas, P., Huntley, E., Kissick, K., Belkacemi, M., and Malley, J., World Meteorological Organization, Geneva, Switzerland, 2019.
Justice, C. O., Román, M. O., Csiszar, I., Vermote, E. F., Wolfe, R. E., Hook, S. J., Friedl, M., Wang, Z., Schaaf, C. B., Miura, T., Tschudi, M., Riggs, G., Hall, D. K., Lyapustin, A. I., Devadiga, S., Davidson, C., and Masuoka, E. J.: Land and cryosphere products from Suomi NPP VIIRS: Overview and status, J. Geophys. Res.-Atmos., 118, 9753–9765, https://doi.org/10.1002/jgrd.50771, 2013.
Keller, J., Bojinski, S., and Prevot, A. S. H.: Simultaneous retrieval of aerosol and surface optical properties using data of the Multi-angle Imaging SpectroRadiometer (MISR), Remote Sens. Environ., 107, 120–137, https://doi.org/10.1016/j.rse.2006.07.020, 2007.
Klimont, Z., Kupiainen, K., Heyes, C., Purohit, P., Cofala, J., Rafaj, P., Borken-Kleefeld, J., and Schöpp, W.: Global anthropogenic emissions of particulate matter including black carbon, Atmos. Chem. Phys., 17, 8681–8723, https://doi.org/10.5194/acp-17-8681-2017, 2017.
Kotchenova, S. Y. and Vermote, E. F.: Validation of a vector version of the 6S radiative transfer code for atmospheric correction of satellite data. Part II. Homogeneous Lambertian and anisotropic surfaces, Appl. Opt., 46, 4455–4464, https://doi.org/10.1364/AO.46.004455, 2007.
Kotchenova, S. Y., Vermote, E. F., Matarrese, R., and Klemm, J. F. J.: Validation of a vector version of the 6S radiative transfer code for atmospheric correction of satellite data. Part I: Path radiance, Appl. Opt., 45, 6762–6774, https://doi.org/10.1364/AO.45.006762, 2006.
Kotchenova, S. Y., Vermote, E. F., Levy, R., and Lyapustin, A.: Radiative transfer codes for atmospheric correction and aerosol retrieval: intercomparison study, Appl. Opt., 47, 2215–2226, https://doi.org/10.1364/AO.47.002215, 2008.
Lee, J., Hsu, N. C., Bettenhausen, C., Sayer, A. M., Seftor, C. J., and Jeong, M.-J.: Retrieving the height of smoke and dust aerosols by synergistic use of VIIRS, OMPS, and CALIOP observations, J. Geophys. Res.-Atmos., 120, 8372–8388, https://doi.org/10.1002/2015JD023567, 2015.
Lenoble, J.: Radiative Transfer in Scattering and Absorbing Atmospheres: Standard Computational Procedures, A. Deepak, Hampton, VA, 300 pp., ISBN 0937-194050, 1985.
Lenoble, J.: Atmospheric Radiative Transfer, A. Deepak, Hampton, VA, ISBN 0937-194212, 1993.
Lenoble, J., Remer, L., and Tanré, D.: Aerosol remote sensing, Springer, Berlin, https://doi.org/10.1007/978-3-642-17725-5, 2013.
Levy, R. C., Mattoo, S., Munchak, L. A., Remer, L. A., Sayer, A. M., Patadia, F., and Hsu, N. C.: The Collection 6 MODIS aerosol products over land and ocean, Atmos. Meas. Tech., 6, 2989–3034, https://doi.org/10.5194/amt-6-2989-2013, 2013.
Levy, R. C., Mattoo, S., Sawyer, V., Shi, Y., Colarco, P. R., Lyapustin, A. I., Wang, Y., and Remer, L. A.: Exploring systematic offsets between aerosol products from the two MODIS sensors, Atmos. Meas. Tech., 11, 4073–4092, https://doi.org/10.5194/amt-11-4073-2018, 2018.
Li, L., Dubovik, O., Derimian, Y., Schuster, G. L., Lapyonok, T., Litvinov, P., Ducos, F., Fuertes, D., Chen, C., Li, Z., Lopatin, A., Torres, B., and Che, H.: Retrieval of aerosol components directly from satellite and ground-based measurements, Atmos. Chem. Phys., 19, 13409–13443, https://doi.org/10.5194/acp-19-13409-2019, 2019.
Liou, K. N.: An Introduction to Atmospheric Radiation, Elsevier Science, ISBN 978-01-2451-451-5, 2002.
Mallet, M., Solmon, F., Nabat, P., Elguindi, N., Waquet, F., Bouniol, D., Sayer, A. M., Meyer, K., Roehrig, R., Michou, M., Zuidema, P., Flamant, C., Redemann, J., and Formenti, P.: Direct and semi-direct radiative forcing of biomass-burning aerosols over the southeast Atlantic (SEA) and its sensitivity to absorbing properties: a regional climate modeling study, Atmos. Chem. Phys., 20, 13191–13216, https://doi.org/10.5194/acp-20-13191-2020, 2020.
Martonchik, J. V., Diner, D. J., Kahn, R. A., Ackerman, T. P., Verstraete, M. M., Pinty, B., and Gordon, H. R.: Techniques for the retrieval of aerosol properties over land and ocean using multiangle imaging, IEEE T. Geosci. Remote, 36, 1212–1227, https://doi.org/10.1109/36.701027, 1998.
Martonchik, J. V., Kahn, R. A., and Diner, D. J.: Retrieval of aerosol properties over land using MISR observations, in: Satellite Aerosol Remote Sensing over Land, edited by: Kokhanovsky, A. A., and De Leeuw, G., Springer Berlin Heidelberg, Berlin, Heidelberg, 267–293, https://doi.org/10.1007/978-3-540-69397-0_9, 2009.
Masek, J. G., Vermote, E. F., Saleous, N. E., Wolfe, R., Hall, F. G., Huemmrich, K. F., Feng, G., Kutler, J., and Teng-Kui, L.: A Landsat surface reflectance dataset for North America, 1990–2000, IEEE Geosci. Remote S., 3, 68–72, https://doi.org/10.1109/LGRS.2005.857030, 2006.
Mie, G.: Sättigungsstrom und Stromkurve einer schlecht leitenden Flüssigkeit, Ann. Phys., 331, 597–614, 1908.
Mishchenko, M. I., Hovenier, J. W., and Travis, L. D.: Light Scattering by Nonspherical Particles: Theory, Measurements, and Applications, Academic Press, New York, 720 pp., ISBN 978-01-2498-660-2, 2000.
Mishchenko, M. I., Travis, L. D., and Lacis, A. A. : Scattering, Absorption, and Emission of Light by Small Particles, Cambridge Univ. Press, Cambridge, 462 pp., ISBN 0521-78252X, 2002.
Nousiainen, T.: Optical modeling of mineral dust particles: A review, J. Quant. Spectrosc. Ra., 110, 1261–1279, https://doi.org/10.1016/j.jqsrt.2009.03.002, 2009.
Omar, A. H., Won, J.-G., Winker, D. M., Yoon, S.-C., Dubovik, O., and McCormick, M. P.: Development of global aerosol models using cluster analysis of Aerosol Robotic Network (AERONET) measurements, J. Geophys. Res.-Atmos., 110, D10S14, https://doi.org/10.1029/2004JD004874, 2005.
Remer, L. A., Kaufman, Y. J., Tanré, D., Mattoo, S., Chu, D. A., Martins, J. V., Li, R.-R., Ichoku, C., Levy, R. C., Kleidman, R. G., Eck, T. F., Vermote, E., and Holben, B. N.: The MODIS Aerosol Algorithm, Products, and Validation, J. Atmos. Sci., 62, 947–973, https://doi.org/10.1175/JAS3385.1, 2005.
Roger, J.-C., Guinot, B., Cachier, H., Mallet, M., Dubovik, O., and Yu, T.: Aerosol complexity in megacities: From size-resolved chemical composition to optical properties of the Beijing atmospheric particles, Geophys. Res. Lett., 36, L18806, https://doi.org/10.1029/2009GL039238, 2009.
Russell, P. B., Bergstrom, R. W., Shinozuka, Y., Clarke, A. D., DeCarlo, P. F., Jimenez, J. L., Livingston, J. M., Redemann, J., Dubovik, O., and Strawa, A.: Absorption Angstrom Exponent in AERONET and related data as an indicator of aerosol composition, Atmos. Chem. Phys., 10, 1155–1169, https://doi.org/10.5194/acp-10-1155-2010, 2010.
SALSA: Satellite Agriculture & Land Surface Applications, SALSA [data set], https://salsa.umd.edu, last access: 2 March 2022.
Shettle, E. P. and Fenn, R. W.: Models for the aerosols of the lower atmosphere and the effects of humidity variations on their optical properties, 214, Air Force Geophysics Laboratory, Air Force Systems Command, United States Air Force, 1979.
Sinyuk, A., Dubovik, O., Holben, B., Eck, T. F., Breon, F.-M., Martonchik, J., Kahn, R., Diner, D. J., Vermote, E. F., Roger, J.-C., Lapyonok, T., and Slutsker, I.: Simultaneous retrieval of aerosol and surface properties from a combination of AERONET and satellite data, Remote Sens. Environ., 107, 90–108, https://doi.org/10.1016/j.rse.2006.07.022, 2007.
Sinyuk, A., Holben, B. N., Eck, T. F., Giles, D. M., Slutsker, I., Korkin, S., Schafer, J. S., Smirnov, A., Sorokin, M., and Lyapustin, A.: The AERONET Version 3 aerosol retrieval algorithm, associated uncertainties and comparisons to Version 2, Atmos. Meas. Tech., 13, 3375–3411, https://doi.org/10.5194/amt-13-3375-2020, 2020.
Torres, B., Dubovik, O., Fuertes, D., Schuster, G., Cachorro, V. E., Lapyonok, T., Goloub, P., Blarel, L., Barreto, A., Mallet, M., Toledano, C., and Tanré, D.: Advanced characterisation of aerosol size properties from measurements of spectral optical depth using the GRASP algorithm, Atmos. Meas. Tech., 10, 3743–3781, https://doi.org/10.5194/amt-10-3743-2017, 2017.
Tsikerdekis, A., Schutgens, N. A. J., and Hasekamp, O. P.: Assimilating aerosol optical properties related to size and absorption from POLDER/PARASOL with an ensemble data assimilation system, Atmos. Chem. Phys., 21, 2637–2674, https://doi.org/10.5194/acp-21-2637-2021, 2021.
Van der Hulst, H. C.: Light Scattering by Small Particles, Dover Edition, New York, ISBN 0486-642283, 1981.
Vermote, E. F., Tanre, D., Deuze, J. L., Herman, M., and Morcette, J.: Second Simulation of the Satellite Signal in the Solar Spectrum, 6S: an overview, IEEE T. Geosci. Remote, 35, 675–686, https://doi.org/10.1109/36.581987, 1997.
Vermote, E. F., El Saleous, N. Z., and Justice, C. O.: Atmospheric correction of MODIS data in the visible to middle infrared: first results, Remote Sens. Environ., 83, 97–111, https://doi.org/10.1016/S0034-4257(02)00089-5, 2002.
Vermote, E. F., Roger, J.-C., Sinyuk, A., Saleous, N., and Dubovik, O.: Fusion of MODIS-MISR aerosol inversion for estimation of aerosol absorption, Remote Sens. Environ., 107, 81–89, https://doi.org/10.1016/j.rse.2006.09.025, 2007.
Vermote, E., Justice, C., and Csiszar, I.: Early evaluation of the VIIRS calibration, cloud mask and surface reflectance Earth data records, Remote Sens. Environ., 148, 134–145, https://doi.org/10.1016/j.rse.2014.03.028, 2014.
Vermote, E., Justice, C., Claverie, M., and Franch, B.: Preliminary analysis of the performance of the Landsat 8/OLI land surface reflectance product, Remote Sens. Environ., 185, 46–56, https://doi.org/10.1016/j.rse.2016.04.008, 2016.
Whitby, K. T.: The Physical Characteristics of Sulfur Aerosols, in: Sulfur in the Atmosphere, edited by: Husar, R. B., Lodge, J. P., and Moore, D. J., Pergamon, 135–159, https://doi.org/10.1016/B978-0-08-022932-4.50018-5, 1978.