the Creative Commons Attribution 4.0 License.
the Creative Commons Attribution 4.0 License.
 | 11 Mar 2022
Retrieval improvements for the ALADIN Airborne Demonstrator in support of the Aeolus wind product validation
Christian Lemmerz
Fabian Weiler
Uwe Marksteiner
Benjamin Witschas
Stephan Rahm
Alexander Geiß
Andreas Schäfler
Oliver Reitebuch
The realization of the European Space Agency's Aeolus mission was supported by the long-standing development and field deployment of the Atmospheric LAser Doppler INstrument (ALADIN) Airborne Demonstrator (A2D) which, since the launch of the Aeolus satellite in 2018, has been serving as a key instrument for the validation of ALADIN, the first-ever Doppler wind lidar (DWL) in space. However, the validation capabilities of the A2D are compromised by deficiencies of the dual-channel receiver which, like its spaceborne counterpart, consists of a Rayleigh and a complementary Mie spectrometer for sensing the wind speed from both molecular and particulate backscatter signals, respectively. Whereas the accuracy and precision of the Rayleigh channel is limited by the spectrometer's high alignment sensitivity, especially in the near field of the instrument, large systematic Mie wind errors are caused by aberrations of the interferometer in combination with the temporal overlap of adjacent range gates during signal readout. The two error sources are mitigated by modifications of the A2D wind retrieval algorithm. A novel quality control scheme was implemented, which ensures that only backscatter return signals within a small angular range are further processed. Moreover, Mie wind results with large bias of opposing sign in adjacent range bins are vertically averaged. The resulting improvement of the A2D performance was evaluated in the context of two Aeolus airborne validation campaigns that were conducted between May and September 2019. Comparison of the A2D wind data against a high-accuracy, coherent DWL that was deployed in parallel on board the same aircraft shows that the retrieval refinements considerably decrease the random errors of the A2D line-of-sight (LOS) Rayleigh and Mie winds from about 2.0 to about 1.5 m s−1, demonstrating the capability of such a direct detection DWL. Furthermore, the measurement range of the Rayleigh channel could be largely extended by up to 2 km in the instrument's near field close to the aircraft. The Rayleigh and Mie systematic errors are below 0.5 m s−1 (LOS), hence allowing for an accurate assessment of the Aeolus wind errors during the September campaign. The latter revealed different biases of the Level 2B (L2B) Rayleigh-clear and Mie-cloudy horizontal LOS (HLOS) winds for ascending and descending orbits, as well as random errors of about 3 m s−1 (HLOS) for the Mie and close to 6 m s−1 (HLOS) for the Rayleigh winds, respectively. In addition to the Aeolus error evaluation, the present study discusses the applicability of the developed A2D algorithm modifications to the Aeolus processor, thereby offering prospects for improving the Aeolus wind data quality.
- Article
(13585 KB) - Full-text XML
- BibTeX
- EndNote


Doppler wind lidar (DWL) represents a powerful means to acquire atmospheric wind profiles with high spatiotemporal resolution and high accuracy, and it has been employed from ground and from air- and shipborne platforms for many years. Following the launch of the European Space Agency's (ESA) Aeolus mission in August 2018, the measurement of vertically resolved wind profiles on a global scale is being accomplished by the Atmospheric LAser Doppler INstrument (ALADIN), which is the first DWL in space. ALADIN is capable of observing the component of the wind vector along the instrument's line of sight (LOS) from ground up to 30 km in the stratosphere (ESA, 2008; Reitebuch, 2012; Kanitz et al., 2019; Parrinello et al., 2021). The Aeolus mission primarily aims at improving numerical weather prediction (NWP) by filling observational gaps in the global wind data coverage, particularly over the oceans, poles, tropics, and the Southern Hemisphere (Andersson, 2018; Stoffelen et al., 2005, 2020; Straume et al., 2020). This goal was already achieved within the first half of the intended mission lifetime of 3 years, with the successful assimilation of Aeolus winds into NWP models, after having identified and corrected for two large error sources that had diminished the wind data quality in the early phase of the mission (Kanitz et al., 2020; Reitebuch et al., 2020). Whereas the implementation of a dedicated calibration instrument mode allowed for the consideration of dark current signal fluctuations on the Aeolus detectors (Weiler et al., 2021a), wind biases that were caused by variations in the temperature distribution across the primary telescope mirror were considerably reduced by a correction scheme based on ECMWF (European Centre for Medium-Range Weather Forecasts) model-equivalent winds (Rennie and Isaksen, 2020; Weiler et al., 2021b; Rennie et al., 2021). Recent assessments of the significance of the Aeolus data have demonstrated the statistically positive impact on the accuracy of NWP forecasts, especially in the tropics and at the poles, hence providing a useful contribution to the Global Observing System (GOS; Rennie and Isaksen, 2020; Rennie et al., 2021). Consequently, the operational assimilation of Aeolus observations was started at several weather services worldwide in 2020.
Since the start of the mission, the quality of the Aeolus wind data product has been assessed by a number of calibration and validation (Cal/Val) activities based on model comparisons (Martin et al., 2021) and ground-based or suborbital instruments (Bedka et al., 2021; Iwai et al., 2021; Fehr et al., 2020, 2021; Baars et al., 2020; Khaykin et al., 2020). Within the framework of this international effort, the German Aerospace Center (Deutsches Zentrum für Luft- und Raumfahrt, DLR) has conducted three airborne validation campaigns between November 2018 and October 2019 (Lux et al., 2020a), deploying its high-accuracy, coherent 2 µm DWL (Weissmann et al., 2005; Witschas et al., 2017, 2020) in combination with the ALADIN Airborne Demonstrator (A2D) on board the DLR Falcon research aircraft. Being the airborne prototype of the Aeolus payload, the A2D has a very similar design and relies on the same measurement principle (Paffrath et al., 2009; Reitebuch et al., 2009), thus delivering valuable information on potential error sources and on the optimization of the Aeolus wind retrieval and related quality control (QC) algorithms. In particular, the A2D receiver is, like ALADIN, composed of complementary Rayleigh and Mie channels for deriving the wind speed from both molecular and particulate backscatter. Beyond the airborne campaigns, the A2D has been serving as test bed to explore new measurement strategies and algorithm modifications which cannot be readily implemented in the Aeolus operation modes and wind processing, respectively.
During earlier campaigns, the (pre-launch) validation capabilities of the A2D were impaired by two major deficiencies that limited the accuracy and precision of the two receiver channels. While the Rayleigh wind results are impaired by the imperfect transmit–receive co-alignment in combination with the incomplete telescope overlap in the instrument's near field, large systematic Mie wind errors are caused by imperfections of the Fizeau interferometer (FI) plates, which results in a skewed interference fringe. These two error sources were tackled by several modifications of the A2D wind retrieval which strongly improved the accuracy and precision of the wind measurement while increasing the measurement range. The identified strategies to overcome the limitations imposed by the two error sources are not only specific to the A2D but are potentially also relevant for other DWLs that utilize either Fabry–Pérot interferometers (FPIs) or FIs for deriving Doppler frequency shifts. This is especially true for the A2D's spaceborne counterpart ALADIN, despite its monostatic design in which the transmit and receive path are realized by the same telescope, which makes an active co-alignment, as used in the A2D, obsolete. However, the developed retrieval modifications are not applicable to DWLs that rely on other measurement principles, such as Mach–Zehnder interferometers (Baidar et al., 2018; Tucker et al., 2018; Bruneau and Pelon, 2021), particularly as they are generally less sensitive to angular variations.
The refinement of the A2D wind retrieval and resulting improvement of the wind data quality substantially enhanced the capabilities of the airborne demonstrator for the Aeolus validation. Furthermore, the lessons learnt from the first validation campaign in 2018 regarding the optimization of the A2D range gate settings (Lux et al., 2020a) were applied in order to increase the statistics of the Aeolus-to-A2D wind comparisons. The statistical significance is further strengthened by a larger number of underflights performed during the two airborne campaigns in 2019 that are discussed in the present work, compared to the campaign in 2018 where only a small dataset was analysed, hence providing a much higher validity of the Aeolus data quality assessment. Finally, a major difference to the previous work is the fact that the Aeolus wind data from the most recent campaign was already reprocessed after implementation of several crucial correction schemes to the Aeolus processors for strongly reducing large systematic errors that were identified in the initial phase of the mission (Abdallah et al., 2020; Masoumzadeh et al., 2020). Analysis of the satellite data from the latest airborne campaign thus allows for the validation of the reprocessed Aeolus wind product with improved data quality.
This paper aims to elaborate on the A2D wind measurement error sources and how they were mitigated in the context of two Aeolus validation campaigns in 2019. After a brief overview of the campaigns and obtained datasets (Sect. 2), the technical evolution of the A2D is outlined, followed by a description of the A2D wind retrieval algorithm (Sect. 3.1). The latter forms the basis for the developed retrieval modifications of the Rayleigh and Mie wind retrieval, which are explained in Sect. 3.2 and 3.3, respectively. The improvement in the A2D wind data quality is demonstrated by a statistical comparison with collocated 2 µm DWL wind measurements carried out during the two airborne campaigns (Sect. 3.4.). Section 4 then focuses on the validation of reprocessed Aeolus wind results from the second campaign in 2019 using the improved A2D wind data. The article closes with a summary and conclusions drawn from the analyses (Sect. 5), including a discussion on the possible applicability of the developed correction schemes to the Aeolus wind retrieval.
The airborne validation of the Aeolus mission started already 3 months after the launch of the satellite on 22 August 2018 when the WindVal III campaign was conducted from the DLR air base in Oberpfaffenhofen, Germany, between 5 November and 5 December 2018. In addition to performing collocated wind measurements of ALADIN and the two wind lidars on board the DLR Falcon research aircraft, WindVal III also aimed at rehearsing the validation activities to be carried out after the commissioning phase of the mission. Balancing the constraints in the planning of the satellite underflights which were imposed by the weather conditions along the measurement track within the reach of the aircraft, air traffic control (ATC) limitations and the satellite status was an important experience gained for the subsequent campaigns. Moreover, several lessons learnt were derived in terms of the measurement strategies and settings of the A2D. Most importantly, following the recommendations formulated in Lux et al. (2020a), the range gate settings of the A2D were optimized such that a higher number of small- and medium-sized range gates were located at altitudes above 4 km at the expense of lower resolution towards the ground. The higher resolution at higher altitudes allowed for a better vertical sampling of high wind speed gradients, e.g. related to jet streams near the tropopause, and hence delivered wind data over a wider wind speed range to be used for the validation of the Aeolus wind product.
Following WindVal III in late 2018, two additional airborne validation campaigns were conducted within the first year of the operational phase of Aeolus. Whereas the AVATARE campaign (Airborne VAlidation Through Airborne lidaRs in Europe) was again carried out from Oberpfaffenhofen, Germany, in May/June 2019, AVATARI (Airborne VAlidation Through Airborne lidaRs in Iceland), performed in September 2019, had its air base in Keflavík, Iceland, which was also the location of the WindVal II campaign in 2016 prior to the launch (Lux et al., 2018; Schäfler et al., 2018). The two campaigns not only considerably extended the available dataset to validate Aeolus wind observations in different geographical regions and under different atmospheric conditions in terms of cloud types and dynamics but also served to assess the accuracy and precision of the Aeolus wind product in different phases of the mission. In particular, the switch-over from the first flight model laser (FM-A) to the redundant laser (FM-B) just after AVATARE in June 2019 marked a caesura, as FM-B delivered a much higher emit energy and, hence, ensured a higher signal-to-noise ratio (SNR) of the backscatter return compared to the end of the FM-A period (Lux et al., 2020b, 2021). Moreover, the satellite instrument was found to be more susceptible to changes in the thermal environment than expected before the launch, showing orbital and seasonal variations in the beam alignment, and, thus, in the wind bias (Martin et al., 2021; Chen et al., 2021). This issue, together with the influence of the seasonally varying solar background being incident on the instrument spectrometers and affecting the wind measurement precision, could be investigated based on the comparative wind measurements from the AVATARE and AVATARI campaigns.
2.1 AVATARE
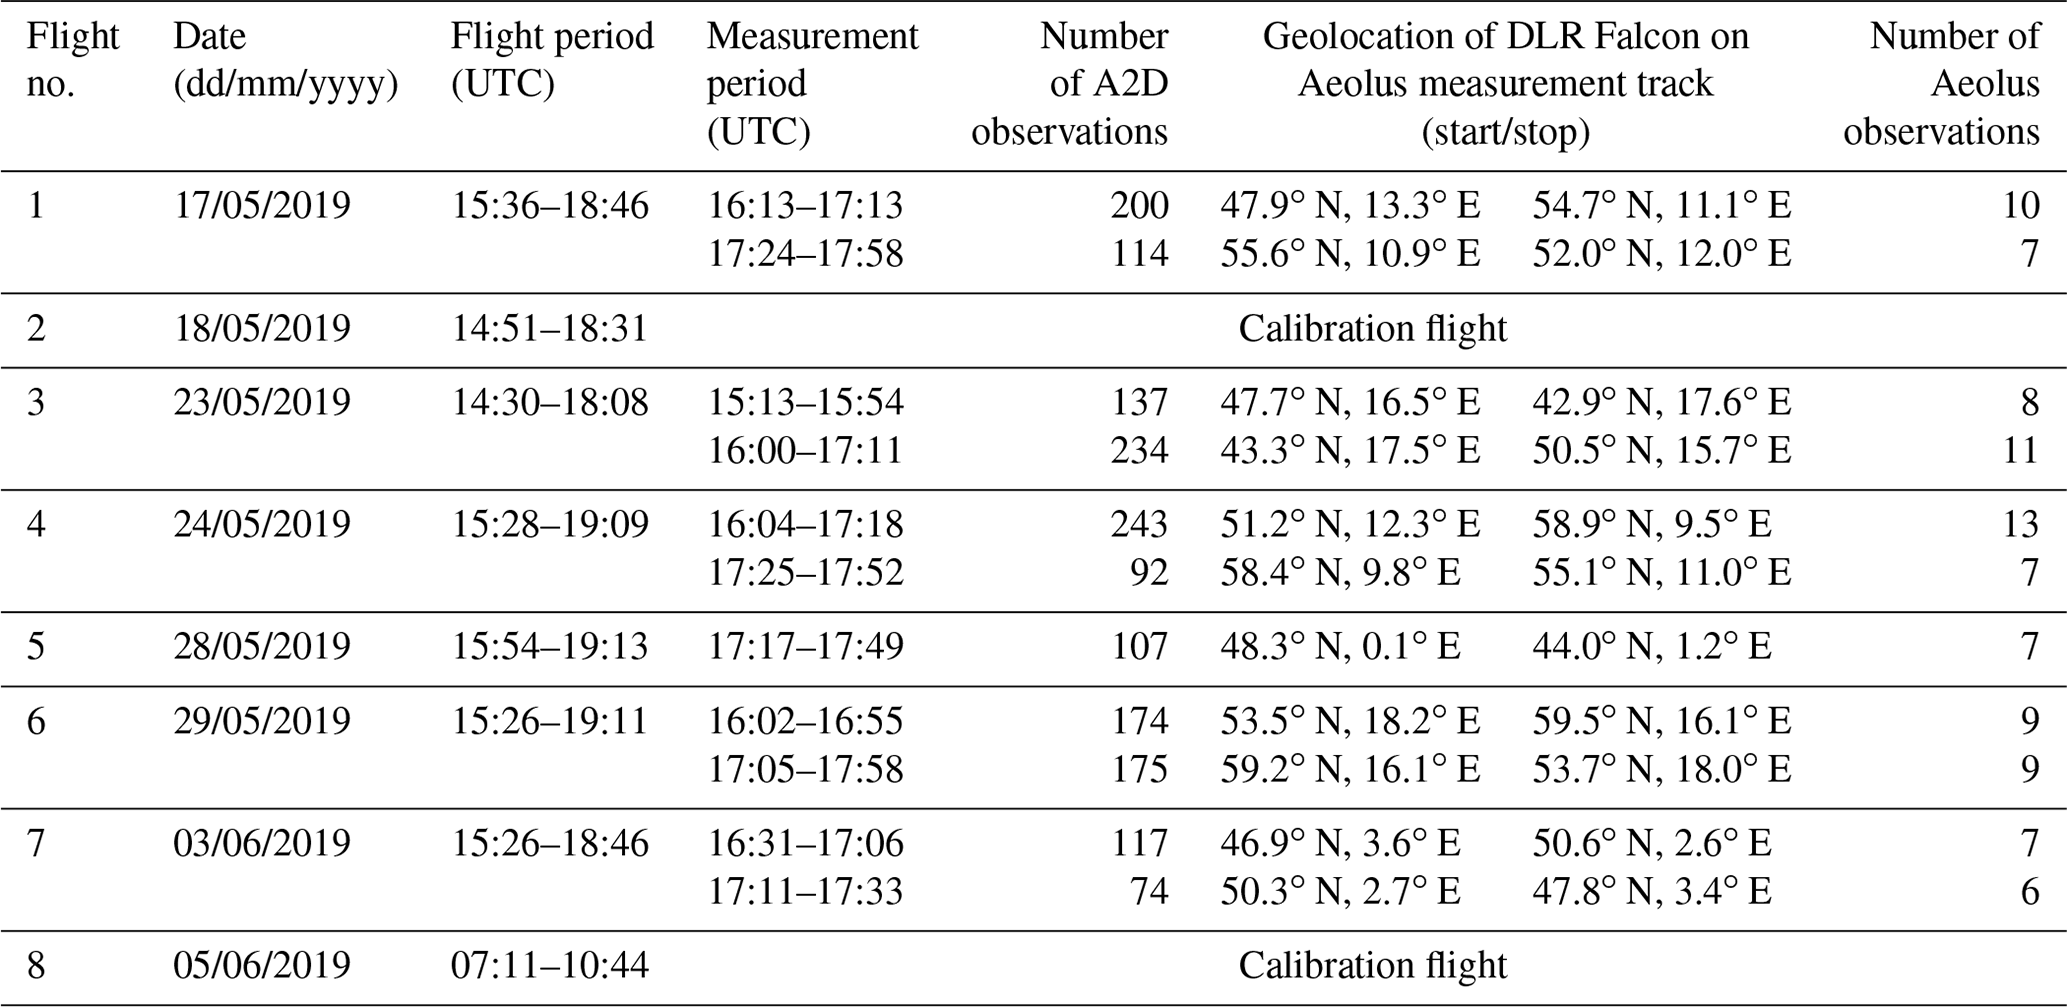
In the framework of the AVATARE campaign, eight research flights were conducted from which six flights were dedicated to Aeolus underpasses and two flights aimed at the calibration of the A2D. The purpose and procedure of the latter are extensively described in Marksteiner et al. (2018). The flight tracks of the DLR Falcon are depicted in Fig. 1, while Table 1 provides an overview of the performed flights, including the geolocations of the start and end points of the respective Aeolus underflight legs and the number of A2D and Aeolus observations, respectively. While the number of A2D observations corresponds to the number of wind profiles with a horizontal averaging length of about 3.6 km, one Aeolus observation, also referred to as basic repeat cycle (BRC), is spread over a nominal horizontal averaging length of about 90 km and can contain multiple wind profiles, especially for the Mie channel, as a result of the so-called grouping algorithm which is part of the Level 2B (L2B) processor (Rennie et al., 2020).
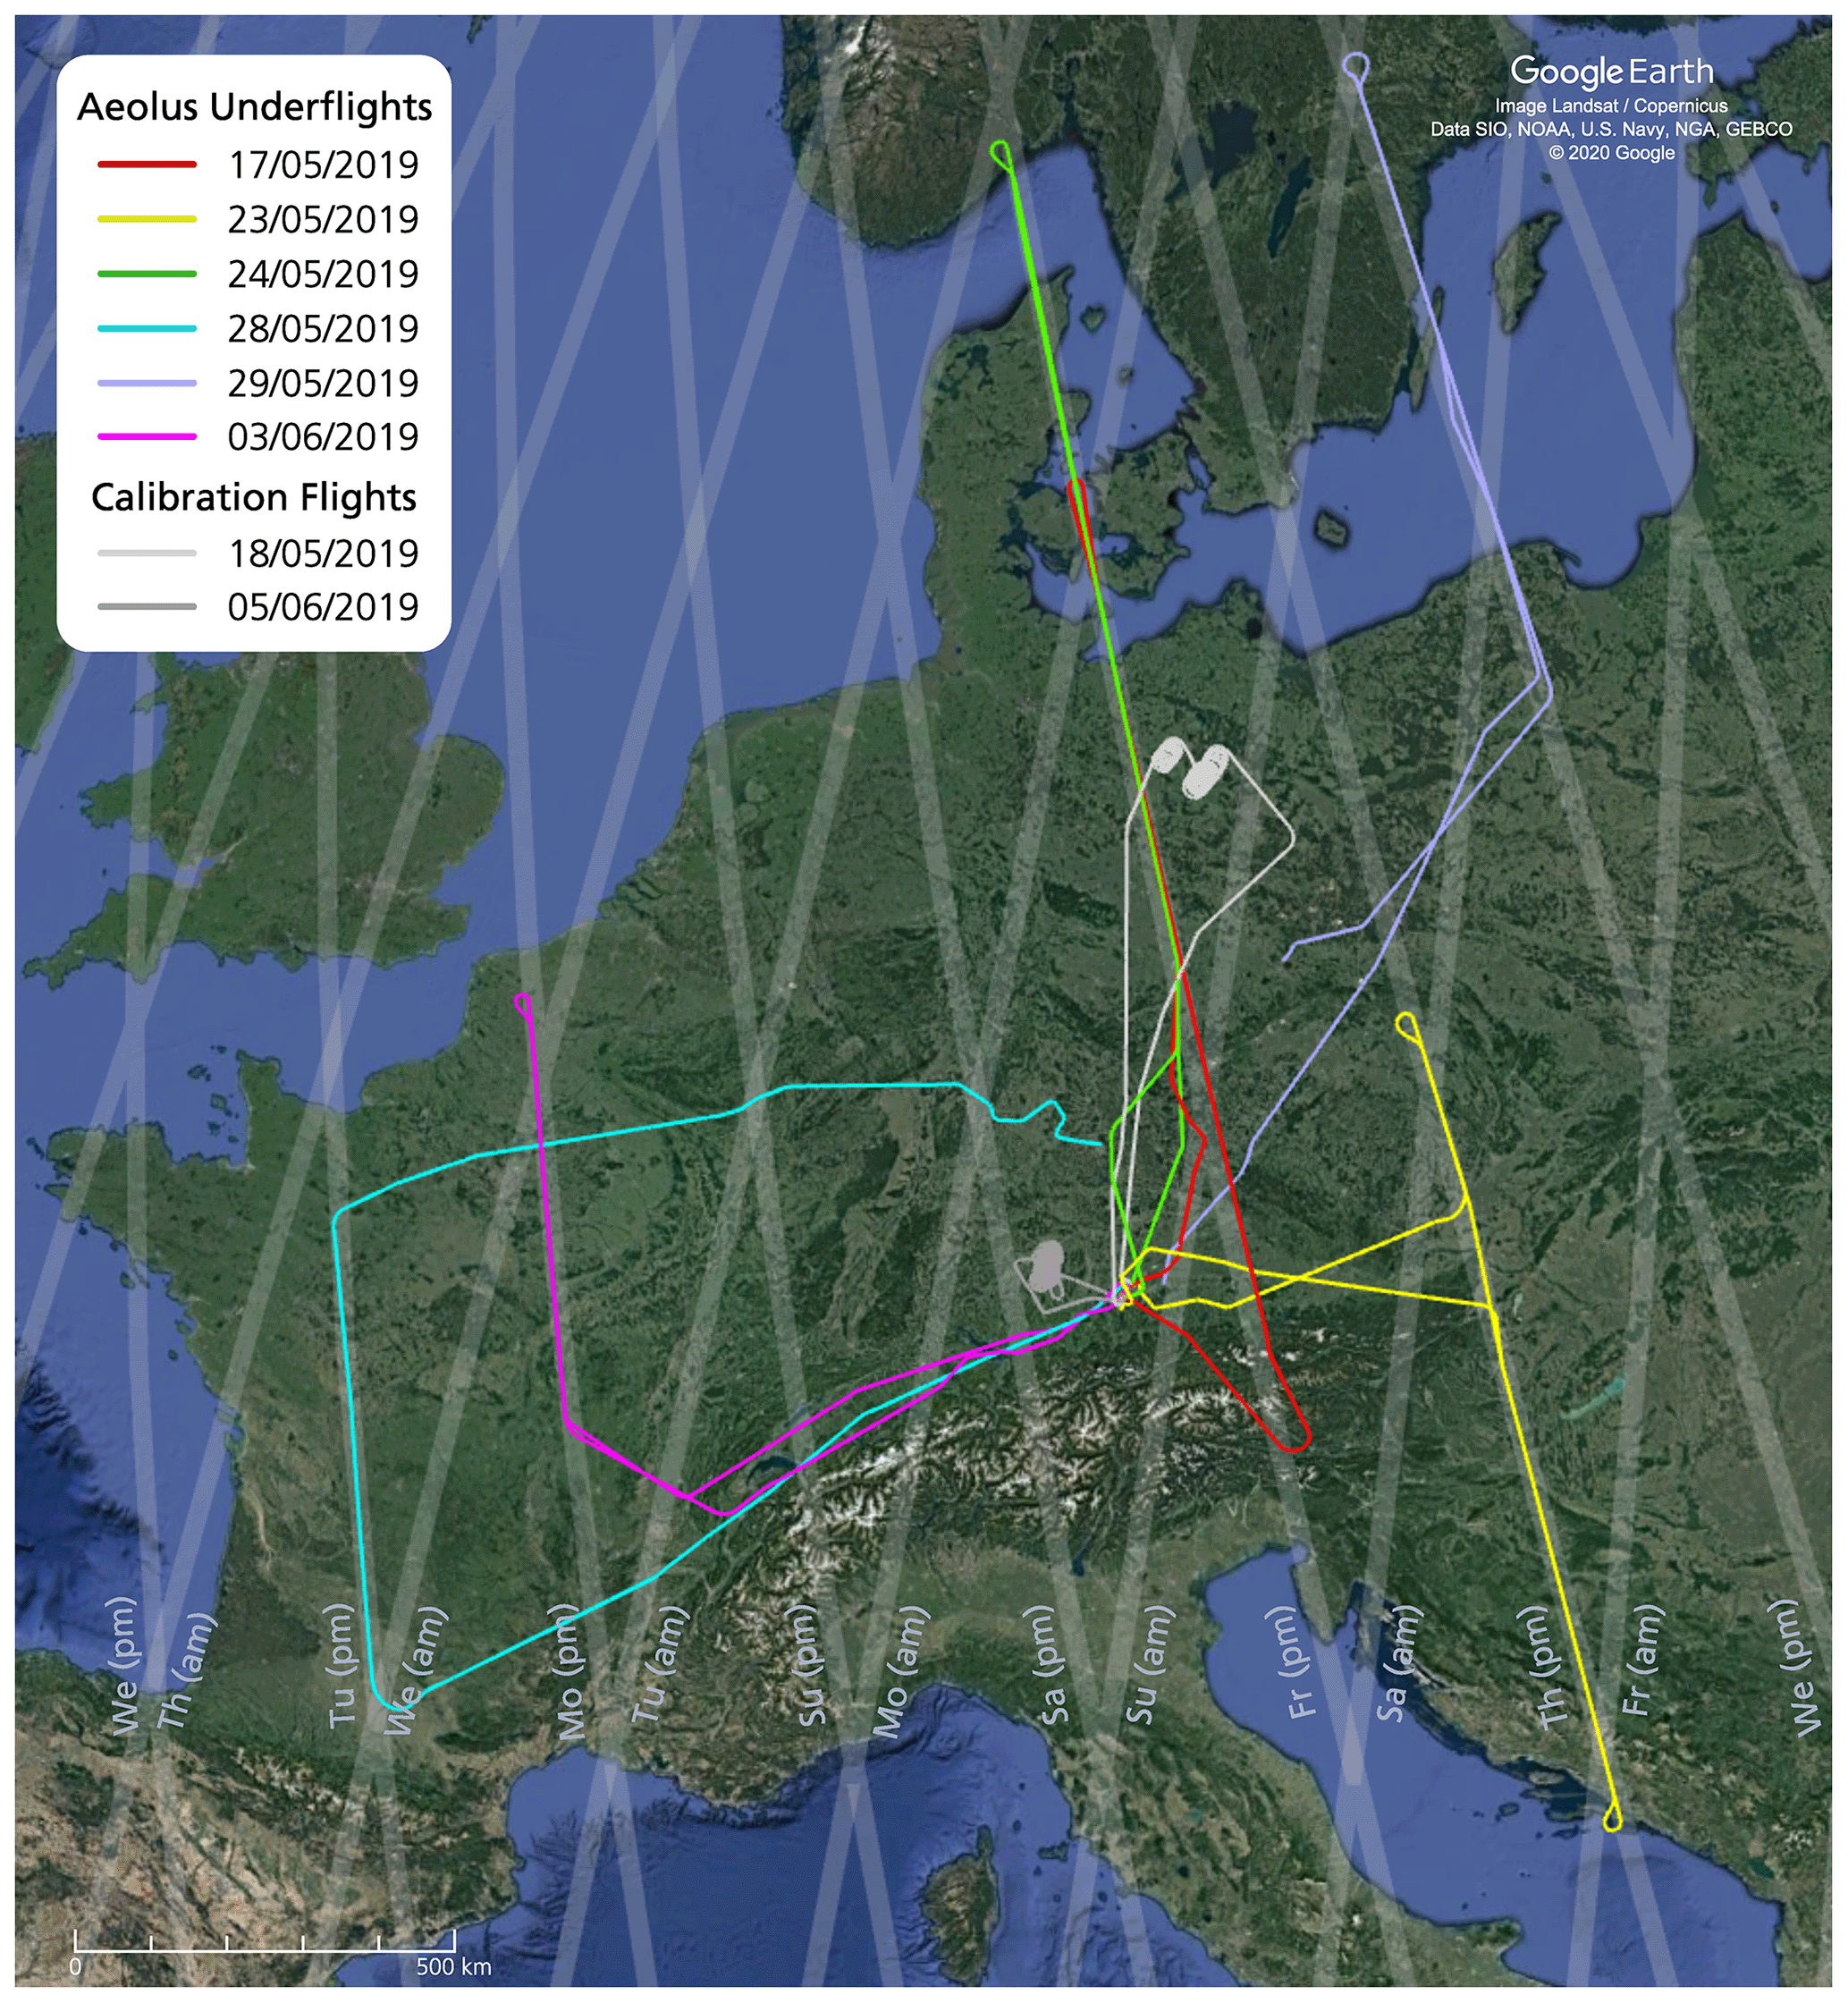
Figure 1Flight tracks of the Falcon aircraft during the AVATARE campaign from 17 May to 5 June 2019 (background image © 2020 Google). Each colour represents a single flight. The Aeolus measurement swath is shown in grey. The satellite flying direction was always from south to north during the probed evening ascending orbits.
Table 1Overview of the research flights of the Falcon aircraft in the frame of the AVATARE campaign in May/June 2019 and the wind scenes performed with the A2D along the Aeolus measurement track.
As can be seen from the flight tracks and times, all underflights were in the evening hours during the ascending orbits of the satellite. Descending orbits in the morning hours were not probed due to unfavourable weather conditions and/or ATC constraints during the campaign period. Adding up the lengths of the satellite swaths covered by the DLR Falcon during the six underflights, the overall track length for which wind data are available for validation purposes is around 4400 km, corresponding to 57 Aeolus wind observations. Since parts of the swaths were overflown twice during some of the flights (see Table 1), several Aeolus observations could be validated by two collocated wind measurements of the airborne wind lidars.
2.2 AVATARI
Thanks to a larger number of available flight hours during AVATARI (62 compared to 34 during AVATARE), a total of 10 Aeolus underflights were performed in September 2019, including also, for the first time, four flights along descending orbits in the early morning hours (see Fig. 2 and Table 2). Already during the transfer from Oberpfaffenhofen to Keflavík via Prestwick, United Kingdom, the first underflight along an ascending orbit could be performed north of Scotland. Since there were no cloud-free conditions over the Iceland main glacier, two double flights were flown to Greenland, with a fuel stop in Kangerlussuaq for the purpose of calibrating the A2D over high-albedo surfaces. During the 10 underflights, the two lidars on board the DLR Falcon sampled almost 8000 km of the Aeolus measurement track across Iceland and parts of the North Atlantic. In contrast to the previous validation campaigns, Aeolus operated with a dedicated range gate setting that was applied exclusively in the area around Iceland within the AVATARI time frame. The setting was optimized for a higher resolution (500 m instead of 1000 m) throughout the troposphere, particularly in the jet stream area, in order to better resolve strong wind speed gradients at the expense of increased noise.
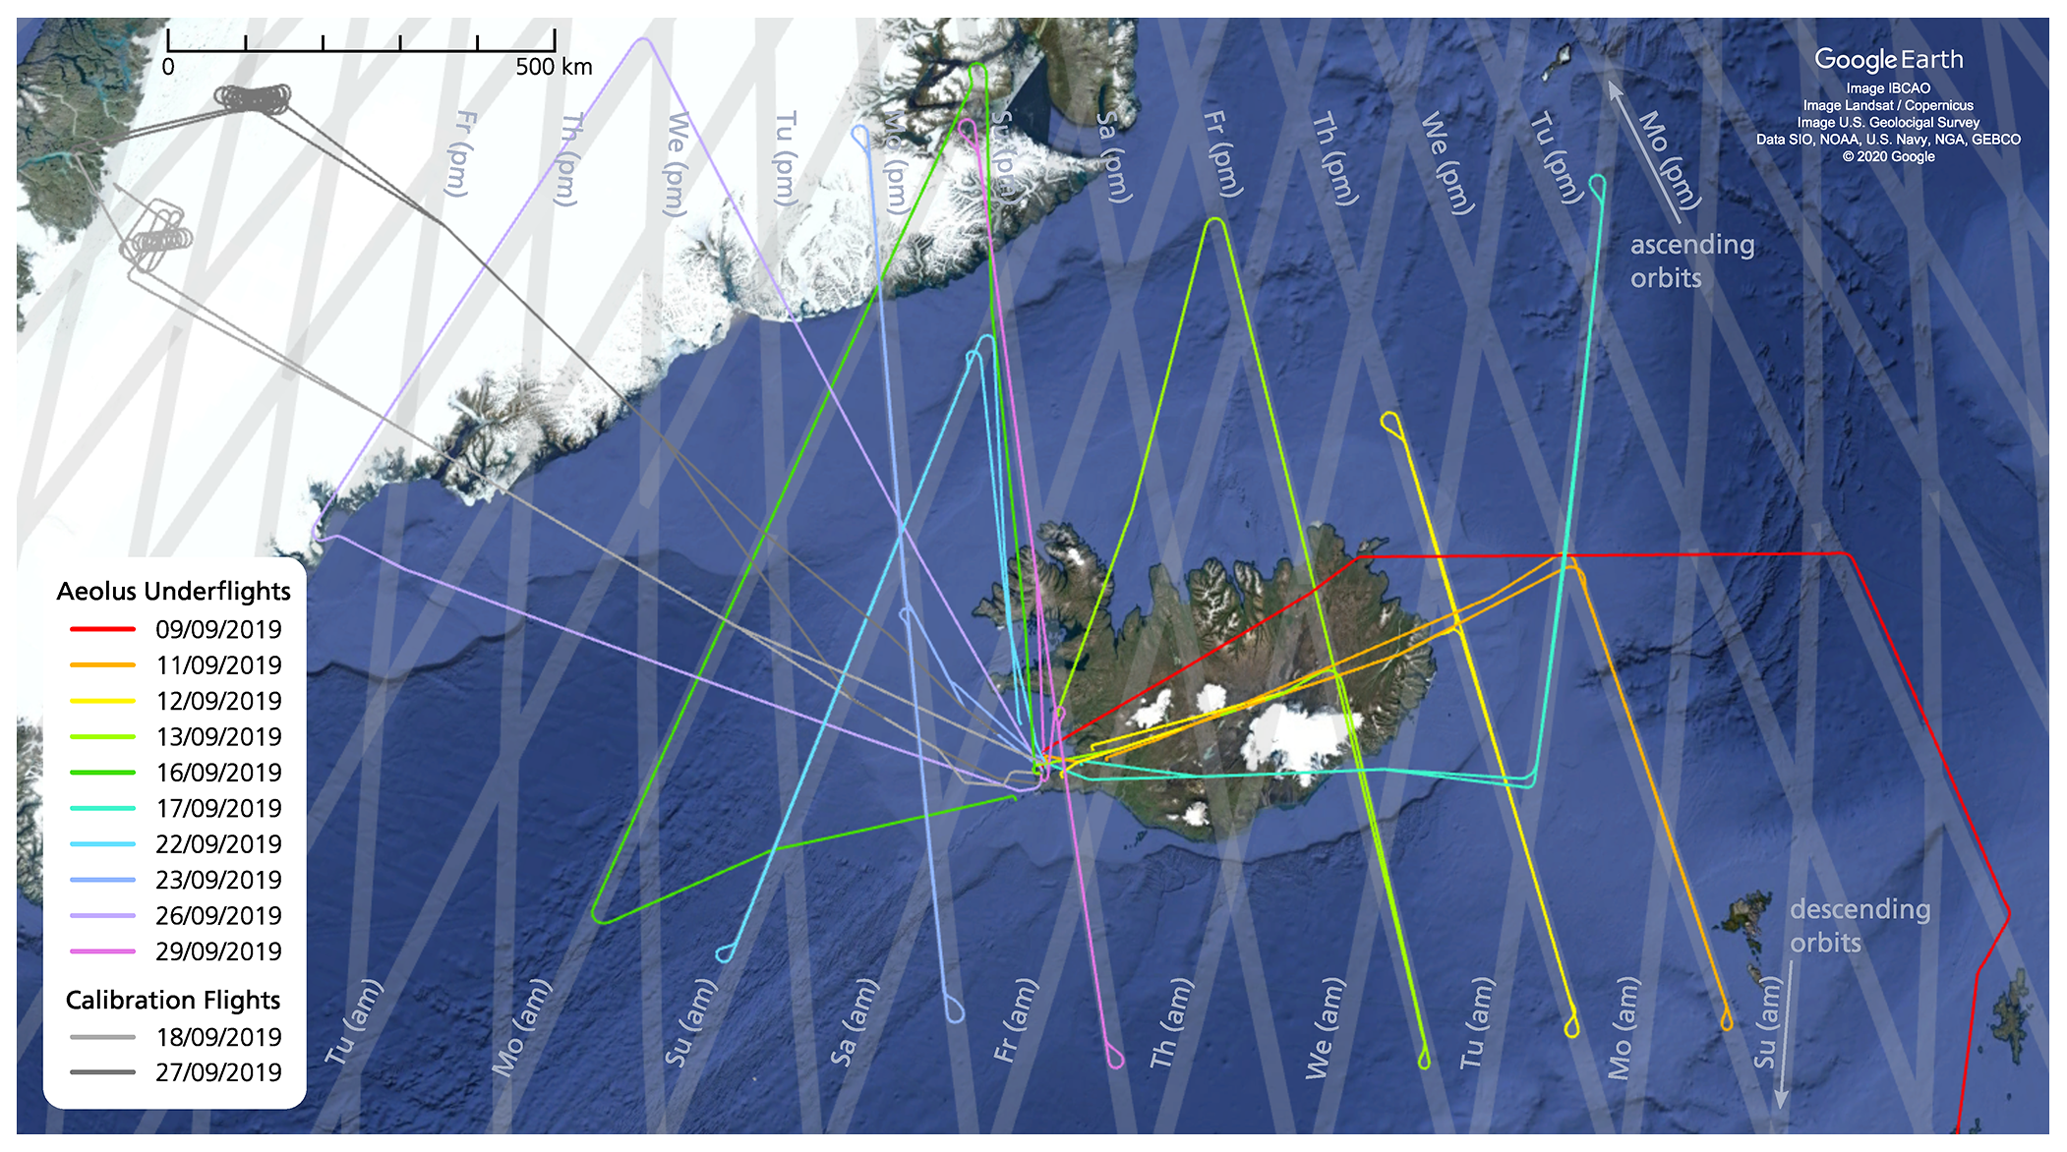
Figure 2Flight tracks of the Falcon aircraft during the AVATARI campaign from 9 to 29 September 2019 (background image © 2020 Google). Each colour represents a single satellite underflight. The Aeolus measurement swath is shown in grey.
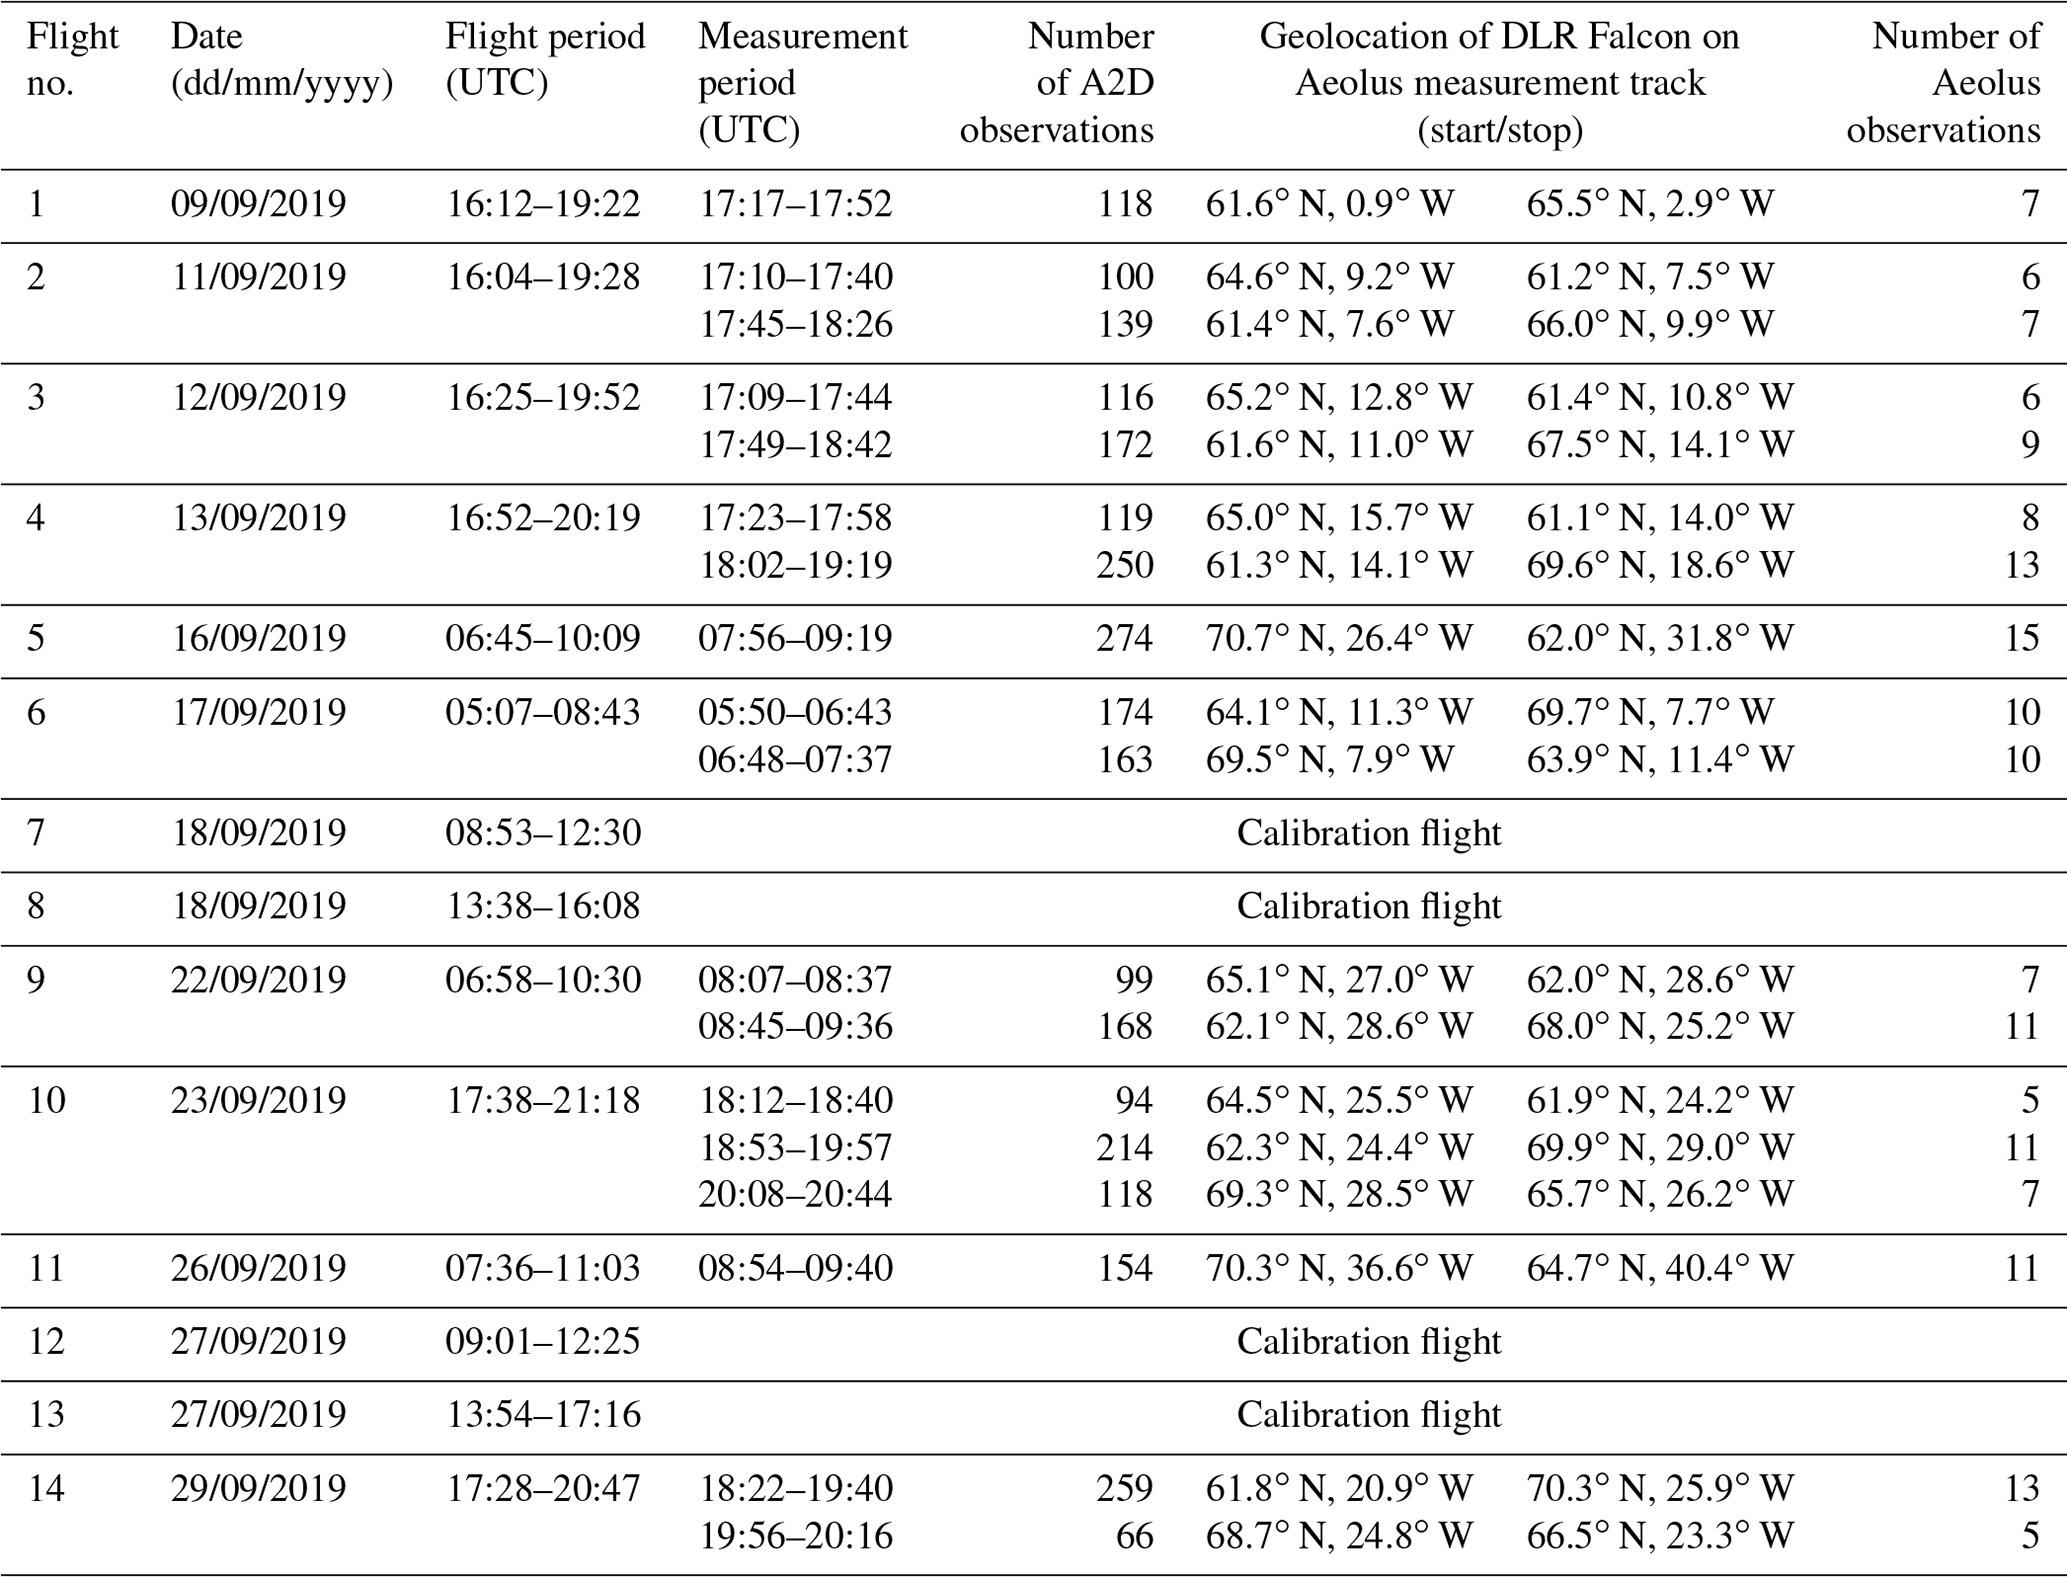
Table 2Overview of the research flights of the Falcon aircraft in the frame of the AVATARI campaign in September 2019 and the wind scenes performed with the A2D along the Aeolus measurement track.
The A2D was developed by the European Aeronautic Defence and Space (EADS) Astrium (now Airbus Defence and Space) in cooperation with the DLR in the early 2000s. Its design and operating principle were extensively described in several previous publications (Paffrath et al., 2009; Reitebuch et al., 2009; Lux et al., 2018, 2020a). Therefore, only a brief description is provided here. The A2D consists of a pulsed, frequency-stabilized, ultraviolet (UV) laser transmitter, a Cassegrain-type telescope, a front optics configuration for separating the backscatter return from a fibre-coupled internal reference signal and two complementary receiver channels that are sensitive to molecular (Rayleigh channel) and particulate backscatter from clouds and aerosols (Mie channel), respectively (Fig. 3). The structural design of the telescope, which is composed of a 20 cm diameter primary mirror and a 7 cm diameter secondary mirror, involves a strong attenuation of the return signal within the first 2 km from the instrument (Paffrath et al., 2009). Moreover, the incomplete telescope overlap in the instrument's near field causes a range-dependent angular distribution of the return signal that is incident on the spectrometers of the receiver, hence giving rise to systematic errors, particularly of the Rayleigh channel (see Sect. 3.2). The incomplete overlap between the transmitted laser beam and the field of view (FOV) of the receiving telescope is an issue that impairs the near-field performance of many different types of lidar instruments, and various approaches have been developed over last decades to determine the overlap function which particularly crucial for aerosol remote sensing (Wandinger and Ansmann, 2002; Stelmaszczyk et al., 2005; Mei et al., 2020). For the wind retrieval of the A2D, exact knowledge the overlap function is not necessary; however, systematic errors arise from the fact that the beam obscuration by the telescope secondary mirror reduces the backscatter such that only higher field angles are transmitted.

Figure 3(a) Simplified schematic of the A2D comprising a frequency-stabilized UV laser transmitter, a Cassegrain telescope, front optics, and a dual-channel receiver. Note: FPI – Fabry–Pérot interferometer; PRF – pulse repetition frequency; ACCD accumulation charge-coupled device. (b) Exemplary signal distribution measured with the Mie ACCD detector (blue bars) and Lorentzian fit of the signals transmitted through the Fizeau interferometer (FI) for determining the Mie fringe centroid position m. (c) Exemplary signal distribution measured with the Rayleigh ACCD detector (green bars) and Gaussian fits of the signals transmitted through the two FPIs (A – pink; B – orange) for determining the Rayleigh spot positions rA and rB.
The wind measurement principle of the two receiver channels relies on different techniques to account for the diverse spectral bandwidth of the particulate (∼ 50 MHz) and molecular backscatter (∼ 3.8 GHz in the UV spectral region and at atmospheric temperature of 293 K). The Mie channel is based on the fringe-imaging technique (McKay, 2002), where the Doppler frequency shift is measured from the spatial displacement of a linear interference pattern (fringe), produced by a FI, that is vertically imaged onto a detector. The latter is realized by an accumulation charge-coupled device (ACCD) with an array size of 16 × 16- pixels (image zone). According to , with f0=844.75 THz being the laser emission frequency and c being the speed of light, scattering from a particle that moves with a LOS (wind) speed of vLOS=1 m s−1 introduces a Doppler frequency shift of about ΔfDoppler = 5.63 MHz. The shift manifests as a motion of the Mie fringe centroid position m (Fig. 3b) by about 0.056 pixels, given the nearly linear relationship between frequency and centroid position for typical wind speeds vLOS well below 100 m s−1 (ΔfDoppler < 563 MHz) and a slope of about 0.01 pixel MHz−1. The exact fringe position is calculated by a Nelder–Mead downhill simplex algorithm (Nelder and Mead, 1965) that optimizes a Lorentzian line shape of the fringe intensity distribution after the electronic charges from all 16 rows in the image zone are binned together to one row with the integrated signal (see Fig. 3a).
Measurement of the Doppler shift from the broadband molecular backscatter signal which features a Rayleigh–Brillouin line shape (Witschas, 2011a, b) is accomplished by the double-edge technique (Chanin et al., 1989; Garnier and Chanin, 1992; Flesia and Korb, 1999; Gentry et al., 2000). It relies on two bandpass filters (A and B) that are implemented as sequential FPIs with adequate choice of spectral width and spacing with respect to each other. The signals transmitted through the two filters are imaged onto the Rayleigh channel detector as two nearly circular spots. After the binning of the electronic charges from the 16 rows in the image zone, the charges from the left and right half of the resulting row are summed up. The contrast between the two total intensities is a measure of the spectral position of the backscatter spectrum with respect of the two fixed filter transmission curves and, hence, allows the determination of the frequency shift between the emitted and backscattered laser pulse. Apart from the signal levels transmitted through the two filters, the respective centroid positions of the corresponding spots rA and rB (Fig. 3c) are relevant for the wind retrieval, as they provide information on the horizontal incidence angle of the backscattered light on the FPIs.
When the A2D is operating in the so-called lidar mode, the summed-up signals from 25 images, i.e. 25 rows, are transferred to a memory zone of the ACCD one after another. Each row represents one range gate, of which three are used for detecting the solar background radiation (range gate no. 0), with signals resulting from the voltage at the analogue-to-digital converter (detection chain offset, DCO; range gate no. 2) and the internal reference signal (range gate no. 4), respectively. Another three range gates (nos. 1, 3, and 5) act as buffers to avoid leakage into the neighbouring range gates, so that 19 range gates are available for collecting the atmospheric backscatter signals (range gates nos. 6 to 24). Note that, for ALADIN, the detection of the internal reference signals does not require a dedicated range gate, as the timing requirements are much more relaxed given the much longer delay between the backscattered return and the emitted pulses. Also, the Aeolus ACCDs make use of so-called virtual pixels to determine the DCO instead of using a range gate (Weiler et al., 2021a). Consequently, no buffer range gates are necessary, and only one range gate is reserved for detecting the (solar) background, which leaves 24 atmospheric range gates for ALADIN.
Owing to the transfer time from the image to the memory zone, the temporal resolution of one range gate is limited to 2.1 µs, which corresponds to a minimum height resolution of 296 m considering the 20∘ off-nadir viewing angle of the instrument. Moreover, it is important to note that the charge transfer process of the ACCD involves a temporal overlap in the acquisition of two subsequent range gates of about 1 µs. This issue is elaborated on in Sect. 3.3 in the context of the Mie wind errors and their reduction. The ACCD allows the accumulation of the signals from multiple successive laser pulses (P) on the chip to the so-called measurements from which two pulses are lost due to the readout of the ACCD. During the wind retrieval, the signals from N measurements are then summed up to one observation which always lasts 14 s, followed by 4 s for data readout and transfer before the next observation starts. While a total of P = 20 pulses was emitted per measurement during the AVATARE campaign, corresponding to a measurement duration of 0.4 s, the number was decreased to P = 10 (0.2 s) for the AVATARI campaign. Consequently, the number of measurements per observation was doubled from N = 35 to N = 70, which offered a higher flexibility of the QC scheme that is applied on measurement level (see the next section). For Aeolus, each observation or BRC takes 12 s and consisted of P = 19 pulses and N = 30 measurements for the period of the two campaigns in 2019. Since the signals from one pulse are lost during readout of the ACCD (P−1 setting), each BRC contains the signals from 540 pulses, as opposed to the A2D where (10 − 2) ⋅ 70 = 560 pulses form one observation (P−2 setting).
The performance of the A2D has been continuously improved over the past 16 years, since it was put into operation in 2005. This initially encompassed technical developments of the individual hardware components, particularly of the UV laser. Here, the focus was laid on the improvement of the frequency and timing stability, which was accomplished by a mechanical bridge that connects the master oscillator cavity mirrors with a stiff construction of steel in order to enhance vibration tolerance, and a novel active cavity control mechanism that represents a combination of the ramp-fire and the ramp-delay-fire techniques (Lemmerz et al., 2017). Thanks to these modifications, a UV frequency stability of 1.8 MHz and a timing stability below 100 ns were simultaneously achieved, thus forming the basis for highly accurate wind measurements. For comparison, the frequency stability of the ALADIN laser is of the order of 8 to 10 MHz (Lux et al., 2021). However, it was found that other error sources limited the accuracy and precision of the A2D wind results. One major cause was identified to be speckle noise in the internal reference path, which was introduced by the use of a fibre to transmit the internal reference signal from the laser to the front optics, where it is injected into the receiver reception path and co-aligned with the atmospheric signal. Slow changes in the intensity distribution of the internal reference signal related to variations in laser frequency, polarization, or (ambient) fibre temperature altered the Mie and Rayleigh internal reference response and, in turn, significantly increased the random error. Consequently, a fibre scrambler was implemented into the A2D in preparation of the Cal/Val campaigns to overcome the detrimental speckle noise effect (Lux et al., 2019). As a result, the frequency variations of the internal reference signal were lowered by a factor of 5 (Mie) and 2 (Rayleigh), respectively, while intensity fluctuations were decreased by 55 % (Mie) and 22 % (Rayleigh). In terms of the Rayleigh random error, which was assessed for the WindVal III campaign wind data with respect to the 2 µm DWL, a considerable reduction by 37 % from 3.32 to 2.08 m s−1 was achieved (Lux et al., 2020a) thanks to the more stable internal reference.
Having overcome the limitation posed by the speckle noise, other deficiencies of the A2D Rayleigh and Mie channel that had been known before emerged more clearly. Regarding the Rayleigh channel, a major error source is related to the alignment sensitivity of the FPIs. Small variations in the incidence angle on the FPIs of a few percent of the total FOV, e.g. introduced by atmospheric inhomogeneity or beam pointing fluctuations, can lead to large wind errors of several metres per second (m s−1). This effect is especially strong within the region of incomplete telescope overlap, i.e. in the instrument's near field, as described above. For the Mie channel, the alignment sensitivity is much less critical, especially in the vertical axis of the fringe; however, a significant systematic error is introduced by the skewness of the imaged FI fringe, which stems from imperfections in the optical system. Owing to the temporal overlap of the atmospheric range gates, strong backscatter gradients that fall within this range gate overlap can result in a shift of the fringe position when the signal is summed up in the image zone. Consequently, the determined Mie responses of the two overlapping range gates are altered, thus deteriorating the Mie wind results.
The issues of the Rayleigh and Mie channel were tackled by refinements of the A2D wind retrieval, which was advanced in the course of the AVATARE and AVATARI data analysis. While the Mie wind errors were reduced by a range gate averaging algorithm, which corrects the Mie winds after the actual wind retrieval, the Rayleigh winds were improved by a novel QC mechanism which was incorporated into the data processing. A more detailed explanation of the two aforementioned error sources and the counteracting retrieval modifications will be provided in two dedicated sections. Prior to that, the A2D wind processing is briefly described.
3.1 The A2D wind retrieval
A flow chart of the A2D processing chain used for the wind retrieval of a selected flight leg is shown in Fig. 4. After the read-in of the required data (initialization file with processing settings, calibration data, digital elevation model (DEM) data, housekeeping data, detector signal data, and aircraft data), geometrical calculations are performed to determine the range gate altitudes, LOS angles, and velocity, as well as the DEM intersection points. The latter are used within the ground detection algorithm. In a next step, the signal levels detected on the Rayleigh and Mie ACCDs are processed, which includes the correction for the solar background and DCO and the consideration of the range and range gate thickness. Afterwards, QC procedures are applied to sort out invalid measurements before the signals from all measurements within one observation are summed up. Up to this stage, the wind retrieval algorithm is identical for the Rayleigh and Mie channel. The transition from the measurement level to the observation level marks the point from which on different methods are applied to derive the wind speed according to the different measurement principles of the two channels.
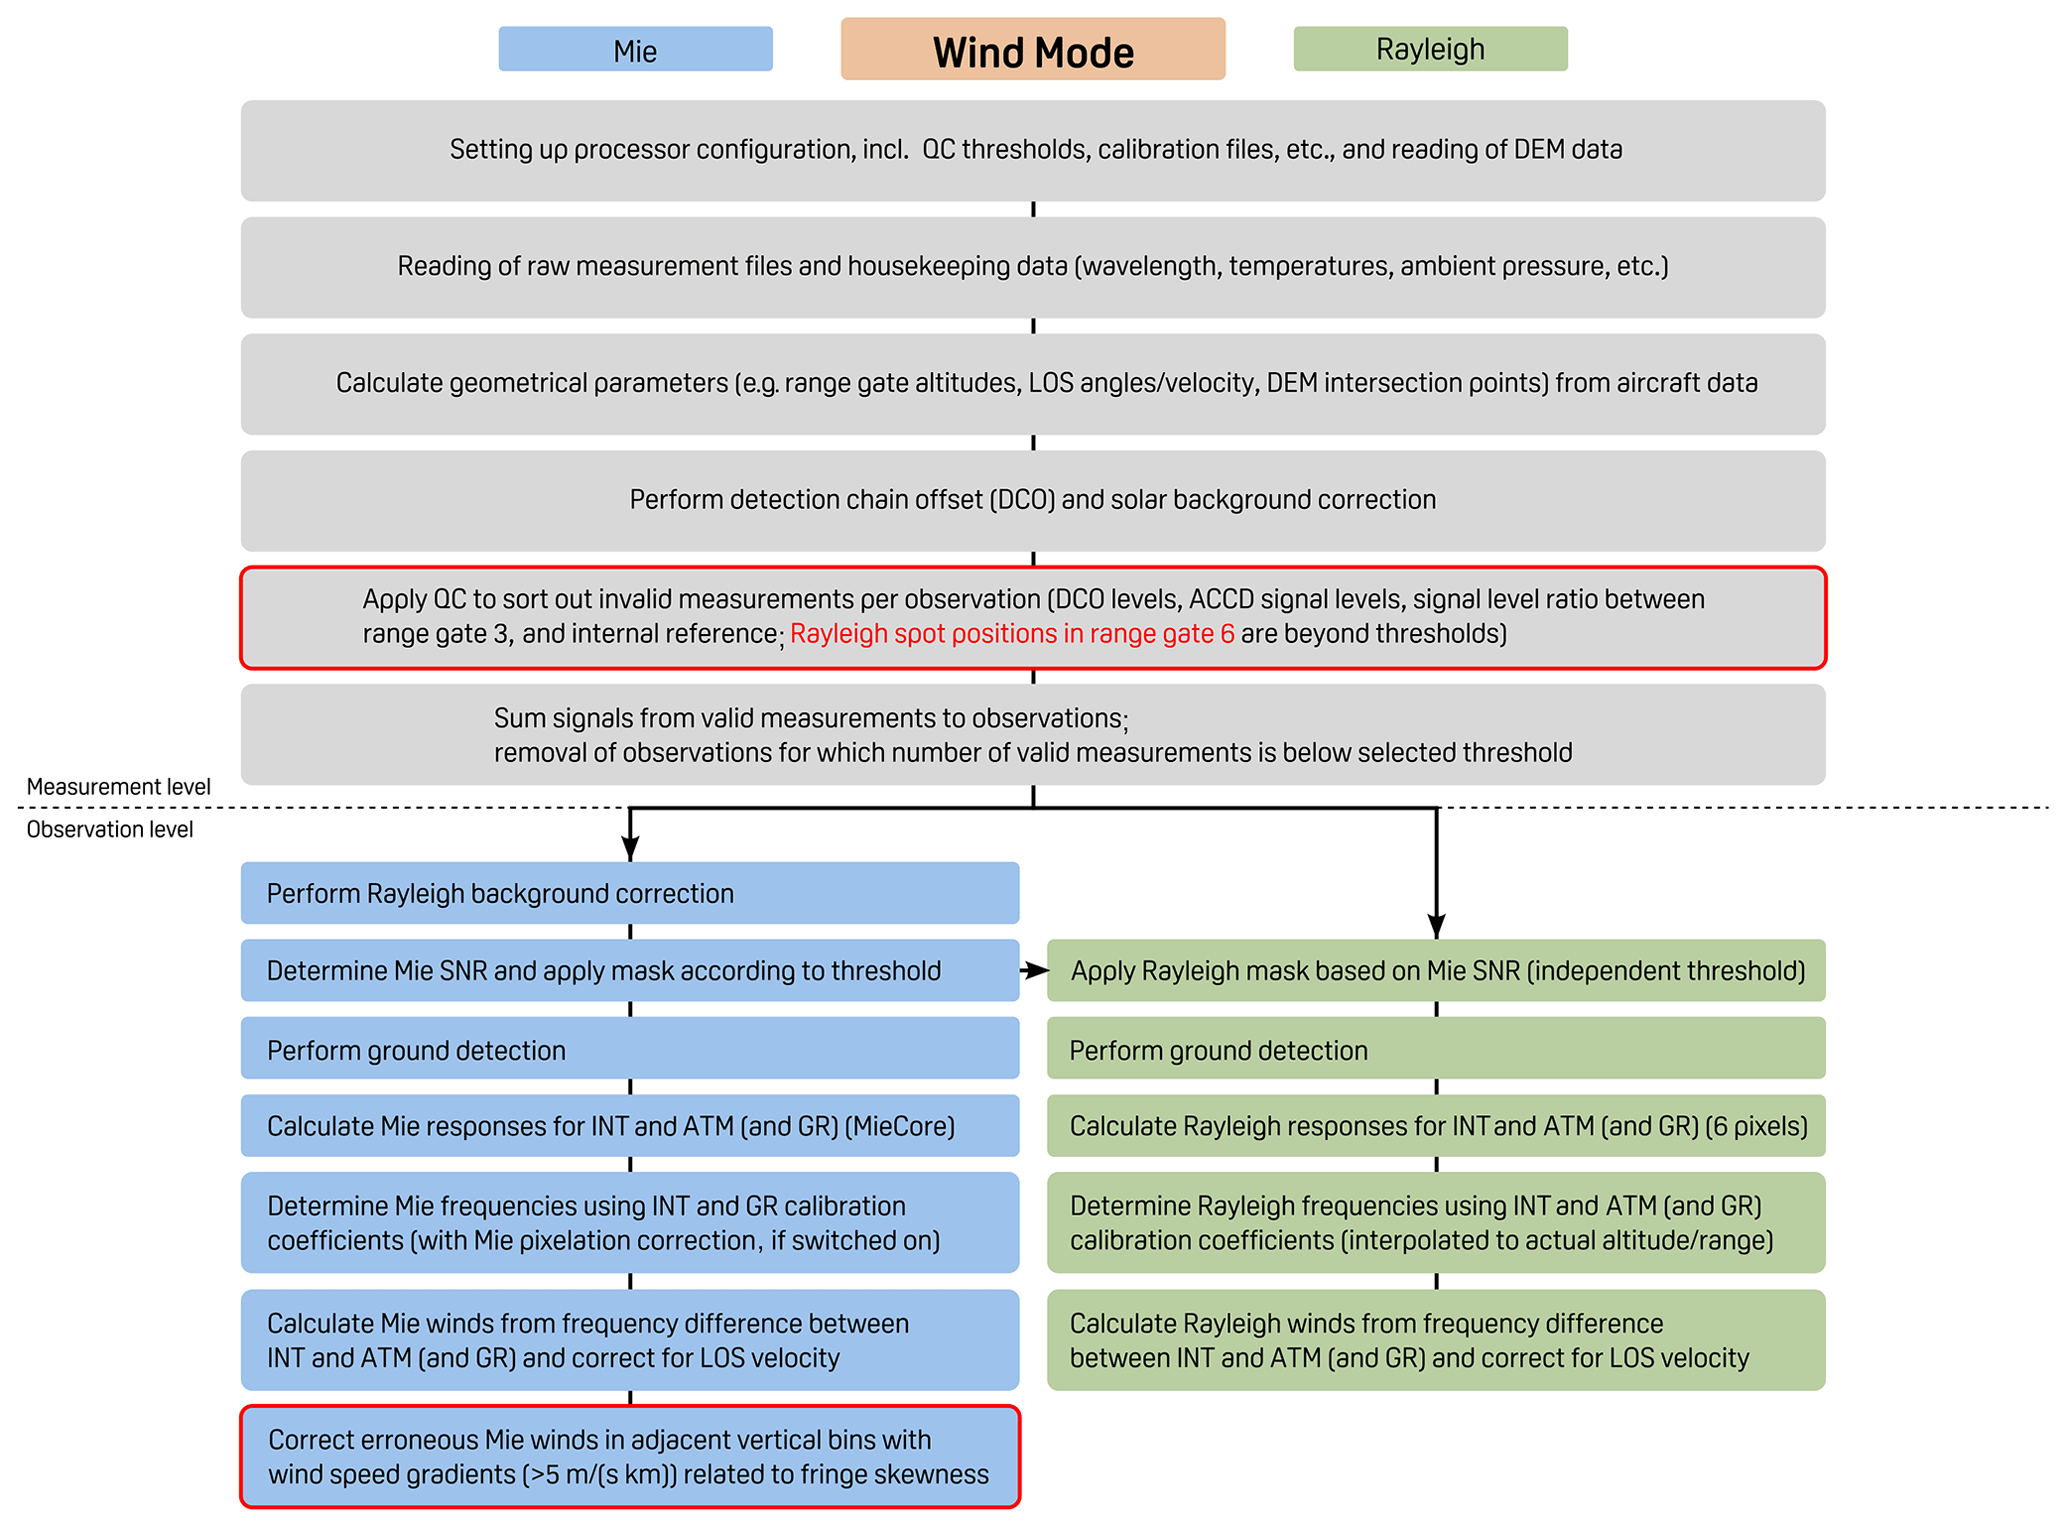
Figure 4Flow chart of the A2D wind retrieval. Refinements that were introduced in the course of the AVATARE and AVATARI data analysis are indicated as red-framed boxes. Note: INT – internal path; ATM – atmospheric path; GR – ground return.
Concerning the Mie channel, the Rayleigh background signal on the detector, which is determined from the so-called MOUSR (Mie Out of Useful Spectral Range) procedure (Lux et al., 2020a), is subtracted prior to the determination of the Mie SNR (see the definition in Marksteiner, 2013) for each bin of the matrix (observation × range gate number). Then, those bins for which the SNR is below the set threshold are flagged as invalid (Mie mask). An independent Mie SNR threshold is set to create a second mask that distinguishes the bins with high and low Mie SNR, i.e. high and low scattering ratio. This mask is inverted and applied on the Rayleigh channel to flag those bins as invalid when the Mie SNR exceeds a certain value (Rayleigh mask). Since the two Mie SNR thresholds can be set independently, a bin (and, hence, a wind result) can be valid in both the Rayleigh and Mie channel, namely when the Mie SNR lies between the two thresholds. This approach is similar to the grouping algorithm that is implemented in the Aeolus L2B processor for discriminating so-called Rayleigh-clear and Mie-cloudy winds (Rennie et al., 2020).
After the masking procedure, the ground detection is performed for both channels. The applied scheme is very similar to that of Aeolus and was developed in the frame of the WindVal II data analysis (Weiler, 2017; Lux et al., 2018). The identification of ground bins leads to additional masks for the two channels that further restrict the number of bins in the final wind curtain. Next, the Mie and Rayleigh responses are derived for each bin through the determination of the FI fringe centroid position and the consideration of the FPI filter transmissions, respectively. Then, the Doppler frequency shift is calculated from the atmospheric and internal reference path responses using the respective calibration data. Considering the LOS velocity of the aircraft, one finally obtains the Mie and Rayleigh wind speed for each valid bin.
The modifications of the A2D wind retrieval that were implemented for mitigating and reducing the Rayleigh and Mie error sources in this study are indicated as red-framed boxes in Fig. 4. They will be introduced in the following sections.
3.2 Mitigation of Rayleigh wind errors
As pointed out in previous publications on the A2D wind data retrieval (Lux et al., 2018, 2020a), one major aspect that limits the Rayleigh wind accuracy is the high sensitivity of the Rayleigh spectrometer response to variations in the incidence angle on the FPI. Despite the active transmit–receive co-alignment loop, atmospheric turbulence and the effect of strong cloud backscatter onto the co-alignment algorithm, as well as laser beam pointing variations, either from inside the laser or from aircraft vibrations affecting the folding mirrors of the instrument, cause residual angular beam variations. Laboratory studies have shown that the Rayleigh response is primarily influenced by vertical incidence angle changes, whereas it is almost insensitive to angle changes along the horizontal axis of the FPI. In particular, it was demonstrated that vertical angular variations in the atmospheric beam of 1 µrad, i.e. 1 % of the 100 µm FOV, causes an error in the wind speed determination of about 0.4 m s−1. The beam variations, as measured by a UV camera inside the A2D front optics (see Fig. 1 in Lux et al., 2018) are of the order of 5 to 10 µrad in both the horizontal and vertical directions in the case that the co-alignment loop is not disturbed, e.g. by cirrus clouds in the near field that cause saturation of the UV camera. Consequently, Rayleigh wind errors by at least 2 to 4 m s−1 are introduced by angular variations. The introduced error manifests as vertical stripes in the two-dimensional Rayleigh wind curtain, since it is correlated among the atmospheric range gates. The mean error varies from observation to observation according to the changes in the angle of incidence over several tens of seconds, which results in a fluctuating wind error from profile to profile.
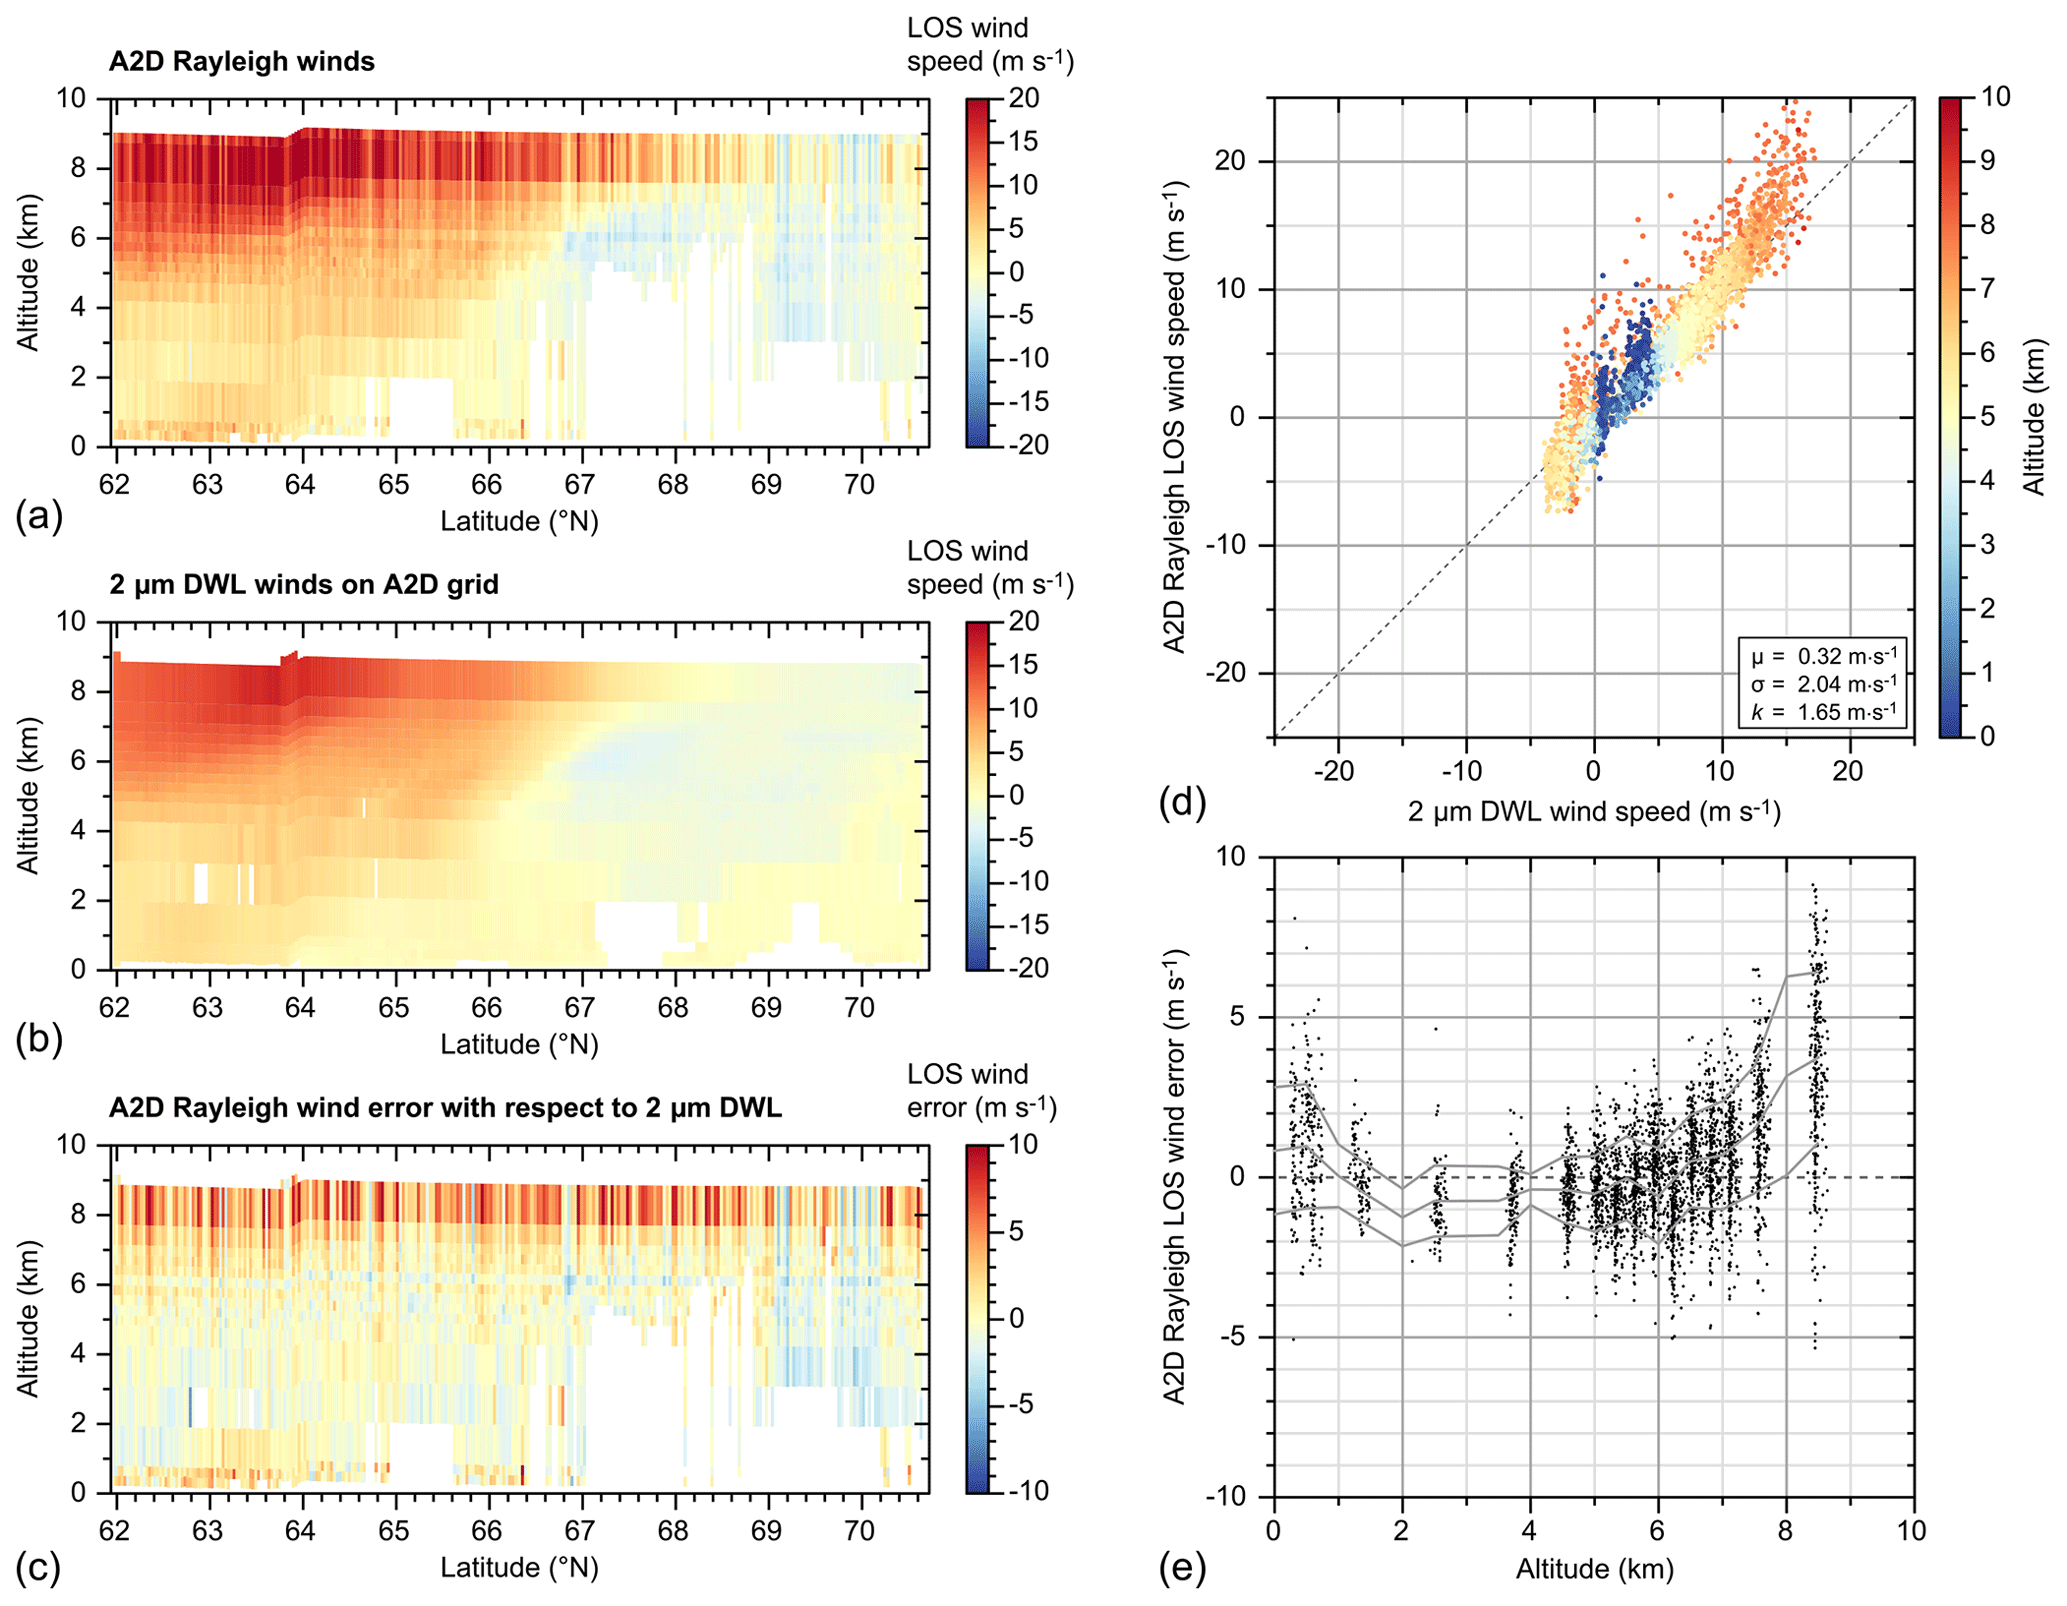
Figure 5A2D Rayleigh wind for the AVATARI underflight on 16 September 2019 before the retrieval modifications. (a) A2D Rayleigh wind data, (b) 2 µm DWL wind data averaged onto the A2D measurement grid, (c) wind speed differences between (a) and (b), and (d) scatterplots comparing the wind data from (a) and (b), where the colour-coding describes the centre altitude of the considered range bin. Panel (e) depicts the altitude dependence of the A2D Rayleigh wind error with respect to the 2 µm DWL. The grey lines indicate the mean and standard deviation of the wind error in bins of 500 m.
This characteristic also becomes obvious from the example of the Aeolus underflight on 16 September 2019 in Fig. 5. The vertical pattern of the A2D Rayleigh curtain in Fig. 5a can be traced back to the angular variations. Comparison with the 2 µm DWL data, averaged onto the A2D measurement grid and projected onto the A2D LOS in Fig. 5b allows the derivation of the wind error per bin which is shown in Fig. 5c. The correlation of the A2D and 2 µm DWL wind data (Fig. 5d) reveals a positive bias, which is mainly evident for winds that were measured at higher altitudes, i.e. in the near field of the instrument. The dependence of the Rayleigh wind error upon the altitude, as depicted in Fig. 5e, illustrates this relation.
The inset in Fig. 5d includes the A2D systematic wind error with respect to the 2 µm DWL, expressed as the mean bias as follows:
i.e. the mean of the wind speed differences that were measured with the two lidars, with n being the number of comparable winds after the exclusion of gross errors (see Sect. 3.41). The A2D random error is given in terms of the standard deviation as follows:
In addition to the standard deviation, the scaled median absolute deviation (scaled MAD) is calculated according to the following:
The scaled MAD is a more robust measure of the wind error variability than the standard deviation, as it is more resilient to outliers in the dataset. If the analysed data are normally distributed, the standard deviation and scaled MAD are identical.
The increasingly positive bias towards the instrument confirms the incomplete telescope overlap which reduces backscatter signal and emphasizes the return from the large angle parts of the field, thus both aggravating the susceptibility of the Rayleigh channel to angular variations. Nevertheless, the increased sensitivity of the spectrometer response from near-field backscatter signals to alignment changes can be exploited to correct for the associated wind error.
The idea is to apply a QC mechanism which filters only those measurements within an observation for which the transmit path and receive path are well aligned and discard those measurements for which large deviations from the optimum alignment occur. This approach, however, requires a parameter that measures the quality of the co-alignment. In a first attempt to develop a QC scheme, the wind error with respect to the 2 µm DWL was correlated with the intensity of the backscatter signal. However, the correlation was found to be very poor, so the filtering of measurements according to the signal intensity did not improve the accuracy of the Rayleigh winds. Much better correlation was found between the wind error and the horizontal Rayleigh spot positions, which are determined as the first moments of the intensities measured on pixels 0 to 7 (spot A, counted from 0) and pixels 8 to 15 (spot B; Fig. 3c). Interestingly, the signal intensities that are transmitted through the two FPI bandpass filters of the ALADIN Rayleigh channel during a dedicated calibration mode and their temporal evolution are also exploited for monitoring the Aeolus instrumental alignment and potentially ongoing drifts (Witschas et al., 2021).
The scatterplot in Fig. 6 illustrates the good correlation of the wind error with the spot position, featuring almost linear relationships for different groups of scatters according to the range gate. Particularly in range gate no. 6, i.e. the second uppermost atmospheric range gate, a steep slope is apparent, which confirms that the sensitivity of the Rayleigh spectrometer to angular variations is highest in the near field of the instrument. Note that the uppermost atmospheric range gate no. 5 is not useful due to the very small telescope overlap. For the purpose of filtering only measurements with good co-alignment, an optimum spot position is determined for which the wind error in the near field (range gate no. 6) decreases to near zero. This procedure is illustrated in Fig. 6 for the underflight on 16 September 2019, where the optimum position of spot B is determined to be 11.617 pixels. The Rayleigh wind error that is caused by alignment fluctuations is correlated among all range gates, since variations in the FPI incidence angle influence the Rayleigh spectrometer response independent of the vertical integration setting. This becomes obvious from Fig. 6, where the error is also close to zero for those wind results that were measured in the other range gates at times when the spot position in range gate no. 6 is close to the determined optimum. Therefore, it is sufficient to only consider the most sensitive range gate no. 6 for the relationship between spot position and wind error.
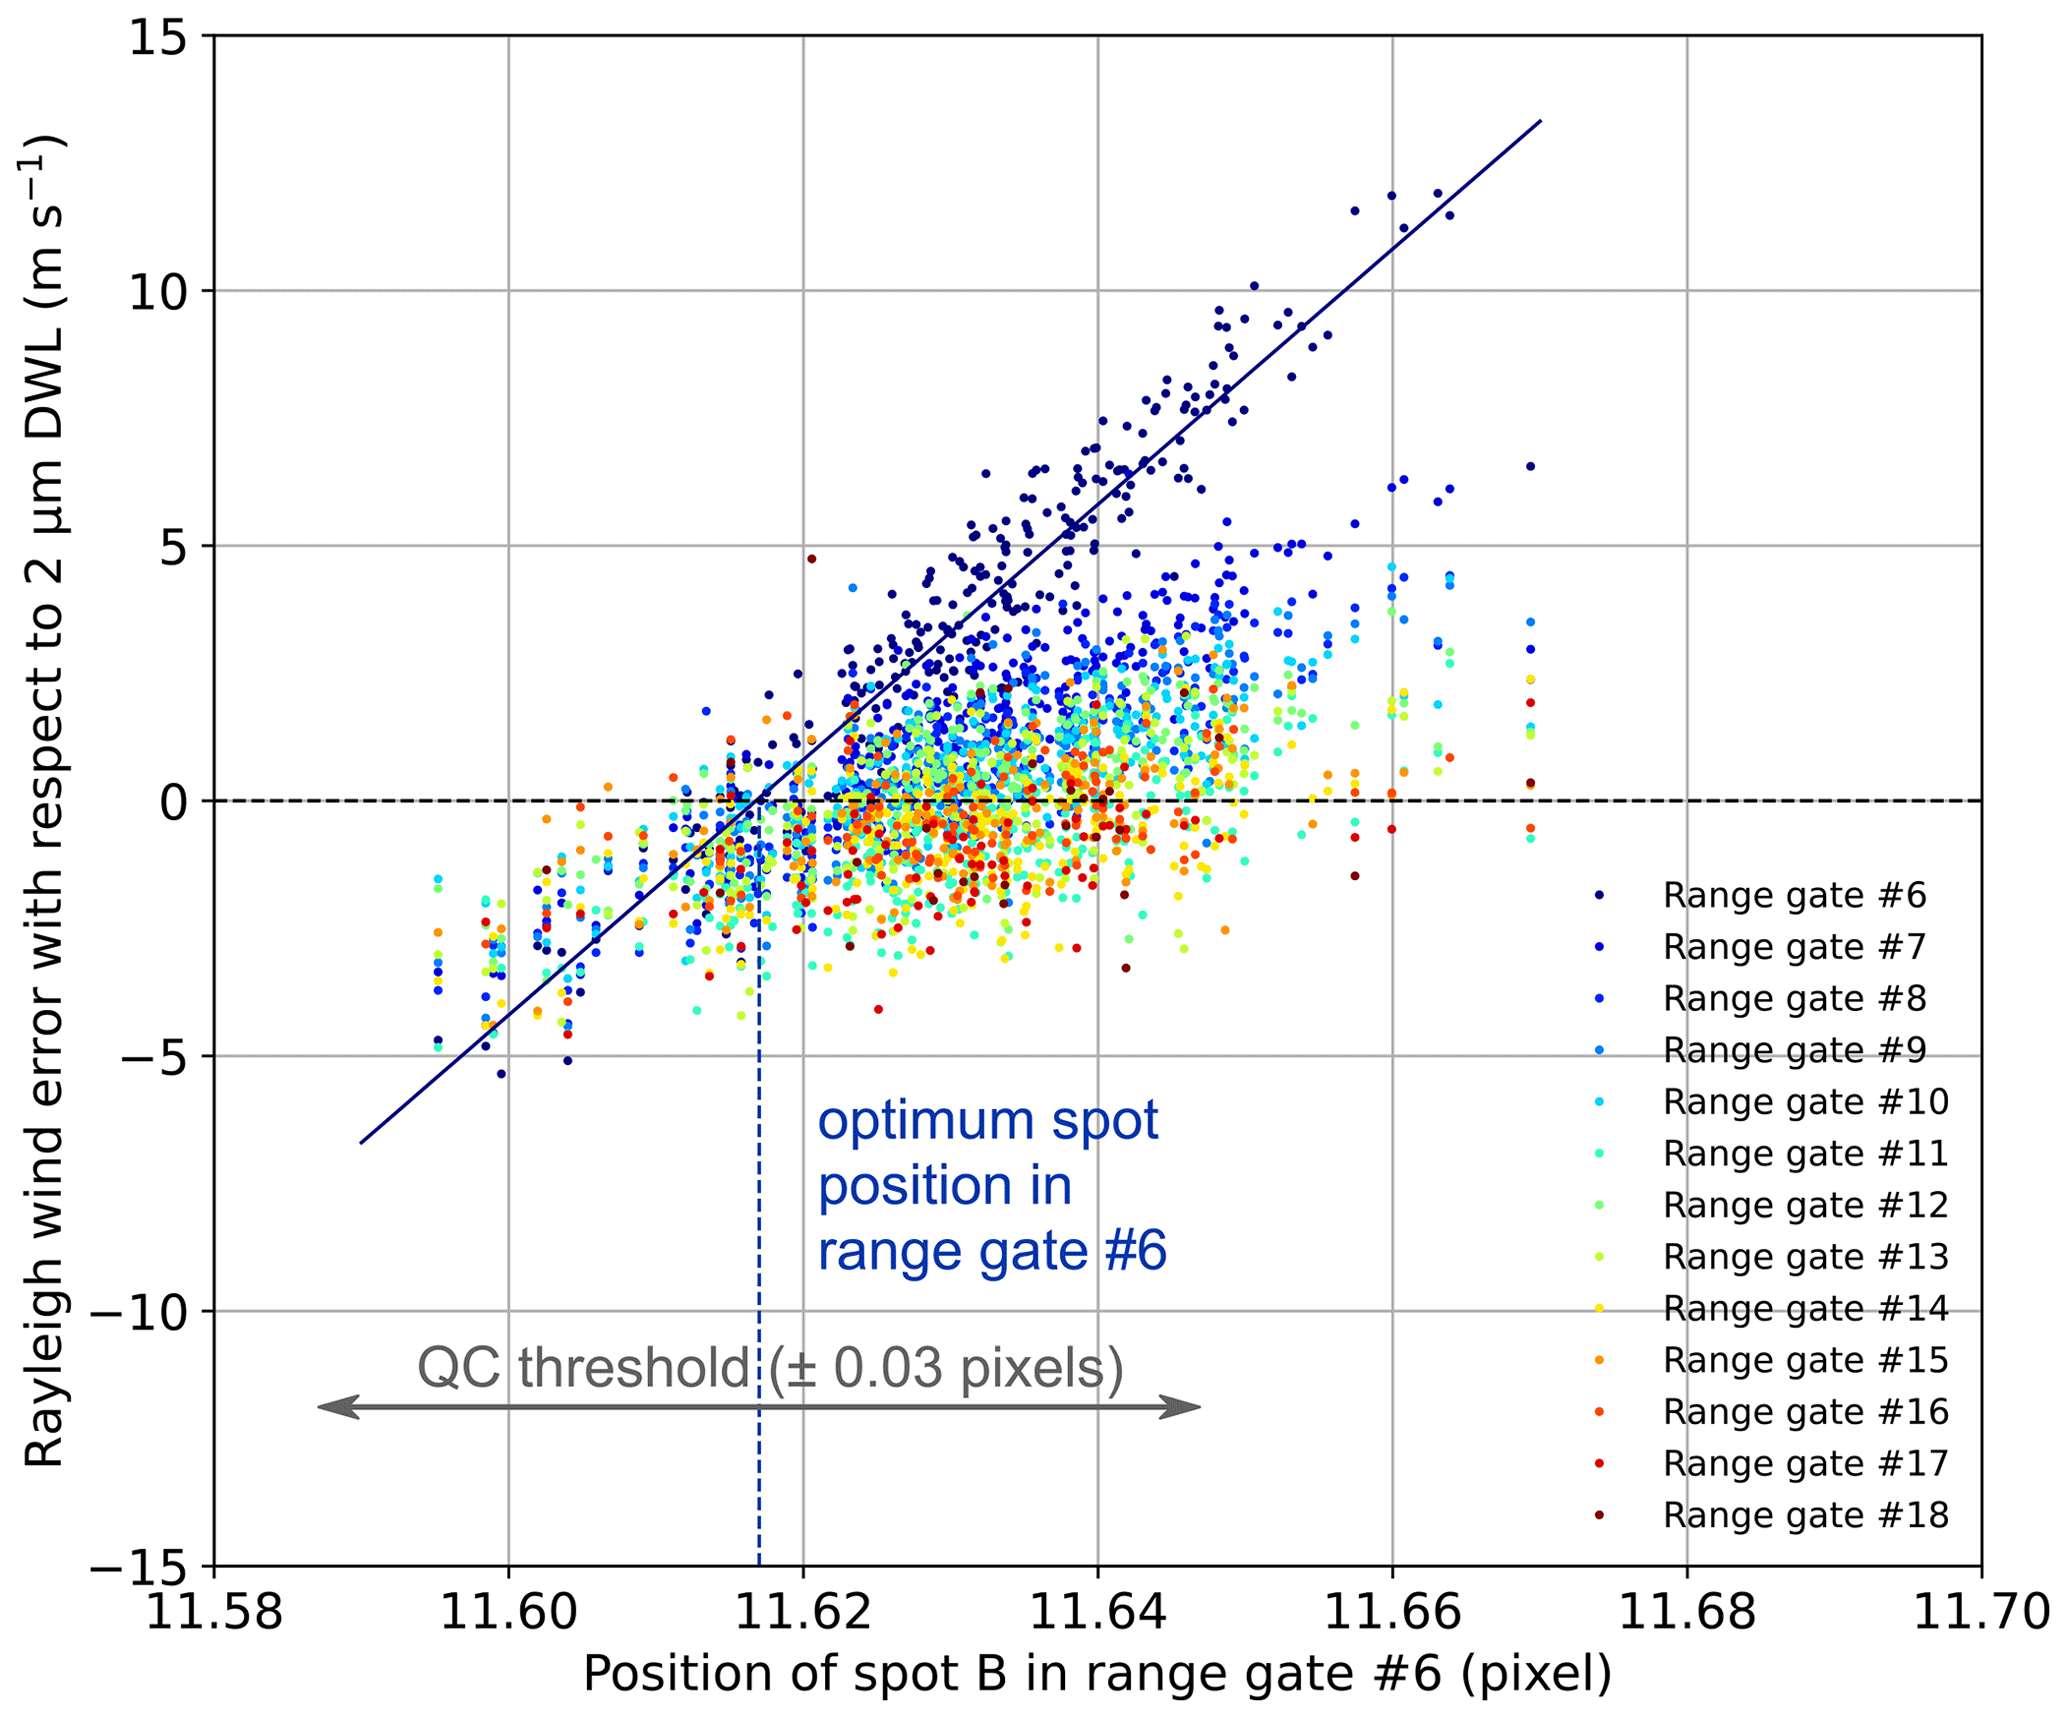
Figure 6A2D Rayleigh wind speed difference with respect to the 2 µm DWL (i.e. wind error) in dependence on the horizontal position of spot B for the AVATARI underflight on 16 September 2019. The scatters are colour-coded according to the A2D range gate. An optimum spot position is determined from those wind results in the near field (range gate no. 6; blue scatters) for which the wind error is zero. Measurements for which the spot position in range gate no. 6 deviates from the optimum by more than 0.03 pixels are filtered out by the QC.
For geometrical reasons, the horizontal spot motions of the two filters are strongly correlated to each other, e.g. both spots move to the periphery or to the centre of the Rayleigh ACCD symmetrically. The reason why spot B is preferred over spot A is the higher sensitivity of its position to angular variations, which is mainly due to the fact that filter B is passed after filter A, and the beam has, thus, travelled a longer path before being incident on the ACCD. The higher alignment sensitivity of spot B was confirmed by analysing the correlation between the spot position in range gate no. 6 and the A2D wind error for all Aeolus underflights from the AVATARE and AVATARI campaigns.
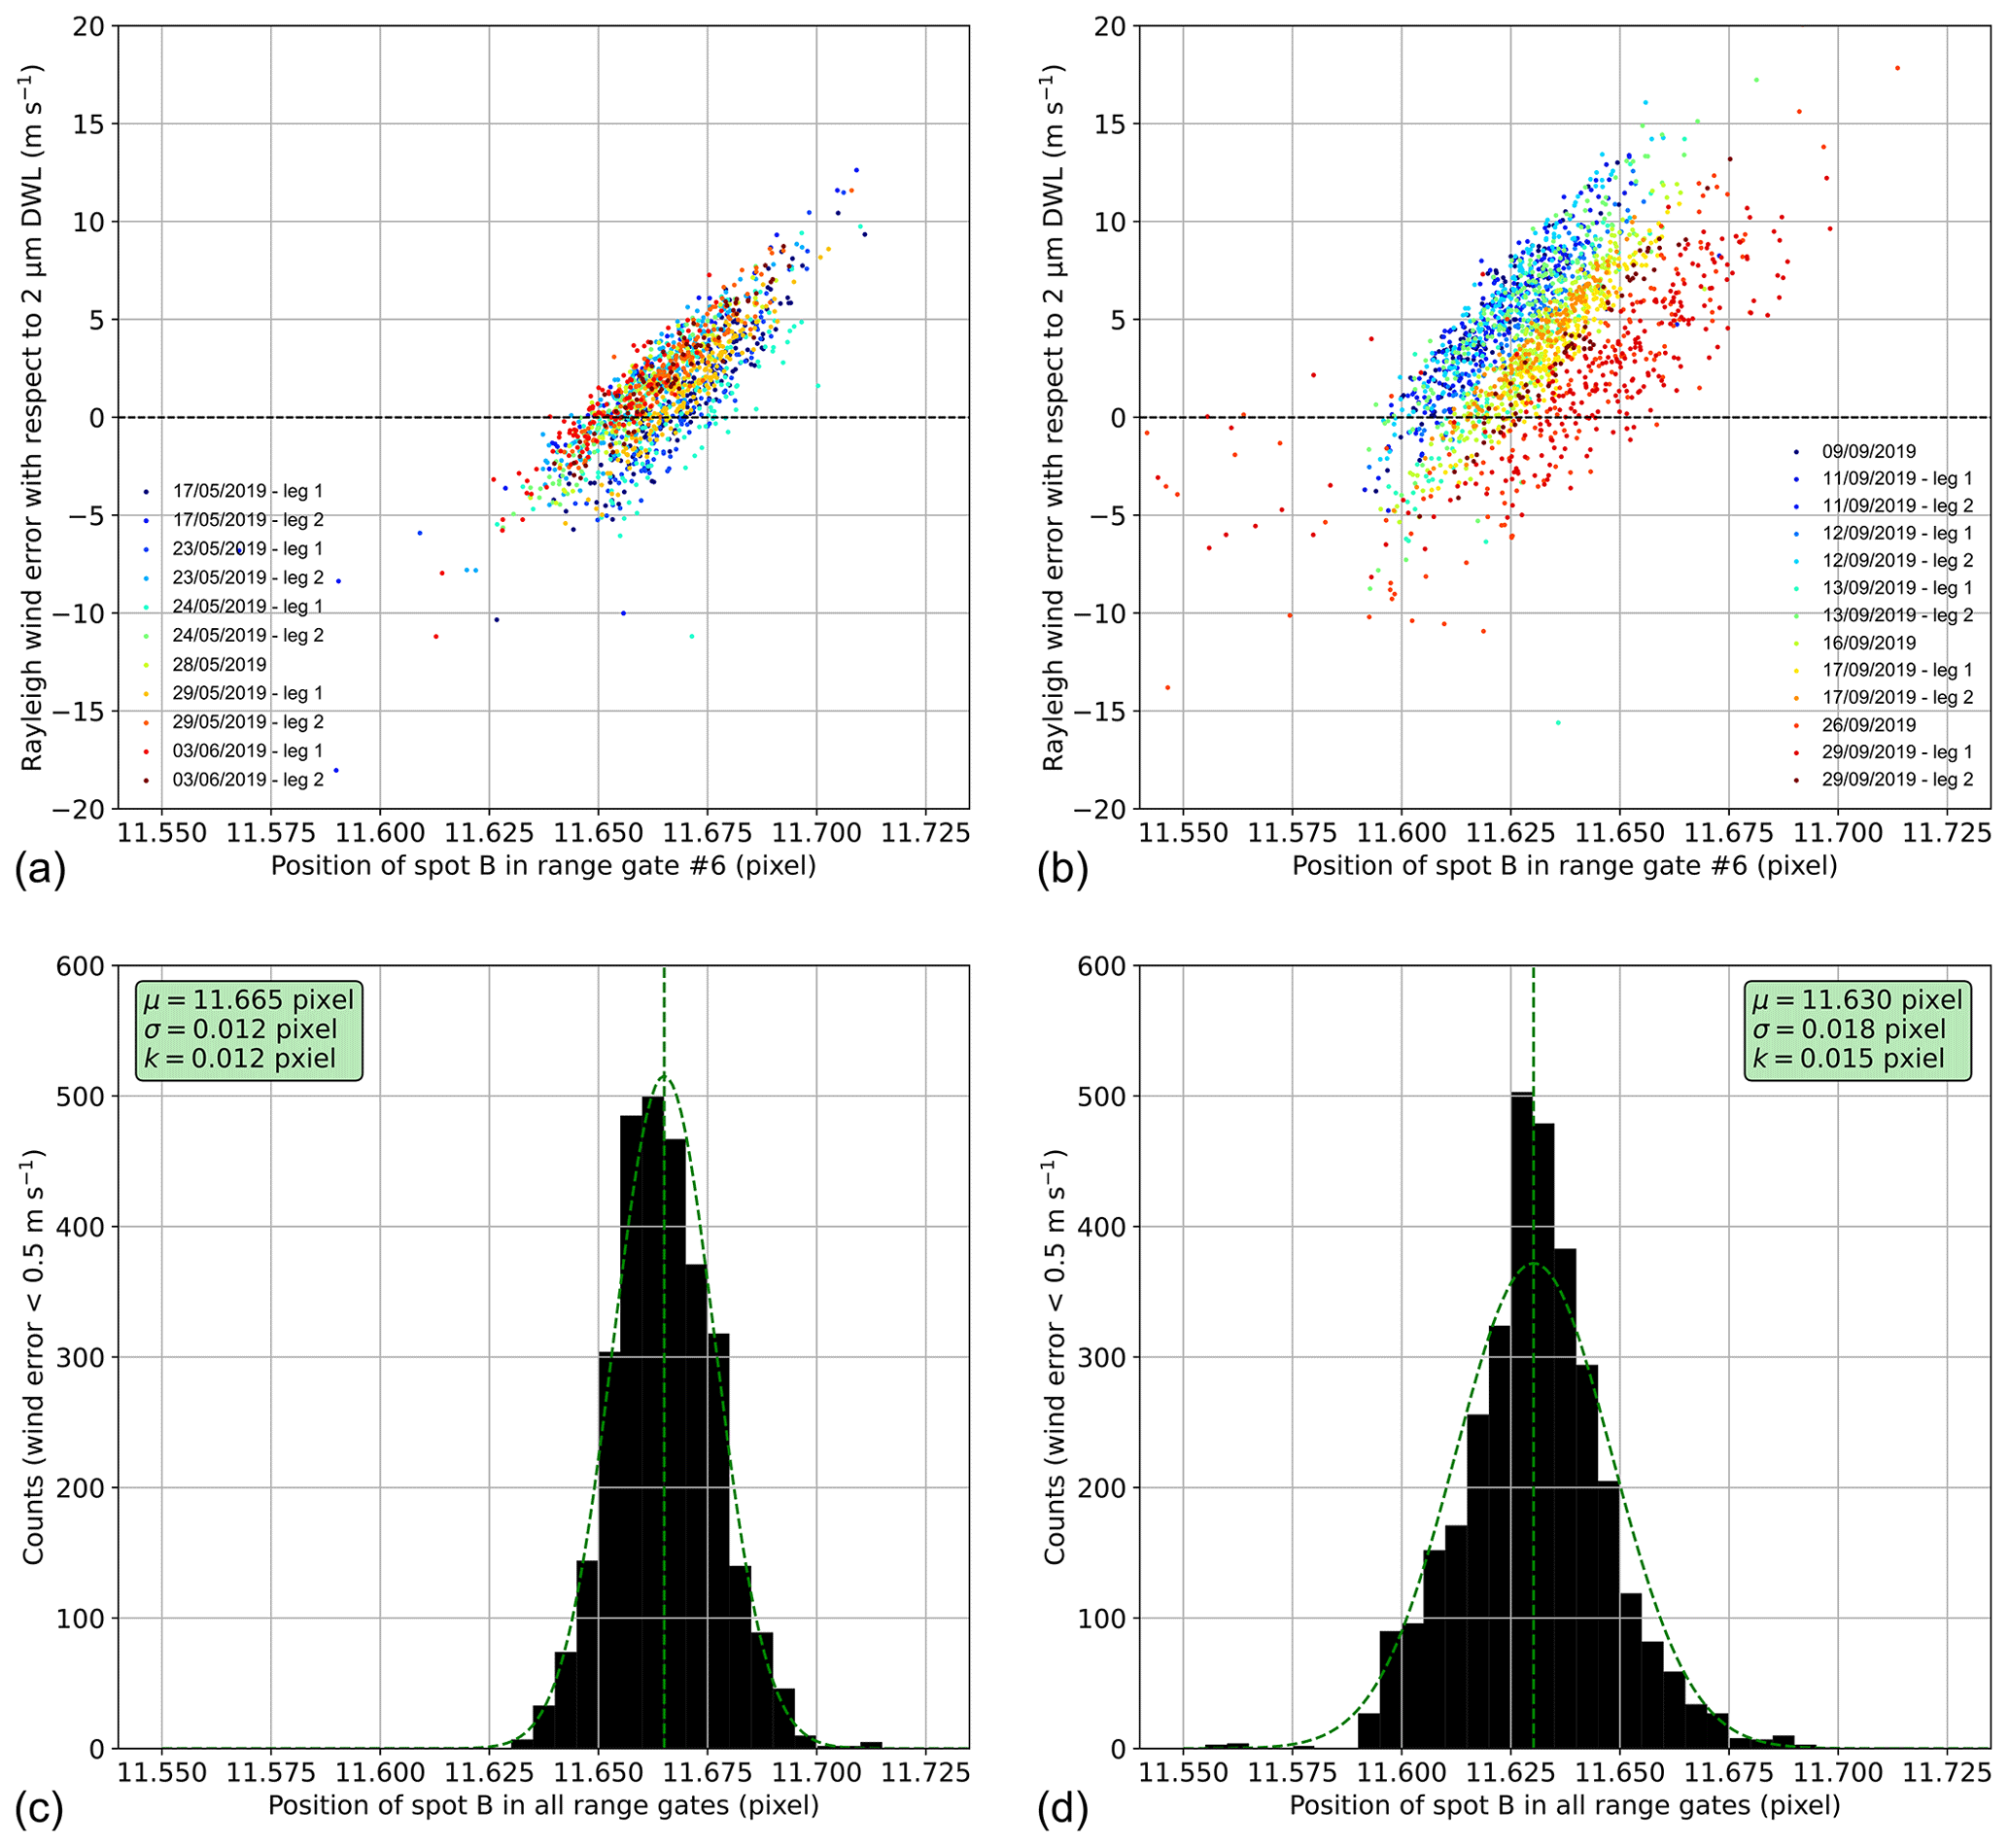
Figure 7A2D Rayleigh wind error with respect to the 2 µm DWL in dependence on the position of spot B in range gate no. 6 for (a) the entire AVATARE campaign and (b) the entire AVATARI campaign (except for the underflights on 22 and 23 September 2019). The scatters are colour-coded according to the different Aeolus underflight legs. Panels (c) and (d) show histograms of spot positions from all range gates for which the wind error is m s−1 (bin size of 0.005 pixel).
The scatterplots in Fig. 7a and b show this relationship for the data from AVATARE and AVATARI, respectively, together with histograms that illustrate the distribution of spot positions for which the wind error is below ±0.5 m s−1. Note that the histograms include data from all atmospheric range gates in order to provide a sufficient amount of wind results for deriving meaningful statistics. As observed for the example in Fig. 6, a clear correlation between the spot position and wind error is evident, which allows us to precisely determine the optimum spot position for each flight leg. The latter are colour-coded in the scatterplots, thus providing information on the variability in the optimum position during the campaigns.
While the optimum position did not change much over the course of AVATARE, a clear trend to larger values is visible as the AVATARI campaign proceeded. This is most likely related to an alignment drift that occurred over the nearly 3 weeks between the first and last underflight and also manifests in a wider distribution of ideal spot positions in the histogram (Fig. 7d). It is important to note that, in addition to the horizontal spot motions which are analysed here, alignment changes can also involve a vertical motion of the Rayleigh spots. Such motions can, however, not be detected after the summation of the signals from the image zone to one line in lidar mode, as explained in Sect. 3. Sensitivity studies have revealed that variations in the vertical spot position cause much stronger systematic error than horizontal motions. Comparison of the two campaign datasets also shows that the respective optimum spot positions slightly deviate from each other (11.67 pixels – AVATARE; 11.63 pixels – AVATARI), suggesting a very small change in the instrument alignment. However, considering that the instrument was dismounted and reintegrated into the Falcon aircraft in between, the reproducibility of the optimum is rather impressive.
For the actual QC procedure, the optimum spot position is determined for each flight leg, i.e. wind scene, individually. Then, measurements for which the spot position deviates by more than 0.03 pixels are rejected before the summation of signals to the observational level. The threshold value of 0.03 pixels was found to provide the best filtering in terms of the improvement of the wind results. At larger thresholds, the QC is less efficient; at smaller thresholds, the number of measurements that pass the QC is so small that the signal levels per observation become too low, and the wind results are significantly affected by noise. This corresponds to 2 % of the allowed alignment fluctuations of the 1.5 pixels spot width, which corresponds to a 100 µrad FOV in the atmosphere. Hence, only measurements for which the horizontal beam variations are less than about ±2 µrad from the ideal incidence angle on the FPI pass the QC. The UV camera data used for the transmit–receive co-alignment loop shows that the angular variations have comparable amplitude in both beam directions for most of the underflights. Consequently, the applied QC approach, in principle, limits the Rayleigh wind error introduced by (vertical) angular variations to about 4 µrad ⋅ 0.4 m s−1 µrad−1 = 1.6 m s−1.
Regarding all wind scenes from the two campaigns, the portion of invalid measurements is typically between 30 % and 60 %, underlining the significant impact of the QC on the data processing. It should be noted that the altitude-dependent relationship between the wind error and the spot position in range gate no. 6 is not always as linear as in the example shown in Fig. 6. Moreover, in some cases, only very few wind results are available in some of the range gates beyond no. 6, resulting in a poor correlation. Therefore, the determination of altitude-dependent linear regression functions for performing a wind correction instead of a QC scheme is difficult to be implemented in the wind retrieval. Note also that the described QC is likewise applied to Mie measurements, although the Mie response is less sensitive to alignment variations. Nevertheless, it is the current method to remove measurements with suboptimal co-alignment from the Mie data as well, although the impact is found to be very small.
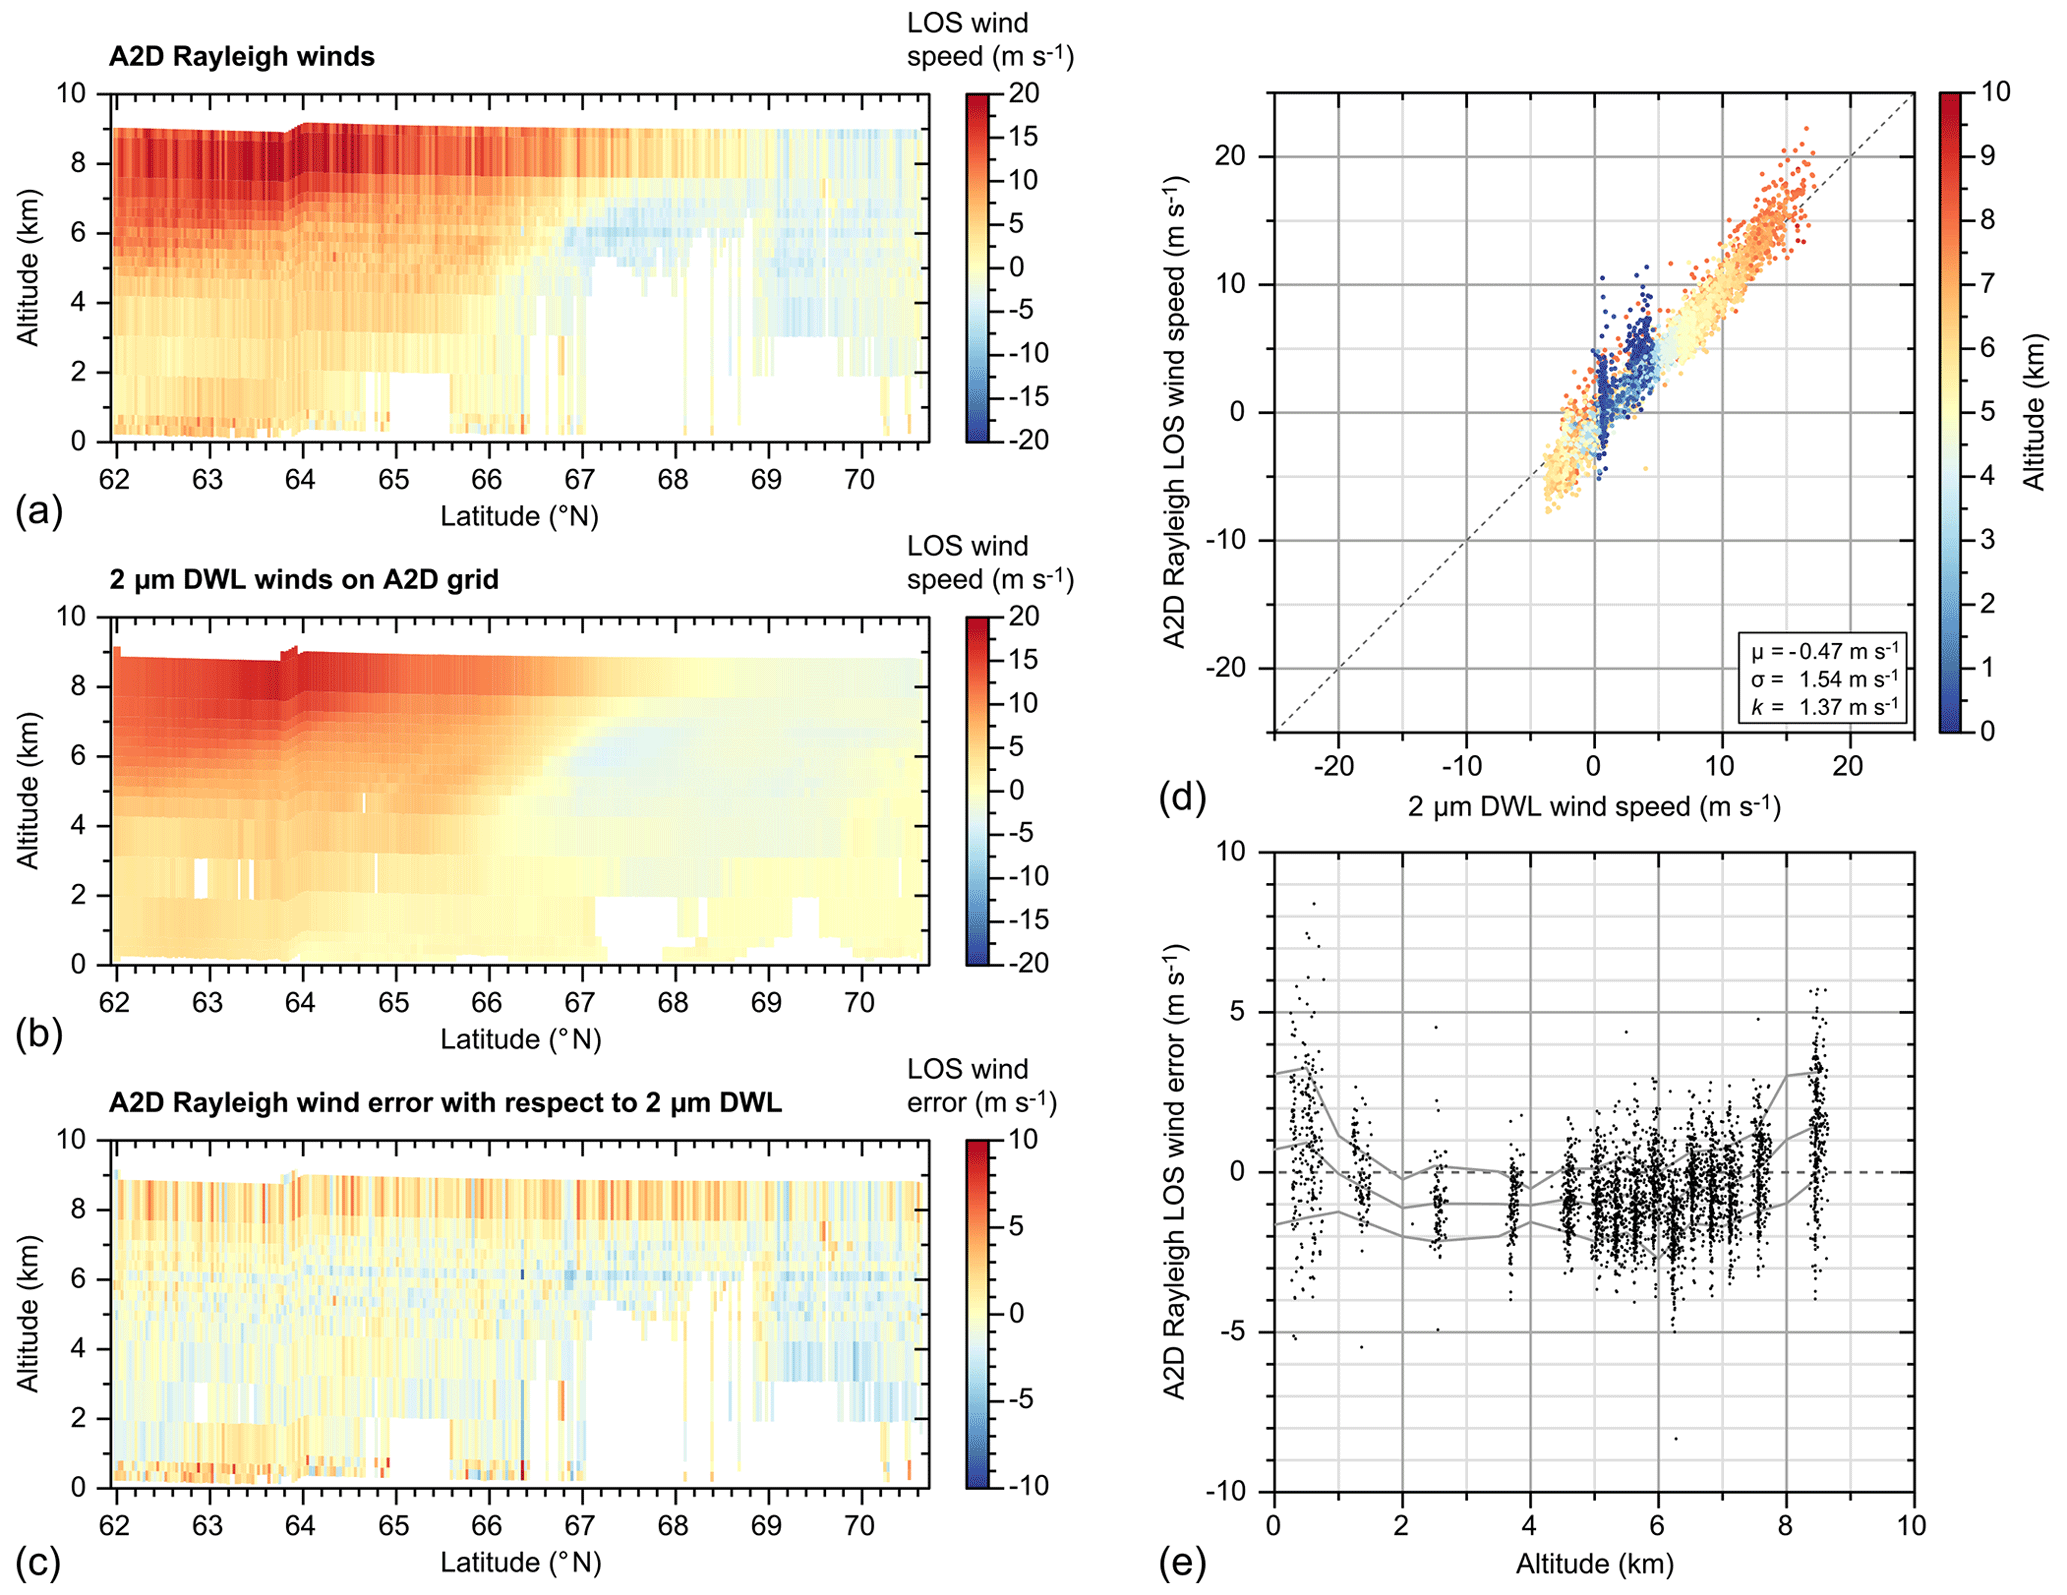
Figure 8A2D Rayleigh wind for the underflight on 16 September 2019, as in Fig. 5, but with usage of the novel spot position QC.
The effect of the new QC on the wind results from 16 September 2019 is depicted in Fig. 8. The Rayleigh curtain is apparently much smoother than without the QC, as the latter significantly diminishes the wind error, and, hence, the magnitude of the error variations from observation to observation that produce the vertical stripes of the curtain. The reduction in wind error is also clearly visible in the scatterplot which shows a much better correlation between the A2D Rayleigh and the 2 µm DWL reference winds, although the mean bias is slightly increased from 0.32 to −0.47 m s−1. However, the standard deviation and the scaled MAD are decreased by 25 % from 2.04 to 1.54 m s−1 and by 17 % from 1.65 to 1.37 m s−1, respectively. The improvement is most pronounced in the near-field winds at altitudes above 7 km, where the large positive bias is effectively reduced by several metres per second (m s−1), albeit a small residual trend to positive biases is still evident towards higher altitudes in Fig. 8e. For instance, the bias of those winds that were measured in the uppermost atmospheric range gate at altitudes around 8.5 km is decreased from 3.71 to 1.49 m s−1. Consequently, the new QC allows the exploitation of the full vertical measurement range of the A2D, whereas the wind data from the first 1.5 to 2 km below the aircraft had to be discarded in previous campaigns due to the large systematic error.
The developed QC mechanism requires the 2 µm DWL wind data as a reference to determine the optimum spot position for each flight leg. However, it should be mentioned that the optimum values vary by only about 0.02 pixels from leg to leg, except for the flights on 22 and 23 September, where the position of spot B was around 12.1 pixels. This is probably due to changes in the alignment that had occurred after a cooling of the instrument in the hangar, and the data from these two flights were, therefore, excluded from the statistics. Hence, the utilization of a fixed optimum for an entire campaign still leads to an improvement of the wind quality. The impact was found to be about half as large in this case.
3.3 Reduction in Mie wind errors
The major error source which currently limits the accuracy of the A2D Mie wind results is of a different origin than that of the Rayleigh channel and, thus, still present after applying the above-described QC algorithm. The Mie response, i.e. the fringe centroid position, is much less sensitive to variations in the incidence angle on the FI. However, it is affected by the shape of the fringe in combination with the temporal range gate overlap of the ACCD detector which has been introduced above. Imperfections of the FI and its illumination cause aberrations such that the fringe is not a straight line but slightly skewed and/or not evenly illuminated from top to bottom. This effect is more pronounced for the A2D compared to ALADIN where the fringe exhibits a smaller degree of skewness. The implications of the Mie skewness for the A2D Mie wind bias are illustrated in Fig. 9. The Mie fringe is imaged onto the 16 × 16 pixel image zone of the ACCD, which is continuously illuminated by the atmospheric backscatter signals. One image corresponds to a predefined range gate, where the vertical resolution of the range gates is determined by the sampling time for one image. For instance, an integration time of Δt = 2.1 µs corresponds to a range resolution of m or a height resolution of 315 m m, respectively. The signal of one range gate is summed up by pushing down the charges, row by row, into the transfer row of the ACCD, while the signal from the subjacent range gate already appears on the image zone. This process takes 1 µs, which leads to a range gate overlap and a vertical smearing of the signal. Consequently, the signal summation in the transfer row is influenced by the signal intensity of each line in the image zone during the transfer process and, hence, by the scattering ratio in the range gate overlap region.
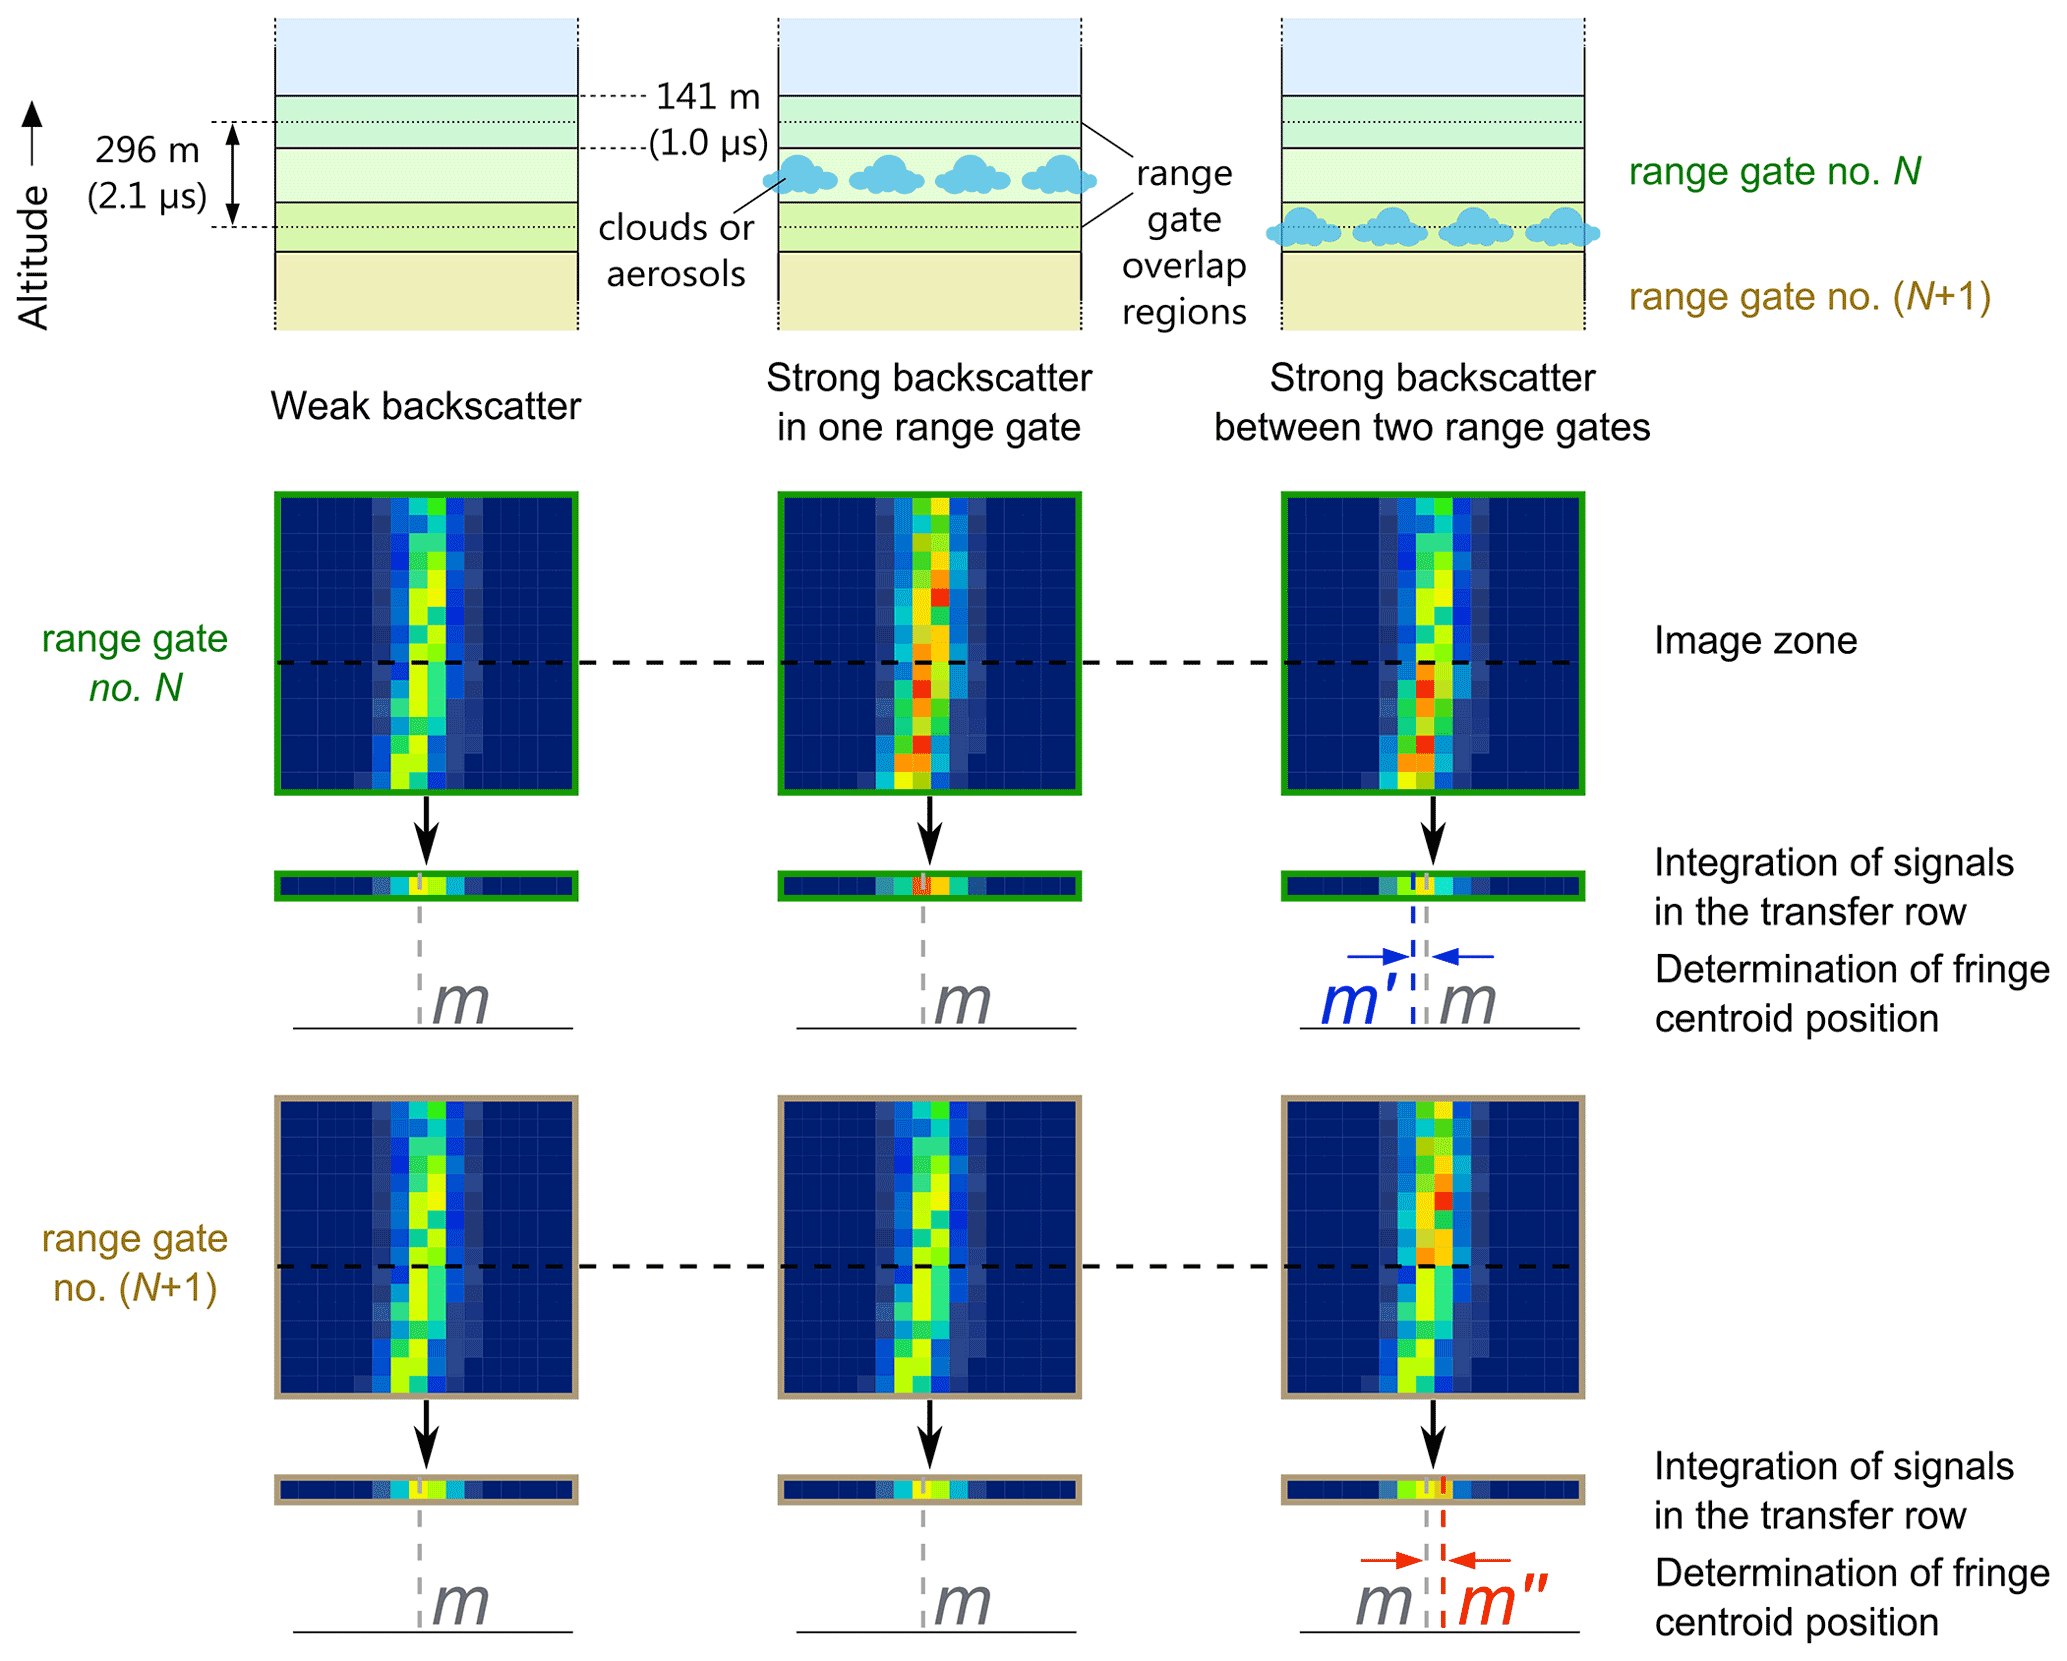
Figure 9Illustration of Mie wind errors due to fringe skewness (see the text for an explanation).
In case of equally strong or weak backscatter in the overlapping range gates (left column of Fig. 9), the fringe centroid position m, which is determined from the summed signal intensities on the 16 transfer row pixels, is not affected. The same holds true for the situation when strong backscatter signals, e.g. from a thick cloud, are present in only one range gate (middle column). However, when a thick cloud falls within the range gate overlap region (right column), the contribution of the strong backscatter signals is divided among the neighbouring range gates. The lower part of the fringe image for range gate no. N is more intense than the upper part, whereas it is the opposite for range gate no. (N+1). Due to the fringe skewness, the different weighting of the 16 lines of the fringe alters the summed signal distribution in the transfer row. As a result, the derived centroid positions m′ and m′′ are down- and upshifted in frequency, respectively, leading to opposing biases of the wind speeds that are then retrieved for the two adjacent range gates. Note that this effect on the Mie responses does not occur for a straight fringe, as a potentially different weighting of the 16 lines of the image zone would not affect the signal distribution in the transfer row. Interestingly, a similar effect is observed for coherent DWLs and radar instruments at cloud boundaries in conjunction with laser chirp causing artefacts in the measured wind data and introducing signal offsets (Bühl et al., 2012).
The described effect not only occurs in instances when strong backscatter gradients fall into the range gate overlap region but also in the case of strong vertical wind gradients that cannot be resolved by the A2D. This also results in a dipole structure of the wind bias, as the fringe position is under- and overestimated in neighbouring range gates, respectively, even in absence of a fringe skewness. Therefore, systematic errors introduced by the range gate overlap in combination with strong vertical wind gradients are likely to be also present for ALADIN.
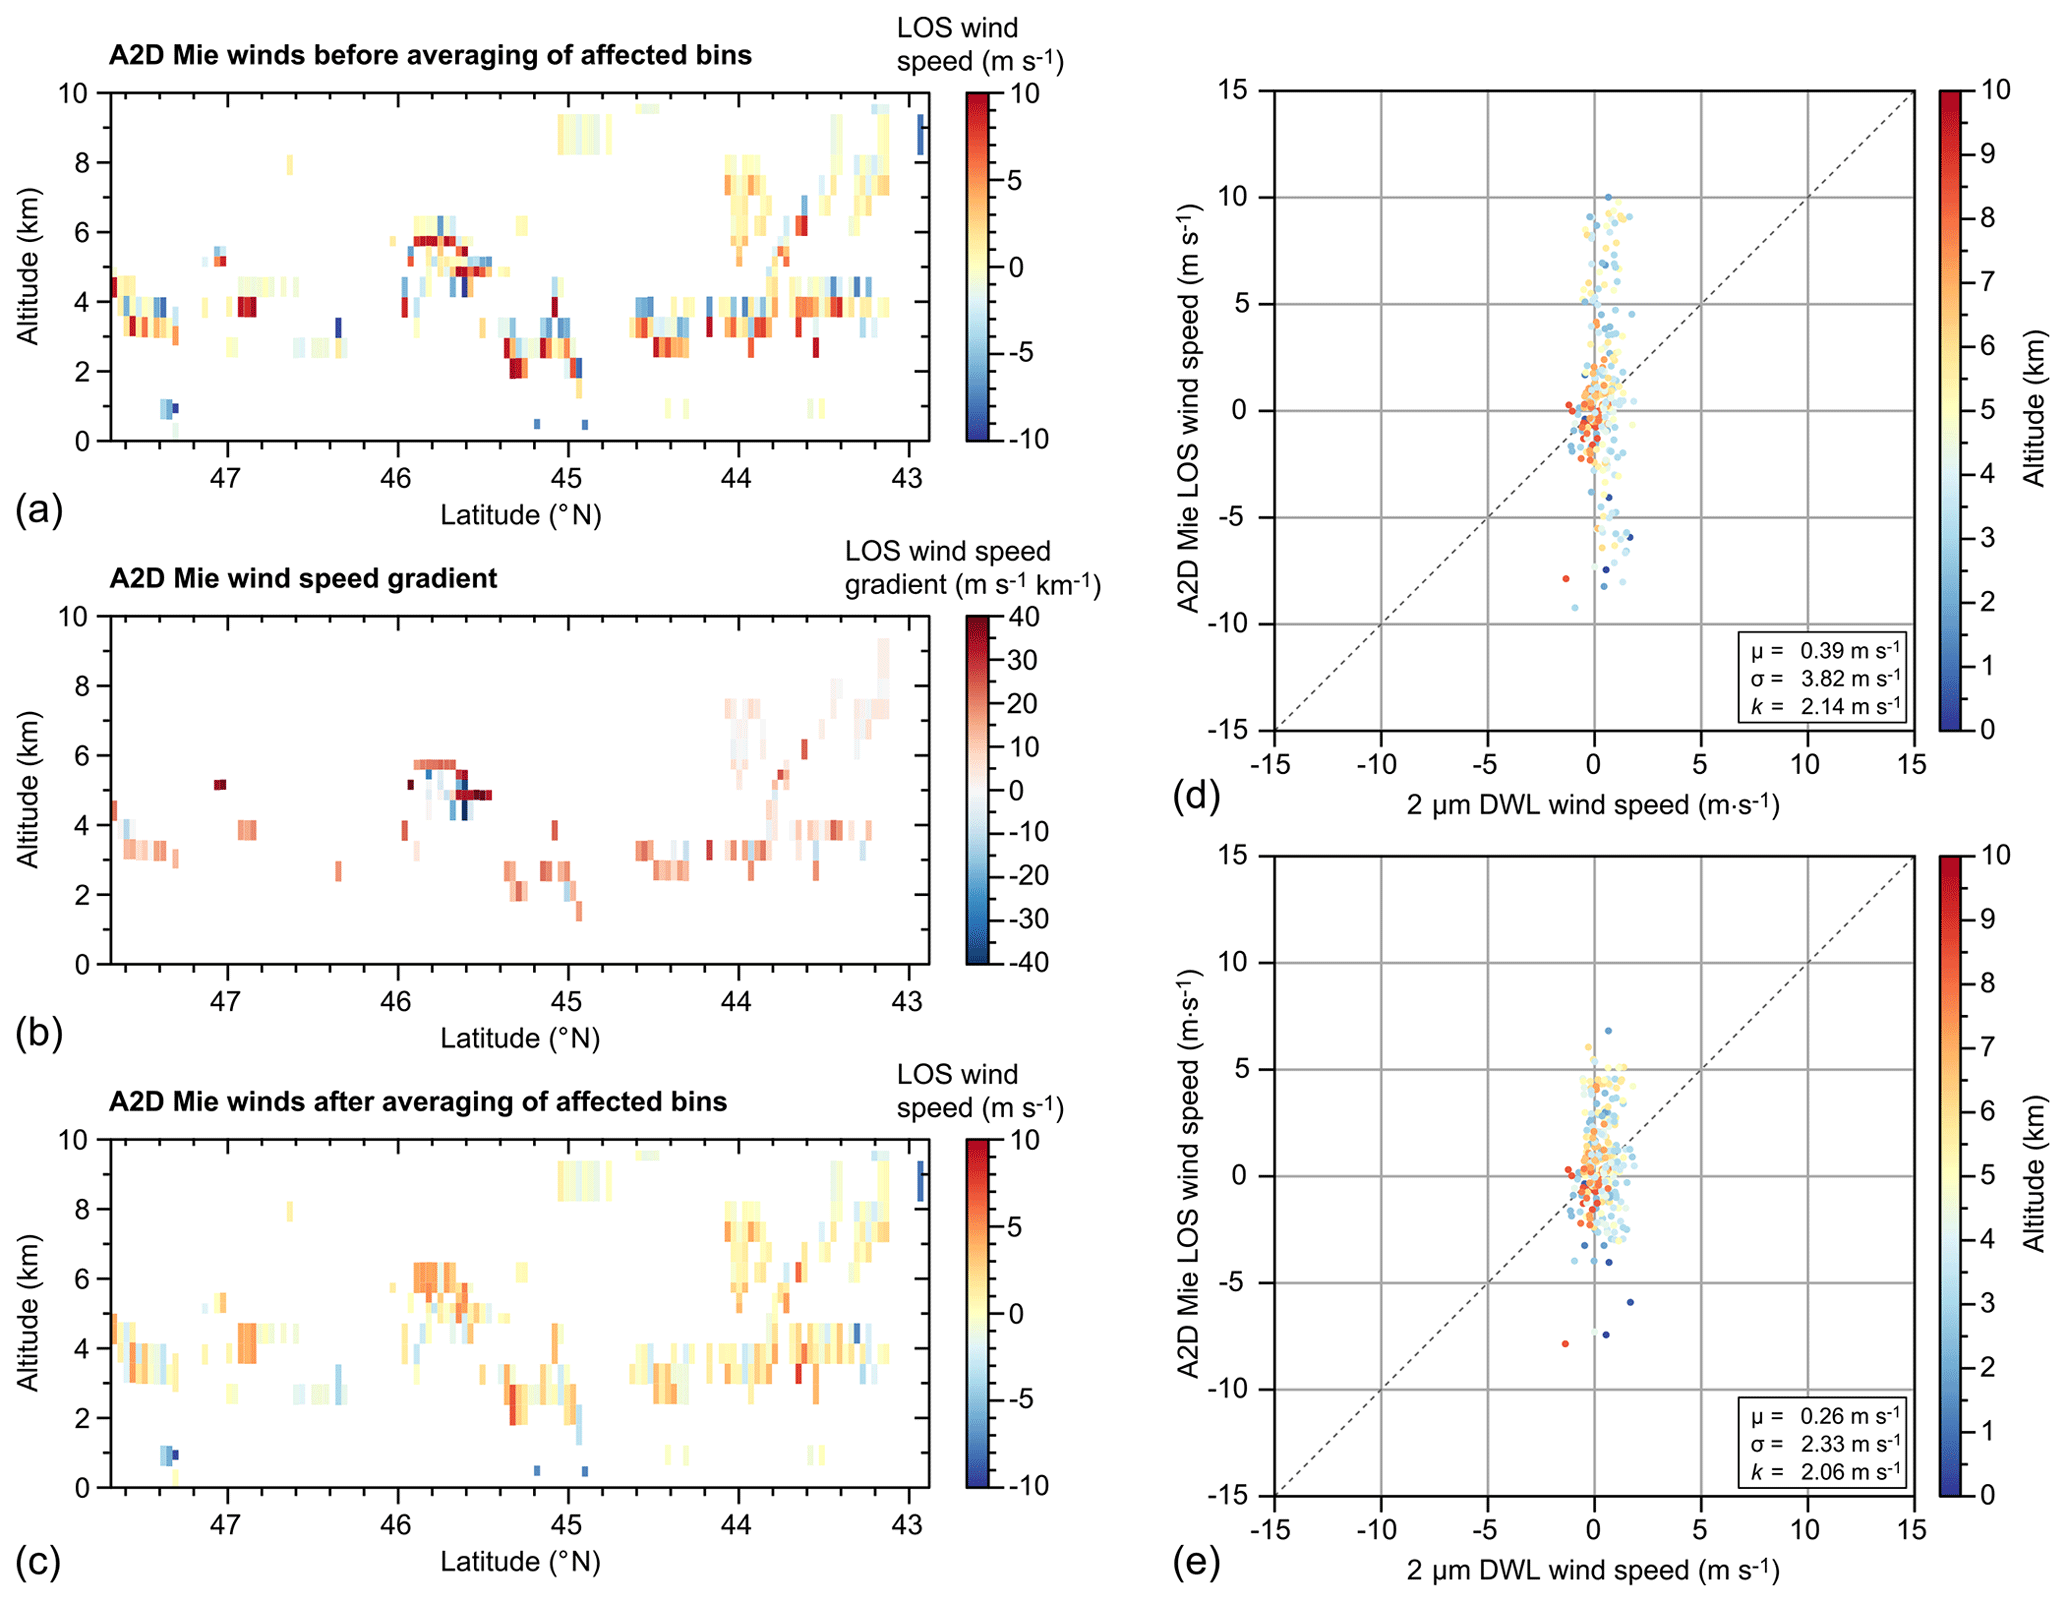
Figure 10Mie winds for the AVATARE underflight on 23 May 2019 before and after retrieval modifications. (a) A2D Mie winds without bin averaging, (b) Mie wind gradient without bin averaging, and (c) Mie winds with bin averaging. The right scatterplots show the correlation between the Mie winds and the 2 µm DWL wind data without (d) and with (e) bin averaging.
The consequence of the fringe skewness on the Mie wind results is presented at the example of the first underflight leg on 23 May 2019 in Fig. 10. During this wind scene, dense, patchy clouds were encountered at different altitudes, resulting in strong backscatter signals distributed over multiple range gates. This caused large positive and negative wind biases at the cloud edges, i.e. where strong backscatter gradients occurred. The opposing biases are clearly visible as red and blue bins in the Mie wind curtain (Fig. 10a) and in the corresponding scatterplot comparing the wind results with the 2 µm DWL reference wind data (Fig. 10c).
In order to correct for the large wind errors, the affected bins were first identified by determining the vertical wind speed gradient. The corresponding curtain is shown in Fig. 10b. In a next step, those bins for which the absolute gradient is above 5 m s−1 km−1 (LOS) are flagged, and the wind speeds from the flagged bin and the one above are averaged. Since real LOS wind gradients are typically below 5 m s−1 km−1, even in the area of jet streams (Lux et al., 2018), the chosen threshold was found to reliably identify the erroneous bins, while leaving unaffected bins unflagged. The averaged wind speed is then allocated to the two contributing bins. In this way, the large positive and negative biases (partly) compensate for each other. As a result, the spread in the wind speeds of adjacent erroneous bins is reduced, leading to higher precision of the Mie winds. For the selected wind scene, the standard deviation is decreased by nearly 40 %, from 3.82 to 2.33 m s−1. The impact of the bin averaging method on the Mie data quality of the entire AVATARE and AVATARI campaigns is discussed in Sect. 4.
The presented technique can be regarded as a post-processing of the Mie wind results, as it is applied after the actual wind retrieval. Moreover, this technique is only applicable when at least two valid adjacent vertical Mie bins are available. In case the Mie SNR is too low in one of the overlapping range bins, and it is, thus, flagged as invalid, no information on the wind speed gradient is available, and the other bin suffering from the fringe skewness error cannot be corrected. Such cases of isolated erroneous bins are visible in the wind curtains in Fig. 10 at about 1 km altitude. Hence, as an alternative approach, it was also tested to identify the affected bins by checking the Mie SNR gradient which is available for all bins. However, the correlation of the Mie SNR gradient with the wind error was found to be subtle, and a complicated case-by-case analysis was necessary to sort out the largest wind speed outliers while retaining the wind results which agreed well with the 2 µm DWL wind data. This fact underlines that the error introduced by the Mie fringe skewness in combination with the range gate overlap is very complex. Therefore, it was decided to use the simple bin averaging approach to improve the Mie wind data quality.
The used wind gradient threshold of 5 m s−1 km−1 (LOS), corresponding to vertical gradients of the horizontal LOS (HLOS) wind speed of about 15 m s−1 km−1, was found to adequately distinguish between cases where the opposing bias is caused by strong vertical backscatter or wind gradients, respectively. Nevertheless, since the two effects can occur simultaneously in rare cases and also enhance each other, e.g. at cloud tops, it cannot be fully excluded that actual wind gradients are artificially smeared by the applied algorithm in some cases.
It is interesting to note that the preliminary analysis of selected Aeolus Mie wind profiles also revealed opposing wind biases in vertically neighbouring range bins, particularly in lower altitudes. This suggests that, despite the smaller fringe skewness observed for the satellite instrument, a similar error source is present for Aeolus. However, a more detailed investigation of larger Aeolus datasets is required to verify this assumption. Here, it is important to differentiate between wind scenes with strong vertical wind speed gradients, those with strong vertical backscatter gradients, and those for which both occur.
3.4 A2D error assessment using the 2 µm DWL
The accuracy and precision of the A2D Mie and Rayleigh wind results from the two airborne campaigns were evaluated by comparing them to the wind data obtained with the coherent 2 µm DWL. The latter offers high accuracy of the horizontal wind speed of about 0.1 m s−1 and precision of better than 1 m s−1 (Weissmann et al., 2005; Witschas et al., 2017), so that it is considered as the true reference. For adequate comparison between the two different lidar datasets, the three-dimensional wind vectors measured with the 2 µm DWL were projected onto the A2D LOS axis. Moreover, the 2 µm measurement grid was adapted to that of the A2D by means of the weighted aerial interpolation algorithm that was also applied for the analysis of the A2D wind data quality of previous campaigns (Marksteiner, 2013; Lux et al., 2018, 2020a). After the harmonization of the two datasets, a bin-to-bin comparison was performed to derive the systematic and random error of the A2D winds for all underflights of the respective campaign, whilst assuming that the representativeness error is negligible. Note that the wind results from additional flight legs aside from the Aeolus measurement swath did not enter the statistical comparison. The error assessment was performed separately for the AVATARE and AVATARI campaigns, as well as before and after the implementation of the retrieval modifications discussed above to demonstrate their impact on the A2D wind data quality.
3.4.1 AVATARE
The results from the statistical comparison of the A2D Mie and Rayleigh LOS winds with the 2 µm DWL are presented as probability density functions (PDFs) of the wind speed differences in Fig. 11. Figure 11a shows that, for the AVATARE dataset, the Mie wind errors that are related to the fringe skewness are largely diminished by averaging the winds in adjacent range gates with extraordinarily high (opposing) bias, as described in Sect. 3.3. Thanks to this method, the random error, represented by the scaled MAD (k; see Eq. 3), is reduced from 1.61 to 1.47 m s−1, while the mean bias μ is also decreased from −0.42 to −0.32 m s−1. The effect on the standard deviation σ is even larger (−22 %, from 2.23 to 1.73 m s−1), as this value is more sensitive to the outliers that are caused by the fringe skewness issue than the scaled MAD. Another parameter that illustrates the positive effect of the retrieval changes is the number of gross errors which are defined as those wind results that deviate by more than 4 times the scaled MAD from the 2 µm DWL wind speed. Note that the scaled MAD values shown in the insets in Fig. 11 are calculated after discarding the gross errors which are indicated as red bars in the histograms. Hence, the original scaled MAD values, considering all A2D wind results, are usually larger. For instance, the complete set of measured Mie winds before processing modifications shows a scaled MAD of 1.75 m s−1. Consequently, wind results that differ by more than 4 ⋅ 1.75 m s−1 = 7.00 m s−1 from the respective 2 µm DWL wind speed in the compared bin are considered as gross errors and excluded from the statistical calculations, resulting in a new scaled MAD value of 1.61 m s−1. The number of Mie gross wind errors acquired during the AVATARE campaign when using the original A2D wind retrieval is 227 and is drastically reduced to 42 upon implementing the bin-averaging method. At the same time, the PDF is transformed to a much more Gaussian contribution, which clearly demonstrates the improvement of the A2D wind accuracy.
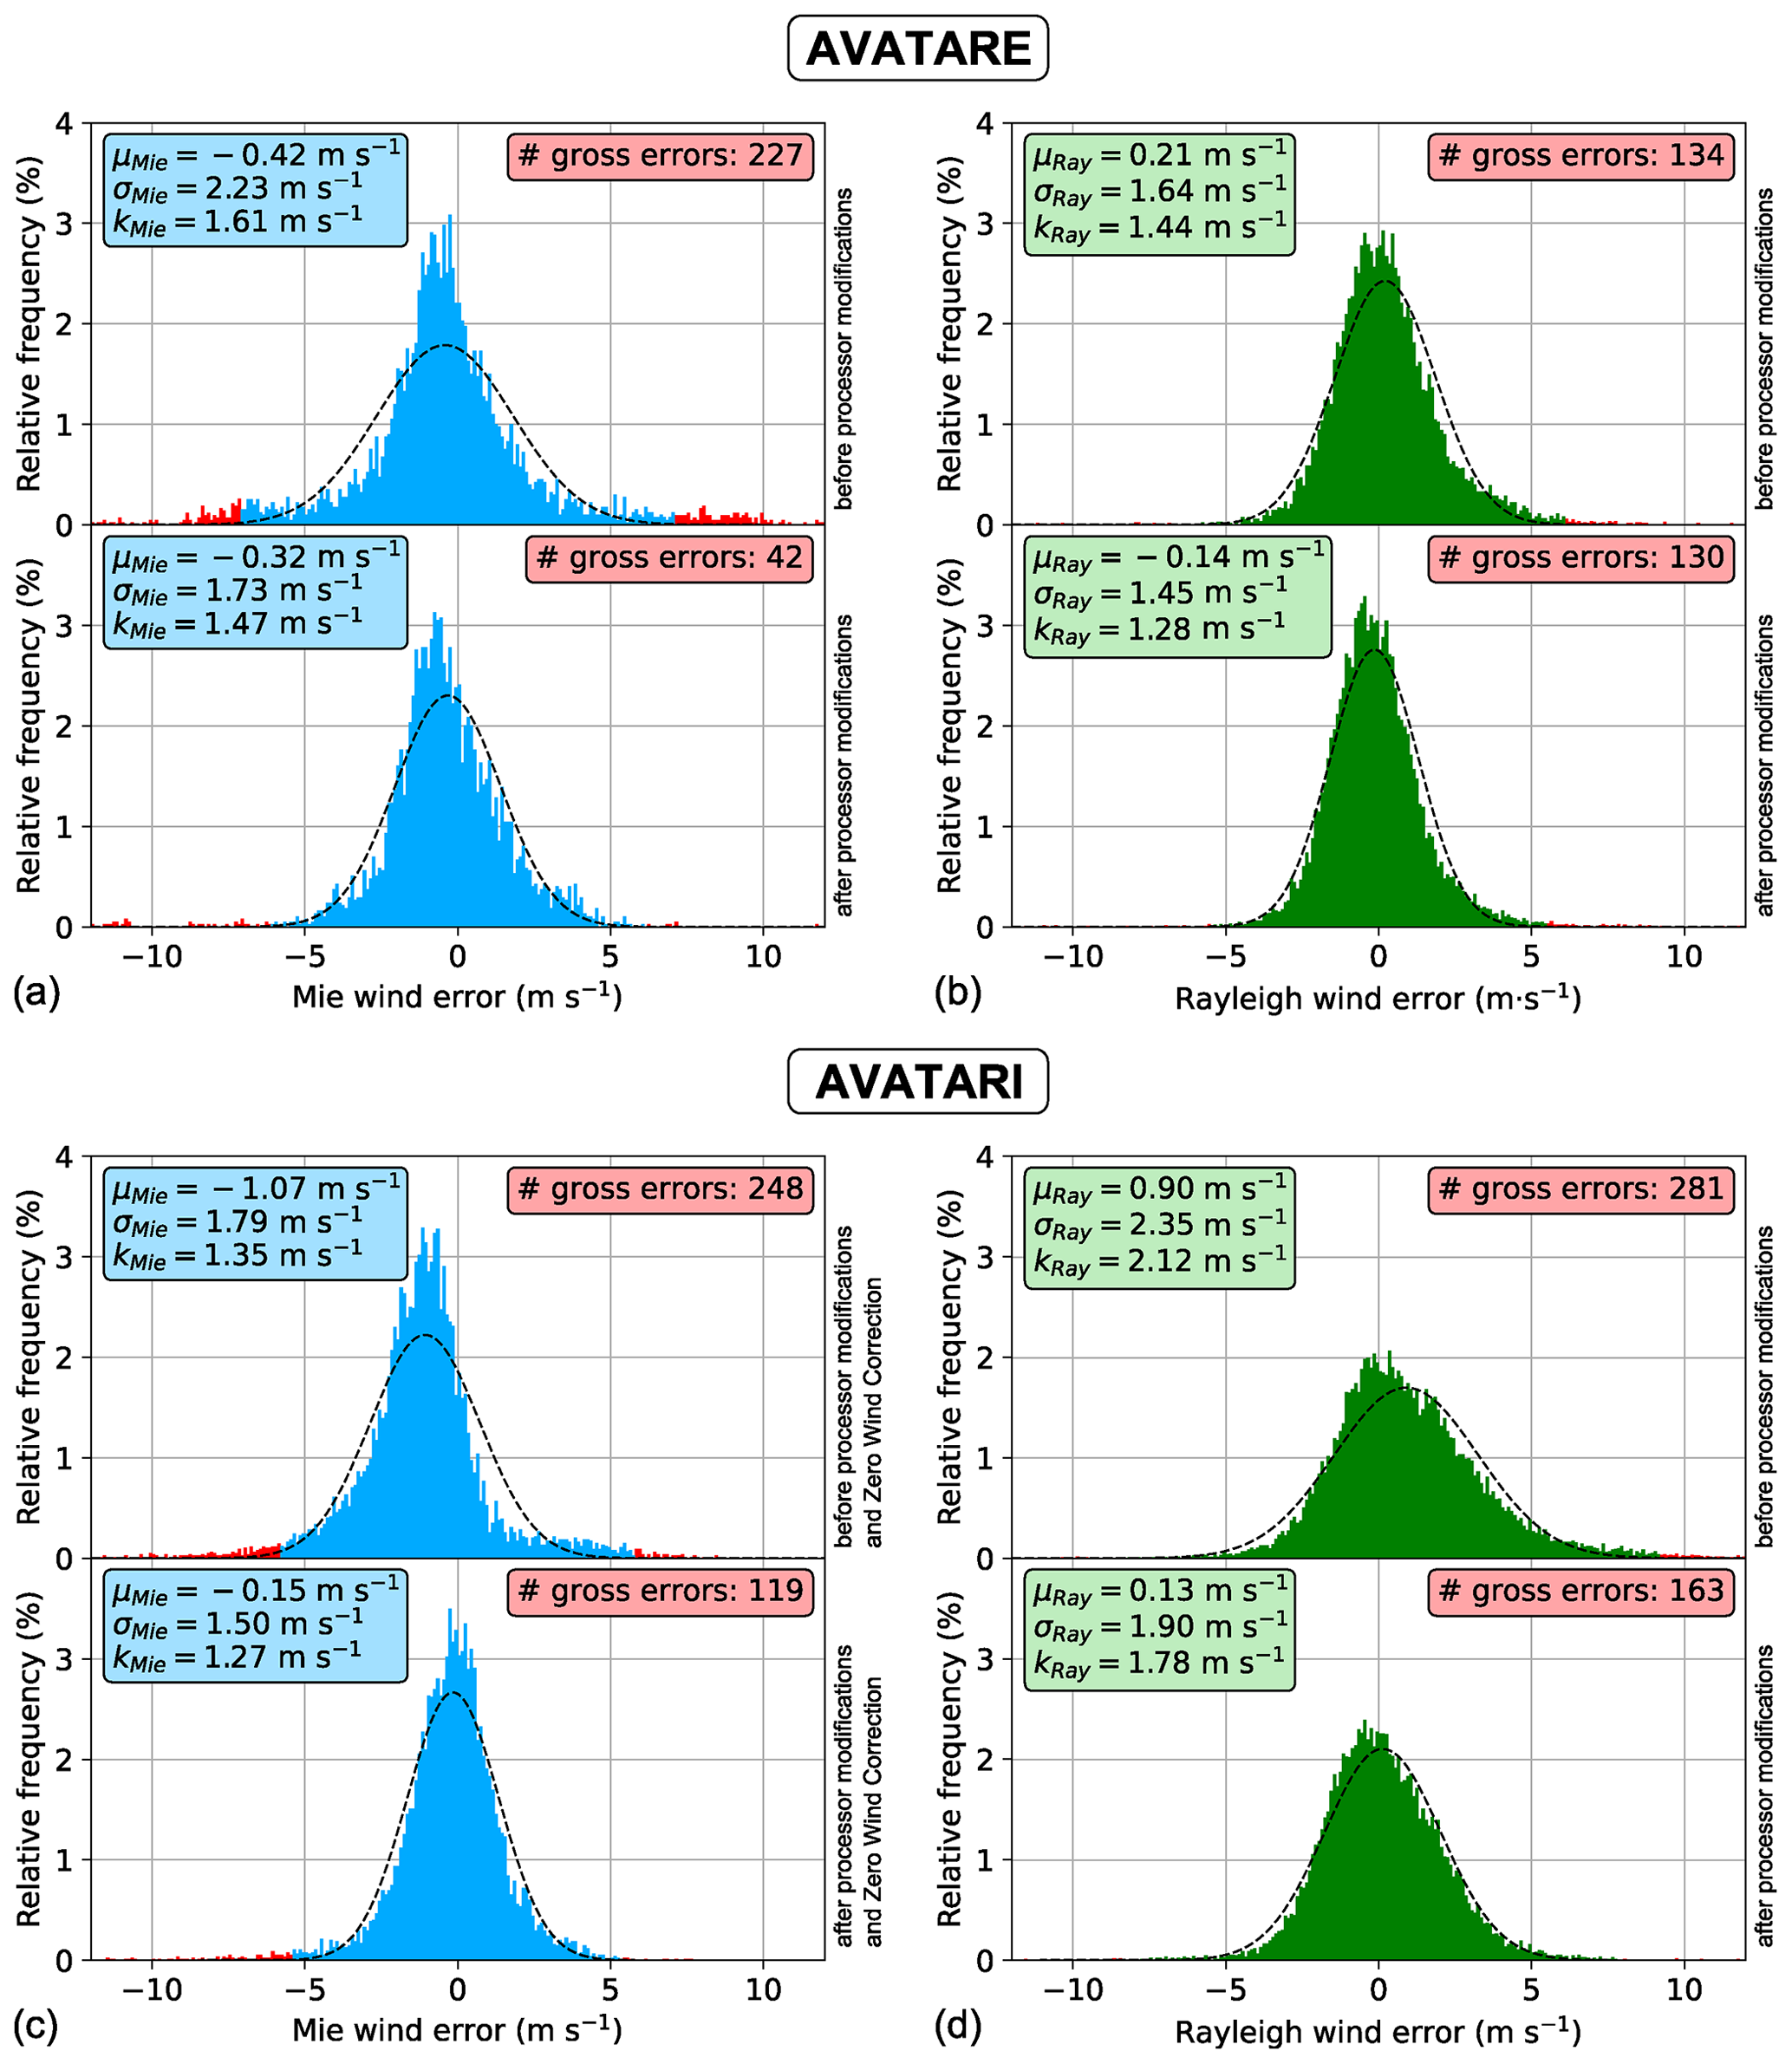
Figure 11Probability density functions for the A2D Mie (a) and Rayleigh (b) wind error with respect to the 2 µm DWL for the entire AVATARE campaign before (top plot in each panel) and after (bottom plot) the applied retrieval modifications. Gross errors (see the definition in the text) are marked in red. The dashed lines represent Gaussian fits. The insets summarize the mean values μ, standard deviations σ, and scaled MAD k calculated for the respective datasets. The corresponding PDFs of the A2D Mie and Rayleigh wind error for the AVATARI dataset are provided in panels (c) and (d), respectively.
The impact of the retrieval modifications on the Rayleigh wind results is rather small for the AVATARE dataset (Fig. 11b). The mean bias is changed from 0.21 to −0.14 m s−1, as a significant amount of the positively biased winds measured at higher altitudes (see Fig. 5e) is corrected by the spot position QC. The latter also reduces the random error from 1.44 to 1.28 m s−1, while the number of gross errors is slightly decreased from 134 to 130.
An interesting aspect of the A2D wind quality assessment is the altitude dependence of the wind error. Here, the analysis showed that the reduction in the systematic and random Mie wind errors by means of the retrieval changes primarily acts on the winds measured below 6 km (see also Fig. 10). This can be explained by the fact that thicker clouds that give rise to the error source related to the fringe skewness are more present in the lower and middle troposphere. The situation is opposite for the Rayleigh channel, where mainly those winds that were measured at higher altitudes above 7 km are improved in quality by the made modifications. This is due to the nature of the developed QC, based on the Rayleigh spot positions, which predominantly tackles the error introduced by the incomplete telescope overlap, i.e. in the near field of the instrument. It was also found that the Mie random error is smallest at altitudes above 6 km, probably because of the presence of thin cirrus clouds. The latter are favourable for accurate Mie wind retrieval, as they provide high Mie SNR without sharp boundaries which exacerbate the Mie fringe skewness effect. On the other hand, cirrus clouds are detrimental to the transmit–receive co-alignment loop, as they affect the determination of the return spot position on the UV camera in the front optics, thereby introducing higher angular variations in the beam being incident on the Rayleigh spectrometers and, in turn, larger Rayleigh random errors. This effect contributes to the slightly increased random error at high altitudes.
3.4.2 AVATARI
Given the fact that almost twice as many Aeolus underflights were performed in the frame of the AVATARI campaign, the latter provided an even larger A2D dataset compared to the AVATARE campaign. Aside from the higher number of winds, the range of detected LOS wind speeds was considerably broader during AVATARI ( m s−1) than during AVATARE ( m s−1), since many of the AVATARI underflights targeted the sampling of the North Atlantic jet stream. The PDFs derived from the statistical comparisons of the A2D Mie and Rayleigh LOS winds with the 2 µm DWL data before and after the retrieval refinements are depicted in Fig. 11c and d. Concerning the Mie channel (Fig. 11c), the systematic error is reduced from −1.07 to −0.15 m s−1, which is, however, not only due to the retrieval modifications. In addition, a so-called zero wind correction (ZWC) was performed, which involves the analysis of strong ground return signals over ice that were collected during two underflights along the eastern coast of Greenland. Here, the measured Mie ground velocity was found to be (−0.9 ± 0.5) m s−1, which pointed to a systematic error source of the A2D Mie channel during the AVATARI campaign. This assumption was further strengthened by the fact that the A2D Mie winds were negatively biased by about 1 m s−1 with respect to the 2 µm DWL for most of the underflights. Hence, the determined ZWC value of −0.9 m s−1 was subtracted from all measured Mie wind speeds of the AVATARI dataset. A likewise verification or correction of the systematic Rayleigh wind error was inhibited by the much higher noise of the Rayleigh ground velocities. The same is true for both the Rayleigh and Mie wind data from the AVATARE campaign, as there were no flights over high-albedo surfaces and, thus, no sufficiently strong ground return for applying a ZWC. While the ZWC reduced the Mie systematic error, the Mie random error is decreased by the mitigation of the fringe skewness error from 1.35 to 1.27 m s−1. As for the AVATARE campaign, this correction mainly affected those winds that were measured at lower altitudes, i.e. in regions where thicker clouds resided that are likely to cause the fringe skewness error. For the Rayleigh winds, a large improvement is apparent both in terms of accuracy and precision. This can primarily be traced back to the correction of the positively biased higher-altitude (i.e. near-field) winds by the spot position QC which diminished the mean bias from 0.90 to 0.13 m s−1, while the random error decreased from 2.12 to 1.78 m s−1. When only considering winds measured at altitudes above 8 km, the mean bias is decreased by nearly 70 % from 2.08 to 0.65 m s−1. The considerable improvement of the A2D wind accuracy and precision also manifests as a significant a reduction of the gross errors (−52 % – Mie; −42 % – Rayleigh). Finally, the distributions of the Mie and Rayleigh wind errors with respect to the 2 µm DWL become more Gaussian upon the retrieval modifications, thus verifying its positive impact on the wind data quality.
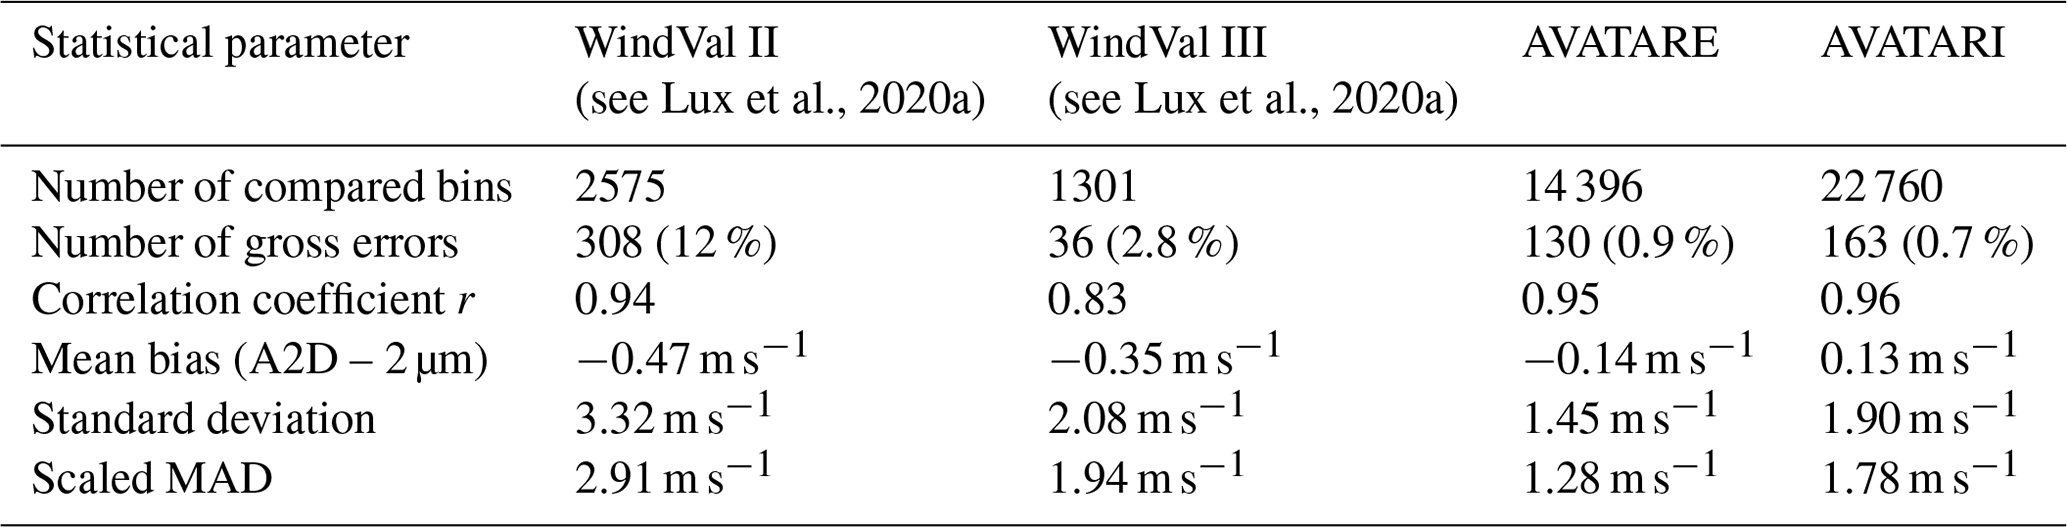
3.4.3 Comparison with previous campaigns
The large impact of the retrieval modifications on the A2D wind data accuracy and precision, which was pointed out in the previous sections, becomes obvious when looking back at the error assessments for the previous airborne campaigns. For this purpose, the results from the statistical comparisons with the 2 µm DWL for AVATARE and AVATARI are summarized in Table 3 (Mie) and Table 4 (Rayleigh), together with the corresponding results for the WindVal II (2016) and WindVal III (2018). When comparing the number of gross errors, it should be noted that, for WindVal II and WindVal III, gross errors were defined as winds that deviated by more than 10 m s−1 from the 2 µm DWL winds, whereas, for the recent campaigns, they were defined as winds that deviate by more than 4 times the scaled MAD, which is always below 10 m s−1. Most notably, the A2D random errors, which typically ranged between 2 and 3 m s−1 for both channels, depending on the encountered atmospheric conditions during the previous campaigns, were drastically reduced to values of (1.5 ± 0.3) m s−1. Moreover, it should be emphasized that the A2D Rayleigh wind data entering the statistical comparisons for the previous campaigns were restricted to altitudes below 7.5 km due to the known large systematic error in the near field, which has now been overcome thanks to the spot position QC. In this respect, the retrieval changes have not only improved the accuracy and precision of the Rayleigh channel but also markedly increased its effective measurement range to higher altitudes. This is especially important for the Aeolus validation, as the range between 7.5 km and the flight altitude (10 to 12 km) is the region where strong wind gradients and high wind speeds, e.g. related to the jet stream, typically occur. Such features are well suited for evaluating the data quality of the Aeolus wind product. Regarding the Mie channel, the made modifications primarily improved the quality of wind data that was acquired in scenes where thick clouds promoted the fringe skewness error, resulting in a large reduction in the random error compared to previous campaigns. In summary, the accuracy and precision of the A2D wind data form an excellent basis for the Aeolus validation, which will be presented in the next section.
Table 3Results in the statistical comparison between the A2D Mie and the 2 µm LOS wind data obtained from the WindVal II and WindVal III (without retrieval improvements), as well as the AVATARE and AVATARI campaigns (with retrieval improvements). For WindVal II and WindVal III, the gross errors are defined as winds that deviate by more than 10 m s−1 from the 2 µm winds. For AVATARE and AVATARI, gross errors are defined as winds that deviate by more than 4 times the scaled MAD from the 2 µm winds.

Table 4As in Table 3 but for the statistical comparison between the A2D Rayleigh and the 2 µm LOS wind data.
From the WindVal III campaign, only a small dataset was available for the Aeolus validation, as the A2D was operable during only three underflights. Moreover, the range gate settings of both ALADIN and the A2D were not optimal, with many narrow range gates in the lower troposphere, where Aeolus winds often exhibited large wind errors and were, therefore, discarded from the analysis (Lux et al., 2020a), resulting in a rather small number of validated Aeolus wind results. The latter were also only of a preliminary nature, with relatively large systematic and random errors early in the mission. In this sense, the Aeolus error assessment that is presented in the following section provides a much higher validity than that of the previous work.
The A2D Mie and Rayleigh wind data collected along the Aeolus measurement swaths during the 16 AVATARE and AVATARI underflights was shown to be of good quality, with mean biases of less than 0.2 m s−1 (except for the Mie winds of the AVATARE campaign with −0.32 m s−1) and random errors of less than 1.8 m s−1 with respect to the 2 µm DWL. These values represent the real instrument error of the A2D which measures LOS wind speeds at an off-nadir angle of 20∘. The Aeolus wind product, however, contains the HLOS wind speeds. Hence, it was decided to convert the A2D LOS wind speeds to HLOS wind speeds for the purpose of comparing the two datasets with each other. Adequate comparison also requires that we consider the different viewing geometries (or pointing angles) of the satellite instrument and its airborne demonstrator. Furthermore, the different horizontal and vertical resolutions of the two instruments necessitate an adaptation of the A2D measurement grid to that of Aeolus. The procedures to harmonize the two datasets are comprehensively described in Lux et al. (2020a). The conversion of the A2D LOS winds to the satellite HLOS involved the use of wind data from the 2 µm DWL (zonal and meridional wind components) and the ECMWF model background that is included in the Aeolus auxiliary meteorological file (AUX_MET). The latter contains vertical profiles of the ECMWF operational short-range forecast model data at 136 pressure levels along the predicted Aeolus track, with a horizontal resolution of about 22 km (Rennie et al., 2020). The AUX_MET data were only used in those parts of the A2D data coverage where valid 2 µm DWL winds were not available, particularly in atmospheric regions with very weak particle backscatter signals.
The ECMWF model background winds, i.e. without assimilation of the Aeolus winds, were additionally exploited to compare the Aeolus L2B winds with the model data. For this purpose, the AUX_MET data (meridional and zonal wind component) were averaged onto the L2B grid using the same aerial averaging formalism (Marksteiner, 2013) that was also used for the harmonization of the A2D and L2B datasets. Subsequent projection of the horizontal wind vector from the model onto the Aeolus HLOS vector then allowed for the validation of the L2B wind results using the ECMWF model. The model winds from the AVATARI campaign were, in turn, compared to the 2 µm DWL data to assess its accuracy. The comparison yielded a slightly negative bias of −0.2 m s−1 and a scaled MAD of 1.7 m s−1.
The quality of the Aeolus wind data contained in the L2B product was considerably improved by the correction for large systematic errors which had strongly degraded the wind data quality in the initial phase of the mission (Kanitz et al., 2020; Reitebuch et al., 2020). While dark current signal anomalies on single (hot) pixels of the Aeolus detectors were successfully mitigated for by the implementation of dedicated calibration instrument modes (Weiler et al., 2021a), wind biases that were introduced by variations in the temperature distribution across the primary telescope mirror were largely diminished by the so-called M1 correction based on ECMWF model winds (Rennie and Isaksen, 2020; Weiler et al., 2021b; Rennie et al., 2021). These corrections formed the basis for the operational assimilation of the Aeolus wind data in NWP by various weather services and were also applied for the reprocessing (baseline 10) of the Aeolus wind products that cover the period of the AVATARI campaign in September 2019 (Abdallah et al., 2020; Masoumzadeh et al., 2020). However, reprocessed wind data for the April/May 2019 time frame when the AVATARE campaign was conducted will only become available in 2022. Therefore, the statistical comparison of the Aeolus wind data with the A2D winds in this section is restricted to the AVATARI dataset.
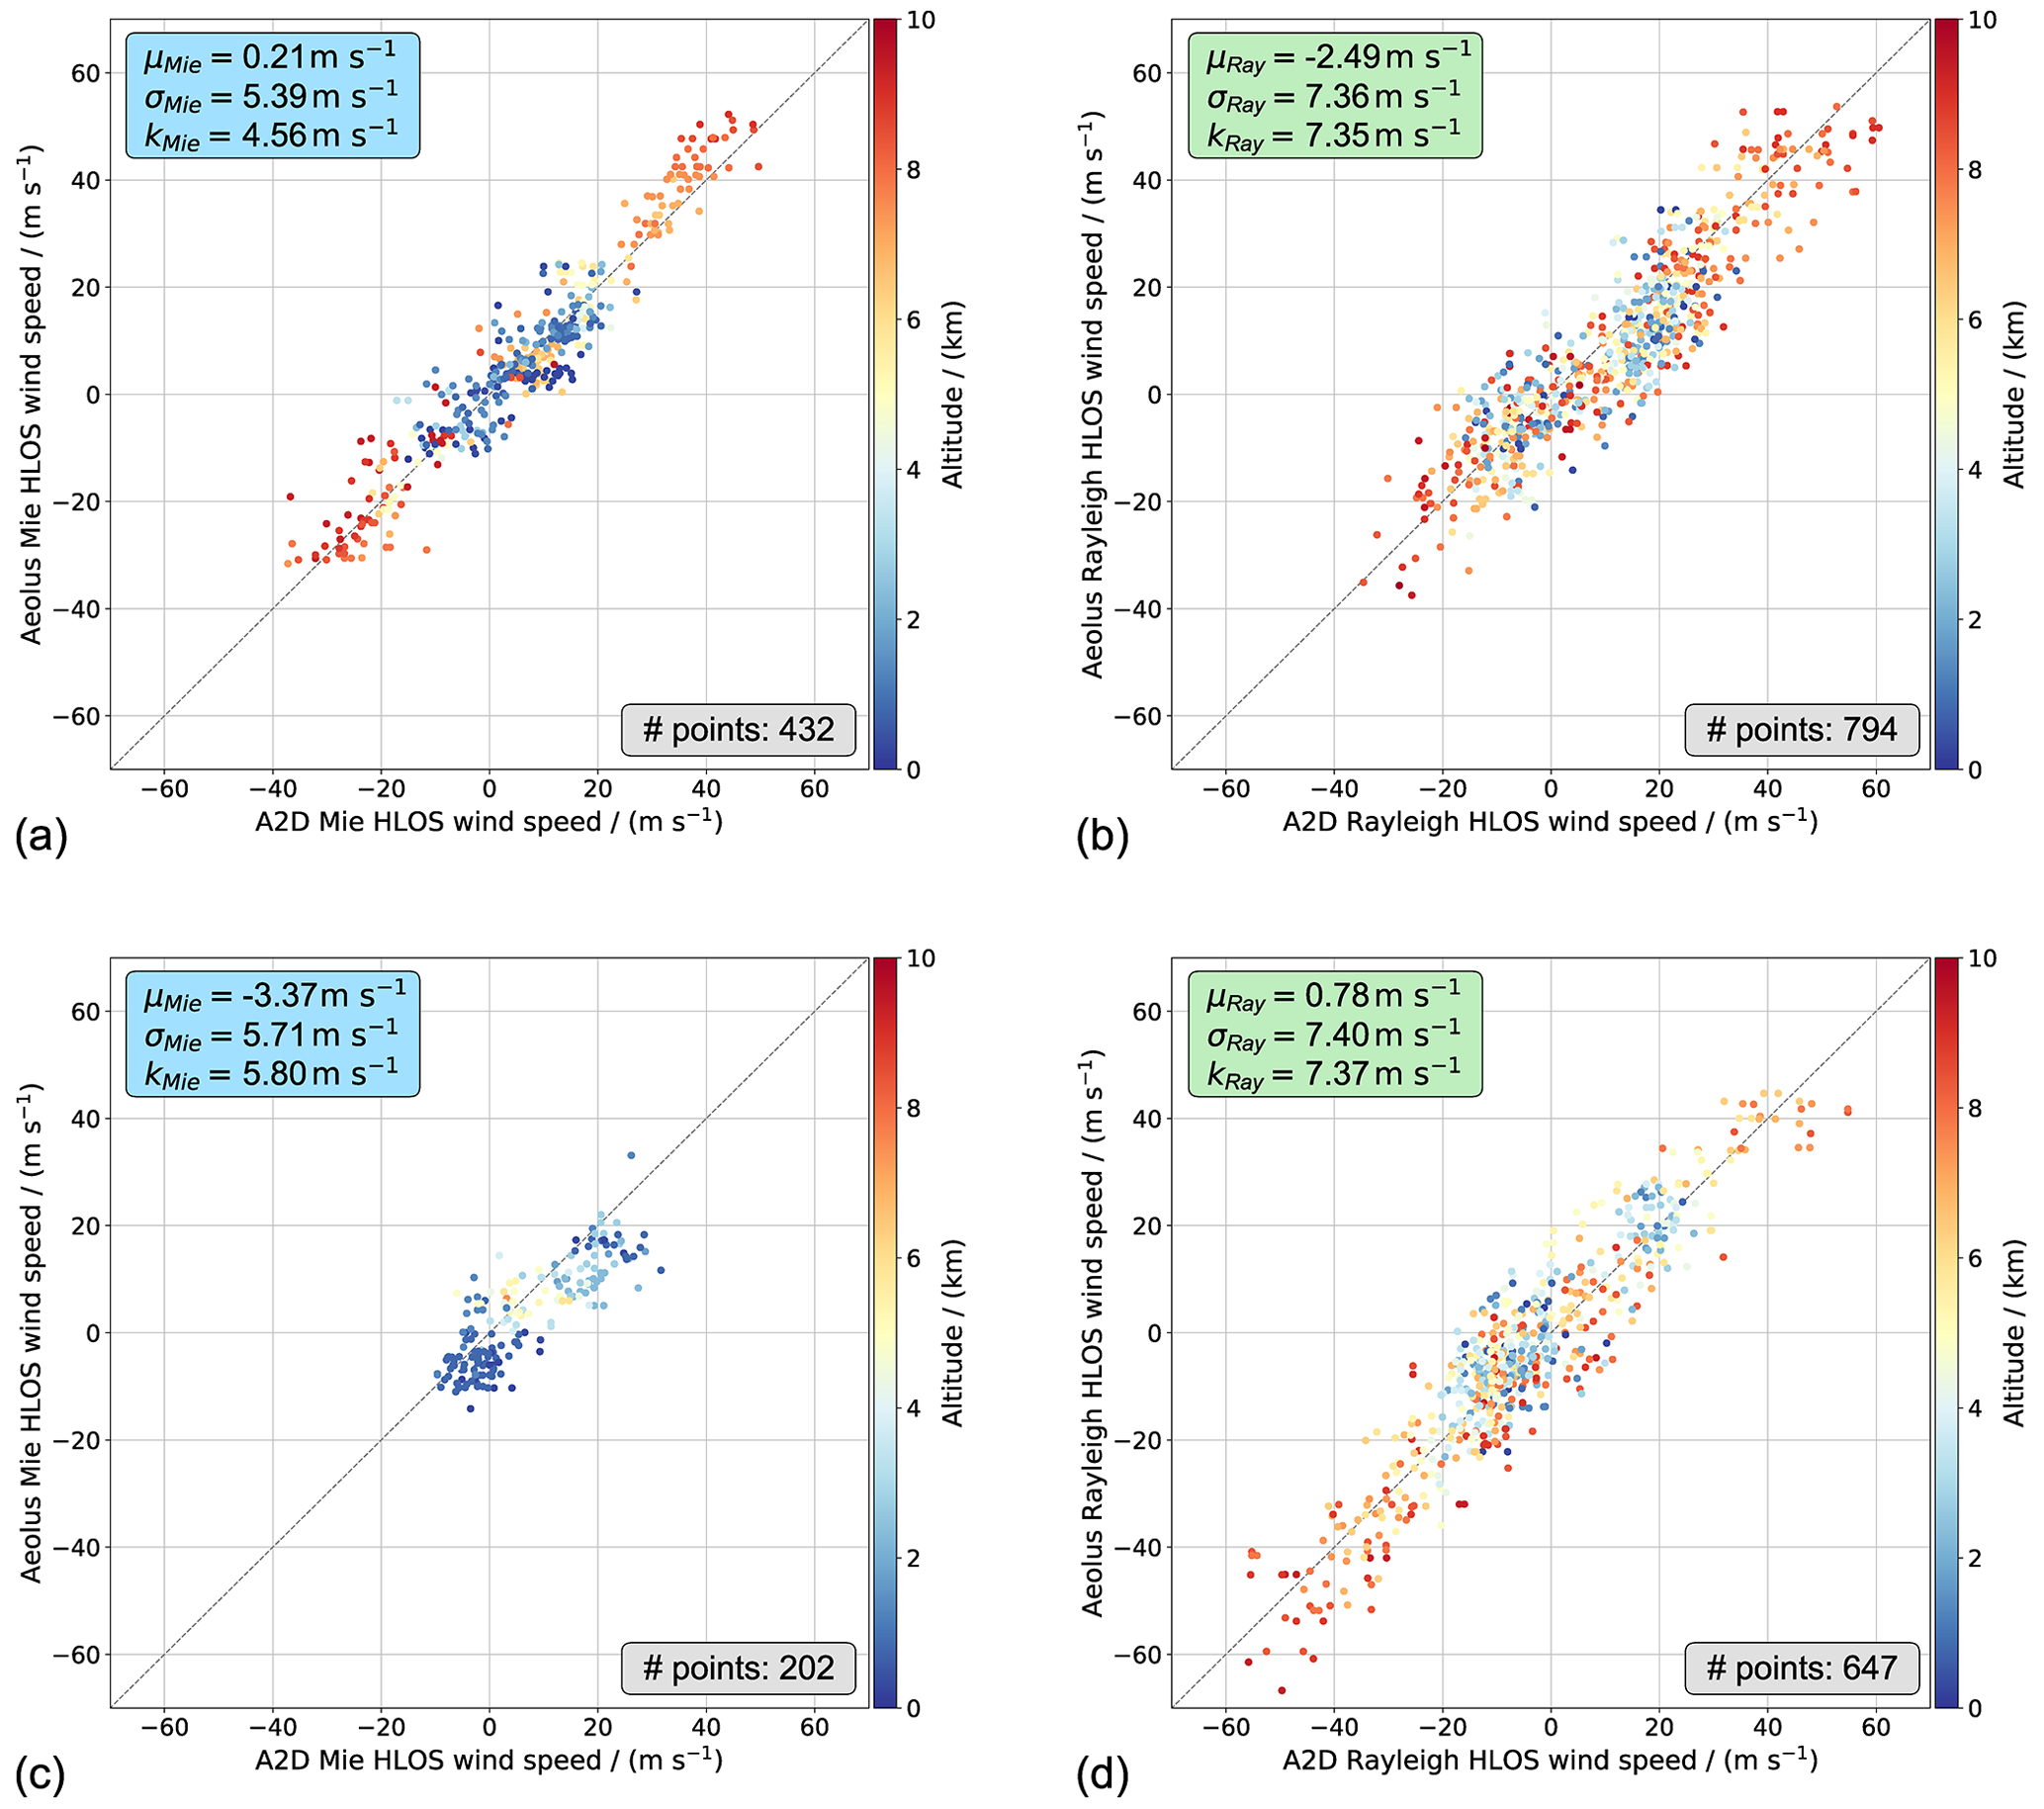
Figure 12Scatterplots comparing the Aeolus L2B Mie-cloudy (a) and Rayleigh-clear winds (b) with the A2D Mie and Rayleigh winds from all underflight legs along ascending orbits during the AVATARI campaign. The bottom panels show the corresponding scatterplots for the Mie (c) and Rayleigh (d) lidar–lidar comparison from all underflight legs along descending orbits of the satellite. The data points are colour-coded with respect to the bottom altitude of the respective bins used for comparison. The mean bias (μ), standard deviation (σ), and scaled MAD (k) are provided in the respective boxes.
In contrast to the AVATARE and WindVal III validation campaigns (Lux et al., 2020a), satellite underflights were not only carried out on ascending orbits of Aeolus but also along descending orbits. Since the systematic and random errors were found to deviate for the two satellite directions, wind data from the four flights along descending orbits (16, 17, 22, and 26 September 2019; see also Table 2) and the six flights along ascending orbits were analysed separately. The scatterplots comparing the Mie and Rayleigh wind data from the two direct-detection wind lidars for ascending orbits (top row) and descending orbits of Aeolus (bottom row) are presented in Fig. 12.
Several filters were applied to the two datasets. While gross errors, as defined in Sect. 3.4.1, were removed from the A2D dataset, Aeolus winds with an estimated HLOS wind error larger than 8 m s−1 (Rayleigh clear) and larger than 4 m s−1 (Mie cloudy) were discarded. These thresholds were found to ensure small departures of the Aeolus winds from the high-accuracy 2 µm DWL wind data (Witschas et al., 2020). The estimated wind error is included in the L2B product and is primarily related to the SNR for the Mie channel, while the pressure and temperature sensitivity of the Rayleigh responses is considered for the Rayleigh channel in addition to the SNR (Rennie et al., 2020). The latter depends on the return signal level and the solar background level. Finally, only Aeolus winds in bins which are covered by at least 25 % with A2D bins were included in the statistical comparison. Optimization of this so-called coverage ratio was discussed in Lux et al. (2020a) in the context of the WindVal III campaign results and ensures a sufficient number of compared bins while preventing large representativity errors.
The scatterplots in Fig. 12 show a good agreement of the Aeolus and A2D Mie winds, with almost no bias for ascending orbits (Fig. 12a), whereas it is −3.4 m s−1 for descending orbits (Fig. 12c). Considering the slightly negative Mie wind bias of the A2D with respect to the 2 µm DWL (−0.15 m s−1 LOS corresponds to −0.15 m s m s−1 HLOS), the actual Aeolus Mie wind biases account for −0.2 m s−1 for the ascending and −3.8 m s−1 for the descending orbits, respectively. The number of compared winds (202) and the wind speed range (−10 to 30 m s−1) are significantly smaller in the latter case, compared to ascending orbits (432; −40 to 50 m s−1), as the four underflights mentioned above were either characterized by low- and middle-level clouds or even cloud-free conditions (26 September 2019), with only weak or moderate wind speeds. The negative bias of the Aeolus Mie winds for the investigated underflights along descending orbits was confirmed by a comparison with ECMWF model background data (−1.7 m s−1), which also showed a significantly smaller bias for the AVATARI dataset along the ascending orbits (−0.6 m s−1). In this context, it should be pointed out that the aforementioned M1 correction aims at reducing the wind bias on a global scale (to below 0.5 m s−1), which does not eliminate larger biases on regional scales like those investigated here for the AVATARI campaign. Since the Mie wind bias shows only weak dependence on the telescope temperature, as opposed to the Rayleigh winds, the M1 correction mainly corrects for globally constant offsets (Weiler et al., 2021b). The colour-coding of the scatters in Fig. 12, which describes the bottom altitude of the bin, reveals that the Aeolus Mie winds are positively biased at higher altitudes on ascending orbits. Further analysis suggests that this is due to a wind speed dependence of the Mie bias, potentially due to the application of an imperfect Mie response calibration (Marseille et al., 2022).
The spread between the Aeolus and A2D Mie wind data results from the fact that the random errors of the two lidar instruments approximately add up quadratically, as follows (Lux et al., 2020a):
Using kA2D = 1.27 m s m s−1 and ktotal = 4.56 m s−1 (ascending orbits), respectively ktotal = 5.80 m s−1 (descending orbits), one can estimate the actual random errors of the Aeolus L2B Mie winds to be 2.7 m s−1 (ascending) and 4.5 m s−1 (descending). Comparison with ECMWF model background data revealed random errors between 3.1 and 3.5 m s−1 for the two datasets. While this is in fair agreement with the random error derived from the Aeolus–A2D comparison for ascending orbits, given the dissimilar data overlap of the A2D, Aeolus, and model winds, the value of 4.5 m s−1 is significantly larger than that from the model comparison, suggesting that the respective A2D and Aeolus Mie datasets from the four underflights along descending orbits is too small to be statistically significant.
Table 5Statistical comparison of the Aeolus L2B Mie-cloudy and Aeolus L2B Rayleigh-clear winds against the A2D Mie and Rayleigh, as well as the ECMWF model background winds, for all underflights performed during the AVATARI campaign. The corresponding scatterplots of the Aeolus–A2D comparison are shown in Fig. 12. The statistics are derived after adaptation of the A2D and ECMWF model data to the respective L2B measurement grids, i.e. a vertical bin thickness of 500 m. The mean bias and scaled MAD for the Aeolus–A2D comparison are additionally provided after consideration of the A2D bias and random error with respect to the 2 µm DWL and given in parentheses.
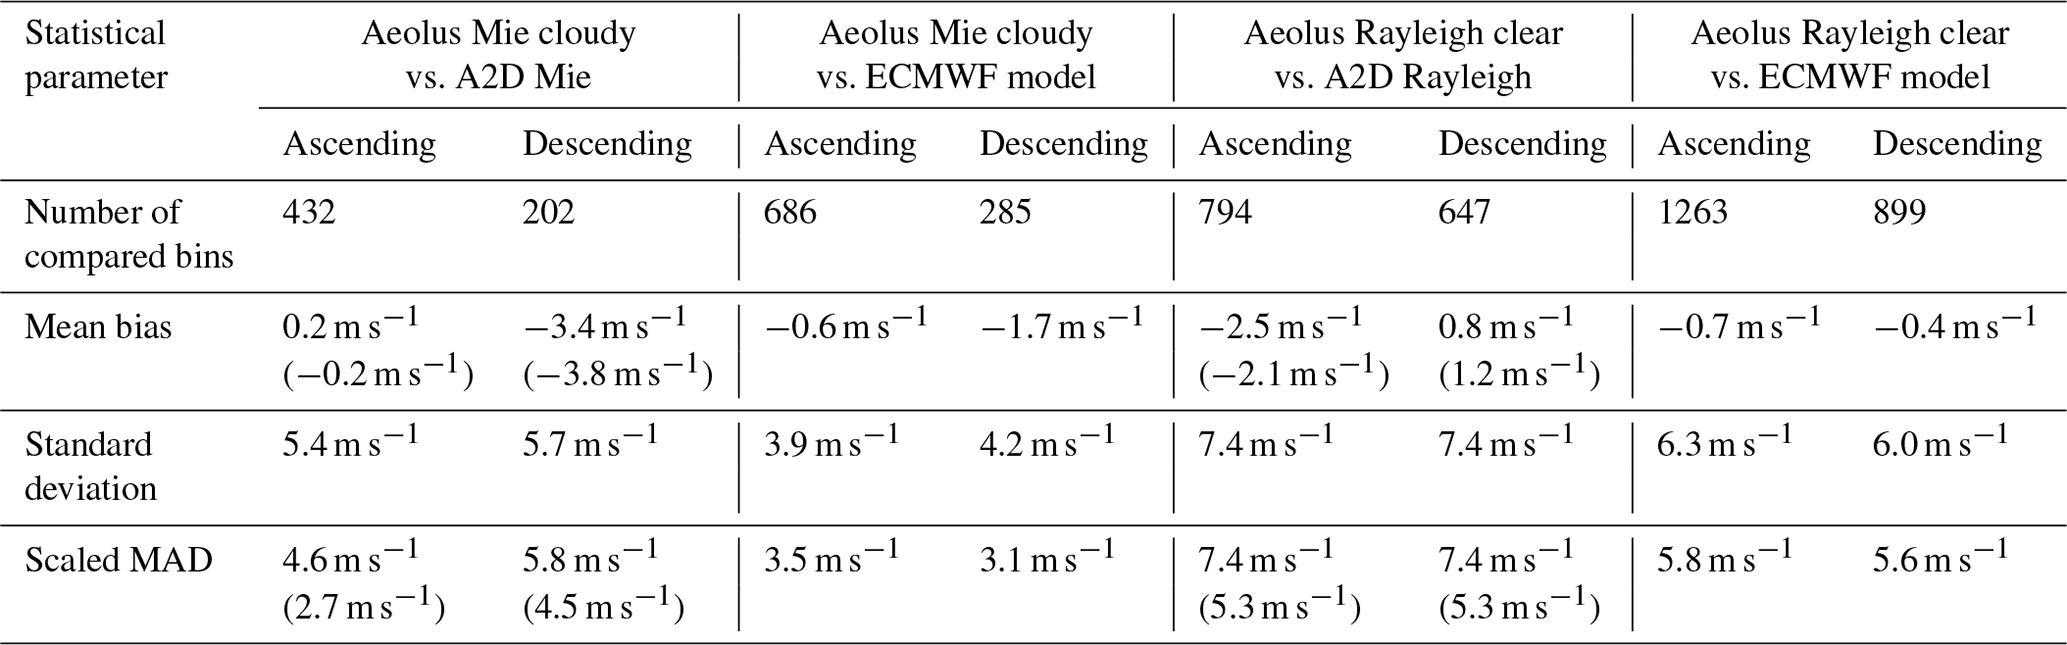
Considering the Rayleigh channel, the number of compared wind results and the wind speed ranges are more balanced, since high wind speeds related to the jet stream were measured with the Aeolus and A2D Rayleigh channels on both descending and ascending orbits. As for the Mie channel, different biases are evident for the Aeolus Rayleigh winds. It is close to −2.1 m s−1 for the ascending orbits (−2.49 m s−1 + 0.13 m s) and around 1.2 m s−1 (0.78 m s−1 + 0.13 m s) for descending orbits. The more negative bias for ascending orbits is in line with the statistical comparison of the Aeolus Rayleigh winds with the ECMWF model background data, although the discrepancy is much smaller here (−0.7, −0.4 m s−1). Different Rayleigh wind biases with respect to ECMWF model data for ascending and descending orbits on a global scale were also reported by Martin et al. (2021), although this study relied on the preliminary Aeolus L2B wind data, i.e. without M1 correction. The results presented here suggest that, despite the implementation of the M1 correction for the reprocessing of the Aeolus wind data, a distinction between ascending and descending orbits is necessary in the error assessment. The random error derived from the Aeolus–A2D comparison for both data subsets is [(7.4 m s−1)2–(1.78 m s)2] = 5.3 m s−1. This result is confirmed by the ECMWF model comparison, which yields only slightly larger values (5.8 m s−1 – ascending; 5.6 m s−1 – descending). The parameters derived from the statistical comparison of the Aeolus L2B winds against the A2D and ECMWF model background wind data are summarized in Table 5.
When comparing the derived random errors for the Aeolus winds from the AVATARI campaign to those from other validation studies, it is important to consider the respective range gate settings. For instance, the error assessment performed in the framework of the WindVal III and AVATARE campaigns showed Rayleigh random errors with respect to the 2 µm DWL of about 3.9 and 4.3 m s−1, respectively (Witschas et al., 2020). During these campaigns, the range bin thickness was 1 km, whereas the vertical resolution was set to be higher (0.5 km) during the AVATARI campaign. Since this change in the settings involves a reduction in signal level by a factor of 2, larger random errors are expected. This is particularly true for the Rayleigh channel, where the precision is primarily limited by the Poisson noise and, thus, by the SNR level. In order to verify this effect, the AVATARI winds from the L2B product were post-processed such that the effective vertical resolution was also 1 km. For this purpose, the winds from three adjacent vertical bins (index i) were averaged as follows:
In this way, the wind speed measured in a certain range bin is smoothed with those of the neighbouring vertical bins, while the contribution of the latter to the averaged wind speed is 25 % each. At the same time, the number of bins remains unchanged so that the number of compared winds entering the statistical comparison with the other datasets is also unaffected. The procedure, however, requires that the regarded range bin has two neighbouring bins with valid wind data, which is, for example, not the case for the uppermost and lowermost range bin of every wind profile. Statistical comparison of the modified L2B data with the A2D and the ECMWF model background showed that the change in mean bias that is introduced by the smoothing to 1 km vertical resolution is insignificant, as expected. In contrast, a considerable influence is evident for the Rayleigh random error, which is reduced by approximately a factor of from around 5.5 to around 3.8 m s−1 for both ascending and descending orbits, thus being comparable to the precision of the Aeolus Rayleigh-clear winds determined in previous validation campaigns but exceeding the mission requirements (2.5 m s−1 in the troposphere; ESA, 2016). Concerning the Mie random error, the impact of the bin averaging is much smaller and accounts for only 0.1 m s−1. One reason is that the precision of the Mie wind speed determination (by the fringe imaging technique) is less dependent on the signal level, as Mie winds are typically obtained from clouds providing strong backscatter so that the signal level rather depends on the mean optical depth within the range gate. Another aspect is the fact that the L2B Mie wind data coverage is much sparser so that three adjacent vertical bins with valid wind data are only rarely available. Hence, the bin averaging procedure is only applied to much fewer bins compared to the Rayleigh channel.
Owing to its representative design and operating principle, the A2D is one of the key instruments for the Cal/Val activities during the Aeolus mission and for the preparation of a potential Aeolus follow-on mission. Therefore, substantial effort has been put into the continuous development of its experimental set-up, software implementation, and wind retrieval algorithm. In recent years, the focus was on the latter in order to overcome two major deficiencies that have limited the instrument's wind accuracy and precision. A novel QC scheme ensures that only backscatter return signals that were detected during proper co-alignment between the transmit and receive path are further processed in the wind retrieval. This approach diminishes the large Rayleigh wind errors that are caused by angular variations, particularly in the near field of the instrument. The QC is likewise applied to sort out the Mie measurements with suboptimal co-alignment, although the Mie channel is less sensitive to alignment variations. Since a large fraction (30 % to 60 %) of the Rayleigh and Mie measurements is rejected with the current QC settings, a refined alignment QC scheme that acts individually on the Mie channel is foreseen for the future. Large Mie wind biases were found to be caused by the skewness of the FI fringe and were reduced by averaging the wind speed over adjacent vertical bins containing strong gradients of the particle backscatter signal, e.g. from the edges of thick clouds. The retrieval modifications substantially decreased the random error of both channels from more than 2.0 to about 1.5 m s−1 (LOS) when comparing the wind datasets from entire campaigns against the high-accuracy 2 µm DWL winds. Furthermore, thanks to the drastic reduction in the systematic Rayleigh wind error in the near field, the measurement range could be extended closer to the aircraft from about 8 to about 10 km altitude. This enabled the accurate sampling of strong wind gradients and high wind speeds in the area of jet streams during the AVATARI campaign.
Thanks to the improved A2D performance, the Aeolus L2B HLOS winds could be validated with better accuracy. For this purpose, collocated wind measurements from 10 underflights in the North Atlantic region around Iceland in September 2019 were compared with each other after the harmonization of the two datasets. The statistical analysis yielded different Rayleigh and Mie biases for the ascending and descending orbits of Aeolus. While the Mie wind bias nearly vanishes for ascending orbits, it is −3.8 m s−1 when only underflights along descending orbits are considered. The comparison against ECMWF model background winds shows a smaller negative bias of around −1.7 m s−1, which could be explained by the rather small dataset from the four underflights along descending orbits lacking statistical significance. The Mie random errors are determined to be around 3 m s−1 for both campaign data subsets. The L2B Rayleigh winds were found to be negatively biased by about −2.1 m s−1 along ascending orbits, whereas a positive bias of around 1.2 m s−1 is evident on descending orbits. A smaller discrepancy was derived from the model comparison (−0.7; −0.4 m s−1), which, however, also confirmed a Rayleigh random error of about 5.5 m s−1 for both directions. This value is reduced by about to 3.8 m s−1 when the vertical bin thickness of 500 m, which was set during the AVATARI campaign, is increased to 1000 m in post-processing, yielding a random error that is comparable to previous airborne campaigns. The error assessment shows that, despite the mitigation of the two major error sources realized in the frame of the reprocessing of the L2B product, the Rayleigh and Mie winds still exhibit biases of up to about 2 m s−1 (neglecting the high Aeolus Mie bias relative to the A2D for descending orbits). This is mainly due to the fact that the M1 correction as part of the new processor aims at diminishing the wind bias on a global scale, which, however, does not exclude larger biases on regional scales. Nevertheless, the systematic errors are significantly smaller than those determined for the preliminary WindVal III and AVATARE datasets by means of the A2D (Lux et al., 2020a) and 2 µm DWL (Witschas et al., 2020), respectively. In the latter study, a Rayleigh wind bias of −4.6 m s−1 was determined for ascending orbits, which is reduced to −2.1 m s−1 according to the A2D comparison in the present work.
Despite the increased accuracy and precision of the A2D, the assessment of the Aeolus systematic and random error is primarily the task of the 2 µm DWL, given its still much higher accuracy of better than 0.1 m s−1 (Weissmann et al., 2005; Witschas et al., 2017). The A2D rather serves to study instrument-related issues that help to identify error sources of the satellite instrument and to explore possible measurement techniques and algorithm refinements which cannot be readily tested with the Aeolus measurement modes and processors due to operational constraints. In this sense, the A2D is an ideal test bed to verify novel correction schemes as those presented in this study.
Although ALADIN does not suffer from an incomplete telescope overlap within its measurement range and, thanks to its monostatic design, features an intrinsically stable transmit–receive co-alignment, apart from long-term alignment evolutions (Witschas et al., 2021), the implemented QC based on the horizontal Rayleigh spot positions may be also applicable to the Aeolus processor. For ALADIN, angular variations in the backscatter signals incident on the Rayleigh channel FPIs primarily arise from orbital cycles of the temperature distribution across the telescope primary mirror. The resulting variations in the Rayleigh wind bias are currently corrected by a multiple linear regression model which describes the wind bias, relative to the ECMWF model, as a function of various temperature sensors located on the primary telescope mirror (Weiler et al., 2021b). Preliminary analysis shows that the horizontal Rayleigh spot position derived from the uppermost atmospheric range bin is correlated with the orbital position of the satellite. However, further investigation is needed to assess whether the correlation of this parameter with the Rayleigh wind bias is strong enough such that it can be exploited for an alternative correction scheme potentially even without the need for ECMWF model winds as a reference. Like for the A2D, the vertical incidence angle, represented by the vertical spot position, is even more crucial for the systematic error of the Aeolus Rayleigh channel but is not available during wind mode due to the operation principle of the ACCD. However, as the present study has demonstrated, effective error correction is possible with the one-dimensional information only, supposedly because beam motions mainly occur along a fixed straight (diagonal) line in the plane spanned by the two axes so that the changes in the known horizontal spot position and the unknown vertical spot position are coupled with each other. The applied QC scheme might become even more relevant for an Aeolus follow-on mission in the case that bi-static architecture is chosen with separate transmit and receive paths, thus necessitating an active co-alignment control which might show similar limitations to that of the A2D. The same holds valid for the atmospheric backscatter lidar ATLID (ATmospheric LIDar) on board ESA's forthcoming Earth Explorer mission EarthCARE (Earth Cloud, Aerosol and Radiation Explorer), which is scheduled for launch in 2023, which also relies on a bi-static design and, thus, makes use of a co-alignment sensor at receiver chain level for ensuring that the emitted laser beam is aligned with the receiver FOV (do Carmo et al., 2021). However, there are also other receiver designs that may be applicable in future spaceborne Doppler wind lidars, e.g. based on Michelson or Mach–Zehnder interferometers (Herbst and Vrancken, 2016; Tucker et al.; 2018; Baidar et al., 2018; Bruneau and Pelon, 2021), which allow for larger acceptance angles, thus relaxing the requirements on the transmitter–receiver co-alignment.
The correction approach that was applied to A2D Mie winds with large opposing biases in vertically neighbouring range bins might be also transferrable to the Aeolus wind retrieval with a wind gradient threshold adapted to the Aeolus LOS. Although the Mie fringe measured with the ALADIN instrument exhibits a smaller degree of skewness than the A2D Mie fringe, similar error patterns were detected in atmospheric scenes with thick clouds in the lower troposphere. Here, a more detailed analysis of larger Aeolus datasets containing such scenes, and those with extraordinarily strong vertical wind speed gradients, is necessary to evaluate whether the Aeolus Mie winds are affected by a similar error source and could potentially be corrected by comparable means. Besides ALADIN, the presented correction schemes, particularly for the Rayleigh channel, may also be applicable to other DWLs that rely on the utilization of FPIs and that are sensitive to variations in the incidence angle.
The development of the A2D wind retrieval will be further pursued with a focus on the cross-talk between the Rayleigh and Mie channel. In particular, the influence of narrowband Mie backscatter signals on the Rayleigh channel response in case of thin clouds or low atmospheric aerosol loadings is an important aspect that will be addressed in the near future. This topic will also be of high relevance for the Aeolus wind and aerosol products, especially with regard to a recent Aeolus validation campaign that was conducted in the tropics in September 2021.
The presented work includes data of the Aeolus mission that is part of the European Space Agency (ESA) Earth Explorer Programme. This includes the reprocessed L2B wind product (Baseline 10; de Kloe et al., 2020; https://earth.esa.int/eogateway/documents/20142/37627/Aeolus-L2B-2C-Input-Output-DD-ICD.pdf, last access: 7 February 2022) for the period of the AVATARI campaign (from 9 through 29 September 2019) that is publicly available and can be accessed via the ESA Aeolus Online Dissemination System (http://aeolus-ds.eo.esa.int/oads/access/collection/L2C_Wind_Products, last access: 7 February 2022; ESA, 2022). The processor development, improvement, and product reprocessing preparation have been performed by the Aeolus DISC (Data, Innovation and Science Cluster), which involves DLR, DoRIT, TROPOS, ECMWF, KNMI, CNRS, S&T, ABB, and Serco, in close cooperation with the Aeolus PDGS (Payload Data Ground Segment). The A2D data used in this paper can be provided upon request to Christian Lemmerz (christian.lemmerz@dlr.de).
OL, CL, and OR conducted the A2D wind observations. CL was the principal investigator of the AVATARE and AVATARI campaigns. OL, FW, and UM analysed the A2D data and developed the methodology to compare the A2D, 2 µm DWL and Aeolus L2B datasets. BW and SR conducted the 2 µm DWL measurements and processed the 2 µm DWL data. CL, OR, AG, and AS conducted the flight planning. The paper was written by OL, with contributions from all co-authors.
The contact author has declared that neither they nor their co-authors have any competing interests.
Publisher’s note: Copernicus Publications remains neutral with regard to jurisdictional claims in published maps and institutional affiliations.
This article is part of the special issue “Aeolus data and their application (AMT/ACP/WCD inter-journal SI)”. It is not associated with a conference.
We thank our ESA colleagues Thorsten Fehr (Aeolus scientific campaign coordinator), Anne Grete Straume (Aeolus mission scientist), and Jonas von Bismarck (Aeolus data quality manager), for their support of the study. The authors are also grateful to the DLR flight experiments department, for the realization of the two airborne campaigns within only 6 months.
The AVATARE and AVATARI campaigns have been supported by the European Space Agency (grant no. 4000128136/19/NL/IA). The first author was partly funded by a young scientist grant by the ESA within the DRAGON 4 program (grant no. 4000121191/17/I-NB).
The article processing charges for this open-access publication were covered by the German Aerospace Center (DLR).
This paper was edited by Ad Stoffelen and reviewed by three anonymous referees.
Abdallah, S., Aprile, S., Mellano, L., De Laurentis, M., Fischer, P., von Bismarck, J., Krisch, I., Reitebuch, O., Masoumzadeh, N., Flament, T., Trapon, D., Weiler, F., Bucci, S., Gostinicchi, G., de Kloe, J., Rennie, M., and Isaksen, L.: Aeolus: First FM-B science data reprocessing campaign, Aeolus Cal/Val & Science Workshop 2020, Online, 2–6 November 2020, https://www.dropbox.com/s/ipj9x3uu16c38ti/Saleh_Abdalla_Et.Al_Flash_First_FM-B_Science_Data_Reprocessing.pdf?dl=0 (last access: 15 October 2021), 2020.
Andersson, E.: Statement of Guidance for Global Numerical Weather Prediction (NWP), World Meteorological Organisation, https://docplayer.net/194586713-Statement-of-guidance-for-global-numerical-weather- prediction-nwp.html, (last access: 2 March 2022), 2018.
Baars, H., Herzog, A., Heese, B., Ohneiser, K., Hanbuch, K., Hofer, J., Yin, Z., Engelmann, R., and Wandinger, U.: Validation of Aeolus wind products above the Atlantic Ocean, Atmos. Meas. Tech., 13, 6007–6024, https://doi.org/10.5194/amt-13-6007-2020, 2020.
Baidar, S., Tucker, S. C., Beaubien, M., and Hardesty, R. M.: The Optical Autocovariance Wind Lidar. Part II: Green OAWL (GrOAWL) Airborne Performance and Validation, J. Atmos. Ocean. Technol., 35, 2099–2116, https://doi.org/10.1175/JTECH-D-18-0025.1, 2018.
Bedka, K. M., Nehrir, A. R., Kavaya, M., Barton-Grimley, R., Beaubien, M., Carroll, B., Collins, J., Cooney, J., Emmitt, G. D., Greco, S., Kooi, S., Lee, T., Liu, Z., Rodier, S., and Skofronick-Jackson, G.: Airborne lidar observations of wind, water vapor, and aerosol profiles during the NASA Aeolus calibration and validation (Cal/Val) test flight campaign, Atmos. Meas. Tech., 14, 4305–4334, https://doi.org/10.5194/amt-14-4305-2021, 2021.
Bruneau, D. and Pelon, J.: A new lidar design for operational atmospheric wind and cloud/aerosol survey from space, Atmos. Meas. Tech., 14, 4375–4402, https://doi.org/10.5194/amt-14-4375-2021, 2021.
Bühl, J., Engelmann, R., and Ansmann, A.: Removing the Laser-Chirp Influence from Coherent Doppler Lidar Datasets by Two-Dimensional Deconvolution, J. Atmos. Ocean. Technol., 29, 1042–1051, https://doi.org/10.1175/JTECH-D-11-00144.1, 2012.
Chanin, M. L., Garnier, A., Hauchecorne, A., and Porteneuve, J.: A Doppler lidar for measuring winds in the middle atmosphere, Geophys. Res. Lett., 16, 1273–1276, https://doi.org/10.1029/GL016i011p01273, 1989.
Chen, S., Cao, R., Xie, Y., Zhang, Y., Tan, W., Chen, H., Guo, P., and Zhao, P.: Study of the seasonal variation in Aeolus wind product performance over China using ERA5 and radiosonde data, Atmos. Chem. Phys., 21, 11489–11504, https://doi.org/10.5194/acp-21-11489-2021, 2021.
de Kloe, J., Stoffelen, A., Tan, D., Andersson, E., Rennie, M., Dabas, A., Poli, P., and Huber, D.: ADM-Aeolus Level-2B/2C Processor Input/Output Data Definitions Interface Control Document, AED-SD-ECMWF-L2B-037, v. 3.4, 110 pp., Aeolus Data Innovation and Science Cluster (DISC), https://earth.esa.int/eogateway/documents/20142/37627/Aeolus-L2B-2C-Input-Output-DD-ICD.pdf (last access: 7 February 2022), 2020.
do Carmo, J. P., Villele, G. de, Wallace, K., Lefebvre, A., Ghose, K., Kanitz, T., Chassat, F., Corselle, B., Belhadj, T., and Bravetti, P.: ATmospheric LIDar (ATLID): Pre-Launch Testing and Calibration of the European Space Agency Instrument That Will Measure Aerosols and Thin Clouds in the Atmosphere, Atmosphere, 12, 76, https://doi.org/10.3390/atmos12010076, 2021.
European Space Agency (ESA): ADM-Aeolus Science Report, ESA SP-1311, 121 pp., European Space Agency, https://esamultimedia.esa.int/multimedia/publications/SP-1311/SP-1311.pdf (last access: 2 March 2022), 2008.
European Space Agency (ESA): ADM-Aeolus Mission Requirements Document, ESA EOP-SM/2047, 57 pp., European Space Agency, https://earth.esa.int/eogateway/documents/20142/1564626/Aeolus-Mission-Requirements.pdf (last access: 22 August 2021), 2016.
European Space Agency (ESA): L2C assimilated wind products, European Space Agency [data set], http://aeolus-ds.eo.esa.int/oads/access/collection/L2C_Wind_Products, last access: 7 February 2022.
Fehr, T., Amiridis, V., Cocquerez, P., Lemmerz, C., Močnik, G., Skofronick-Jackson, G., Bley, S., and Flamant, C.: Aeolus Campaigns: Overview and the Tropical Campaign 2021, Aeolus Cal/Val & Science Workshop 2020, Online, 2–6 November 2020, https://www.dropbox.com/s/y26eu2l8uqac8rw/Thorsten_Fehr_Oral_AeolusCampaigns_v1_red.pdf?dl=0 (last access: 15 October 2021), 2020.
Fehr, T., Amiridis, V., von Bismarck, J., Bley, S., Flamant, C., Hertzog, A., Lemmerz, C., Močnik, G., Parrinello, T., Skofronick-Jackson, G., and Straume, A. G.: Aeolus Calibration, Validation and Science Post-Launch Campaigns, EGU General Assembly 2021, Online, 19–30 April 2021, EGU2021-12562, https://doi.org/10.5194/egusphere-egu21-12562, 2021.
Flesia, C. and Korb, C. L.: Theory of the double-edge molecular technique for Doppler lidar wind measurement, Appl. Opt., 38, 432–440, https://doi.org/10.1364/AO.38.000432, 1999.
Garnier, A. and Chanin, M. L.: Description of a Doppler Rayleigh LIDAR for measuring winds in the middle atmosphere, Appl. Phys. B, 55, 35–40, https://doi.org/10.1007/BF00348610, 1992.
Gentry, B. M., Chen, H., and Li, S. X.: Wind measurements with 355-nm molecular Doppler lidar, Opt. Lett., 25, 1231–1233, https://doi.org/10.1364/OL.25.001231, 2000.
Herbst, J. and Vrancken, P.: Design of a monolithic Michelson interferometer for fringe imaging in a near-field, UV, direct-detection Doppler wind lidar, Appl. Opt., 55, 6910–6929, https://doi.org/10.1364/AO.55.006910, 2016.
Iwai, H., Aoki, M., Oshiro, M., and Ishii, S.: Validation of Aeolus Level 2B wind products using wind profilers, ground-based Doppler wind lidars, and radiosondes in Japan, Atmos. Meas. Tech., 14, 7255–7275, https://doi.org/10.5194/amt-14-7255-2021, 2021.
Kanitz, T., Lochard, J., Marshall, J., McGoldrick, P., Lecrenier, O., Bravetti, P., Reitebuch, O., Rennie, M., Wernham, D., and Elfving, A.: Aeolus First Light – First Glimpse, Proc. SPIE, 11180, 111801R, https://doi.org/10.1117/12.2535982, 2019.
Kanitz, T., Wernham, D., Alvarez, E., Tzeremes, G., Parrinello, T., Marshall, J., Brewster, J., Lecrenier, O., Schillinger, M., Sanctis, V. de, D'Ottavi, A., Reitebuch, O., Weiler, F., Lux, O., Rennie, M., and Isaksen, L.: Aeolus - ESA'S Wind Lidar Mission, A Brief Status, in: 2020 IEEE International Geoscience and Remote Sensing Symposium, Waikoloa, USA, 26 September–2 October 2020, 3463–3466, 2020.
Khaykin, S. M., Hauchecorne, A., Wing, R., Keckhut, P., Godin-Beekmann, S., Porteneuve, J., Mariscal, J.-F., and Schmitt, J.: Doppler lidar at Observatoire de Haute-Provence for wind profiling up to 75 km altitude: performance evaluation and observations, Atmos. Meas. Tech., 13, 1501–1516, https://doi.org/10.5194/amt-13-1501-2020, 2020.
Lemmerz, C., Lux, O., Reitebuch, O., Witschas, B., and Wührer, C.: Frequency and timing stability of an airborne injection-seeded Nd: YAG laser system for direct-detection wind lidar, Appl. Opt., 56, 9057, https://doi.org/10.1364/ao.56.009057, 2017.
Lux, O., Lemmerz, C., Weiler, F., Marksteiner, U., Witschas, B., Rahm, S., Schäfler, A., and Reitebuch, O.: Airborne wind lidar observations over the North Atlantic in 2016 for the pre-launch validation of the satellite mission Aeolus, Atmos. Meas. Tech., 11, 3297–3322, https://doi.org/10.5194/amt-11-3297-2018, 2018.
Lux, O., Lemmerz, C., Weiler, F., Marksteiner, U., Witschas, B., Nagel, E., and Reitebuch, O.: Speckle Noise Reduction by Fiber Scrambling for Improving the Measurement Precision of an Airborne Wind Lidar System, in: 2019 Conference on Lasers and Electro-Optics Europe & European Quantum Electronics Conference (CLEO/Europe-EQEC), CLEO Europe, Munich, Germany, 23–27 June 2019, OSA Technical Digest, paper ch_2_2, https://doi.org/10.1109/CLEOE-EQEC.2019.8872955, 2019.
Lux, O., Lemmerz, C., Weiler, F., Marksteiner, U., Witschas, B., Rahm, S., Geiß, A., and Reitebuch, O.: Intercomparison of wind observations from the European Space Agency's Aeolus satellite mission and the ALADIN Airborne Demonstrator, Atmos. Meas. Tech., 13, 2075–2097, https://doi.org/10.5194/amt-13-2075-2020, 2020a.
Lux, O., Wernham, D., Bravetti, P., McGoldrick, P., Lecrenier, O., Riede, W., D'Ottavi, A., Sanctis, V. de, Schillinger, M., Lochard, J., Marshall, J., Lemmerz, C., Weiler, F., Mondin, L., Ciapponi, A., Kanitz, T., Elfving, A., Parrinello, T., and Reitebuch, O.: High-power and frequency-stable ultraviolet laser performance in space for the wind lidar on Aeolus, Opt. Lett., 45, 1443–1446, https://doi.org/10.1364/OL.387728, 2020b.
Lux, O., Lemmerz, C., Weiler, F., Kanitz, T., Wernham, D., Rodrigues, G., Hyslop, A., Lecrenier, O., McGoldrick, P., Fabre, F., Bravetti, P., Parrinello, T., and Reitebuch, O.: ALADIN laser frequency stability and its impact on the Aeolus wind error, Atmos. Meas. Tech., 14, 6305–6333, https://doi.org/10.5194/amt-14-6305-2021, 2021.
Marksteiner, U.: Airborne Wind Lidar Observations for the Validation of the ADM-Aeolus Instrument, PhD thesis, Technische Universität München, 180 pp., https://pdfs.semanticscholar.org/6e2a/9435e63122a5bfce5fdbe0b881c76fd7962f.pdf (last access: 18 May 2021), 2013.
Marksteiner, U., Lemmerz, C., Lux, O., Rahm, S., Schäfler, A., Witschas, B., and Reitebuch, O.: Calibrations and Wind Observations of an Airborne Direct-Detection Wind LiDAR Supporting ESA's Aeolus Mission, Remote Sens., 10, 2056, https://doi.org/10.3390/rs10122056, 2018.
Marseille, G.-J., de Kloe, J., Marksteiner, U., Reitebuch, O., Rennie, M., and de Haan, S.: NWP calibration applied to Aeolus Mie channel winds, Q. J. R. Meteorol. Soc., https://doi.org/10.1002/qj.4244, 2022.
Martin, A., Weissmann, M., Reitebuch, O., Rennie, M., Geiß, A., and Cress, A.: Validation of Aeolus winds using radiosonde observations and numerical weather prediction model equivalents, Atmos. Meas. Tech., 14, 2167–2183, https://doi.org/10.5194/amt-14-2167-2021, 2021.
Masoumzadeh, N., Reitebuch, O., Weiler, F., Krisch, I., Marksteiner, U., de Kloe, J., Abdalla, S., Flament, T., Trapon, D., Aprile, S., Mellano, L., De Laurentis, M., Fischer, P., von Bismarck, J., Bucci, S., and Gostinicchi, G.: Strategy for re-processing of Aeolus data products, Aeolus Cal/Val & Science Workshop 2020, Online, 2–6 November 2020, https://www.dropbox.com/s/y66qks2aqppyy9i/Nafiseh_Masoumzadeh_Flash_Strategy.pdf?dl=0 (last access: 15 October 2021), 2020.
McKay, J. A.: Assessment of a multibeam Fizeau wedge interferometer for Doppler wind lidar, Appl. Opt., 41, 1760, https://doi.org/10.1364/AO.41.001760, 2002.
Mei, L., Ma, T., Zhang, Z., Fei, R., Liu, K., Gong, Z., and Li, H.: Experimental Calibration of the Overlap Factor for the Pulsed Atmospheric Lidar by Employing a Collocated Scheimpflug Lidar, Remote Sens., 12, 1227, https://doi.org/10.3390/rs12071227, 2020.
Nelder, J. A. and Mead, R.: A Simplex Method for Function Minimization, Comput. J., 7, 308–313, https://doi.org/10.1093/comjnl/7.4.308, 1965.
Paffrath, U., Lemmerz, C., Reitebuch, O., Witschas, B., Nikolaus, I., and Freudenthaler, V.: The Airborne Demonstrator for the Direct-Detection Doppler Wind Lidar ALADIN on ADM-Aeolus. Part II: Simulations and Rayleigh Receiver Radiometric Performance, J. Atmos. Ocean. Technol., 26, 2516–2530, https://doi.org/10.1175/2009JTECHA1314.1, 2009.
Parrinello, T., Straume, A. G., Von Bismark, J., Bley, S., Tran, V. D., Fisher, P., Wernham, D., Kanitz, T., Fehr, T., De Laurentis, M., Alvarez, E., Krish, I., Reithebuch, O., and Rennie, M.: Aeolus: ESA's wind mission. Status and future challenges, EGU General Assembly 2021, Online, 19–30 April 2021, EGU21-1676, https://doi.org/10.5194/egusphere-egu21-1676, 2021.
Reitebuch, O.: The Spaceborne Wind Lidar Mission ADM-Aeolus, in: Atmospheric physics: Background, methods, trends, edited by: Schumann, U., Research Topics in Aerospace, Springer, Berlin, London, 815–827, https://doi.org/10.1007/978-3-642-30183-4_49, 2012.
Reitebuch, O., Lemmerz, C., Nagel, E., Paffrath, U., Durand, Y., Endemann, M., Fabre, F., and Chaloupy, M.: The Airborne Demonstrator for the Direct-Detection Doppler Wind Lidar ALADIN on ADM-Aeolus. Part I: Instrument Design and Comparison to Satellite Instrument, J. Atmos. Ocean. Technol., 26, 2501–2515, https://doi.org/10.1175/2009JTECHA1309.1, 2009.
Reitebuch, O., Lemmerz, C., Lux, O., Marksteiner, U., Rahm, S., Weiler, F., Witschas, B., Meringer, M., Schmidt, K., Huber, D., Nikolaus, I., Geiss, A., Vaughan, M., Dabas, A., Flament, T., Stieglitz, H., Isaksen, L., Rennie, M., Kloe, J. D., Marseille, G.-J., Stoffelen, A., Wernham, D., Kanitz, T., Straume, A.-G., Fehr, T., von Bismarck, J., Floberghagen, R., and Parrinello, T.: Initial Assessment of the Performance of the First Wind Lidar in Space on Aeolus, EPJ Web Conf., 237, 1010, https://doi.org/10.1051/epjconf/202023701010, 2020.
Rennie, M. and Isaksen, L.: The NWP impact of Aeolus Level-2B winds at ECMWF, Technical Memorandum, ECMWF, https://doi.org/10.21957/alift7mhr, 2020.
Rennie, M., Tan, D., Andersson, E., Poli, P., Dabas, A., De Kloe, J., Marseille, G.-J., and Stoffelen, A.: Aeolus Level-2B Algorithm Theoretical Basis Document (Mathematical Description of the Aeolus L2B Processor), AED-SD-ECMWF-L2B-038, V. 3.4, 124 pp., ECMWF, https://earth.esa.int/eogateway/documents/20142/37627/Aeolus-L2B-Algorithm-ATBD.pdf (last access: 25 January 2021), 2020.
Rennie, M. P., Isaksen, L., Weiler, F., Kloe, J., Kanitz, T., and Reitebuch, O.: The impact of Aeolus wind retrievals in ECMWF global weather forecasts, Q. J. R. Meteorol. Soc., 147, 3555–3586, https://doi.org/10.1002/qj.4142, 2021.
Schäfler, A., Craig, G., Wernli, H., Arbogast, P., Doyle, J. D., McTaggart-Cowan, R., Methven, J., Rivière, G., Ament, F., Boettcher, M., Bramberger, M., Cazenave, Q., Cotton, R., Crewell, S., Delanoë, J., Dörnbrack, A., Ehrlich, A., Ewald, F., Fix, A., Grams, C. M., Gray, S. L., Grob, H., Groß, S., Hagen, M., Harvey, B., Hirsch, L., Jacob, M., Kölling, T., Konow, H., Lemmerz, C., Lux, O., Magnusson, L., Mayer, B., Mech, M., Moore, R., Pelon, J., Quinting, J., Rahm, S., Rapp, M., Rautenhaus, M., Reitebuch, O., Reynolds, C. A., Sodemann, H., Spengler, T., Vaughan, G., Wendisch, M., Wirth, M., Witschas, B., Wolf, K., and Zinner, T.: The North Atlantic Waveguide and Downstream Impact Experiment, B. Am. Meteorol. Soc., 99, 1607–1637, https://doi.org/10.1175/BAMS-D-17-0003.1, 2018.
Stelmaszczyk, K., Dell'Aglio, M., Chudzyński, S., Stacewicz, T., and Wöste, L.: Analytical function for lidar geometrical compression form-factor calculations, Appl. Opt., 44, 1323–1331, https://doi.org/10.1364/AO.44.001323, 2005.
Stoffelen, A., Pailleux, J., Källen, E., Vaughan, M., Isaksen, L., Flamant, P., Wergen, W., Andersson, E., Schyberg, H., Culoma, A., Meynart, R., Endemann, M., and Ingmann, P.: The Atmospheric Dynamics Mission for Global Wind Field Measurement, B. Am. Meteorol. Soc. 86, 73–87, https://doi.org/10.1175/BAMS-86-1-73, 2005.
Stoffelen, A., Benedetti, A., Borde, R., Dabas, A., Flamant, P., Forsythe, M., Hardesty, M., Isaksen, L., Källén, E., Körnich, H., Lee, T., Reitebuch, O., Rennie, M., Riishøjgaard, L.-P., Schyberg, H., Straume, A. G., and Vaughan, M.: Wind Profile Satellite Observation Requirements and Capabilities, B. Am. Meteorol. Soc., 101, E2005-E2021, https://doi.org/10.1175/BAMS-D-18-0202.1, 2020.
Straume, A. G., Rennie, M., Isaksen, L., Kloe, J. de, Marseille, G.-J., Stoffelen, A., Flament, T., Stieglitz, H., Dabas, A., Huber, D., Reitebuch, O., Lemmerz, C., Lux, O., Marksteiner, U., Weiler, F., Witschas, B., Meringer, M., Schmidt, K., Nikolaus, I., Geiss, A., Flamant, P., Kanitz, T., Wernham, D., von Bismarck, J., Bley, S., Fehr, T., Floberghagen, R., and Parinello, T.: ESA's Space-Based Doppler Wind Lidar Mission Aeolus – First Wind and Aerosol Product Assessment Results, EPJ Web Conf., 237, 1007, https://doi.org/10.1051/epjconf/202023701007, 2020.
Tucker, S. C., Weimer, C. S., Baidar, S., and Hardesty, R. M.: The Optical Autocovariance Wind Lidar. Part I: OAWL Instrument Development and Demonstration, J. Atmos. Ocean. Technol., 35, 2079–2097, https://doi.org/10.1175/JTECH-D-18-0024.1, 2018.
Wandinger, U. and Ansmann, A.: Experimental determination of the lidar overlap profile with Raman lidar, Appl. Opt., 41, 511–514, https://doi.org/10.1364/AO.41.000511, 2002.
Weiler, F.: Bias correction using ground echoes for the airborne demonstrator of the wind lidar on the ADM-Aeolus mission, Master's thesis, University of Innsbruck, 96 pp., https://resolver.obvsg.at/urn:nbn:at:at-ubi:1-7104 (last access: 11 October 2020), 2017.
Weiler, F., Kanitz, T., Wernham, D., Rennie, M., Huber, D., Schillinger, M., Saint-Pe, O., Bell, R., Parrinello, T., and Reitebuch, O.: Characterization of dark current signal measurements of the ACCDs used on board the Aeolus satellite, Atmos. Meas. Tech., 14, 5153–5177, https://doi.org/10.5194/amt-14-5153-2021, 2021a.
Weiler, F., Rennie, M., Kanitz, T., Isaksen, L., Checa, E., de Kloe, J., Okunde, N., and Reitebuch, O.: Correction of wind bias for the lidar on board Aeolus using telescope temperatures, Atmos. Meas. Tech., 14, 7167–7185, https://doi.org/10.5194/amt-14-7167-2021, 2021b.
Weissmann, M., Busen, R., Dörnbrack, A., Rahm, S., and Reitebuch, O.: Targeted Observations with an Airborne Wind Lidar, J. Atmos. Ocean. Tech., 22, 1706–1719, https://doi.org/10.1175/JTECH1801.1, 2005.
Witschas, B.: Analytical model for Rayleigh–Brillouin line shapes in air, Appl. Opt., 50, 267–270, https://doi.org/10.1364/AO.50.000267, 2011a.
Witschas, B.: Analytical model for Rayleigh–Brillouin line shapes in air: Errata, Appl. Opt., 50, 5758, https://doi.org/10.1364/AO.50.005758, 2011b.
Witschas, B., Rahm, S., Dörnbrack, A., Wagner, J., and Rapp, M.: Airborne Wind Lidar Measurements of Vertical and Horizontal Winds for the Investigation of Orographically Induced Gravity Waves, J. Atmos. Ocean. Tech., 34, 1371–1386, https://doi.org/10.1175/JTECH-D-17-0021.1, 2017.
Witschas, B., Lemmerz, C., Geiß, A., Lux, O., Marksteiner, U., Rahm, S., Reitebuch, O., and Weiler, F.: First validation of Aeolus wind observations by airborne Doppler wind lidar measurements, Atmos. Meas. Tech., 13, 2381–2396, https://doi.org/10.5194/amt-13-2381-2020, 2020.
Witschas, B., Lemmerz, C., Lux, O., Marksteiner, U., Reitebuch, O., Weiler, F., Fabre, F., Dabas, A., Flament, T., Huber, D., and Vaughan, M.: Spectral performance analysis of the Aeolus Fabry-Pérot and Fizeau interferometers during the first years of operation, Atmos. Meas. Tech. Discuss. [preprint], https://doi.org/10.5194/amt-2021-357, in review, 2021.
- Abstract
- Introduction
- Overview of validation campaigns and datasets
- The A2D and its evolution since 2005
- Aeolus validation using the improved A2D
- Summary and conclusions
- Data availability
- Author contributions
- Competing interests
- Disclaimer
- Special issue statement
- Acknowledgements
- Financial support
- Review statement
- References