the Creative Commons Attribution 4.0 License.
the Creative Commons Attribution 4.0 License.
 | 15 Mar 2022
Above-aircraft cirrus cloud and aerosol optical depth from hyperspectral irradiances measured by a total-diffuse radiometer
Matthew S. Norgren
John Wood
K. Sebastian Schmidt
Bastiaan van Diedenhoven
Snorre A. Stamnes
Luke D. Ziemba
Ewan C. Crosbie
Michael A. Shook
A. Scott Kittelman
Samuel E. LeBlanc
Stephen Broccardo
Steffen Freitag
Jeffrey S. Reid
This study develops the use of spectral total and diffuse irradiance measurements, made from a prototype hyperspectral total-diffuse sunshine pyranometer (SPN-S), to retrieve layer fine-mode aerosol (τaer) and total optical depths from airborne platforms. Additionally, we use spectral analysis in an attempt to partition the total optical depth into its τaer and cirrus cloud optical depth (τcld) components in the absence of coarse-mode aerosols. Two retrieval methods are developed: one leveraging information in the diffuse irradiance and the other using spectral characteristics of the transmitted direct beam, with each approach best suited for specific cloud and aerosol conditions. The SPN-S has advantages over traditional sun photometer systems, including no moving parts and a low cost. However, a significant drawback of the instrument is that it is unable to measure the direct-beam irradiance as accurately as sun photometers. To compensate for the greater measurement uncertainty in the radiometric irradiances, these retrieval techniques employ ratioed inputs or spectral information to reduce output uncertainty. This analysis uses irradiance measurements from the SPN-S and the solar spectral flux radiometer (SSFR) aboard the National Aeronautics and Space Administration's (NASA) P-3 aircraft during the 2018 deployment of the ObseRvations of Aerosols above CLouds and their intEractionS (ORACLES) campaign and the 2019 Cloud, Aerosol and Monsoon Processes Philippines Experiment (CAMP2Ex) mission to quantify above-aircraft cirrus τcld and derive vertical profiles of layer τaer. Validation of the τaer retrieval is accomplished by comparison with co-located measurements of direct solar irradiance made by the Sky-Scanning Sun-Tracking Atmospheric Research (4STAR) and in situ measurements of aerosol optical depth. For the aggregated 2018 ORACLES results, regression between the SPN-S-based method and sun photometer τaer values yields a slope of 0.96 with an R2 of 0.96, while the root mean square error (RMSE) is . When comparing the retrieved τaer to profiles of integrated in situ measurements of optical extinction, the slope, R2, and RMSE values for ORACLES are 0.90, 0.96, and , and for CAMP2Ex they are 0.94, 0.97, and , respectively.
This paper is a demonstration of methods for deriving cloud and aerosol optical properties in environments where both atmospheric constituents may be present. With improvements to the low-cost SPN-S radiometer instrument, it may be possible to extend these methods to a broader set of sampling applications, such as ground-based settings.
- Article
(4921 KB) - Full-text XML
- BibTeX
- EndNote


Clouds and aerosol particles both play important roles in controlling the flux of solar radiation through the Earth's atmosphere. Despite their relevance to the broader climate system and Earth's radiative balance, significant uncertainty exists in quantifying the optical properties of atmospheric systems containing one or both constituents. Traditional passive remote sensing methods retrieve aerosol properties in the absence of clouds (Holben et al., 1998; Levey et al., 2013). This is because when clouds are thick their radiative signal is large in relation to the aerosol signal, and when clouds are thin it is difficult to separate the two signals. For automated aerosol optical depth (τaer) retrievals, the challenge of cloud detection and removal is a significant hurdle to overcome (Smirnov et al., 2000; Remer et al., 2012; Spencer et al., 2019; Yang et al., 2019). Advanced methods, such as the spectral deconvolution algorithm (SDA), have been developed to differentiate between fine- and coarse-mode τaer using spectral sun photometry data (O'Neill et al., 2003), though these techniques are limited when cirrus is present (Smirnov et al., 2018). Conversely, retrieval of cloud optical depth (τcld) tends to be insensitive to the aerosol loading of the local environment because clouds are often much thicker optically than aerosols. A common exception to this occurs when thin cirrus clouds are present. Reported values for mean cirrus cloud optical depth vary regionally (Giannakaki et al., 2007; Dai et al., 2019) but tend to be less than a value of unity (Kox et al., 2014; Heymsfield et al., 2017; Zhou et al., 2018). Since it is common for cirrus to have optical depths similar to those of aerosols, which typically have values less than 4 in equatorial regions (Torres et al., 2002), remote sensing of the optical depth of either constituent is complicated by the presence of the other. Other thin-cloud types, such as low-level clouds in the Arctic, can have relatively high rates of occurrence and therefore pose challenges when using remote sensing techniques to study cloud or aerosol optical properties. For the case of thin Arctic clouds, Garrett and Zhao (2013) demonstrated the utility of thermal spectral remote sensing to derive the optical properties when the clouds have an emissivity less than unity.
The necessity of retrieving both aerosol and cirrus cloud optical properties is supported by the fact that aerosols are ubiquitous throughout Earth's atmosphere, and cirrus clouds are globally prevalent (Sassen et al., 2008). Cirrus presence is especially high in equatorial regions, where their frequency of occurrence can be near 50 % (Sassen et al., 2008; Zou et al., 2020). Overlying cirrus limits remote sensing of cloud and aerosol properties by passive airborne radiometers and polarimeters (e.g., Werner et al., 2013; Stamnes et al., 2018), and ground-based sun photometer retrievals of τaer frequently suffer from contamination by these clouds (Chew et al., 2011). In the past, attempts have been made to account for and correct retrievals of τaer for the impact of cirrus (Lee et al., 2013). Efforts have also been made to use sun photometry to derive cirrus τcld (Kinne et al., 1997; Segal-Rosenheimer et al., 2013), but work towards joint τcld and τaer retrieval is limited.
In this paper we address some of the issues associated with remote sensing of thin-cloud and aerosol systems by leveraging the capabilities of a new hyperspectral total-diffuse radiometer, SPN-S. The advantage of this radiometer system is that it is low-cost and deployable to a wide range of environments. The device is mechanically simple, with a fixed shadow mask used to block the direct beam of the sun to make measurements of the diffuse irradiance. This shadow mask design allows for simultaneous measurements of both the total and diffuse fluxes, which is functionality that traditional rotating shadow band radiometer systems cannot obtain. The concurrent sampling of the two irradiances is useful in airborne or other dynamic settings where scenes can change rapidly. However, radiometer systems like the SPN-S have higher measurement uncertainties than sun photometer systems, which limits their ability to investigate atmospheric optical properties. To compensate for lower accuracy, we propose a method for deriving τcld of thin clouds using narrowband measurements of the diffuse-to-total ratio (DR). This diffuse ratio method, which is referred to as RD, is advantageous for the study of thin clouds (τ<1) because its main radiometric input is a ratio of two measured irradiances made from the same instrument, which reduces absolute calibration-induced errors. By using the ratio of two radiometric quantities as the retrieval input, the measurement uncertainty affecting the retrieval output is strongly dependent on the instrument precision, which is low in relation to the overall radiometric calibration of the system. As a result, the RD method reliably detects thin clouds because it is highly sensitive to small variations in optical depth. The concept of using a ratio of two spectral measurements to study thin clouds was previously developed by Garrett and Zhao (2013), who used a ratio of measured thermal emission to study thermodynamic phase and optical properties of thin Arctic clouds. A second method, which we refer to as the spectral direct-beam method (RS), uses measurements of the direct irradiance to develop optical depth spectra. The shape of the spectral optical depth curve contains information on the loading of fine-mode and large, coarse-mode particles in the atmosphere. In the absence of coarse-mode aerosols we show the potential to retrieve τaer and τcld values.
The two methods presented in this study overlap with previous cloud and aerosol retrieval techniques. DR has been used to study aerosol single-scattering albedo and asymmetry parameter properties using measurements from multi-filter rotating shadow band radiometers (MFRSRs; Kassianov et al., 2007; Herman et al., 1975). Although MFRSRs are the most widely used total-diffuse radiometer system, past work utilizing the instrument has relied on the direct irradiance measurement when deriving τaer (Michalsky et al., 2010). Likewise, the use of spectral shape of the transmitted direct beam in the RS method is similar to the SDA method developed by O'Neill et al. (2003). However, MFRSR and sun photometer systems require extensive alignment and precise operating conditions, making these past methods not applicable to airborne settings and restricting them to use at the surface. Extending these previous works and then using them in conjunction with a shadow-mask-designed radiometer allows for a broader set of applications. Specifically, the use of the SPN-S in airborne settings (or other non-stationary environments) is a novel application of a spectral total-diffuse radiometer system which allows for greater detail of the atmospheric aerosol and cloud structure to be known.
This paper describes the theoretical underpinnings of the retrievals in Sect. 2, along with a justification of which method is best suited for specific atmospheric conditions. Section 3 overviews the data used in the study from two airborne field campaigns: the 2018 deployment of the ObseRvations of Aerosols above CLouds and their intEractionS (ORACLES) campaign conducted over the Southeast Atlantic Ocean and the 2019 Cloud, Aerosol and Monsoon Processes Philippines Experiment (CAMP2Ex) mission conducted above the waters surrounding the Philippines. Section 3 follows with a detailed accounting of the retrieval algorithm implementation using the field measurements. Section 4 presents the results: first a comparison of retrieved τaer values to co-located τaer measurements made by a sun photometer as well as in situ measurements of the aerosol optical depth. Then summary statistics of the ORACLES and CAMP2Ex campaigns are shown. Section 5 is a discussion of limitations and usefulness of the two new methods. Section 6 provides a brief summary of the paper.
The attenuated direct solar radiation in a layered model of the atmosphere is directly related to the layer optical depth by Beer's law:
where Fdir is the direct-beam irradiance, F0 is the incident irradiance at the top of the layer, μ is the air mass factor which we approximate as the cosine of the solar zenith angle (SZA), and τ is the layer optical depth. Inverting Eq. (1) is frequently invoked to derive optical depth from measurements of Fdir.
Conversely, the two-stream approximation of the radiative transfer equation can be used to relate the downwelling diffuse irradiance to the optical depth (Eq. 5.66, p. 263 in Bohren and Clothiaux, 2006):
where g is the asymmetry parameter of the single atmospheric layer (the mean cosine of the scattering angle, which in the context of the two-stream approximation is a parameter that describes the relative amounts of forward and backward scattering within a layer), and Fdif is the downwelling diffuse irradiance. It is important to note that Eq. (2) assumes no absorption, and the atmospheric layer is above a black surface. By solving Eq. (1) for F0, substituting this into Eq. (2), and consolidating all the irradiance terms to the left-hand side, we get an expression relating the diffuse ratio (DR) to optical depth:
In the thin-cloud limit
Eq. (3) simplifies to
and the dependence of DR on g is minimal. Crucially, Eqs. (3) and (5) are not dependent on F0, which allows for knowledge of τ to be obtained without information (or assumptions) of the irradiance incident upon the layer. These equations give us two relationships between observables, DR and Fdir, and optical depth. Equations (1) and (3) form the basis of the two retrieval methods: (1) using DR to derive τcld and (2) exploiting spectral features of Fdir to partition τ into τcld and τaer components.
2.1 Diffuse method, RD – τcld retrieval
Equation (3) directly links DR to optical depth for cases when the extinction of the layer is solely caused by scattering. Cloud particles have minimal absorption coefficients for light at visible wavelengths (Bohren and Huffman, 1998) and therefore a single-scattering albedo (SSA) near unity. Fine-mode aerosols are commonly absorbing, while coarse-mode aerosols, such as sea salt and dust, have similar scattering characteristics to clouds, both of which limit the application of RD to samples without aerosols (the implications aerosols have on RD are discussed in more detail in Sect. 5). Given these constraints, Eq. (3) can be solved to derive cloud optical depth. We apply this model specifically to retrieve cirrus cloud optical depth because, as we show in Sect. 2.3, DR is most sensitive to changes in τ when τ is small. At optical depths , DR asymptotes to unity, leaving little information on τ.
At smaller cloud optical depths, when a direct beam is still present (), DR is linked to the amount of forward scattering promoted by the cloud medium, and therefore a source of uncertainty in RD is incomplete knowledge of g (or the full scattering phase function). For cirrus clouds g typically ranges from 0.7 to 0.9 (Fu, 2007). Likewise, surface albedo, a, impacts DR through a process of multiple scattering of light between the surface and the cloud layer. Since the analytic solution in Eq. (3) does not account for the impact of surface albedo on DR we use a radiative transfer model (RTM) to accurately represent the sampled environment and implement the retrieval. In field settings, the flight-level a (afl) is directly inferred by ratioing downwelling and upwelling total irradiance measured by the SPN-S and the solar spectral flux radiometer (SSFR), respectively.
The retrieval steps of the RD method are simple.
-
Given a measurement of diffuse ratio, DRmea, we solve Eq. (5) to make an initial estimate of the cloud optical depth, τest.
-
Measured flight-level albedo (afl) and τest are used as inputs into the RTM to simulate a diffuse ratio, DRsim; g is set to 0.85 in the RTM.
-
DRsim and DRmea are compared:
- 3.1.
If the difference is greater than ±1 %, τest is adjusted by a small amount, , and step 2 is repeated.
- 3.2.
If the difference is less than ±1 %, τcld=τest.
- 3.1.
-
The τcld value has bias induced by the wide field of view (FOV) of the SPN-S, and this bias is corrected for in certain sampling settings. Details of the FOV correction are found in Sect. 3.2 and Appendix A.
The details and specifics of the measurements and RTM used in the diffuse method, RD, will be discussed in Sect. 3 of this paper.
2.2 Spectral direct-beam method, RS – τcld,τaer retrieval
The spectral direct-beam method, RS, leverages the differences in the spectral dependence of layer optical depth containing small (fine-mode) and large (coarse-mode) particles. Layers containing small particles, with sizes roughly that of the wavelength of visible light, have a strong wavelength dependence in optical depth. For fine-mode aerosols τaer,λ can be described by
where the lambda subscript of the τaer,λ term indicates a spectral dependence on the optical depth, τaer,0 is the optical depth at a reference wavelength λ0, and AE is the Ångström exponent (Ångström, 1929).
Larger particles, such as coarse-mode aerosol (e.g., sea salt or dust) and cloud hydrometeors, reside close to or in the geometric scattering regime at visible wavelengths and therefore have low AE values. This results in minimal wavelength dependence of τ of atmospheric layers containing these large particles (i.e., τ is largely spectrally flat in visible wavelengths). In an atmospheric system containing fine- but no coarse-mode aerosols, we expect the spectral total layer optical depth to be of the form
In practice we use Beer's law, Eq. (1), to determine τλ, where this spectral optical depth is also represented by the summation of all atmospheric constituents with non-zero optical depth:
where τRay,λ is the spectral optical depth from Rayleigh scattering, and τmol,λ is a term encompassing non-Rayleigh extinction from trace gas molecular and water vapor absorption sources. In the wavelength range used in this analysis there is optical depth from trace gases and water vapor, but rather than measure or calculate the τmol,λ term, we select wavelengths that minimize its value. Further, we apply a correction to the derived τλ based on measured values of τλ from above the aerosol layer (see Sect. 3.5.2). That is, we are calculating a layer aerosol optical depth, and in doing so we account for much of the influence of τmol,λ on τλ. Future work may want to treat the τmol,λ term with more detail, which would possibly allow for column and not layer τaer,λ to be retrieved. Then if wavelengths are selected that minimize τmol,λ, τλ is dependent on τcld, τaer,λ, and τRay,λ; τRay,λ can be solved for empirically and is a function of the pressure differential across the observed layer:
where ΔP is the pressure differential across the layer in millibars, , c2=1.0455996, c3=341.29061 µm−2, µm−2, µm−2, and c6=85.968563 µm−2 (Bodhaine et al., 1999). Using Eq. (9) to calculate and account for the τRay,λ term in Eq. (8), the spectral shape of the layer optical depth dictated by Eq. (7) can be described in terms of τcld and τaer,λ. An example of this is illustrated in Fig. 1 for simulated optical depths (RTM configuration is given in Sect. 3.3) for a case with a cloud only (blue lines) and cloud with aerosol (red lines). A set of selected retrieval wavelengths, designated by the yellow shading, represents regions of the spectrum where τmol is minimal (additionally the shaded regions correspond with usable channels from the SPN-S; more in Sect. 3). For the aerosol-free case within the selected wavelength region, the τλ profile, which accounts for the τRay term (dashed blue line), falls nearly along a flat line of the simulated cloud optical depth value of τcld=0.20. When fine-mode aerosols are present, τλ is curved in the form of Eq. (7) and asymptotes to a value of τcld=0.20 at longer wavelengths. The aerosol optical depth is simply the difference in the layer and cloud optical depths at 500 nm: .
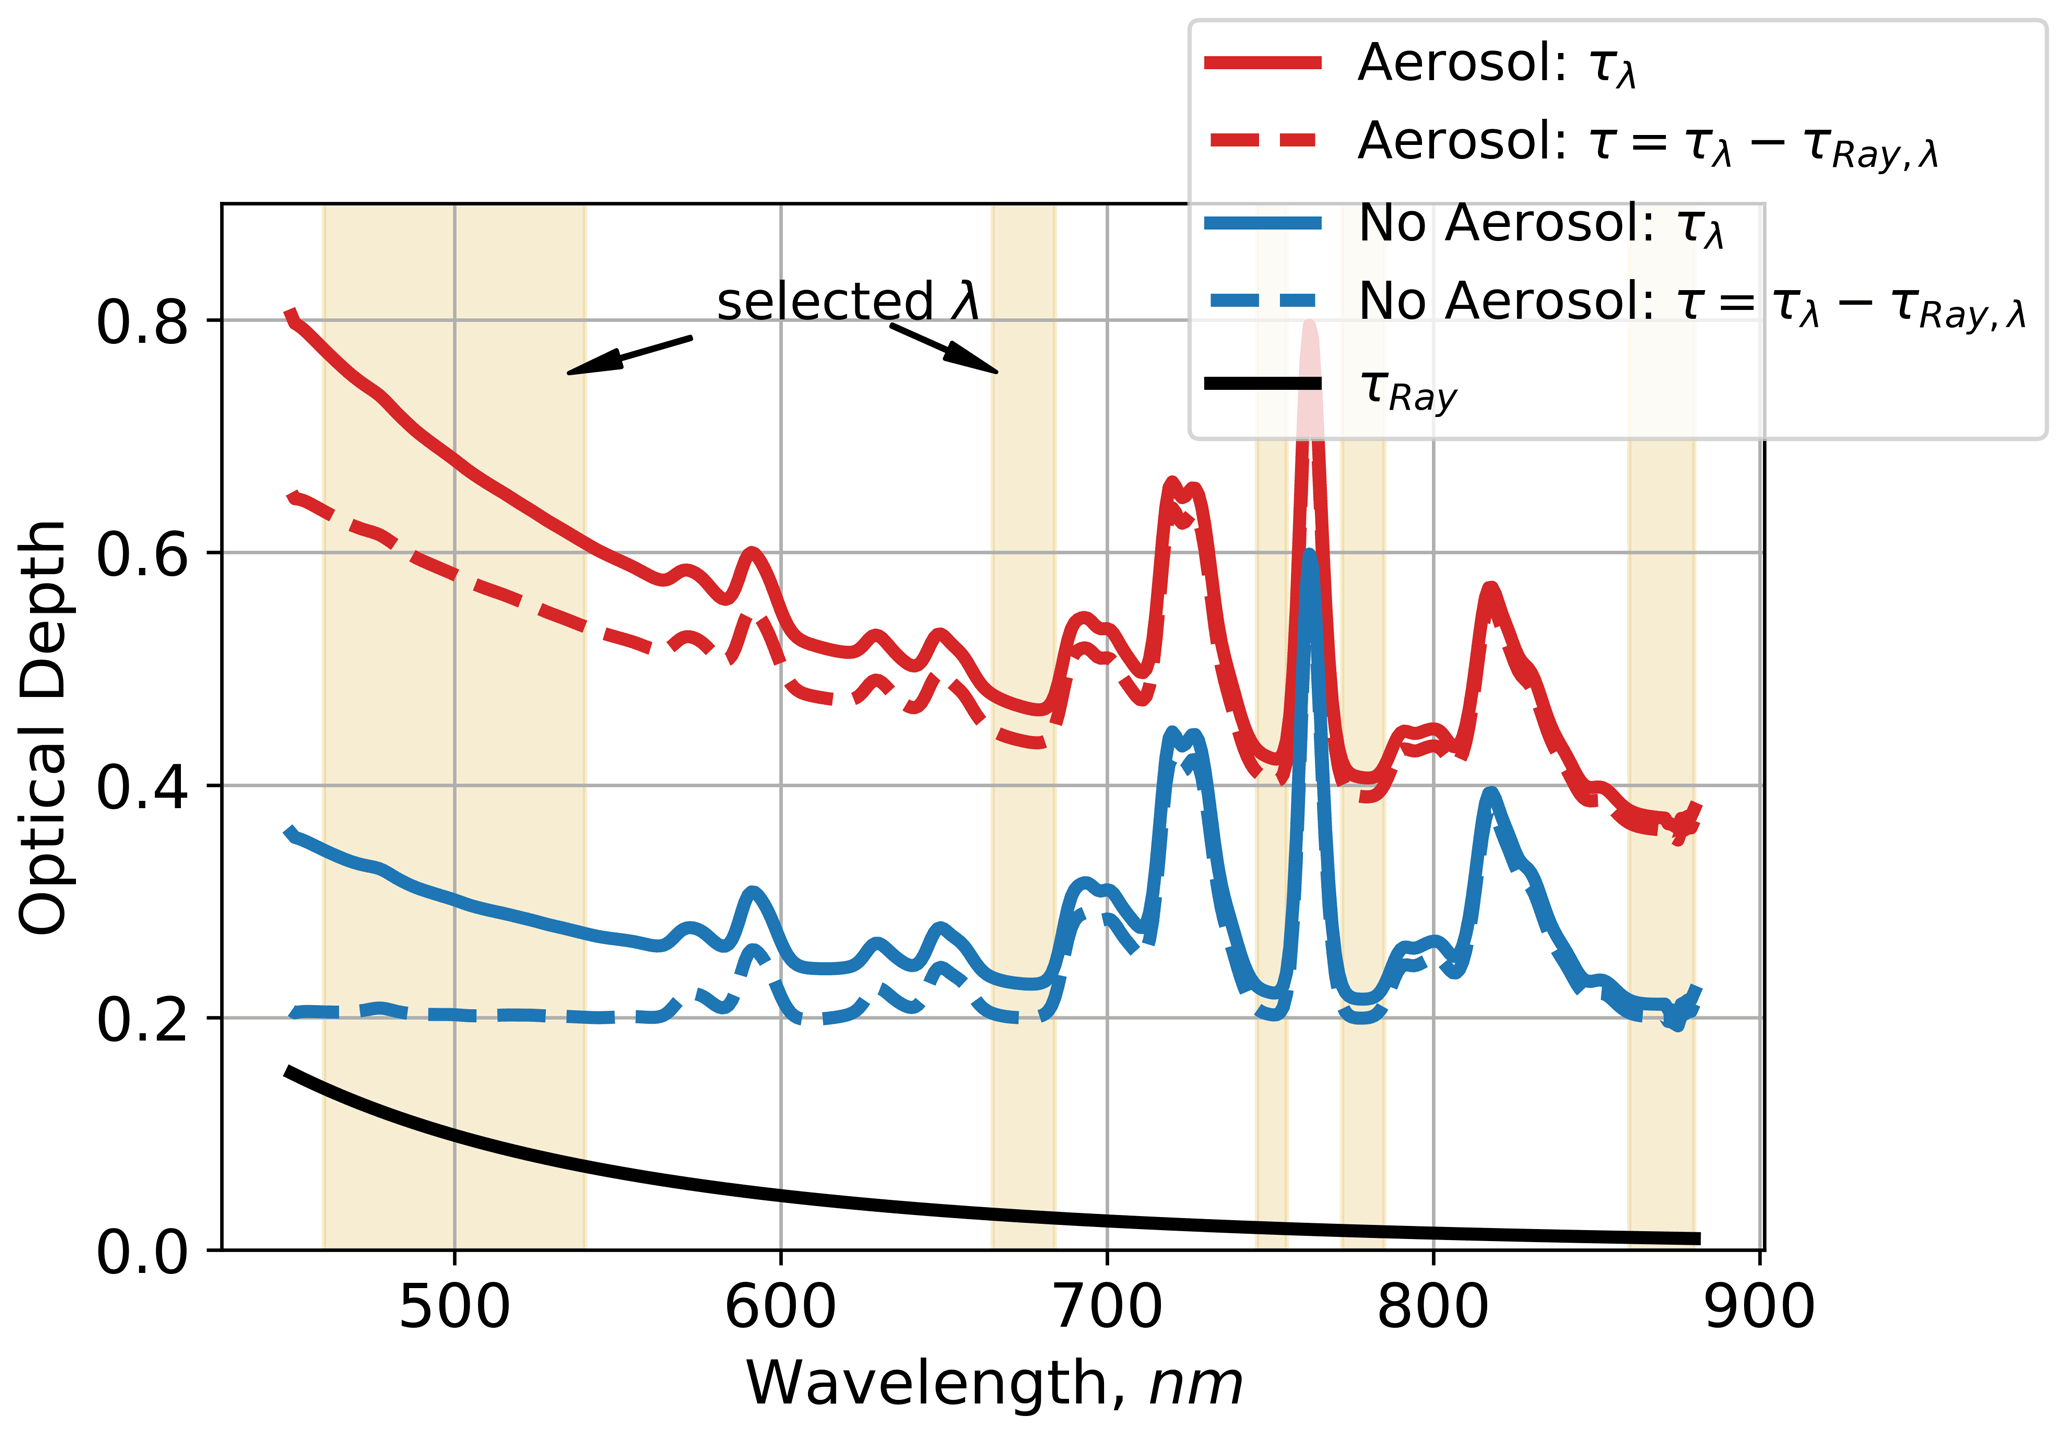
Figure 1Simulated spectral τλ for two cases. Cloud only (τcld=0.20, τaer,500 nm=0.00) is denoted by the blue lines, and a case with cloud and aerosols (τcld=0.20, τaer,500 nm=0.38) is shown by the red lines. The solid black line is calculated τRay,λ. Subtracting τRay,λ from τλ yields the dashed red and blue lines, which are represented by Eq. (7). The shaded yellow regions are the wavelengths selected for use in RS. For the aerosol-free case, the layer optical depth is spectrally flat at the value of τcld.
In practice RS is implemented as follows:
-
Spectral measurements of direct irradiance, Fdir, are used to determine τmea,λ using Beer's law (Eq. 1).
-
Wavelengths in window channels are selected that minimize the τmol,λ term in Eq. (8).
-
τmea,λ is characterized above the aerosol layer and used to correct all profile samples of τmea,λ for the influence of τmol,λ.
-
τRay,λ is calculated from Eq. (9) and then subtracted from the corrected τmea,λ.
-
A set of calculated layer optical thicknesses, τcalc,λ, are found using Eq. (7) for a range of τcld, τaer,0, and AE values.
-
The root mean square error (RMSE) is found for each combination of τcalc,λ and τmea,λ profiles. The retrieval outputs – τcld, τaer, and AE – are the values corresponding to the τcalc,λ with the lowest RMSE.
-
A field-of-view correction is applied to the τcld retrieval output (see Sect. 3.2 and Appendix A).
2.3 RD and RS comparison and use selection consideration
Without knowledge of the output uncertainties in the two methods, the separation of the aerosol from the cloud radiative signal makes RS the more capable of the two retrieval methods. However, RS is based on measuring Fdir, which is a measurement that is susceptible to significant errors when made from airborne platforms. For the SPN-S, the main error sources of the irradiance measurements are the result of improper radiometric calibration, the sensor cosine response, and errors associated with the attitude of the sensor relative to the horizon. RD has the advantage of being derived from the ratio of two irradiances simultaneously measured by the same instrument. In the case of the SPN-S, the diffuse and total irradiance measurements are made by the same sensor, which allows us to assume that the radiometric uncertainties in Fdif and Ftot are correlated, and therefore the uncertainty in DRmea is a function of the instrument precision and not the accuracy. Further, DR is minimally affected by sensor attitude errors because the Fdir term is in the denominator. However, there are additional sources of measurement uncertainty related to the SPN-S system that are important to consider, such as internal reflections caused by the shadow mask that can lead to bias in the measured diffuse irradiance. Internal reflections are a problem inherent to total-diffuse radiometer systems reliant on shadow mask (and shadow band) designs, and a detailed discussion of how these and related issues have been addressed for the SPN-S is given in Badosa et al. (2014). For the SPN-S irradiance measurements we estimate that a 4 %–6 % accuracy uncertainty results from the lamp calibration process, and up to another 2 % uncertainty stems from imperfect knowledge of the cosine response of the sensor. For the sake of this analysis, we use uncertainty values of 7 % accuracy and 0.5 % for precision (Wood et al., 2017). There are additional sources of error (e.g., changes in sensor attitude) that will be addressed in the following sections.
The performance of both retrieval methods is gauged considering the uncertainty in the inputs. First, we evaluate Eqs. (1) and (3) for a range of τ values. Figure 2 shows the profile of the direct transmittance, (green line), given a 7.0 % uncertainty in Fdir. At high values of Tdirect (low τ), the measurement uncertainty is a significant proportion of the signal, leading to substantial ambiguity in the associated value of τ. As optical depths increase, Tdirect falls off exponentially at the same rate as its error, meaning the absolute error in τ is constant, and hence the fractional error decreases as the cloud layer thickens. For RD the uncertainty in DR is minimal, and so for a known value of g the retrieved τ has little ambiguity until the DR signal starts to asymptote to unity at values . However, the uncertainty in the value of g is a main source of error when determining τ at low optical depths. The pink and purple lines are DR profiles for g ranging from 0.5–1.0. At low values of DR, when scattering is minimal, the uncertainty in g leads to relatively little ambiguity in the value of τ (i.e., g is not represented in Eq. 5). As the cloud optical depth increases, greater amounts of scattering occur, and the importance of g in DR becomes more pronounced, leading to poorer retrieval performance. Fortunately, the two methods for deriving τ are complementary; RD has lower uncertainty in retrieving thin-cloud τ, whereas the use of RS is justified as τ becomes larger. This threshold at which the output uncertainty in RS falls below RD is approximately when τ∼1, though this level is dependent on how well g is constrained and the level of uncertainty in the inputs. Both methods lose utility as τ becomes large, and the light becomes completely diffuse.

Figure 2Solutions given the direct transmittance using Beer's law (Eq. 1) and the diffuse ratio (Eq. 3) for given layer optical depths. Shown are uncertainties in optical depth for irradiances associated with layer optical depths of 0.2, 1.0, and 3.0. Uncertainty in Fdir is 7.0 %, and uncertainty in DR is 0.5 %.
To further address the question of retrieval performance, we test the explicit retrieval methods used in this study (outlined in Sects. 3.4) on model-generated irradiance data. To do this we simulated a set of spectral irradiances using an RTM (see Sect. 3.3) for values of τcld ranging from 0 to 6. The cloud optical properties in the simulations were generated using the “hey” ice cloud parameterizations that are a part of the public libRadtran package (Yang et al., 2013; Emde et al., 2016). For this example, a cloud comprised of smooth solid-column ice crystals with an effective radius of 20 µm was inserted in the atmosphere with a base height of 10 km, and we set a=0.15. In practice, we directly infer a using SPN-S and SSFR measurements, so in this exercise we do not investigate the influence of albedo on the retrieval error. The DR profiles are calculated at three values of g: 0.70, 0.85, and 0.95. The simulated inputs, Fdir for RS and DR for RD, are then injected into both retrieval structures, and the outputs are compared to the true values of τcld – the values of τcld set in the RTM simulations.
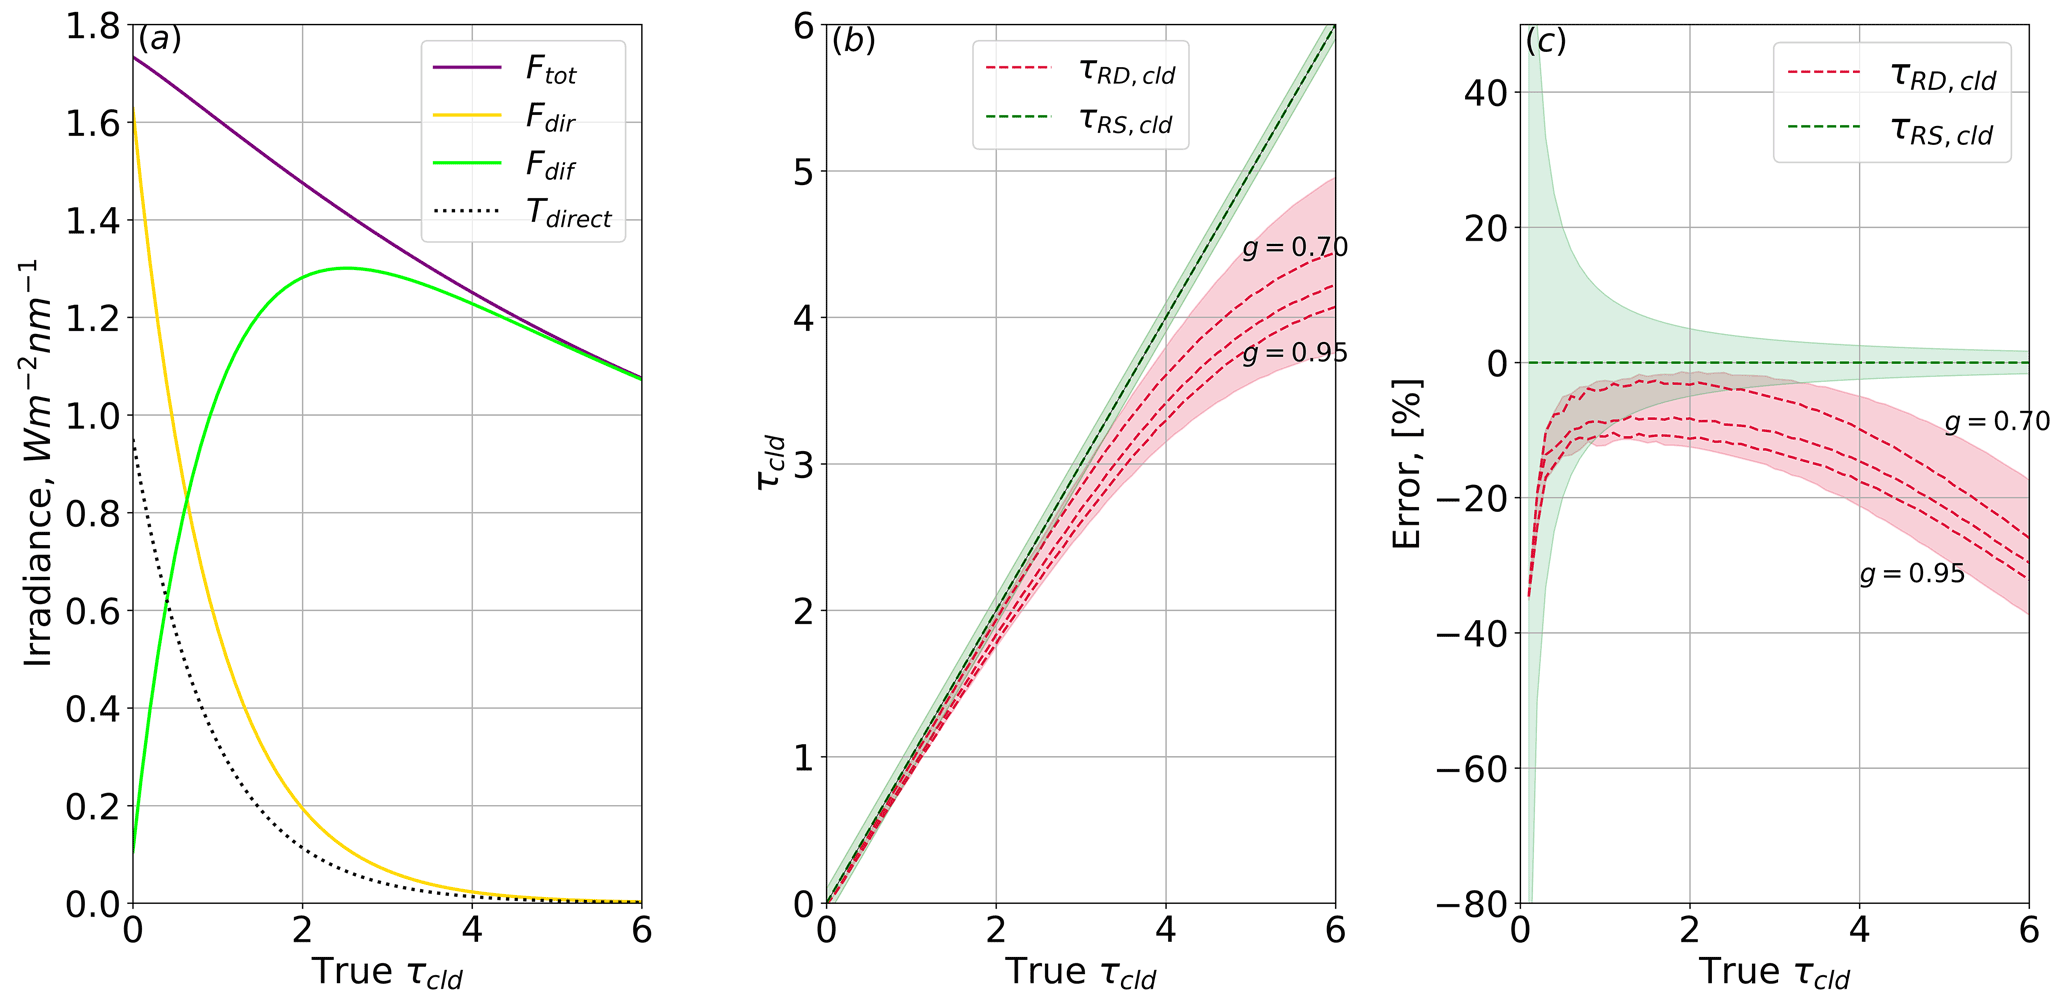
Figure 3(a) Simulated 500 nm irradiances at 4 km altitude, with an ice cloud situated at 10 km. Solar zenith angle is 20∘; ice crystal effective radius is 20 µm. (b) Retrieval outputs with the simulated irradiances used as inputs. Error in Fdir is 7.0 %; error in DR is 0.5 %. The uncertainty in retrieval output is represented by the shading. For RD, this uncertainty also reflects g values of 0.70, 0.85, and 0.95. (c) Percent error in the two retrieval methods when compared to the true cloud optical depth.
Figure 3 shows the results of this experiment. The left panel is the simulated 500 nm downwelling irradiances. The middle panel shows the retrieved values of τcld plotted against the true τcld, and the right panel is the error in retrieved τcld value as a function of true τcld. The results support the analysis of the analytic functions presented in Fig. 2: when the output of the RD method has less uncertainty in the retrieved optical depth, making it the superior method. When τcld is greater than unity, there is less uncertainty associated with the retrieved optical depth from the RS method. It is critical to note that this analysis of cloud simulations assumes an absence of aerosols. If absorbing aerosols are present, knowledge of SSA and g is needed to accurately use RD to retrieve optical depth.
Another limitation that is worth mentioning is that the output of RD falls below the identity line because of the difference in the scattering phase functions used in the simulated data and the DR calculations in the retrieval. In RD, the phase function is approximated using the Henyey–Greenstein phase function for a given value of g, while the simulated data use full phase functions for cloud layers containing solid-column ice crystal habit from the libRadtran library. We use Henyey–Greenstein in the retrieval to make it more broadly applicable to various atmospheric conditions and to avoid making assumptions about the cloud microphysics.
This section details the data sources used in the retrievals and in validation of their outputs. Additionally, the RTM used throughout this study is described. This is followed by a detailed explanation of the procedures used to implement RS and RD with the field data.
3.1 ORACLES and CAMP2Ex campaigns
The data used in this study come from two independent field campaigns that occurred in climatically different tropical to subtropical regions of the globe. Both campaigns used the National Aeronautics and Space Administration's (NASA) P-3 aircraft equipped with a set of radiometric and in situ scientific instruments, with the goal of addressing questions surrounding cloud and aerosol impacts on atmospheric state. Specifically, ORACLES was a three-part mission focused on studying the radiative effects of biomass-burning-generated aerosols present above clouds. Sampling of the aerosol plume was done over the eastern Atlantic Ocean after it had advected off the west coast of the African continent. The experiment environment at ORACLES was stratified, with a persistent aerosol layer sitting below clear skies (i.e., minimal cirrus clouds). A stratus cloud layer of varying cloud fraction was often found below or at the bottom of the aerosol layer. While cirrus did tend to occur in the sampling region, flight planning was done to avoid their presence. This environment allowed for measurements of aerosol properties to be made with minimal influence from surrounding clouds outside of the impact the low cloud layer had on albedo. The science flights took place in August–October of 2016–2018. The SPN-S was only developed in time for operation during the 2018 deployment of the ORACLES mission. A complete overview of the ORACLES campaign is given by Redemann et al. (2021).
In contrast, CAMP2Ex took place from late August through early October of 2019 in the maritime environments surrounding the island of Luzon, Philippines. This location was selected because polluted air masses from Borneo and Sumatra could be characterized as they are transported through the South China Sea and Sulu Sea into the western Pacific by the Maritime Continent's southwest monsoon flow. Sampling took place in several different air masses, which had variability in the aerosol source: local sources from industrial activity on Luzon (especially from Manila) and tanker ships to biomass burning aerosols transported from Borneo and long-range transport of aerosols from the Asian continent. Given the nature of the southwest monsoon, the cloud environment was highly dynamic, with cumulus clouds and convective cells of varying degrees of maturity present during all flight days. Unlike with ORACLES, where cirrus could be avoided, during CAMP2Ex regional deep convection led to ubiquitous cirrus. It is this high prevalence of the cirrus clouds during the mission which provided much of the motivation for developing the spectral approaches for determining τcld and τaer. CAMP2Ex also sampled for 10 d after the monsoon transition, leading to lower cirrus optical depths and sampling of the heavily polluted Asian air masses. For an overview of the CAMP2Ex mission, refer to Reid et al. (2022).
Regarding the sampling methods, note that during both campaigns we employed a “square-spiral” sampling technique to profile layers of the atmosphere up to two times per science flight. This is where the P-3 aircraft descends through the atmosphere, from high-altitude flight to near-surface, by making a box pattern. The box pattern consists of four legs of descent, with wings held level (i.e., pitch and roll kept as close to 0∘ as possible), connected by 90∘ descending turns that are banked. The goal is to minimize the influence aircraft attitude has on the radiometer's position relative to the horizon, thereby reducing the magnitude of the attitude correction that is needed in post-processing of the radiometric data. In comparison to a series of traditional flat “radiation legs”, the “square-spiral” method allows for relatively rapid profiling of the atmosphere, which is useful in dynamic environments such as the ones encountered in CAMP2Ex. At CAMP2Ex near-surface clouds were encountered in most spirals, and so for this study we restricted spiral profiles to altitudes greater than 0.4 km. At ORACLES the stratus deck was mostly found below 1 km, and we limit sampling to above this altitude.
3.2 SPN-S irradiances and retrieval input data
The SPN-S is a modified version of the commercially available broadband SPN1 pyranometer. Instead of the detector head directing the sampled light to a set of seven thermopiles, this spectral version uses a seven-spectrometer array to measure irradiance from 350 to 1000 nm at 1 nm spectral resolution and 1 Hz temporal resolution. Detailed characterization of SPN1 and how the measurements of total and diffuse irradiance are made is described in Badosa et al. (2014). The version of the SPN-S used in this study is most similar to the Spectrometer 1 system described in Wood et al. (2017), with modifications done to the instrument chassis to allow it to be mounted on top of the P-3 fuselage. We follow the procedure laid out in Wood et al. (2017) for deriving the spectral direct irradiance from the measurements of total and diffuse irradiance.
Our procedure for calibration and attitude correction deviates from the methods described in Wood et al. (2017). The SPN-S was calibrated against a tungsten “FEL” lamp that is traceable to a National Institute of Standards and Technology (NIST) standard. The power of the FEL lamp is significantly lower than the power of the solar radiation at the sampling sites, and this led to issues with measuring irradiances at the shorter and longer wavelengths of the SPN-S's capabilities. For our analysis we only use sampled radiation from 460 to 900 nm due to these calibration constraints.
The direct-beam and total irradiances were corrected for the pitch and roll of the aircraft in accordance with the attitude correction method outlined in Long et al. (2010). Due to time limitations of the P-3 aircraft and cloud cover constraints, we could not fly the recommended “box” and “diagonal” patterns needed to determine pitch and roll offset angles of the mounted SPN-S. Rather, we manually went through all the flight data from the ORACLES campaign, identified heading changes in the aircraft that occurred under clear-sky conditions (DR500 nm<0.1), and used the collective set of these heading changes as a substitute for the “box” and “diagonal” patterns in the Long et al. (2010) method. Since the SPN-S was mounted on the P-3 in the same configuration for the CAMP2Ex mission as it was during ORACLES, we assume the offset angles are constant across the two missions. To minimize the impact aircraft attitude has on the direct irradiance measurements we restrict our analysis to when both aircraft pitch and roll were within .
To measure diffuse irradiance, the SPN-S uses a shadow mask to block the direct beam of the sun. The field of view (FOV) blocked by the sun is an area larger than the solar disk, and this wide FOV leads to understatement of the diffuse irradiance under sky conditions where there is a significant amount of light scattered in the direction of the direct beam (conversely, direct transmittance is overstated). This is similar to FOV issues encountered by sun photometer systems (Segal-Rosenheimer et al., 2013). Thin cirrus cloud layers are associated with strong forward scattering, and the induced bias in the measured irradiances will cause underestimation of τcld by both the RD and RS methods. We correct the τcld outputs of both retrievals for errors associated with the FOV of the SPN-S. This correction is done by developing an empirical relationship from radiance simulations that associates the magnitude of the irradiance bias induced by the FOV error to the true τcld; the details of the correction are explained in Appendix A.
RD requires measurements of afl, which is derived from flux measurements made by two sensors. The spectral total upwelling irradiance, Fup, is measured by a nadir-mounted solar spectral flux radiometer (SSFR; Pilewskie et al., 2003). The SSFR is a moderate-resolution total irradiance spectrometer system with a spectral range of 350–2100 nm. Like the SPN-S, the SSFR is radiometrically calibrated against a NIST-traceable lamp standard before and after each field campaign. Throughout the duration of each campaign, a series of field calibrations were used to monitor and correct for variations in the primary radiometric calibration. Since the upwelling irradiance is diffuse, the signal is only minorly impacted by the angular response of the SSFR light collector. A spectrally dependent factor that accounts for the angular response of the SSFR light collector to diffuse irradiance is determined through laboratory investigation. This factor has a value near unity, and it is used to correct the upwelling irradiance measurements to account for this angular dependence of the measured signal; afl is then determined by ratioing Fup to Ftot, the latter of which is measured by the SPN-S.
Altitude, pressure, sun position, and navigation data are measured at 1 Hz aboard the P-3 as described in Bennett (2020).
3.3 Radiative transfer model
The simulated DR values used in RD are made using the Discrete Ordinates Radiative Transfer Program (DISORT) 2.0 (Stamnes et al., 2000). We use the libRadtran library version 2.0.1 to configure and run DISORT 2.0 (Emde et al., 2016), with the base configuration set as follows.
-
Molecular absorption is done using LOWTRAN 7 (Pierluissi and Pang, 1985).
-
Pressure, temperature, and gas mixing ratio profiles – including ozone and water vapor – are set using the tropical atmosphere profile from Anderson et al. (1986).
-
The solar source is defined using 1 nm resolution top-of-atmosphere flux from Kurucz (1994).
-
A slit function with a 6 nm full width at half maximum is used on the output of spectral calculations.
-
Solar zenith angle and model output elevation were set to values corresponding to P-3 position and time of day.
-
Flight-level spectral albedo, afl, is determined from the SPN-S and SSFR irradiance measurements.
We simulated cirrus clouds by modifying the standard aerosol configuration in libRadtran, which generates scattering phase functions from Henyey–Greenstein. A cloud layer was inserted between 10–11 km, and then we adjusted the layer optical depth to the appropriate τcld. In this configuration, SSA was set to 1, and g=0.85 was used as a baseline value of the asymmetry parameter. All other simulated irradiances mentioned in the paper (e.g., Fig. 1) used a similar model configuration with deviations noted in the text.
3.4 Validation data
The Spectrometer for Sky-Scanning Sun-Tracking Atmospheric Research (4STAR; Dunagan et al., 2013) is an airborne sun photometer that makes direct-beam measurements of τaer above the aircraft using spectrometers (similar to the SSFR) spanning 350 to 1650 nm, with τaer reported at 24 wavelengths outside of gas absorption bands. Before and after each field deployment, 4STAR is calibrated at the Mauna Loa Observatory using Langley extrapolation methods. Additionally, in-flight high-altitude calibration measurements are used as a calibration verification and adjustment throughout deployment (LeBlanc et al., 2020). The resulting uncertainty in 4STAR-measured τaer is as low as 0.007 at the 501 nm channel.
4STAR operated only during the ORACLES campaign so we also compared the derived τaer values from the retrievals against in situ measurements of optical extinction (τin situ). For CAMP2Ex, total dry aerosol scattering was measured in situ by a TSI-3563 nephelometer at relative humidity (RH) less than 40 %. To account for aerosol humidification, a parallel TSI-3563 nephelometer was operated at an RH of 82 %±10 % and was used to derive the scattering hygroscopicity factor (i.e., f(RH); Ziemba et al., 2013). Scattering coefficients for each measured wavelength (i.e., 450, 550, and 700 nm) at ambient RH are then calculated using dry scattering coefficients, f(RH), and ambient RH by the diode laser hygrometer (DHL; Diskin et al., 2002). Optical absorption coefficients were measured by a Radiance Research three-wavelength particle soot absorption photometer (PSAP) at 430, 532, and 660 nm, with the sample dried by heating the air to 40 ∘C. To develop altitude profiles of τin situ, ambient extinction coefficients are computed as the sum of dry absorption coefficient and ambient scattering coefficient after correcting both to 500 nm wavelength using measured scattering and absorption Ångström exponents and Eq. (6). The estimated uncertainties for the scattering and absorption coefficients are 30 % and 15 %, respectively. For the square spiral maneuvers performed by the P-3, this total ambient extinction was integrated with respect to altitude to generate a τin situ profile. Before integrating, 10 s averaging was applied to the time series to reduce the influence of noise artifacts on the profile. At ORACLES, TSI-3563 nephelometers and a Radiance Research PSAP were also flown, and measurements were processed in the same fashion as those from CAMP2Ex, with the caveat that a pair of Radiance Research M100 nephelometers were humidity-controlled and used to determine ambient scattering at 540 nm and f(RH). At ORACLES, the Radiance Research M100 nephelometer data were used to derive ambient extinction at times when the ambient TSI-3563 nephelometer was not operational. All in situ measurements on the P-3 aircraft for both CAMP2Ex and ORACLES were made behind an isokinetic shrouded solid-diffuser inlet (McNaughton et al., 2007) and are reported at ambient temperature and pressure.
3.5 Retrieval implementation
3.5.1 Diffuse method, RD
Implementation of RD is straightforward, and we followed the steps outlined in Sect. 2.1 of this paper. For the 500 nm SPN-S channel, DRmea is calculated directly from the measured Fdif and Ftot. The estimate of the optical depth, τest, is made from DRmea using Eq. (5); τest is input into the RTM along with afl to obtain a simulated value of DRsim. If , the τest is the reported τcld value of the retrieval. If , τest is increased by a value of 0.01, and if , τest is decreased by a value of 0.01. The RTM is run again, and the new DRsim is compared to DRmea. The process iterates until the condition is met.
We ran RD at three wavelengths to obtain τcld at 500, 670, and 870 nm. Since cirrus clouds are made of ice crystals, we assume the layer AE≈0 and therefore the τcld at the three wavelengths should be similar if only clouds are present. Significant spectral variation in τcld – >5 % deviation from the 500 nm retrieval to the 870 nm value – indicates that aerosols are present in the sampling layer. In such a case, careful interpretation of the retrieval output is advised.
3.5.2 Spectral direct-beam method, RS
The first step in implementing RS is to use Eq. (1) to derive the spectrally dependent total measured optical depth above the aircraft, τtot,λ. The μ term in Eq. (1) is calculated from the reported solar zenith angles logged in the P-3 flight records. F0 in this calculation is determined using RTM simulations of Fdir at 14 km, which is an altitude above the cirrus cloud layer. This is done for all Fdir measurements contained within a square spiral where the 500 nm DRmea<0.95, which generally corresponds to τ∼3 (see Fig. 2). This threshold on the diffuse ratio is used to ensure that there is measurable direct-beam signal, and above this level, measurement uncertainty in Fdir makes it untenable to use RS. Using the atmospheric pressure measurements made from the P-3, τRay,λ is calculated by Eq. (9), and then these values are subtracted from τtot,λ:
We do this for a limited set of the SPN-S wavelengths, λretrieval={(460–540), (665–684), (746–755), (772–785), (860–879)} nm. The wavelengths used in the retrieval were determined by studying simulated spectra of optical depths, such as those in Fig. 1, and then selecting spectral regions where there is minimal influence of molecular absorption. The presence of some extinction by trace gases is acceptable at the selected wavelengths because we correct the τλ spectra for these influences using aerosol-free samples from the top of the spiral (see the following paragraphs for details of this step). This correction does not account for changes in column trace gas concentrations as the aerosol layer is profiled, which is a limitation of this method. Our analysis was bounded between 460 and 880 nm due to the SPN-S calibration issue described in Sect. 3.2.
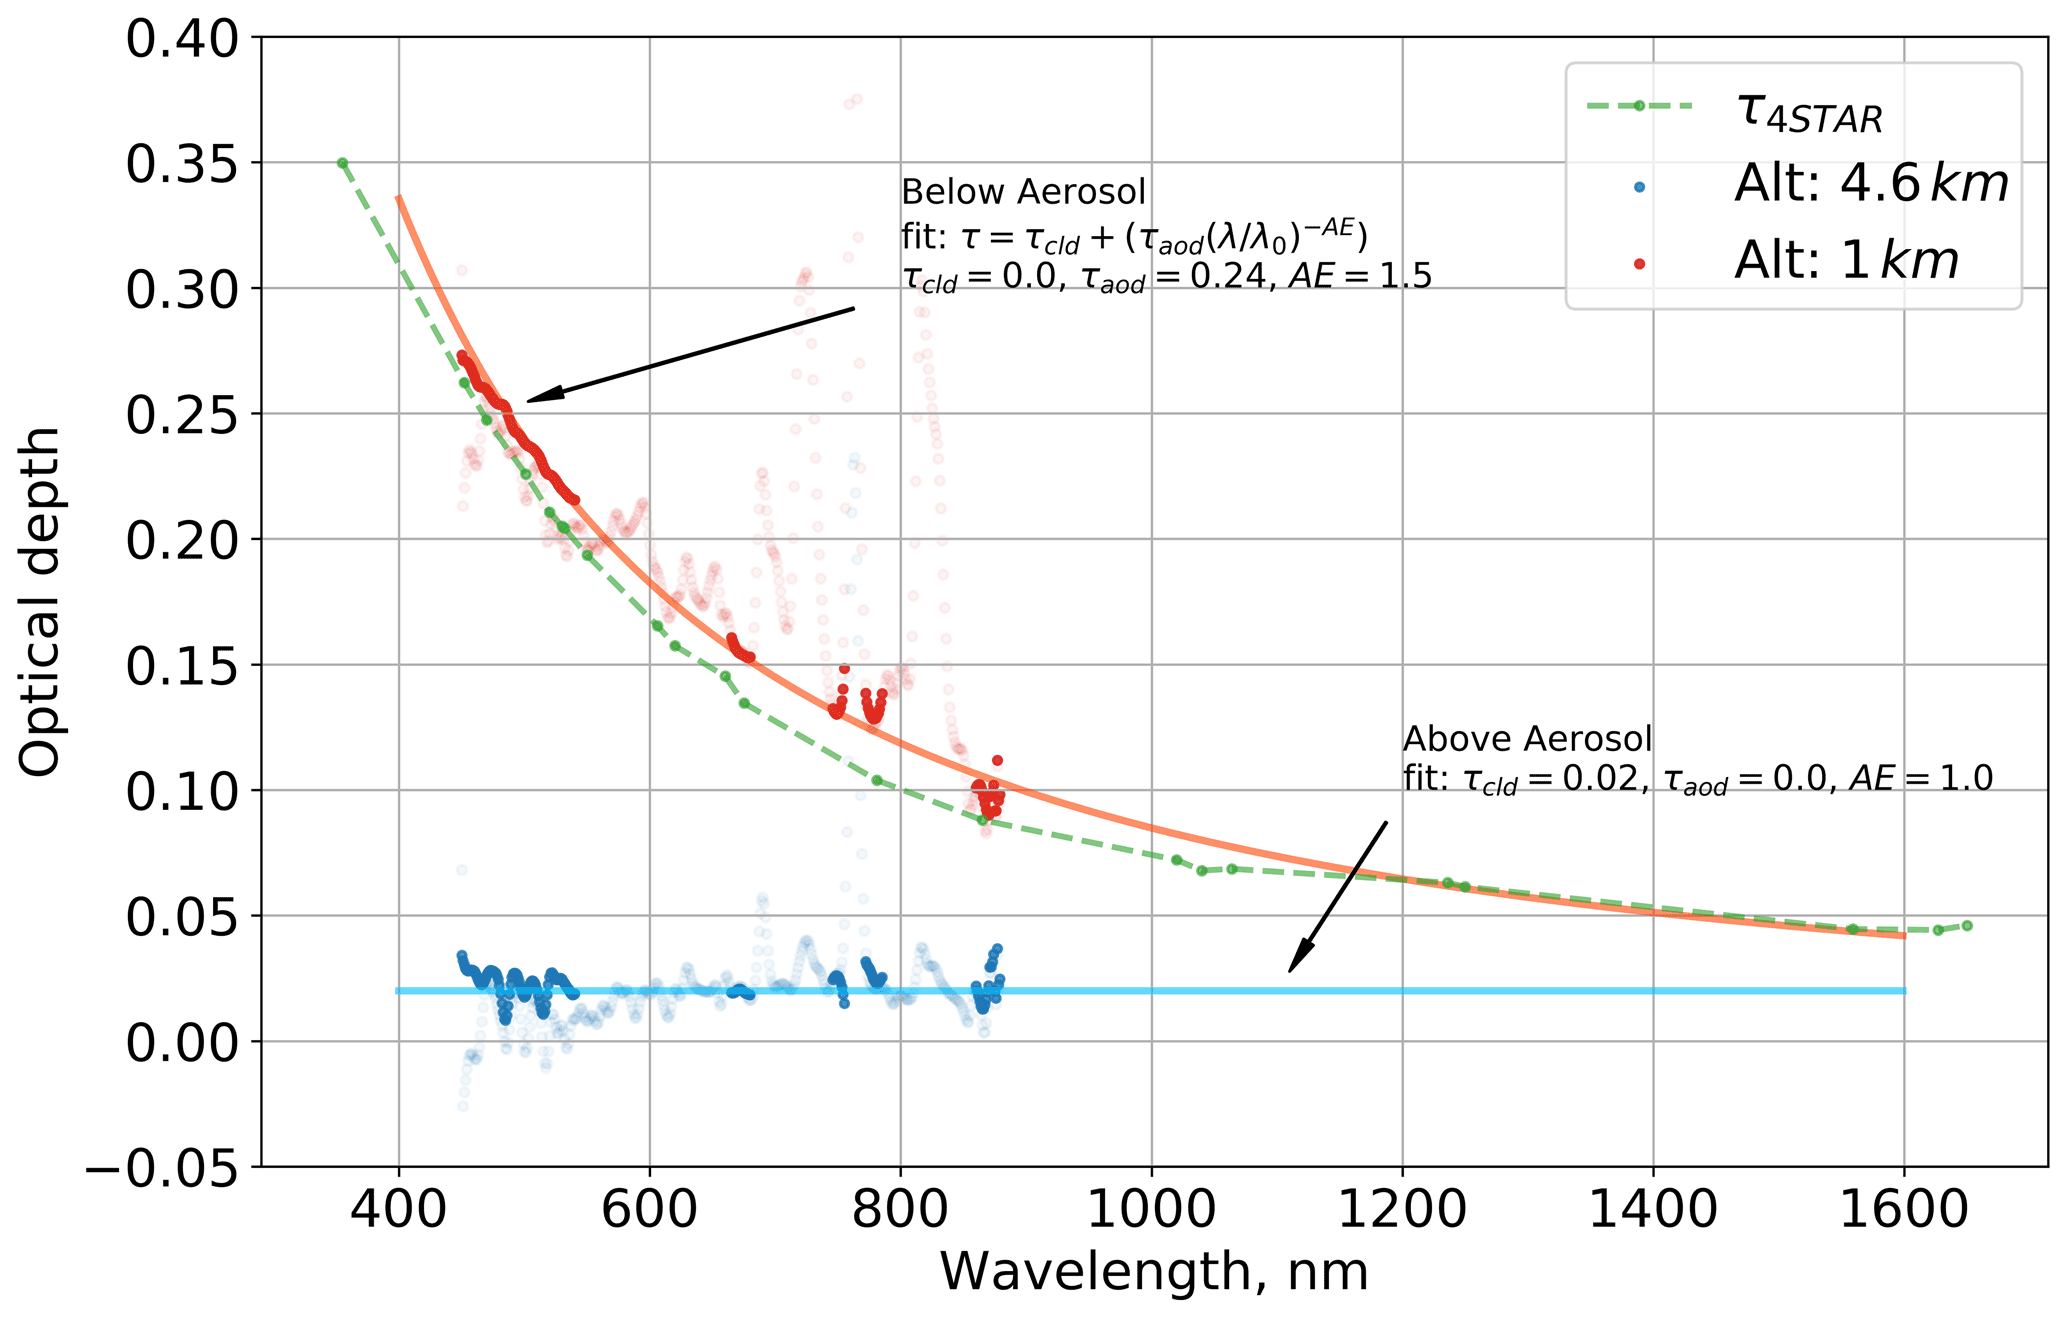
Figure 4Two examples of the spectral optical depth used in RS to determine τcld and τaer. Both examples are from the spiral on 5 October 2018 of the ORACLES mission. (1) A clear-sky case, colored in blue, from a sample taken at an altitude 4.6 km. (2) In red, a sample from 1 km, which is below the aerosol layer. The dark red and blue dots are τadj,λ, and they correspond to the dashed red and blue lines in Fig. 1. The faded red and blue dots are values from all SPN-S channels from 460 to 880 nm, including those not used in the retrieval. The blue and red lines represent the best-fit lines for the RS outputs. The green line is τ4STAR as measured at 1 km altitude.
The determination of F0, the presence of trace gases, and calibration inconsistencies with the prototype SPN-S system led to complexities in implementing RS. Flight-to-flight changes in atmospheric conditions and the SPN-S calibration caused the derived τλ profiles to have a spurious spectral shape, deviating from flat under clear-sky or cloud-only conditions (the faint blue dots in Fig. 4 are a good example of errors in τλ). These errors had a constant magnitude within a flight and were not proportional to signal magnitude. Issues related to the dark-current correction may have been responsible for some of the observed behavior, though we are unsure. Additionally, the use of the RTM to derive F0, which is traceable to the solar spectrum defined by Kurucz (1994), is a source of error in optical depth calculations. Nonetheless, we were able to account for these errors by using τλ samples from high-altitude flights to adjust the measured optical depth profiles. To do this, spectral profiles of τλ from aerosol-free regions of the tops of the P-3 spirals were collected. The spiral tops are assumed to be aerosol-free, and this assumption is checked by manually observing if the 4STAR aerosol optical depth (τ4STAR) is <0.05 or for the CAMP2Ex case if the integrated in situ extinction (τin situ) has a significant gradient in this region of the spiral profile. Spirals with tops that are within the aerosol layer were excluded from the study. The spectral optical depth correction, τcrr,λ, is the mean optical depth that each channel is from a reference channel at 500 nm for the selected spiral top τλ spectra:
The optical depth correction is applied to all τλ by subtraction:
Applying this correction is beneficial since Eq. (7) assumes τλ has a smooth exponential shape, and correcting τλ to a line allows for better representation of the data by the model. Due to this need to correct τλ, we restrict use of RS to square spiral samples and do not use it for time series analysis of full science flights. In a sense, we are deriving layer optical depth with RS, and the spiral tops are used to characterize the flux at the top of the layer, and deviations at lower altitude are accounted for by the τaer term. RD in comparison is temporally and spatially independent from itself and can be used at any point along the flight track when DR is sufficiently small; more details about the utility of both methods are discussed in Sect. 5. Further, scattering by low- and mid-altitude clouds can interfere with interpretation of Fdir, and therefore spirals with significant numbers of these clouds were excluded from this study (e.g., if the P-3 entered a cloud during the spiral, the spiral was not analyzed).
Each corrected optical depth profile, τadj,λ, is compared to a series of curves generated using Eq. (7) for defined sets of τcld, τaer, and AE; τcld is varied from 0 to 5 at 0.01 resolution, τaer is varied from 0 to 1.5 with 0.01 resolution, and AE ranged from 1 to 2.0 with 0.1 resolution. The RMSE between each curve and the τadj,λ sample is computed. The fit parameters – τcld, τaer, AE – corresponding to the curve with the lowest RMSE value are designated the outputs of the retrieval. Figure 4 shows two examples of RS for a clear-sky case (blue line) and a case within an aerosol layer (red line). The solid filled dots represent τadj,λ, and the impact of τcrr,λ is noticeable when comparing to the faded dots, which are the uncorrected optical depth profiles, τλ. The solid lines represent Eq. (7) with the fit parameters set to the retrieval output in these two cases.
We first present the results of the ORACLES campaign followed by the CAMP2Ex results. For each campaign we first show the retrieval performance for a one-square-spiral case study, and then we give the aggregate statistics for the campaign.
4.1 ORACLES 5 October 2018 profile
Between 09:52:00 and 10:15:00 UTC, the P-3 flew a square spiral centered around a latitude and longitude of , , with a spiral midpoint SZA of 22.8∘. The profile started at an altitude of 5.74 km and ended near the surface at 0.33 km. No clouds were present above the spiral start height, and this absence of cirrus was typical of the spirals conducted during the 2018 deployment of the ORACLES campaign. Despite this lack of cloud, we applied RD in addition to RS to compare the outputs of the two methods. The left panel of Fig. 5 shows both the measured 500 nm diffuse ratio, DR, and 500 nm direct transmittance, T500 nm, with their associated uncertainty. Starting just below the 4 km level, the magnitude of the slopes of both DR and T500 nm steepen, signaling the presence of an aerosol layer. The profiles remain predictable in shape all the way to the surface, with monotonic change and no erratic points to indicate clouds along the profile path.
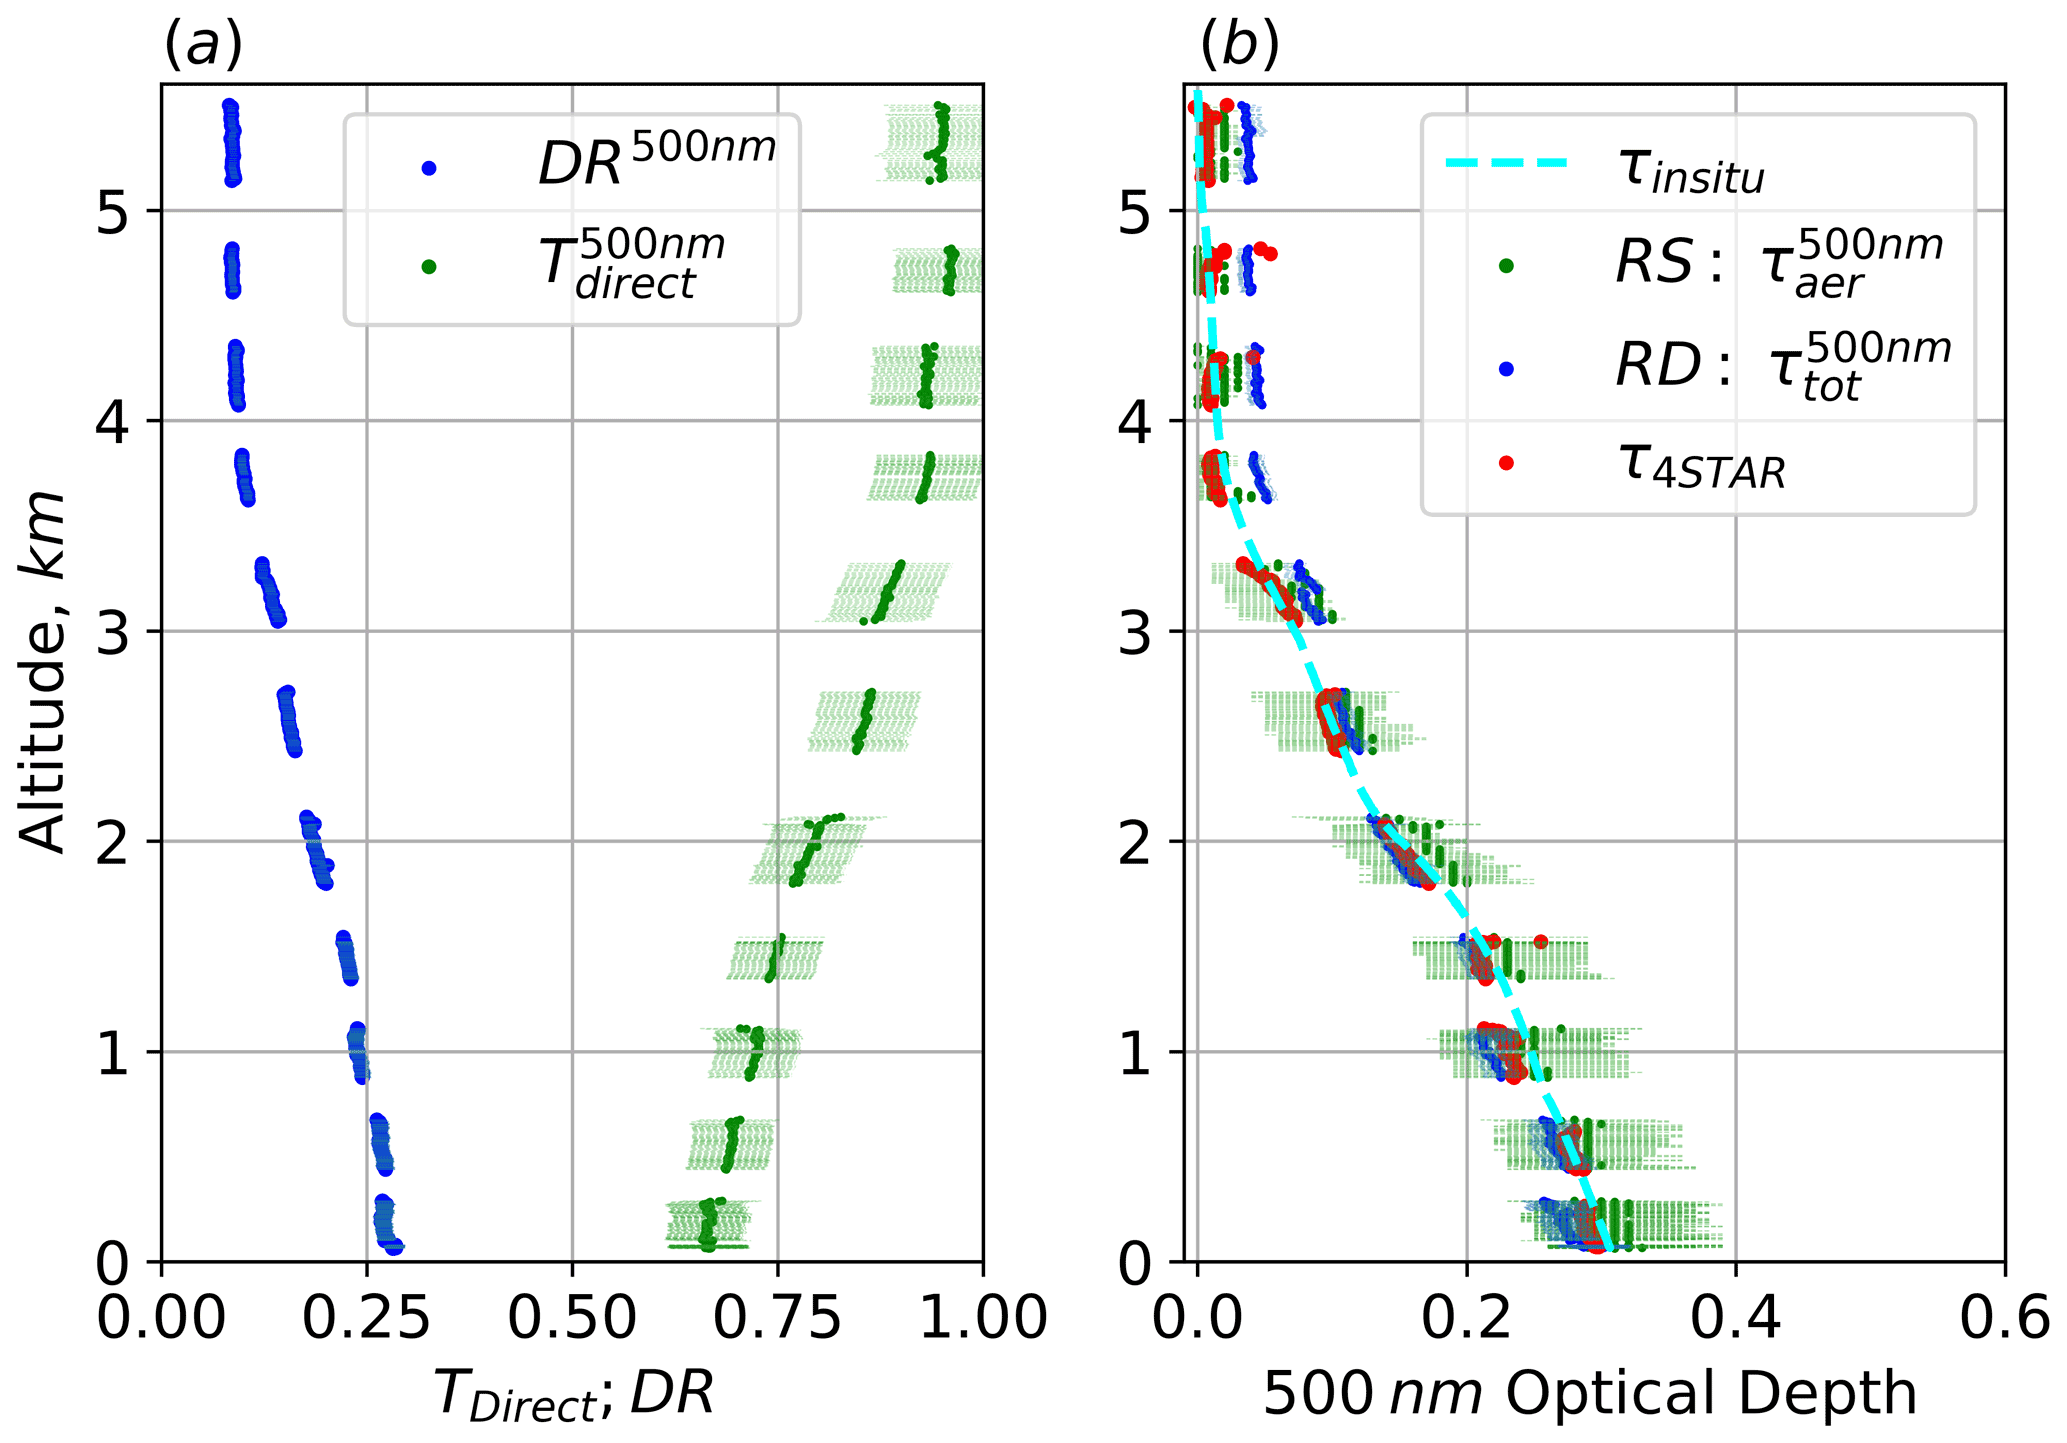
Figure 5ORACLES spiral on 5 October 2018. (a) DR and T500 nm with the associated measurement uncertainty shown by the shading; (b) τaer profiles derived from RS, 4STAR, in situ, and RD.
The right panel of Fig. 5 shows the altitude profiles of 500 nm τaer from RS (τRS,aer, green), 4STAR (τ4STAR, red), in situ (τin situ, cyan), and RD (τRD, blue). Expectedly, the inability of RD to account for absorption within the aerosol layer leads to lower values of τaer than the other methods below 3 km. Above the aerosol layer, RD detects a non-zero optical depth of ∼0.05, which is mainly a result of the relatively high retrieval uncertainty in the RS method when observing small optical depths (see Figs. 2 and 3). This is similar to the measurements made by 4STAR, which commonly detects non-zero optical depths at the top of the spiral. However, in the case of 4STAR, these optical depths are mostly due to the presence of stratospheric aerosols (Kremser et al., 2016), though there may also be contribution from small amounts of tropospheric aerosol as well. In the case of 4STAR, the τaer measured at the top of the spiral is accounted for by subtracting off a constant value that is equal to the mean τ4STAR value above 5.5 km. Visual comparison between τRS,aer and τ4STAR profiles shows agreement with τ4STAR falling within the reported uncertainty in τRS,aer for all samples outside of a few τ4STAR outlier cases. With respect to the τin situ profile, both the τRS,aer and τ4STAR agree well with the in-situ-measured extinction.
4.2 2018 ORACLES mission statistics
There were 14 square spirals flown by the P-3 during the 2018 deployment of the ORACLES mission. The cumulated τaer data from this set of spirals are used in regression analysis, with 4STAR serving as the reference measurement. The left panel of Fig. 6 shows scatterplots of τ4STAR vs. τRS,aer and τin situ. Regression for τRS,aer gives R2=0.96, slope =0.96, and intercept , and RMSE is . The high R2 value and low RMSE indicate that the SPN-S-based aerosol optical depth retrieval performs well in comparison to 4STAR. Regression for τin situ vs. τ4STAR yields R2=0.96, slope =0.90, and intercept , and RMSE is . The good agreement between τ4STAR and τin situ gives us confidence that integrating the in situ measurements of extinction can serve as a basis for comparison for the CAMP2Ex cases where 4STAR (or an equivalent system) was not operated. The right panel shows percent errors for τRS,aer and τin situ for binned τ4STAR values. At small optical depths, uncertainty is a significant fraction of the total optical depth signal, and this leads to large relative errors. As τ4STAR increases, the fractional error between τ4STAR and τRS,aer decreases.
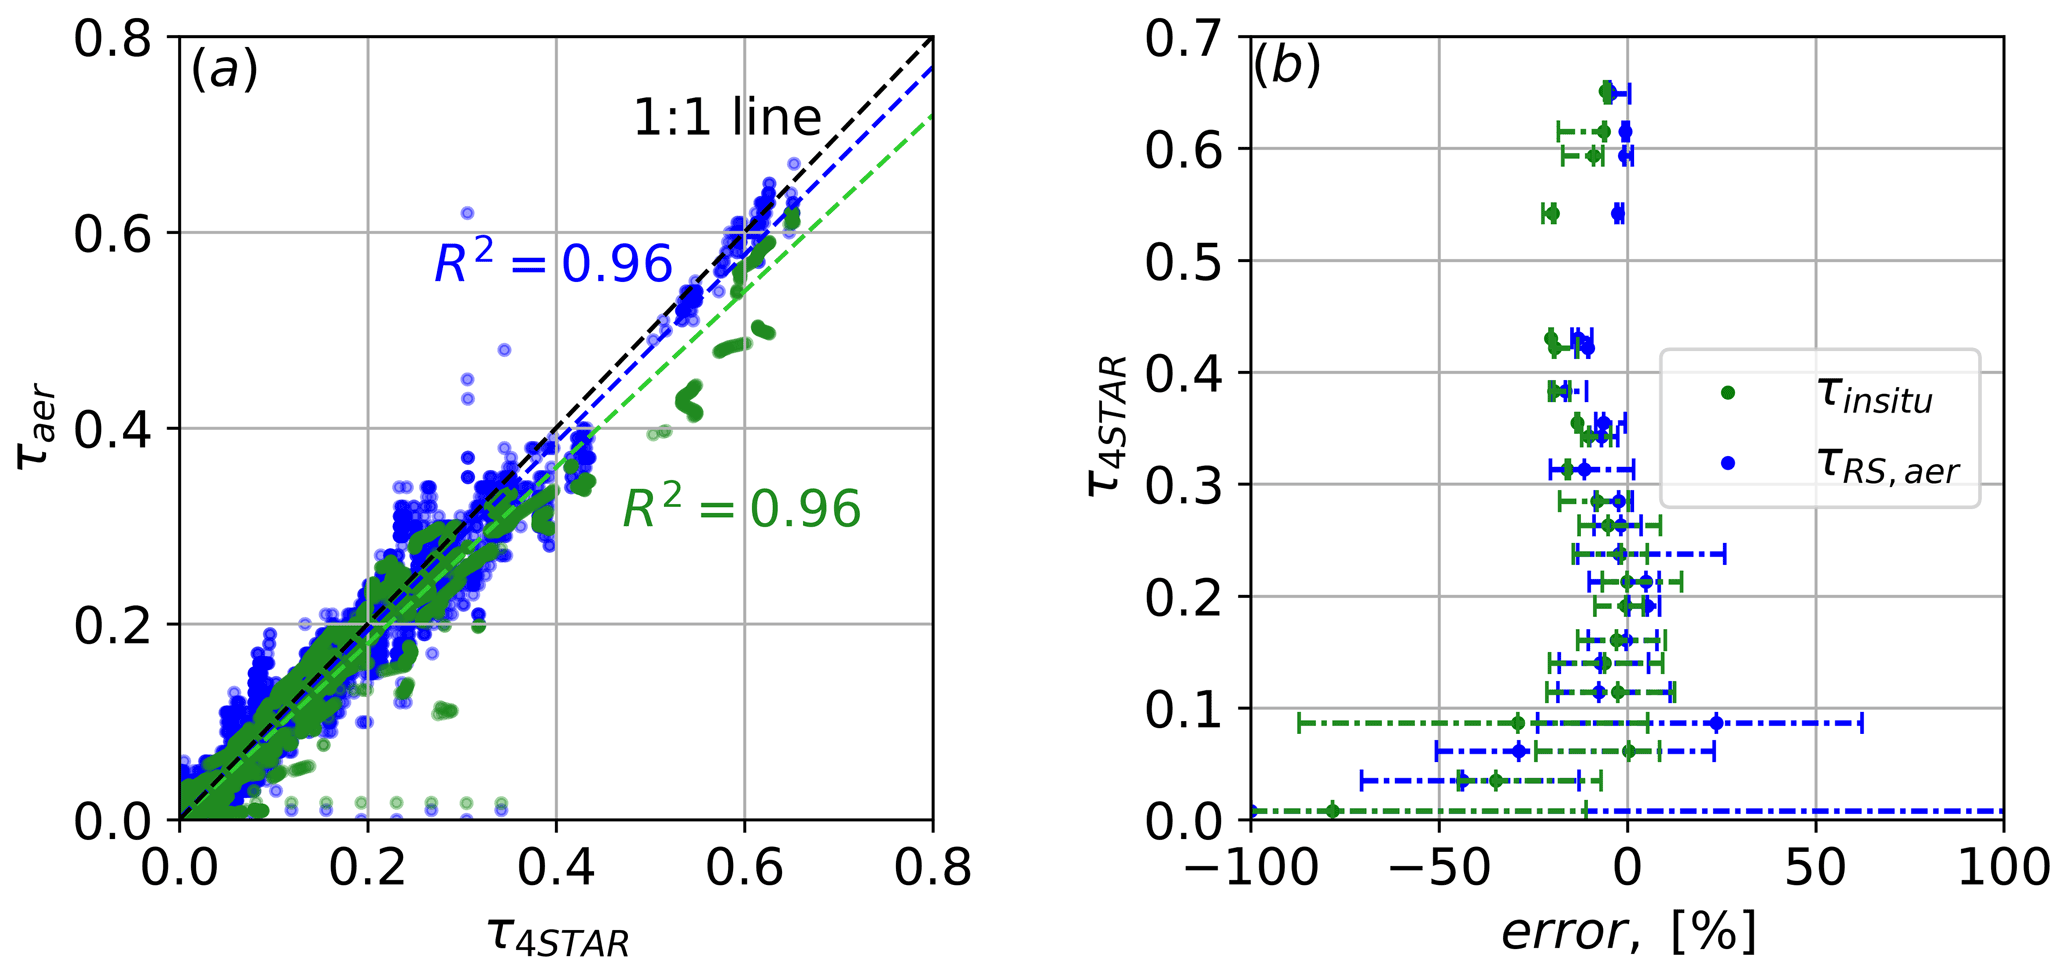
Figure 6Aggregated τaer statistics using τ4STAR as a baseline for the ORACLES campaign. (a) Scatterplots of τ4STAR vs. τRS,aer and τin situ. Regression or τRS,aer gives R2=0.96, slope =0.96, and intercept , and RMSE is . Regression for τin situ yields R2=0.96, slope =0.90, and intercept , and RMSE is . (b) Percent error in τRS,aer and τin situ relative to τ4STAR; τ4STAR values are sorted into bins with 0.025 optical depth width, and the corresponding statistics for τRS,aer and τin situ are reported. Dots represent the median value; tips of the line are the 25th and 75th quantiles of the τRS,aer and τin situ distributions within each bin.
Figure 7 compares the total optical depths derived using RS and RD, where . For these ORACLES cases conducted under cloud-free skies, the retrieval of τRD is caused by aerosols. The regression slope (slope =0.84) deviates significantly from unity, which is expected because RD accounts for extinction only due to scattering. From our analysis in Sect. 2.3 we anticipate the regression to give a slope of less than 1, with the value being linked to g and SSA of the aerosol layer (the green line in Fig. 7 is the modeled relationship for g=0.85 and SSA=1). The aerosols sampled at ORACLES were absorbing, with mid-visible SSA values near 0.85 (Cochrane et al., 2019), and this sink of radiation by the aerosol layer and the errors in the scattering phase function used in RD are the main causes for τ being underestimated by the RD method. A final point worth noting is that there are numerous instances when τRD has a non-zero value, yet τRS,tot does not register an optical depth. This is not surprising given the higher sensitivity to small changes in τ of the RD output.

Figure 7Aggregated optical depth data from ORACLES campaign τRS,tot vs. τRD. Regression gives R2=0.95, slope =0.84, and intercept . The green line is the predicted τRD for a given τRS,tot value, which is determined by RTM simulations (i.e., the dashed red line in the center panel of Fig. 3), for g=0.85.
4.3 CAMP2Ex 17 September 2019 profile
From 00:57:00 to 01:27:00 UTC on 17 September 2019 the P-3 flew a square spiral centered at a latitude and longitude of , , with a spiral midpoint SZA of 36.1∘. The spiral profiled from an altitude of 5.59 km to near the surface at 0.40 km. In contrast to the ORACLES case study, there were cirrus clouds present above the spiral location, and their radiative signature can be seen in the deviation in both the DR and T500 nm profiles from a monotonic curve above 3 km (left panel of Fig. 8). Additionally, the dip in T500 nm value (seen as a spike in DR) around 2 km indicates the influence of a cloud in the vicinity of the P-3. The variation in DR and T500 nm due to clouds causes difficulty when visually attempting to discern the start of the aerosol layer on the graph, but near 2.5 km the magnitudes of the T500 nm and DR slopes increase, indicating the presence of aerosols.
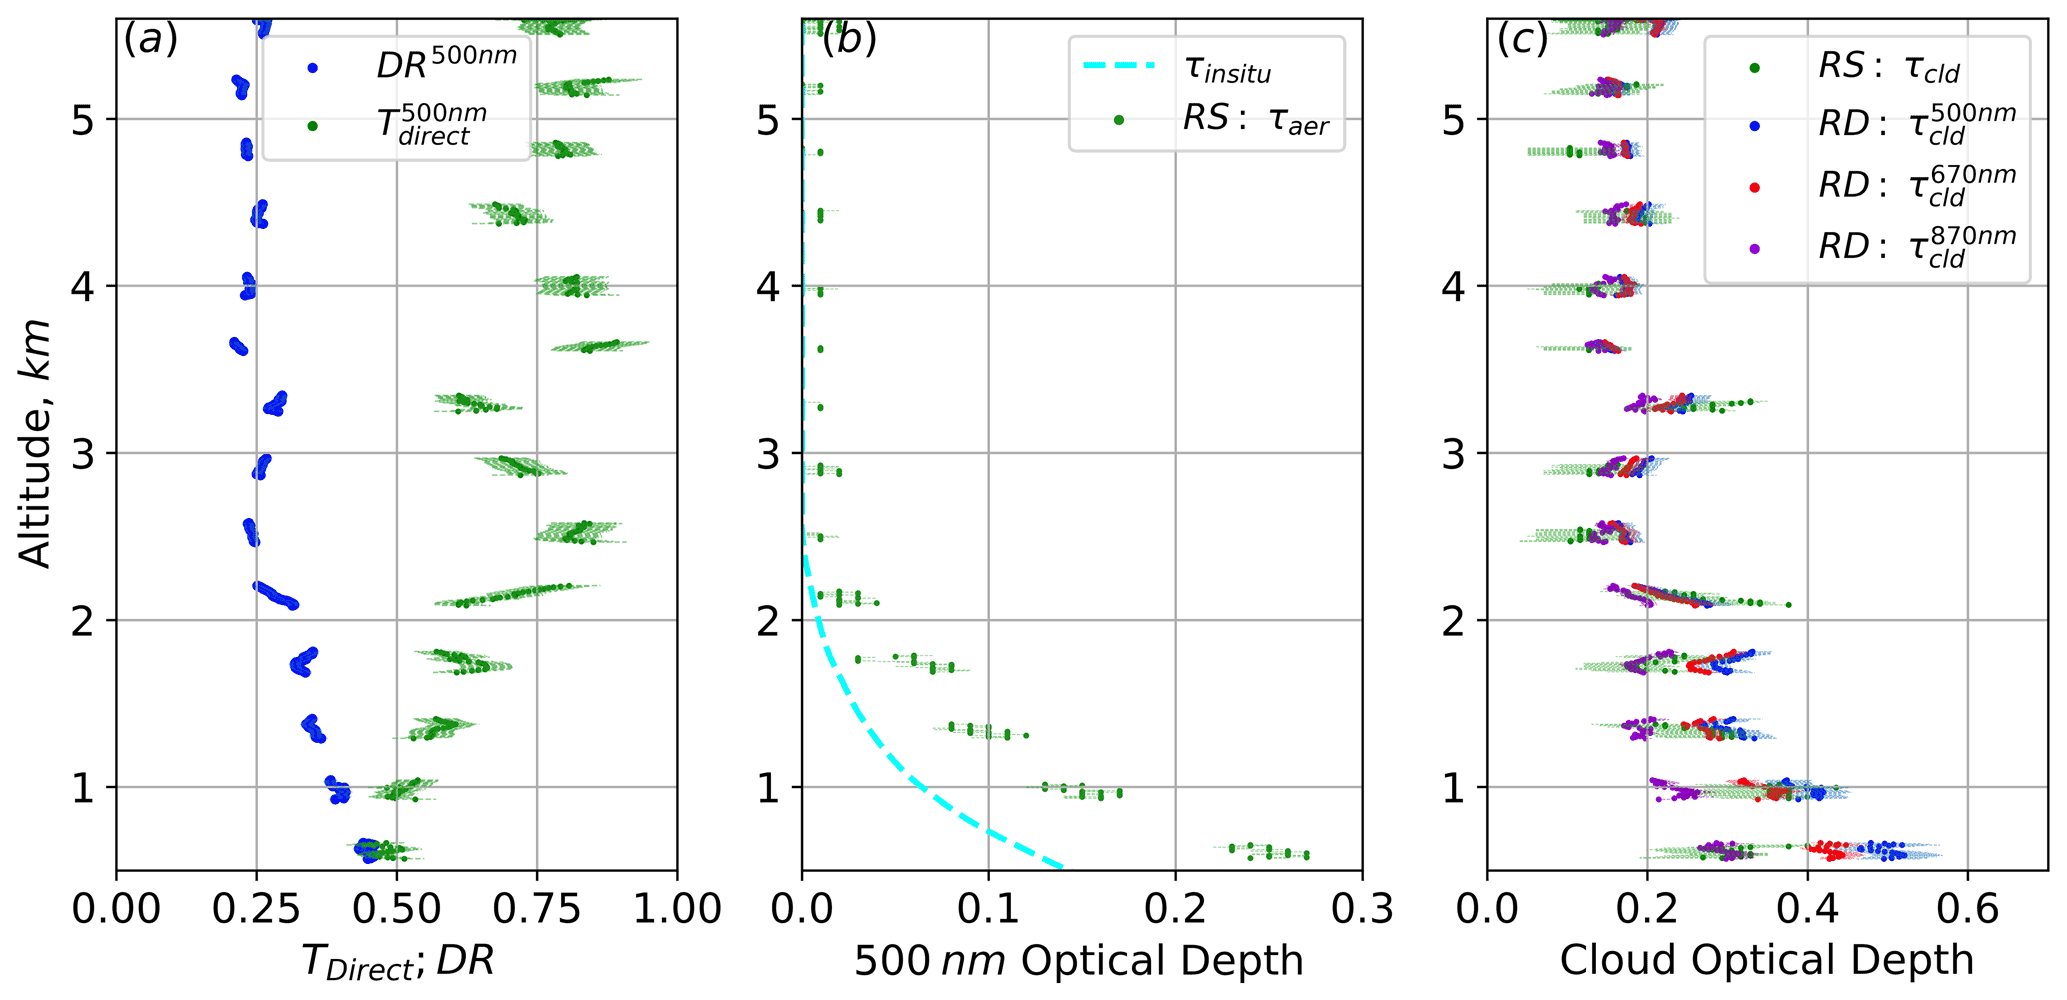
Figure 8CAMP2Ex square spiral on 17 September 2019. (a) DR and T500 nm as a function of P-3 altitude with the associated measurement uncertainty shown by the shading; (b) τaer profiles derived from RS and in situ; (c) τcld values for RD at 500, 670, and 870 nm and RS as a function of altitude.
The middle panel of Fig. 8 shows the altitude profiles of τRS,aer and τin situ. There is good agreement between the shape of the two curves; however τRS,aer is consistently higher than τin situ for altitudes below 2.5 km. We are not sure of the specific reasons why τRS,aer has higher values than τin situ in this case. This bias was not found regularly in the other CAMP2Ex cases, which indicates that instrument error, associated with either the SPN-S or the in situ measurements, may be responsible for the observed differences in τaer.
The right panel of Fig. 8 shows cloud optical depth derived from the RS and RD methods, τRS,cld and τRD, respectively, as the P-3 profiled the atmosphere; τRD is shown at 500, 670, and 870 nm. Above the aerosol layer (>2.5 km) there is good consistency between the three wavelengths of τRD. The 870 nm channel has slightly greater variance than the other two, and this relates to increased noise levels and stray-light issues within the spectrometer that we observed for SPN-S channels past 850 nm. Above the aerosol layer τRD has less variance in optical depth values than τRS,cld, though the majority of samples of τRS,cld and τRD fall within their uncertainties. An imperfect attitude correction of the SPN-S appears to be the main driver of this discrepancy between the retrieved τRS,cld and τRD values. Since fluctuations in sensor attitude more severely impact the direct irradiance than the diffuse ratio, changes in the P-3 heading during the square spiral will influence τRS,cld more than τRD. One benefit of having two methods for retrieving τcld is that sources of error that are a result of the experimental setup can be identified. We do not account for the uncertainty attributed to changes in sensor attitude on RS because there are engineering approaches, such as stabilizing platforms, and study methods that can be implemented which can reduce the impact aircraft attitude has on the measurement in future deployments of the SPN-S.
Within the aerosol layer (<2.5 km), spectrally dependent absorption of the aerosol causes the three wavelengths of τRD to diverge, with the longer wavelengths less influenced by the aerosols. While RD is limited when sampling in the aerosol layer because SSA is not known, the wavelength dependence of τRD can be used to determine if aerosols are present. For τRS,cld, the retrieved values from within the aerosol layer fall within the range of cloud optical depth observed above the aerosol layer.
4.4 2019 CAMP2Ex mission statistics
There were 18 spirals flown by the P-3 during the CAMP2Ex campaign. Figure 9 shows the relationship of τRS,aer vs. τin situ, and the corresponding regression gives R2=0.97, slope =0.94, and intercept , while RMSE is . These aggregated results are consistent with the comparison between τ4STAR and τin situ done for the ORACLES campaign, where τin situ also had a slight low bias in relation to the 4STAR-derived optical depths (slope =0.90). The relatively clean air with lower aerosol extinction and more varied source regions sampled during the CAMP2Ex campaign (Hilario et al., 2021) restrict our ability to fully validate τRS,aer under the cirrus conditions because the amount of sampling done at high τaer was limited. Additional future work to further examine the retrieval of τaer under a broader range of optical depths when cirrus clouds are present is needed. This is critical in light of the found limitations of the SDA method under cirrus conditions (Smirnov et al., 2018). However, there is reason to expect the RS method will be able to retrieve τaer under cirrus conditions with lower uncertainty than has been possible using past methods. For example, the SDA method is developed for use with ground-based measurements, and therefore it derives a column optical depth. When retrieving column τaer it is difficult to account for the forward scattering of light by cirrus, which makes it difficult to accurately constrain τaer. In the RS method, because the irradiance at the top of the layer is directly characterized, the forward scattering by cirrus is accounted for when deriving τaer. Regardless, the limited retrieved τRS,aer values at CAMP2Ex are consistent with the relationship between τin situ and τ4STAR observed at ORACLES.

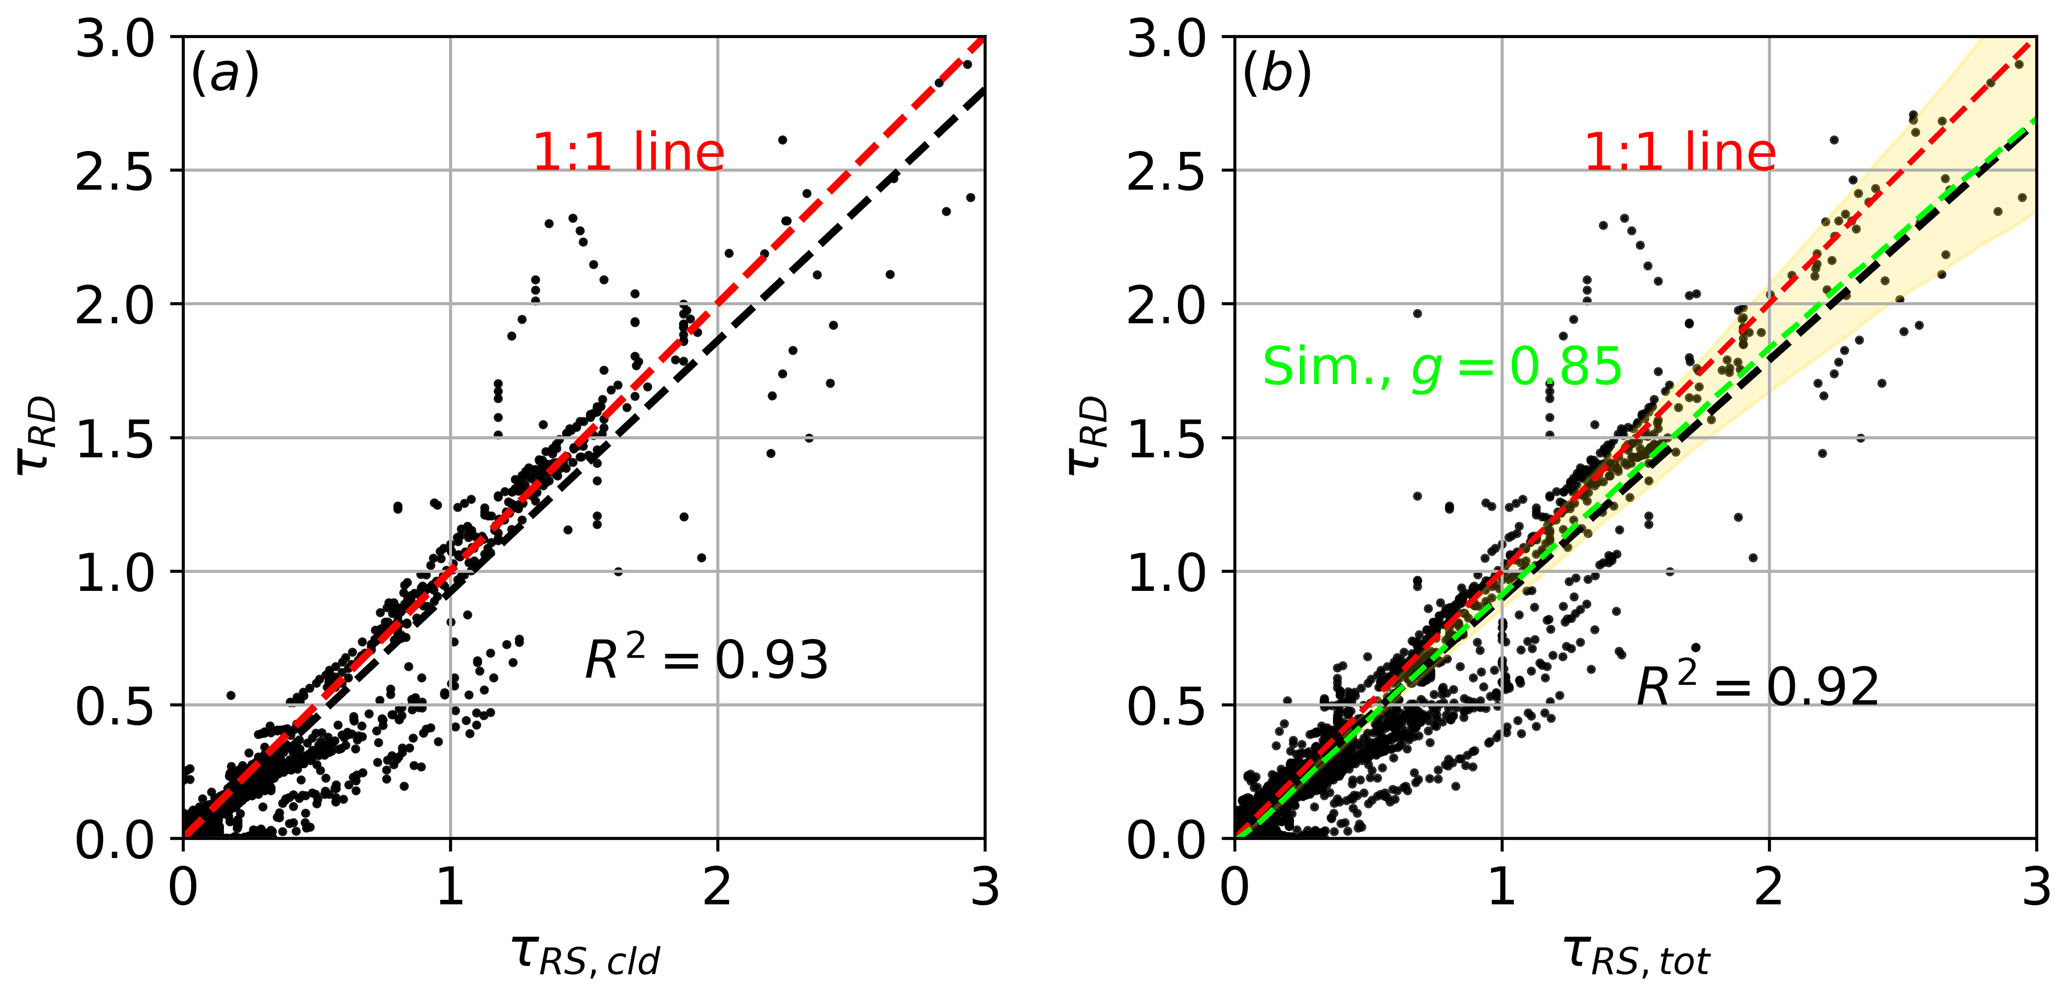
Figure 10CAMP2Ex. (a) Above-aerosol-layer comparison: τRS,cld vs. τRD. (b) All data total-optical-depth comparison: τRS,tot vs. τRD. The dashed green line represents the expected τRD given a value of τRS,tot assuming g=0.85.
Like with the ORACLES results, we compare τRS,tot to τRD for two cases: (1) above the aerosol layer, which is shown in the left panel of Fig. 10, and (2) the optical depths for complete spiral profiles (i.e., data from above and within the aerosol layer), which are shown in the right panel of Fig. 10. At higher optical depths, the relationship between τRS,cld and τRD (left panel) resembles the predicted one (see Sect. 2.3), with the sampled points clustering mostly along the 1 : 1 line. There is a grouping of points near τRS,cld=1 that have lower values of τRD, which are depressing the regression slope from unity (slope =0.94). A possible explanation for these points is clouds in the vicinity of the P-3 scattering light into the diffuse sensor of the SPN-S, biassing Fdif high, the result of which is low τRD,cld. Comparing the relationship between the total set of samples (τRS,tot vs. τRS; right panel), the points generally fall below the 1 : 1 line (slope =0.89). Here, the addition of absorbing aerosols is the likely cause of the low τRD values in relation to τRS,tot. However, errors in the scattering phase function used in the RTM and the influence of mid-spiral clouds may also be partially responsible for the lower values of τRD and the resulting low regression slope.
4.5 RD cirrus characterization along flight track
The inputs of RD are absolute, and therefore the method can be deployed to derive τcld along P-3 flight tracks. We demonstrate this with an example from the science flight on 6 September 2019 from 03:00 to 05:00 UTC. To reduce the computational time required to run the retrieval, the 1 Hz SPN-S and SSFR irradiance data are subsampled at 0.1 Hz before being processed. For this sampling period SZA ranged from 10.0 to 17.6∘. The top panel of Fig. 11 shows the P-3 altitude and DR, while τcld at 500 and 670 nm is shown in the bottom panel, along with the ratio of the two optical depths. The presented data are not filtered for any criteria on DR. When DR is near unity the retrieval performs poorly, resulting in spikes in the retrieved value of τcld; two examples of these events are seen at 03:30 and 04:30. When DR<0.9, such as the start of the flight track from 03:00 to 03:28 UTC or the section near the end, 04:45 to 04:56 UTC, there is consistency between and , indicating successful retrieval of τcld. At lower altitudes, from 03:38 to 04:15 UTC, the cloudier environment frequently causes the irradiance to become completely diffuse, and the retrieval fails. During the low flight leg, 04:00 to 04:10 UTC, the ratio of is high, indicating the possible presence of aerosols. A complete analysis of CAMP2Ex cirrus cloud optical and radiative properties is provided in Hong et al. (2022).
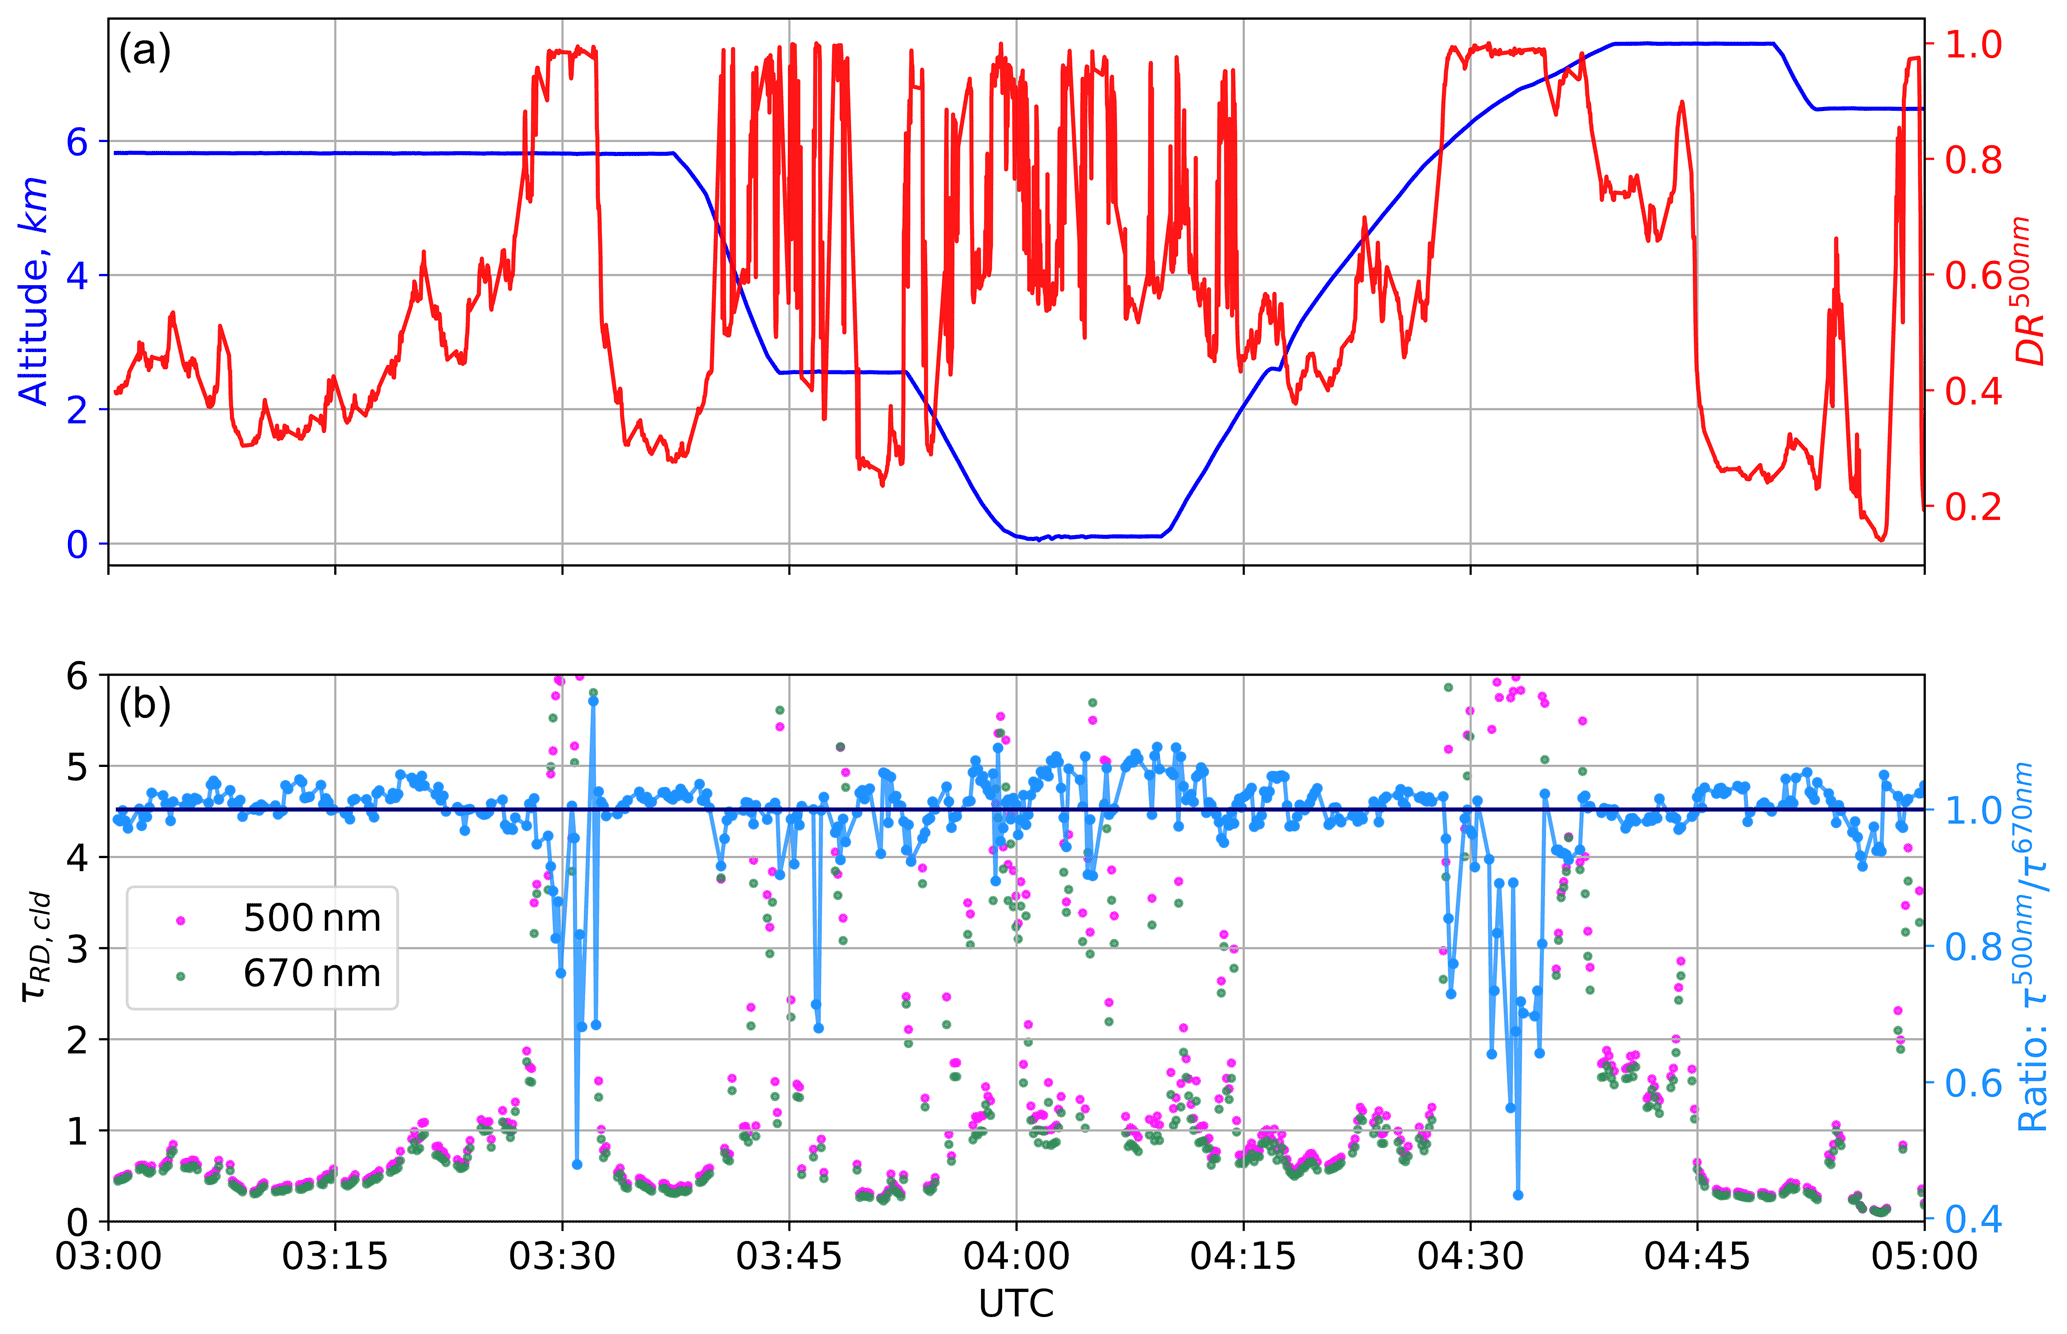
Figure 11Time series of 6 September 2019, partial flight track of (a) P-3 Altitude and DR, (b) and . The ratio, is also shown.
The application of the SPN-S radiometer to deriving overlying cloud and aerosol optical depth is promising, but there are tradeoffs that must be considered when comparing these methods to existing standards. If the objective is to identify and classify the optical properties of thin clouds (e.g., τcld<1), RD is a robust choice because the small uncertainty in DR allows for a highly sensitive retrieval. At optical depths greater than 1, the assumptions underpinning RD, especially knowledge of the scattering phase function, lose validity, causing significant errors in the retrieval output (see Fig. 3). Since the relationship between the retrieved τcld and its error can be largely explained for a given value of g, it may be possible to correct for the discrepancy between predicted and true cloud optical depth under conditions where g is constrained or there is accurate knowledge of the phase function. However, the capabilities of RD will always be limited to thin clouds because beyond an optical depth of about 5 the DR signal loses much of its sensitivity to changes in τcld. Of course, this limit at which RD can accurately derive τcld will be dictated by the performance of the sensor measuring DR. Another limitation of RD is that, without knowledge of the layer SSA, the effects of absorption on DR are not quantifiable, thus making the retrieval of limited use when aerosols are present. The caveat to this is the development of a simple aerosol flag, where spectral dependencies in RD output can be attributed to an absorber, such as aerosols, being present in the sampled layer.
The benefit of RS is that the retrieval has the potential to separate the cloud and aerosol radiative signals from each other. The tradeoff with the existing sun photometry standards of measuring τaer is greater uncertainty that stems from the difficulty in accurately measuring Fdir with a radiometer. Errors are induced into Fdir measurements by several mechanisms: changes in sensor attitude, calibration shifts over time, cosine response errors, temperature effects, etc. We attempt to reduce the uncertainty associated with these errors by sampling profiles of the atmosphere and using the high-altitude aerosol-free samples to correct for calibration errors and variations in atmospheric composition, but the need for this correction currently limits the application of the method to profiles of atmospheric layers. While it is unlikely that the SPN-S system will ever be able to obtain the precision and accuracy of a system like 4STAR, there remains obvious room for improvement. Better characterization of the offset angles of the mounted SPN-S will reduce the error related to changing aircraft attitude. (During ORACLES and CAMP2Ex, the SPN-S was not a priority instrument, and flying the necessary flight patterns to determine the offset angles via the Long et al., 2010, method was not possible.) More sophisticated radiometric calibrations will also improve retrieval performance, be it through laboratory comparisons with traceable lamp standards or using Langley techniques and intercomparison with known benchmarks. The seven-detector-head design of the SPN-S introduces technical challenges when calibrating using a lamp, and this being a prototype instrument, some of the challenges are still being worked through.
Another source of uncertainty in optical depth retrievals relying on direct and diffuse measurements made from the SPN-S is the wide FOV associated with shadow band radiometer systems, which results in an overestimation of the direct transmittance. Biased measurements of transmittances due to the sensor FOV being wider than the solar disk are an issue associated with sun photometers as well; however the FOV of the SPN-S system is greater than commonly used sun photometers (∼5–10∘ vs. ), making FOV correction necessary for accurate optical depth retrievals (di Sarra et al., 2015; Wood et al., 2017). Empirical methods can be used to account for the discrepancy in sensor FOV, but these methods are reliant on large numbers of co-located measurements of τaer with a sun photometer under varying aerosol or cloud conditions. These empirical relationships are specific to the individual sensors themselves, meaning that we cannot apply previously generated FOV corrections here. In the specific cases used in this study, comparison with the SPN-S and 4STAR did not indicate substantial FOV bias that warranted correcting τaer, so we did not apply those techniques. However, forward scattering in the direction of the direct beam is most severe under thin ice clouds, and so we used RTM simulations of the diffuse radiance to account for these effects when retrieving τcld using both RS and RD (details contained in Appendix A).
RS is prone to errors when differentiating a signal between τcld and τaer if certain aerosol types are present. Coarse-mode aerosols, such as dust particles, can have AE values near zero (Eck et al., 1999) and therefore have minimal spectral dependence on their optical depth. That is, larger aerosol particles have extinction wavelength profiles similar to cirrus clouds. In cases where large aerosol particles are present, the τcld term in Eq. (7) is also dependent on the coarse-mode aerosol optical depth. The aerosol type and clouds present when sampling will determine the extent to which large aerosols impact the retrieval output. For example, if the study region is cloud-free, optical depths due to coarse-mode aerosols will still be able to be measured using RS by evaluating the τcld term of the retrieval output. In fact, RS could be extended to do aerosol-mode analysis under cloud-free skies in a manner similar to the SDA method used in sun photometry (O'Neill et al., 2003).
Advances in the capability of the SPN-S are ongoing, and improvements to the system have already been made since the prototype version was deployed to ORACLES and CAMP2Ex. Most notably, software improvements now allow for sequential sampling to occur at multiple spectrometer integration times. The advantage of this technique is that both bright and dark parts of the irradiance spectrum can be resolved nearly simultaneously, giving much better instrument performance at the tails of its spectral range (<450 and >900 nm). Having greater spectral range in which to evaluate Eq. (7) will allow differentiating between cloud and aerosol optical depths to be done with greater confidence. Likewise, with the improved calibration mentioned earlier in this section it may be possible to eliminate the need for spiral patterns and the associated optical depth correction. Instrument upgrades, along with measuring and accounting for extinction from trace gases (i.e., better representation of τmol,λ), open the door for applying RS to a broader set of sampling types, such as along full flight tracks or to ground-based deployments. Making the mentioned improvements to the SPN-S and using it in ground-based settings would produce useful data to use in the characterization of the retrieval uncertainty. All of these retrieval methods need more future work to better validate and understand their outputs, some of which is currently ongoing. Hong et al. (2022) will compare retrieved τcld to similar results from spaceborne remote sensors.
There are several more advantages of SPN-S system-based methods for cirrus cloud and aerosol studies to note. The SPN-S is a total-diffuse radiometer that has no moving parts, which makes it an inexpensive and user-friendly instrument to operate in a wide variety of settings. Airborne sun photometer or lidar systems tend to be mechanically and technologically complex, resulting in significant overhead when operating them in field settings. Moreover, while the spectral analysis techniques of RS can be applied to any set of spectral direct irradiance measurements (for example, RS can be applied to spectral sun photometer irradiances), a well-characterized SPN-S system has inherent advantages. The SPN-S measurement of hyperspectral total irradiance provides a more complete view of the radiative environment rather than informing about only the optical depth and direct irradiance that sun-staring sun photometry measurements provide. An example of how this might be beneficial is for the determination of heating rates in the atmosphere. With a measured spectral τaer profile, radiometric-based approaches have been advanced that allow aerosol-intensive properties to be derived (Cochrane et al., 2019), from which it is possible to determine aerosol heating rates and radiative effects (Cochrane et al., 2022). SPN-S measurements may allow for similar studies to be completed with a consolidated set of instruments at lower cost. Additionally, aerosol-intensive properties can be studied using the DR measurement in manners similar to Kassianov et al. (2007).
In this paper we use the capabilities of the newly developed SPN-S radiometer to implement two retrieval methods: RD is a scheme that utilizes single-channel measurements of DR and afl to derive cirrus cloud optical depth, while RS is a technique that exploits structure in optical depth spectrum to partition it into τcld and τaer components. Since the primary radiometric input of RD is the ratio of two measured irradiances, calibration-induced uncertainties in the system are minimized, resulting in a retrieval that is highly sensitive to small optical depths. Unquantified absorption in the atmosphere limits the utility of RD to derive τcld, with the caveat that the method can be used to identify the presence of aerosols by comparison of the retrieved optical depths at multiple wavelengths. On the other hand, RS is based on measurements of Fdir which have larger associated uncertainties stemming from calibration errors and the influence of changing sensor attitude. This makes RS best suited for deriving τcld at values greater than unity where the inherent retrieval errors are a lower fraction of the output or when aerosols are present. Since τaer is derived from the spectral shape of the optical depth and not the absolute value at any one wavelength, the τaer output of the retrieval is less influenced by the measurement uncertainty than the spectrally independent τcld output.
We apply both methods to data from two field campaigns, ORACLES in 2018 and CAMP2Ex in 2019, to evaluate their performance. RS performed well at retrieving τaer by comparison to measurements made by the 4STAR sun photometer system () and optical depth as retrieved by in situ measurements under both clear-sky and cirrus conditions (). There were limited cases of high aerosol loading under cirrus conditions, so the retrieval performance under these circumstances warrants further investigation. The τcld retrievals of both methods were evaluated against each other and behaved as our theoretical analysis predicted.
The optical depth retrieval uncertainties in these two new methods suggest that the SPN-S is not a replacement for traditional sun photometer instruments such as 4STAR. However, it is a low-cost alternative that is mechanically simple, making it logistically easier to deploy in many circumstances, such as on aircraft. Depending on the experiment, the tradeoffs in optical depth uncertainty in the SPN-S can be afforded by the accessibility it provides to reliably identifying the presence of above-aircraft clouds and aerosols. Cirrus identification is of value to other passive nadir-viewing sensors such as imaging and scanning radiometers and polarimeters. The SPN-S is also advantageous in that it measures spectrally resolved total, direct, and diffuse irradiance, which are useful quantities in the context of radiation science.
The SPN-S used in this study is a prototype, and work remains to better characterize the performance and calibration characteristics of the instrument. Much of this work is ongoing already, with software advancements having expanded the spectral range of the system, while improvements to the calibration procedures are a focus of current work. Increases in system predictability and reduced measurement uncertainty will allow for more versatility in the deployment of the methods presented in this study. For example, it may be possible to use RS for time series analysis if the calibration stability gets to the point where a profiling approach is no longer needed to correct for errors in the optical depth spectra. The combination of utility, robustness, and ease of implementation offered by the SPN-S makes it feasible to implement in a wide variety of settings: from future airborne campaigns to long-term monitoring applications at ground-based field sites.
Forward scattering of radiation in the direction of the direct beam is a common phenomenon sun photometry techniques must account for when deriving optical depth of aerosols and thin clouds (Segal-Rosenheimer et al., 2013). Frequently the full-angle FOV (here FOV refers to the full-angle, not half-angle, FOV of the sensor) of a sensor used to measure Fdir is greater than the angular width of the sun's disk, causing diffuse light surrounding the direct beam to influence measurements. This overestimation of the direct transmittance leads to τ being underestimated when implementing standard radiative transfer techniques. While the SPN-S does not function in the same manner as a sun photometer to measure Fdir, the shadow mask used to block the direct beam when sampling Fdif has a shading area wider than the beam. That is, the shading area of the shadow mask is too large, and this leads to a low bias in measured Fdif and a high bias in derived Fdir. Under most atmospheric conditions this bias is minimal and can be ignored. However, it has been shown that when thin clouds are present, especially ice phase clouds which scatter strongly in the direction of the direct beam, the biases can lead to errors in τ retrievals up to 100 % (Segal-Rosenheimer et al., 2013).
To account for the contamination in measured Fdir by diffuse radiation, we developed corrections for the τcld outputs of both methods presented in this paper, RS and RD, based on simulated radiance fields in the FOV of the SPN-S. These corrections are in the form of a relationship between the optical depth inferred by the sensor to the true optical depth, and they are dependent on solar zenith angle and wavelength.
To do this, we used the MYSTIC Monte Carlo model that is a part of the libRadtran package (Emde et al., 2016) to simulate the diffuse radiance, Ldif, in the FOV of the SPN-S. The SPN-S is a prototype, and its exact FOV is unknown, but it is estimated to be around 8∘ (Wood et al., 2017). Further, errors in FOV at angles greater than 5∘ will have minimal impact on the optical depth correction because the majority of Ldif is located within the first 2 angular degrees from the center of the solar disk. We run a set of radiance simulations, with the sensor pointed towards the sun's position, and calculate Ldif across the arc length of the FOV, scanning across the sensor FOV area in the azimuth and zenith directions. These simulations are done for a set of ice clouds with τcld ranging from 0–6 at 0.1 resolution over a black surface. We limited the Monte Carlo model runs to 1000 photons each, which is a low number, but the FOV corrections are based on fits to sets of model runs, and so the error in any one simulation due to the low photon count is minimal. Figure A1 shows an example of simulated diffuse transmitted radiance, defined as as a function of viewing angle in the azimuth. Forward scattering from thin cirrus peaks around τcld=1, leading to the observable spike in Tldif.
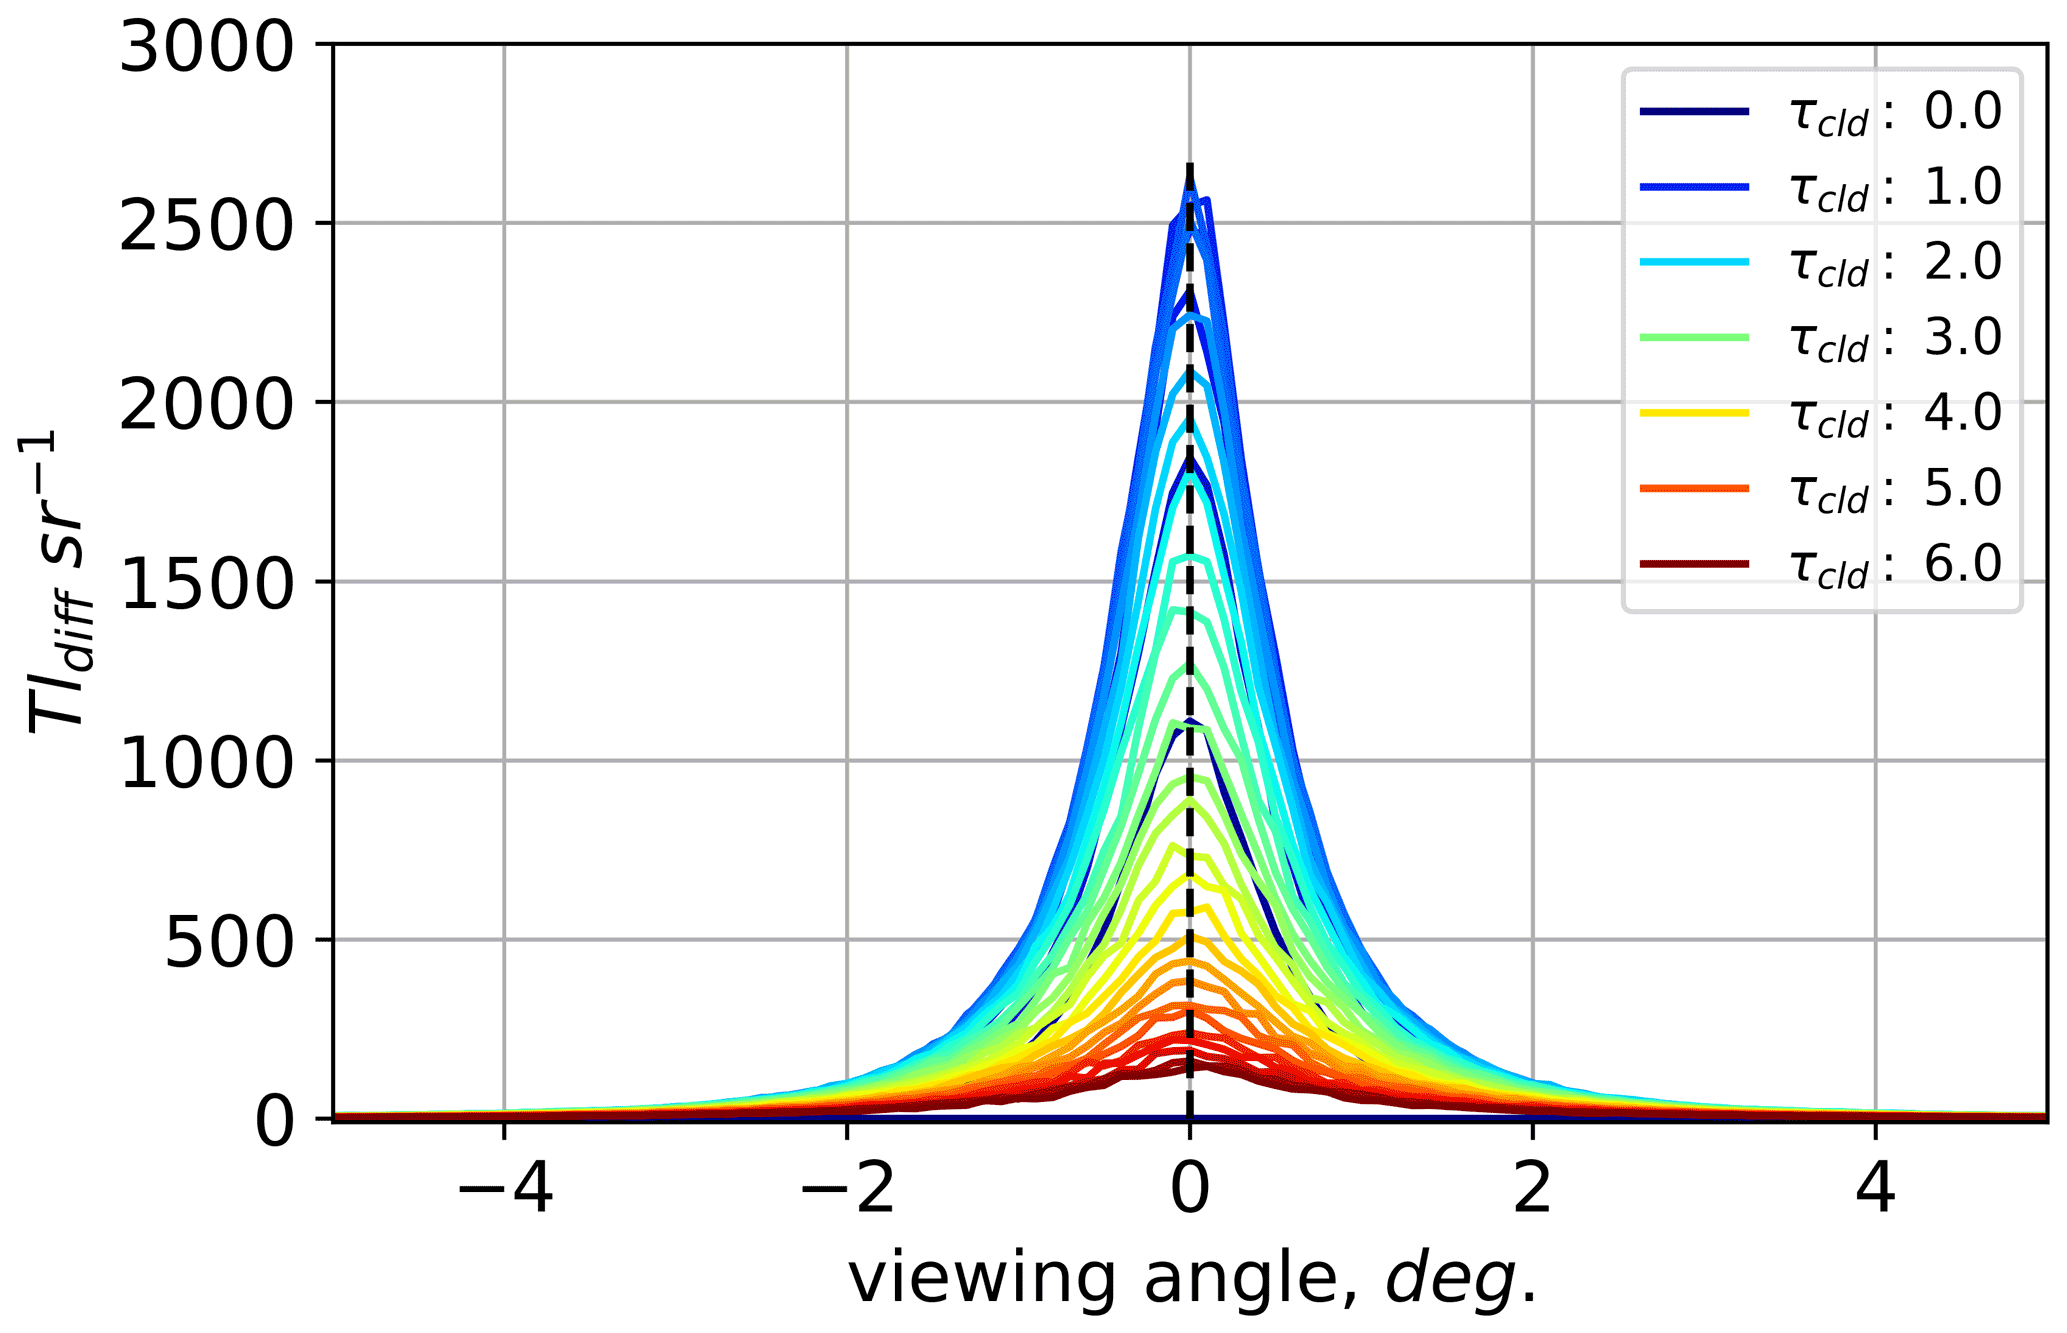
Figure A1Simulations of diffuse radiance transmittance at 500 nm, when scanning across the sensor FOV in the azimuthal direction. Line color corresponds to τcld value. The sun is positioned at a viewing angle of 0∘, and the SZA is 20∘.
We assume that the radiance field is symmetrical about both the zenith and azimuth axis and integrate the radiance fields to derive the total diffuse transmittance in the FOV of the sensor, Tdif,FOV:
In practice, we split the integral along the four FOV paths we simulated using MYSTIC:
Tdif,FOV is the extra transmittance in the measurement of direct-beam transmittance made by the sensor. Figure A2 shows the dependence Tdif,FOV has on τcld.
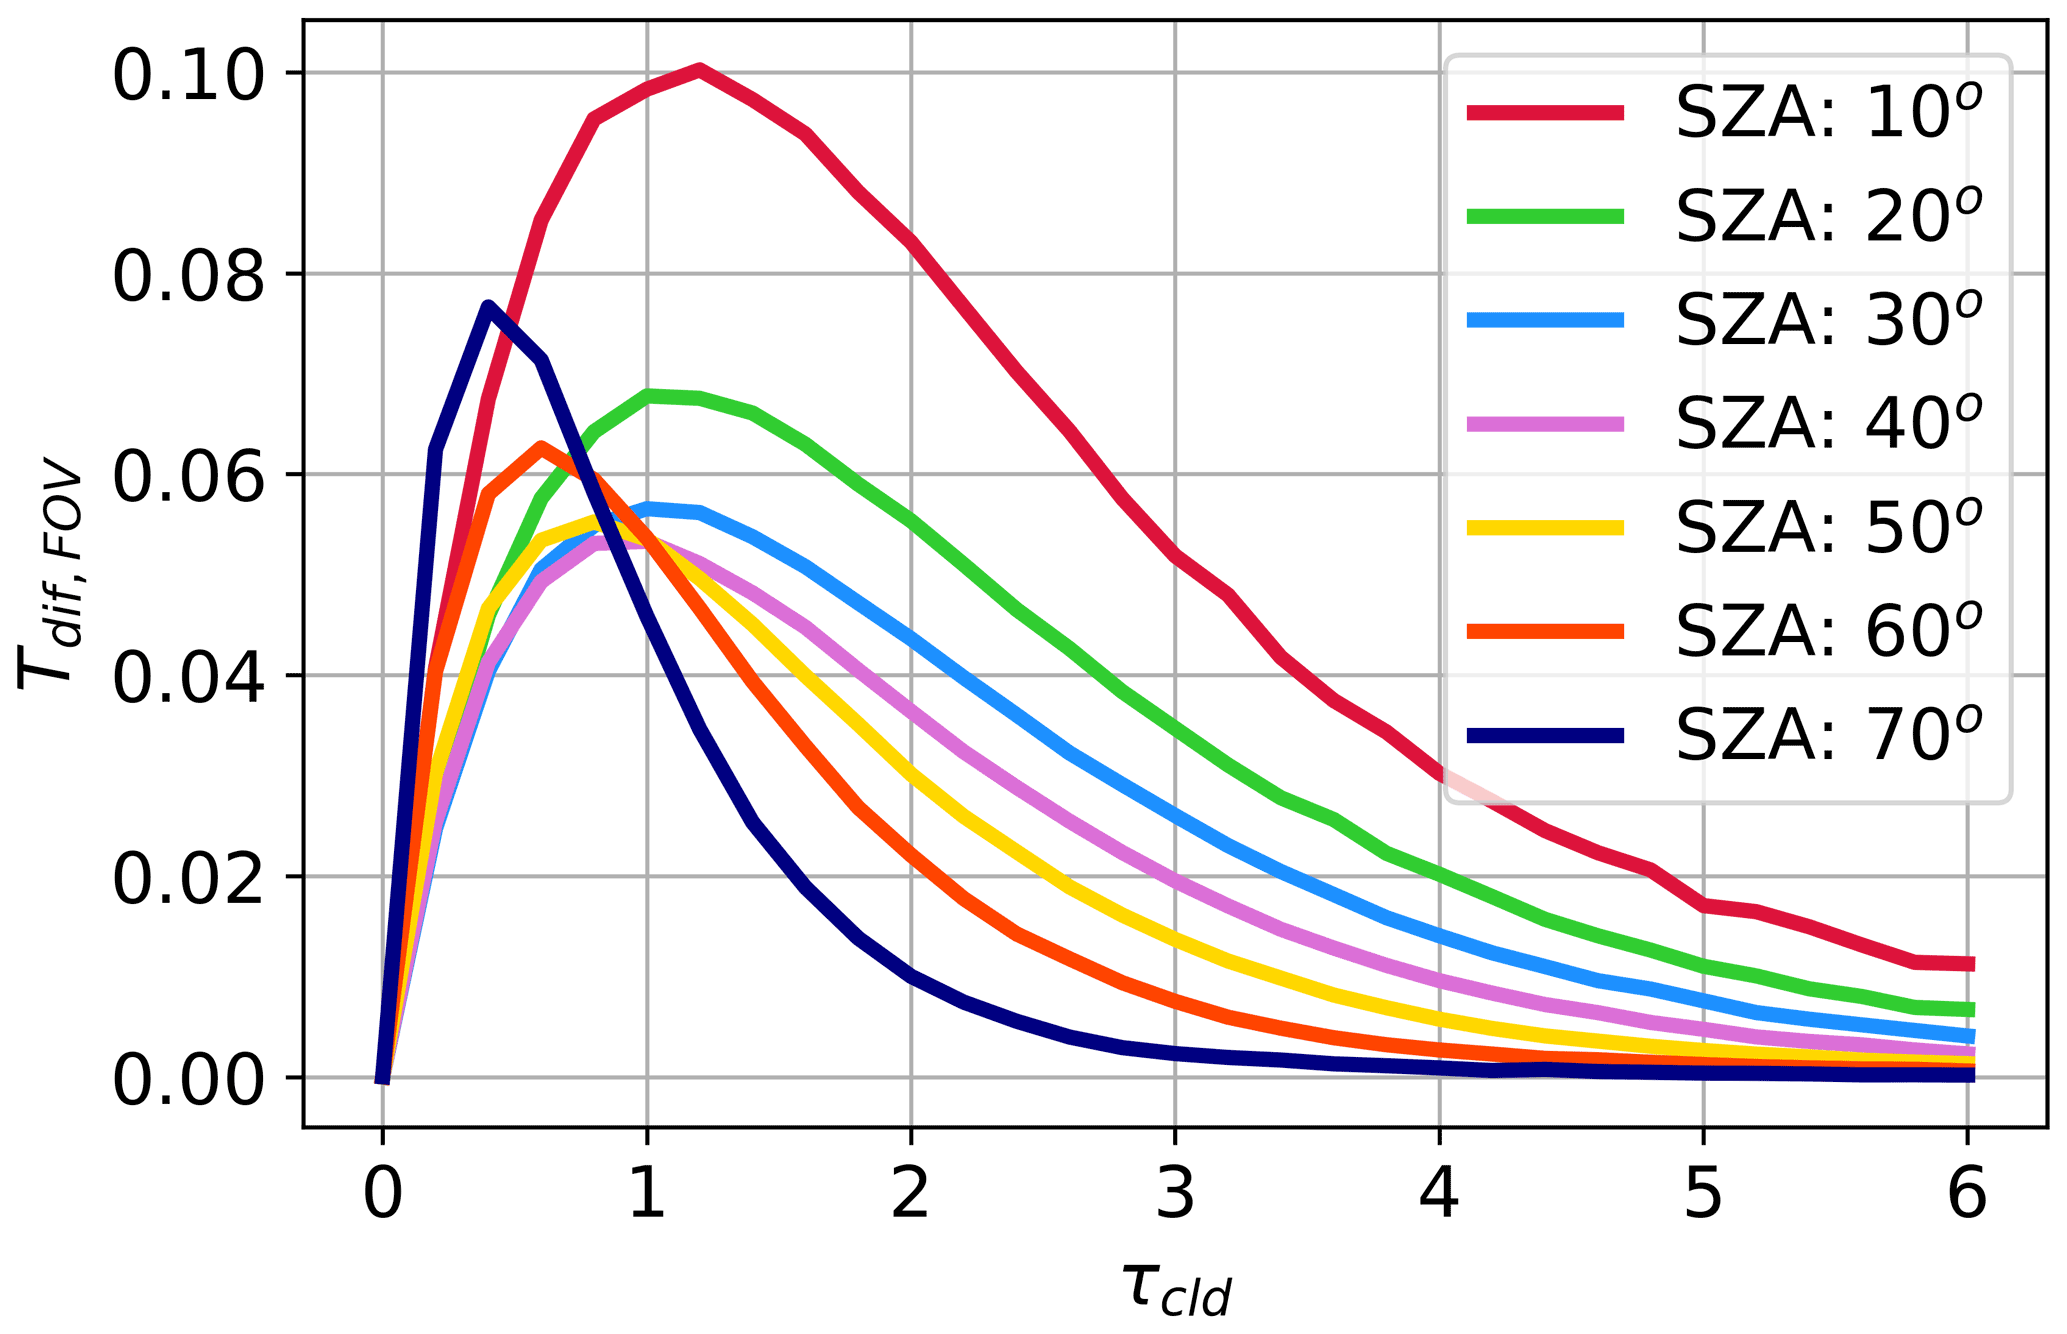
Figure A2Tdif,FOV as a function of τcld for the 500 nm wavelength. The relationship is shown for multiple SZAs ranging from 10–70∘.
For RS, the relationship between τcld and the optical depth inferred from the method, τi, is determined by inverting Beer's law (Eq. 1) and inserting the biased transmittance:
where Tdir,true=Tdir,true(τcld) is the direct-beam transmittance given a true cloud optical depth. Here again we use libRadtran to simulate Tdir,true for each τcld value used in the simulations of Tdif,FOV. Likewise, for RD, Tdif,FOV is used to calculate the bias in DR, and then Eq. (5) is used to find τi:
where Fdif,true and Ftot,true are the true irradiances given a true cloud optical depth, and Fdif,FOV is the extra diffuse irradiance the sensor sees due to the wide FOV of the shadow mask (). Equations (A3) and (A4) form the relationships between τi and τcld, which we then fit with fourth- or sixth-degree polynomials. The resulting curves give the correction factors for the retrieval outputs, τRS,cld and τRD. The retrieval outputs are the sensor-inferred optical depths (τi), and we directly map these to the τcld values; these relationships are illustrated in Fig. A3.
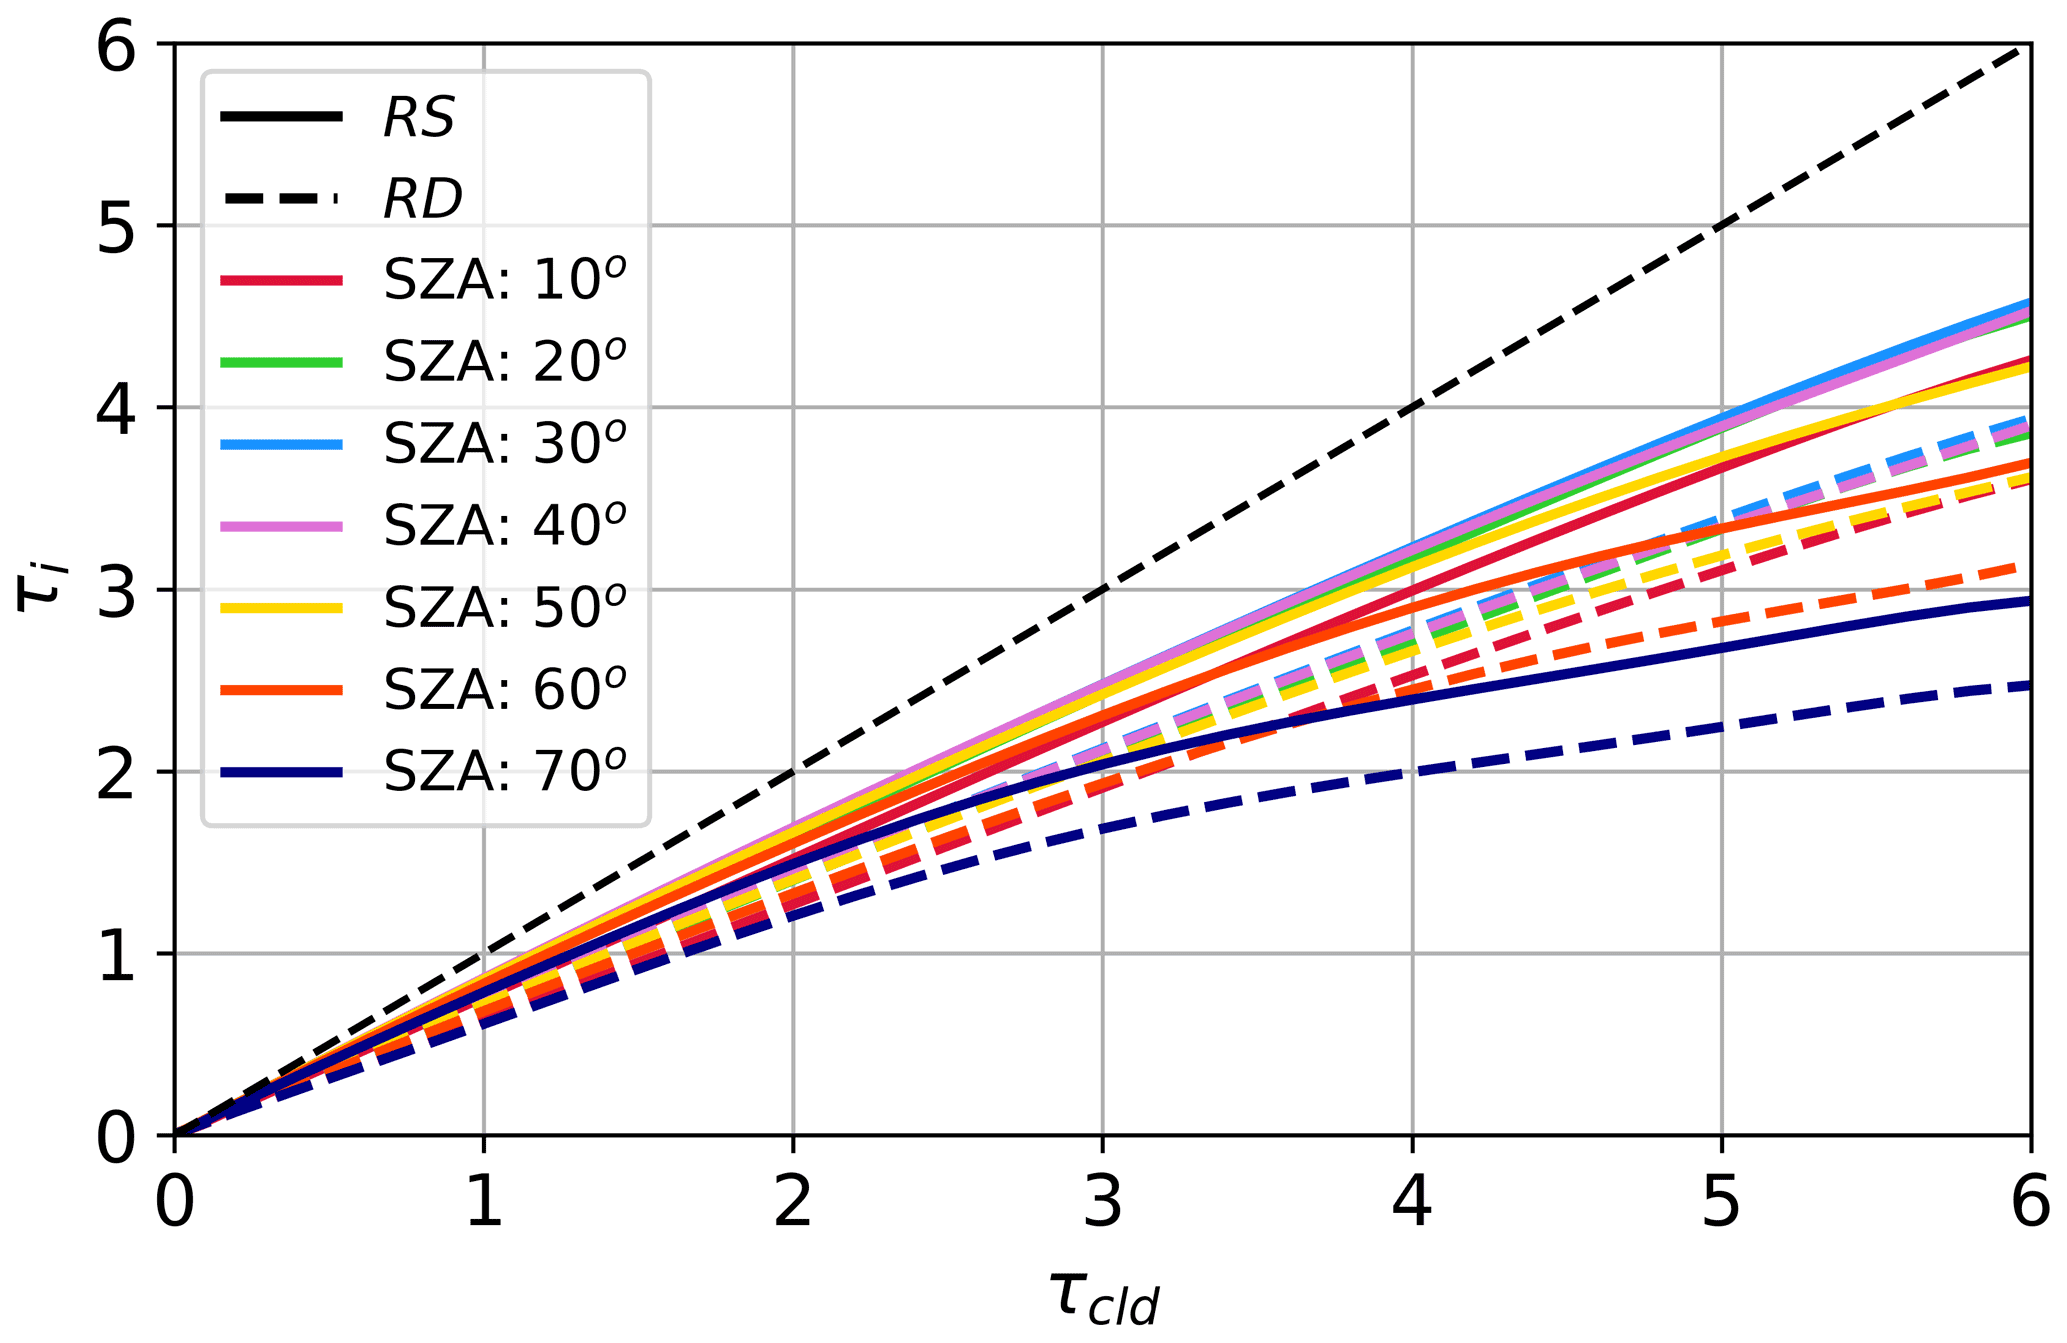
Figure A3Relationships of τcld vs. τi for RS and RD (Eqs. A3 and A4) for the 500 nm wavelength, with SZA ranging from 10–70∘.
We derive these τcld correction relationships for SZA ranging from 10–70∘ and at wavelengths of 500, 670, and 870 nm. When applying the corrections, the SZA dependence is accounted for by interpolating the derived factors to the SZA at the time of the sample. It is important to note that for the diffuse case, the correction is limited because we ignore the influence a non-zero surface albedo has on Tdif,FOV. Further, applying the correction to the output of RD when aerosols are present will cause errors, and so the correction is only applied in aerosol-free regions. We also ignore the impact ice crystal habit has on this correction because for thin cirrus the overall correction is relatively small (∼0 %–20 %), and any error crystal habit induces will therefore have minimal impact on the final retrieved τcld value.
The ORACLES data can be found at https://doi.org/10.5067/Suborbital/ORACLES/P3/2018_V1 (ORACLES Science Team, 2019). The project level archive for the CAMP2Ex project is located at: https://doi.org/10.5067/Suborbital/CAMP2EX2018/DATA001. The P-3 navigation data is located at https://doi.org/10.5067/Airborne/CAMP2Ex_MetNav_AircraftInSitu_P3_Data_1 (NASA/LARC/SD/ASDC, 2020a), the radiation data is located at https://doi.org/10.5067/Airborne/CAMP2Ex_Radiation_AircraftInSitu_P3_Data_1 (NASA/LARC/SD/ASDC, 2020b), the aerosol in situ data is located at https://doi.org/10.5067/Airborne/CAMP2Ex_Aerosol_AircraftInSitu_P3_Data_1 (NASA/LARC/SD/ASDC, 2020c).
MSN performed the analysis, collected SPN-S and SSFR data, and wrote the manuscript with input from the co-authors. JW developed the SPN-S, helped with interpretation of data, and edited the manuscript. KSS assisted with the development of the methodology, writing, and editing of the manuscript. BvD and SAS aided in development of the RD method and edited the manuscript. LDZ, ECC, and MAS collected the CAMP2Ex in situ aerosol data, helped with data interpretation, and edited the manuscript. ASK helped with collection of SSFR and SPN-S data. SEL and SB provided 4STAR data and helped with data interpretation and editing. SF collected the ORACLES in situ aerosol. JSR is the PI of the CAMP2Ex mission and helped with editing the manuscript.
At least one of the (co-)authors is a member of the editorial board of Atmospheric Measurement Technologies. The peer-review process was guided by an independent editor, and the authors also have no other competing interests to declare.
Publisher's note: Copernicus Publications remains neutral with regard to jurisdictional claims in published maps and institutional affiliations.
This article is part of the special issue “Cloud, Aerosol and Monsoon Processes Philippines Experiment (CAMP2Ex) (ACP/AMT inter-journal SI)”. It is not associated with a conference.
This research has been supported by the National Aeronautics and Space Administration (grant no. 80NSSC18K0146).
This paper was edited by Jing Wei and reviewed by two anonymous referees.
Anderson, G., Clough, S., Kneizys, F., Chetwynd, J., and Shettle, E: AFGL atmospheric constituent profiles (0–120 km), Tech. Rep. AFGL-TR-86-0110, Air Force Geophys. Lab., Hanscom Air Force Base, Bedford, Mass., https://apps.dtic.mil/sti/pdfs/ADA175173.pdf (last access: 22 February 2022), 1986.
Ångström, A.: On the atmospheric transmission of sun radiation and on dust in the air, Geogr. Ann., 11, 156–166, 1929.
Badosa, J., Wood, J., Blanc, P., Long, C. N., Vuilleumier, L., Demengel, D., and Haeffelin, M.: Solar irradiances measured using SPN1 radiometers: uncertainties and clues for development, Atmos. Meas. Tech., 7, 4267–4283, https://doi.org/10.5194/amt-7-4267-2014, 2014.
Bennet, R.: NSRC Meteorological and Navigation (MetNav) User Guide, available at: https://www-air.larc.nasa.gov (last access: 14 February 2022), 2020.
Bodhaine, B. A., Wood, N. B., Dutton, E. G., and Slusser, J. R.: On Rayleigh optical depth calculations, J. Atmos. Ocean. Tech., 16, 1854–1861, 1999.
Bohren, C. F. and Clothiaux, E. E.: Fundamentals of Atmospheric Radiation, Wiley-VCH, Berlin, https://doi.org/10.1002/9783527618620, 2006.
Bohren, C. F. and Huffman, D. R.: Absorption and scattering of light by small particles, second edn., Wiley, ISBN 978-0-471-29340-8, 1998.
Chew, B. N., Campbell, J. R., Reid, J. S., Giles, D. M., Welton, E. J., Salinas, S. V., and Liew, S. C.: Tropical cirrus cloud contamination in sun photometer data, Atmos. Environ., 45, 6724–6731, https://doi.org/10.1016/j.atmosenv.2011.08.017, 2011.
Cochrane, S. P., Schmidt, K. S., Chen, H., Pilewskie, P., Kittelman, S., Redemann, J., LeBlanc, S., Pistone, K., Kacenelenbogen, M., Segal Rozenhaimer, M., Shinozuka, Y., Flynn, C., Platnick, S., Meyer, K., Ferrare, R., Burton, S., Hostetler, C., Howell, S., Freitag, S., Dobracki, A., and Doherty, S.: Above-cloud aerosol radiative effects based on ORACLES 2016 and ORACLES 2017 aircraft experiments, Atmos. Meas. Tech., 12, 6505–6528, https://doi.org/10.5194/amt-12-6505-2019, 2019.
Cochrane, S. P., Schmidt, K. S., Chen, H., Pilewskie, P., Kittelman, S., Redemann, J., LeBlanc, S., Pistone, K., Segal Rozenhaimer, M., Kacenelenbogen, M., Shinozuka, Y., Flynn, C., Ferrare, R., Burton, S., Hostetler, C., Mallet, M., and Zuidema, P.: Biomass burning aerosol heating rates from the ORACLES (ObseRvations of Aerosols above CLouds and their intEractionS) 2016 and 2017 experiments, Atmos. Meas. Tech., 15, 61–77, https://doi.org/10.5194/amt-15-61-2022, 2022.
Dai, G., Wu, S., Song, X., and Liu, L.: Optical and Geometrical Properties of Cirrus Clouds over the Tibetan Plateau Measured by LiDAR and Radiosonde Sounding during the Summertime in 2014, Remote Sens., 11, 302, https://doi.org/10.3390/rs11030302, 2019.
di Sarra, A., Sferlazzo, D., Meloni, D., Anello, F., Bommarito, C., Corradini, S., De Silvestri, L., Di Iorio, T., Monteleone, F., Pace, G., Piacentino, S., and Pugnaghi, S.: Empirical correction of multifilter rotating shadowband radiometer (MFRSR) aerosol optical depths for the aerosol forward scattering and development of a long-term integrated MFRSR-Cimel dataset at Lampedusa, Appl. Opt., 54, 2725–2737, https://doi.org/10.1364/ao.54.002725, 2015.
Diskin, G. S., Podolske, J. R., Sachse, G. W., and Slate, T. A.: Open-Path Airborne Tunable Diode Laser Hygrometer, in: Diode Lasers and Applications in Atmospheric Sensing, edited by: Fried, A., SPIE Proceedings, 4817, 196–204, https://doi.org/10.1117/12.453736, 2002.
Dunagan, S., Johnson, R., Zavaleta, J., Russell, P., Schmid, B., Flynn, C., Redemann, J., Shinozuka, Y., Livingston, J., and Segal Rozenhaimer, M.: Spectrometer for Sky-Scanning Sun-Tracking Atmospheric Research (4STAR): Instrument Technology, Remote Sens., 5, 3872–3895, https://doi.org/10.3390/rs5083872, 2013.
Eck, T. F., Holben, B. N., Reid, J. S., Dubovic, O., Smirnov, A., O'Neil, N. T., Slutsker, I., and Kinne, S.: Wavelength dependence of the optical depth of biomass burning, urban, and desert dust aerosols, J. Geophys. Res., 104, 31333–31349, 1999.
Emde, C., Buras-Schnell, R., Kylling, A., Mayer, B., Gasteiger, J., Hamann, U., Kylling, J., Richter, B., Pause, C., Dowling, T., and Bugliaro, L.: The libRadtran software package for radiative transfer calculations (version 2.0.1), Geosci. Model Dev., 9, 1647–1672, https://doi.org/10.5194/gmd-9-1647-2016, 2016.
Fu, Q.: A New Parameterization of an Asymmetry Factor of Cirrus Clouds for Climate Models, J. Atmos. Sci., 64, 4140–4150, 2007.
Garrett, T. J. and Zhao, C.: Ground-based remote sensing of thin clouds in the Arctic, Atmos. Meas. Tech., 6, 1227–1243, https://doi.org/10.5194/amt-6-1227-2013, 2013.
Giannakaki, E., Balis, D. S., Amiridis, V., and Kazadzis, S.: Optical and geometrical characteristics of cirrus clouds over a Southern European lidar station, Atmos. Chem. Phys., 7, 5519–5530, https://doi.org/10.5194/acp-7-5519-2007, 2007.
Herman, B., Browning, R., and De Luisi, J.: Determination of the effective imaginary term of the complex refractive index of atmospheric dust by remote sensing: The diffuse-direct radiation method, J. Atmos. Sci., 32, 918–925, 1975.
Heymsfield, A. J., Krämer, M., Luebke, A., Brown, P., Cziczo, D. J., Franklin, C., Lawson, P., Lohmann, U., McFarquhar, G., Ulanowski, Z., and Van Tricht, K.: Cirrus Clouds, Meteorol. Monogr., 58, 2.1–2.26, https://doi.org/10.1175/AMSMONOGRAPHS-D-16-0010.1, 2017.
Hilario, M. R. A., Crosbie, E., Shook, M., Reid, J. S., Cambaliza, M. O. L., Simpas, J. B. B., Ziemba, L., DiGangi, J. P., Diskin, G. S., Nguyen, P., Turk, F. J., Winstead, E., Robinson, C. E., Wang, J., Zhang, J., Wang, Y., Yoon, S., Flynn, J., Alvarez, S. L., Behrangi, A., and Sorooshian, A.: Measurement report: Long-range transport patterns into the tropical northwest Pacific during the CAMP2Ex aircraft campaign: chemical composition, size distributions, and the impact of convection, Atmos. Chem. Phys., 21, 3777–3802, https://doi.org/10.5194/acp-21-3777-2021, 2021.
Holben, B. N., Eck, T. F., Slutsker, I., Tanré, D., Buis, J. P., Setzer, A., Vermote, E., Reagan, J. A., Kaufman, Y. J., Nakajima, T., Lavenu, F., Jankowiak, I., and Smirnov, A.: AERONET – A Federated Instrument Network and Data Archive for Aerosol Characterization, Remote Sens. Environ., 66, 1, https://doi.org/10.1016/S0034-4257(98)00031-5, 1998.
Hong, Y., et al.: Cirrus cloud radiative properties as observed during the CAMP2Ex mission, in preparation, 2022.
Kassianov, E. I., Flynn, C. J., Ackerman, T. P., and Barnard, J. C.: Aerosol single-scattering albedo and asymmetry parameter from MFRSR observations during the ARM Aerosol IOP 2003, Atmos. Chem. Phys., 7, 3341–3351, https://doi.org/10.5194/acp-7-3341-2007, 2007.
Kinne, S., Akerman, T. P., Shiobara, M., Uchiyama, A., Heymsfield, A. J., Miloshevich, L., Wendell, J., Eloranta, E., Purgold, C., and Bergstrom, R. W.: Cirrus cloud radiative and microphysical properties from ground observations and in situ measurements during FIRE 1991 and their application to exhibit problems in cirrus solar radiative transfer modeling, J. Atmos. Sci., 54, 2320–2344, https://doi.org/10.1175/1520-0469(1997)054<2320:CCRAMP>2.0.CO;2, 1997.
Kox, S., Bugliaro, L., and Ostler, A.: Retrieval of cirrus cloud optical thickness and top altitude from geostationary remote sensing, Atmos. Meas. Tech., 7, 3233–3246, https://doi.org/10.5194/amt-7-3233-2014, 2014.
Kremser, S., Thomason, L. W., von Hobe, M., Hermann, M., Deshler, T., Timmreck, C., Toohey, M., Stenke, A., Schwarz, J. P., Weigel, R., Fueglistaler, S., Prata, F. J., Vernier, J.-P., Schlager, H., Barnes, J. E., Antuña-Marrero, J.-C., Fairlie, D., Palm, M., Mahieu, E., Notholt, J., Rex, M., Bingen, C., Vanhellemont, F. Bourassa, A., Plane, J. M. C., Klocke, D., Carn, S. A., Clarisse, L., Trickl, T., Neely, R., James, A. D., Rieger, L., Wilson, J. C., and Meland, B.: Stratospheric aerosol – Observations, processes, and impact on climate, Rev. Geophys., 54, 278–335, https://doi.org/10.1002/2015RG000511, 2016.
Kurucz, R. L.: Synthetic Infrared Spectra, in: Infrared Solar Physics, edited by: Rabin, D. M., Jefferies, J. T., and Lindsey, C., 154, 523–531, IAU Symposium, 2–6 March 1992, Tucson, Arizona, USA, https://adsabs.harvard.edu/full/1994IAUS..154..523K (last access: 22 February 2022), 1994.
LeBlanc, S. E., Redemann, J., Flynn, C., Pistone, K., Kacenelenbogen, M., Segal-Rosenheimer, M., Shinozuka, Y., Dunagan, S., Dahlgren, R. P., Meyer, K., Podolske, J., Howell, S. G., Freitag, S., Small-Griswold, J., Holben, B., Diamond, M., Wood, R., Formenti, P., Piketh, S., Maggs-Kölling, G., Gerber, M., and Namwoonde, A.: Above-cloud aerosol optical depth from airborne observations in the southeast Atlantic, Atmos. Chem. Phys., 20, 1565–1590, https://doi.org/10.5194/acp-20-1565-2020, 2020.
Lee, J., Hsu, N. C., Bettenhausen, C., and Sayer, A. M.: Retrieval of aerosol optical depth under thin cirrus from MODIS: Application to an ocean algorithm, J. Geophys. Res.-Atmos., 118, 10111–10124, https://doi.org/10.1002/jgrd.50806, 2013.
Levy, R. C., Mattoo, S., Munchak, L. A., Remer, L. A., Sayer, A. M., Patadia, F., and Hsu, N. C.: The Collection 6 MODIS aerosol products over land and ocean, Atmos. Meas. Tech., 6, 2989–3034, https://doi.org/10.5194/amt-6-2989-2013, 2013.
Long, C. N., Bucholtz, A., Jonsson, H., Schmid, B., Vogelmann, A., and Wood, J.: A Method of Correcting for Tilt from Horizontal in Downwelling Shortwave Irradiance Measurements on Moving Platforms, The Open Atmospheric Science Journal, 4, 78–87, 2010.
McNaughton, C. S., Clarke, A. D., Howell, S. G., Pinkerton, M., Anderson, B. E., Thornhill, L., Hudgins, C., Winstead, E., Dibb, J. E., Scheuer, E., and Maring, H.: Results from the DC-8 Inlet Characterization Experiment (DICE): Airborne versus surface sampling of mineral dust and sea salt aerosols, Aerosol Sci. Technol., 41, 136–159, https://doi.org/10.1080/02786820601118406, 2007.
Michalsky, J., Denn, F., Flynn, C., Hodges, G., Kiedron, P., Koontz, A., Schlemmer, J., and Schwartz, S. E.: Climatology of aerosol optical depth in north-central Oklahoma: 1992–2008, J. Geophys. Res., 115, D07203, https://doi.org/10.1029/2009JD012197, 2010.
NASA/LARC/SD/ASDC: CAMP2Ex P-3 In-Situ Meteorological and Navigational Data, NASA Langley Atmospheric Science Data Center DAAC [data set], https://doi.org/10.5067/Airborne/CAMP2Ex_MetNav_AircraftInSitu_P3_Data_1, 2020a.
NASA/LARC/SD/ASDC: CAMP2Ex In-Situ Radiation Data, NASA Langley Atmospheric Science Data Center DAAC [data set], https://doi.org/10.5067/Airborne/CAMP2Ex_Radiation_AircraftInSitu_P3_Data_1, 2020b.
NASA/LARC/SD/ASDC: CAMP2Ex P-3 In-Situ Aerosol Data, NASA Langley Atmospheric Science Data Center DAAC [data set], https://doi.org/10.5067/Airborne/CAMP2Ex_Aerosol_AircraftInSitu_P3_Data_1, 2020c.
O'Neill, N. T., Eck, T. F., Smirnov, A., Holben, B. N., and Thulasiraman, S.: Spectral discrimination of coarse and fine mode optical depth, J. Geophys. Res.-Atmos., 108, 4559, https://doi.org/10.1029/2002jd002975, 2003.
ORACLES Science Team: Suite of Aerosol, Cloud, and Related Data Acquired Aboard P3 During ORACLES 2018, Version 1, NASA Ames Earth Science Project Office (ESPO), Moffett Field, CA [data set], https://doi.org/10.5067/Suborbital/ORACLES/P3/2018_V1, 2019.
Pierluissi, J. H. and Peng, G.: New molecular transmission band models for LOWTRAN, Opt. Eng., 24, 541–547, https://doi.org/10.1117/12.7973523, 1985.
Pilewskie, P., Pommier, J., Bergstrom, R., Gore, W., Howard, S., Rabbette, M., Schmid, B., Hobbs, P. V., and Tsay, S. C.: Solar spectral radiative forcing during the Southern African Regional Science Initiative, J. Geophys. Res., 108, 8486, https://doi.org/10.1029/2002JD002411, 2003.
Redemann, J., Wood, R., Zuidema, P., Doherty, S. J., Luna, B., LeBlanc, S. E., Diamond, M. S., Shinozuka, Y., Chang, I. Y., Ueyama, R., Pfister, L., Ryoo, J.-M., Dobracki, A. N., da Silva, A. M., Longo, K. M., Kacenelenbogen, M. S., Flynn, C. J., Pistone, K., Knox, N. M., Piketh, S. J., Haywood, J. M., Formenti, P., Mallet, M., Stier, P., Ackerman, A. S., Bauer, S. E., Fridlind, A. M., Carmichael, G. R., Saide, P. E., Ferrada, G. A., Howell, S. G., Freitag, S., Cairns, B., Holben, B. N., Knobelspiesse, K. D., Tanelli, S., L'Ecuyer, T. S., Dzambo, A. M., Sy, O. O., McFarquhar, G. M., Poellot, M. R., Gupta, S., O'Brien, J. R., Nenes, A., Kacarab, M., Wong, J. P. S., Small-Griswold, J. D., Thornhill, K. L., Noone, D., Podolske, J. R., Schmidt, K. S., Pilewskie, P., Chen, H., Cochrane, S. P., Sedlacek, A. J., Lang, T. J., Stith, E., Segal-Rozenhaimer, M., Ferrare, R. A., Burton, S. P., Hostetler, C. A., Diner, D. J., Seidel, F. C., Platnick, S. E., Myers, J. S., Meyer, K. G., Spangenberg, D. A., Maring, H., and Gao, L.: An overview of the ORACLES (ObseRvations of Aerosols above CLouds and their intEractionS) project: aerosol–cloud–radiation interactions in the southeast Atlantic basin, Atmos. Chem. Phys., 21, 1507–1563, https://doi.org/10.5194/acp-21-1507-2021, 2021.
Remer, L. A., Mattoo, S., Levy, R. C., Heidinger, A., Pierce, R. B., and Chin, M.: Retrieving aerosol in a cloudy environment: aerosol product availability as a function of spatial resolution, Atmos. Meas. Tech., 5, 1823–1840, https://doi.org/10.5194/amt-5-1823-2012, 2012.
Reid, J., et al.: An overview of the Cloud, Aerosol and Monsoon Processes Philippines Experiment (CAMP2Ex) mission, in preparation, 2022.
Sassen, K., Wang, Z., and Liu, D.: Global distribution of cirrus clouds from CloudSat/Cloud-Aerosol Lidar and Infrared Pathfinder Satellite Observations (CALIPSO) measurements, J. Geophys. Res., 113, D00A12, https://doi.org/10.1029/2008JD009972, 2008.
Segal-Rosenheimer, M., Russell, P. B., Livingston, J. M., Ramachandran, S., Redemann, J., and Baum, B. A.: Retrieval of cirrus properties by Sun photometry: A new perspective on an old issue, J. Geophys. Res.-Atmos., 118, 4503–4520, 2013.
Smirnov, A., Holben, B., Eck, T., Dubovik, O., and Slutsker, I.: Cloud-Screening and Quality Control Algorithms for the AERONET Database, Remote Sens. Environ., 73, 337–349, https://doi.org/10.1016/S0034-4257(00)00109-7, 2000.
Smirnov, A., Zhuravleva, T. B., Segal-Rozenhaimer, M., and Holben, B. N.: Limitations of AERONET SDA product in presence of cirrus clouds, J. Quant. Spectrosc. Ra., 206, 338–341, https://doi.org/10.1016/j.jqsrt.2017.12.007, 2018.
Spencer, R. S., Levy, R. C., Remer, L. A., Mattoo, S., Arnold, G. T., Hlavka, D. L., Meyer, K. G., Marshak, A., Wilcox E. M., and Platnick, S. E.: Exploring aerosols near clouds with high-spatial-resolution aircraft remote sensing during SEAC4RS, J. Geophys. Res.-Atmos., 124, 2148–2173, https://doi.org/10.1029/2018JD028989, 2019.
Stamnes, K., Tsay, S. C., Wiscombe, W., and Laszlo, I.: DISORT, a General-Purpose Fortran Program for Discrete-Ordinate-Method Radiative Transfer in Scattering and Emitting Layered Media: Documentation of Methodology, Tech. rep., Dept. of Physics and Engineering Physics, Stevens Institute of Technology, Hoboken, NJ, USA, http://www.libradtran.org/lib/exe/fetch.php?media=disortreport1.1.pdf (last access: 14 Febuary 2022), 2000.
Stamnes, S., Hostetler, C., Ferrare, R., Burton, S., Liu, X.,Hair, J., Hu, Y., Wasilewski, A., Martin, W., van Diedenhoven, B., Chowdhary, J., Cetinic, I., Berg, L. K., Stamnes, K., and Cairns, B.: Simultaneous polarimeter retrievals of microphysical aerosol and ocean color parameters from the MAPP algorithm with comparison to high-spectral-resolution lidar aerosol and ocean products, Appl. Optics, 57, 2394–2413, https://doi.org/10.1364/AO.57.002394, 2018.
Torres, O., Bhartia, P. K., Herman, J. R., Sinyuk, A., Ginoux, P., and Holben, B.: A long-term record of aerosol optical depth from TOMS observations and comparison to AERONET measurements, J. Atmos. Sci., 59, 398–413, https://doi.org/10.1175/1520-0469(2002)059<0398:ALTROA>2.0.CO;2, 2002.
Werner, F., Siebert, S., Pilewskie, P., Shaw, R. A., and Wendisch, M.: New airborne retrieval approach for trade wind cumulus properties under overlying cirrus, J. Geophys. Res.-Atmos., 118, 3634–3649, https://doi.org/10.1002/jgrd.50334, 2013.
Wood, J., Smyth, T. J., and Estellés, V.: Autonomous marine hyperspectral radiometers for determining solar irradiances and aerosol optical properties, Atmos. Meas. Tech., 10, 1723–1737, https://doi.org/10.5194/amt-10-1723-2017, 2017.
Yang, P., Bi, L., Baum, B. A., Liou, K.-N., Kattawar, G., and Mishchenko, M.: Spectrally consistent scattering, absorption, and polarization properties of atmospheric ice crystals at wavelengths from 0.2 µm to 100 µm, J. Atmos. Sci., 70, 330–347, https://doi.org/10.1175/JAS-D-12-039.1, 2013.
Yang, Y., Zhao, C., Sun, L., and Wei, J.: Improved aerosol retrievals over complex regions using NPP Visible Infrared Imaging Radiometer Suite observations, Earth Space Sci., 6, 629–645, https://doi.org/10.1029/2019ea000574, 2019.
Zhou, Y., Sun, X., Mielonen, T., Li, H., Zhang, R., Li, Y., and Zhang, C.: Cirrus cloud optical thickness and effective diameter retrieved by MODIS: Impacts of single habit assumption, 3-D radiative effects, and cloud inhomogeneity, J. Geophys. Res.-Atmos., 123, 1195–1210, https://doi.org/10.1002/2017JD027232, 2018.
Ziemba, L. D., Hudgins, C. H., Obland, M. D., Rogers, R. R., Scarino, A. J., Winstead, E. L., Anderson, B. E., Thornhill, K. L., Ferrare, R., Barrick, J., Beyersdorf, A. J., Chen, G., Crumeyrolle, S., Hair, J., and Hostetler, C. A.: Airborne observations of aerosol extinction by in-situ and remote-sensing techniques: Evaluation of particle hygroscopicity, Geophys. Res. Lett., 40, 417–422, https://doi.org/10.1029/2012GL054428, 2013.
Zou, L., Griessbach, S., Hoffmann, L., Gong, B., and Wang, L.: Revisiting global satellite observations of stratospheric cirrus clouds, Atmos. Chem. Phys., 20, 9939–9959, https://doi.org/10.5194/acp-20-9939-2020, 2020.