the Creative Commons Attribution 4.0 License.
the Creative Commons Attribution 4.0 License.
 | 25 Mar 2022
LED-based solar simulator to study photochemistry over a wide temperature range in the large simulation chamber AIDA
Magdalena Vallon
Linyu Gao
Feng Jiang
Bianca Krumm
Jens Nadolny
Junwei Song
Thomas Leisner
A light source has been built at the AIDA (Aerosol Interactions and Dynamics in the Atmosphere) simulation chamber at the Karlsruhe Institute of Technology, simulating solar radiation at ground level. Instead of full spectra light sources, it uses a combination of LEDs with a narrow emission spectrum, resulting in a combined spectrum similar to the solar spectrum between 300 and 530 nm. The use of LEDs leads to an energy-efficient, robust and versatile illumination concept. The light source can be used over a wide temperature range down to −90 ∘C and is adjustable in intensity and spectral width as well as easily adjustable to new technological developments or scientific needs. Characterization of the illumination conditions shows a vertical intensity gradient in the chamber. The integral intensity corresponds to a NO2 photolysis frequency j(NO2) of ( s−1 for temperatures between 213 and 295 K. At constant temperature, the light intensity is stable within ±1 %. While the emissions of the different LEDs change with temperature, they can be adjusted, and thus it is possible to adapt the spectrum for different temperatures. Although the illumination of the simulation chamber leads to an increase of 0.7 K h−1 of the mean gas temperature, it is possible to perform experiments with aqueous droplets at relative humidities up to ≤95 % and also above water or ice saturation with corresponding clouds. Additionally, temperature- and wavelength-dependent photolysis experiments with 2,3-pentanedione have been conducted. The photolysis of 2,3-pentanedione occurs mainly between 400 and 460 nm, resulting in a mean photolysis frequency of ( s−1 independent of temperature in the range 213–298 K with a quantum yield of 0.36±0.04. In contrast, the yield of the two main photolysis products, acetaldehyde and formaldehyde, decreases with temperature. Furthermore, the light source was applied to study the photochemistry of aerosol particles. For the atmospheric brown carbon proxy compound 3,5-diacetyl-2,4,6-trimethyl-1,4-dihydropyridine, photochemical reaction products were identified. In aerosol particles containing iron oxalate as a photosensitizer, the photosensitized degradation of organic acids (pinic and pinonic acid) was studied. Although the light source only generates about one-third of the maximum solar irradiation at ground level at Karlsruhe (49.007∘ N, 8.404∘ E; 12:00 UTC+2) on a clear summer day with a substantial intensity gradient throughout the simulation chamber, it could be shown that this type of light source allows reproducible experiments over a wide range of simulated atmospheric conditions and with a large flexibility and control of the irradiation spectrum.
- Article
(2517 KB) - Full-text XML
-
Supplement
(2006 KB) - BibTeX
- EndNote


The interaction of light with the atmosphere is an important factor in understanding the physical and chemical processes influencing air quality and our climate. Alongside direct radiative effects, the interaction with clouds and aerosols, a mixture of either solid or liquid particles with gas, is significant. From a chemical viewpoint, light enables, besides the thermodynamic, photochemical pathways by specific electronic excitation of the molecules. This leads to a multitude of reaction pathways, which without light would not be possible. Various photochemical reactions like the formation of ozone and OH radicals or the fragmentation of halocarbon compounds have been studied widely in the last few decades, now offering a good understanding for many photochemical reactions of atmospheric relevance. However, for many of the multiple organic compounds in the atmosphere, additional research is still needed (Goldstein and Galbally, 2007). The lack of a proper understanding of the influence of such compounds can also be seen in the high uncertainty of interaction of aerosols with light in the ICCP report (Stocker et al., 2013).
In principle, photochemical reactions in the atmosphere can not only be categorized as inorganic and organic processes, but also if they take place in the gas or particle phase. Some substances are even only able to absorb in the ultraviolet to visible (UV-Vis) or enlarge their absorption cross section considerably by adsorbing at particles, thus breaking the symmetry of their molecule orbitals (Navea and Grassian, 2018). A well-studied example is the chemisorption of NO3− to Al2O3 surfaces and subsequent photolytic reaction to NO2 (Baltrusaitis et al., 2007; Rubasinghege and Grassian, 2009). However, molecules do not have to fragment directly: especially more complex organic molecules can absorb the photon and transfer the excess energy to surrounding molecules, leading to an enhanced fragmentation of substances which cannot absorb photons in the respective wavelength range themselves. Such molecules are called photosensitizers (Herrmann et al., 2015; George et al., 2015). In seawater, chlorophyll and humic acids take on this role. At the sea surface chlorophyll absorbs photons and reduces Cl− to the reactive Cl atoms (Reeser et al., 2009), and isoprene is produced from nonanoic acids under the influence of humic acids (Ciuraru et al., 2015). Also, aldehydes, acids (Rossignol et al., 2014; Monge et al., 2012; Aregahegn et al., 2013; Fu et al., 2015), metals and metal oxides have been shown to act as photosensitizers in atmospherically relevant processes (overviews regarding the latter two can be found in Herrmann et al., 2015, and George et al., 2015). By an increase in oxidation through solar irradiation, more compounds with a low vapour pressure are likely to be formed also in the gas phase, thus forming new particles or condensing on existing particles. Consequently, light contributes not only to the aging, but also to the formation of new particles, increasing particle phase and consequently reactions which are only possible in the liquid or solid phase (Navea and Grassian, 2018). A lack of proper research methods to simulate atmospheric photochemistry therefore underestimates the formation of various, possibly harmful, components.
Apart from field measurements, controlled experiments in cloud simulation chambers offer the possibility of understanding the atmospheric processes. One of these simulations chambers is the AIDA (Aerosol Interactions and Dynamics in the Atmosphere) chamber at the Institute of Meteorology and Climate Research at the Karlsruhe Institute of Technology (KIT). It is one of the largest atmospheric simulation chambers with a solid chamber wall, allowing temperatures down to −90 ∘C as well as cloud formation by adiabatic expansion (Möhler et al., 2003; Saathoff et al., 2003). The volume and temperature stability offers the possibility of long-term experiments with aerosols. Until now it did not have the possibility of simulating solar irradiation, however, and as it has a solid aluminium casing, it cannot use natural sunlight like the Teflon chambers SAPHIR in Jülich (Bohn and Zilken, 2005; Rohrer et al., 2005), EUPHORE in Valencia (Wiesen, 2001; Zádor et al., 2006) or HELIOS in Orléans (Ren et al., 2017). To simulate some aspects of the atmospheric chemistry processes, it is possible to generate ozone or OH radicals without a light source. However, this only allows us to simulate a limited part of atmospheric photochemistry. Other similar chambers have solved this issue by using either xenon arc lamps (CESAM chamber; Wang et al., 2011), fluorescent tubes or black light (PACS-C3: Platt et al., 2013; Fankhauser et al., 2020) or single-wavelength LEDs (CLOUD chamber: Lehtipalo et al., 2018). LEDs and fluorescent tubes have the advantages that they are easy to use, emit less heat and are relatively cost-efficient. Nevertheless, they do not emit in the full spectral range of the photochemically relevant spectrum, which should start at around 300 nm depending on the atmospheric height (solar spectrum; see Fig. S1 in the Supplement) and reach at least 500 nm to include photochemical reactions of chromophores found in organic matter (Sharpless and Blough, 2014). High-pressure xenon arc lamps on the other hand emit a spectrum similar to the solar spectrum with high intensities. However, they are difficult to handle due to their size and the risk of imploding light bulbs. Additionally, the spectrum is often too broad, making it necessary to apply filters, blocking part of the UV and IR radiation (Wang et al., 2011). So, none of these solutions was favourable for the illumination of the AIDA chamber.
In the following we will describe the implementation of a newly designed light source for the AIDA chamber as well as the spectral characterization and photochemical characterization by the photolysis of NO2. Additionally, the results of temperature- and wavelength-dependent photolysis experiments of 2,3-pentanedione will be presented, and a first insight will be given into the photochemical aging of a brown carbon proxy and photosensitized decomposition of atmospherically relevant organic acids.
2.1 AIDA aerosol and cloud simulation chamber
The AIDA simulation chamber at KIT is designed to simulate atmospheric conditions in the temperature range of −90 to +60 ∘C. It is comprised of an aluminium cylinder with a 4 m inner diameter and a torispherical head and bottom, resulting in a 7.5 m-high chamber with a volume of 84.5 m3 and an inner surface area of 103 m2 (Saathoff et al., 2009). To recreate different atmospheric pressures and to facilitate the cleaning of the chamber, the pressure inside the vessel can be adjusted between 0.01 and 1500 hPa. Various flanges and lances are implemented and allow the addition of synthetic air, chemicals or aerosols as well as the mounting of different measurement instruments. Typical sampling tubes range 400 mm into the well-mixed volume of the AIDA chamber. By rotating with 400 revolutions per minute, a fan inside the chamber ensures homogeneous dispersion of all components in less than 2 min during all experiments described in this paper. A more detailed description of the chamber can be found in Wagner et al. (2006), Saathoff et al. (2003), and Müller et al. (2012).
2.2 Instrumentation
For the spectral measurements three different UV-Vis spectrometers were used. For continuous monitoring during the experiments a UV-Vis spectrometer (CCS200-Thorlabs) is connected via an optical fibre to the AIDA bottom looking inside the chamber via an off-axis parabolic mirror and through a quartz window. For the spatially resolved measurements inside the chamber, two calibrated UV-Vis spectrometers with diffusor heads were used (SR900HS, Opsytec; LI-1800 LICOR). Please note that the spectra measured with the fibre-coupled spectrometer show a bias compared to the calibrated ones, essentially significantly underestimating the UV wavelengths.
The concentrations of the trace gases were measured with different gas sensors. For nitrogen dioxide the cavity phase shift NO2 Analyzer (AS32M Environment S. A.), for nitrogen oxide the chemiluminescence NO analyser (CLD 77AM Eco Physics) and for ozone the UV photometric ozone monitor (O341M Environment S. A.) were used. All of these gas sensors are connected to the chamber through fluorinated ethylene propylene (FEP) tubes.
For the concentration measurements of 2,3-pentanedione and its reaction products, a proton transfer mass spectrometer (PTR-TOF-MS 4000, Ionicon, hereafter PTR-MS) was connected via SilcoNert coated stainless tubes to the AIDA chamber, measuring the gas phase continuously. The PTR-MS is a time-of-flight mass spectrometer, ionizing organic components by transferring a proton from H3O+ to the analyte (Romano et al., 2015; Yuan et al., 2017). Furthermore, the PTR-MS coupled with the particle inlet of CHARON (Chemical Analysis of Aerosol Online) can be alternatively switched between particle and gas phase for the particle-phase measurement of semi-volatile compounds. In addition, a chemical ionization mass spectrometer (HR-ToF-CIMS, Aerodyne Inc., hereafter CIMS) ionizing with iodide (I−) with high sensitivity for highly oxidized organic molecules. Its FIGAERO (Filter Inlet for Gases and AEROsols) attachment allows the sampling of aerosol particles on Teflon filters, the subsequent heating of the filters to 200 ∘C to evaporate the particle-phase components into the gas phase, and detection by the CIMS (Lopez-Hilfiker, 2014). To ensure gas-phase analysis at the chamber throughout the experiments, aerosol filters were taken separately, stored at −20 ∘C in individual containers and analysed as soon as the experiments were completed.
2.3 Experimental procedures
For all photochemical experiments the chamber was cleaned by evacuating and flushing repeatedly with synthetic air and ozone. Afterwards it was filled with a defined amount of water vapour and synthetic air (21 % O2, 79 % N2) generated by evaporating liquid nitrogen (class 2.2 (C/E), AirProducts) and liquid oxygen (4.8–99.998 vol %, Basi).
For the NO2-photolysis experiments, 40–70 ppb of NO2 (1000.3 ppm NO2 2.5 in N2 5.0, Basi) was added to the chamber and illuminated for 40 min. The light source was operated at the highest intensity possible for every temperature.
For the photolysis of 2,3-pentanedione, 66–71 ppb and in one case 20 ppb of 2,3-pentanedione were added to the chamber either to the pure synthetic air or after a photochemical experiment with NO2. For the temperature-dependent photolysis experiments the light source was used at the same intensity for each temperature as for the corresponding temperature in the photolysis of NO2, illuminating for 60–65 min. Additionally, 2,3-pentanedione was irradiated for intervals of 15 min using a different range of wavelengths for every interval.
For the photolysis of the brown carbon proxy, two solutions were prepared, each containing NH4NO3, (NH4)2SO4 and 3,5-diacetyl-2,4,6-trimethyl-1,4-dihydropyridine (hereafter DTDP). One solution contained a commercial DTDP (Sigma-Aldrich, 97 %) (2.00 g l−1 NH4NO3, 1.221 g l−1 (NH4)2SO4, 1.11 g l−1 DTDP); for the second solution the DTDP was prepared in the laboratory by using acetaldehyde (44.34 g l−1, Acros Organics 99,5 %), 2,4-pentanedione (100.22 g l−1, Alfa Aesar 99 %) and (NH4)2SO4 (132.16 g l−1) according to Kampf et al. (2016). In this way the atmospheric processes leading to the formation of the brown carbon proxy were imitated, and potential by-products would also appear in the solution. The solutions were nebulized into the chamber using an ultrasonic nebulizer (Synaptec) and illuminated for 120 min.
To mimic photosensitized decomposition of organic acids, a solution of NH4NO3, iron oxalate (C6Fe2O12, Sigma-Aldrich) as the photosensitizer and pinonic (Acros Organics 98 %) and pinic acid (∼95 % synthesized by the University of Frankfurt) as atmospherically relevant organic acids was nebulized in the chamber and illuminated twice, each time for 1 h. As a reference the experiment was repeated with a solution of oxalic acid, pinonic acid and NH4NO3. A detailed overview of the concentrations and experimental characteristics can be found in the Supplement (Table S1).
The design criteria for the light source for the AIDA chamber were the following. (1) The spectrum of the light source should allow us to mimic the solar spectrum in the troposphere but should be variable in intensity and wavelength range to allow simulation of different atmospheric heights as well as wavelength-specific photolysis experiments. (2) The light source should affect the temperature homogeneity and the leak tightness of the chamber as little as possible. It should work in the temperature range from 303 to 183 K, be energy-efficient, be easy to handle, and maintain and improve or adapt to new technical developments. With these, classical solutions like arc lamps or fluorescent tubes were ruled out. Instead, a light source was designed by using a combination of LEDs with a small full width at half maximum (FWHM) (∼10–15 nm) and peak wavelengths from 305 to 528 nm. In total, 3000 LEDs covering 11 different wavelengths were used, leaving out the longer wavelengths above 530 nm. All the LEDs were tested beforehand to ensure their functionality at temperatures down to 183 K, and their emission spectrum regarding changes with temperature and operating with different electric currents was characterized. For the most part, spectral changes regarding the electrical current were minor and can be neglected. On the other hand, temperature changes are influencing the emission spectrum substantially. In general, a shift in the peak wavelengths of up to 5 nm could be observed while changing the ambient temperature from 298 to 183 K. The intensity increased or decreased depending on the manufacturer and LED type by up to +60 % or −50 % (examples of LEDs with a wavelength of 340 and 365 nm are available in Fig. S4). For every LED type which underwent a decrease in intensity, the reduction could be counteracted by increasing the electric current at the respective temperature. To prevent degradation of the LED lenses due to aggressive chemicals, the light source was not installed inside the chamber but on top of the chamber on three aluminium heat sinks mounted above flanges with a diameter of 500 mm (Fig. 1b–d). Each flange lid contains three CF flanges (VPCF200UVQ-L, VACOM) with quartz windows (Fused Silica, Corning HPFS 7980) with a thickness of 9 mm and a diameter of 200 mm each, resulting in a total of nine windows for the light to pass through into the chamber (see Fig. 1a and c). The flanges are mounted at an angle of 14∘ on top of the chamber, so that the incoming light forms three conical radiation paths overlapping in the middle of the chamber. The different LED types were distributed as homogeneously as possible over the three flanges. The volume between the LEDs and the quartz windows is constantly flushed with dry nitrogen (20 l min−1) during operation to avoid condensation of water and build-up of ozone, helping also with reducing the heat. To avoid unnecessary irradiation losses, stripes of eloxated aluminium mirrors (MIRO 4300UP, alanod) were installed between the windows and the LEDs and at the inner part of the 500 mm flanges (see Fig. 1b). The cooling rate of the heat sinks ((60×60) cm2, JK 2907, Junior Kühlkörper GmbH) is enforced by five fans (8218 JH4, Ebmpapst) per heat sink, forcing the air through the gills of the heat sinks. To monitor the temperature of the LED boards, 28 temperature sensors (Pt1000) are placed on top of different boards. During operation the LED boards heat up to a maximum of 344 K at room temperature. All the electronic parts are connected to two 19 in. racks outside of the chamber isolation, containing all the necessary power supplies for the LEDs, the components to control the power supplies (cRio-9066, National Instruments), as well as the modules to process the temperature signals (NI-9226, NI-9264, NI-9476, NI-9209, NI-9221, National Instruments). A general connection scheme can be found in Fig. S2. The whole setup is controlled by a specifically written software (LabVIEW, National Instruments). It allows us to control the LED intensity for every wavelength and reads the actually flowing electric current as well as the temperatures. Maximum values for the electric current and the temperatures can be set by the user, leading to an automatic shutdown of the light source if one of these values is exceeded. The UV-Vis spectrometer (CCS200, Thorlabs) installed at the bottom of the chamber, measuring constantly the light spectrum inside the chamber, serves as an additional control mechanism to ensure constant irradiation is achieved during the experiments.
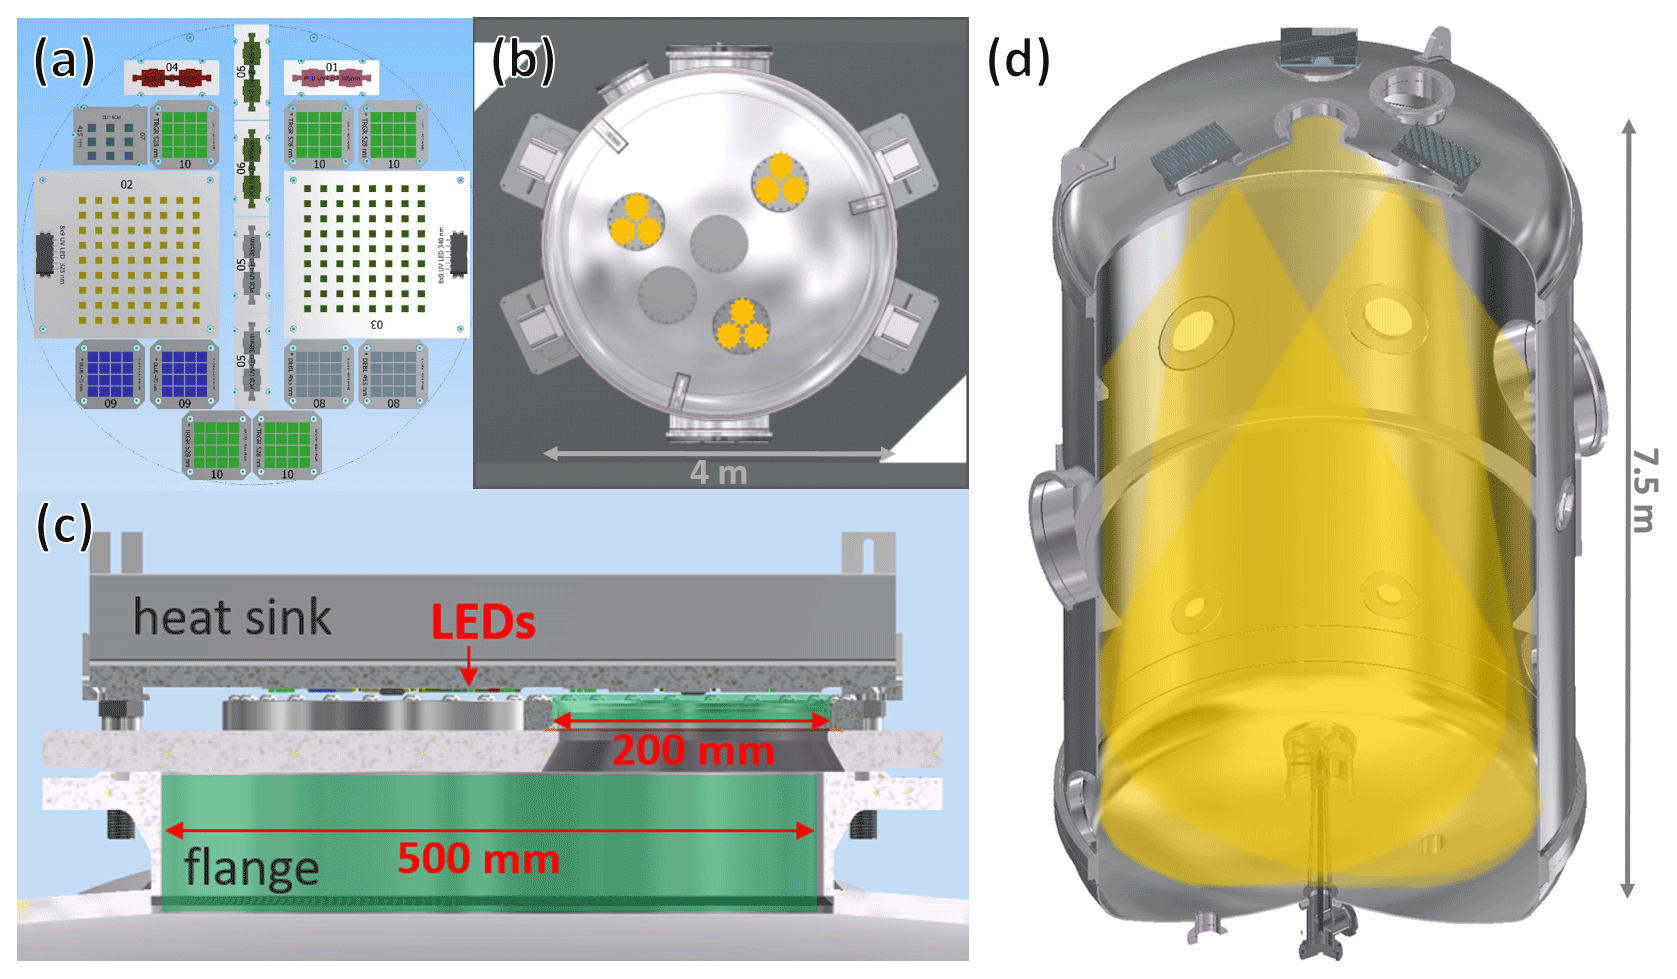
Figure 1(a) LED board placement matching one 200 mm window. (b) Three of these patches are placed on one heat sink above the 500 mm flange with three 200 mm quartz windows. (c) Placement of the flanges and the windows on top of AIDA. (d) Placement of the light source in relation to the whole AIDA with corresponding light cones.
The total radiative output of all the LEDs amounts to 1400 W; while the UV LEDs have efficiencies of only ∼2 %, the LEDs with longer wavelengths reach efficiencies of 30 % to 70 %. The optical power is distributed over the different wavelengths and over the chamber cross section. For a proper characterization of the illumination, spatially resolved spectral and integral actinometric measurements were performed.
4.1 Spectral and spatial characteristics
The combined emission of all the LEDs results in a spectrum similar but not identical to the solar spectrum at ground level. Measurements in the centre of the chamber (see Fig. 2a) show that the spectral distribution matches the solar spectrum by overlapping of the single LED spectra. Only at 357 and 440 nm are there discrepancies due to the fact that LEDs with a peak wavelength in that region and high efficiency are, to our knowledge, not yet available. The intensity and to a lesser extent the spectral distribution are dependent on the position in the chamber. Due to the conical dispersion of the light, the irradiated area increases quadratically, and the intensity of the light reduces accordingly. This effect and the absorption of light on the walls lead to strong vertical but smaller horizontal gradients in intensity. Measurements show that the light intensity in the centre of the chamber at about 1 m above ground level represents 45 % of the intensity at a height of 4 m. This can be further divided into the different parts UV-B (280–315 nm), UV-A (315–400 nm) and visible light (400–620 nm). The absorption of light with shorter wavelengths by the chamber walls and flange collar is stronger than for the light with a longer wavelength, resulting in a reduction of the UV parts in comparison to the visible part. This is also in accordance with the reflectivity of oxidized aluminium, which shows a plateau from 670 to 500 nm with a reflectance of 0.7 starting to decline to 0.65 at 350 nm (Pavlovic and Ignatiev, 1986). Please note that the aluminium wall in the AIDA chamber is oxidized. However, the reflectivity of non-oxidized aluminium, like the reflectors added to the flange collars, also decreases for wavelengths below 400 nm (Bartl and Baranek, 2004). Comparing the values of the measurements at 1 and 4 m, the UV-B at 1 m represents 32 %, the UV-A represents 43 % and the visible represents 47 % of the values at 4 m. The absorption on the walls and the overlapping of the light cones in the middle of the chamber also lead to a slight radial intensity gradient (see Fig. 2b). At 1.20 m left and right of the chamber centre at 1 m height, the light intensity is on average 86 % of the light intensity in the centre at the same height.
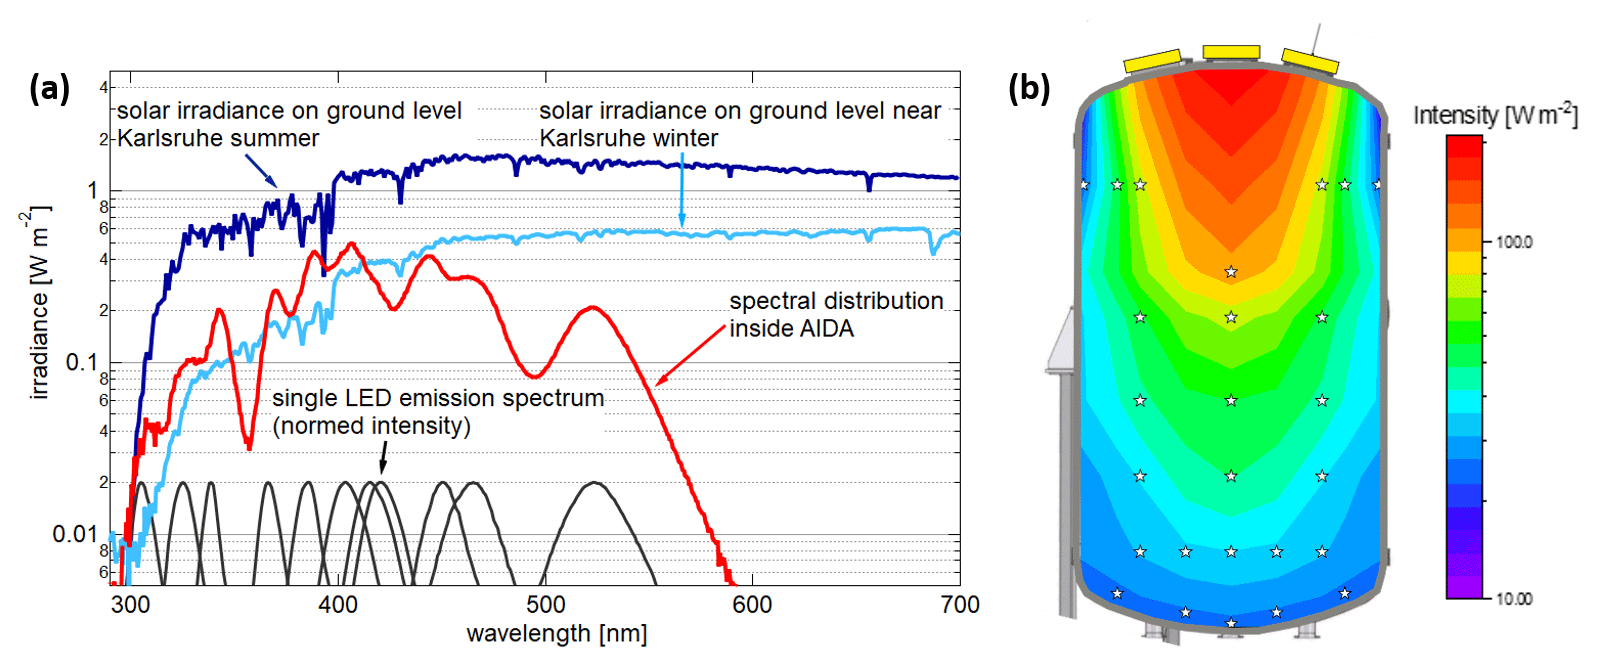
Figure 2(a) Light spectrum inside the AIDA chamber, measured at a central position at a height of 2.9 m above the chamber floor. Solar irradiance for winter was measured with a calibrated spectrometer at KIT. The solar irradiance for summer is calculated with the NCAR UCAR Quick TUV model (further information in the Supplement). The ratios of the mean intensity inside the AIDA chamber and the maximum values outside are given in Fig. S3 for summer and winter. (b) Light intensity distribution interpolated based on measurements at 26 different positions (white stars) inside the AIDA chamber.
4.2 Stability of the light source
At a constant temperature, the emission of the light is also constant in intensity, thus offering reproducible illumination conditions. As the emission of the LEDs themselves is temperature-dependent, the resulting spectra in the chamber change slightly with temperature. This also leads to the effect that, after switching on the LEDs, it takes less than 3 min until the LEDs have reached a constant operating temperature. After this initial period the light emission remains constant within ±0.02 % (see Fig. 3b). This effect is less pronounced at warmer temperatures. The overall variability is less than 1 % at constant temperature. Additionally, the LEDs can be operated at higher electrical currents at lower temperatures, changing the emitted spectrum further with typically higher emissions for lower wavelengths (cf. Fig. 3a). Alternatively, it is in principle possible to apply lower currents at lower temperatures to keep the emission spectrum nearly constant compared to warmer conditions. However, it is also possible to add more or stronger UV LEDs to increase the UV intensity, also for higher chamber temperatures.

Figure 3(a) Spectra taken with the UV-Vis spectrometer at the bottom of the chamber at four different temperatures. The electrical settings for the LEDs for each temperature are different. In addition to the emission changes in the LEDs due to the temperature variation, this leads to different spectral distributions for each temperature. (b) Spectra taken with the UV-Vis spectrometer at the bottom of the chamber over a time period of 30 min.
4.3 Integral light intensity
The actinometric experiments, by using the photolysis of NO2 inside the chamber, provide photolysis frequencies for every measured temperature and light setting, thus offering reference values of the light intensity for comparison to other simulation chambers or to solar irradiation. The photolysis of NO2 can be described with the following three equations, neglecting further side reactions (Harvey et al., 1977; Holmes et al., 1973).
The actinometric experiments were carried out at eight different temperatures (213, 243, 263, 268, 273, 283, 295 and 296 K) in dry synthetic air, each with the highest light intensity setting possible, for long-term use. Figure 4a shows pressure, temperature and the concentrations of the trace gases of one of these experiments. Please note that the instantaneous steps of 0.1 K in temperature when switching on and off the light are due to radiative heating of the sensors inside the chamber but do not reflect a sudden change in gas temperature. After turning on the light the NO2 concentration decreases, the NO and O3 concentrations rise, and the system reaches a dynamic equilibrium after 10–12 min. Using the equilibrium concentrations and assuming a quasi-stationary state for ozone, the photolysis frequency is calculated by using the following equation and the reaction rate constant exp (−1400 K T−1) (cm3 molec.−1 s−1), as recommended by the IUPAC (Atkinson et al., 2004).
The resulting photolysis frequencies for the different temperatures are shown in Fig. 4b. They vary slightly, resulting in a mean value of ( s−1. Additionally, one experiment was done in pure nitrogen but led to very similar results. In comparison, the maximum values for a clear winter day and a summer day in Karlsruhe are s−1 and s−1 (calculated with the Quick TUV Calculator of NCAR UCAR). Thus, 1 h of illumination in the AIDA chamber corresponds to 0.5 h solar illumination on a clear winter day at ground level. Regarding the size of the chamber, this is a significant value. The biggest chamber of PACS-C3 (27 m3) at the Paul Scherrer Institute in Switzerland achieves a NO2 photolysis frequency of s−1 by combining arc xenon lamps and black-light lamps (Paulsen et al., 2005). By using three 4 kW high-pressure arc xenon lamps for the CESAM chamber (4.2 m3) at the Interuniversitary Laboratory of Atmospheric Systems in Paris, a photolysis frequency of s−1 is achieved (Wang et al., 2011). Since the chamber is higher than other chambers compared to the base area and the LED emissions are conical, uniform and intense illumination is particularly difficult. Being at the lower end of the illumination intensities, still significant improvements based on the fast development of LEDs in the near future seem possible.
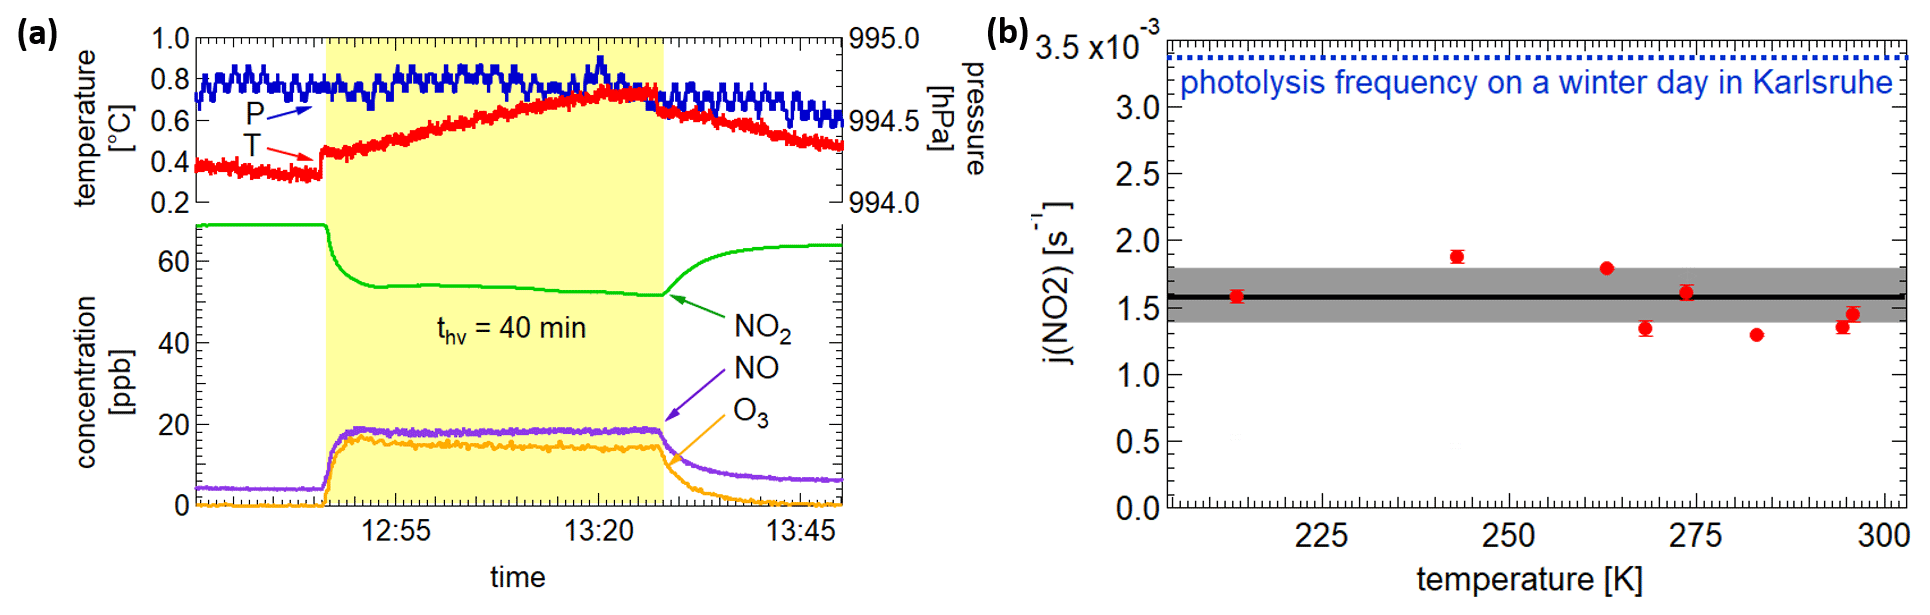
Figure 4(a) Pressure, temperatures and concentrations during an actinometric experiment with NO2. (b) The resulting photolysis frequencies at the different temperatures.
By constructing the light source as a combination of LEDs, we achieved an illumination with a similar spectral distribution to the solar light at ground level as well as intensities which allow us to simulate realistic conditions of the atmospheric illumination. Furthermore, the light source has only a small impact on the temperature stability of the chamber. The average gas temperature increases by 0.7 K per hour for the first 2 h of illumination with maximum power. This ensures stable simulation conditions and allows the illumination of clouds at relative humidities close to and above water or ice saturation. An example of this is shown in Fig. S11. The light source itself can be operated safely between 183 and 303 K, and the irradiation spectrum can be changed at any point also during the experiments without technical difficulties. This is especially advantageous in comparison to xenon arc lamps, which get very hot and are difficult to handle, for example if one would like to adjust the spectrum by adding or removing a filter. Especially important for future uses is the light sources' adaptability. LEDs can be replaced or added whenever there is a new technological development or scientific need, e.g. by adding UV-C LEDs.
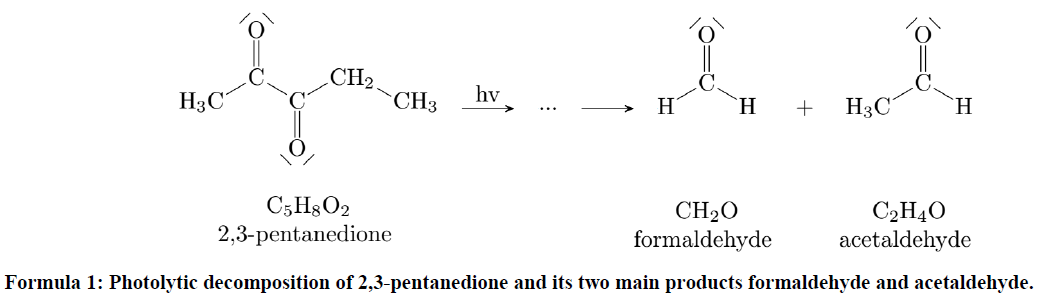
Studying the photolysis of 2,3-pentanedione in the gas phase also demonstrates the possibilities the new AIDA light source offers. 2,3-Pentanedione itself is a yellowish liquid which is used in the food industry for fragrance and flavouring (Burdock, 2002). However, it is also emitted into the atmosphere through biological processes in vine and pine trees or formed by ozonolysis of alkenes (Burdock, 2002; Campo et al., 2006; Grossjean et al., 1998). Furthermore, as an alpha carbonyl component, it can be used as a proxy for similar molecules. Carbonyl components can decompose in the atmosphere through photochemical pathways, forming radicals (Tadić et al., 2006). The primary photolysis step of 2,3-pentanedione can lead to different radicals with thresholds at around 340, 350, and 400 nm (Bouzidi et al., 2015; Szabo et al., 2011; Kercher et al., 2005). An overview of different reaction pathways for the photolysis of 2,3-pentanedione is given in Bouzidi et al. (2014, 2015). Besides CO2 and CO, the main products of these reaction pathways are acetaldehyde and formaldehyde (Szabo et al., 2011).
The aim is to improve the current knowledge about the decomposition behaviour of α-carbonyls and especially 2,3-pentanedione in the atmosphere. For this purpose photolysis frequencies and product distributions were determined as a function of temperature and wavelength of the irradiation.
5.1 Variation of temperature
The photolysis frequency j of a molecule is not only dependent on the incoming radiation I, but also on the quantum yield φ, which for photolysis is defined by the actual number of bond cleavages divided by the number of absorbed photons and the absorption cross section σ of the respective substance. The latter two as well as the product yields can be temperature-dependent (Seinfeld and Pandis, 2006).
As temperature dependencies of the photolysis of other components like NO2 (Shetter et al., 1988), ozone (Smith et al., 2000) or o-methylacetophenone (Scaiano, 1980) are minor, it is to be expected that this is also the case for 2,3-pentanedione. However, as acetylaldehyde and formaldehyde are not the direct photolysis products, a temperature dependence of their formation cannot be ruled out. Thus the photolysis frequencies, quantum yields, and product yields were determined in a series of experiments at five different temperatures (213, 243, 273, 283, 298 K). Employing the PTR-MS, the mass concentrations of acetaldehyde and formaldehyde in the gas phase were measured (see Fig. S5). The photolysis frequencies are calculated by regarding the photolysis as a first-order reaction. This is justified as the data show a linear behaviour on a logarithmic scale. The slope of the line allows us to calculate the photolysis frequency for the respective experiment (see Fig. 5). The concentration of 2,3-pentanedione decays due to photolysis but especially for the lower temperatures, also due to the adsorption of molecules from the gas phase at the chamber walls. To calculate the photolysis frequency (jPTD) of 2,3-pentanedione (PTD), the mean value of the decay before and after illumination (kW) is subtracted from the decay during illumination. As the slope is typically steeper before than after illumination, subtraction of the corresponding values instead of the mean value gives the maximum uncertainty for the resulting photolysis frequency.
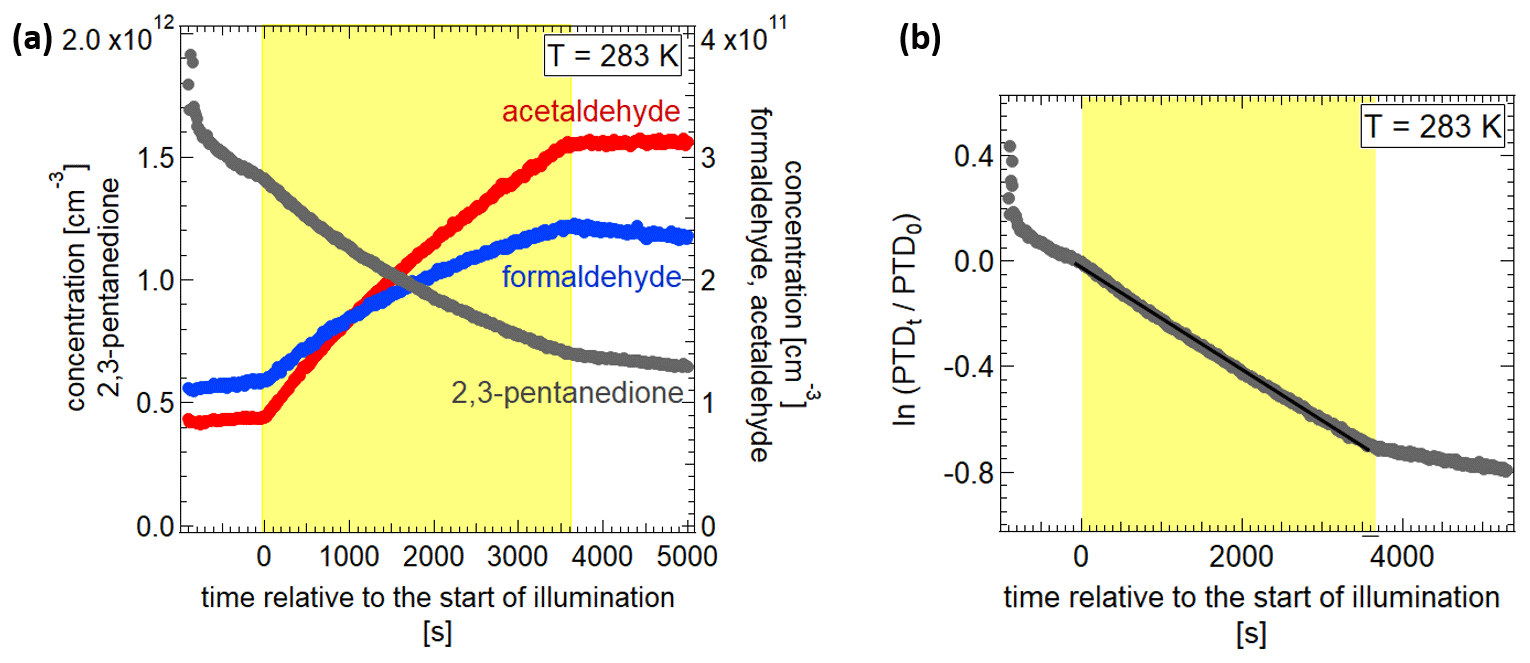
Figure 5(a) Concentrations of 2,3-pentanedione, acetaldehyde and formaldehyde during the experiment. (b) Logarithmic depiction of the 2,3-pentanedione (PTD) concentration to calculate the photolysis frequency.
The resulting photolysis frequencies and product yields are shown in Fig. 6 as a function of temperature. The photolysis frequencies vary only slightly, and there is no significant temperature dependence. The wall loss for the experiment at 213 K before illumination resulted in a stronger concentration decrease compared to during the illumination. As a result, only an upper limit of photolysis frequency, calculated with the wall loss rate after the illumination, is given in Fig. 6. It is safe to assume that photolysis was taking place, even though it is difficult to define a frequency, because the formation of products could be observed. The mean value for the four photolysis frequencies from 243 to 298 K is ( s−1. Regarding photolysis of 2,3-pentanedione alone, this corresponds to an atmospheric lifetime of about 40 min on a clear summer day in Karlsruhe (49.007∘ N, 8.404∘ E). The value for 298 K is not significantly different from the mean, with () s−1. Szabo et al. (2011) observed a photolysis frequency of 2,3-pentanedione of ( s−1 at 300 K. This is only 11 % of our measured value. There are two distinct differences in the experimental setup which could explain the discrepancy. First is the fact that Szabo et al. (2011) were adding 1-pentene to trap OH radicals, which may be formed through photolysis of 2,3-pentanedione directly or by the photolysis of one of the reaction products. They account for a 30 % higher photolysis frequency without 1-pentene. Second is the spectral difference of the light sources used. For the experiments of Szabo et al. (2011), a combination of two fluorescent tubes with emission maxima at 312 and 365 nm was used as the light source. This results in a narrower spectrum overall. Additionally, the absorption spectrum of 2,3-pentanedione shows a minimum at 325 nm, and thus the main photolysis was probably only driven by the emission of the fluorescent tube with a peak wavelength at 365 nm. Bouzidi et al. (2014) measured at 298 K photolysis frequencies of s−1 and ( s−1 with and without an OH radical scavenger. These are already higher values than the results of Szabo et al. (2011). However, the value in the absence of an OH radical scavenger is only 35 % and hence significantly lower than the value we have observed. A major difference is that Bouzidi et al. (2014) use 2,3-pentanedione at concentrations of 12–48 ppm, while we use concentrations of 20–71 ppb. Thus it is possible that recombination processes play a larger role than in our experiments. As for the experiments reported by Szabo et al. (2011), one major difference is the light source used (broadband UV lamps: 330–480 nm with a maximum near 370 nm).
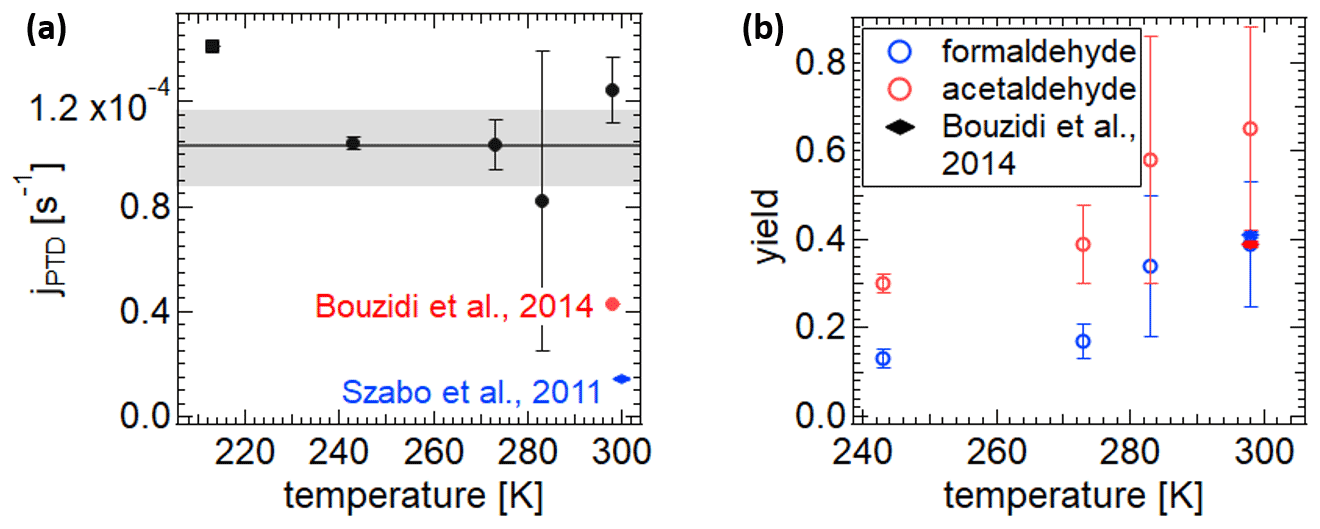
Figure 6(a) Photolysis frequencies of the photolysis of 2,3-pentanedione for the experiments at different temperatures and the photolysis frequencies measured by Szabo et al. (2011) and Bouzidi et al. (2014). (b) The product yields for the corresponding experiments. The wall loss at 213 K was too high to perform a model run for the product yield. The photolysis frequency for this temperature shown in the figure is the upper limit with the assumption of a minimal wall loss, equivalent to the value after illumination.
The yields of the products of acetaldehyde and formaldehyde were determined using a simple kinetic model applying the KinSim software (Peng and Jimenez, 2019) in Igor Pro. The model accounted for the wall loss of 2,3-pentanedione as well as the photolysis and consecutive formation of formaldehyde and acetaldehyde with the yields x and y. The rate for the wall loss was set as the mean value kW. The yields and the photolysis rates were fitted to the measured concentration profiles. The resulting product yields are shown in Fig. 6b, ignoring the experiment at 213 K due to the strong wall losses. The error bars reflect mainly the uncertainties implied by the wall losses and to a smaller extent those of the quantification by the PTR-MS measurement. The yields for acetaldehyde are always higher than for formaldehyde, and a strong positive temperature dependence can be observed. As a temperature dependence of the photolysis itself can be ruled out, the different yields have to be accounted for in a change in the reaction mechanism. As there are a lot of possible pathways after the primary photolysis, either the reaction pathways to the formation of acetaldehyde and formaldehyde are thermodynamically controlled and decrease with temperature or other pathways are gaining in significance with lower temperatures. One of the formation reactions of formaldehyde in the reaction mechanism given by Bouzidi et al. (2014, 2015) is the reaction of CH3O with O2. Its reaction rate has been studied by several groups. These findings are summarized in Wantuck et al. (1987). According to their results the reaction rate at 293 K is 1.8 times the reaction rate at 243 K, which may explain our observed temperature dependence partially. For the formation of acetaldehyde the reaction of C2H5O with O2 is an important pathway, and its reaction rate has been studied by Hartmann et al. (1990) for temperatures between 295 and 411 K. Their expression for the reaction rate implies a 1.5 times higher reaction rate for 293 K than for 243 K. Even though the expression might not be perfect for lower temperatures, it shows that the temperature dependence for this reaction pathway may also be considered an explanation for our observations. For a temperature of 298 K and without an OH radical scavenger, Bouzidi et al. (2014) report yields of 0.41±0.7, 0.39±0.6 and 0.076±0.005 for formaldehyde, acetaldehyde and CO, respectively. The yield for formaldehyde agrees with our observation, but the yield for acetaldehyde is significantly lower than the value observed in the AIDA experiments. This may be due to the different analytical techniques used (PTR-MS vs. derivatization followed by HPLC-UV analysis), the different light sources or different wall loss rates in the different simulation chambers.
5.2 Variation of the irradiation spectrum
In addition to the temperature-dependent experiments, 2,3-pentanedione was illuminated in intervals of 15 min at 298 K by changing the spectrum of the emitted light. The different spectra are given in Fig. S6. This was achieved by using only a part of the LEDs. The aim was to evaluate the wavelength dependence of the photolysis. Furthermore, the results were used to determine a quantum yield of the photolysis. Figure 7 shows the evolution of the 2,3-pentanedione concentration during this experiment. The yellow parts represent the illumination periods, with the corresponding peak wavelengths of the LEDs used for each illumination. It should be noted that the resulting spectrum is always broader than the specified peak wavelength (see Fig. S6). For a spectrum which is comprised of the LEDs with the peak wavelengths from 365 to 528 nm, the resulting spectrum has an intensity of about 50 % from 360 to 533 nm as the FWHM for most LEDs is between 10 and 15 nm. The concentration profile shows that there is no significant photolysis detectable with solely the UV LEDs in use. This is to be expected regarding the minimum of the absorption spectrum of 2,3-pentanedione between 300 and 350 nm. On the other hand, the largest impact has the addition of the LEDs with peak wavelengths of 455, 415 and 405 nm. This is also the region where the absorption spectrum shows a maximum (see Fig. 8). The values for the photolysis frequencies are summarized in Table 1. It is noteworthy that we can still measure a significant photolysis of 2,3-pentanedione even with an illumination produced of LEDs with peak wavelengths well beyond the photolysis threshold of 400 nm. In particular, this applies to the illumination periods marked as 455–528 nm and 475–528 nm.
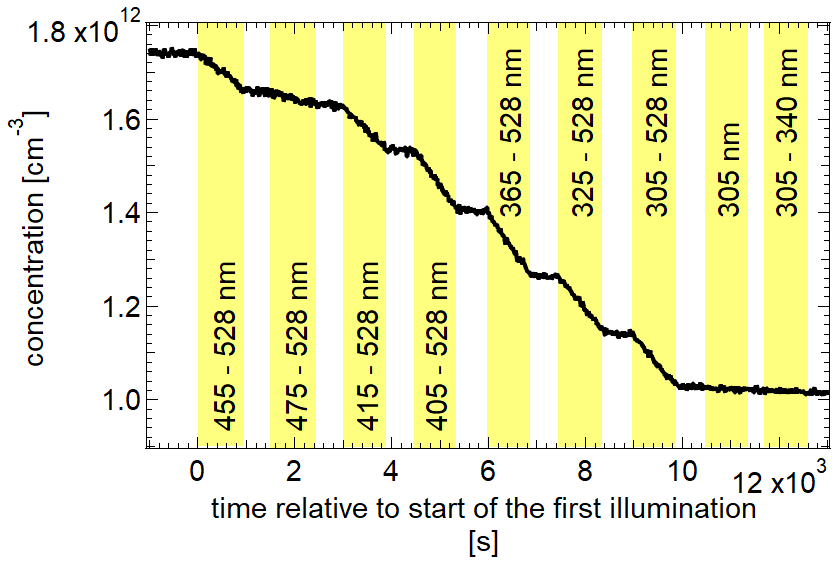
Figure 7Concentration of 2,3-pentanedione over the course of several illumination periods with different wavelength ranges of light spectra irradiated at 298 K.
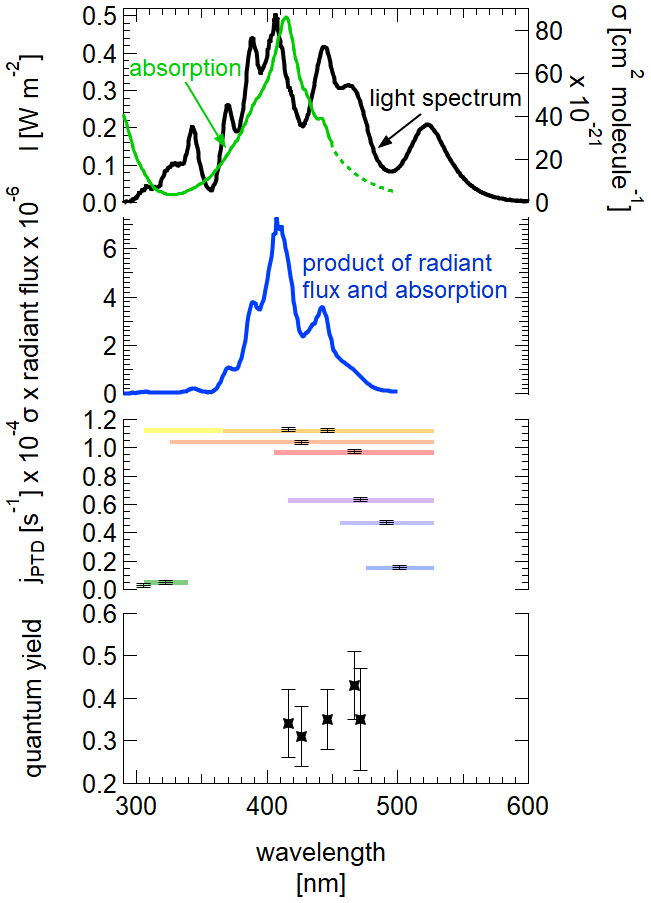
Figure 8Top: measured spectrum of the light source at 3 m height inside the chamber. Absorption spectrum of 2,3-pentanedione, extrapolated for the part between 450 and 500 nm (data: Szabó et al., 2011). Upper middle: product of radiant flux and absorption spectrum. Bottom middle: observed photolysis frequencies for the corresponding illumination at different wavelength ranges. Bottom: calculated quantum yields for the corresponding wavelength ranges.
Table 1Measured and calculated photolysis frequencies of the photolysis of 2,3-pentanedione for different wavelength ranges as well as calculated quantum yields for a temperature of 298 K. The given wavelengths for the observed values refer to the peak wavelengths of the outermost activated LEDs. Values marked as * are not reliable because the difference between the estimated wavelength range and the actual spectral width is affecting the final results too strongly.

The determination of the quantum yield requires a comparison of the calculated photolysis frequency, with the quantum yield equal to 1 with the observed values (see Table 1). As the photolysis frequency can be calculated as the sum over the discrete values of the radiant flux J(λ), the absorption cross section σ(λ) and the quantum yield φ(λ), the actual quantum yield can be calculated.
It should be kept in mind that this value is only valid for our experimental conditions: this includes the illumination conditions but also chamber-specific influences like wall loss effects. One way of accounting for this is to normalize the value with as was done by Bouzidi et al. (2014), which will be discussed in the following.
The quantum yield is not calculated if only the long wavelengths from 475 to 528 nm are used or if only the short wavelengths from 305 to 340 nm are used. This is firstly due to the absorption spectrum of 2,3-pentanedione being only available until 450 nm (Szabó et al., 2011). Even with a reasonable extrapolation up to 500 nm, the comparison between the photolysis frequencies for the spectral range of 450 to 500 nm is not valid as the LEDs with a peak wavelength of 528 nm are ignored. Secondly, due to the minimum in the absorption spectrum in the UV region, the simplification to use a spectrum from 300 to 345 nm when using LEDs with peak wavelengths from 305 to 340 nm underestimates the actual available light. This is true for the complete spectral width, but more drastic were the actual spectrum overlaps with the absorption maximum. Furthermore, the given uncertainty for the absorption coefficient in the region of 330 nm is up to 40 %, adding considerably to the uncertainty at this wavelength range. Thus, only the values calculated for wavelengths between 300 and 500 nm were used for comparison, resulting in a mean quantum yield of 0.36±0.04. There seems to be no obvious tendency of the quantum yield regarding the spectral characteristics in the respective wavelength range. Szabo et al. (2011) estimated a quantum yield of 0.41±0.05 for the photolysis through solar irradiation and Bouzidi et al. (2014) a quantum yield of 0.20±0.02 for illumination with fluorescent lamps. Considering the uncertainties, there is good agreement between the value determined by Szabo et al. (2011) and our experiments, while the value of Bouzidi et al. (2014) is about 56 % of our value. If we apply a correction according to the procedure used by Bouzidi et al. (2014), we obtain a quantum yield of 0.45 (). Hence, the difference is then even larger.
To explore the possibilities the light source at the AIDA chamber offers, two further experimental series were conducted. One system studied is DTDP, a pyridine derivative, as a proxy for atmospheric brown carbon components, diluted in aqueous ammonium nitrate and ammonium sulfate solution droplets. A second system consists of ammonium nitrate solution particles, containing iron oxalate as a photosensitizer and pinonic and pinic acid as typical secondary organic components. For both systems only the main preliminary results are presented.
6.1 Photolysis of 3,5-diacetyl-2,4,6-trimethyl-1,4-dihydropyridine (DTDP)
DTDP, a pyridine derivative, is known as an atmospheric brown carbon component (Kampf et al., 2016), which can be formed e.g. by reaction of acetaldehyde and 2,4-pentanedione in the presence of ammonium sulfate. Its absorption spectrum shows a strong band around 380 nm (cf. Fig. S7). Therefore, we studied its photolysis in aqueous droplets containing ammonium nitrate and ammonium sulfate (weight ratios of DTDP : NH4NO3 : (NH4)2SO4 of ) at the temperatures 264, 273, 283, and 293 K at relative humidities of 70 %–79 %. The dry diameter of the aerosol particles was 350 nm. Please note that the DTDP-containing particle droplets were liquid only at 293 and 283 K but higher viscous at 273 and 263 K (Extended AIM Aerosol Thermodynamics Model, 2022; Clegg et al., 1998). This higher viscosity could hinder reactions of excited DTDP with other reaction partners. For these experiments we can assume that the absorption of photons through NO3− and the subsequent formation of OH radicals can be regarded as negligible as a potential sink for DTPD in comparison to the direct photolysis. This is because the absorption spectrum of NO3− overlaps only weakly with the emission spectrum of the AIDA light source and the quantum yields for OH radical formation is only about 1 % (Mack and Bolton, 1999). The nitrate ion concentrations were too low to compensate for this. Nevertheless, experiments in the absence of nitrate ions would be beneficial.
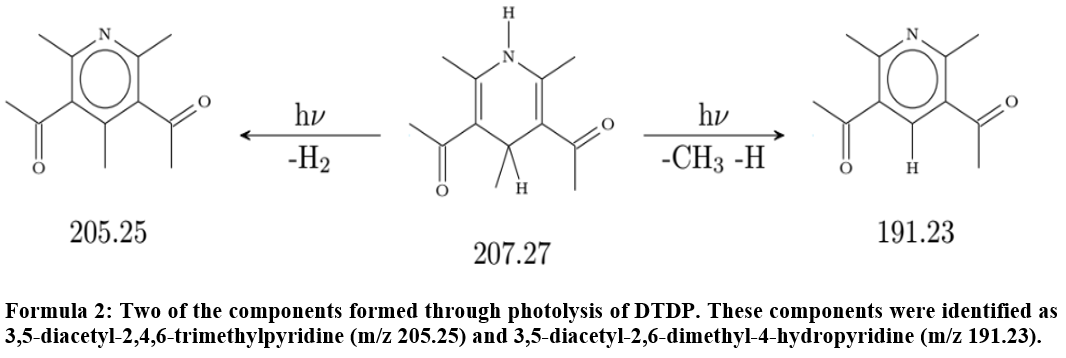
The illumination of these droplets leads to the depletion of DTDP in the particle phase corresponding to an average photolysis frequency of ( s−1 over all four temperatures (see Fig. S8). Even though the exact determination of the mass loadings of DTDP in the particle phase turned out to be problematic, we can say that the estimated lifetime of DTDP regarding photolysis in the atmosphere should be in the range of 7–15 min. During illumination the production of several components in the gas and particle phases could be observed by CIMS measurements. Sixteen of these components could be observed in the particle phase at all four temperatures studied as well as in the gas phase for three of the experiments. The gas-phase data for the fourth experiment are not available due to technical problems. The mass increases for these 16 components at 293 K are given in the Supplement (Fig. S9). Two of these could be identified as 3,5-diacetyl-2,4,6-trimethylpyridine ( 205.25) and 3,5-diacetyl-2,6-dimethyl-4-hydropyridine ( 191.23) by comparison to results of Mitsunobu et al. (1972) and Memarian et al. (2004). Two stable aromatic compounds formed through elimination of H2 and CH3, respectively. The formation of these products is temperature-dependent, as shown in Fig. 9 for the case of 3,5-diacetyl-2,4,6-trimethylpyridine. Further molecular structures, e.g. by elimination of CO, are possible and a corresponding mass-to-charge ratio can be found, but a more detailed characterization still needs to be done.
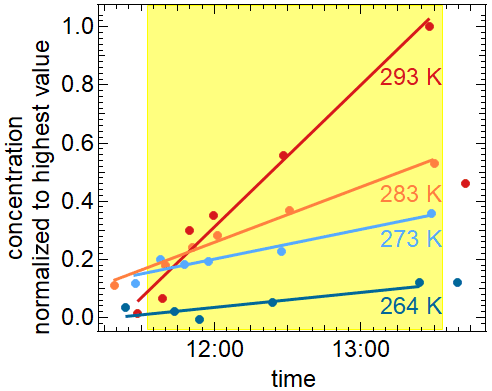
Figure 9Mass increase over the illumination period of the mass peak at 205 in the particle phase, identified as 3,5-diacetyl-2,4,6-trimethylpyridine. Dots represent the measurement values. The formation is slower at lower temperatures.
6.2 Depletion of pinic and pinonic acid by iron oxalate as photosensitizer
The illumination of iron oxalate charge-transfer complexes leads to the production of radicals, particularly OH radicals. Oxalic acid itself does not decompose through solar illumination. However, through the complexation with Fe3+ ions, absorption in the UV and visible region is possible (Zuo and Hoigné, 1994; Cooper and DeGraff, 1971; Pozdnyakov et al., 2008). Detailed descriptions of the photolytic decomposition of the oxalic acid and the formation of radicals can be found in Chen et al. (2007, 2008) and Pozdnyakov et al. (2008). The radicals can consequently react with water and the organic compounds in the aerosol particles. We studied the depletion of two organic acids in aqueous droplets also containing ammonium nitrate and iron oxalate at temperatures of 283, 243 and 213 K at relative humidities of 88 %, 72 % and 55 %, respectively. Pinonic and pinic acids are well-known oxidation products of α-pinene (Christoffersen et al., 1998; Yu et al., 1998), which is, alongside other terpenes, emitted into the atmosphere in large quantities (Guenther et al., 2012). The aerosol particles were generated by dispersing an aqueous solution of 0.0065 mol l−1 pinonic acid, 0.0073 mol l−1 pinic acid, 0.013 mol l−1 NH4NO3 and 0.0021 mol l−1 iron oxalate or 0.0081 mol l−1 oxalate in the reference experiment. The resulting dry particle diameters were 350 nm. Mass spectrometric data show a decrease in the concentrations of the two acids in the particle phase during illumination, with the strongest decrease at the warmest temperature (283 K) (see Fig. 10) and a negligible concentration change for pinic acid at 213 K. Several masses increase during illuminations, of which three could be identified as C8H12O5, C10H15NO6 and C10H15NO7 (see Fig. 10, last panel). Decomposition of pinic and pinonic acid as well as the formation of products reduce significantly with decreasing temperature, which might be partially due to the increased viscosity of the aerosol particles. The evolution of particle diameter, relative humidity and temperature for the experiment at 283 K can be found in Fig. S10. A reference experiment at 283 K with oxalic acid, pinonic acid and NH4NO3 shows no distinct reduction in the pinonic acid concentration during illumination. Our analysis results in first-order rate coefficients of s−1 for the decay of pinonic acid at 283, 243 and 213 K as well as 3– s−1 for pinic acid at 283 and 243 K.

Figure 10Mass concentration of pinic and pinonic acid as well as one of the identified products. Bars: particle phase; line: gas phase; grey shading: introduction of aerosol into the AIDA chamber; yellow: illumination period. Pinic and pinonic acid reduces during illumination, while the product C10H15NO7 increases. Due to its instable peroxy structure, the product concentration declines after the end of the illumination.
These results demonstrate that iron oxalate acts as a photosensitizer, which can potentially contribute to degradation of organic compounds in aqueous aerosol particles.
With the construction of a light source for the AIDA chamber, aerosol formation and ageing studies as well as cloud processes can now be extended, including illumination with light of atmospherically relevant intensities and spectral characteristics. Light intensities comparable to 25 % of a clear summer day or 44 % of a clear winter day in Karlsruhe are possible. This was achieved by using a combination of LEDs with 11 different peak wavelengths from 305 to 528 nm, with the additional possibility of changing the irradiation spectrum and photon flux at any point during the experiments. Since the LEDs emit only very little IR radiation, the deterioration of the excellent temperature homogeneity of the simulation chamber is relatively small at 0.7 K h−1. Therefore, the investigation of the interaction of light with gas-phase components, aerosols as well as water and ice clouds is now possible for simulated tropic to stratospheric conditions.
Characterization experiments show a photolysis frequency for NO2 of s−1 in the temperature range between 213 and 295 K and a spectral shape similar to the solar spectrum in the UV-Vis range.
The first experiments with 2,3-pentanedione prove the applicability of the light source at different temperatures and with different irradiation spectra. The formation of the photolysis products acetaldehyde and formaldehyde show a distinct temperature dependence, with yields decreasing with decreasing temperature. The photolysis itself is independent of the temperature.
From the variation of the irradiation spectrum, we conclude that the photolysis of 2,3-pentanedione is possible for wavelengths below 460 nm, with a mean photolysis frequency of s−1. The quantum yield for the photolysis was determined as 0.36±0.04.
Further experiments with a photosensitizer and brown carbon components show the variability in photo-aging experiments now possible in the AIDA chamber as well as the first results. This includes an estimate for the atmospheric lifetime of 3,5-diacetyl-2,4,6-trimethyl-1,4-dihydropyridine of 11±4 min and the identification of the photolysis products 3,5-diacetyl-2,4,6-trimethylpyridine and 3,5-diacetyl-2,6-dimethylpyridine. Additionally, a temperature-dependent degradation of organic acids in aqueous droplets through the photosensitizer iron oxalate could be observed.
Although the light source so far only generates about one-third of the maximum solar irradiation at ground level with a substantial intensity gradient throughout the simulation chamber, it could be shown that this type of light source allows reproducible experiments over a wide range of simulated atmospheric conditions and with a large flexibility and control of the irradiation spectrum. A specific asset of the setup is the large temperature range over which the studies can be conducted.
The AIDA light spectrum is available via the KITopen data repository (Vallon et al., 2022).
The supplement related to this article is available online at: https://doi.org/10.5194/amt-15-1795-2022-supplement.
MV and JN built the light source based on ideas by HS and TL. MV and HS conducted the experiments with substantial contributions by LG (AMS and CIMS), FJ (filter samples, absorption measurements), and JS (AMS and PTR-MS). The data were analysed by HS and MV (light spectra, CIMS, aerosol data), JS (AMS and PTR-MS), and BK (kinetics). MV wrote the manuscript with contributions from all the co-authors.
The contact author has declared that neither they nor their co-authors have any competing interests.
Publisher’s note: Copernicus Publications remains neutral with regard to jurisdictional claims in published maps and institutional affiliations.
This article is part of the special issue “Simulation chambers as tools in atmospheric research (AMT/ACP/GMD inter-journal SI)”. It is not associated with a conference.
The authors also want to thank the staff of the KIT-IMK-AAF, especially Georg Scheurig, Tomasz Chudy, and Steffen Vogt, for their technical support. Special thanks go to GRACE, the graduate school of KIT, for financing conferences and the aerosol summer school.
This research has been supported by Horizon 2020 (grant no. EUROCHAMP-2020 – 730997).
The article processing charges for this open-access publication were covered by the Karlsruhe Institute of Technology (KIT).
This paper was edited by Mingjin Tang and reviewed by three anonymous referees.
Aregahegn, K. Z., Nozière, B., and George, C.: Organic aerosol formation photo-enhanced by the formation of secondary photosensitizers in aerosols, Faraday Discuss., 165, 123–134, https://doi.org/10.1039/c3fd00044c, 2013.
Atkinson, R., Baulch, D. L., Cox, R. A., Crowley, J. N., Hampson, R. F., Hynes, R. G., Jenkin, M. E., Rossi, M. J., and Troe, J.: Evaluated kinetic and photochemical data for atmospheric chemistry: Volume I – gas phase reactions of Ox, HOx, NOx and SOx species, Atmos. Chem. Phys., 4, 1461–1738, https://doi.org/10.5194/acp-4-1461-2004, 2004.
Baltrusaitis, J., Schuttlefield, J., Jensen, J. H., and Grassian, V. H.: FTIR spectroscopy combined with quantum chemical calculations to investigate adsorbed nitrate on aluminium oxide surfaces in the presence and absence of co-adsorbed water, Phys. Chem. Chem. Phys., 9, 4970–4980, https://doi.org/10.1039/b705189a, 2007.
Bartl, J. and Baranek, M.: Emissivity of aluminium and its importance for radiometric measurement, Meas. Sci. Rev., 4, 31–36, 2004.
Bohn, B. and Zilken, H.: Model-aided radiometric determination of photolysis frequencies in a sunlit atmosphere simulation chamber, Atmos. Chem. Phys., 5, 191–206, https://doi.org/10.5194/acp-5-191-2005, 2005.
Bouzidi, H., Fittschen, C., Coddeville, P., and Tomas, A.: Photolysis of 2,3-pentanedione and 2,3-hexanedione: Kinetics, quantum yields, and product study in a simulation chamber, Atmos. Environ., 82, 250–257, https://doi.org/10.1016/j.atmosenv.2013.10.039, 2014.
Bouzidi, H., Djehiche, M., Gierczak, T., Morajkar, P., Fittschen, C., Coddeville, P., and Tomas, A.: Low-Pressure Photolysis of 2,3-Pentanedione in Air: Quantum Yields and Reaction Mechanism, J. Phys. Chem. A,, 119, 12781–12789, https://doi.org/10.1021/acs.jpca.5b09448, 2015.
Campo, E., Ferreira, V., Escudero, A., Marqués, J. C., and Cacho, J.: Quantitative gas chromatography-olfactometry and chemical quantitative study of the aroma of four Madeira wines, Anal. Chim. Acta, 563, 180–187, https://doi.org/10.1016/j.aca.2005.10.035, 2006.
Chen, J., Zhang, H., Tomov, I. V., Wolfsberg, M., Ding, X., and Rentzepis, P. M.: Transient structures and kinetics of the ferrioxalate redox reaction studied by time-resolved EXAFS, optical spectroscopy, and DFT, J. Phys. Chem. A, 111, 9326–9335, https://doi.org/10.1021/jp0733466, 2007.
Chen, J., Zhang, H., Tomov, I. V., and Rentzepis, P. M.: Electron transfer mechanism and photochemistry of ferrioxalate induced by excitation in the charge transfer band, Inorg. Chem., 47, 2024–2032, https://doi.org/10.1021/ic7016566, 2008.
Christoffersen, T. S., Hjorth, J., Horie, O., Jensen, N. R., Kotzias, D., Molander, L. L., Neeb, P., Ruppert, L., Winterhalter, R., Virkkula, A., Wirtz, K., and Larsen, B. R.: Cis-pinic acid, a possible precursor for organic aerosol formation from ozonolysis of α-pinene, Atmos. Environ., 32, 1657–1661, https://doi.org/10.1016/S1352-2310(97)00448-2, 1998.
Ciuraru, R., Fine, L., Pinxteren, M. V., D'Anna, B., Herrmann, H., and George, C.: Unravelling New Processes at Interfaces: Photochemical Isoprene Production at the Sea Surface, Environ. Sci. Technol., 49, 13199–13205, https://doi.org/10.1021/acs.est.5b02388, 2015.
Clegg, S. L., Brimblecombe, P., and Wexler, A. S.: A thermodynamic model of the system H+-NH4+-SO42−-NO3−-H2O at tropospheric temperatures, J. Phys. Chem. A, 102, 2137–2154, https://doi.org/10.1021/jp973042r, 1998.
Cooper, G. D. and DeGraff, B. A.: Photochemistry of the ferrioxalate system, J. Phys. Chem., 75, 2897–2902, 1971.
Extended AIM Aerosol Thermodynamics Model: http://www.aim.env.uea.ac.uk/aim/aim.php, last access: 31 January 2022.
Fankhauser A. M., Bourque, M., Almazan, J., Marin, D., Fernandez, L., Hutheesing, R., Ferdousi, N., Tsui, W. G., and McNeill, V. F.: Impact of Environmental Conditions on Secondary Organic Aerosol Production from Photosensitized Humic Acid, Environ. Sci. Technol., 54, 5385–5390, https://doi.org/10.1021/acs.est.9b07485, 2020.
Fenaroli, G. and Burdock G. A.: Fenaroli's handbook of flavor ingredients, 4th edn., CRC press, Boca Raton, 1411–1412, , ISBN 0-8493-0946-8, 2002.
Fu, H., Ciuraru, R., Dupart, Y., Passananti, M., Tinel, L., Rossignol, S., Perrier, S., Donaldson, J. D., Chen, J., and George, C.: Photosensitized Production of Atmospherically Reactive Organic Compounds at the Air/Aqueous Interface, J. Am. Chem. Soc., 137, 8348–8351, https://doi.org/10.1021/jacs.5b04051, 2015.
George, C., Ammann, M., D'Anna, B., Donaldson, D. J., and Nizkorodov, S. A.: Heterogeneous Photochemistry in the Atmosphere, Chem. Rev., 115, 4218–4258, https://doi.org/10.1021/cr500648z, 2015.
Goldstein, A. H. and Galbally, I. E.: Known and unexplored organic constituents in the earth's atmosphere, Eviron. Sci. Technol., 41, 1514–1421, https://doi.org/10.1021/es072476p, 2007.
Guenther, A. B., Jiang, X., Heald, C. L., Sakulyanontvittaya, T., Duhl, T., Emmons, L. K., and Wang, X.: The Model of Emissions of Gases and Aerosols from Nature version 2.1 (MEGAN2.1): an extended and updated framework for modeling biogenic emissions, Geosci. Model Dev., 5, 1471–1492, https://doi.org/10.5194/gmd-5-1471-2012, 2012.
Hartmann, D., Karthäuser, J., Sawerysyn, J. P., and Zellner, R.: Kinetics and H2O Product Yield of the Reaction C2H5O + O2 between 295 and 411 K, Ber. Bunsen. Phys. Chem., 94, 639–645, https://doi.org/10.1002/bbpc.19900940604, 1990.
Harvey, R. B., Stedmann, D. H., and Chameides, W.: Determination of the Absolute Rate of Solar Photolysis of NO2, J. Air Pollut. Control Assoc., 27, 663–666, https://doi.org/10.1080/00022470.1977.10470469, 1977.
Herrmann, H., Schaefer, T., Tilgner, A., Styler, S. A., Weller, C., Teich, M., and Otto, T.: Tropospheric Aqueous-Phase Chemistry: Kinetics, Mechanisms, and Its Coupling to a Changing Gas Phase, Chem. Rev., 115, 4259–4334, https://doi.org/10.1021/cr500447k, 2015.
Holmes, J. R., O'Brien, R. J., Crabtree, J. H., Hecht, T. A., and Seinfeld, J. H.: Measurement of Ultraviolet Radiation Intensity in Photochemical Smog Studies, Environ. Sci. Technol., 7, 519–523, https://doi.org/10.1021/es60078a002, 1973.
Kampf, C. J., Filippi, A., Zuth, C., Hoffmann, T., and Opatz, T.: Secondary brown carbon formation via the dicarbonyl imine pathway: nitrogen heterocycle formation and synergistic effects, Phys. Chem. Chem. Phys., 18, 18353–18364, https://doi.org/10.1039/C6CP03029G, 2016.
Kercher, J. P., Fogleman, E. A., Koizumi, H., Sztáray, B., and Baer, T.: Heats of formation of the propionyl ion and radical and 2,3-pentanedione by threshold photoelectron photoion coincidence spectroscopy, J. Phys. Chem. A, 109, 939–946, https://doi.org/10.1021/jp0458497, 2005.
Lehtipalo, K., Yan, C., Dada, L., Bianchi, F., Xiao, M., Wagner, R., Stolzenburg, D., Ahonen, L. R., Amorim, A., Baccarini, A., Bauer P. S., Baumgartner, B., Bergen, A., Bernhammer, A.-K., Breitenlechner, M., Brilke, S., Buchholz, A., Stephany Buenrostro Mazon, S., Chen, D., Chen, X., Dias, A., Dommen, J., Draper, D. C., Duplissy, J., Ehn, M., Finkenzeller, H., Fischer, L., Frege, C., Fuchs, C., Garmash, O., Gordon, H., Hakala, J., He, X., Heikkinen, L., Zeinritzi, M., Helm, J. C., Hofbauer, V., Hoyle, C. R., Jokinen, T., Kangasluoma, J., Kerminen, V.-M., Kim, C., Kirkby, J., Kontkanen, J., Kürten, A., Lawler, M. J., Mai, H., Mathot, S., Mauldin R. L., Molteni, U., Nichman, L., Nie, W., Nieminen, T., Ojdanic, A., Onnela, A., Passananti, M., Petäjä, T., Piel, F., Pospisilova, V., Quéléver, L. L. J., Rissanen, M. P., Rose, C., Sarnela, N., Schallhart, S., Schuchmann, S., Sengupta, K., Simon, M., Sipilä, M., Tauber, C., Tomé, A., Tröstl, J., Väisänen, O., Vogel, A. L., Volkamer, R., Wagner, A. C., Wang, M., Weitz, L., Wimmer, D., Ye, P., Ylisirniö, A., Zha, Q., Carslaw, K. S., Curtius, J., Donahue, N. M., Flagan, R. C., Hansel, A., Riipinen, I., Virtanen, A., Winkler, P. M., Baltensperger, U., Kulmala, M., and Worsnop, D. R.: Multicomponent new particle formation from sulfuric acid, ammonia, and biogenic vapors, Sci. Adv., 4, 1–9, https://doi.org/10.1126/sciadv.aau5363, 2018.
Lopez-Hilfiker, F. D., Mohr, C., Ehn, M., Rubach, F., Kleist, E., Wildt, J., Mentel, Th. F., Lutz, A., Hallquist, M., Worsnop, D., and Thornton, J. A.: A novel method for online analysis of gas and particle composition: description and evaluation of a Filter Inlet for Gases and AEROsols (FIGAERO), Atmos. Meas. Tech., 7, 983–1001, https://doi.org/10.5194/amt-7-983-2014, 2014.
Mack, J. and Bolton J. R.: Photochemistry of nitrite and nitrate in aqueous solution: a review, J. Photoch. Photobio. A, 128, 1–13, https://doi.org/10.1016/S1010-6030(99)00155-0, 1999.
Memarian, H. R., Bagheri, M., and Döpp, D.: Synthesis and photochemistry of novel 3,5-diacetyl-1,4-dihydropyridines. II [1], Monatsh. Chem., 135, 833–838, https://doi.org/10.1007/s00706-003-0139-5, 2004.
Mitsunobu, O., Matsumoto, S., Wada, M., and Masuda, H.: Photooxidation of 1,4-Dihydropyridines, B. Chem. Soc. Jpn., 45, 1453–1457, 1972.
Möhler, O., Stetzer, O., Schaefers, S., Linke, C., Schnaiter, M., Tiede, R., Saathoff, H., Krämer, M., Mangold, A., Budz, P., Zink, P., Schreiner, J., Mauersberger, K., Haag, W., Kärcher, B., and Schurath, U.: Experimental investigation of homogeneous freezing of sulphuric acid particles in the aerosol chamber AIDA, Atmos. Chem. Phys., 3, 211–223, https://doi.org/10.5194/acp-3-211-2003, 2003.
Monge, M. E., Rosenørn, T., Favez, O., Müller, M., Adler, G., Riziq, A. A., Rudich, Y., Herrmann, H., George, C., and D'Anna, B.: Alternative pathway for atmospheric particles growth, P. Natl. Acad. Sci. USA, 109, 6840–6844, https://doi.org/10.1073/pnas.1120593109, 2012.
Müller, L., Reinnig, M.-C., Naumann, K. H., Saathoff, H., Mentel, T. F., Donahue, N. M., and Hoffmann, T.: Formation of 3-methyl-1,2,3-butanetricarboxylic acid via gas phase oxidation of pinonic acid – a mass spectrometric study of SOA aging, Atmos. Chem. Phys., 12, 1483–1496, https://doi.org/10.5194/acp-12-1483-2012, 2012.
Navea, J. G. and Grassian, V. H.: Photochemistry of Atmospheric Particles, in: Encyclopedia of Interfacial Chemistry: Surface Science and Electrochemistry, edited by: Wandelt, K., Elsevier, 553–562, https://doi.org/10.1016/B978-0-12-409547-2.13210-X, 2018.
Paulsen, D., Dommen, J., Kalberer, M., Prévôt, A. S. H., Richter, R., Sax, M., Steinbacher, M., Weingartner, E., and Baltensperger, U.: Secondary organic aerosol formation by irradiation of 1,3,5- trimethylbenzene-NOx-H2O in a new reaction chamber for atmospheric chemistry and physics, Environ. Sci. Technol., 39, 2668–2678, https://doi.org/10.1021/es0489137, 2005.
Pavlovic, T. and Ignatiev, A.: Optical and microstructural properties of anodically oxidized aluminium, Thin Solid Films, 138, 97–109, https://doi.org/10.1016/0040-6090(86)90220-8, 1986.
Peng, Z. and Jimenez, J. L.: KinSim: A Research-Grade, User-Friendly, Visual Kinetics Simulator for Chemical-Kinetics and Environmental-Chemistry Teaching, J. Chem. Educ., 96, 806–811, https://doi.org/10.1021/acs.jchemed.9b00033, 2019.
Platt, S. M., El Haddad, I., Zardini, A. A., Clairotte, M., Astorga, C., Wolf, R., Slowik, J. G., Temime-Roussel, B., Marchand, N., Ježek, I., Drinovec, L., Močnik, G., Möhler, O., Richter, R., Barmet, P., Bianchi, F., Baltensperger, U., and Prévôt, A. S. H.: Secondary organic aerosol formation from gasoline vehicle emissions in a new mobile environmental reaction chamber, Atmos. Chem. Phys., 13, 9141–9158, https://doi.org/10.5194/acp-13-9141-2013, 2013.
Pozdnyakov, I. P., Kel, O. V., Plyusnin, V. F., Grivin, V. P., and Bazhin, N. M.: New insight into photochemistry of ferrioxalate, J. Phys. Chem. A, 112, 8316–8322, https://doi.org/10.1021/jp8040583, 2008.
Reeser, D. I., George, C., and Donaldson, D. J.: Photooxidation of halides by chlorophyll at the air-salt water interface, J. Phys. Chem. A, 113, 8591–8595, https://doi.org/10.1021/jp903657j, 2009.
Ren, Y., Grosselin, B., Daële, V., and Mellouki, A.: Investigation of the reaction of ozone with isoprene, methacrolein and methyl vinyl ketone using the HELIOS chamber, Faraday Discuss., 200, 289–311, https://doi.org/10.1039/c7fd00014f, 2017.
Rohrer, F., Bohn, B., Brauers, T., Brüning, D., Johnen, F. J., Wahner, A., and Kleffmann, J.: Characterisation of the photolytic HONO-source in the atmosphere simulation chamber SAPHIR, Atmos. Chem. Phys., 5, 2189–2201, https://doi.org/10.5194/acp-5-2189-2005, 2005.
Romano, A., Capozzi, V., Spano, G., and Biasioli, F.: Proton transfer reaction–mass spectrometry: online and rapid determination of volatile organic compounds of microbial origin, Appl. Microbiol. Biot., 99, 3787–3795, https://doi.org/10.1007/s00253-015-6528-y, 2015.
Rossignol, S., Aregahegn, K. Z., Tinel, L., Fine, L., Nozière, B., and George, C.: Glyoxal induced atmospheric photosensitized chemistry leading to organic aerosol growth, Environ. Sci. Technol., 48, 3218–3227, https://doi.org/10.1021/es405581g, 2014.
Rubasinghege, G. and Grassian, V. H.: Photochemistry of adsorbed nitrate on aluminum oxide particle surfaces, J. Phys. Chem. A, 27, 7818–7825, https://doi.org/10.1021/jp902252s, 2009.
Saathoff, H., Möhler, O., Schurath, U., Kamm, S., Dippel, B., and Mihelcic, D.: The AIDA soot aerosol characterisation campaign 1999, J. Aerosol Sci., 34, 1277–1296, https://doi.org/10.1016/S0021-8502(03)00363-X, 2003.
Saathoff, H., Naumann, K.-H., Möhler, O., Jonsson, Å. M., Hallquist, M., Kiendler-Scharr, A., Mentel, Th. F., Tillmann, R., and Schurath, U.: Temperature dependence of yields of secondary organic aerosols from the ozonolysis of α-pinene and limonene, Atmos. Chem. Phys., 9, 1551–1577, https://doi.org/10.5194/acp-9-1551-2009, 2009.
Scaiano, J. C.: Temperature dependence of the photochemistry of o-methylacetophenone. A laser flash photolysis study, Chem. Phys. Lett., 73, 319–322, https://doi.org/10.1016/0009-2614(80)80381-2, 1980.
Seinfeld, J. H. and Pandis, S. P.: Atmospheric Chemistry and Physics From Air Pollution to Climate Change, 2nd edn., John Wiley & Sons, Hoboken, New Jersey, 116–117, ISBN 0-471-72018-6, 2006.
Sharpless, C. M. and Blough, N. V.: The importance of charge-transfer interactions in determining chromophoric dissolved organic matter (CDOM) optical and photochemical properties, Environ. Sci.-Proc. Imp., 16, 654–671, https://doi.org/10.1039/c3em00573a, 2014.
Shetter, R. E., Davidson, J. A., Cantrell, C. A., Burzynski Jr., N. J., and Calvert, J. G.: Temperature dependence of the atmospheric photolysis rate coefficient for NO2, J. Geophys. Res.-Atmos., 93, 7113–7118, https://doi.org/10.1029/JD093iD06p07113, 1988.
Smith, G. D., Molina, L. T., and Molina, M. J.: Temperature dependence of O(1D) quantum yields from the photolysis of ozone between 295 and 338 nm, J. Phys. Chem. A, 104, 8916–8921, https://doi.org/10.1021/jp001006d, 2000.
Stocker T. F., Qin, D., Plattner, G.-K., Tignor, M., Allen, K. S., Boschung, J., Nauels, A., Xia, Y., Bex, V., and Midgley, M. P.: CLIMATE CHANGE 2013, The Physical Science Basis. Contribution of Working Group 1 to the Fifth Assessment Report of the Intergovernmental Panel on Climate Change, Cambridge University Press, Cambridge, 1–2228, ISBN 978-1-107-66182-0, 2013.
Szabó, E., Djehiche, M., Riva, M., Fittschen, C., Coddeville, P., Sarzyński, D., Tomas, A., and Dóbé, S.: Atmospheric chemistry of 2,3-pentanedione: Photolysis and reaction with OH radicals, J. Phys. Chem. A, 115, 9160–9168, https://doi.org/10.1021/jp205595c, 2011.
Tadić, J., Moortgat, G. K., and Wirtz, K.: Photolysis of glyoxal in air, J. Photoch. Photobio. A, 177, 116–124, https://doi.org/10.1016/j.jphotochem.2005.10.010, 2006.
Task Group on Atmospheric Chemical Kinetic Data Evaluation: https://iupac-aeris.ipsl.fr/htdocs/datasheets/pdf/NOx24_NO_O3.pdf, last access: 22 March 2022.
Vallon, M., Gao, L., Jiang, F., Krumm, B., Nadolny, J., Song, J., Leisner, T., and Saathoff, H.: Light spectra measured inside the AIDA aerosol and cloud simulation chamber, KITopen [data set], https://doi.org/10.5445/IR/1000143326, 2022.
Wagner, R., Bunz, H., Linke, C., Möhler, O., Naumann, K.-H., Saathoff, H., Schnaiter, M., and Schurath, U.: Chamber Simulations of Cloud Chemistry: The AIDA Chamber, in: Nato Science Series: IV: Earth an Environmental Science, edited by: Barnes, I. and Rudzinky, K. J., Springer, Dordrecht, 62, 67–82, https://doi.org/10.1007/1-4020-4232-9_5, 2006.
Wang, J., Doussin, J. F., Perrier, S., Perraudin, E., Katrib, Y., Pangui, E., and Picquet-Varrault, B.: Design of a new multi-phase experimental simulation chamber for atmospheric photosmog, aerosol and cloud chemistry research, Atmos. Meas. Tech., 4, 2465–2494, https://doi.org/10.5194/amt-4-2465-2011, 2011.
Wantuck, P. J., Oldenburg, R. C., Baughcum, S. L., and Winn, K. R.: Removal Rate Constant Measurements for CH3O by O2 over the 298–973 K Range, J. Phys. Chem., 91, 4653–4655, https://doi.org/10.1021/j100302a004, 1987.
Wiesen P.: Photooxidant Studies Using the European Photoreactor EUPHORE, in: Transport and Chemical Transformation in the Troposphere, 2nd edn., edited by: Midgley, P. M., Reuther, M., and Williams, M., Springer, Berlin, Heidelberg, 155–162, https://doi.org/10.1007/978-3-642-56722-3_25, 2001.
Yu, J., Flagan, R. C., and Seinfeld, J. H.: Identification of products containing −COOH, −OH, and −C=O in atmospheric oxidation of hydrocarbons, Environ. Sci. Technol., 32, 2357–2370, https://doi.org/10.1021/es980129x, 1998.
Yuan, B., Koss, A. R., Warneke, C., Coggon, M., Sekimoto, K., and de Gouw, J. A.: Proton-Transfer-Reaction Mass Spectrometry: Applications in Atmospheric Sciences, Chem. Rev., 117, 13187–13229, https://doi.org/10.1021/acs.chemrev.7b00325, 2017.
Zádor, J., Turányi, T., Wirtz, K., and Pilling, M. J.: Measurement and investigation of chamber radical sources in the European Photoreactor (EUPHORE), J. Atmos. Chem., 55, 147–166, https://doi.org/10.1007/s10874-006-9033-y, 2006.
Zuo, Y. and Hoigné, J.: Photochemical decomposition of oxalic, glyoxalic and pyruvic acid catalysed by iron in atmospheric waters, Atmos. Environ., 28, 1231–1239, https://doi.org/10.1016/1352-2310(94)90270-4, 1994.
- Abstract
- Introduction
- Experimental overview
- Construction of the light source
- Characterization of the light source
- Photolysis of 2,3-pentanedione
- Photolysis of dissolved organic components
- Conclusions
- Data availability
- Author contributions
- Competing interests
- Disclaimer
- Special issue statement
- Acknowledgements
- Financial support
- Review statement
- References
- Supplement