the Creative Commons Attribution 4.0 License.
the Creative Commons Attribution 4.0 License.
 | 28 Mar 2022
Optimized Umkehr profile algorithm for ozone trend analyses
Irina Petropavlovskikh
Koji Miyagawa
Audra McClure-Beegle
Bryan Johnson
Jeannette Wild
Susan Strahan
Krzysztof Wargan
Richard Querel
Lawrence Flynn
Eric Beach
Gerard Ancellet
Sophie Godin-Beekmann
The long-term record of Umkehr measurements from four NOAA Dobson spectrophotometers was reprocessed after updates to the instrument calibration procedures. In addition, a new data quality-control tool was developed for the Dobson automation software (WinDobson). This paper presents a comparison of Dobson Umkehr ozone profiles from NOAA ozone network stations – Boulder, the Haute-Provence Observatory (OHP), the Mauna Loa Observatory (MLO), Lauder – against several satellite records, including Aura Microwave Limb Sounder (MLS; ver. 4.2), and combined solar backscatter ultraviolet (SBUV) and Ozone Mapping and Profiler Suite (OMPS) records (NASA aggregated and NOAA cohesive datasets). A subset of satellite data is selected to match Dobson Umkehr observations at each station spatially (distance less than 200 km) and temporally (within 24 h). Umkehr Averaging kernels (AKs) are applied to vertically smooth all overpass satellite profiles prior to comparisons. The station Umkehr record consists of several instrumental records, which have different optical characterizations, and thus instrument-specific stray light contributes to the data processing errors and creates step changes in the record. This work evaluates the overall quality of Umkehr long-term measurements at NOAA ground-based stations and assesses the impact of the instrumental changes on the stability of the Umkehr ozone profile record. This paper describes a method designed to correct biases and discontinuities in the retrieved Umkehr profile that originate from the Dobson calibration process, repair, or optical realignment of the instrument. The Modern-Era Retrospective analysis for Research and Applications version 2 (MERRA-2) Global Modeling Initiative (M2GMI) and NASA Global Modeling Initiative chemistry transport model (GMI CTM) ozone profile model output matched to station location and date of observation is used to evaluate instrumental step changes in the Umkehr record. Homogenization of the Umkehr record and discussion of the apparent stray light error in retrieved ozone profiles are the focus of this paper. Homogenization of ground-based records is of great importance for studies of long-term ozone trends and climate change.
- Article
(6973 KB) - Full-text XML
-
Supplement
(2322 KB) - BibTeX
- EndNote


The success of 30 years of international collaborations since the implementation of the Montreal Protocol and its amendments were celebrated at the Symposium for the 30th Anniversary of the Montreal Protocol (http://www.montreal30.io3c.org/, last access: 21 February 2022), bringing together leading scientists, policymakers, and the public at the French Academy of Sciences in Paris, France (Godin-Beekmann et al., 2018) on 22–23 September 2017. The emphases were on future scientific and public policy challenges for efficiently guiding ozone recovery processes (Newman, 2018). Confirmation of stratospheric ozone recovery was reported in recently published literature (Steinbrecht et al., 2017; Ball et al., 2019; Petropavlovskikh et al., 2019). The current state of stratospheric ozone recovery was summarized in the 2018 WMO/UNEP ozone assessment (WMO, 2018), where trend uncertainties for combined observational records have been used to describe confidence in detected trends. Uncertainty of trend detection did not include full information about ozone measurement uncertainty. The difference in trends derived from satellite combined observational records suggests that further work needs to be done to assure good practices for the homogenization of long-term ozone records. Ground-based records are often used to verify the stability of satellite records (Fioletov et al., 2006; Krzycin and Rajewska-Wich, 2007; Nair et al., 2011, 2012; Flynn et al., 2014; Hubert et al., 2016; Bernet et al., 2019, 2021; Wang et al., 2020). In order to provide the reference, ground-based observations require careful and continuing examination of past calibration records, changes in instrumentation, and assessment of measurement uncertainties. Changes in the frequency of measurements can create complications in interpretation of relative stability of records and the resulting impact on the derived ozone trends (Sofieva et al., 2014; Damadeo et al., 2014).
Multiple studies show statistically significant positive trends in ozone in upper stratospheric levels in tropical and northern midlatitudes, and nearly significant positive trends in the Southern Hemisphere. The statistical and analytical approaches to quantify ozone recovery are complicated by the natural year-to-year variability which is detected in the observed ozone records. Moreover, stratospheric ozone recovery rates are expected to be slower than the decline of stratospheric ozone during the 1980s due to the long lifetime of the ozone-depleting substances. While ozone recovery in the upper stratosphere is mostly determined by halogen levels, temperature plays an important role in ozone recovery, including so-called “super recovery”, where ozone abundances exceed 1980 levels due to greenhouse-gas-induced stratospheric cooling. At the same time, in the lower stratosphere, atmospheric composition and ozone levels are driven by the climate-impacted changes in the Brewer–Dobson circulation and by seasonal-to-decadal variability in stratosphere–troposphere exchange. These processes are difficult to discern and predict based solely on ozone or other atmospheric composition observations (Ball et al., 2019, 2020; Abalos et al., 2019; Orbe et al., 2017; Strahan et al., 2020; Dietmüller et al., 2021). Analyses of the processes that are responsible for ozone changes through atmospheric chemistry and dynamical transport rely on the development of climate chemistry models (CCMs, Morgenstein et al., 2017). However, the long-standing differences between the model reconstruction of the past ozone variability and observations suggest the need for improvement of simulations of the seasonal to subseasonal processes. Continuous verification of modeling results with the ongoing long-term measurements will help with understanding the processes that determine ozone recovery. Dobson Umkehr time series beginning in the 1950s are one of a few long-term historical ozone observational records. Continuous Umkehr datasets provide a reference for testing consistency among shorter satellite and remote sensing methods and are used to validate combined records (Petropavlovskikh et al., 2005a; Kramarova et al., 2013).
The Umkehr method is based on measuring the difference in zenith-sky intensities selected from two spectral regions (centered on 311.5 and 332.4 nm, so-called C-pair spectral channels) over a range of solar zenith angles (SZAs). The longest records are those from Dobson and Brewer spectrophotometers. The logs of the ratio of the observed radiances (also called N values) increase with increasing SZA, and at about 86∘ SZA reverses and starts to decrease up to 90∘ SZA, which grants the observation its name since “Umkehr” means reversal or change in German. Using the Umkehr effect for calculating vertical ozone distribution was first described by Götz et al. (1934). The earliest Umkehr measurements were performed in the 1930s in Arosa, Switzerland (Staehelin et al., 2018). The method helped to determine the altitude of the maximum in the ozone layer and was applied around the world to study seasonal and interannual cycles in ozone distribution. Several algorithms were developed to improve the Umkehr method, and with an advance in computers, the processing algorithm was developed by Mateer (1965). He investigated the impacts of the a priori and vertical smoothing to assess the vertical resolution in the retrieved profile. The algorithm used Vigroux ozone absorption cross sections (Vigroux, 1953). Carl Mateer applied his experience with the Umkehr method in developing the first algorithm for satellite ozone retrieval (Mateer, 1971). After Bass and Paur (1985) published a new absorption cross section and its temperature dependence, Mateer and DeLuisi updated the Umkehr algorithm (Mateer and DeLuisi, 1992). DeLuisi (1979) and DeLuisi et al. (1989) studied the effects of volcanic aerosol interferences and found that stratospheric aerosols from the Agung and El Chichón eruptions produced large errors in Umkehr-retrieved ozone profiles.
Despite short-term impacts from stratospheric aerosols on Umkehr ozone retrievals, the length and stability of the record were considered as an advantage for satellite validation. Newchurch et al. (1987) provided reference to the Stratospheric Aerosol and Gas Experiment (SAGE) I ozone data processing to assist with the correction of its altitude registration. The analysis helped to homogenize SAGE I and SAGE II records for trend analyses. Comparisons of Umkehr profiles with multiple Solar Backscatter Ultraviolet Radiometer 2 (SBUV(/2)) ozone records (Bhartia et al., 2013) aided in assessment of offsets between individual SBUV(/2) instrumental records due to satellite drifting orbit (Kramarova et al., 2013). Because of its long-term measurement record, Umkehr data are regularly used for scientific assessments of ozone depletion (Harris et al., 1998). They were first used in the early 1980s (Reinsel et al., 1984) to estimate changes in stratospheric ozone depletion over long-term stations in the US, India, Australia, Canada, and Europe.
Some global locations that host a Dobson instrument have been providing routine, morning and afternoon, Umkehr observations to the World Ozone and UV Radiation Center (WOUDC) database, including a number of stations hosting Umkehr time series that start in the late 1950s. This renders the Umkehr ozone profiles the longest ozone profile time series (Bojkov et al., 2002) and is central in validating other observational methods (Petropavlovskikh et al., 2005a), as well as numerical models that simulate and forecast ozone content changes (Zanis et al., 2006). These profiles do not come as a replacement to other ground-based observations of the ozone profile but rather serve to complement them. Ozonesonde observations provide a much finer vertical resolution profile; however, the measurements typically stop at the balloon-burst altitude of 30 km (Deshler et al., 2008), and the launches are typically performed once a week or less (with the exception of two stations in Europe where sampling is done three times a week). The issue of relatively short time records also applies to lidar (Jiang et al., 2007) and microwave (Moreira et al., 2017) observations.
The Umkehr retrieval algorithm relies on the “self-calibration” technique that applies normalization of a set of morning or afternoon measurements to a single measurement selected at the smallest SZA. This process removes the majority of the instrumental artifacts and homogenizes time series. The vertical distribution of ozone is retrieved in 10 ozone layers between surface and ∼ 45 km. However, routine (operational) data processing is still not optimized to account for an out-of-band (i.e., known as stray) light that affects measurements at the high SZAs (Petropavlovskikh et al., 2005b; Evans et al., 2009). Optimization of stray light correction is a unique process to each Dobson instrument as it depends on its bandpass and optical alignment that are not always known from the historical calibration records. Recent attempts to measure the bandpasses of several Dobson instruments in the optical lab with lasers (Köhler et al., 2018) led to an investigation of instrumental uncertainties in Dobson total ozone retrieval. The band-pass adjustment for some instruments lead to several percent change in derived total column ozone. However, not many instruments have been optically characterized so far. The Dobson Umkehr algorithm thus requires an extensive verification of stray light levels in multiple instruments used to create long-term records. Change of the instrument can introduce step changes in the vertical distribution of retrieved ozone profiles and thus affect the stability of the long-term record.
Table 1NOAA Dobson Umkehr data information: Name of the station, WMO code, dates of the record (month and year), and geolocation of the ground-based stations.
NOAA Dobson ozone observations are positioned to continue monitoring stratospheric ozone recovery for the next 30 years. In addition to the six NOAA Dobson stations (Table 1) and four NOAA Brewer stations, Umkehr observations are regularly performed by several Dobson (three) and Brewer spectrometers (six) that are distributed globally. Stratospheric ozone recovery rates will differ between tropics, middle latitudes, and high latitudes (WMO, 2018). Umkehr stations are located at multiple locations around the world and will hence provide important information for tracking ozone recovery.
The current operational Umkehr profile algorithm produces data that have relatively large uncertainty (∼ 5 % in the stratosphere, Hassler et al., 2014; also see Fig. 2 in Petropavlovskikh et al., 2005b), which precludes our ability to detect small changes in stratospheric ozone. The refinement of the processing software is required to resolve the instrument-related offsets in ozone profile retrievals. It is also important to remove offsets between satellite and ground-based ozone profiles to further improve the satellite ozone profile validation process. The main objective of this paper is to reduce noise in the existing Umkehr records and therefore improve its suitability for detection of relatively small trends (e.g., 1 %–3 % over the 2000–2016 period, Petropavlovskikh et al., 2019). In addition, continuous improvement of the satellite retrieval algorithms requires ground-based observations of high accuracy and stability, which the optimized Umkehr record aims to provide.
In this paper, we discuss optimization approach to homogenize long-term Umkehr ozone profile records. In Sect. 2, we describe several long-term ozone-observing records and model simulations of stratospheric ozone variability selected for this study. We also discuss a matching criterion for comparisons of these records with ground-based observations. In Sect. 3, we present methods developed for identification of vertical and temporal offsets between operational Umkehr and other ozone-observing systems. Then, we describe the approach for removing offsets to homogenize Umkehr record. Finally, in Sect. 4, we demonstrate the consistency between optimized Umkehr and other ozone records.
2.1 NOAA Dobson total ozone and Umkehr ozone profiles
Dobson total column ozone records are regularly used in satellite record validation (Bai et al., 2015; Koukoulil et al., 2016; Boynard et al., 2018) and development of the global combined ozone data records (Fioletov, 2008; Hassler et al., 2008). In 2017, NOAA long-term Dobson total column ozone records at 15 stations were homogenized to account for inconsistencies in the past calibration records, data processing methods, and selection of representative data. The updated total ozone records are used in Umkehr ozone profile retrievals. Descriptions of three Dobson stations used in this paper analysis, instrumentation, and total ozone data changes can be found in Evans et al. (2017).
The ozone profile data at NOAA are collected by Dobson instruments with Umkehr method deployed only at six ground-based stations: Fairbanks, AK, USA; the Haute-Provence Observatory (OHP), France; Boulder, CO, US; Mauna Loa, Hawaii, US; Perth, Australia; and Lauder, New Zealand (Table 1). Observations at all Umkehr stations are ongoing except at Perth where the Dobson stopped collecting data in 2016. In this paper, we focus our discussion of changes in Umkehr record at Boulder, CO. Section S1 in the Supplement shows summary results for the OHP (middle northern latitude), the Mauna Loa Observatory (MLO) (tropical latitude) and Lauder (Southern Hemisphere middle latitude) stations, while results for Fairbanks (high northern latitudes) and Perth (middle southern latitudes) are similar to other stations and therefore are not shown.
The Umkehr data collection is automated by the NOAA WinDobson operational software (Evans et al., 2017) that schedules zenith-sky observations at C-pair spectral channels during the morning and afternoon hours. During the automation, the observational process (i.e., frequency of observations, signal-to-noise ratio, cloud clearance, etc.) is changed. The software uses the near-IR cloud detector to screen the Umkehr data for clear-sky conditions, interpolates screened observations to 12 nominal SZAs, adds total column ozone information, processes data, and checks retrieved ozone profiles for quality flags and against station climatological variability (±2 standard deviations). This process results in the improved quality assurance of observations and reduces cloud-induced anomalies in the Umkehr data. The quality check of the retrieved ozone profile includes assessment of the number of iterations (fewer than four is considered a good profile) and the condition that the difference between observed and retrieved Umkehr observations at all SZAs remains within measurement uncertainty (Petropavlovskikh et al., 2005b). The number of accepted Umkehr profiles per month depends on the station geolocation and season and can vary between a few (e.g., at Boulder in spring due to seasonal increase in clouds) and up to 60 (e.g., at MLO when counting both morning and afternoon retrievals in winter), but on average Umkehr stations observe 15 profiles per month or more (∼ 30 profiles at MLO). NOAA Dobson Umkehr operational ozone profile data are posted on the GML archive https://gml.noaa.gov/aftp/data/ozwv/Dobson/AC4/Umkehr/ (last access: 21 May 2021). The Umkehr observations are archived at the WOUDC (https://www.woudc.org, last access: 18 October 2018), operated by the Environment Climate Change Canada, where the centralized data processing is done by Python-based version of the UMK04 processing software (https://github.com/woudc/woudc-umkehr, last access: 18 October 2018). The content of the files at the NOAA and WOUDC archives is the same as that for the operational Umkehr ozone profile record, but the format differs.
2.2 Ozonesonde data
The ozonesonde instrument has been launched on the meteorological balloons since the 1980s at 10 NOAA stations. Evolving instrumentation has created discontinuities and gaps leading to inhomogeneous data records. NOAA and the international community developed homogenization methods for ozonesondes that were applied to NOAA and Southern Hemisphere Additional Ozonesondes (SHADOZ) networks (Sterling et al., 2018; Witte et al., 2018). The error budget for each profile is calculated and included in the archived files (Sterling et al., 2018). Modern ozonesonde instruments sample ozone at the high vertical resolution, on the order of 100–200 m. The sondes constitute an essential component of satellite calibration and cross calibration (Hubert et al., 2016) and are used for verification and improvement of climate chemistry, chemistry transport models, and reanalyses (Stone et al., 2016; Miyazaki and Bowman, 2017; Wargan et al., 2018; Stauffer et al., 2019). The ozonesonde profile records provide key measurements for the middle and lower stratospheric, and tropospheric ozone trend calculations and are a benchmark network for stratospheric ozone profile observations (Steinbrecht et al., 2017; Petropavlovskikh et al., 2019; WMO, 2018). Data for ozonesonde records are publicly available from the NOAA Global Monitoring Lab (GML) at https://gml.noaa.gov/aftp/ozwv/Ozonesonde/ (last access: 10 March 2021), from the WOUDC at https://www.woudc.org (last access: 18 October 2021), from the Network for the Detection of Atmospheric Composition Change (NDACC) at https://www.ndacc.org (last access: 8 July 2021), and from the NOAA National Centre for Environmental Information (NCEI) archive at https://data.nodc.noaa.gov/cgi-bin/iso?id=gov.noaa.ncdc:C01562 (last access: 3 October 2021). In this paper, we are using ozonesonde data from Boulder, USA; Hilo, USA; and Lauder, New Zealand. The data for the first two stations are taken from the NOAA GML archive and are homogenized versions (Sterling et al., 2018). The Lauder ozonesonde data prior to 2018 were provided by Richard Querel of NIWA, New Zealand, for the use in the LOTUS report (Petropavlovskikh et al., 2019). This dataset is not homogenized, and the data are the same as those archived at NDACC (http://www.ndaccdemo.org/, last access: 8 July 2021). We extended Lauder ozonesonde data with the unhomogenized 2018–2020 data downloaded from the NDACC archive (last accessed in April 2021). The OHP ozonesonde data were homogenized in 2020. The data are available from the NDACC archive (Gaudel et al., 2015). However, the NDACC version at the time of data analyses contained some small errors associated with the telemetry noise in the recent measurement period. Therefore, we used the latest version provided by Gerard Ancellet and Sophie Godin-Beekmann of Latmos, France (Gerard Ancellet and Sophie Godin-Beekmann, personal communications, 15 June 2021), which is also now archived at NDACC.
2.3 Satellite ozone profile data
Several satellite records are used for monitoring ozone globally and vertically. In this paper, we are using daily NOAA and NASA long-term records that are sampled for the Umkehr station overpass conditions and also matched in time with Umkehr profiles.
2.3.1 SBUV and OMPS ozone profile records
NASA and NOAA have produced satellite measurements of ozone profiles through the SBUV and related instruments (Nimbus 4 and 7) providing nearly 40 years of continuous data (1978–present). The use of the common-design single-instrument dataset eliminates many homogeneity issues including varying vertical resolution or instrumentation differences. Version 8.6 SBUV data incorporate additional calibration adjustments beyond the version 8 release (McPeters et al., 2013; Bhartia et al., 2013). Small but evident biases remain (Kramarova et al., 2013).
The Suomi National Polar-orbiting Partnership (S-NPP) satellite of the Joint Polar Satellite System (JPSS) was launched in October 2011 (Flynn et al., 2006). It carries the Ozone Mapping and Profiler Suite nadir profiler (further referred to as OMPS) sensor that collects high spectrally resolved solar backscattered radiance in the sunlit part of the globe (Seftor et al., 2014). OMPS makes measurements from 250 to 310 nm with a 1.1 nm resolution. It has a 16.6∘ cross-track FOV and 0.26∘ along-track slit width, but several spectrums are combined to cover a footprint of 250 × 250 km. The ozone profile retrieval is very similar to the Rodgers optimal statistical method deployed in the SBUV and Umkehr retrieval techniques. Validation of the NOAA operational OMPS ozone profile products is described in Flynn et al. (2014). Evaluation of the OMPS NASA V8.6 algorithm products for trend analyses is described in McPeters et al. (2019).
In this paper, we used two satellite combined records. The first record is the NASA aggregated dataset (further referred to as AGG), which is comprised of SBUV, SBUV/2, and OMPS profiles from all (Nimbus 4 through NOAA 19) overlapping satellites and using the NASA version 8.6 processing (McPeters et al., 2013). The AGG station overpass data are selected from all daily records that are found within the ±2∘ latitude, ±20∘ longitude box centered on the station location and averaged using 1 distance weighting to the station location. The dataset for Boulder station is available at https://acd-ext.gsfc.nasa.gov/anonftp/toms/sbuv/AGGREGATED/sbuv_aggregated_boulder.co_067.txt (last access: 10 March 2021). The AGG overpass records for other Umkehr stations can be found in the same directory. Sometimes, there are two or three satellite overpass data found for a single day. For the purpose of comparisons with Umkehr data, all daily records are averaged.
The second record is the NOAA COHesive (COH) dataset that combines records data from the SBUV/2 and OMPS (NOAA processing, further referred to as OMPS_NOAA) instruments on the many satellites using correlation-based adjustments providing an overall bias adjustment plus an ozone-dependent factor (Petropavlovskikh et al., 2019). The resulting profile product is a set of daily or monthly zonal means, has been used in climate reviews (Weber et al., 2018; Steinbrecht et al., 2017), and is publicly available at http://ftp.cpc.ncep.noaa.gov/SBUV_CDR/ (last access: 10 March 2021).
In order to create the station overpass data, each SBUV/2 and OMPS satellite record is sampled separately to find all daily records from ±2/20∘ latitude/longitude box centered on the station. The collected profiles are 1 distance weighted to the station location and averaged. This is a similar process to the AGG overpass record but does not combine daily data from different satellites. The overpass data from each satellite are adjusted using the SBUV COH technique developed for zonal average data. The SBUV/2 and OMPS COH station overpass data (further referred to as COH) are available on the NOAA website at http://ftp.cpc.ncep.noaa.gov/SBUV_CDR/overpass (last access: 18 June 2021).
2.3.2 Aura MLS profiles
The Microwave Limb Sounder (MLS) measured ozone profiles from the Upper Atmosphere Research Satellite (UARS) and Aura satellite platforms (Waters et al., 1999). We use Aura MLS version 4.2 data (Livesey et al., 2020) for comparisons with Umkehr observations during the 2005–2020 period. MLS version 5.1 was not available at the time of analysis; the ozone product is not expected to differ significantly between the two versions (Livesey et al., 2020). Retrieved ozone values are computed for 12 levels per decade change in pressure. That is, 12 levels are selected between 1 and 10 hPa; another 12 levels are selected between 10 and 100 hPa, and also between 100 and 1000 hPa. The spacing is linear in log pressure. The vertical resolution of the MLS averaging kernel (AK) is about 2.6 km in the middle stratosphere and increases to ∼ 3.5 km at 1 hPa pressure level. The MLS mixing ratio profiles are converted to layers in DU using pressure and temperature profiles provided in the files as also measured by MLS. The Umkehr AKs are applied to smooth MLS gridded profiles prior to comparisons. The frequency of MLS observations in space and time (3500 profiles daily between 82∘ N and 82∘ S latitudes) provides matching overpasses within ±5∘ latitude and ±5∘ longitude of the Umkehr station location. Validation of the accuracy of MLS ozone profiles and their stability is described in Livesey et al. (2020). The MLS ozone profiles are assimilated in the Modern-Era Retrospective analysis for Research and Applications version 2 (MERRA-2) reanalyses (Wargan et al., 2017 and references therein). Section 2.4 discusses MERRA-2 data used in the global NASA chemistry transport models used for Umkehr homogenization.
2.3.3 SAGE II ozone record
SAGE is an ongoing series of solar occultation instruments spanning several decades providing high-precision vertical profiles of ozone from the troposphere to the mesosphere with ∼ 1 km vertical resolution. Providing the longest single-instrument record of stratospheric ozone, SAGE II (Mauldin et al., 1986) was operational aboard the Earth Radiation Budget Satellite between October 1984 and August 2005. In this paper, we use the 1985–2000 period to avoid the reduced sampling after 2000. In mid-inclination orbit (57∘), the instrument observed upwards of 31 solar occultation measurements per day (∼ 15 sunrises and ∼ 15 sunsets as viewed from orbit). The sampling is such that, for each event type, successive observations are evenly spaced in longitude (i.e., ∼ 24∘ between each) and slowly moving in latitude, collectively providing uniform sampling over two separate latitude bands of different meridional extents (i.e., larger near the tropics and narrower at midlatitudes) in any given day that slowly shifts from day to day. Because of the infrequent sampling, the matching criteria for the SAGE II ozone satellite data are relaxed to ±20∘ in longitude and ±2∘ in latitude. The SAGE II ozone V7 data are available as number density profiles at pressure levels from this directory: https://doi.org/10.5067/ERBS/SAGEII/SOLAR_BINARY_L2-V7.0 (NASA/LARC/SD/ASDC, 2012). The number density profile is converted to ozone partial pressure and to DU (1 DU is 2.69 × 10²⁰ molecules m−1) using pressure and temperature profiles provided in the files which are based on MERRA. The high-resolution SAGE II profile is smoothed with AKs from the respective Umkehr profile found by temporal and spatial matching as described above.
2.4 GMI CTM and M2GMI simulated ozone profiles
The NASA Global Modeling Initiative chemistry transport model (GMI CTM), an offline model driven by MERRA-2 meteorological reanalysis (Gelaro et al., 2017), is used to assess the impact of various natural and anthropogenic perturbations of atmospheric composition and chemistry (Strahan et al., 2007, 2013). Strahan et al. (2016) uses the excellent agreement between simulated and observed seasonal evolution of Arctic N2O to demonstrate the simulation's value in quantitatively separating chemical from dynamical changes in polar ozone depletion during the Aura period (2004–2015). Douglass et al. (2017) compared a GMI CTM simulation with midlatitude NDACC column measurements of long-lived reservoir species HNO3 and HCl to verify the realism of MERRA-2 transport in both hemispheres from 2004 to the present and to demonstrate the value of GMI CTM simulations to explain how sparse sampling impacts interpretation of trends in the observations. Strahan et al. (2015) analyzed MLS N2O data to show that the quasi-biennial oscillation (QBO) had a profound and far-reaching impact on Cly variability in the Southern Hemisphere. The QBO modulates the extratropical mean age (and hence N2O and Cly) each winter, and the impacts are then transported to the Antarctic lower stratosphere on a 1-year timescale. The QBO adds unexpected interannual variability to equivalent effective stratospheric chlorine (EESC) in the southern extratropical stratosphere.
The CTM is integrated at 1∘ horizontal resolution on 72 vertical levels from the surface to 0.01 hPa and uses MERRA-2 meteorological fields as input. The output from the GMI CTM simulation is available for 1985–present (https://portal.nccs.nasa.gov/datashare/dirac/gmidata2/users/mrdamon/Hindcast-Family/HindcastMR2V2/, last access: 23 February 2021). The CTM's tropospheric physical processes include convection, boundary layer turbulent transport, wet scavenging in convective updrafts, wet and dry deposition, lightning NOx production, and anthropogenic, natural, and biogenic emissions. The chemical mechanism uses JPL-2015 rates and currently has 119 species and more than 400 kinetic and photolytic reactions; it is an updated version of the mechanism described in Duncan et al. (2008).
Customized GMI CTM simulation outputs were created for the three NOAA Dobson Umkehr stations for 1979–2017 to assist in the assessment of the instrumental offsets and to develop instrument-specific corrections to homogenize the Umkehr record. GMI CTM data at the NDACC sites (including six NOAA Umkehr sites) are available at https://www.ndacc.org (last access: 8 July 2021). The files contain vertical profiles of O3, NO2, H2O, temperature, pressure, potential temperature, and potential vorticity on a geometric altitude grid with hourly time resolution. Model output is generated on geometric altitude, geopotential height, or pressure-level grids as needed for comparisons with Umkehr that is derived as pressure-level gridded layer data. Daily global ozone, trace gas, and meteorological fields are also available as needed for synoptic-scale interpretation of Dobson and ozonesonde data.
We use another simulation M2GMI (Orbe et al., 2017; Wargan et al., 2018) that is available for Umkehr step-change analyses. It is called MERRA-2 GMI (M2GMI). M2GMI is the full GEOS general circulation model (GCM) with the GMI chemical mechanism and is driven by the MERRA-2 horizontal winds, temperature, and surface pressure using the “replay” methodology (Orbe et al., 2017). The MERRA-2 assimilated meteorological fields are used by the model to simulate meteorology that is continuously adjusted to the MERRA-2 winds, temperature, and surface pressure. Comparisons of the M2GMI against MERRA-2, GMI CTM, and ozonesonde profiles have been recently described in Stauffer et al. (2019).
The step change in the GMI CTM ozone record in 1998 was documented (Stauffer et al., 2019, and references therein). It was a result of the introduction of microwave radiance observations from a series of Advanced Microwave Sounding Unit (AMSU) sensors into the MERRA-2 observing system (Gelaro et al., 2017). The 1998 change as well as the addition of MLS temperature assimilation in the upper stratosphere in 2004 strongly impacted the MERRA-2 dynamical fields (Gelaro et al., 2017; Long et al., 2017). The MERRA-2 analysis increments alter the wind fields that come from its GCM, pushing them toward the meteorological observations. Where the GCM has biases, the increments are large, driving unrealistic circulations that impact the GMI CTM stratospheric ozone distributions in the tropics and subtropics.
There are differences between the GMI CTM and M2GMI ozone simulations. Even though they both use the same full GMI chemical mechanism, the meteorology used in the two models is not identical. In the GMI CTM, the MERRA-2 meteorological product is used. M2GMI output is driven by a specified dynamics (SD) simulation. Instead of using MERRA-2 meteorology, this SD uses a different method: “replay” (see further description in Orbe et al., 2017). Because the 1998 and 2005 discontinuity is smoothed in the M2GMI ozone record (Stauffer et al., 2019), we decided to use its ozone data as a reference for the Umkehr optimization. In addition, we are using the GMI CTM output for assessment of changes in the optimized Umkehr record and for evaluation of ozone variability represented by two modeling records.
The M2GMI ozone profile output is subsampled for the Boulder, OHP, MLO (or Hilo), and Lauder Dobson station geolocations (selected from the grid closest to the station location) and is matched within 30 min to the Umkehr observation (local time for the averaged Sun elevation between 70 and 90∘ SZA). The ozone profiles are provided on the constant pressure levels that are converted to Dobson units (DUs) and smoothed with Umkehr AKs to created Umkehr-like layers. This is the version of data that is used as a reference dataset for Umkehr optimization. The M2GMI ozone and temperature profiles are available for the 1980–2019 time period (https://www.esrl.noaa.gov/gmd/aftp/data/ozwv/Dobson/AC4/, last access: 21 May 2021). In addition, the temperatures are used to adjust ozone absorption cross sections in the radiative transfer modeling of Umkehr curves to account for the diurnal, daily, and seasonal ozone variability in the stratosphere (see Sect. S4).
2.5 FG11 and QBO a priori
FG11 (further referred to as fg11ap) is a climatological ozone dataset (McPeters and Labow, 2012) that describes typical ozone variability with latitude (5∘ zonal averages) and season (12 months). This is based on the Aura MLS and ozonesonde records measured between 2005 and 2010. Note that the ozone profile on any day of the year is the same in each year of the record. Thus, ozone in each Umkehr layer only changes seasonally.
The QBO a priori (further referred to QBOap) is an ozone climatology developed for analyses of the SBUV records to improve soft calibrations for the MOD ozone record (Ziemke et al., 2021). In addition to the seasonally and latitudinally dependent climatology, the method empirically modifies ozone profiles based on the phase of the QBO cycle. The QBOap is a zonally (36 5∘ latitude bins) and monthly averaged dataset available from 1970 to 2019.
Both climatologies are matched with the dates and latitude location of the Umkehr observation at the Boulder station (40.05∘ N) and are also AK smoothed.
2.6 Combined MLS and ozonesonde record
The Aura MLS record (described in Sect. 2.3.2 above) is matched with ozonesonde profile by date (±12 h) and location (±5∘ in longitude and ±5∘ in latitude). The approach to the combining of MLS and ozonesonde record is described in McPeters and Labow (2012). We use this method to extend MLS station overpass ozone profile below 100 hPa with the ozonesonde profiles. The time series of MLS–ozonesonde combined profiles between 2005 and 2020 is created for the Boulder station. The extended dataset is indicated by SND_MLS in the figures and is used in the homogenization process.
3.1 Description of the Dobson measurement uncertainties
The Dobson consists of two monochromators and a slit plate for selecting two bands (pairs) of the UV solar spectrum approximately 20 nm apart. The Q levers indicate the position of the wavelength pairs (A, C, or D), which also depends on the temperature inside of the instrument. The photomultiplier tube registers the alternating signals from the short wavelength, which is absorbed by ozone, and the long wavelength attenuated by the optical wedge, resulting in the measurable current (see Evans, 2008 for further details). It has been demonstrated (i.e., Moeini et al., 2019) that each Dobson instrument has a unique optical system. Some of the optical wedges are made from fused silica and others from quartz glass. Fused silica has higher UV transmission and is relatively even across the spectra used by the Dobson. The transmission of quartz glass is several percent less and passes longer wavelengths more efficiently. The optical wedges are also designed to have a logarithmic density curve, but wedge calibrations show that it is not uniform across the entire wedge, and some are inherently darker overall. An error in poorly mapped wedge tend to increase toward the darker portion of the wedge, which would have a greater effect on measurements made at large SZAs. The thickness of the cobalt filters can make observations at longer wavelengths more susceptible to stray light.
With time, the optical alignment in the instrument may shift or the optical prisms may degrade. An operational instrument wavelength setting is regularly confirmed using the mercury lamp test. A standard lamp test is used to check the stability of the extraterrestrial constant derived during the station instrument calibration procedures against the reference instrument (every 4–6 years). The characteristics of an optical wedge are checked using two standard lamps (Dobson, 1957; Evans, 2008). The identified changes are post-corrected to homogenize the ozone record at the station. The total ozone changes are typically corrected with a linear adjustment (step change or time-dependent increments based on comparison with the Dobson standard), but for Umkehr measurements the changes are identified through the characterization of the optical wedge, which is then mapped into R–N tables that produce Umkehr N values (N value , and I is the intensity of the UV light observed through two spectral slits of the C-pair observations). The relation between R and N is not linear and thus can modify the shape of the Umkehr curve after the calibrations. This is a small change in N value but can result in a significant (above uncertainty) step change in the Umkehr ozone profile.
The measurement of a Dobson slit function is not a simple task. The original method used a model 783 McPherson spectrophotometer to determine the slit functions for Dobson 083 (Komhyr et al., 1993). The method restricted the slit function to the core bandpass and did not provide information about out-of-band light rejection. Recent investigations of the difference in the core bandpasses of three reference Dobson instruments (regional standard Dobson no. 064, Germany, no. 074, Czech Republic, and the world standard no. 083, USA) were performed with a tuneable laser in a laboratory setting with support from the EMRP ENV 059 project “Traceability for atmospheric total column ozone” (Köhler et al., 2018). Although some small deviations in the bandpasses were found, the effective absorption cross sections derived using each Dobson slit function did not differ significantly and thus affected the derived total column ozone by less than 2 % (depending on the ozone cross section and wavelength pair). Unfortunately, the laboratory setting did not allow assessment of the stray light contribution for the three Dobson instruments.
The non-laboratory-based methods can be used to discern the level of the stray light when referenced against another instrument with similar (Christodoulakis et al., 2015) or higher level of stray light rejection (Moeini et al., 2019). However, even with the knowledge of the instrument-specific bandpass (shape and spectral alignment) and with the expected level of stray light (between 10−4 to 10−5) a small but significant SZA-dependent bias remains unexplained in Umkehr observations. Moreover, this bias propagates into the retrieved Umkehr profiles and creates a 5 %–10 % bias relative to other ozone-observing techniques (Petropavlovskikh et al., 2011). The next session demonstrates the standardized stray light corrections and changes in the Umkehr biases.
3.2 Standardized stray light corrections
The impact of a stray-light-induced error in the Umkehr retrieval is described in Petropavlovskikh et al. (2009) where Umkehr profiles in Boulder were compared against NOAA-11 and NOAA-16 SBUV/2 V8 satellite and ozonesonde coincident profiles. It is further demonstrated in this paper by comparing multi-year biases between operational Umkehr retrievals at three additional stations (Haute-Provence, France; Mauna Loa, Hawaii; and Lauder, New Zealand; see Table 1 for details) and several satellite records (Aura MLS, AGG, and COH; see details in Table 3). Prior to comparisons, all records with vertical resolution less than 2 km (satellites and ozonesondes) are converted to DU, interpolated to 61 pressure levels (quarter of a standard Umkehr pressure layer), and smoothed with the Umkehr AKs. Subsequently, the high-resolution profiles are integrated to the 10 standard Umkehr layers (see Table S1). Figure 1 shows comparisons for Umkehr profiles at Boulder, CO, processed with (a) operational retrieval and (b) with application of standardized correction for stray light. Similar plots for Umkehr records at OHP, MLO, and Lauder appear in Sect. S1.
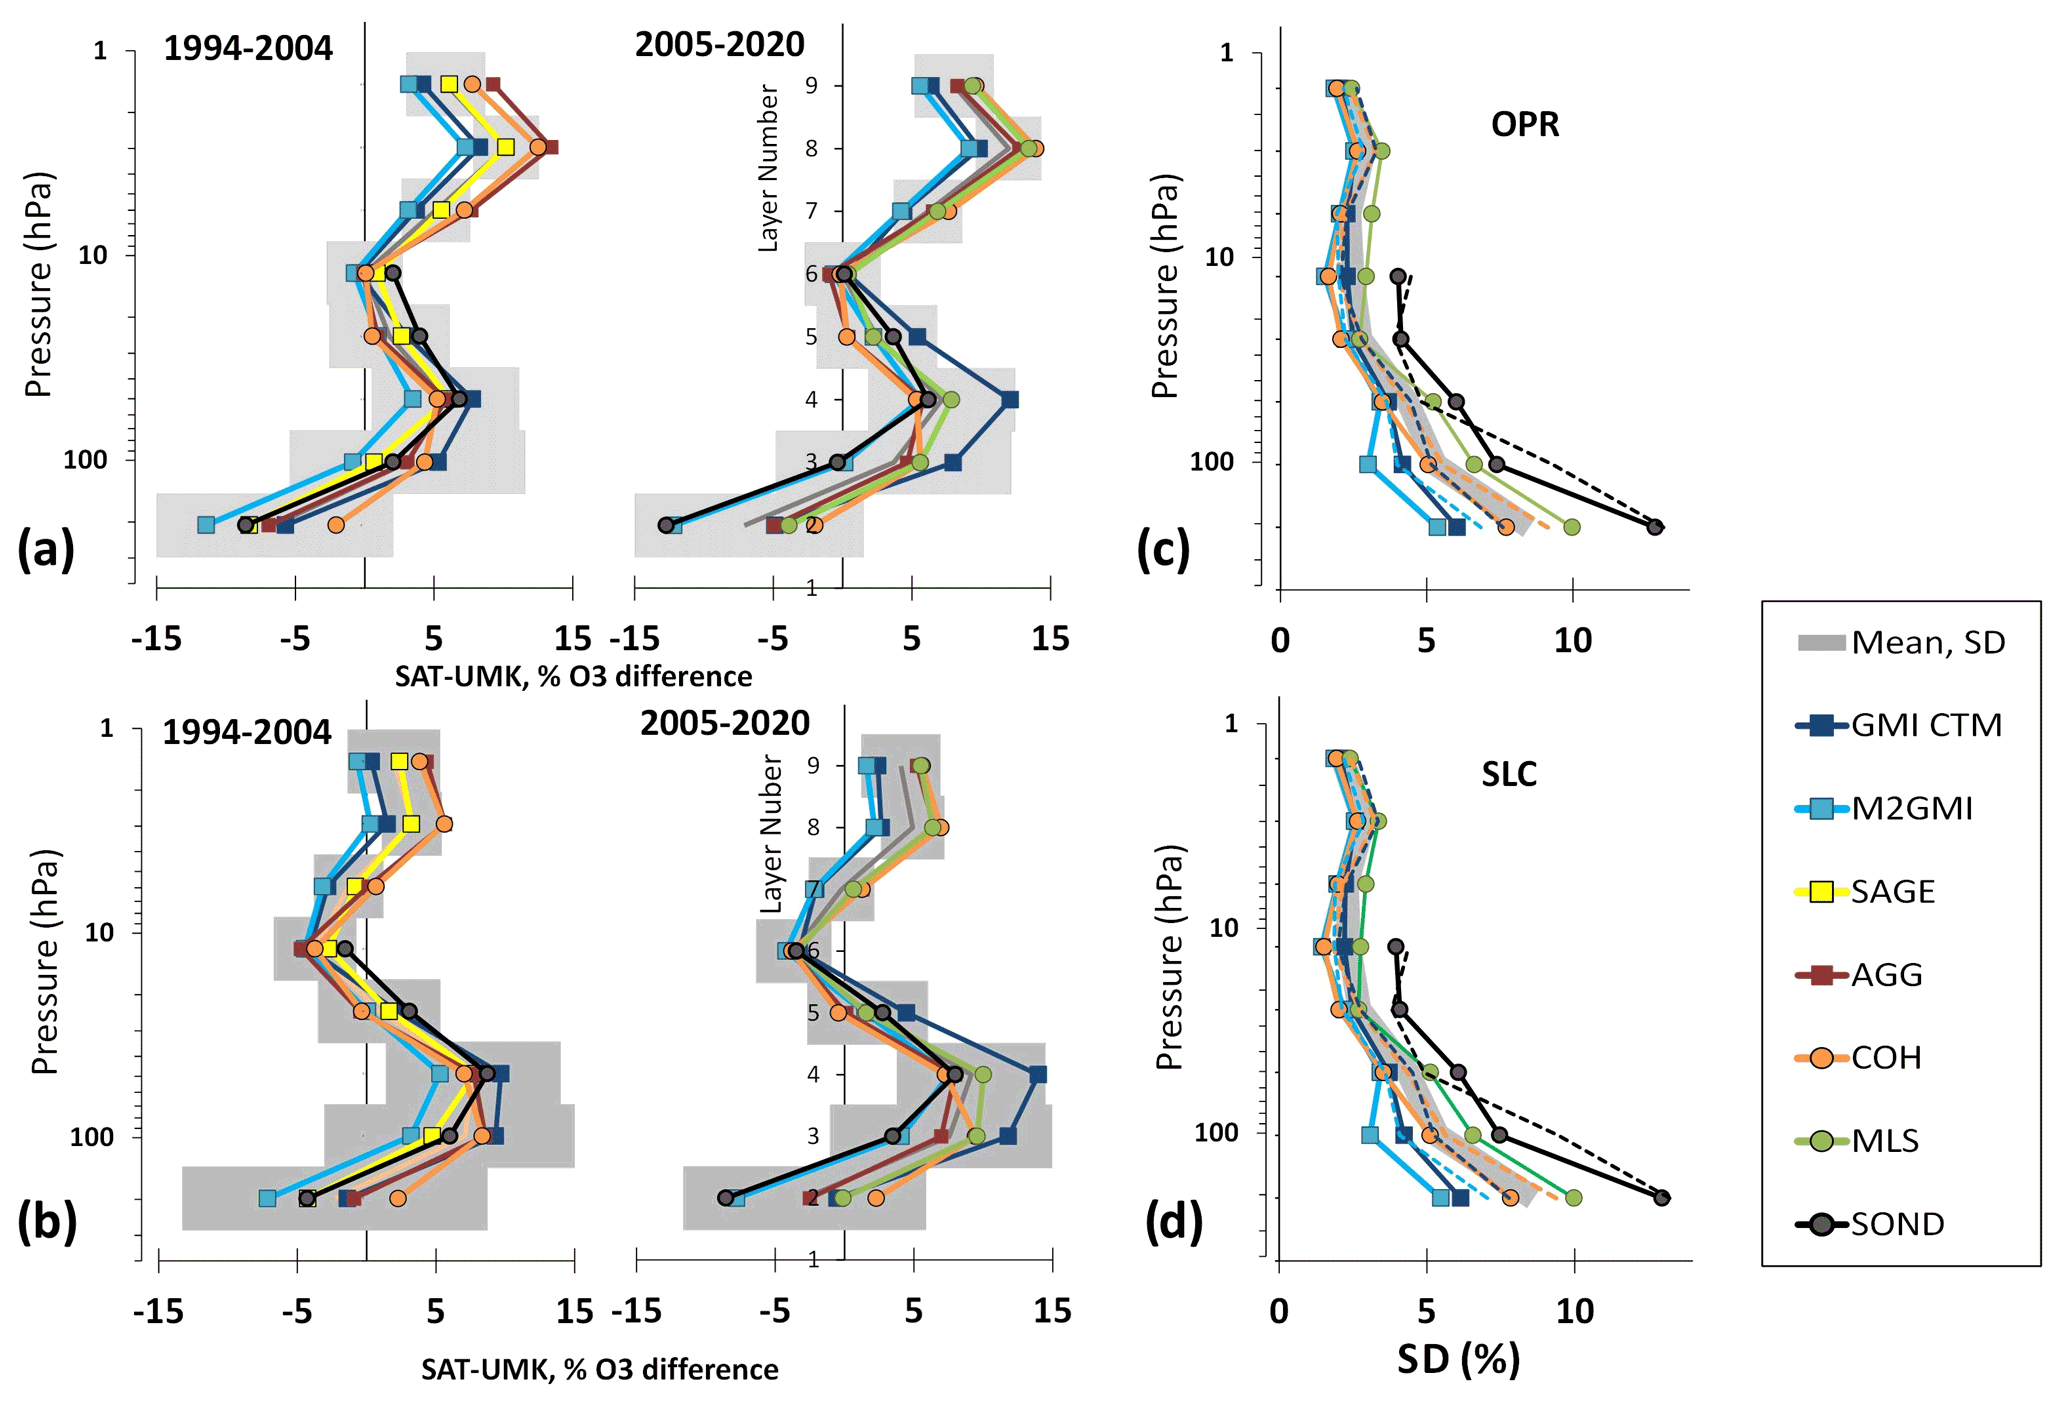
Figure 1(a) Bias between station overpass data from satellite (AGG, COH, Aura MLS, and SAGE), model profile from grid closest to Boulder geolocation (GMI CTM and M2GMI), ozonesonde record from Boulder relative to operational (OPR) Umkehr profiles taken during 1994–2004 (left panel) and 2005–2020 (right panel). Mean profile and SD are calculated as an average (six sets of comparisons, excluding SAGE) of biases and averaged standard deviations. (b) The same as panel (a), but Umkehr retrieval includes standard stray light correction (SLC). (c–d) Standard deviations for the mean biases shown in panels (a) and (b). OPR is operational, and SLC is standard stray light correction. A solid line is for comparisons from 2005 to 2020, and a dotted line is for the 1994–2004 period.
Two panels in Fig. 1a summarize biases for operational Umkehr profiles. Ozonesonde profiles are matched between observations and models at the time of Umkehr observations in Boulder (±12 h) and space (± 50 km). Biases in eight Umkehr layers are averaged in two periods (before and after 2005). The left panel shows comparisons between Umkehr and GMI CTM, M2GMI, AGG, COH, SAGE II, and ozonesondes. The right panel also includes comparisons with Aura MLS. AGG and COH results are nearly identical, supporting the consistency of the two different combination tactics. The COH bias does not change significantly before and after 2005; it agrees well with operational Umkehr in layers 2, 4, and 6, while it shows higher ozone in other layers with the largest positive bias (up to 15 %) in layer 8. The biases in layers 3, 6, 7, and 8 are larger than 5 % that is Umkehr retrieval uncertainty for these layers. Layer 1 bias is also larger than 5 %, but Umkehr retrieval uncertainty in this layer is ∼ 10 %–15 %. Results for layer 1 were not included in these comparisons because SAGE II or MLS satellite records do not have consistent ozone information below 250 hPa, whereas vertical grid of the SBUV/OMPS profiles is coarse for interpolation. Ozonesonde and COH biases are similar for the two periods. Aura MLS bias is also like the COH bias. The M2GMI model comparisons show the smallest bias except for the largest negative bias in layer 2 found in both time periods and an increased positive bias in layer 5 in 2005–2020 period. The GMI CTM biases in layers 6–9 are similar in magnitude to the M2GMI biases, whereas they grow larger in layers 3–5. Moreover, in the 2005–2020 period (right panel), both M2GMI and GMI CTM biases in layers 3–5 increase relative to 1994–2004 (left panel) comparisons, and GMI CTM biases become the largest positive biases among all datasets. Ozonesondes have the lowest bias in layers 3 and 6, high bias in layers 4 and 5, and large negative bias in layer 2. The models have lower bias in layers 6–8 as compared to observations (satellite and ozonesonde) and larger bias in layers 2–4. The mean offset is calculated by averaging results from all datasets except SAGE II (six datasets before and after 2005), and horizontal bars represent the standard deviation of the mean bias values.
Figure 1b shows comparison of the same datasets, but Umkehr profiles are processed using standardized stray light corrections (SLCs, Petropavlovskikh et al., 2011). It is found that SLC reduces bias in layers 7, 8, and 9, increases biases in layers 4 and 3 (GMI bias in layer 3 becomes the largest among all layers), whereas biases in layers 5, 6, and 1 do not change significantly.
Figure 1c and d summarize the uncertainty of the bias calculated for operational and SLC Umkehr profiles, respectively. The solid (dashed) lines show results for the 2005–2018 (1995–2004) comparison periods. There is no large difference found between standard deviations (SDs) in two time periods, and they are larger than 5 % in layers 2, 3 and 4. The largest SDs are found in comparisons between ozonesonde and Umkehr. This could be related to a large vertical variability captured by ozonesondes and the limitations in the Umkehr AK smoothing. However, the SD in layer 2 is still below 15 %, which is the estimated Umkehr retrieval uncertainty in the bottom layers. In summary, we demonstrated that the standardized stray light corrections do not fully reduce the bias between Umkehr and other ozone-observing methods. Since the optical characterization of each Dobson instrument is not yet possible, the optimization approach is discussed next. In this paper, we discuss an empirical approach to minimize simulated and observed Umkehr differences at large SZAs.
3.3 Empirical correction methodology
This section describes the new method developed for optimization of Dobson ozone profile retrievals to account for the instrument-specific out-of-band stray light and other optical artifacts. This approach is used for homogenization of the long-term Umkehr records. The corrections for each instrumental record in the station time series are developed to remove artificial steps in the NOAA Umkehr ozone profile records and to reduce the bias relative to other ozone-observing systems. To minimize instrumental artifacts in Umkehr observations (unknown instrumental optical degradation or contribution of the background noise), the Umkehr retrieval forward model (simulation of the observation) is forced to match the auxiliary or reference ozone profile. For example, the M2GMI ozone and temperature profiles simulated near the location of the Dobson station in Boulder are assumed to represent atmospheric absorption and molecular scattering properties (assuming no aerosols in the atmosphere) for the day (and time) of the Umkehr measurement. The use of daily changing temperature profiles modifies the ozone absorption cross section that allows an improvement in the model fit to the day-to-day variability in N values at large SZAs (see Sect. S3 for further discussion).
The forward model of the Umkehr retrieval uses the reference ozone and temperature profiles to simulate the absorbing and scattering properties of the UV zenith-sky radiation observed by Dobson. It first calculates the single scattering zenith-sky intensities with high (0.1 nm) spectral resolution. The convolution of spectrally resolved zenith-sky radiances and standardized band-pass functions (Komhyr et al., 1993) is performed to create N values at 10 nominal SZAs. In the next step, the multiple scattering and refraction corrections are selected from look-up tables (LUTs) that are prepared by the radiative transfer simulations of the Umkehr observations (Petropavlovskikh et al., 2005b, 2009) using a set of climatological ozone profiles (McPeters et al., 1998). Corrections are selected based on the station location (i.e., in low-, middle-, or high-latitude regions) and adjusted to the total ozone observed for the day. In the following step, the standardized stray light out-of-band corrections are selected from LUT similarly developed to the scheme described above (Petropavlovskikh et al., 2011). This means that up to this point the Umkehr N values are simulated for a generic Dobson instrument. The assumption for out-of-band rejection (or SLC) of the UV light in a typical Dobson instrument is on the order of 2 × 10⁻⁵ (Evans et al., 2009; Petropavlovskikh et al., 2011) but can vary between instruments (Moeini et al., 2019) and therefore can vary between Dobson instruments sequentially operated to create the long-term station record.
In order to test the representativeness of the M2GMI's vertical ozone distribution over Boulder, the above-described process is repeated by using several reference ozone records, including Boulder overpass output from the GMI CTM and M2GMI models, FG11ap and QBOap climatology, and combined MLS and ozonesonde profiles (SND_MLS) matched to Umkehr station location and date of observation (see data description in Sect. 2). Differences between simulated and measured Umkehr N values are averaged over the time between two consecutive calibrations of the Dobson instrument at each nominal SZA to create an empirical correction for the Umkehr curve simulated by the forward model. This unique correction is applied to reprocess each Umkehr measurement (morning and afternoon separately) taken during the reanalyzed time period, and the new ozone profile is called optimized. Note that optimized ozone retrieval includes both the standardized SLC and the new empirical instrumental correction. The homogenized time series is created after all individual observational periods are reprocessed (see Sect. 4.2 for further discussion).
Table 2Umkehr N-value-optimized corrections for each nominal solar zenith angle (70–90∘ SZAs) are shown for four Umkehr stations. All corrections are normalized to 70∘ SZA (set to zero at 70∘ SZA). The correction period is between the dates indicated in the second column. The last correction is through the end of 2020. The “updated WD” note on the right of the table identifies the WinDobson operating system installation date for Dobson automation.
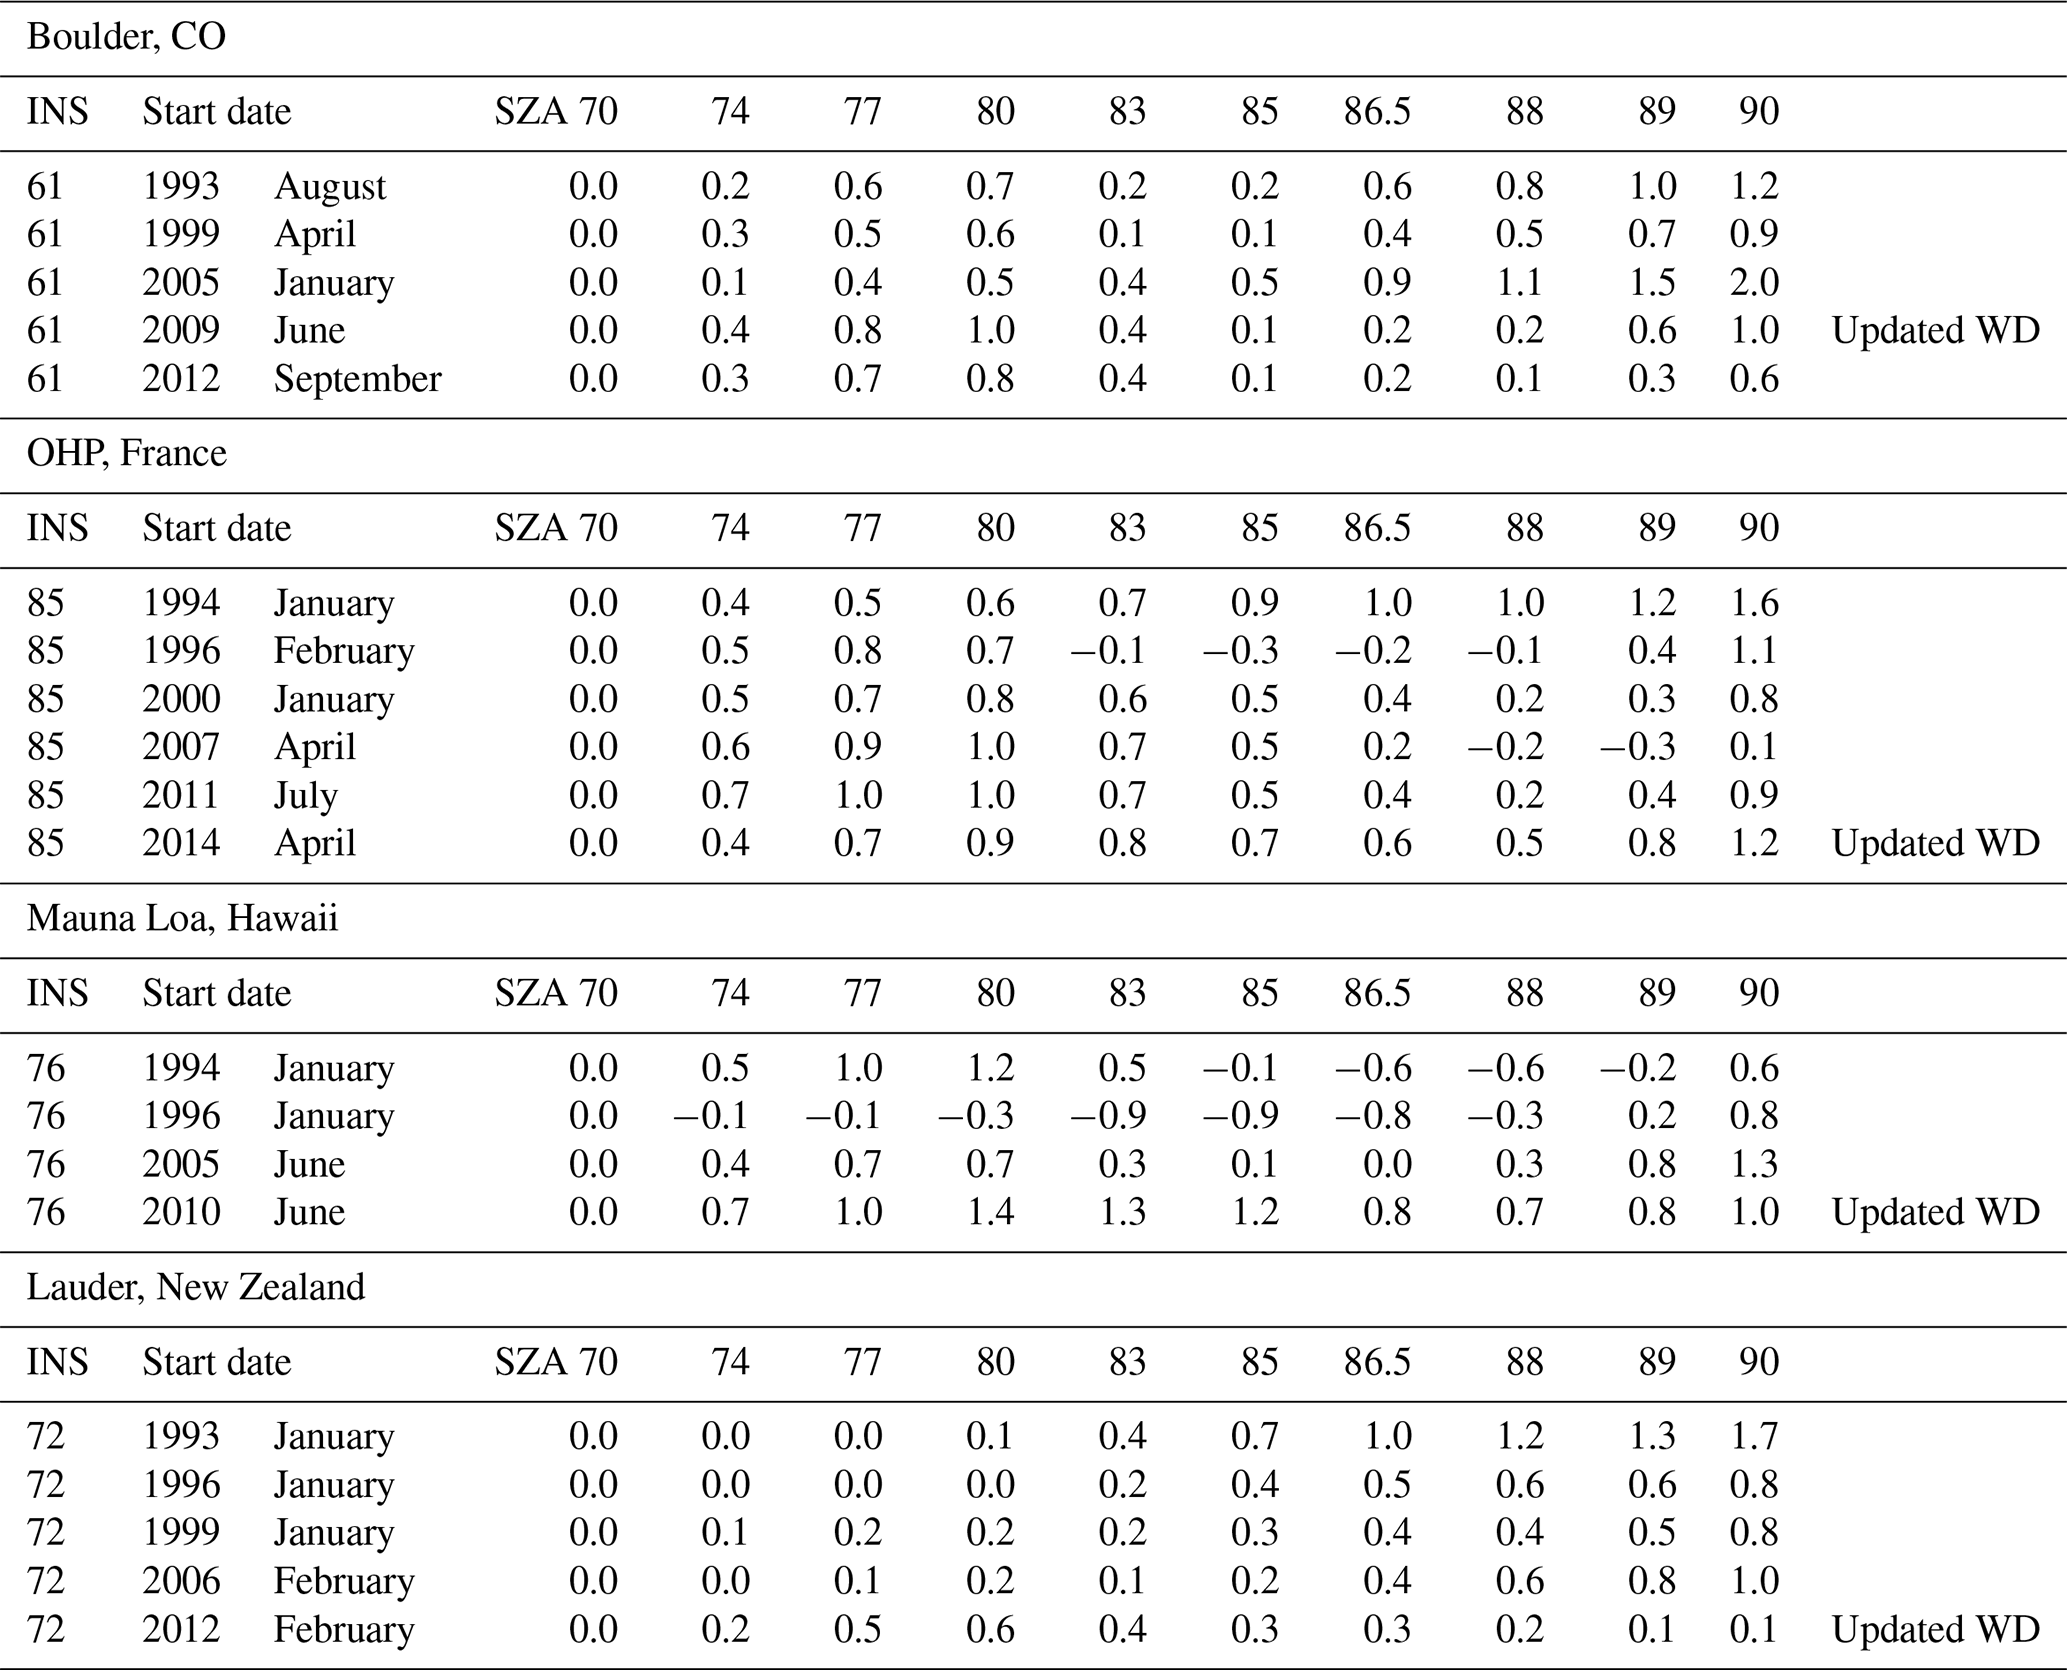
Table 2 contains the dates and time periods selected to apply empirically derived adjustments to Dobson observations in Boulder, CO; OHP, France; Mauna Loa, Hawaii; and Lauder, New Zealand. These dates do not represent the entire calibration record of a station instrument. Not all calibration activities create a step change in Umkehr records. Alternatively, the optimization method does not allow one to discern changes that are less than measurement noise. Another limitation of this method is that it requires at least 3 years of the record after the calibration to derive the correction. Therefore, if calibration happens within the last 2 years of the record, the optimization method is not able to detect the step change until a longer period becomes available.
The decision to adjust Umkehr data is tested every time the station instrument is replaced with a new instrument. The change in observations can occur due to different levels of out-of-band rejection unique to each Dobson instrument optics system. Therefore, another reason to reprocess the data is after optical repair in order to determine whether it was caused by sudden physical damage (i.e., fall of the instrument) or long-term wear and tear due to exposure to the weather elements (i.e., sea salt erosion). The instrument repair can include replacement of the optical wedge, replacement of the photocounter, or change of the center of the bandpass due to a new temperature setup for the Q levers.
The optimization method accounts for undetermined deviations in the optical system that have not been captured at the time of the exchange or repair of the Dobson instruments. The changes may not be significant for accuracy of the total column ozone observations but may be large enough to change Umkehr curve and create a step change in ozone record. To verify empirical adjustments and the consistency of reprocessed Umkehr time series, in Sect. 5, we present comparisons with independent ozone-observing systems (satellites, ozonesonde) and coincident with Dobson observations.
3.4 Discussion of optimization results
Figure 2a summarizes adjustments to the simulated N values that are needed to match Umkehr observations in Boulder with other reference records between 2005 and 2018. Examples of several N-value corrections are shown for Umkehr simulations where ozone profiles from several datasets were used as the reference ozone profile information. The daily differences are averaged over the 2005–2018 period and plotted at each Umkehr nominal SZA. The mean N-value correction and standard deviations are shown as gray boxes. The measurement uncertainty of typical Umkehr observations ranges between 0.5 N value at 70∘ SZA and up to 1.2 N value at 90∘ SZA (i.e., standard deviations of the error covariance matrix). The empirical corrections appear to agree within the observation uncertainty. However, the largest negative correction at 86.5∘ SZA varies between −0.1 and −1.4 N values depending on the reference dataset. Also all corrections exhibit similar shape with respect to the SZA. Figure 2b summarizes distribution of Umkehr N-value residuals calculated with M2GMI reference profiles. The width of the distributions increases with SZA. The largest deviations are found when the QBOap dataset is used as a reference (not shown) and the lowest deviations are found when the M2GMI ozone profiles are used as a reference.
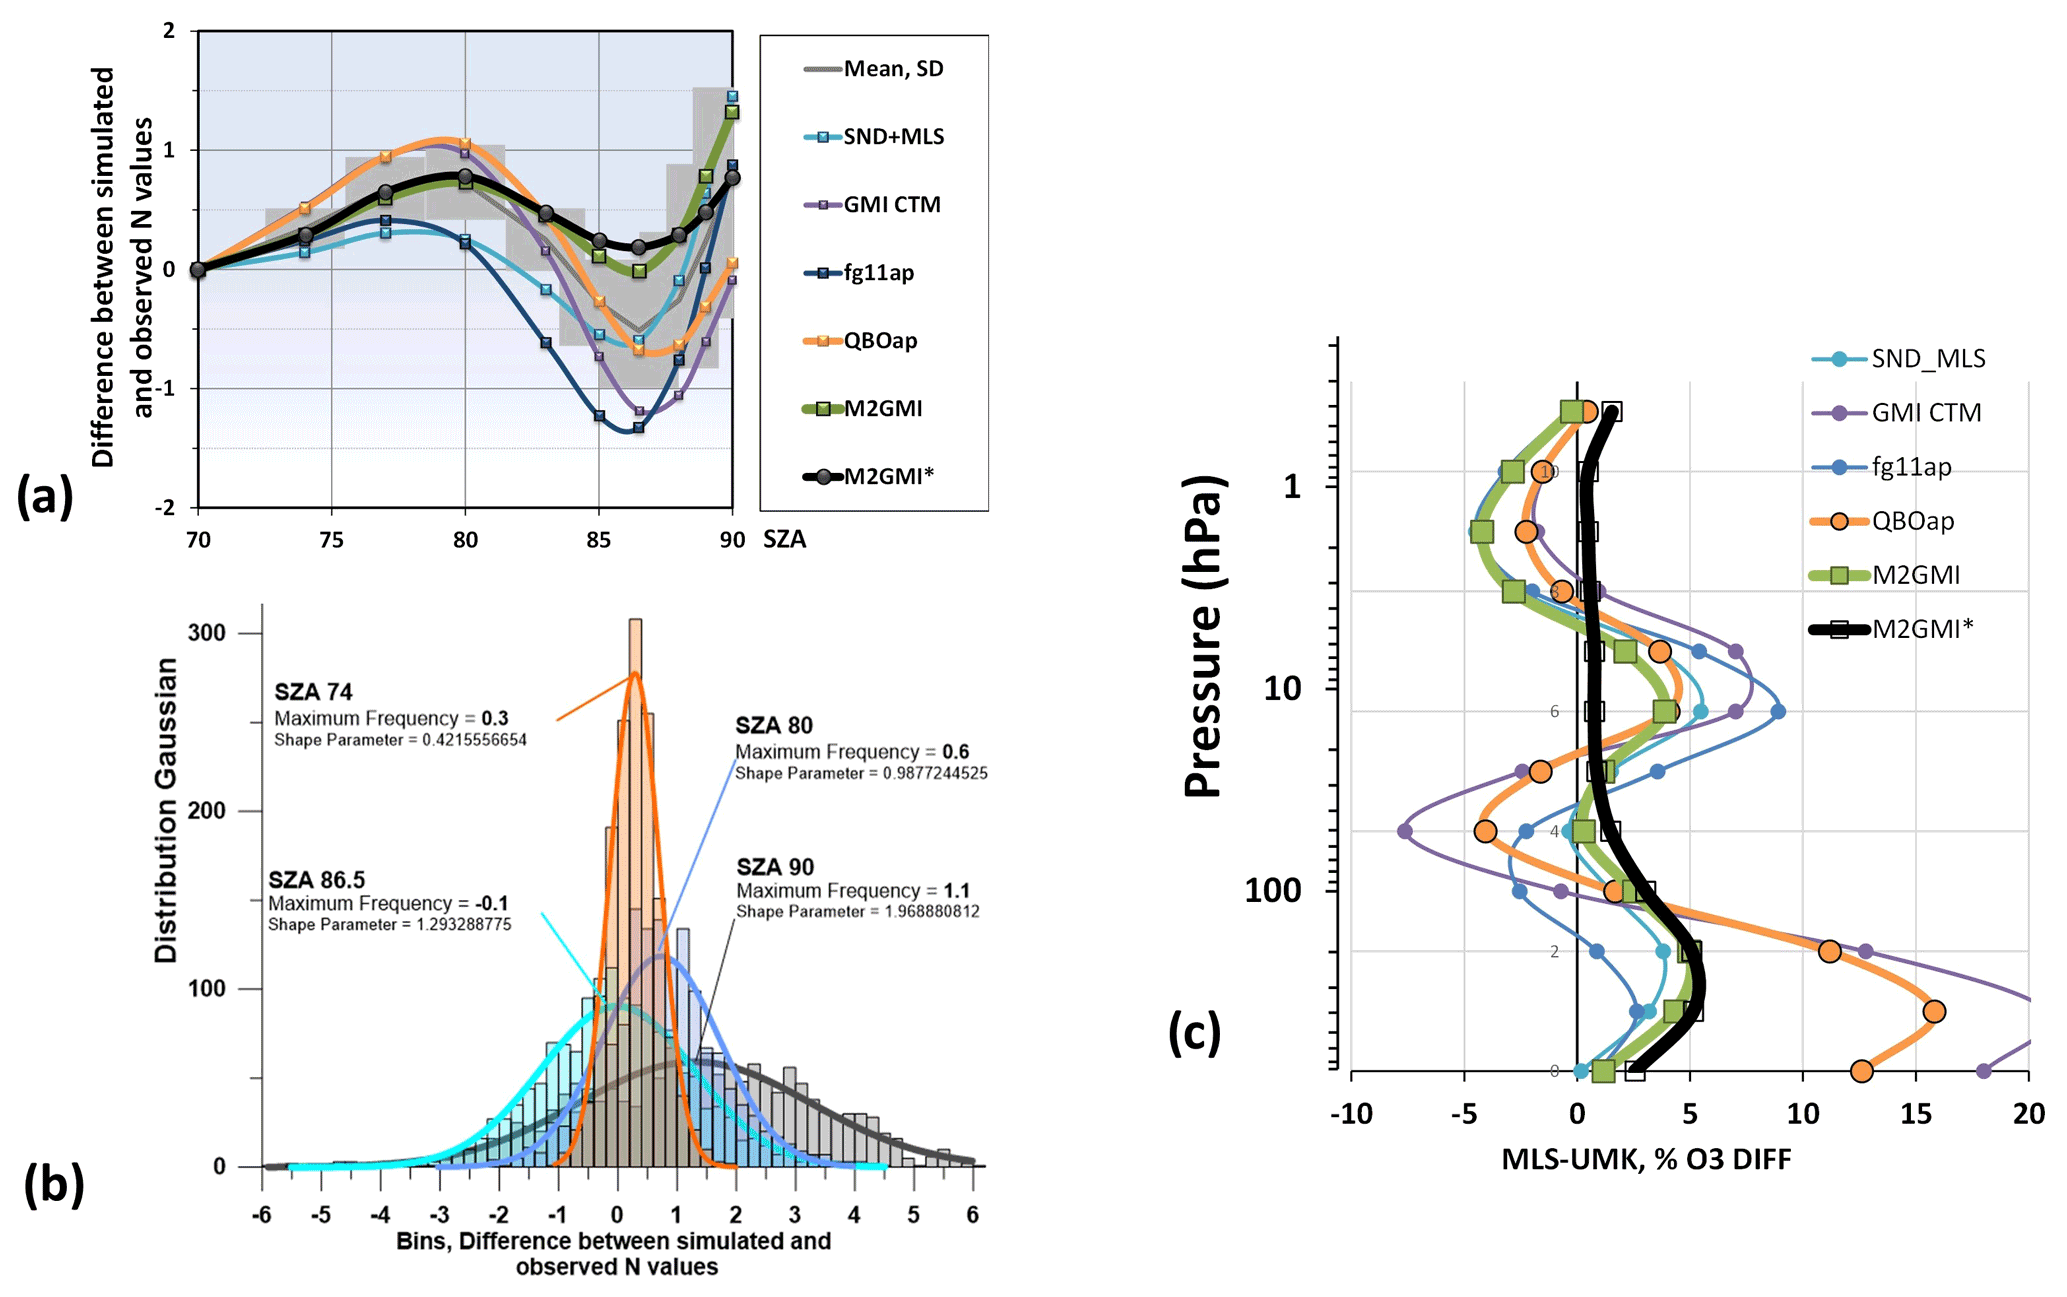
Figure 2The simulated Umkehr observations are based on the GMI CTM and M2GMI models, MLS satellite overpass and ozonesonde profiles at Boulder, and two ozone climatologies at 40∘ latitude (fg11ap and QBOap). (a) Difference between simulated and observed N values at Boulder as a function of SZA. (b) Histogram of the differences between simulated (based on M2GMI data) and observed N values at 74∘ (orange), 80∘ (purple), 86.5∘ (light blue), and 90∘ (dark) SZA. Solid lines are normal distribution fits to the data; the maximum frequency and shape parameters of the fit are provided in the legend. (c) The difference between the MLS and several versions of Umkehr profiles retrieved after applying corrections shown in panel (a). The final optimized adjustment M2GMI* (N-value correction is shown in panel a as a black line) is found through the iterative approach to minimize the M2GMI bias.
In order to select the most effective empirical adjustment for the Boulder Umkehr data processing in 2008–2015, Umkehr ozone profiles retrieved with multiple empirical corrections are compared to the MLS station-overpass ozone profiles (Fig. 2c). The goal is to have a zero bias through the difference profile comparisons with MLS. Empirical optimizations minimize ozone bias in comparisons to the MLS profiles; however, optimized Umkehr profiles still show ±5 % bias, even when the MLS profiles are used as a reference (see results for the MLS and sonde combined profile, SND_MLS). There are some differences between optimized datasets, but they all agree within the uncertainty of each empirical correction. Results show the wave-like distribution of biases that change from negative bias in the upper stratosphere to positive in the middle, then again to the negative bias in the lower stratosphere and to the positive bias in the troposphere. Some of these biases are due to the Rodgers optimal estimation technique that relies on the vertical ozone profile smoothing and a priori covariance that assumes cross correlations between adjoining layers (Rodgers, 1990, 2000). There is also a limitation in Umkehr observations that makes it difficult to clearly separate ozone information between tropospheric and stratospheric layers.
Since no Aura MLS data are available prior to 2004, we select the M2GMI dataset to develop optimized corrections for the entire Umkehr record. The M2GMI correction is derived separately for each calibration time period of the Dobson record in Boulder (Table 1). We note that the M2GMI-based optimized correction produces a small (±5 %) but significant bias in retrieved Umkehr ozone profiles relative to the MLS profiles averaged over the 2005–2018 period (see Fig. 2c, green line). It means that there is an additional difference between the atmospheric state and the Umkehr observation that is not adequately simulated in the forward model of the Umkehr retrieval. Therefore, the step-by-step adjustment of the M2GMI-based correction curve is performed using 0.1 N-value increments at one SZA at a time. The adjusted correction is tested for the Umkehr retrieval. The iterative process continues until the remaining bias between optimized Umkehr (M2GMI*) and MLS ozone profiles (Fig. 2c, dark line) is minimized in the 2005–2018 period. The final N-value adjustment for the 2005–2018 period is marked as M2GMI* (black line in Fig. 2a). This additional correction to M2GMI optimization is applied to all M2GMI empirical corrections prior to reprocessing the entire Umkehr record.
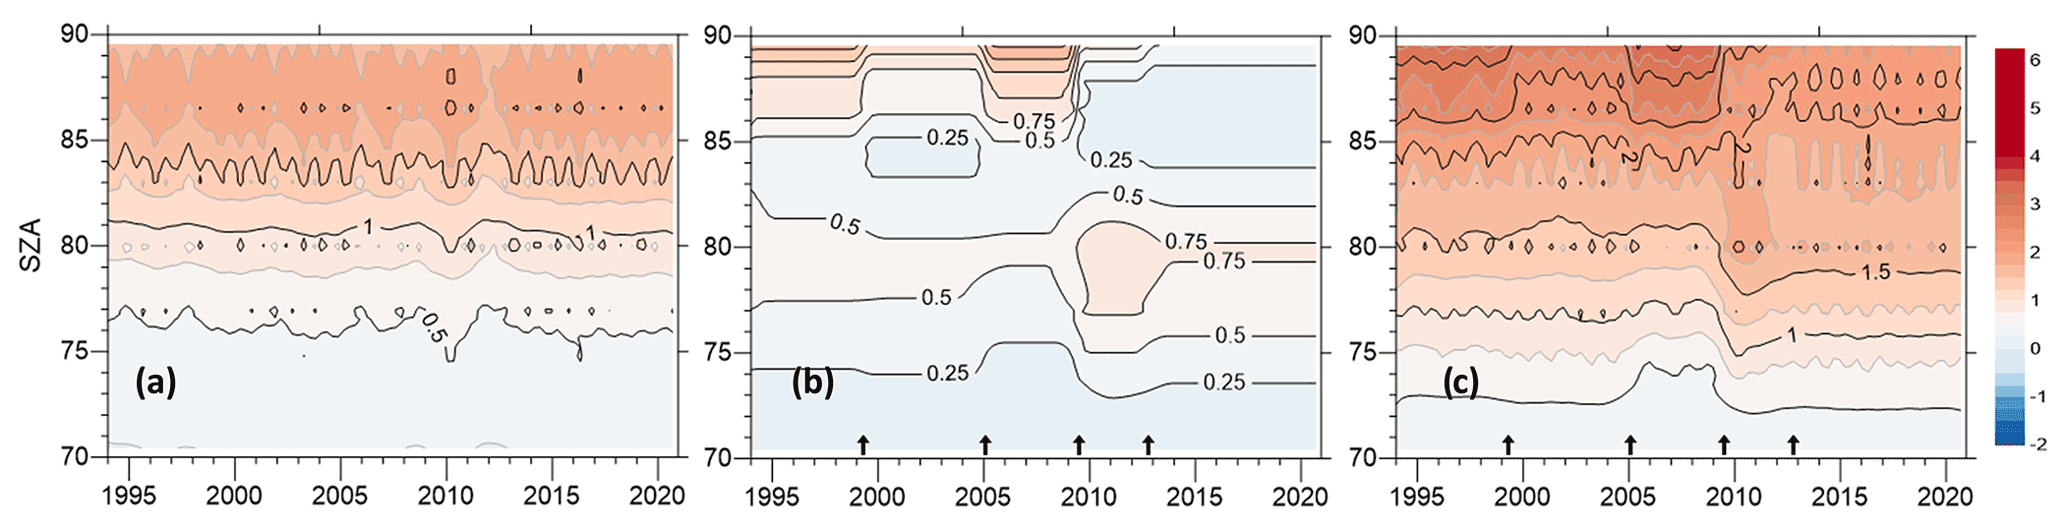
Figure 3Plots show the time-series of Umkehr N-value corrections in Boulder: (a) standardized stray light (SLC) corrections, (b) the optimized (OPT) stray light correction, and (c) final optimization applied by combining SLC and OPT corrections. Black arrows at the bottom of panels (b) and (c) indicate dates of Umkehr record corrections (Table 2).
Figure 3 summarizes the time series of all empirical corrections as a function of SZAs applied to the Umkehr observations in Boulder after 1994. Three panels show the SLC (Fig. 3a), M2GMI empirical corrections (Fig. 3b), and the combined correction (Fig. 3c). The black arrows at the bottom indicate dates of Dobson calibrations and/or instrument replacements (see Table 2 for the dates). The optimized corrections indicate several distinct time periods that change the mean ozone levels in time series and therefore impact trends calculated after 2000.
This section discusses the vertical and temporal changes in the Umkehr optimized ozone record. Comparisons between operational OPR (red), standardized SLC (green), and optimized OPT (blue) ozone in layer 8 (4–2 hPa) at Boulder are plotted in Fig. 4 as a function of time. The biases between operational and SLC (magenta) and SLC and optimized (black) demonstrate the main temporal difference between the time series. It is apparent that the SLC time series features an additional seasonal cycle that is total ozone dependent and corrects the out-of-band stray light errors in the operational Umkehr record. The optimized Umkehr version in addition to the SLC uses M2GMI-based empirical corrections developed for each period marked by blue arrows.
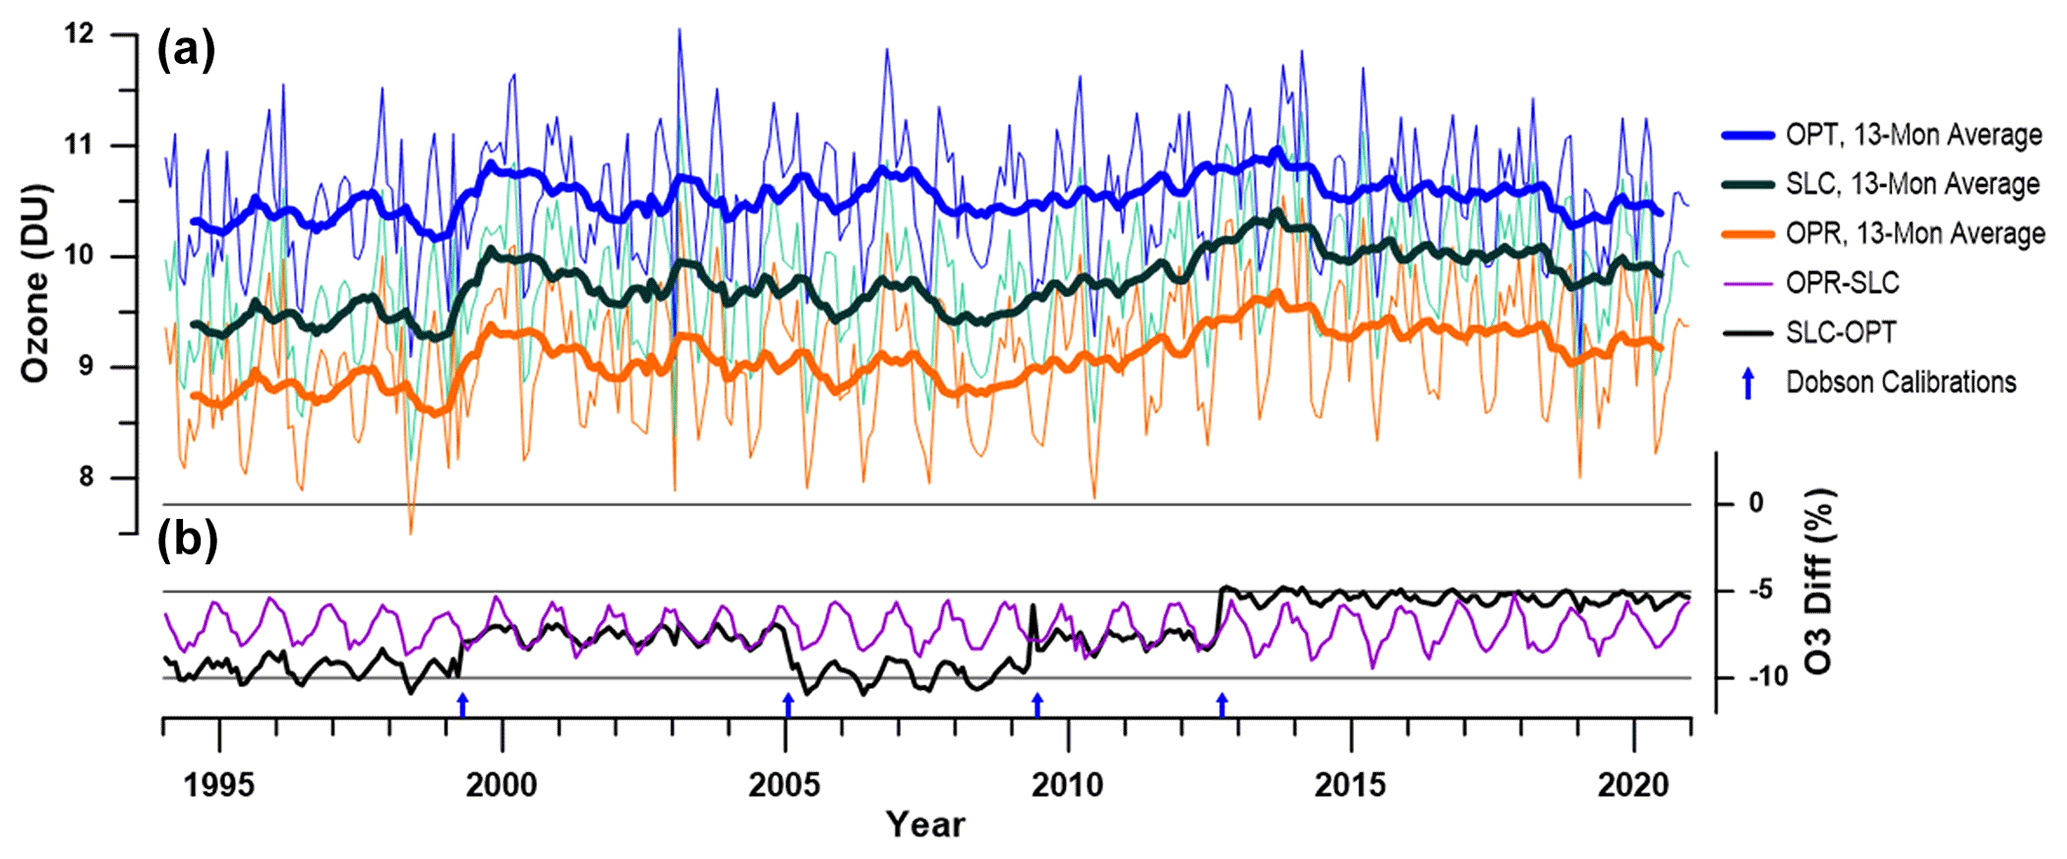
Figure 4(a) The time series of Umkehr monthly averaged (thin lines) ozone in layer 8 (4–2 hPa) compared with operational (OPR), standard stray light corrected (SLC), and optimized (OPT) versions. The thick lines are a 13-month running average. (b) A difference between OPT and SLC (black line) and between OPR and SLC data (purple line).
The offsets between OPT and SLC versions vary from −5 % (in the period since last calibration) to up to −10 % in 1994–1998 and 2005–2009 periods, and −7 % bias in 1999–2004 and 2009–2012 periods. The up and down biases in the optimized record impact the linear trends in layer 8 ozone (reduced by ∼ 2 % per decade based on a simple linear fit) as compared to those derived from the operational or SLC version of Umkehr record. The replacement of Dobson 82 with Dobson 61 resulted in a step change in Umkehr ozone in layer 8 at the beginning of time series (see Fig. S11c showing the 1985–2000 period). The optimization method identified the need for an adjustment on the order of 10 %. This change in stratospheric ozone levels at the beginning of the Boulder Umkehr record can significantly reduce trends derived from the homogenized record (optimized series) prior to 1997 and bring it to a closer agreement with the satellite combined zonally averaged trends (LOTUS report, Fig. 5.9a in chap. 5). A discussion of trends is beyond of the focus of this paper and will be addressed in a follow-up publication.
The step changes in the differences are clearly seen in this plot and vary between 0 % and −15 % during non-volcanic periods, while during the volcanic period (see Fig. S11c) corrections can be as large as −30 %. Optimizing Umkehr ozone profile retrievals during the volcanic eruption follows a similar procedure to that described above. When large volcanic eruptions inject aerosols into the stratosphere, the operational Umkehr retrieval is not set up to account for the change in atmospheric scattering. Therefore, the errors in operationally retrieved Umkehr profiles can be as large as 70 %. For trend analyses, the volcanic time periods in the Umkehr time series (i.e., 1991–1993) are typically removed prior to fitting the statistical model to the data. The optimization method reduces the introduction of gaps in Umkehr time series so that the entire record can be used for trend analysis. An example of volcanic period corrections and discussion of results is shown in Sect. S2.
4.1 Changes in mean and seasonal biases
After reprocessing of the Umkehr data with optimization corrections, the changes to vertical profiles are verified through comparisons against independent ozone observations that are matched with Umkehr record. For verification of changes in Umkehr data at Boulder, satellite overpass data are used for comparisons (Table 3) and coincident ozonesonde profiles.
Table 3Satellite ozone profile records used for comparisons with Umkehr records. The time of observational (combined) records and links to the archived records are included for reference.
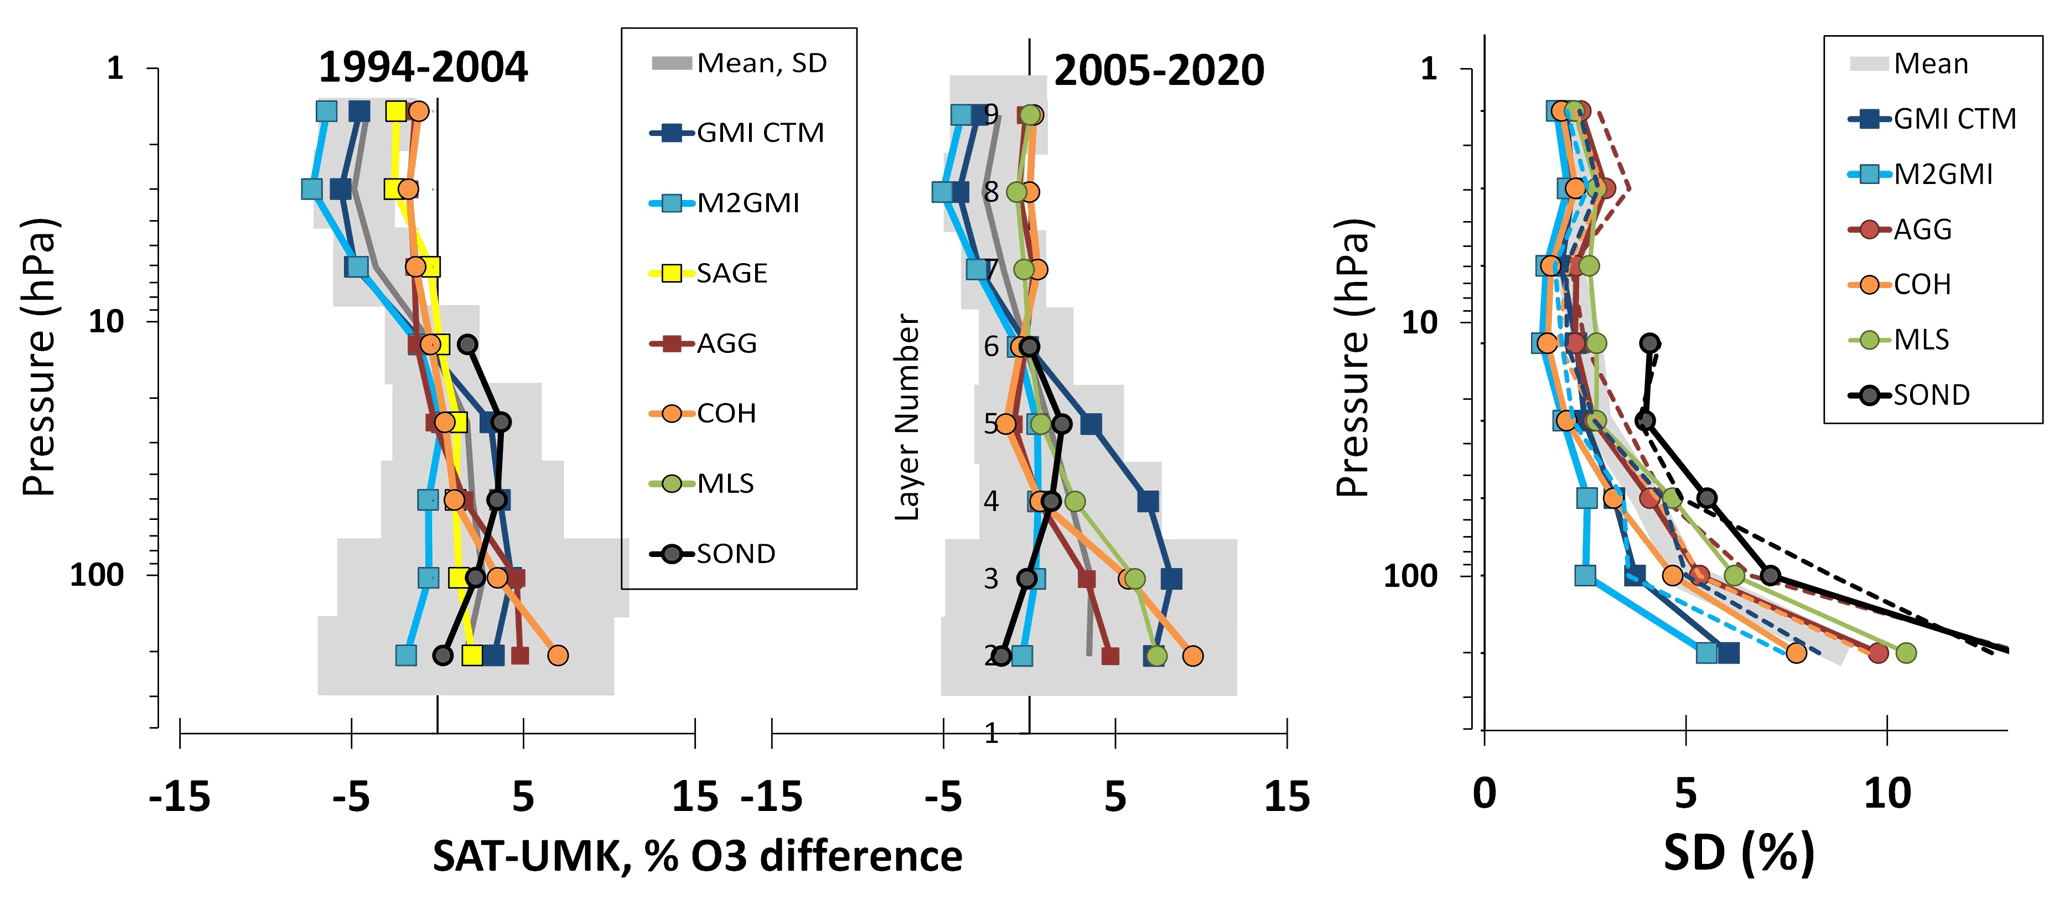
Figure 5Same as Fig. 1a, but comparisons are against the Umkehr version with optimized stray light correction.
Figure 5 shows Boulder Umkehr data comparisons for the two time periods: 1994–2004 and 2005–2020. The reference data are the same as those in Fig. 1.
In comparison to the results shown in Fig. 1 (Umkehr operational and SLC versions), the optimization process significantly reduces satellite/Umkehr biases in the upper stratosphere (Umkehr layers 7–9). For example, a small bias (< 2 %) is found between Umkehr and AGG, COH, and MLS profiles above 30 hPa. The comparisons with GMI CTM and M2GMI models show 3 %–5 % negative bias that is slightly larger in the 1994–2004 period as compared to the 2005–2020 period. In comparison to the operational Umkehr data, the bias is smaller and has changed sign. The agreement between the modeled ozone and Umkehr is better for the SLC version rather than the optimized retrieval. However, the optimization is not meant to reduce the bias between the model and Umkehr. The models are used only as a reference to assure the continuity of optimized ozone after the Dobson calibration.
In the middle/lower stratosphere (layer 3–4, ∼ 125–30 hPa) small positive biases (< 5%) are found between satellite, COH, AGG and MLS, and optimized Umkehr records. Also positive biases (up to 8 %) are found in comparisons with GMI CTM profiles in 2005–2020 period, whereas the bias is negligible in M2GMI comparisons. In the upper troposphere–lower stratosphere (UTLS) (layer 2, 250–125 hPa), positive biases (5 %–10 %) are found in comparisons against COH (1994–2020) and MLS (2005–2020) satellite data. However, these biases are within the uncertainty of the Umkehr retrieval in layer 2 (∼ 10 %). Comparisons of optimized Umkehr profiles with the date-/time-matched ozonesonde data in Boulder show that prior to 2004, the bias from optimized Umkehr is ∼ 5 % in layers 3–5, but after 2005 the bias is largely reduced.
For the validation of Umkehr optimization, it is important to track changes in the reference records (especially models) before and after 1998, and around 2005, as the discontinuity can lead to an introduction of the artificial trend in homogenized Umkehr time series. The step change in GMI CTM ozone record in 2005 was discussed in several recently published papers (i.e., Orbe et al., 2017; Stauffer et al., 2019). The bias is due to assimilation of the Aura MLS temperature profiles in MERRA-2 starting at the end of 2004. The change in temperature fields affects the winds generated by MERRA-2 that drive transport in both M2GMI and GMI CTM ozone simulations as well as stratospheric chemistry. The biases relative to Umkehr above 30 hPa are almost identical in both models, while a small reduction in biases (< 2 %) is found after 2005. This is the expected result as ozone variability in the upper stratosphere is largely determined by the chemistry that is similarly described in both models. In the lower stratosphere, the transport of the chemicals is driven by the MERRA-2 meteorological fields; however, the modeled ozone profiles are not forced to reproduce the MLS profiles. Note that Umkehr and MLS satellite overpass comparisons for the 2005–2020 period show a smaller bias below 30 hPa than those in GMI CTM comparisons, but it is larger than the bias between ozonesonde and Umkehr. M2GMI does not show a significant bias below 30 hPa and compares well against Boulder ozonesonde in the 2005–2020 period. The differences between the two models are likely related to the differences in ozone mixing across the tropopause, as discussed in Stauffer et al. (2019). There are small changes in biases between the models after 2005; however, COH and M2GMI biases relative to Umkehr show little change after 2005.

Figure 6Seasonal biases between the Umkehr measurements in Boulder and the COH record from 2005 to 2018. Two panels show results for Umkehr retrievals: operational (a) and optimized correction (b). The biases are significantly reduced after the optimized corrections are implemented in the Umkehr retrievals. Panel (b) shows the difference between Umkehr a priori (based on climatology from McPeters and Labow, 2012) and S-NPP OMPS a priori (Flynn et al., 2014) selected at 45∘ N.
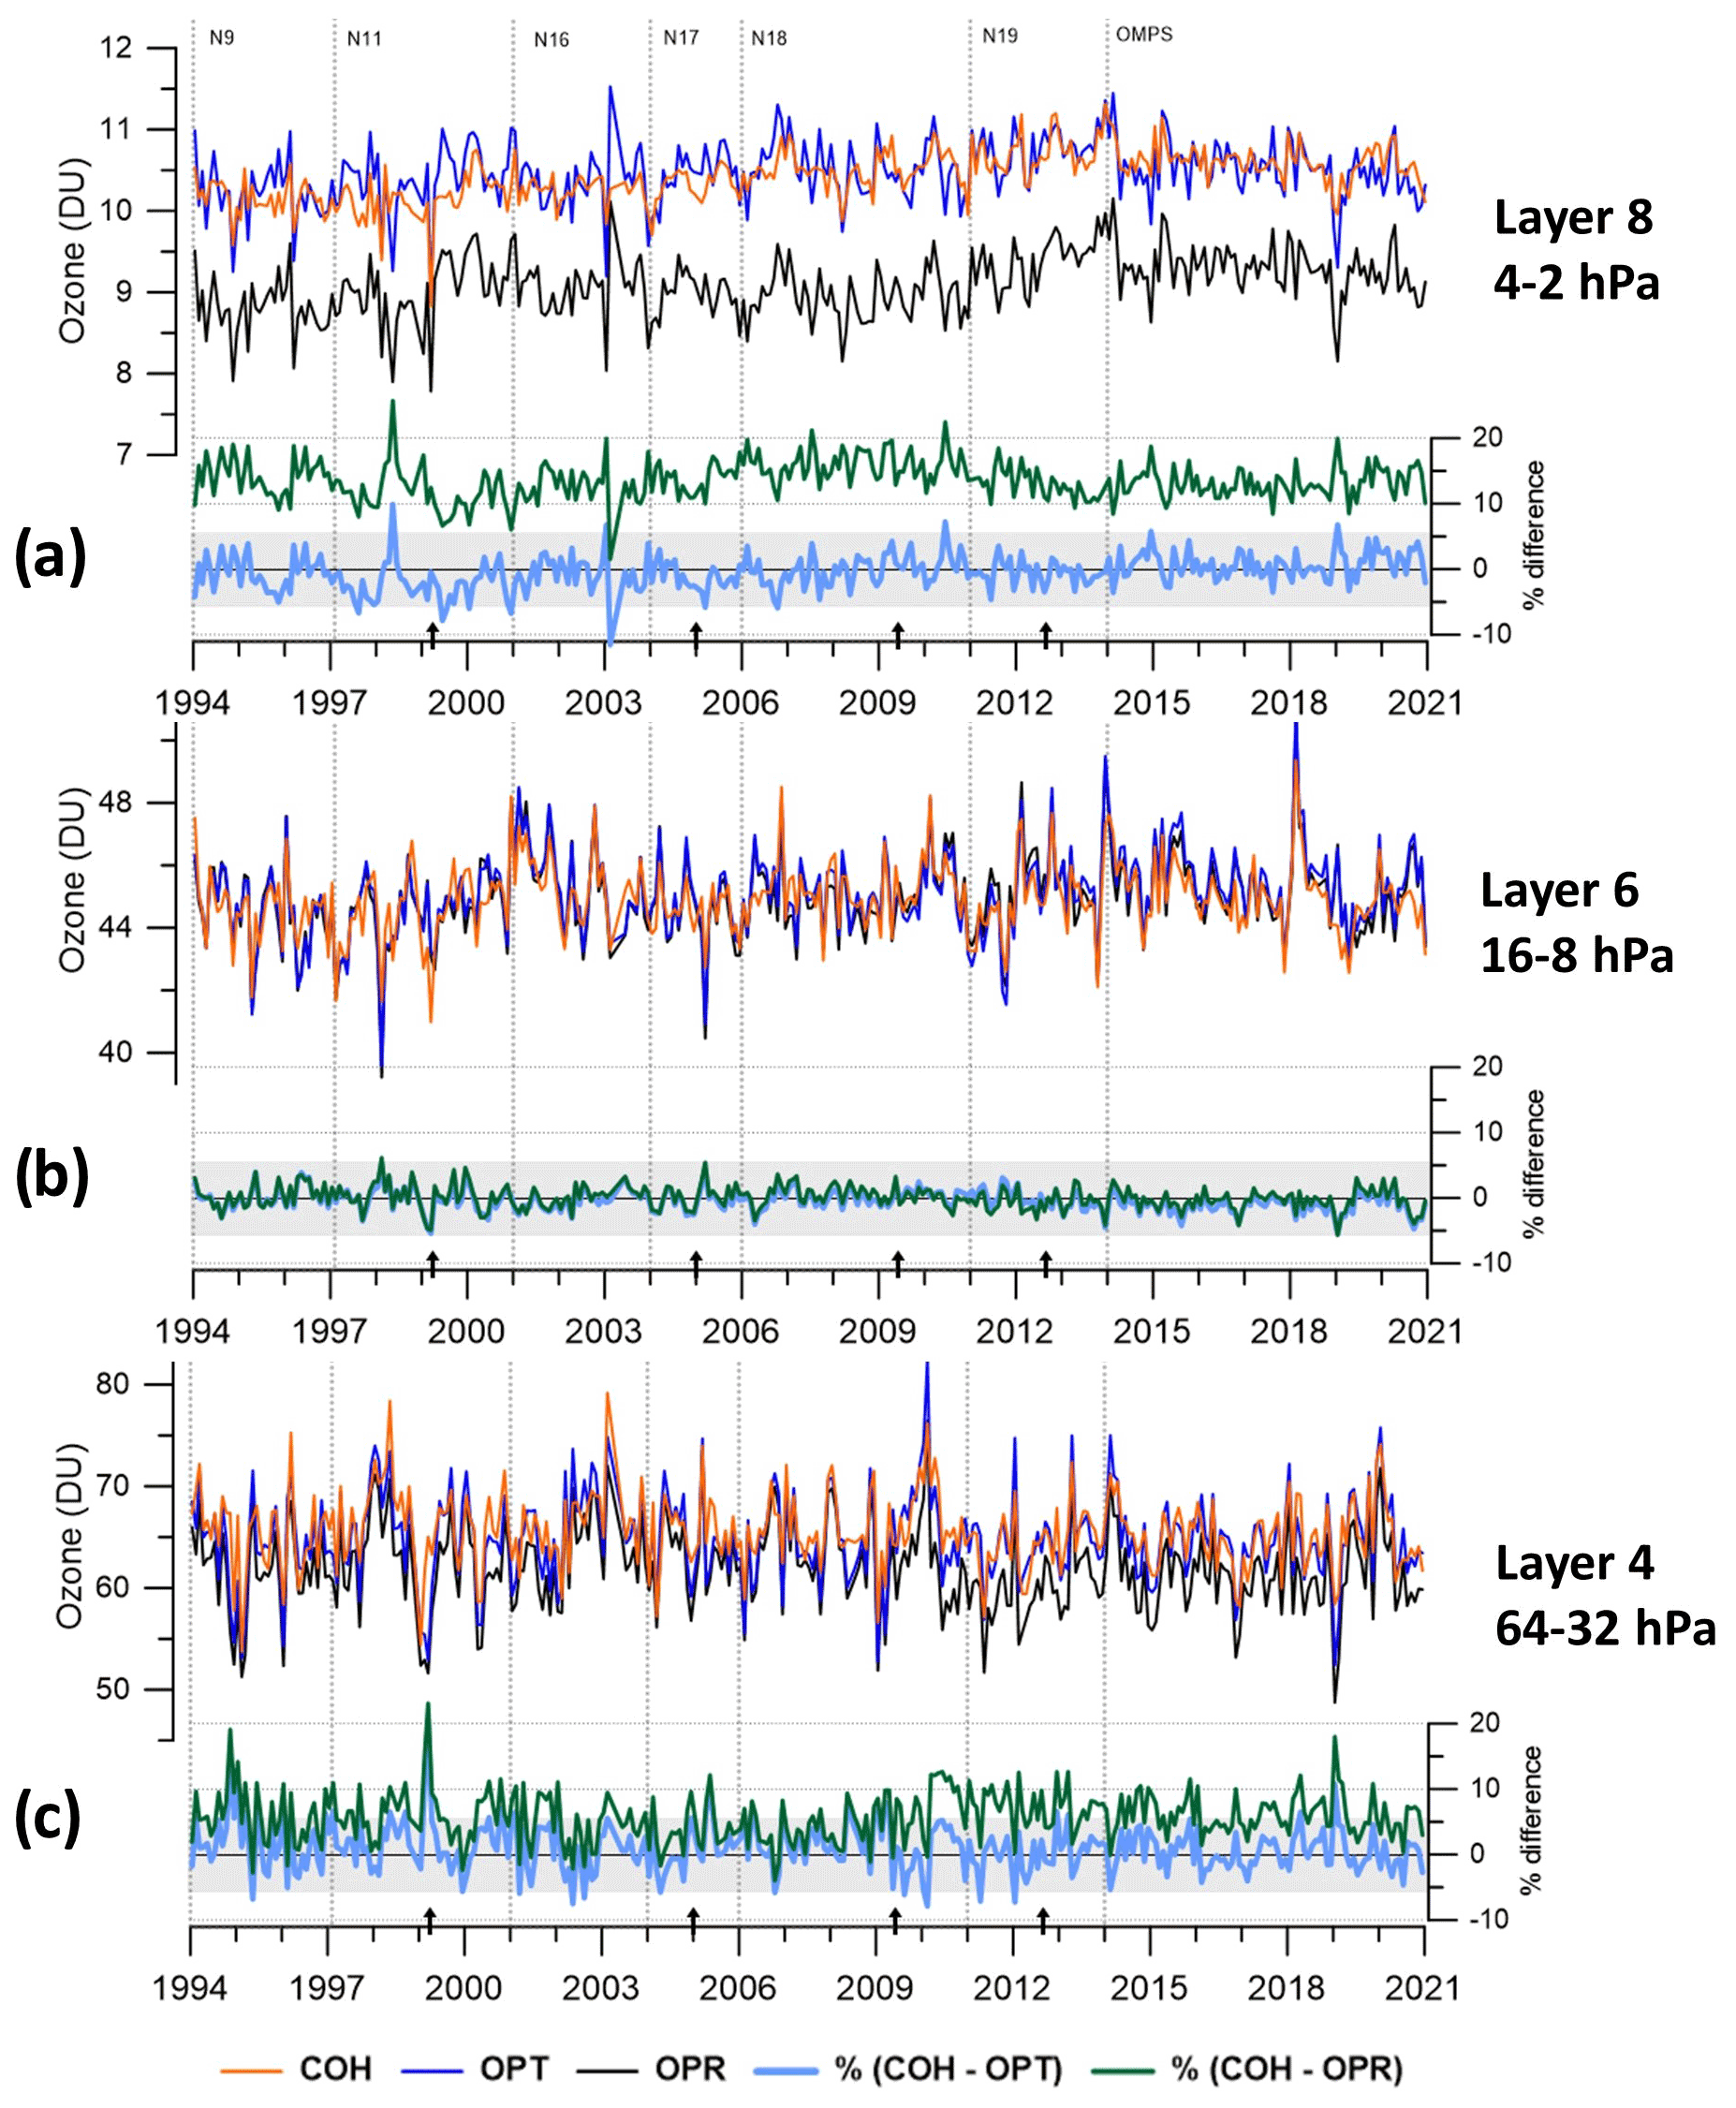
Figure 7The time series of ozone at Boulder in Umkehr layer 8 (2–4 hPa). Operational Umkehr (black), optimized Umkehr (blue), and COH (orange) data are shown as monthly averages. The difference between COH and operational Umkehr data is shown as a dark green line. The percent difference between optimized Umkehr and COH ozone is shown as a light blue line. The arrows indicate the optimization periods. The vertical dotted line indicates beginning/end of a series of SBUV/OMPS satellite records that are combined in the long-term COH time series.
Figure 6a shows seasonal differences between the COH overpass record and the operational (left) or optimized (right) Umkehr ozone profiles collected in Boulder. The plots show the monthly percent differences averaged from 2000 to 2018. The optimized version of the Umkehr data shows a significant reduction in biases as compared to the operational version in the layers above 10 hPa, while small positive and somewhat seasonally varying bias (up to 5 %) remains between 100 and 10 hPa. The largest negative bias is found near 200 hPa in winter months. It could be related to the 5 %–10 % differences in the a priori data used for satellite and Umkehr retrievals (Fig. 6b) and limitations in both systems to the sensing of ozone variability in the lowest stratosphere. To summarize, optimization of the Umkehr observational record in Boulder over the 2000–2018 period reduced mean biases between Umkehr and COH ozone in the upper and middle stratosphere. Since SBUV/2 and OMPS ozone information in lower layers is strongly influenced by a priori data, and has little independent information there (Kramarova et al., 2013), this result is expected.
4.2 Temporal changes in optimized Umkehr time series
Figure 7 shows 1994–2020 comparisons between monthly mean ozone retrieved by the operational Umkehr processing (black line) and ozone derived after optimization (blue line). Three panels (top to bottom) show comparisons in layer 8 (4–2 hPa), 6 (16–8 hPa), and 4 (64–32 hPa) for the Boulder Umkehr record. Similar plots for OHP, MLO, and Lauder records are included in Sect. S1. The arrow symbols at the bottom of the plot indicate the dates of the Dobson instrument calibrations or instrument replacements (see Table 2 for the dates of calibrations and the WinDobson automation events). The standardized stray light correction is a long-term mean adjustment that depends on ozone climatology and is total ozone dependent (Petropavlovskikh et al., 2011). It creates the seasonally dependent adjustment (less than 1 % in the upper stratosphere), but this correction does not add significant long-term trend. However, different optimized corrections are applied to the individual periods between instrument calibrations, which results in different amounts of increases in the retrieved ozone.
To highlight changes in optimized Umkehr, the COH overpass ozone record is plotted as a reference (red line). The vertical dotted lines indicate the periods of satellite records (also see abbreviations at the top of the plot) that are combined in the COH ozone dataset. The difference between COH and operational Umkehr data is shown as a dark green line with a mean positive bias of ∼ 15 % (0 % and 5 %) in layer 8 (6 and 4, respectively) that varies seasonally and temporally. The percent difference between optimized Umkehr and COH is shown as a light green line. The average bias is close to zero, while the seasonal changes are also reduced in layers 8 and 4. The main change in the optimized Umkehr ozone dataset is the increase/decrease in ozone amount vertically (three panels in Fig. 7). Also noticeable are changes in the relative shifts between calibration periods. For example, the change in the offset between COH and operational Umkehr biases (dark green line) is seen in the 2001–2006 and 2006–2011 periods. This step change offset is largely reduced in COH comparisons against the optimized Umkehr version (light green). In addition, we do not find any evidence of a step change in the optimized data in 1998 or 2004/2005 that could be related to step changes found in M2GMI (Stauffer et al., 2019). Similarly, in optimized records of three other Umkehr stations (see Sect. S1), we do not find any impact from the M2GMI step changes. For example, at the MLO station, the instrumental artifacts in Dobson operations resulted in significant step change in Umkehr operational data but were completely eliminated by the optimization method (see Fig. S5a). The importance of these changes for trend analyses is alluded to in the LOTUS 2019 report and will be further discussed in a future paper.
In this paper, we discussed a method for the Umkehr profile optimization and its impact on the homogenization of the long-term records. The lack of the optical characterization of Dobson instruments used for Umkehr method observations results in the biases in the retrieved ozone profiles relative to other observing systems. The previous approach of standardized stray light corrections helped with reduction of biases but did not eliminate the step changes in the station record associated with instrumental changes. The optimization method relies on the experience of Dobson operators, knowledge of the Dobson world calibration center (operated by NOAA GML in Boulder for more than 40 years), and its records of instrument calibrations. The careful and robust approach to instrument exchanges, repairs, and calibrations against the WMO standard Dobson 083 allowed for collection of high-quality long-term records of stratospheric ozone changes. The optimization provides a tool for fine tuning the Umkehr retrievals, removal of the instrumental biases, and empirical evaluation of the impacts of stray light contributions to the observations over different time periods. However, the optimization is not meant to reduce the bias between the reference model and Umkehr ozone profile. The models are used only as a guide to assure the continuity of optimized ozone after evaluating and removing step changes caused by Dobson instrumental artifacts, changes to the data collection protocols, and data processing. This careful approach aims at homogenizing Umkehr time series for trend analyses, reducing noise in the data, and supporting NOAA and WMO efforts in the detection of ozone recovery under the Montreal Protocol guidance.
The datasets used in this study can be downloaded from https://gml.noaa.gov/aftp/data/ozwv/Dobson/AC4/Umkehr/Monthly/ (last access: 21 May 2021; Petropavlovskikh and Miyagawa, 2021).
The supplement related to this article is available online at: https://doi.org/10.5194/amt-15-1849-2022-supplement.
IP and KM analyzed the data and wrote the manuscript. KM, AMB, BJ, SS, KW, RQ, GA, and SGB prepared the ground-based ozone data; JW, LF, and EB prepared satellite ozone datasets for analyses. SS and KW performed the simulations and extracted model data for comparisons with ground-based stations. IP prepared the manuscript with contributions from all co-authors.
The contact author has declared that neither they nor their co-authors have any competing interests.
Publisher's note: Copernicus Publications remains neutral with regard to jurisdictional claims in published maps and institutional affiliations.
This article is part of the special issue “Quadrennial Ozone Symposium 2016 – Status and trends of atmospheric ozone (ACP/AMT inter-journal SI)”. It is a result of the Quadrennial Ozone Symposium 2016, Edinburgh, United Kingdom, 4–9 September 2016.
Irina Petropavlovskikh and Krzysztof Wargan would like to thank Luke Oman for developing M2GMI and for very fruitful discussions.
This study was supported by NOAA Climate Program Office's Atmospheric Chemistry, Carbon Cycle, and Climate program, grant no. NA19OAR4310169 (CU)/NA19OAR4310171 (UMD). Irina Petropavlovskikh and Jeannette Wild were also supported by the NASA SAGE III/ISS award no. NA19OAR4310169. Krzysztof Wargan is supported by NASA's Global Modeling and Assimilation Office core funding.
This research has been supported by the Climate Program Office (grant no. NA19OAR4310169).
This paper was edited by Mark Weber and reviewed by two anonymous referees.
Abalos, M., Polvani, L., Calvo, N., Kinnison, D., Ploeger, F., Randel, W.,and Solomon, S.: New insights on the impact of ozone-depleting substances on the Brewer-Dobson circulation, J. Geophys. Res.-Atmos., 124, 2435–2451, https://doi.org/10.1029/2018JD029301, 2019.
Bai, K., Liu, C., Shi, R., and and Gao, W.: Comparison of Suomi-NPP OMPS total column ozone with Brewer and Dobson spectrophotometers measurements, Front. Earth Sci., 9, 369–380, https://doi.org/10.1007/s11707-014-0480-5, 2015.
Ball, W. T., Alsing, J., Staehelin, J., Davis, S. M., Froidevaux, L., and Peter, T.: Stratospheric ozone trends for 1985–2018: sensitivity to recent large variability, Atmos. Chem. Phys., 19, 12731–12748, https://doi.org/10.5194/acp-19-12731-2019, 2019.
Ball, W. T., Chiodo, G., Abalos, M., Alsing, J., and Stenke, A.: Inconsistencies between chemistry–climate models and observed lower stratospheric ozone trends since 1998, Atmos. Chem. Phys., 20, 9737–9752, https://doi.org/10.5194/acp-20-9737-2020, 2020.
Bass, A. M. and Paur, R. J.: The ultraviolet cross-sections of ozone: I. The measurements in Atmospheric ozone, edited by: Zerefos, C. S. and Ghazi, A., Reidel, Dordrecht, Boston, Lancaster, 606–610, https://doi.org/10.1007/978-94-009-5313-0_120, 1985.
Bernet, L., von Clarmann, T., Godin-Beekmann, S., Ancellet, G., Maillard Barras, E., Stübi, R., Steinbrecht, W., Kämpfer, N., and Hocke, K.: Ground-based ozone profiles over central Europe: incorporating anomalous observations into the analysis of stratospheric ozone trends, Atmos. Chem. Phys., 19, 4289–4309, https://doi.org/10.5194/acp-19-4289-2019, 2019.
Bernet, L., Boyd, I., Nedoluha, G., Querel, R., Swart, D., and Hocke, K.: Validation and Trend Analysis of Stratospheric Ozone Data from Ground-Based Observations at Lauder, New Zealand, Remote Sens., 13, 109, https://doi.org/10.3390/rs13010109, 2021.
Bhartia, P. K., McPeters, R. D., Flynn, L. E., Taylor, S., Kramarova, N. A., Frith, S., Fisher, B., and DeLand, M.: Solar Backscatter UV (SBUV) total ozone and profile algorithm, Atmos. Meas. Tech., 6, 2533–2548, https://doi.org/10.5194/amt-6-2533-2013, 2013.
Bojkov, R. D., Kosmidis, E., DeLuisi, J. J., Petropavlovskikh, I., Fioletov, V. E., Godin, S., and Zerefos, C.: Vertical ozone distribution characteristics deduced from ∼ 44,000 re-evaluated Umkehr profiles (1957–2000), Meteorol. Atmos. Phys., 79, 127–158, https://doi.org/10.1007/s007030200000, 2002.
Boynard, A., Hurtmans, D., Garane, K., Goutail, F., Hadji-Lazaro, J., Koukouli, M. E., Wespes, C., Vigouroux, C., Keppens, A., Pommereau, J.-P., Pazmino, A., Balis, D., Loyola, D., Valks, P., Sussmann, R., Smale, D., Coheur, P.-F., and Clerbaux, C.: Validation of the IASI FORLI/EUMETSAT ozone products using satellite (GOME-2), ground-based (Brewer–Dobson, SAOZ, FTIR) and ozonesonde measurements, Atmos. Meas. Tech., 11, 5125–5152, https://doi.org/10.5194/amt-11-5125-2018, 2018.
Christodoulakis, J., Varotsos, C., Cracknell, A. P., Tzanis, C., and Neofytos, A.: An assessment of the stray light in 25 years of Dobson total ozone data at Athens, Greece, Atmos. Meas. Tech., 8, 3037–3046, https://doi.org/10.5194/amt-8-3037-2015, 2015.
Damadeo, R. P., Zawodny, J. M., and Thomason, L. W.: Reevaluation of stratospheric ozone trends from SAGE II data using a simultaneous temporal and spatial analysis, Atmos. Chem. Phys., 14, 13455–13470, https://doi.org/10.5194/acp-14-13455-2014, 2014.
DeLuisi, J. J.: Umkehr vertical ozone profile errors caused by the presence of stratospheric aerosols, J. Geophys. Res., 84, 1766–1770, https://doi.org/10.1029/JC084iC04p01766, 1979.
DeLuisi, J. J., Longenecker, D. U., Mateer, C. L., and Wuebbles, D. J.: An analysis of northern middle-latitude Umkehr measurements corrected for stratospheric aerosols for 1979–1986, J. Geophys. Res., 94, 9837–9846, https://doi.org/10.1029/JD094iD07p09837, 1989.
Deshler, T., Mercer, J. L., Smit, H. G. J., Stubi, R., Levrat, G., Johnson, B. J., Oltmans, S. J., Kivi, R., Thompson, A. M., Witte, J., Davies, J., Schmidlin, F. J., Brothers, G., and Sasaki, T.: Atmospheric comparison of electrochemical cell ozonesondes from different manufacturers, and with different cathode solution strengths: The Balloon Experiment on Standards for Ozonesondes, J. Geophys. Res., 113, D04307, https://doi.org/10.1029/2007JD008975, 2008.
Dietmüller, S., Garny, H., Eichinger, R., and Ball, W. T.: Analysis of recent lower-stratospheric ozone trends in chemistry climate models, Atmos. Chem. Phys., 21, 6811–6837, https://doi.org/10.5194/acp-21-6811-2021, 2021.
Dobson, G. M. B.: Adjustment and calibration of the ozone spectrophotometer, ibid. V, Part I, WMO/TD-No. 1469, 90–113, Pergamon Press, 1957.
Douglass, A. R., Strahan, S. E., Oman, L. D., and Stolarski, R. S.: Multi-decadal records of stratospheric composition and their relationship to stratospheric circulation change, Atmos. Chem. Phys., 17, 12081–12096, https://doi.org/10.5194/acp-17-12081-2017, 2017.
Duncan, B. N., West, J. J., Yoshida, Y., Fiore, A. M., and Ziemke, J. R.: The influence of European pollution on ozone in the Near East and northern Africa, Atmos. Chem. Phys., 8, 2267–2283, https://doi.org/10.5194/acp-8-2267-2008, 2008.
Evans, R., McConville, G., Oltmans, S., Petropavlovskikh, I., and Quincy, D.: Measurement of internal stray light within Dobson ozone spectrophotometers, Int. J. Remote Sens., 30, 4247–4258, https://doi.org/10.1080/01431160902825057, 2009.
Evans, R. D.: Operations Handbook – Ozone Observations with a Dobson Spectrophotometer – revised version, WMO/GAW Report No. 183, 2008.
Evans, R. D., Petropavlovskikh, I., McClure-Begley, A., McConville, G., Quincy, D., and Miyagawa, K.: Technical note: The US Dobson station network data record prior to 2015, re-evaluation of NDACC and WOUDC archived records with WinDobson processing software, Atmos. Chem. Phys., 17, 12051–12070, https://doi.org/10.5194/acp-17-12051-2017, 2017.
Fioletov, V. E.: Ozone climatology, trends, and substances that control ozone, Atmos. Ocean, 46, 39–67, https://doi.org/10.3137/ao.460103, 2008.
Fioletov, V. E., Tarasick, D. W., and Petropavlovskikh, I.: Estimating ozone variability and instrument uncertainties from SBUV(/2), ozonesonde, Umkehr, and SAGE II measurements: Short-term variations, J. Geophys. Res., 111, D02305, https://doi.org/10.1029/2005JD006340, 2006.
Flynn, L., Seftor, C., Larsen, J., and Xu, P.: Introduction to the Ozone Mapping and Profiler Suite (OMPS), in: Earth Science Satellite Remote Sensing, vol. 1: Science and Instruments, edited by: Qu, J. J., Gao, W., Kafatos, M., Murphy, R. E., and Salomonson, V. V., Springer, Berlin, https://doi.org/10.1007/978-3-540-37293-6_15, ISBN 978-3-540-35606-6, 2006.
Flynn, L., Long, C., Wu,X., Evans, R., Beck, C. T., Petropavlovskikh, McConville, I. G., Yu, W., Zhang, Z., Niu, J., Beach, E.,Hao, Y., Pan, C., Sen, B., Novicki, M., Zhou, S., and Seftor, C.: Performance of the Ozone Mapping and Profiler Suite (OMPS) products, J. Geophys. Res.-Atmos., 119, 6181–6195, https://doi.org/10.1002/2013JD020467, 2014.
Gaudel, A., Ancellet, G., and Godin-Beekmann, S.: Analysis of 20 years of tropospheric ozone vertical profiles by lidar and ECC at Observatoire de Haute Provence (OHP) at 44∘ N, 5.7∘ E, Atmos. Environ., 113, 78–89, https://doi.org/10.1016/j.atmosenv.2015.04.028, 2015.
Gelaro, R., McCarty, W., Suárez, M. J., Todling, R., Molod, A., Takacs, L., Randles, C. A., Darmenov, A., Bosilovich, M. G., Reichle, R., Wargan, K., Coy, L., Cullather, R., Draper, C., Akella, S., Buchard, V., Conaty, A., da Silva, A. M., Gu, W., Kim, G., Koster, R., Lucchesi, R., Merkova, D., Nielsen, J. E., Partyka, G., Pawson, S., Putman, W., Rienecker, M., Schubert, S. D., Sienkiewicz, M., and Zhao, B.: The Modern-Era Retrospective Analysis for Research and Applications, version 2 (MERRA-2), J. Climate, 30, 5419–5454, https://doi.org/10.1175/JCLI-D-16-0758.1, 2017.
Godin-Beekmann, S., Newman, P. A. and Petropavlovskikh, I.: 30th anniversary of the Montreal Protocol: From the safeguard of the ozone layer to the protection of the Earth's climate, C. R. Geosci., 350, 331–333, https://doi.org/10.1016/j.crte.2018.11.001, 2018.
Götz, F. W. P., Meetham, A. R., and Dobson, G. M. B.: The vertical distribution of ozone in the atmosphere, Proc. R. Soc. London, Ser. A, 145, 416–443, 1934.
Harris, N., Hudson, R., and Phillips, C. (Eds.): Assessment of trends in the vertical distribution of ozone, Stratospheric Processes and Their Role in Climate/International Ozone Commission/Global Atmospheric Watch (SPARC/IOC/ GAW) Report 1, WMO/TD- No. 935; GORMP-No. 43, available at: https://www.sparc-climate.org/publications/sparc-reports/sparc-report-no-1/, last accessed: 22-Febrary 2022), 1998.
Hassler, B., Bodeker, G. E., and Dameris, M.: Technical Note: A new global database of trace gases and aerosols from multiple sources of high vertical resolution measurements, Atmos. Chem. Phys., 8, 5403–5421, https://doi.org/10.5194/acp-8-5403-2008, 2008.
Hassler, B., Petropavlovskikh, I., Staehelin, J., August, T., Bhartia, P. K., Clerbaux, C., Degenstein, D., Mazière, M. D., Dinelli, B. M., Dudhia, A., Dufour, G., Frith, S. M., Froidevaux, L., Godin-Beekmann, S., Granville, J., Harris, N. R. P., Hoppel, K., Hubert, D., Kasai, Y., Kurylo, M. J., Kyrölä, E., Lambert, J.-C., Levelt, P. F., McElroy, C. T., McPeters, R. D., Munro, R., Nakajima, H., Parrish, A., Raspollini, P., Remsberg, E. E., Rosenlof, K. H., Rozanov, A., Sano, T., Sasano, Y., Shiotani, M., Smit, H. G. J., Stiller, G., Tamminen, J., Tarasick, D. W., Urban, J., van der A, R. J., Veefkind, J. P., Vigouroux, C., von Clarmann, T., von Savigny, C., Walker, K. A., Weber, M., Wild, J., and Zawodny, J. M.: Past changes in the vertical distribution of ozone – Part 1: Measurement techniques, uncertainties and availability, Atmos. Meas. Tech., 7, 1395–1427, https://doi.org/10.5194/amt-7-1395-2014, 2014.
Hubert, D., Lambert, J.-C., Verhoelst, T., Granville, J., Keppens, A., Baray, J.-L., Bourassa, A. E., Cortesi, U., Degenstein, D. A., Froidevaux, L., Godin-Beekmann, S., Hoppel, K. W., Johnson, B. J., Kyrölä, E., Leblanc, T., Lichtenberg, G., Marchand, M., McElroy, C. T., Murtagh, D., Nakane, H., Portafaix, T., Querel, R., Russell III, J. M., Salvador, J., Smit, H. G. J., Stebel, K., Steinbrecht, W., Strawbridge, K. B., Stübi, R., Swart, D. P. J., Taha, G., Tarasick, D. W., Thompson, A. M., Urban, J., van Gijsel, J. A. E., Van Malderen, R., von der Gathen, P., Walker, K. A., Wolfram, E., and Zawodny, J. M.: Ground-based assessment of the bias and long-term stability of 14 limb and occultation ozone profile data records, Atmos. Meas. Tech., 9, 2497–2534, https://doi.org/10.5194/amt-9-2497-2016, 2016.
Jiang, Y. B., Froidevaux, L., Lambert, A., Livesey, N. J., Read, W. G., Waters, J. W., Bojkov, B., Leblanc, T., McDermid, I. S., Godin-Beekmann, S., Filipiak, M. J., Harwood, R. S., Fuller, R. A., Daffer W. H., Drouin, B. J., Cofield, R. E., Cuddy, D. T., Jarnot, R. F., Knosp, B. W., Perun, V. S., Schwartz, M. J., Snyder, W. V., Stek, P. C., Thurstans, R. P., Wagner, P. A., Allaart, M., Andersen, S. B., Bodeker, G., Calpini, B., Claude, H., Coetzee, G., Davies, J., De Backer, H., Dier, H., Fujiwara, M., Johnson, B., Kelder, H., Leme, N. P., König-Langlo, G., Kyro, E., Laneve, G., Fook, L. S., Merrill, J., Morris, G., Newchurch, M., Oltmans, S., Parrondos, M. C., Posny, F., Schmidlin, F., Skrivankova, P., Stubi, R., Tarasick, D., Thompson, A., Thouret, V., Viatte, P., Vömel, H., von Der Gathen, P., Yela, M., and Zablocki, G.: Validation of Aura Microwave Limb Sounder Ozone by ozonesonde and lidar measurements, J. Geophys. Res., 112, D24S34, https://doi.org/10.1029/2007JD008776, 2007.
Köhler, U., Nevas, S., McConville, G., Evans, R., Smid, M., Stanek, M., Redondas, A., and Schönenborn, F.: Optical characterisation of three reference Dobsons in the ATMOZ Project – verification of G. M. B. Dobson's original specifications, Atmos. Meas. Tech., 11, 1989–1999, https://doi.org/10.5194/amt-11-1989-2018, 2018.
Komhyr, W. D., Mateer, C. L., and Hudson, R. D.: Effective Bass-Paur 1985 ozone absorption coefficients for use with Dobson ozone spectrophotometers, J. Geophys. Res., 98, 20451–20465, https://doi.org/10.1029/93JD00602, 1993.
Koukouli, M. E., Zara, M., Lerot, C., Fragkos, K., Balis, D., van Roozendael, M., Allart, M. A. F., and van der A, R. J.: The impact of the ozone effective temperature on satellite validation using the Dobson spectrophotometer network, Atmos. Meas. Tech., 9, 2055–2065, https://doi.org/10.5194/amt-9-2055-2016, 2016.
Kramarova, N. A., Bhartia, P. K., Frith, S. M., McPeters, R. D., and Stolarski, R. S.: Interpreting SBUV smoothing errors: an example using the quasi-biennial oscillation, Atmos. Meas. Tech., 6, 2089–2099, https://doi.org/10.5194/amt-6-2089-2013, 2013.
Krzycin, J. W. and Rajewska-Wich, B.: Preliminary comparison of the ozone vertical profiles from Umkehr and ozonesonde measurements over Poland with EOS-MLS Aura spacecraft overpasses, 2004–2005, Int. J. Remote Sens., 28, 1089–1100, 2007.
Livesey, N. J., Read, W. G., Wagner, P. A., Froidevaux, L., Lambert, A., Manney, G. L., Millán, L. F., Pumphrey, H. C., Santee, M. L., Schwartz, M. J., Wang, S. H., Fuller, R. A., Jarnot, R. F., Knosp, B. W., Martinez, E., and Lay, R. R.: Earth Observing System (EOS) Aura Microwave Limb Sounder (MLS) Version 4.2x Level 2 data quality and description document, Tech. Rep. JPL D-33509 Rev. D, Version 4.2x–3.1, Jet Propulsion Laboratory, California Institute of Technology, Pasadena, California, 91109-8099, available at: https://mls.jpl.nasa.gov/data/v4-2_data_quality_document.pdf (last access: 22 February 2022), 2018.
Long, C. S., Fujiwara, M., Davis, S., Mitchell, D. M., and Wright, C. J.: Climatology and interannual variability of dynamic variables in multiple reanalyses evaluated by the SPARC Reanalysis Intercomparison Project (S-RIP), Atmos. Chem. Phys., 17, 14593–14629, https://doi.org/10.5194/acp-17-14593-2017, 2017.
Mateer, C. L.: On the information content of Umkehr observations, J. Atmos. Sci., 22, 370–382, 1965.
Mateer, C. L.: Estimation of total ozone from satellites measurements of backscattered ultraviolet earth radiance, J. Atmos. Sci., 28, 1307–1311, 1971.
Mateer, C. L. and DeLuisi, J. J.: A new Umkehr inversion algorithm, J. Atmos. Terr. Phys., 54, 537–556, 1992.
Mauldin III, L. E., McCormick Jr., M. P., McMaster, L. R., and Vaughan, W. R.: The Stratospheric Aerosol and Gas Experiment II (SAGE II) Design and In-Orbit Performance, Proc. SPIE 0589, Instrumentation for Optical Remote Sensing from Space, 104–113, https://doi.org/10.1117/12.951921, 1986.
McPeters, R. D. and Labow, G. J.: Climatology 2011: An MLS and sonde derived ozone climatology for satellite retrieval algorithms, J. Geophys. Res., 117, D10303, https://doi.org/10.1029/2011JD017006, 2012.
McPeters, R. D., Bhartia, P. K., Krueger, A. J., Herman, J. R., Wellemeyer, C. G., Seftor, C. J., Jaross, G., Torres, O., Moy, L., Labow, G., Byerly, W., Taylor, S. L., Swissler, T., and Cebula, R. P.: Earth Probe Total Ozone Mapping Spectrometer (TOMS) data products user's guide, NASA Tech. Pap., NASA/TP-1998–206895, 72 pp., https://ozoneaq.gsfc.nasa.gov/media/docs/epusrguide.pdf (last access: 22 February 2022), 1998.
McPeters, R. D., Bhartia, P. K., Haffner, D., Labow, G. J., and Flynn, L.: The version 8.6 SBUV ozone data record: An overview, J. Geophys. Res.-Atmos., 118, 8032–8039, https://doi.org/10.1002/jgrd.50597, 2013.
McPeters, R., Frith, S., Kramarova, N., Ziemke, J., and Labow, G.: Trend quality ozone from NPP OMPS: the version 2 processing, Atmos. Meas. Tech., 12, 977–985, https://doi.org/10.5194/amt-12-977-2019, 2019.
Miyazaki, K. and Bowman, K.: Evaluation of ACCMIP ozone simulations and ozonesonde sampling biases using a satellite-based multi-constituent chemical reanalysis, Atmos. Chem. Phys., 17, 8285–8312, https://doi.org/10.5194/acp-17-8285-2017, 2017.
Moeini, O., Vaziri Zanjani, Z., McElroy, C. T., Tarasick, D. W., Evans, R. D., Petropavlovskikh, I., and Feng, K.-H.: The effect of instrumental stray light on Brewer and Dobson total ozone measurements, Atmos. Meas. Tech., 12, 327–343, https://doi.org/10.5194/amt-12-327-2019, 2019.
Moreira, L., Hocke, K., and Kämpfer, N.: Comparison of ozone profiles and influences from the tertiary ozone maximum in the night-to-day ratio above Switzerland, Atmos. Chem. Phys., 17, 10259–10268, https://doi.org/10.5194/acp-17-10259-2017, 2017.
Morgenstern, O., Hegglin, M. I., Rozanov, E., O'Connor, F. M., Abraham, N. L., Akiyoshi, H., Archibald, A. T., Bekki, S., Butchart, N., Chipperfield, M. P., Deushi, M., Dhomse, S. S., Garcia, R. R., Hardiman, S. C., Horowitz, L. W., Jöckel, P., Josse, B., Kinnison, D., Lin, M., Mancini, E., Manyin, M. E., Marchand, M., Marécal, V., Michou, M., Oman, L. D., Pitari, G., Plummer, D. A., Revell, L. E., Saint-Martin, D., Schofield, R., Stenke, A., Stone, K., Sudo, K., Tanaka, T. Y., Tilmes, S., Yamashita, Y., Yoshida, K., and Zeng, G.: Review of the global models used within phase 1 of the Chemistry–Climate Model Initiative (CCMI), Geosci. Model Dev., 10, 639–671, https://doi.org/10.5194/gmd-10-639-2017, 2017.
NASA/LARC/SD/ASDC: Stratospheric Aerosol and Gas Experiment (SAGE) II Version 7.0 Aerosol, O3, NO2 and H2O Profiles in binary format, NASA Langley Atmospheric Science Data Center DAAC [data set], https://doi.org/10.5067/ERBS/SAGEII/SOLAR_BINARY_L2-V7.0, 2012.
Nair, P. J., Godin-Beekmann, S., Pazmiño, A., Hauchecorne, A., Ancellet, G., Petropavlovskikh, I., Flynn, L. E., and Froidevaux, L.: Coherence of long-term stratospheric ozone vertical distribution time series used for the study of ozone recovery at a northern mid-latitude station, Atmos. Chem. Phys., 11, 4957–4975, https://doi.org/10.5194/acp-11-4957-2011, 2011.
Nair, P. J., Godin-Beekmann, S., Froidevaux, L., Flynn, L. E., Zawodny, J. M., Russell III, J. M., Pazmiño, A., Ancellet, G., Steinbrecht, W., Claude, H., Leblanc, T., McDermid, S., van Gijsel, J. A. E., Johnson, B., Thomas, A., Hubert, D., Lambert, J.-C., Nakane, H., and Swart, D. P. J.: Relative drifts and stability of satellite and ground-based stratospheric ozone profiles at NDACC lidar stations, Atmos. Meas. Tech., 5, 1301–1318, https://doi.org/10.5194/amt-5-1301-2012, 2012.
Newchurch et al, 1987. Newchurch, M. J., Grams, G. W., Cunnold, D. M., and DeLuisi, J. J.: A comparison of SAGE 1, SBUV, and Umkehr ozone profiles including a search for Umkehr aerosol effects, J. Geophys. Res., 92, 8382–8390, https://doi.org/10.1029/JD092iD07p08382, 1987.
Newman, P. A.: The way forward for Montreal Protocol science, C. R. Geosci., 350, 442–447, https://doi.org/10.1016/j.crte.2018.09.001, 2018.
Orbe, C., Oman, L. D., Strahan, S. E., Waugh, D. W., Pawson, S., Takacs, L. L., and Molod, A. M.: Large-scale atmospheric transport in GEOS replay simulations, J. Adv. Model. Earth Syst., 9, 2545–2560, https://doi.org/10.1002/2017MS001053, 2017.
Petropavlovskikh, I. and Miyagawa, K.: NOAA Dobson Umkehr Operational, StrayLight, and Optimized Ozone Profile Data, Monthly Averages, NOAA GML [data set], https://gml.noaa.gov/aftp/data/ozwv/Dobson/AC4/Umkehr/Monthly/, last access: 21 May 2021.
Petropavlovskikh, I., Ahn, C., Bhartia, P. K., and Flynn, L. E.: Comparison and covalidation of ozone anomalies and variability observed in SBUV(/2) and Umkehr northern midlatitude ozone profile estimates, Geophys. Res. Lett., 32, L06805, https://doi.org/10.1029/2004GL022002, 2005a.
Petropavlovskikh, I., Bhartia, P. K., and DeLuisi, J.: New Umkehr ozone profile retrieval algorithm optimized for climatological studies, Geophys. Res. Lett., 32, L16808, https://doi.org/10.1029/2005GL023323, 2005b.
Petropavlovskikh, I., Evans, R., McConville, G., Miyagawa, K., and Oltmans, S.: Effect of the out-of- band stray light on the retrieval of the Umkehr Dobson ozone profiles, Int. J. Remote Sens., 30, 6461–6482, https://doi.org/10.1080/01431160902865806, 2009.
Petropavlovskikh, I., Evans, R., McConville, G., Oltmans, S., Quincy, D., Lantz, K., Disterhoft, P., Stanek, M., and Flynn, L.: Sensitivity of Dobson and Brewer Umkehr ozone profile retrievals to ozone cross-sections and stray light effects, Atmos. Meas. Tech., 4, 1841–1853, https://doi.org/10.5194/amt-4-1841-2011, 2011.
Petropavlovskikh, I., Godin-Beekmann, S., Hubert, D., Damadeo, R., Hassler, B., and Sofieva, V.: SPARC/IO3C/GAW Report on Long-term Ozone Trends and Uncertainties in the Stratosphere, edited by: Kenntner, M. and Ziegele, B., GAW Report No. 241; WCRP Report 17/2018, https://doi.org/10.17874/f899e57a20b, 2019.
Reinsel, G. C., Tiao, G. C., DeLuisi, J. J., Mateer, C. L., Miller, A. J., and Frederick, J. E.: Analysis of upper stratospheric Umkehr ozone profile data for trends and the effects of stratospheric aerosols, J. Geophys. Res., 89, 4833–4840, https://doi.org/10.1029/JD089iD03p04833, 1984.
Rodgers, C. D.: Characterization and error analysis of profiles retrieved from remote sounding measurements, J. Geophys. Res., 95, 5587–5595, 1990.
Rodgers, C. D.: Inverse Methods for Atmospheric Sounding: Theory and Practice, vol. 2 of Series on Atmospheric, Oceanic and Planetary Physics, edited by: Taylor, F. W., World Scientific, Singapore, New Jersey, London, Hong Kong, ISBN 981-02-2740-X, 2000.
Seftor, C. J., Jaross, G., Kowitt, M., Haken, M., Li, J., and Flynn, L. E.: Postlaunch performance of the Suomi National Polar-orbiting Partnership Ozone Mapping and Profiler Suite (OMPS) nadir sensors, J. Geophys. Res.-Atmos., 119, 4413–4428, https://doi.org/10.1002/2013JD020472, 2014.
Sofieva, V. F., Kalakoski, N., Päivärinta, S.-M., Tamminen, J., Laine, M., and Froidevaux, L.: On sampling uncertainty of satellite ozone profile measurements, Atmos. Meas. Tech., 7, 1891–1900, https://doi.org/10.5194/amt-7-1891-2014, 2014.
Staehelin, J., Viatte, P., Stübi, R., Tummon, F., and Peter, T.: Stratospheric ozone measurements at Arosa (Switzerland): history and scientific relevance, Atmos. Chem. Phys., 18, 6567–6584, https://doi.org/10.5194/acp-18-6567-2018, 2018.
Stauffer, R. M., Thompson, A. M., Oman, L. D., and Strahan, S. E.: The effects of a 1998 observing system change on MERRA-2-based ozone profile simulations, J. Geophys. Res.-Atmos., 124, 7429–7441, https://doi.org/10.1029/2019JD030257, 2019.
Steinbrecht, W., Froidevaux, L., Fuller, R., Wang, R., Anderson, J., Roth, C., Bourassa, A., Degenstein, D., Damadeo, R., Zawodny, J., Frith, S., McPeters, R., Bhartia, P., Wild, J., Long, C., Davis, S., Rosenlof, K., Sofieva, V., Walker, K., Rahpoe, N., Rozanov, A., Weber, M., Laeng, A., von Clarmann, T., Stiller, G., Kramarova, N., Godin-Beekmann, S., Leblanc, T., Querel, R., Swart, D., Boyd, I., Hocke, K., Kämpfer, N., Maillard Barras, E., Moreira, L., Nedoluha, G., Vigouroux, C., Blumenstock, T., Schneider, M., García, O., Jones, N., Mahieu, E., Smale, D., Kotkamp, M., Robinson, J., Petropavlovskikh, I., Harris, N., Hassler, B., Hubert, D., and Tummon, F.: An update on ozone profile trends for the period 2000 to 2016, Atmos. Chem. Phys., 17, 10675–10690, https://doi.org/10.5194/acp-17-10675-2017, 2017.
Sterling, C. W., Johnson, B. J., Oltmans, S. J., Smit, H. G. J., Jordan, A. F., Cullis, P. D., Hall, E. G., Thompson, A. M., and Witte, J. C.: Homogenizing and estimating the uncertainty in NOAA's long-term vertical ozone profile records measured with the electrochemical concentration cell ozonesonde, Atmos. Meas. Tech., 11, 3661–3687, https://doi.org/10.5194/amt-11-3661-2018, 2018.
Stone, K. A., Morgenstern, O., Karoly, D. J., Klekociuk, A. R., French, W. J., Abraham, N. L., and Schofield, R.: Evaluation of the ACCESS – chemistry–climate model for the Southern Hemisphere, Atmos. Chem. Phys., 16, 2401–2415, https://doi.org/10.5194/acp-16-2401-2016, 2016.
Strahan, S. E., Duncan, B. N., and Hoor, P.: Observationally derived transport diagnostics for the lowermost stratosphere and their application to the GMI chemistry and transport model, Atmos. Chem. Phys., 7, 2435–2445, https://doi.org/10.5194/acp-7-2435-2007, 2007.
Strahan, S. E., Douglass, A. R., and Newman, P. A.: The contributions of chemistry and transport to low arctic ozone in March 2011 derived from Aura MLS observations, J. Geophys. Res., 118, 1563–1576, 2013.
Strahan, S. E., Oman, L. D., Douglass, A. R., and Coy, L.: Modulation of Antarctic vortex composition by the Quasi-Biennial Oscillation, Geophys. Res., Lett., 42, 4216–4223, https://doi.org/10.1002/2015GL063759, 2015.
Strahan, S. E., Douglass, A. R., and Steenrod, S. D.: Chemical and dynamical impacts of stratospheric sudden warmings on Arctic ozone variability, J. Geophys. Res., 19, 11836–11851, https://doi.org/10.1002/2016JD025128, 2016.
Strahan, S. E., Smale, D., Douglass, A. R., Blumenstock, T., Hannigan, J. W., Hase, F., Jones, N. B., Mahieu, E., Notholt, J., Oman, L. D., Ortega, I., Palm, M., Prignon, M., Robinson, J., Schneider, M., Sussmann, R., and Velazco, V. A.: Observed hemispheric asymmetry in stratospheric transport trends from 1994 to 2018, Geophys. Res. Lett., 47, e2020GL088567, https://doi.org/10.1029/2020GL088567, 2020.
Vigroux, E.: Contribution a l'étude expérimentale de l'absorption de l'ozone, Ann. Phys. (Paris), 12, 709–762, https://doi.org/10.1051/anphys/195312080709, 1953.
Wang, H. J. R., Damadeo, R., Flittner, D., Kramarova, N., Taha, G., Davis, S., Thompson, A. M., Strahan, S., Wang, Y., Froidevaux, L., Degenstein, D., Bourassa, A., Steinbrecht, W., Walker, K. A., Querel, R., Leblanc, T., Godin-Beekmann, S., Hurst, D., and Hall, E.: Validation of SAGE III/ISS solar occultation ozone products with correlative satellite and ground based measurements, J. Geophys. Res.-Atmos., 125, e2020JD032430, https://doi.org/10.1029/2020JD032430, 2020.
Wargan, K., Labow, G., Frith, S., Pawson, S., Livesey, N., and Partyka, G.: Evaluation of the ozone fields in NASA's MERRA-2 reanalysis, J. Climate, 30, 2961–2988, https://doi.org/10.1175/JCLI-D-16-0699.1, 2017.
Wargan, K., Orbe, C., Pawson, S., Ziemke, J. R., Oman, L. D., Olsen, M. A., Coy, L., and Knowland, E. K.: Recent decline in extratropical lower stratospheric ozone attributed to circulation changes, Geophys. Res. Lett., 45, 5166–5176, https://doi.org/10.1029/2018GL077406, 2018.
Waters, J. W., Read, W. G., Froidevaux, L., Jarnot, R. F., Cofield, R. E., Flower, D. A., Lau, G. K., Pickett, H. M., Santee, M. L., Wu, D. L., Boyles, M. A., Burke, J. R., Lay, R. R., Loo, M. S., Livesey, N. J., Lungu, T. A., Manney, G. L., Nakamura, L. L., Perun, V. S., Ridenoure, B. P., Shippony, Z., Siegel, P. H., Thurstans, R. P., Harwood, R. S., Pumphrey, H. C., and Filipiak, M. J.: The UARS and EOS Microwave Limb Sounder Experiments, J. Atmos. Sci., 56, 194–218, https://doi.org/10.1175/1520-0469(1999)056<0194:TUAEML>2.0.CO;2, 1999.
Witte, J. C., Thompson, A. M., Smit, H. G. J., Vömel, H., Posny, F., and Stübi, R.: First reprocessing of Southern Hemisphere ADditional OZonesondes profile records: 3. Uncertainty in ozone profile and total column, J. Geophys. Res.-Atmos., 123, 3243–3268, https://doi.org/10.1002/2017JD027791, 2018.
Weber, M., Coldewey-Egbers, M., Fioletov, V. E., Frith, S. M., Wild, J. D., Burrows, J. P., Long, C. S., and Loyola, D.: Total ozone trends from 1979 to 2016 derived from five merged observational datasets – the emergence into ozone recovery, Atmos. Chem. Phys., 18, 2097–2117, https://doi.org/10.5194/acp-18-2097-2018, 2018.
WMO: Scientific Assessment of Ozone Depletion: 2018, Global Ozone Research and Monitoring Project – Report, World Meteorological Organization, Geneva, Switzerland, 588 pp., https://csl.noaa.gov/assessments/ozone/2018/ (last accessed: 22 Febrary 2022), 2018.
Zanis, P., Maillard, E., Staehelin, J., Zerefos, C., Kosmidis, E., Tourpali, K., and Wohltmann, I.: On the turnaround of stratospheric ozone trends deduced from the reevaluated Umkehr record of Arosa, Switzerland, J. Geophys. Res., 111, D22307, https://doi.org/10.1029/2005JD006886, 2006.
Ziemke, J. R., Labow, G. J., Kramarova, N. A., McPeters, R. D., Bhartia, P. K., Oman, L. D., Frith, S. M., and Haffner, D. P.: A global ozone profile climatology for satellite retrieval algorithms based on Aura MLS measurements and the MERRA-2 GMI simulation, Atmos. Meas. Tech., 14, 6407–6418, https://doi.org/10.5194/amt-14-6407-2021, 2021.
- Abstract
- Introduction
- Data
- Optimization of Umkehr stray light corrections
- Comparisons of optimized Umkehr time series against reference records
- Conclusions
- Data availability
- Author contributions
- Competing interests
- Disclaimer
- Special issue statement
- Acknowledgements
- Financial support
- Review statement
- References
- Supplement