the Creative Commons Attribution 4.0 License.
the Creative Commons Attribution 4.0 License.
 | 29 Mar 2022
Traceable total ozone column retrievals from direct solar spectral irradiance measurements in the ultraviolet
Luca Egli
Julian Gröbner
Gregor Hülsen
Herbert Schill
René Stübi
Total column ozone (TCO) is commonly measured by Brewer and Dobson spectroradiometers. Both types of instruments use solar irradiance measurements at four wavelengths in the ultraviolet radiation range to derive TCO. For the calibration and quality assurance of the measured TCO both instrument types require periodic field comparisons with a reference instrument.
This study presents traceable TCO retrievals from direct solar spectral irradiance measurements with the portable UV reference instrument QASUME. TCO is retrieved by a spectral fitting technique derived by a minimal least square fit algorithm using spectral measurements in the wavelength range between 305 and 345 nm. The retrieval is based on an atmospheric model accounting for different atmospheric parameters such as effective ozone temperature, aerosol optical depth, Rayleigh scattering, SO2, ground air pressure, ozone absorption cross sections and top-of-the-atmosphere solar spectrum. Traceability is achieved by fully characterizing and calibrating the QASUME spectroradiometer in the laboratory to SI standards (International System of Units). The TCO retrieval method from this instrument is independent from any reference instrument and does not require periodic in situ field calibration.
The results show that TCO from QASUME can be retrieved with a relative standard uncertainty of less than 0.8 % when accounting for uncertainties from the measurements and the retrieval model, such as different ozone absorption cross sections, different reference top-of-the-atmosphere solar spectra, uncertainties from effective ozone temperature or other atmospheric parameters. The long-term comparison of QASUME TCO with TCO derived from a Brewer and a Dobson in Davos, Switzerland, reveals that all three instruments are consistent within 1 % when using the ozone absorption cross section from the University of Bremen. From the results and method presented here, other absolute SI calibrated cost-effective solar spectroradiometers, such as array spectroradiometers, may be applied for traceable TCO monitoring.
- Article
(1342 KB) - Full-text XML
- BibTeX
- EndNote


Since the 1970s the depletion of the stratospheric ozone layer has been reported in many international scientific publications (e.g., Molina and Rowland, 1974; Solomon, 1999; Staehelin et al., 2001, 2018) and regularly summarized in the Word Meteorological Organisation (WMO) assessment of ozone depletion (e.g., WMO, 2018, or https://www.esrl.noaa.gov/csd/assessments/ozone, last access: 23 March 2022). It has been shown that the ozone layer in the stratosphere was reduced by anthropogenic emissions of ozone depleting substances, which have been controlled since the 1980s by the Montreal protocol. In order to monitor the effect of the decisions by the Montreal protocol and its amendments, the temporal development of the ozone layer needs to be observed worldwide with accurate instrumentations. Furthermore, the mutual interactions between the ozone layer and climatic change on earth's surface are currently investigated and require long-term consistent observations of total ozone column in the atmosphere (e.g., Bais et al., 2015, 2019; Seckmeyer et al., 2018; Young et al., 2021).
The atmospheric shield of total column ozone (TCO) is important for the incoming UV radiation at the earth's surface and its impact on human health (Zerefos, 2002) due to changing UV exposure on the ground with decreasing TCO. Since the ozone layer absorbs effectively the radiation in the UV band at wavelengths shorter than 350 nm, accurate direct sun measurements of the UV radiation allow retrieving TCO at the earth's surface by measuring the UV radiation in that wavelength band (Kerr et al., 1988).
Since the beginning of the 1920s, total ozone column has been measured by the Dobson sun spectroradiometer (Dobson, 1931, 1968; Basher, 1985; Komhyr et al., 1989) to form a global network. The Dobson instruments were operated manually and required substantial manpower and maintenance and were difficult to operate at remote sites. In order to monitor the aforementioned depletion of TCO and its impact on climatic change and the UV exposure on the ground, the Brewer spectrometer (Kerr et al., 1981, 1985) was introduced in the 1980s as an automatic device measuring direct solar UV radiation and global UV irradiance with then state-of-the-art technology using gratings instead of prisms. Contrary to the Dobson instruments, the Brewer also allowed measuring absolute intensities, in contrast to the Dobson instruments, which provide relative measurements of the different UV wavelength bands. Both, the Brewer and the Dobson instruments, are considered as the standard instruments for TCO monitoring on the ground by WMO in the framework of the Global Atmosphere Watch program (GAW).
The Dobson as well as the Brewer are operationally using solar irradiance measurements at four specific wavelengths in the UV band between 300 and 340 nm for the retrieval of ozone with the double ratio technique (Kerr et al., 1988) and have to be calibrated for TCO against a regional standard instrument via on-site intercomparisons (Köhler, 2002; Redondas et al., 2019). Systematic biases and seasonal dependency were observed when comparing both instruments (Kerr at al., 1988; Köhler et al., 2018; Staehelin et al., 2018; Vaníček et al., 2012; Redondas et al., 2014; Gröbner et al., 2021), displaying biases in estimating TCO with the Dobson or the Brewer. Recently, Gröbner et al. (2021) showed that these systematic biases between Brewer and Dobson can be reduced by using the temperature dependent ozone absorption cross sections from the University of Bremen (SG14; Serdyuchenko et al., 2014) calculated with the effective ozone temperature from balloon soundings. The SG14 cross section is also known as “IUP” in Gröbner et al. (2021).
In recent years, TCO was also retrieved from the earth's surface accounting for the solar spectrum between 300 and 340 nm, e.g., with the Phaeton system (Gkertsi et al., 2018), the Pandora system (Herman et al., 2017) or the BTS array spectroradiometer (Zuber et al., 2018a, b, 2021).
In this study a scanning double monochromator was used to retrieve TCO from direct solar UV spectral irradiance measurements between 305 and 345 nm at a wavelength increment of 0.25 nm. The retrieval of TCO is named here as “full spectrum” retrieval of TCO. Therefore, this retrieval includes a larger amount of spectral information in the atmospheric ozone absorption band compared with the standard four wavelengths of the Dobson and Brewer.
The main objective of this study is to introduce traceable TCO measurements from the world portable reference spectroradiometer for UV radiation QASUME (Gröbner et al., 2005) as a reference for TCO. Traceability is achieved by fully characterizing and calibrating the QASUME spectroradiometer in the laboratory with sources that are traceable to primary SI standards with an unbroken calibration chain and a comprehensive uncertainty analysis for the entire calibration chain. Since TCO cannot be measured directly, but only from ground remote sensing, a retrieval model algorithm is needed to derive TCO from the solar UV irradiance measurements. The uncertainty of the retrieval algorithm is also investigated for the various parameters of the retrieval model. We define here “model traceability” with respect to the retrieval as a standardized, reproducible and comprehensible process to derive TCO from the solar UV spectrum. Both, the uncertainty of the spectral measurements and the uncertainties of the retrieval algorithm, result in an overall uncertainty of traceable TCO observations. The sensitivity of the retrieval model is determined for various atmospheric input parameters and then optimized for robust TCO estimations. The presented method can also be considered as a reference algorithm for other instruments measuring UV spectra from calibrated direct sun irradiance as, for example, array spectroradiometers (Zuber et al., 2021).
Finally, the results of the traceable TCO measurements from QASUME are compared with long-term observations from two instruments of MeteoSwiss, a double monochromator Brewer and a Dobson spectroradiometer operated at the World Radiation Center (PMOD/WRC), in Davos, Switzerland, between 20 September 2018 and 15 November 2020. This long-term intercomparison allows validating and investigating the reproducibility of the TCO measurements from QASUME.
2.1 QASUME portable UV reference instrument
The transportable reference spectroradiometer QASUME was built for quality assurance of spectral ultraviolet measurements in Europe, as described in Gröbner et al. (2005). Since 2001, QASUME has been deployed at more than 33 stations worldwide to assure the quality of global UV irradiance measurements from other spectroradiometers such as, for example, the Brewer spectroradiometer. A thorough revised uncertainty budget for the QASUME instrument was calculated and presented in Hülsen et al. (2016). The uncertainty budget will be used for the estimation of the overall uncertainty budget of TCO in Sect. 3.1.
The QASUME instrument is a scanning double monochromator consisting of a commercially available Bentham DM-150 with a focal length of 150 mm and a grating with 2400 lines mm−1. The spectral range covers the wavelength region between 250 and 550 nm. The slit function is almost triangular with a full width at half maximum (FWHM) resolution of 0.78 nm. The entrance optic is connected by an optical fiber to the monochromator entrance slit and is mounted at the end of a collimating tube of 1000 mm length, providing a full field of view of approximately 2∘. The collimating tube with the global entrance optic is mounted on a sun tracker which follows the sun during daytime to measure direct solar irradiance. The system is embedded in a temperature-stabilized box, while the entrance optics are heated to a temperature above 28 ∘C to exclude temperature effects of the entrance optics.
For this study, direct solar UV irradiance measurements were collected with QASUME between 20 September 2018 and 15 November 2020 at the measurement platform at PMOD/WRC, Davos, Switzerland, at 1560 m a.s.l. (coordinates: 46.81∘ N, 9.83∘ E) during all seasons, but with some missing periods, when the system was in the laboratory or participated at field measurement campaigns. Spectral measurements of QASUME are traceable to the primary spectral irradiance standard of the Physikalisch Technische Bundesanstalt (PTB; Gröbner and Sperfeld, 2005) via secondary standard tungsten halogen 1 kW FEL lamps. The stability of QASUME is monitored in the field with 250 W tungsten halogen lamps on a regular schedule on the measurement platform.
The spectra were recorded regularly on an interval of 30 min and occasionally on an interval of 20 min. Since the instrument is a scanning spectroradiometer, the time interval between each wavelength increment of 0.25 nm is less than or equal to 1.5 s; therefore, the measurement of the spectrum between 305 and 345 nm requires a maximum of 4.5 min. More than 3200 spectra, valid for TCO retrieval, were recorded from morning to evening at different solar zenith angles (SZA) ranging between 23 and 76∘ (ozone air mass between 1.1 and 4.0) during 20 September 2018 and 15 November 2020. The measured spectra were used for the TCO retrieval algorithm as described in the following section.
2.2 Total ozone column retrieval algorithm
The post-processing of the calibrated solar UV irradiance spectra from QASUME was performed off-line in two steps: (a) wavelength shift correction and homogenization of the spectra with the MatSHIC software developed at PMOD/WRC; and (b) retrieving TCO with a least square fit (LSF) minimization algorithm according to Huber et al. (1995).
The post-processing chain described here displays an algorithm routine, which ensures consistent and comparable TCO measurements derived from spectral solar measurements.
2.2.1 MatSHIC algorithm
The MatSHIC algorithm is based on the concepts of the SHICrivm algorithm developed by Slaper et al. (1995) and implemented in Matlab. The algorithm convolves a high spectral resolution solar spectrum (ETS) with the slit function of QASUME and determines the spectral shift for each wavelength of the measured spectrum until the best agreement to the convolved ETS is found. The so detected wavelength shift is then applied to each wavelength of the measured spectrum to provide consistency to this reference solar spectrum. In a second step, the algorithm adjusts the high-resolution ETS to the wavelength-corrected measurements. Since the ETS is a high-resolution spectrum with 0.01 nm wavelength steps and around 0.05 nm FWHM slit function, the resulting spectrum can be homogenized by convolution with a triangular slit function to a selectable wavelength increment and slit function, equal to or larger than the wavelength increment and slit function of the ETS. For this study, the resulting spectra were homogenized to 0.01 nm wavelength increment and convolved to 0.5 nm full width half maximum with a triangular slit function. These selected specifications have been shown to be the best homogenization settings for the TCO retrieval in terms of overall uncertainty.
2.2.2 Total ozone column retrieval algorithm from full solar UV irradiance spectrum
For the full solar UV irradiance spectrum TCO retrieval, the LSF algorithm presented by Huber et al. (1995) and applied by Vaskuri et al. (2018), and further described in Zuber et al. (2021), is refined and optimized here for traceable TCO measurements with QASUME.
The LSF algorithm uses a spectral non-linear least square fitting procedure in the main UV ozone absorption wavelength range between 305 and 345 nm and implements an atmospheric model based on the Beer–Lambert law:
Iλ denotes the measured spectral irradiance from QASUME and homogenized by MatSHIC at the wavelength λ. I0 indicates the ETS at the top of the atmosphere. For the standard retrieval presented here, the new composite hybrid solar reference spectrum TSIS (Coddington et al., 2021) is used for I0. m is the air mass from the surface of earth to the top of the atmosphere.
The atmospheric model accounts for the effect of ozone absorption at each wavelength and furthermore the attenuation by the atmosphere including aerosols, Rayleigh scattering and sulfur dioxide (SO2). The resulting attenuated modeled solar spectrum using Eq. (2) is then compared with the measured solar spectrum on the earth's surface. The LSF algorithm minimizes the spectral residuals between the modeled and measured solar spectrum and returns the corresponding model parameters. Figure 1 shows the residuals at each wavelength for three sample solar spectra measured on 27 June 2020. The figure shows that the residuals of the fitting parameters in Eqs. (1)–(3) are, besides the high-frequency variations, almost spectrally flat with a high spectral variation between 300 and 305 nm and a slight increase at wavelengths larger than 345 nm. The spectral high-frequency variation of up to 2 % seen in Fig. 1 are residuals from the convolution of the high-resolution ETS with the QASUME slit function during the MatSHIC procedure.
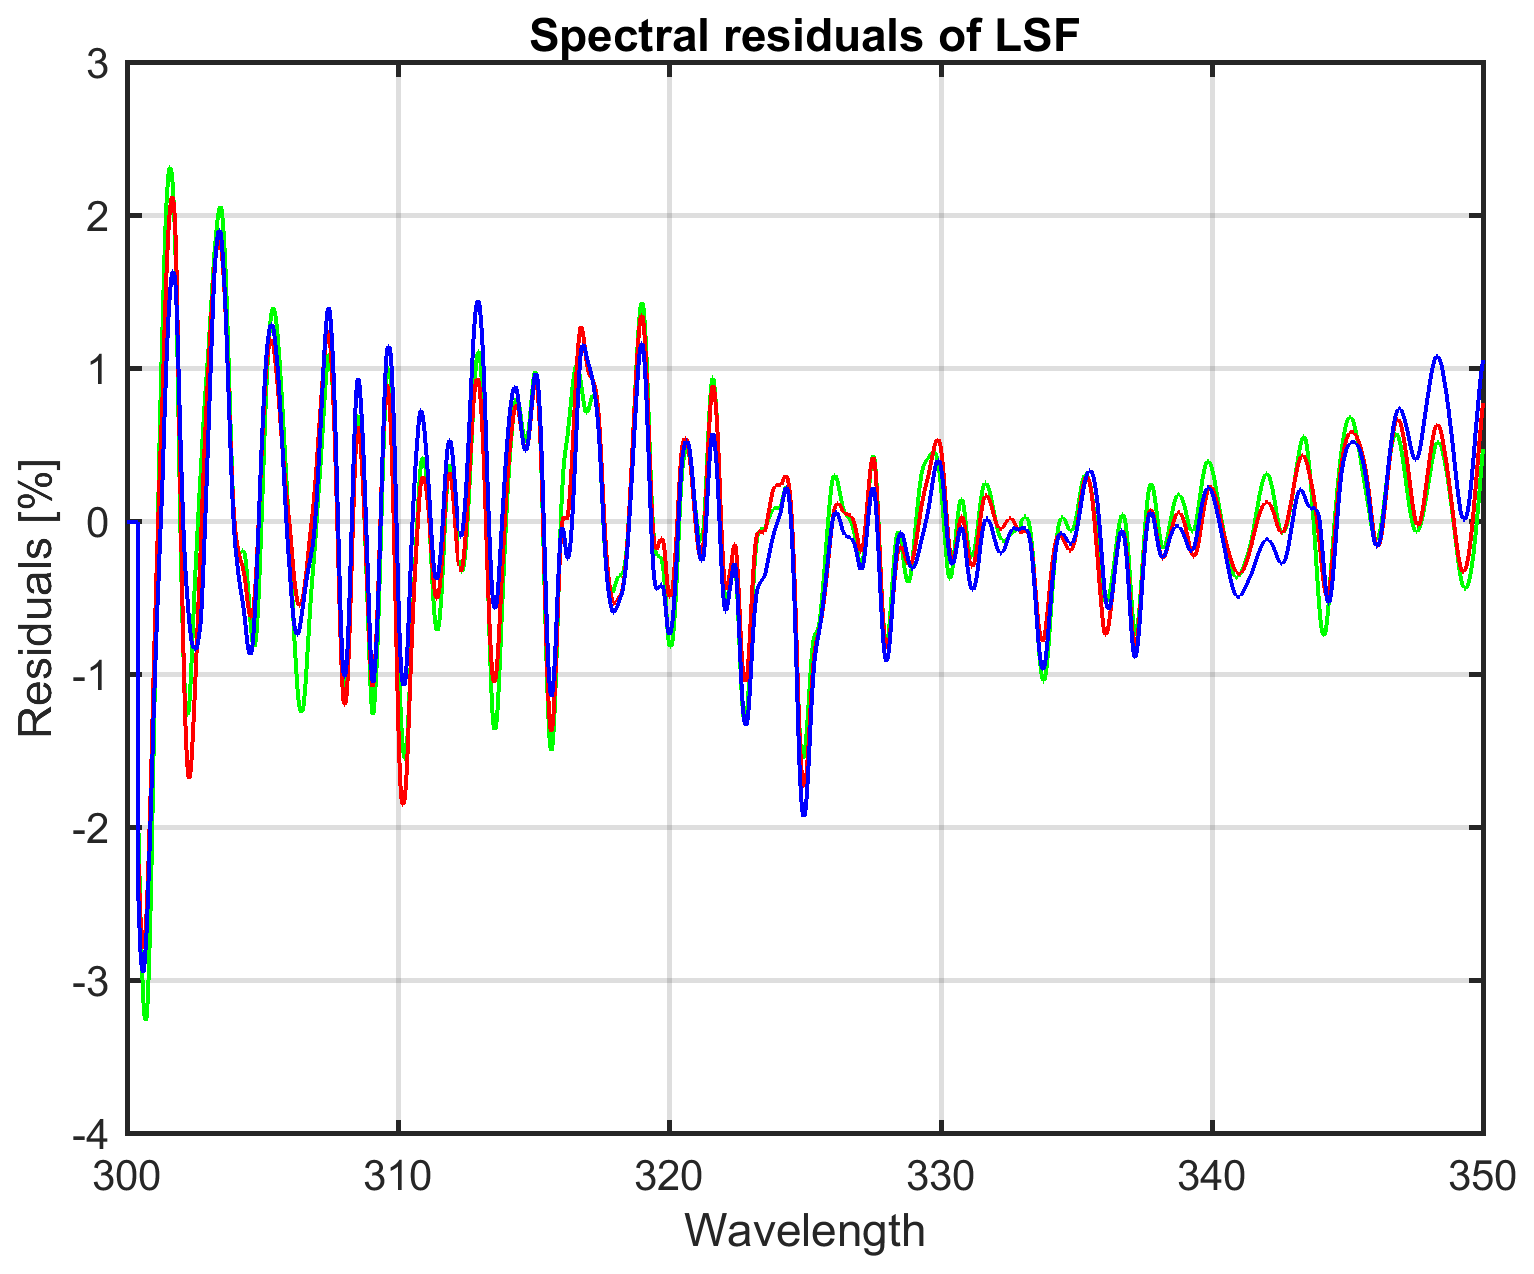
Figure 1Spectral residuals of the measured and the modeled spectra of the best fit from the LSF algorithm. The exemplary figure shows three spectra at local noon and retrieved TCO of 303 DU. The average of the residuals of the irradiance over all wavelengths is less than 0.5 %.
An important parameter of the model shown in Eq. (1) is the air mass m, denoting the path length of radiation through the atmosphere. The air mass m furthermore depends on the geographical location and time of the day and thus on the solar zenith angle during a day and over the seasons. The air mass is calculated based on the geometry between the earth, atmosphere and the sun for each time stamp and corresponding wavelength of the measured spectrum individually. The absorption through the atmosphere is summarized by the term τλ(T,p)m in Eq. (2). The term τλ(T,p)m indicates the attenuation of direct irradiance by ozone, aerosols, sulfur dioxide (SO2) and Rayleigh scattering during its path through the standard atmosphere. The air mass for the ozone , aerosol , Rayleigh and SO2 is calculated from the standard U.S. atmosphere profile for mid-latitudes afglus (NOAA, 1976) and Eq. (1) can be written in more detail as Eq. (2):
For the ozone attenuation term the SG14 ozone absorption cross section (Serduychenko et al., 2014) for different effective ozone temperatures (T) parameterized with a quadratic polynomial fit is applied for the standard retrieval algorithm. This cross section has been selected by the WMO as the new reference ozone absorption cross sections for the Brewer and Dobson (Matthew Tully, personal communication, 2018 in Gröbner et al., 2021) and the best consistency between Brewer and Dobson is found for the SG14 cross section (Redondas et al., 2014; Gröbner et al., 2021). However, the effect of other available ozone absorption cross sections will be analyzed and discussed in Sect. 3 addressing the overall uncertainty budget. The dependency of the ozone absorption cross sections on temperature implies that the effective ozone temperature is required as input for the TCO retrieval algorithm. In analogy to Gröbner et al. (2021), the effective ozone temperature measurements from balloon sounding at the nearest sounding station in Payerne, Switzerland, is taken as input for the retrieval algorithm. As in Gröbner et al. (2021), days without ozone-sonde launches were calculated from linearly interpolating the effective ozone temperature between successive measurements. To reduce the day-to-day noise, the interpolated dataset was smoothed with a 10 d running mean.
The term in Eq. (2) denotes the attenuation by aerosol optical depth. The wavelength dependence of the aerosol optical depth (AOD) for is defined with a linear parametrization normalized to 340 nm as follows:
where α and β are the other two free parameters besides TCO for the LSF retrieval. The linear dependence of AOD with wavelength is also assumed in the double ratio technique for the Brewer retrieval (Kerr et al., 1985). Note that AOD calculated by the Angstrom law result in similar TCO as when using Eq. (3).
The third term in Eq. (2), , accounts for the effect of Rayleigh scattering in the atmosphere. The scattering by air molecules is parameterized according to Bodhaine et al. (1999). This parametrization uses the air surface pressure p in order to calculate the Rayleigh optical depth. Finally, the attenuation by SO2 is also considered in the overall attenuation equation (Eq. 2), even though the amount of SO2 in the atmosphere above Davos is so small that it can be negligible here (Gröbner et al., 2021). Nitrogen dioxide and other atmospheric trace gases are not considered as their absorption is negligible in this wavelength range. Finally, Recalculation TCO with other standard atmospheres than afglus revealed negligible changes in TCO in Davos.
Accounting for all four terms of attenuation in the Beer–Lambert atmospheric model, the LSF approach derives the best fit to determine TCO.
In summary, the standard full spectrum TCO retrieval with QASUME consists of the following settings:
-
MatSHIC spectrum homogenization: 0.5 nm FWHM, 0.01 nm wavelength increment
-
Wavelength range: 305–345 nm
-
Ozone absorption cross section: SG14 (Serduyschenko et al., 2014)
-
Extraterrestrial Solar Spectrum: TSIS (Coddington et al., 2021)
-
Aerosol optical depth (AOD): linear spectral function
-
Rayleigh scattering: Bodhaine (Bodhaine et al., 1999)
-
SO2: HITRAN (Hermans et al., 2019)
-
Effective ozone temperature: input parameter from balloon soundings (Gröbner et al., 2021)
-
Atmospheric model: Beer–Lambert law (Eq. 1), with U.S. standard atmosphere (NOAA, 1976).
3.1 TCO Uncertainty from measurement uncertainty
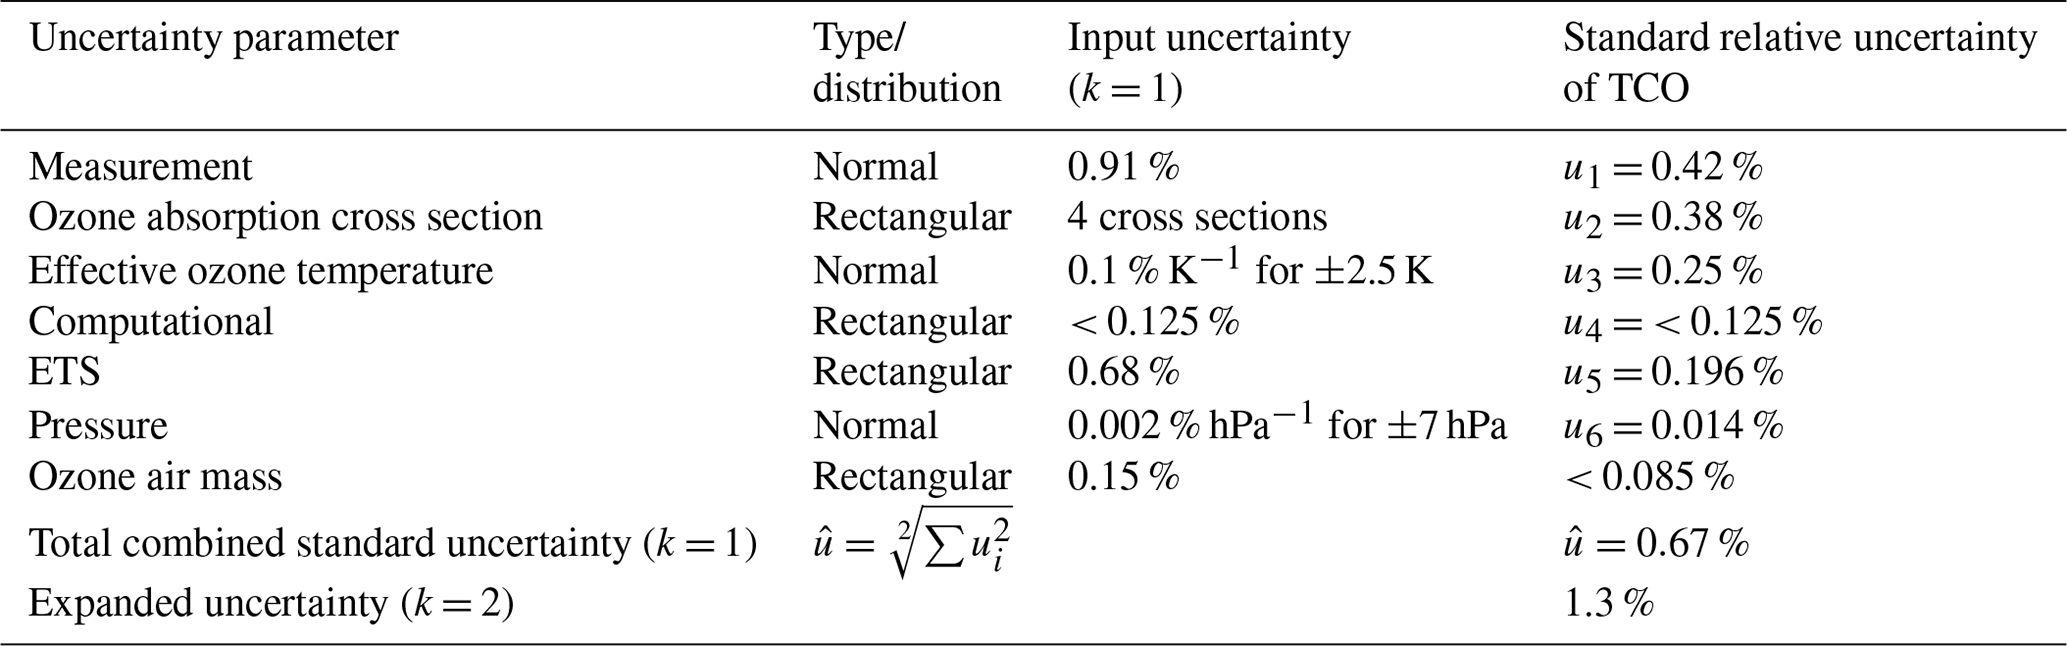
The measurement uncertainty of QASUME is reported in Hülsen et al. (2016) for global solar UV irradiance measurements and recalculated for direct solar irradiance in Gröbner et al. (2017). The different contributions for the direct solar UV irradiance measurement uncertainty are separately listed in the publication resulting in an overall relative standard uncertainty of 0.91 % (Gröbner et al., 2017; Vaskuri et al., 2018). Vaskuri et al. (2018) stated an uncertainty of 0.38 % for TOC retrievals when considering this random noise of 0.91 % from the measurements. The uncertainty assessment in Gröbner et al. (2017) does not report any spectral correlation of the uncertainty from spectral measurements. The effects of potential spectral correlations on full spectrum retrievals are investigated and discussed in Vaskuri et al. (2018) applying sinusoidal spectral correlations of different degrees. Depending on the degree of spectral correlation, the uncertainty for TCO from full spectrum originating from the measurements can result in uncertainties of TCO between 0.72 % (full correlation), 0.42 % (unfavorable correlation) and 0.38 % (no correlation) (Vaskuri et al., 2018). Effects of potential spectral correlations are included and discussed in this study in the uncertainty assessment of two different solar spectra (Sect. 3.3). Therefore, we state a conservative uncertainty contribution to TCO originating from spectral measurements from QASUME of 0.42 %, k = 1 (Table 1).
Table 1Uncertainty budget for the TCO retrieval by the LSF algorithm applied to the QASUME spectroradiometer.
Note that here and in the following sections, the standard uncertainty, k = 1, indicates that for a normal distribution the uncertainty corresponds to a coverage probability of about 68 %, while k = 2 (expanded uncertainty) corresponds to a coverage probability of approximately 95 %.
3.2 Uncertainty from ozone absorption cross section
The authors of the SG14 cross section reported an uncertainty of 1.5 % (k = 1) for the measurements. Applying this uncertainty randomly by adding Gaussian noise within 1.5 % to the cross section and retrieving TCO from the modified cross section, a variation in TCO of less than 0.2 DU or 0.06 % is observed. This low uncertainty is attributed to the convolution of the high-resolution cross section to the FWHM of 0.5 nm and the use of a large number of measurements (305–345 nm with 0.01 nm yields 4000 fitting points).
A more pragmatic method to estimate the uncertainty regarding the cross sections is the comparison of retrieved TCO with other available ozone absorption cross sections in the wavelength range between 305 and 345 nm. In order to estimate the uncertainty derived from the use of different ozone absorption cross sections, we compare TCO retrieved with the standard settings but with four other available cross sections. For comparability, the same cross sections with the same quadratic or linear parameterizations of the effective ozone temperature as in Gröbner et al. (2021) and available from the IGACO webpage (http://igaco-o3.fmi.fi/ACSO/cross_sections.html, last access: 23 March 2022) are used and summarized as follows:
-
IGQ: The Bass and Paur (Bass and Paur, 1985) ozone absorption cross sections from the IGACO webpage, with a quadratic parametrization of cross-section temperature (file bp.par).
-
DBM: Daumont et al. (1992), Brion et al. (1993) and Malicet et al. (1995) published a high-resolution dataset at five temperatures between 218 and 295 K. As in Gröbner et al. (2021) a linear parametrization of the ozone temperature is applied, due to the lack of measurements at temperatures below 218 K.
-
G17: This absorption cross sections were measured by the University of Bremen in 2017 (Gorshelev et al., 2017; Gröbner et al., 2021) during the project European Metrology Research Program ATMOZ (“Traceability of atmospheric total column ozone”). The G17 (ATMOZ) cross section was measured between 295 and 350 nm with improved noise characteristics in this wavelength region compared with the SG14 cross section from Serdyuchenko et al. (2014). However, SG14 was selected by the WMO as the new reference cross section for the Dobson and Brewer network before G17 had been measured. Here and in Gröbner et al. (2021) the quadratic polynomial temperature approximation is used.
-
ACS: Birk and Wagner (2018) measured a new cross section in the frame of the ESA project SEOM-IAS between 243 and 346 nm. The temperature range is at 193, 213, 233, 253, 273 and 293 K. As for SG14 a quadratic polynomial temperature dependence fit is applied to parametrize the temperature dependency.
Figure 2 presents the relative differences between TCO retrievals with the aforementioned specific cross sections and the resulting TCO derived with the SG14 cross section. Figure 2 shows the relative difference of over 3200 TCO data recorded between 20 September 2018 and 15 November 2020. The subfigures display the mean of the relative differences, indicated as offset, the standard deviation and the seasonal variation in terms of a sinusoidal fit. TCO derived when using the different cross sections deviate in average between −0.43 % and +0.31 % for IGQ, DBM and G17 cross sections, respectively. The results of the ACS cross section show that this new cross section produces a large offset in TCO compared with the other ozone absorption cross sections. This fact is also mentioned in Gröbner et al. (2021). When comparing this cross section with the other cross sections, an increasing spectral variability is seen at wavelengths longer than 320 nm, thus affecting the ozone retrieval of QASUME and Dobson, while the Brewer is less affected since his longest wavelength is 320 nm. Therefore, ACS is excluded from the uncertainty analysis originating from cross section.
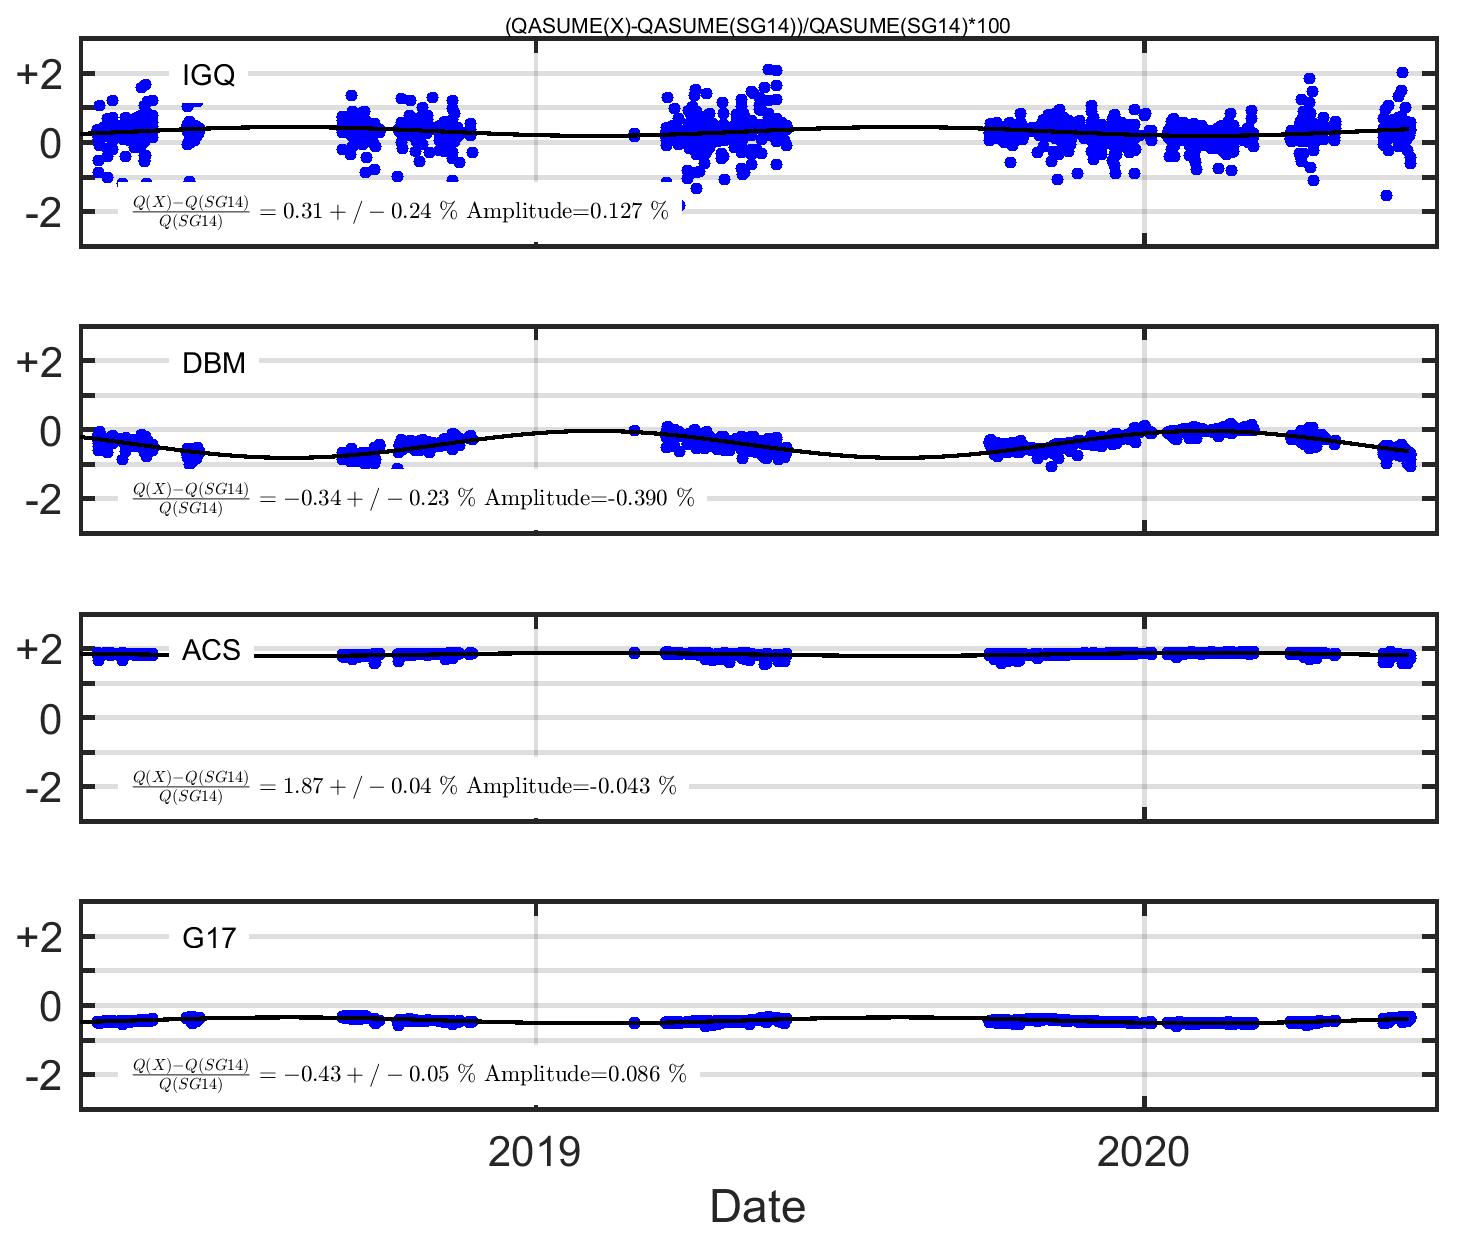
Figure 2Differences (%) of systematic offset, point to point variability (±) and seasonal variation (amplitude) of TCO retrieval of different cross sections compared with the SG14 standard cross section.
To account for the variability of each individual measurement and the offset, all relative differences from the three cross sections (IGQ, DBM and G17) are merged and the mean and standard deviation are calculated resulting in an offset of −0.15 % and a standard deviation of 0.38 %. Since the standard deviation is larger than the bias, we state and note in Table 1 a relative standard uncertainty of TCO retrieval from the cross sections of 0.38 %.
3.3 Uncertainty from top-of-the-atmosphere solar spectrum
The top-of-the-atmosphere spectrum chosen as the standard ETS, TSIS, has an uncertainty of 1.3 % at wavelengths shorter than 400 nm (Coddington et al., 2021). Applying this uncertainty as a Gaussian noise to the ETS during the TCO retrieval process, a variation of less than 0.18 DU or smaller than 0.06 % of resulting TCO is obtained (again, mainly due to the large number of points used in the retrieval).
Since the above approach does not take into account systematic spectral uncertainties, we estimated the uncertainty in TCO retrieval by using different independent solar spectra. As in the previous section, the other standard parameters are kept constant for the TCO retrieval. The second ETS that was used is called QASUMEFTS and was measured at the Izana Observatory, Tenerife, Spain, during September 2016 and fully described in Gröbner et al. (2017) and compared in Coddington et al. (2021) with the TSIS solar spectrum. The QASUMEFTS solar spectrum has an overall uncertainty of around 1 % (k = 1) for the wavelength range between 310 and 350 nm and gradually about 2.0 % (k = 1) between 300 and 310 nm as reported in Gröbner et al. (2017) and is therefore comparable to the uncertainty from TSIS with an uncertainty of 1.3 % at wavelengths shorter than 400 nm (Coddington et al., 2021).
Figure 3 presents the comparison of TCO retrievals from TSIS versus QASUMEFTS resulting in an offset of 0.68 % in retrieved TCO with a standard deviation of −0.24 %. The resulting uncertainty component is therefore 0.196 % (), assuming a rectangular uncertainty distribution with width 0.68 % (Table 1). The resulting bias of 0.68 % between TSIS and QASUMEFTS may be caused by spectral correlations of the QASUME measurements and the solar spectrum TSIS which are not explicitly known. This bias is on the order of 0.72 %, as reported in Vaskuri et al. (2018), when a full correlation of measurement uncertainties between the spectral measurement and the extraterrestrial spectrum is assumed. Here we have chosen “unfavorable” correlation for the measurement uncertainty, while potential larger spectral correlations of the measurement are therefore reflected here by the comparison of QASUMEFTS and TSIS resulting in an uncertainty of 0.196 %.
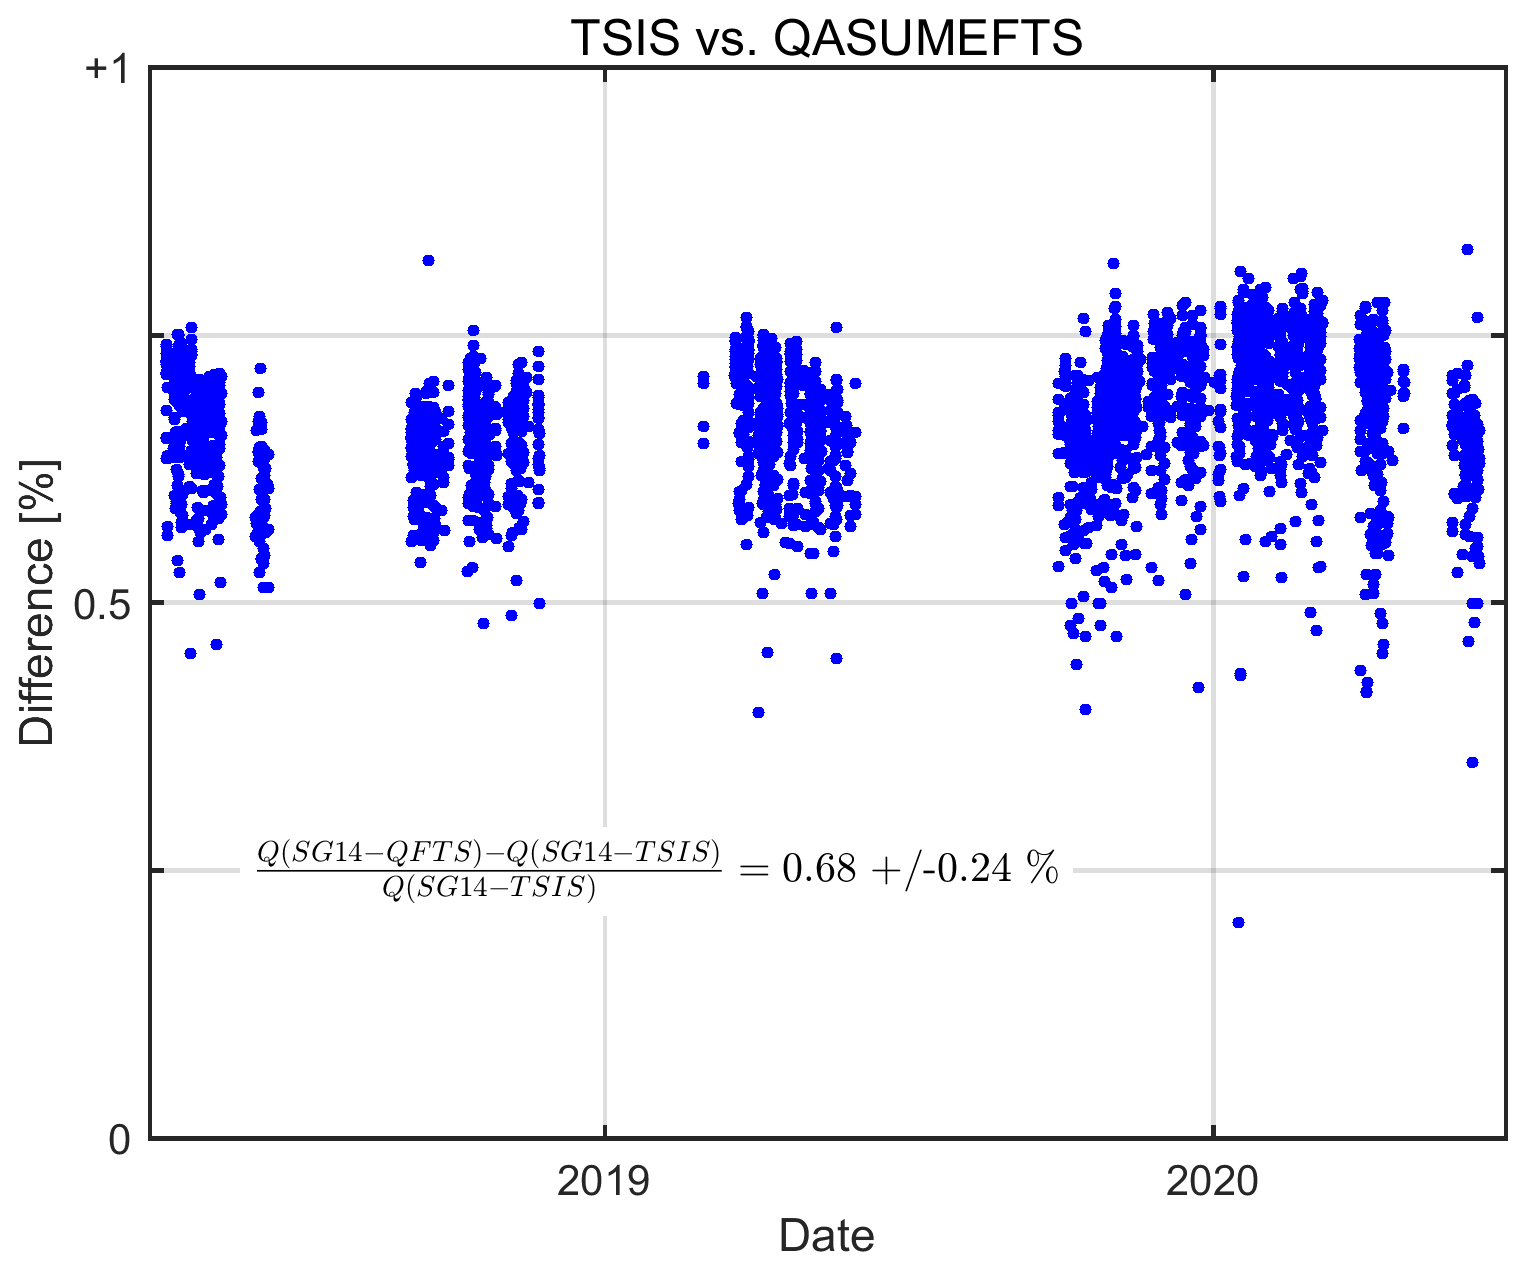
Figure 3Differences between TSIS extraterrestrial spectrum and QASUMEFTS with SG14 cross section displaying the uncertainty originating from the selection of the solar spectrum.
3.4 Uncertainty from effective ozone temperature
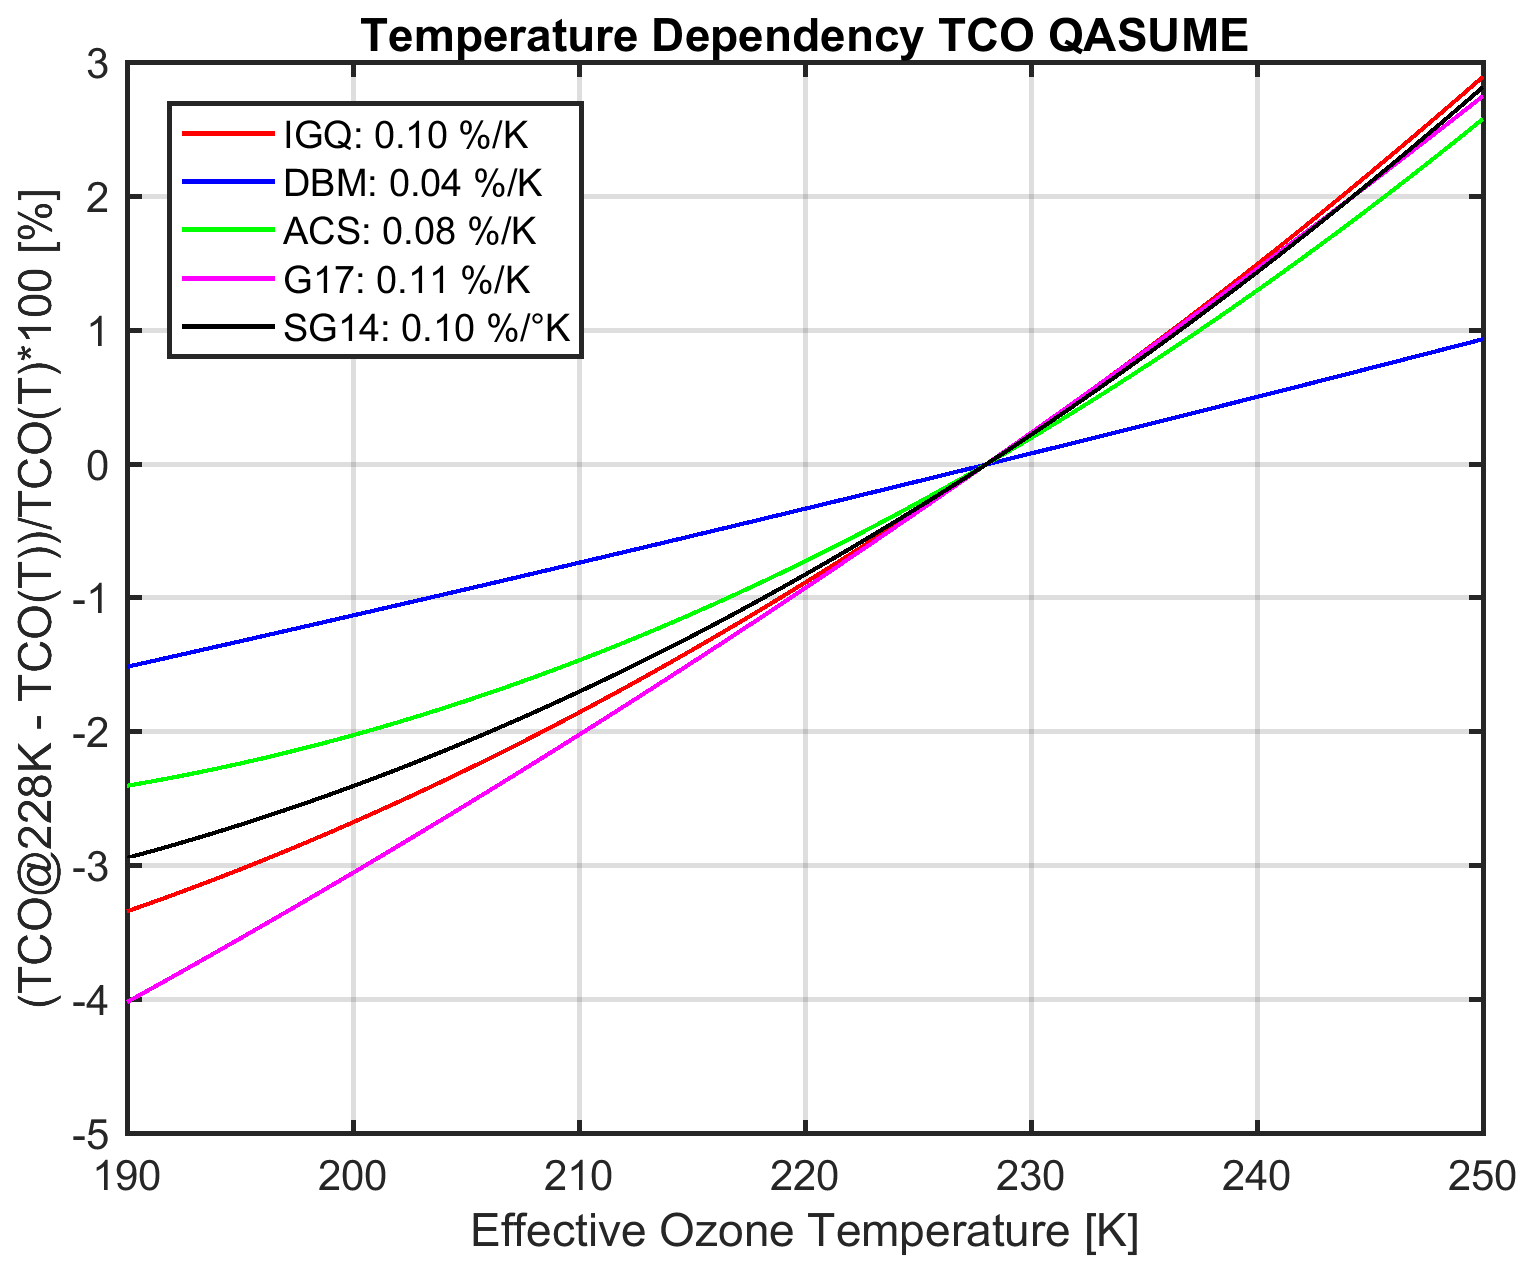
Figure 4 shows the temperature dependency of the QASUME TCO retrieval algorithm normalized to 228 K which is taken as a climatological value by the Brewer procedure. The calculated temperature dependency shows that the sensitivity of TCO is about 0.1 % K−1 for IGQ, G17 and SG14 cross sections, and about 0.08 % K−1 for ASC and only 0.04 % K−1 for DBM cross section. These values are comparable to the temperature sensitivity of the Dobson of also about 0.1 % K−1 (Gröbner et al., 2021; Redondas et al., 2014), while the Brewer has almost no temperature dependency (e.g., for the SG14 cross section).
Due to the sensitivity of TCO on effective temperature, one may assume that the temperature could be retrieved by the LSF algorithm. In this case the temperature would serve as a fitting parameter. An expanded algorithm was developed and tested. However, the retrieved effective temperature showed unreasonable variation of more than 7 K and the resulting TCO exhibited large invalid TCO for a large number of spectra. Since the effective temperature cannot be retrieved by this algorithm, the temperature needs to be included as an input parameter to the algorithm. Note that the effective temperature can be retrieved by the Brewer as proposed in Kerr (2002). However, in order to be independent of the Brewer, we have chosen the effective ozone temperature for Davos derived from balloon soundings in Payerne, Switzerland, 220 km distant from Davos. The effective temperature input for the retrieval is measured on a 2 or 3 d schedule and linearly interpolated for daily values. Note that the uncertainty of the ozone sondes and their traceability is not known. However, an estimate of the uncertainty is given as follows: Gröbner et al. (2021) stated a seasonal variability of the effective temperature of amplitude of 11.4 K and a mean value of 225.2 K between 2016 and 2020. This would result in an uncertainty of about 5.7 K if a constant effective ozone temperature of 225.2 K is used as a constant climatological value for the TCO retrieval. To reduce the uncertainty of TCO from this dependence on effective ozone temperature, we included the temperature in the retrieval instead of a fixed climatological value. Gröbner et al. (2021) also compared the effective ozone temperature from balloon soundings with ECMWF reanalysis data from (https://www.temis.nl/climate/efftemp/overpass.php, last access: 23 March 2022) with daily data and revealed a standard deviation of 2.5 K for the period between 2016 and 2020. The differences between the two datasets are not correlated with the seasons and we therefore pragmatically consider the uncertainty of observing the temperature as 2.5 K, when using either balloon soundings or ECMWF reanalysis data. Considering this sensitivity on effective temperature of 0.1 K %−1 for QASUME TCO measurements and the estimated uncertainty of measuring the effective ozone temperature, a general standard uncertainty for TCO of 0.25 % can be stated from effective ozone temperature and is included in Table 1.
3.5 Uncertainty from the air mass
The standard retrieval algorithm includes the U.S. standard atmosphere afglus with a defined ozone profile. However, balloon soundings from Payerne, Switzerland, show that the effective ozone height can change by about 3.6 km within the seasons (Gröbner et al., 2021), resulting in a change in TCO of 0.3 %. Therefore, the standard uncertainty in TCO for this parameter is estimated at 0.086 % (see Table 1).
3.6 Uncertainty from atmospheric pressure
The sensitivity of retrieved TCO on pressure changes is about 0.2 % when pressure changes of 100 hPa are included in the TCO retrieval algorithm. On average, the pressure in Davos was around 840 hPa and varied between ±7 hPa during the period of comparison, which results in a variation in TCO of 0.014 %. Due to this small sensitivity of TCO on air pressure and to simplify the standard algorithm, a constant air pressure of 840 hPa was used as an input parameter for the algorithm. The resulting variation in TCO is here considered as a TCO uncertainty of 0.014 % from Rayleigh scattering parametrization with variable ground air pressure (Table 1). For locations with higher variations in air pressure, the measured pressure can be taken as the input for the algorithm, if necessary.
3.7 Uncertainty from least square fit algorithm (computational)
As a criterion for valid TCO retrieval, residuals of the Jacobian matrix from the in-built Matlab function “lsqnonlin” are calculated indicating the 95 % confidence interval of the retrieved TCO. If the value is less than 0.7 DU (or about 0.23 % at 300 DU), the retrieval is considered as valid. If the value exceeds 0.7 DU, the measurement could have been disturbed by moving clouds, overcast sky or other atmospheric effects. The criterion of 0.7 DU indicates that TCO varies by less than 0.25 % (at 300 DU). Therefore, we define the relative standard uncertainty of the least square fit retrieval model as 0.25 % 2 = 0.125 % (Table 1).
3.8 Overall uncertainty
In Sect. 3.1 to 3.7 the individual uncertainty components relevant for the TOC retrieval from solar UV irradiance measurements are described and calculated. The summary and the combined uncertainty are listed in Table 1. In order to estimate the combined uncertainty two methods are chosen.
3.8.1 Arithmetic calculation of overall uncertainty
Assuming no correlation of the individual uncertainty components as listed in Table 1, the combined standard uncertainty can be calculated by the square root of the sum of the squares of the individual uncertainties, according to the guide to the expression of uncertainty in measurement (GUM, ISO, 2009):
Equation (4) results in a combined uncertainty of 0.67 % when including all uncertainty contributions (Table 1).
3.8.2 Monte Carlo simulation
Since TCO is derived by an atmospheric model as described in Sect. 2.2, the combined uncertainty of the model and the corresponding input parameters can also be determined by a Monte Carlo simulation (Vaskuri et al., 2018). Monte Carlo simulation means that all the input parameters of the model, such as measurement, cross sections, effective ozone temperature, solar spectrum, pressure and air mass are varied within their specific uncertainties using the specific type of distribution as listed in Table 1. Each variation displays a realization of possible TCO retrievals. Specifically, the TCO time series between 20 September 2018 and 15 November 2020 is recalculated for each of the 3200 individual measurements by a random variation in the different retrieval model parameters. Each data point of the entire time series is recalculated 10 times to obtain a total number of randomly varied realizations of more than 32 000.
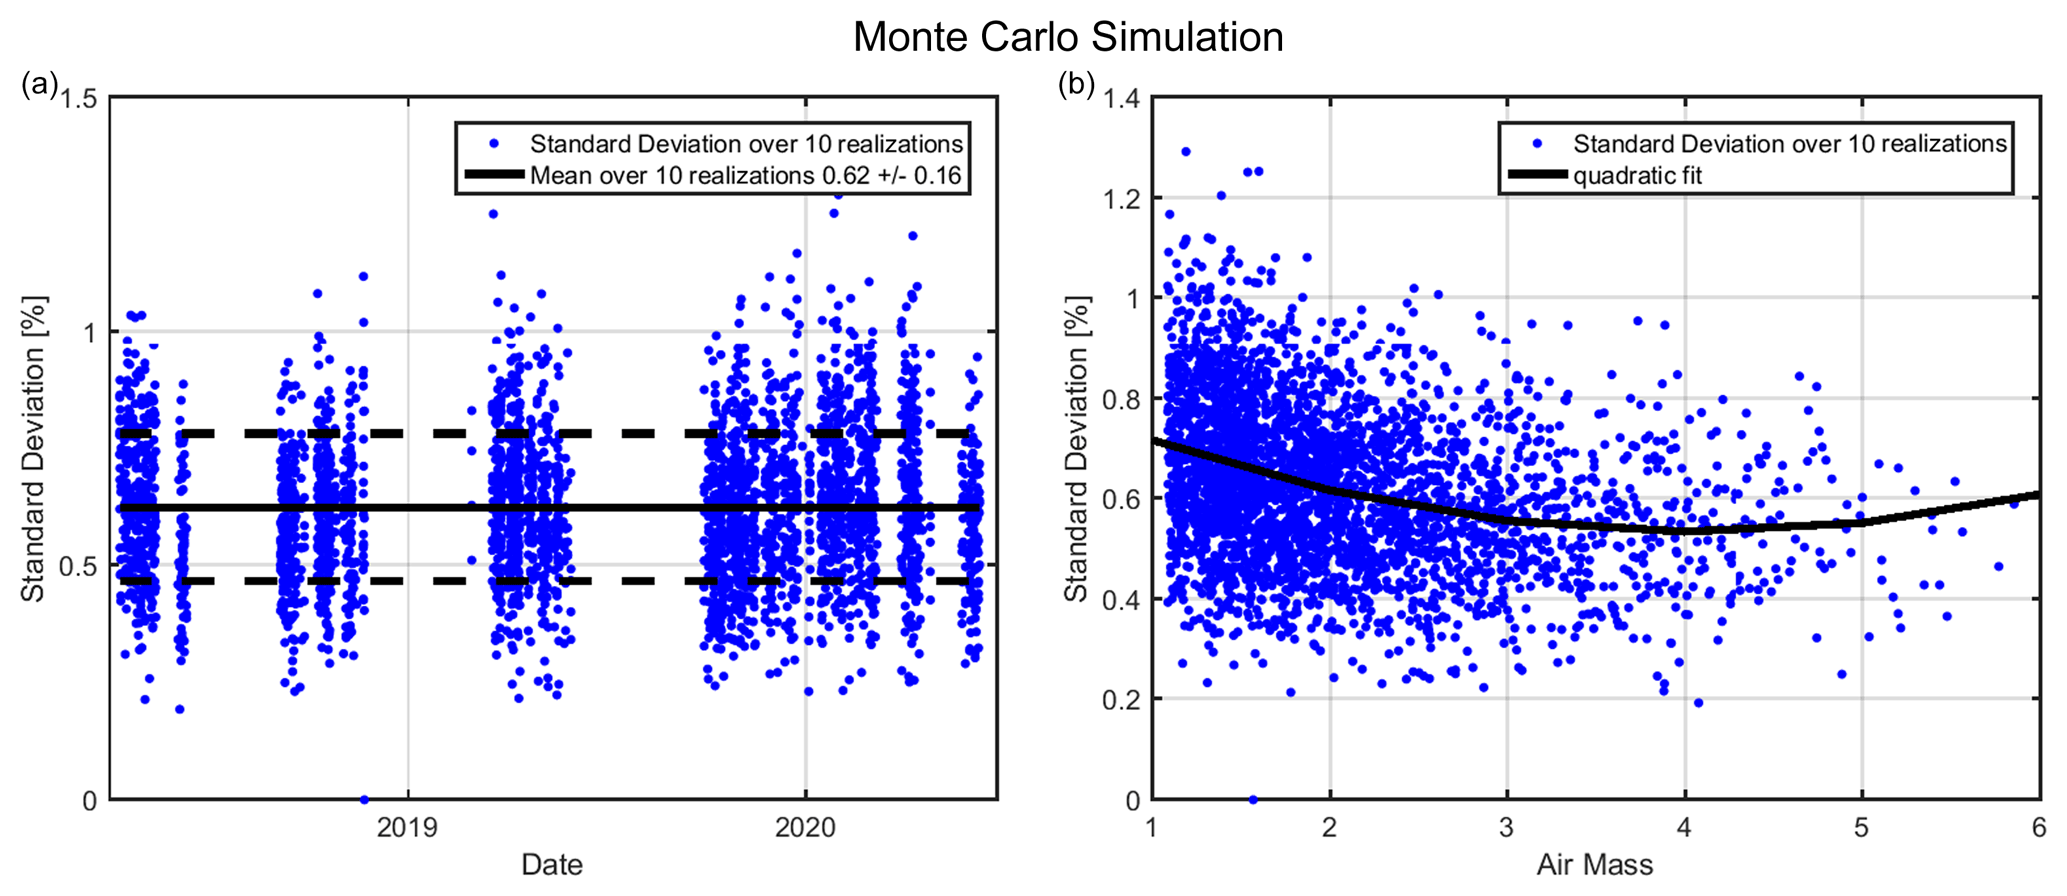
Figure 5Results of the 32 000 realizations of TCO from the Monte Carlo simulation. Panel (a) shows the standard deviation of 10 realizations for each measurement point and (b) indicates the dependency on air mass.
Figure 5a presents the standard deviation over 10 realizations for a single measurement (blue points). The black line indicates the mean standard deviation of all 3200 measurements of 0.62 ± 0.16 % (dashed black lines). Since the standard deviation may be dependent on solar zenith angle and the corresponding air mass change, the standard deviation of each measurement is displayed as a function or air mass (Fig. 5b). The cubic fit highlights that there is a negligible dependence of the standard deviation with air mass of 0.16 %, which is slightly larger at lower air masses. Figure 6 presents the frequency distribution of the differences between TCO from the standard algorithm and TCO from all varied input parameters resulting in 10 × 3200 = 32 000 realizations. The mean of the distribution of this large number of realizations is around 0.33 % with a standard deviation of 0.80 %. The bias of 0.33 % (= approx. 0.68 % 2) originates from the differences between the two selected ETS's (Fig. 3), which differ by 0.68 % (see Sect. 3.3).
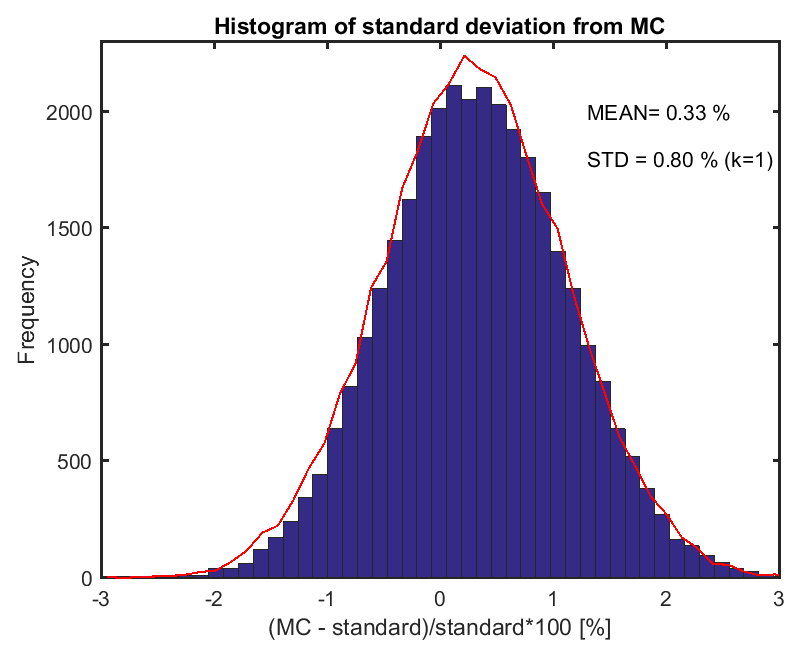
Figure 6Histogram of all realizations from the Monte Carlo (MC) simulation indicating an overall uncertainty of 0.8 % (standard deviation of differences) of traceable TCO measurements with QASUME. The red line indicates a randomly generated Gaussian distribution.
Combining the two statistical analyses of the Monte Carlo simulation (Figs. 5 and 6), we achieve an average standard deviation of 0.71 %. The standard deviation indicates the standard uncertainty of 0.8 % retrieved from Monte Carlo simulations. This estimation is in good agreement with the previous uncertainty estimation using uncorrelated quantities of 0.67 %. The similarity of the uncorrelated and the Monte Carlo derived uncertainties indicates that the individual uncertainties are weakly correlated. However, they slightly depend on the air mass. Therefore, a standard relative uncertainty of 0.8 % or expanded uncertainty of 1.6 % can be used as a maximum value for TCO retrievals from solar UV irradiance measurements, based on the two independent uncertainty estimations presented here.
Comparison with Dobson and Brewer: Gröbner et al. (2021) presented a long-term comparison between automated Dobson (Stübi et al., 2021) and Brewer from the Lichtklimatologische Observatorium Arosa (LKO) and PMOD/WRC Davos TCO time series. The comparison accounted for the same ozone absorption cross sections as used in our study, the physical characteristics of the instruments (e.g., measured slit functions) and the effective ozone temperature from balloon soundings. The comparison revealed that the best agreement can be found when using the SG14 ozone absorption cross section (Serdyuchenko et al., 2014; Gröbner et al., 2021) and showed that the comparison of TCO from Brewer and Dobson with other ozone absorption cross sections, however, revealed variation of up to 5 % between these two instruments. The comparison included, however, only two instrument types. With QASUME we have introduced a third independent type of instrument for measuring TCO.
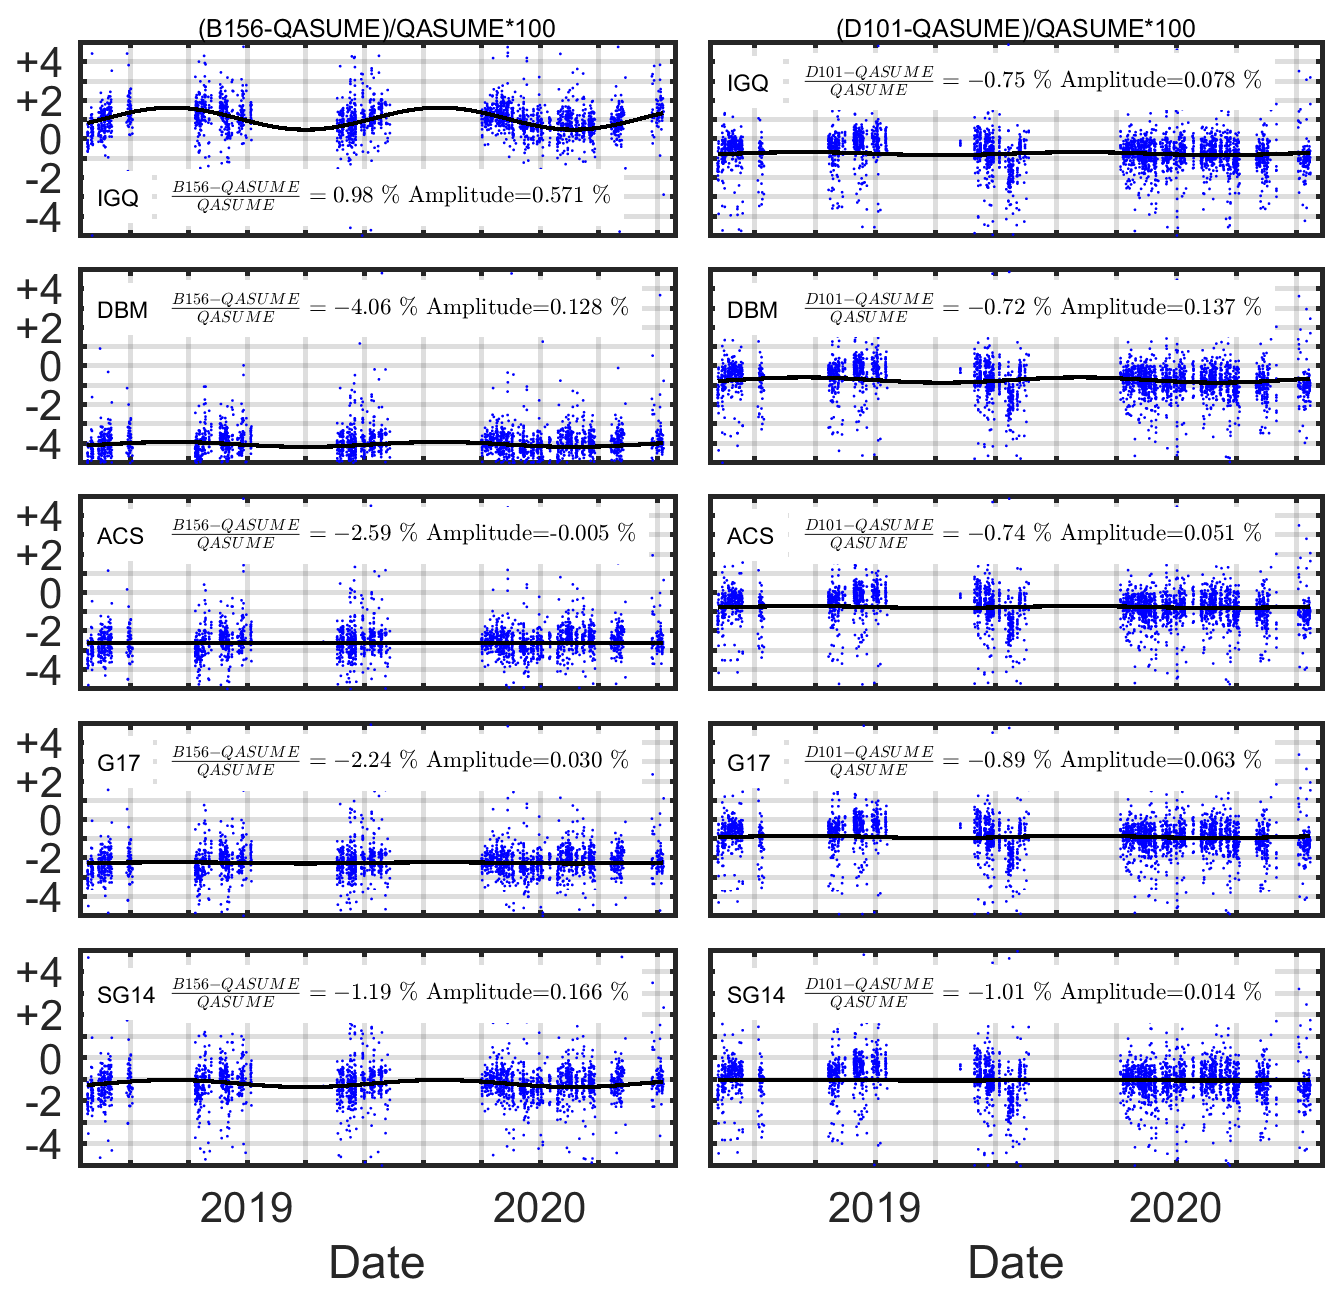
Figure 7Comparison of TCO from Brewer 156 (left panels) and Dobson 101 (right panels) with TCO from traceable QASUME TCO retrieval for five different cross sections.
In analogy to Gröbner et al. (2021), Fig. 7 presents the comparisons of the Brewer 156 double monochromator and Dobson 101 with QASUME TCO for five different cross sections. The results show that averaged relative differences in TCO range between −4.06 % (DBM) and 0.98 % (IGQ), when comparing QASUME with the Brewer 156. These large differences of up to 5 % between the use of different ozone absorption cross sections is consistent with the findings reported by Gröbner et al. (2021) for the comparison between Brewer and Dobson.
On the other hand, the comparison between Dobson and QASUME ranges between −1.01 % (SG14) and −0.72 % (DBM), which is significantly smaller than the variation seen between Brewer and QASUME. The variability of 5.04 % for the Brewer–QASUME comparison and the much lower variability of 0.29 % for the Dobson–QASUME comparison indicate that the TCO retrieval by Dobson and QASUME have a similar response to the cross sections studied here. The Brewer is more sensitive to some of the ozone absorption cross sections (e.g., DBM, ACS and G17) than on IGQ and SG14. It remains speculative if the sensitivity originates from the instrument characteristics or the cross section at the specific wavelength, or both. We only can conclude that the response on the cross sections is similar for the Dobson and for QASUME.
Additionally, Fig. 8 presents the dependency of the differences in TCO retrieved with the SG14 cross section with respect to the ozone slant path column, which is defined as the multiplication of air mass and TCO. While Brewer and QASUME show the same slant path dependency, the comparison between QASUME and Dobson shows a slight roll-off at larger slant path, with the Dobson measuring lower TCO values. This is probably caused by spectral stray light contamination in the Dobson monochromator, as reported in Komhyr et al. (1989). Similar slant path dependencies for the Brewer and the Dobson are found also when retrieving TCO with other cross sections indicating that the slant path dependency is less sensitive on the selected cross section than the offset of the averaged differences.
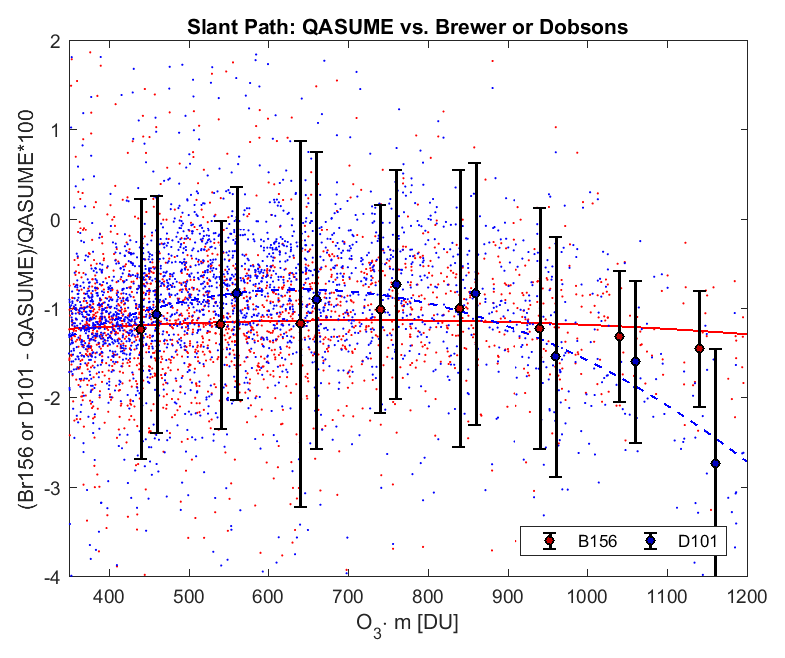
Figure 8Differences of Brewer 156 and Dobson 101 retrieved with SG14 cross section compared with QASUME TCO depending on the ozone slant path. The comparison with Brewer shows negligible stray-light effects.
As concluded by Gröbner et al. (2021), the SG14 cross section shows the best consistency between Brewer and Dobson of less than 0.21 %. However, Fig. 7 shows that QASUME overestimates TCO by about 1 % (Dobson) and 1.2 % (Brewer), which is 1 % and 0.8 % larger than the comparison between Dobson and Brewer, respectively. We clearly see that the independent instrument and retrieval procedure, which is a distinctly different retrieval approach compared with the double ratio technique for Brewer and Dobson, agree with the ground based TCO retrieval from the established instruments to within 1 % as shown in Fig. 7. The observed offset of 1 % in the TCO retrieved by QASUME with respect to the Brewer (using SG14 cross section for both) is also confirmed by preliminary comparisons performed at the Observatory in Izãna, Tenerife, Spain, in September 2016 and in El Arenosillo in June 2019 in southern Spain. The final approved results are foreseen to be published in a WMO report. One may assume that ground based TCO observations may result in the same values independent of the instrument and retrieval algorithm if the effect of the different cross sections is negligible as seen for the Dobson (Fig. 7). We have undertaken many efforts to detect the potential source (e.g., Angstrom parametrization instead of linear parametrization) of this bias, but we could not explain the observed bias of 1 %.
However, the offset of 1 % between the TCO from QASUME relative to Brewer and Dobson is well within the uncertainties of the TCO retrieval of 1.6 % (expanded uncertainty, with 95 % coverage interval) of QASUME. If the uncertainties of the Dobson and Brewer TCO retrieval are assumed to be 1 %, then the combined uncertainty of 1.9 % clearly demonstrates the consistency of the three instruments to within their uncertainties.
We have introduced traceable TCO ground based retrievals from direct solar spectral UV irradiance measurements in the wavelength range between 305 and 345 nm. The QASUME spectroradiometer used for this study is calibrated in the laboratory based on an unbroken traceability chain to SI and the TCO retrieval algorithm is standardized. The combined standard uncertainty of 0.8 % is quantified by the uncertainties from the radiometric quantities, the instrument characteristics and the various uncertainties of the retrieval model. The expanded relative uncertainty is 1.6 % (k = 2, representative for a coverage interval of 95 %). The Monte Carlo simulation of the uncertainties revealed that the parameters affecting the uncertainty are weakly correlated and the combined uncertainty can therefore be calculated by the square root of the sum of the squares of the individual uncertainty parameters according to GUM (ISO, 2009).
The calibration and stability of QASUME is regularly verified in the field and in the laboratory using proven radiometric calibration techniques (Hülsen et al., 2016), thereby allowing a TCO retrieval with known uncertainties without requiring recalibrations with respect to other reference instruments, as is the case for the Brewer and Dobson networks.
The Arosa/Davos time series consist of a triad of Dobson and a triad of Brewer (Staehelin et al., 2018). This triad of two instrument types is now complemented with an instrument traceable to the SI providing independent traceable TCO values from a distinctly different TCO retrieval algorithm with well-established uncertainties. When using the SG14 ozone absorption cross sections, QASUME agrees with Brewer and Dobson within 1 % in a long-term comparison in Davos, which is within their combined uncertainties. Further studies are necessary to validate the TCO retrieval using this method at other locations worldwide with different atmospheric compositions such as higher aerosol loads and different effective ozone temperatures.
The MatSHIC and TCO retrieval algorithm are available from the main author (Luca Egli) on request.
The data is available from the main author (Luca Egli) on request.
LE and JG developed the QASUME retrieval algorithm, analyzed the data and wrote the paper. GH operated QASUME at PMOD/WRC. HS and RS were responsible for the Brewer and Dobson measurements used in this study.
The contact author has declared that neither they nor their co-authors have any competing interests.
Publisher's note: Copernicus Publications remains neutral with regard to jurisdictional claims in published maps and institutional affiliations.
We thank the two anonymous reviewers and the editor Mark Weber for their helpful comments, which substantially improved this publication.
This research has been supported by the ESA (project QA4EO, grant no. QA4EO/SER/SUB/09) and by GAW-CH MeteoSwiss (project INFO3RS, grant no. 123001926).
This paper was edited by Mark Weber and reviewed by two anonymous referees.
Bais, A. F., McKenzie, R. L., Bernhard, G., Aucamp, P. J., Ilyas, M., Madronich, S., and Tourpali, K.: Ozone depletion and climate change: impacts on UV radiation, Photoch. Photobio. Sci., 14, 19–52, https://doi.org/10.1039/C4PP90032D, 2015.
Bais, A. F., Bernhard, G., McKenzie, R. L., Aucamp, P. J., Young, P. J., Ilyas, M., Jöckel, P., and Deushi, M.: Ozone–climate interactions and effects on solar ultraviolet radiation, Photoch. Photobio. Sci., 18, 602–640, https://doi.org/10.1039/C8PP90059K, 2019.
Basher, R. E.: Review of the Dobson Spectrophotometer and its Accuracy, in: Atmospheric Ozone, edited by: Zerefos, C. S. and Ghazi, A., Springer, Dordrecht, https://doi.org/10.1007/978-94-009-5313-0_78, 1985.
Bass, A. M. and Paur, R. J.: The ultraviolet cross-sections of ozone, I – The measurements, II – Results and temperature dependence, in: Atmospheric Ozone, edited by: Zerefos, C. S. and Ghazi, A., Springer, Dordrecht, the Netherlands, 606–616, https://doi.org/10.1007/978-94-009-5313-0_120, 1985.
Birk, M. and Wagner, G.: ESA SEOM-IAS – Measurement and ACS database O3 UV region, Version I, Zenodo [data set], https://doi.org/10.5281/zenodo.1485588, 2018.
Bodhaine, B. A., Wood, N. B., Dutton, E. G., and Slusser, J. S.: On Rayleigh Optical Depth Calculations, J. Atmos. Ocean. Tech., 16, 1854–1861, 1999.
Brion, J., Chakir, A., Daumont, D., Malicet, J., and Parisse, C.: High-resolution laboratory absorption cross section of O3, Temperature effect, Chem. Phys. Lett., 213, 610–612, 1993.
Coddington, O. M., Richard, E. C., Harber, D., Pilewskie, P., Woods, T. N., Chance, K., Liu, X., and Sun, K.: The TSIS-1 Hybrid Solar Reference Spectrum, Geophys. Res. Lett., 48, e2020GL091709, https://doi.org/10.1029/2020GL091709, 2021.
Daumont, D., Brion, J., Charbonnier, J., and Malicet, J.: Ozone UV spectroscopy I: Absorption cross-sections at room temperature, J. Atmos. Chem., 15, 145–155, 1992.
Dobson, G. M. B.: A photoelectric spectrophotometer for measuring the amount of atmospheric ozone, P. Phys. Soc., 43, 324–339, https://doi.org/10.1088/0959-5309/43/3/308, 1931.
Dobson, G. M. B.: Forty years research on atmospheric ozone at Oxford – a history, Appl. Optics, 7, 387–405, 1968.
Gkertsi, F., Bais, F. A., Kouremeti, N., Drosoglou, T., Fountoulakis, I., and Fragkos, K.: DOAS-based total column ozone retrieval from Phaethon system, Atmos. Environ., 180, 51–58, https://doi.org/10.1016/j.atmosenv.2018.02.036, 2018.
Gorshelev, V., Weber, M., and Burrows, J. P.: ATMOZ Gorshelev Huggins Ozone Band Absorption Cross-Section (1.0), Zenodo [data set], https://doi.org/10.5281/zenodo.5847189, 2017.
Gröbner, J. and Sperfeld, P.: Direct traceability of the portable QASUME irradiance scale to the primary irradiance standard of the PTB, Metrologia, 42, 134, https://doi.org/10.1088/0026-1394/42/2/008, 2005.
Gröbner, J., Schreder, J., Kazadzis, S., Bais, A. F., Blumthaler, M., Görts, P., Tax, R., Koskela, T., Seckmeyer, G., Webb, A. R., and Rembges, D.: Traveling reference spectroradiometer for routine quality assurance of spectral solar ultraviolet irradiance measurements, Appl. Optics, 44, 5321–5331, 2005.
Gröbner, J., Kröger, I., Egli, L., Hülsen, G., Riechelmann, S., and Sperfeld, P.: The high-resolution extraterrestrial solar spectrum (QASUMEFTS) determined from ground-based solar irradiance measurements, Atmos. Meas. Tech., 10, 3375–3383, https://doi.org/10.5194/amt-10-3375-2017, 2017.
Gröbner, J., Schill, H., Egli, L., and Stübi, R.: Consistency of total column ozone measurements between the Brewer and Dobson spectroradiometers of the LKO Arosa and PMOD/WRC Davos, Atmos. Meas. Tech., 14, 3319–3331, https://doi.org/10.5194/amt-14-3319-2021, 2021.
Herman, J., Evans, R., Cede, A., Abuhassan, N., Petropavlovskikh, I., McConville, G., Miyagawa, K., and Noirot, B.: Ozone comparison between Pandora #34, Dobson #061, OMI, and OMPS in Boulder, Colorado, for the period December 2013–December 2016, Atmos. Meas. Tech., 10, 3539–3545, https://doi.org/10.5194/amt-10-3539-2017, 2017.
Hermans, C., Vandaele, A. C., and Fally, S.: Fourier Transform measurements of SO2 absorption cross sections: I. Temperature dependence in the 24 000–29 000 cm−1 (345–420 nm) region, J. Quant. Spectrosc. Ra., 110, 756–765, 2019.
Huber, M., Blumthaler, M., Ambach, W., and Staehelin, J.: Total atmospheric ozone determined from spectral measurements of direct solar UV irradiance, Geophys. Res. Lett., 22, 53–56, https://doi.org/10.1029/94gl02836, 1995.
Hülsen, G., Gröbner, J., Nevas, S., Sperfeld, P., Egli, L., Porrovecchio, G., and Smid, M.: Traceability of solar UV measurements using the QASUME reference spectroradiometer, Appl. Optics, 55, 7265–7275, 2016.
ISO: ISO/IEC Guide 98-1:2009: Guide to the expression of uncertainty in measurement (GUM), https://www.iso.org/standard/46383.html (last access: 23 March 2022), 2009.
Kerr, J. B.: New methodology for deriving total ozone and other atmospheric variables from Brewer spectrophotometer direct sun spectra, J. Geophys. Res., 107, 4731, https://doi.org/10.1029/2001JD001227, 2002.
Kerr, J. B., McElroy, C. T., and Olafson, R. A.: Measurements of total ozone with the Brewer spectrophotometer, Proc. Quad. Ozone Symp., 4–9 August 1980, Boulder, CO, USA, edited by: London, J., Natl. Cent. for Atmos. Res., 74–79, 1981.
Kerr, J. B., McElroy, C. T., Wardle, D. I., Olafson, R. A., and Evans, W. F. J.: The automated Brewer Spectrophotometer, Proceed. Quadr. Ozone Symp., 3–7 September 1984, Halkidiki, Greece, edited by: Zerefos, C. S. and Ghazi, A., D. Reidel, Norwell, Mass., USA, 396–401, 1985.
Kerr, J. B., Asbridge, I. A., and Evans, W. F. J.: Intercomparison of total ozone measured by the Brewer and Dobson Spectrophotometers at Toronto, J. Geophys. Res., 93, 11129–11140, 1988.
Köhler, U.: Europäisches Dobson Kalibrierzentrum Hohenpeißenberg garantiert hohe Datenqualität, Ozonbulletin des Deutschen Wetterdienstes Nr. 87, Meteorologisches Observatorium, Hohenpeißenberg, Germany, 2002.
Köhler, U., Nevas, S., McConville, G., Evans, R., Smid, M., Stanek, M., Redondas, A., and Schönenborn, F.: Optical characterisation of three reference Dobsons in the ATMOZ Project – verification of G. M. B. Dobson's original specifications, Atmos. Meas. Tech., 11, 1989–1999, https://doi.org/10.5194/amt-11-1989-2018, 2018.
Komhyr, W. D., Grass, R. D., and Leonard, R. K.: Dobson Spectrophotometer 83: A Standard for Total Ozone Measurements, 1962–1987, J. Geophys. Res., 94, 9847–9861, 1989.
Malicet, J., Daumont, D., Charbonnier, J., Parisse, C., Chakir, A., and Brion, J.: Ozone UV spectroscopy, II. Absorption crosssections and temperature dependence, J. Atmos. Chem., 21, 263–273, 1995.
Molina, M. J. and Rowland, F. S.: Stratospheric sink for chlorofluoromethanes-Chlorine atom catalyzed destruction of ozone, Nature, 249, 810–812, 1974.
NOAA: National Oceanic and Atmospheric Administration (NOAA), US Standard Atmosphere, Dept. of Commerce, National Oceanic and Atmospheric Administration, Washington, USA, NOAA-S/T 76-1562, 1976.
Redondas, A., Evans, R., Stuebi, R., Köhler, U., and Weber, M.: Evaluation of the use of five laboratory-determined ozone absorption cross sections in Brewer and Dobson retrieval algorithms, Atmos. Chem. Phys., 14, 1635–1648, https://doi.org/10.5194/acp-14-1635-2014, 2014.
Redondas, A., León-Luís, S. F., López-Solano, J., Berjón, A., and Carreño, V.: Thirteenth Intercomparison Campaign of the Regional Brewer Calibration Center Europe, Joint publication of State Meteorological Agency (AEMET), Madrid, Spain and World Meteorological Organization (WMO), Geneva, Switzerland, WMO/GAWReport No. 246, https://doi.org/10.31978/666-20-018-3, 2019.
Seckmeyer, G., Wendisch, M., and Macke, A.: Biologische und medizinische Wirkungen solarer Bestrahlung – Biological and medical effects of solar radiation, promet Meteorologische Fortbildung DWD, Deutscher Wetterdienst (DWD), Offenbach, Germany, 2018.
Serdyuchenko, A., Gorshelev, V., Weber, M., Chehade, W., and Burrows, J. P.: High spectral resolution ozone absorption cross-sections – Part 2: Temperature dependence, Atmos. Meas. Tech., 7, 625–636, https://doi.org/10.5194/amt-7-625-2014, 2014.
Slaper, H., Reinen, H., Blumthaler, M., Huber, M., and Kuik, F.: Comparing Ground-Level Spectrally Resolved Solar UV Measurements Using Various Instruments: A Technique Resolving Effects of Wavelength Shift and Slit Width, Geophys. Res. Lett., 22, 2721–2724, https://doi.org/10.1029/95GL02824, 1995.
Solomon, S.: Stratospheric ozone depletion: A review of concepts and history, Rev. Geophys., 37, 275–316, 1999.
Staehelin, J., Harris, N., Appenzeller, C., and Eberhard, J.: Ozone trend: A review, Rev. Geophys., 39, 231–290, 2001.
Staehelin, J., Viatte, P., Stübi, R., Tummon, F., and Peter, T.: Stratospheric ozone measurements at Arosa (Switzerland): history and scientific relevance, Atmos. Chem. Phys., 18, 6567–6584, https://doi.org/10.5194/acp-18-6567-2018, 2018.
Stübi, R., Schill, H., Klausen, J., Maillard Barras, E., and Haefele, A.: A fully automated Dobson sun spectrophotometer for total column ozone and Umkehr measurements, Atmos. Meas. Tech., 14, 5757–5769, https://doi.org/10.5194/amt-14-5757-2021, 2021.
Vaníček, K., Metelka, L., Skřivánková, P., and Staněk, M.: Dobson, Brewer, ERA-40 and ERA-Interim original and merged total ozone data sets – evaluation of differences: a case study, Hradec Králové (Czech), 1961–2010, Earth Syst. Sci. Data, 4, 91–100, https://doi.org/10.5194/essd-4-91-2012, 2012.
Vaskuri, A., Kärhä, P., Egli, L., Gröbner, J., and Ikonen, E.: Uncertainty analysis of total ozone derived from direct solar irradiance spectra in the presence of unknown spectral deviations, Atmos. Meas. Tech., 11, 3595–3610, https://doi.org/10.5194/amt-11-3595-2018, 2018.
WMO (World Meteorological Organization): Scientific Assessment of Ozone Depletion: 2018, Global Ozone Research and Monitoring Project – Report No. 58, 588 pp., Geneva, Switzerland, https://csl.noaa.gov/assessments/ozone/2018/ (last access: 28 March 2022), 2018.
Young, P. J., Harper, A. B., Huntingford, C., Paul, N. D., Morgenstern, O., Newman, P. A., Oman, L. D., Madronich, S., and Garcia, R. R.: The Montreal Protocol protects the terrestrial carbon sink, Nature, 596, 384–388, https://doi.org/10.1038/s41586-021-03737-3, 2021.
Zerefos, C. S.: Long-term ozone and UV variations at Thessaloniki, Greece, Phys. Chem. Earth A/B/C, 27, 455–460, https://doi.org/10.1016/S1474-7065(02)00026-8, 2002.
Zuber, R., Ribnitzky, M., Tobar, M., Lange, K., Kutscher, D., Schrempf, M., Niedzwiedz, A., and Seckmeyer, G.: Global spectral irradiance array spectroradiometer validation according to WMO, Meas. Sci. Technol., 29, 105801, https://doi.org/10.1088/1361-6501/aada34, 2018a.
Zuber, R., Sperfeld, P., Riechelmann, S., Nevas, S., Sildoja, M., and Seckmeyer, G.: Adaption of an array spectroradiometer for total ozone column retrieval using direct solar irradiance measurements in the UV spectral range, Atmos. Meas. Tech., 11, 2477–2484, https://doi.org/10.5194/amt-11-2477-2018, 2018b.
Zuber, R., Köhler, U., Egli, L., Ribnitzky, M., Steinbrecht, W., and Gröbner, J.: Total ozone column intercomparison of Brewers, Dobsons, and BTS-Solar at Hohenpeißenberg and Davos in 2019/2020, Atmos. Meas. Tech., 14, 4915–4928, https://doi.org/10.5194/amt-14-4915-2021, 2021.