the Creative Commons Attribution 4.0 License.
the Creative Commons Attribution 4.0 License.
 | 05 Apr 2022
Sentinel-5P TROPOMI NO2 retrieval: impact of version v2.2 improvements and comparisons with OMI and ground-based data
Henk Eskes
Steven Compernolle
Gaia Pinardi
Tijl Verhoelst
Jean-Christopher Lambert
Maarten Sneep
Mark ter Linden
Antje Ludewig
K. Folkert Boersma
J. Pepijn Veefkind
Nitrogen dioxide (NO2) is one of the main data products measured by the Tropospheric Monitoring Instrument (TROPOMI) on the Sentinel-5 Precursor (S5P) satellite, which combines a high signal-to-noise ratio with daily global coverage and high spatial resolution. TROPOMI provides a valuable source of information to monitor emissions from local sources such as power plants, industry, cities, traffic and ships, and variability of these sources in time. Validation exercises of NO2 v1.2–v1.3 data, however, have revealed that TROPOMI's tropospheric vertical column densities (VCDs) are too low by up to 50 % over highly polluted areas. These findings are mainly attributed to biases in the cloud pressure retrieval, the surface albedo climatology and the low resolution of the a priori profiles derived from global simulations of the TM5-MP chemistry model.
This study describes improvements in the TROPOMI NO2 retrieval leading to version v2.2, operational since 1 July 2021. Compared to v1.x, the main changes are the following. (1) The NO2-v2.2 data are based on version-2 level-1b (ir)radiance spectra with improved calibration, which results in a small and fairly homogeneous increase in the NO2 slant columns of 3 % to 4 %, most of which ends up as a small increase in the stratospheric columns. (2) The cloud pressures are derived with a new version of the FRESCO cloud retrieval already introduced in NO2-v1.4, which led to a lowering of the cloud pressure, resulting in larger tropospheric NO2 columns over polluted scenes with a small but non-zero cloud coverage. (3) For cloud-free scenes a surface albedo correction is introduced based on the observed reflectance, which also leads to a general increase in the tropospheric NO2 columns over polluted scenes of order 15 %. (4) An outlier removal was implemented in the spectral fit, which increases the number of good-quality retrievals over the South Atlantic Anomaly region and over bright clouds where saturation may occur. (5) Snow/ice information is now obtained from ECMWF weather data, increasing the number of valid retrievals at high latitudes.
On average the NO2-v2.2 data have tropospheric VCDs that are between 10 % and 40 % larger than the v1.x data, depending on the level of pollution and season; the largest impact is found at mid and high latitudes in wintertime. This has brought these tropospheric NO2 closer to Ozone Monitoring Instrument (OMI) observations. Ground-based validation shows on average an improvement of the negative bias of the stratospheric (from −6 % to −3 %), tropospheric (from −32 % to −23 %) and total (from −12 % to −5 %) columns. For individual measurement stations, however, the picture is more complex, in particular for the tropospheric and total columns.
- Article
(12733 KB) - Full-text XML
- BibTeX
- EndNote


The Tropospheric Monitoring Instrument (TROPOMI), launched on 13 October 2017 aboard the polar-orbiting Sentinel-5 Precursor (S5P) satellite, provides measurements of atmospheric trace gases (such as NO2, O3, SO2, HCHO, CH4, and CO) and of cloud and aerosol properties. With these measurements TROPOMI, among others, continues the long record of satellite-based observations of global NO2 concentrations.
The reason to monitor NO2 worldwide is its important role in the troposphere and stratosphere. Nitrogen oxides (NOx), the combined name of both nitrogen dioxide (NO2) and nitrogen oxide (NO), enter the atmosphere as a result of anthropogenic and natural processes. They are essential precursors for the formation of ozone in the troposphere (Sillman et al., 1990), and they influence concentrations of OH and thereby shorten the lifetime of methane (Fuglestvedt et al., 1999). Tropospheric NO2 plays a key role in air-quality issues, as it directly affects human health (WHO, 2003). Stratospheric NO2 is involved in photochemical reactions with ozone and thus may affect the ozone layer, either by acting as a catalyst for ozone destruction (Crutzen, 1970; Seinfeld and Pandis, 2006; Hendrick et al., 2012) or by suppressing ozone depletion (Murphy et al., 1993).
The TROPOMI NO2 retrieval (van Geffen et al., 2020, 2021; Eskes et al., 2022) uses the three-step approach that was introduced for the Ozone Monitoring Instrument (OMI) NO2 retrieval and named DOMINO (Boersma et al., 2007, 2011). This approach was also applied within the QA4ECV project (Boersma et al., 2018), which provided a consistent reprocessing for the NO2 retrieval from measurement by OMI aboard EOS-Aura (Levelt et al., 2006, 2018), GOME-2 aboard MetOp-A (Munro et al., 2006, 2016), SCIAMACHY aboard Envisat (Bovensmann et al., 1999), and GOME aboard ERS-2 (Burrows et al., 1999).
Apart from the operational product described in this paper, several groups presented scientific TROPOMI NO2 retrieval products over Europe (Liu et al., 2021), China (Liu et al., 2020) or Canada (Griffin et al., 2019). These products offer interesting comparisons with the operational product because of differences in the stratospheric estimate, albedo and cloud datasets, aerosol treatment, and a priori profiles used. Douros et al. (2022) describe the impact of the a priori profile and present a European product based on the operational product and profiles from the Copernicus Atmosphere Monitoring Service (CAMS) European air-quality forecasts.
The first step in the NO2 processing is a differential optical absorption spectroscopy (DOAS) retrieval to determine the slant column density (SCD), Ns, the total amount of NO2 along the effective light path from Sun through atmosphere to satellite; details of this step are described by van Geffen et al. (2020). Next, NO2 vertical profile information from a chemistry transport model/data assimilation system that assimilates the SCDs – in the case of TROPOMI, TM5-MP – is used to determine the stratospheric vertical column density (VCD), . Finally, the tropospheric VCD, , is determined:
where Mstrat and Mtrop are the stratospheric and tropospheric air-mass factors (AMFs), which depend on surface albedo, surface pressure, cloud fraction, cloud pressure, the shape of the NO2 vertical profile (not of the absolute concentration levels), and the viewing geometry of the satellite ground pixel in question. An overview of the NO2 data versions is given in the section TROPOMI NO2 documentation and data versions below.
Validation with ground-based measurements and comparison with OMI measurements (e.g. Judd et al., 2020; Tack et al., 2021; Verhoelst et al., 2021; Lambert et al., 2021; Marais et al., 2021; Wang et al., 2020) shows that versions v1.2 and v1.3 of TROPOMI NO2 data leads to (a) tropospheric VCDs that are too low by 22 % to 37 % for clean and slightly polluted scenes, and up to 51 % over highly polluted areas, and (b) stratospheric VCDs that are too low by about 0.2×10¹⁵ molec cm−2 (3.3 µmol m−2). At the same time, the SCDs of OMI measurements match those of TROPOMI very well, with TROPOMI's SCDs about 3 % higher on average due to SCD retrieval details (van Geffen et al., 2020).
An improved FRESCO cloud pressure retrieval (Sect. 4.1), is used in the NO2 processing as v1.4 since 29 November 2020, which reduces the bias in the tropospheric VCDs of polluted scenes considerably (Eskes et al., 2022; Lambert et al., 2021; Riess et al., 2022).
This paper discusses updates in the TROPOMI NO2 retrieval algorithm activated in the operational stream as data version v2.2 on 1 July 2021 and investigates the effect on the SCD and stratospheric VCD (Sect. 3) and on the tropospheric VCD (Sect. 4). This processing includes the use of updated level-1b (ir)radiance spectra (see Sect. 2.1.3). The evaluation is based on a set of test data covering the four seasons (Sect. 2.1.2), produced partly with test version v2.1 and with final version v2.2; the difference between these two for the NO2 is minor (see Sect. 3). Ground-based measurements from the test periods are used to evaluate the impact of the improvements on validation results (Sect. 5).
TROPOMI NO2 level-2 data were reported in SI units, i.e. in mol m−2, where the conversion factor to the more commonly used unit molec cm−2 is 6.022140×10¹⁹ mol−1; for the convenience of the reader, the commonly used unit is added occasionally in the text and in some of the figures.
TROPOMI NO2 documentation and data versions
The standard operational TROPOMI NO2 data product is described in the Algorithm Theoretical Basis Document (ATBD; van Geffen et al., 2021). The Product User Manual (PUM; Eskes et al., 2021) and the Product ReadMe File (PRF; Eskes and Eichmann, 2021) describe usage of the data and the data product versions. The most recent version of these documents can be found on http://www.tropomi.eu/data-products/nitrogen-dioxide/ (last access: 7 March 2022) and on https://sentinel.esa.int/web/sentinel/technical-guides/sentinel-5p/ (last access: 7 March 2022) and includes information on earlier versions.
The NO2 data product is made by the so-called NLL2DP (“Netherlands level-2 data processor”) that provides the TROPOMI data products for which KNMI and SRON are responsible, and if either of these product algorithms is updated, the processor version is updated for all these products. In this paper product version numbers are given with two digits; in practice a third digit may be used to account for minor bug fixes.
The following is an overview of the NO2 data versions and the version of the level-1b (ir)radiance spectra (Sect. 2.1.3) used as input for the retrieval as well as the diagnostic dataset (DDS; Sect. 2.1.2) versions; further details are given in the ATBD and PRF.
-
NO2-v1.2 with level-1b v1.0 is used as of 30 April 2018, the start of the publicly released data; this version replaced all older versions, which are therefore not discussed.
-
NO2-v1.3 with level-1b v1.0 is used as of 20 March 2019, with the same NO2 algorithm as v1.2 but with an improvement in the input cloud data from FRESCO that affect the NO2 VCDs of some ground pixels. As of this version the surface or cloud albedo is adjusted to ensure that the retrieved cloud fraction is within the range [0:1], leading to more realistic cloud pressures; the same albedo treatment is used for the NO2 cloud fraction as of v2.1 (Sect. 4.3).
-
NO2-v1.4 with level-1b v1.0 is used as of 29 November 2020, with the same NO2 algorithm as v1.2-1.3 but with an improvement in the input cloud data from FRESCO that affects the NO2 VCDs of many ground pixels (see Sect. 4.1).
-
NO2-v2.1 with level-1b v2.0 is used for test data DDS-2 and includes a number of improvements in the NO2 retrieval discussed in this paper.
-
NO2-v2.2 with level-1b v2.0 and the same NO2 algorithm as v2.1 is used for test data DDS-3 discussed in this paper and is operational as of 1 July 2021.
-
NO2-v2.3 with level-1b v2.0 contains no changes in the NO2 data (other than some minor bug fixes; cf. Sect. 6.2) and is operational as of 14 November 2021.
-
NO2-v2.4 with updated level-1b v2.1 and updates in the NO2 data (cf. Sect. 6) is scheduled for mid 2022 and will be used for a full mission reprocessing as of 30 April 2018, therewith replacing all previous versions.
Note that near-real time (NRT) data are not considered here; validation of both the offline (OFFL) and NRT data has shown that results of the two processing chains do not differ significantly (Lambert et al., 2021).
Table 1Overview of the diagnostic dataset (DDS) periods processed for evaluation of the updated NO2 data. Columns 3 and 4 give the start of the data that were processed. Columns 5 and 6 give the start of the data that are used for the analysis of the vertical column density (VCD), i.e. after a spin-up period needed by TM5-MP. Columns 7 and 8 give the end of the data that were processed. Note that the orbit at the start of a period may have a sensing start time just before midnight preceding the given date. The last two columns give the version number of the publicly released offline (OFFL) and DDS data.
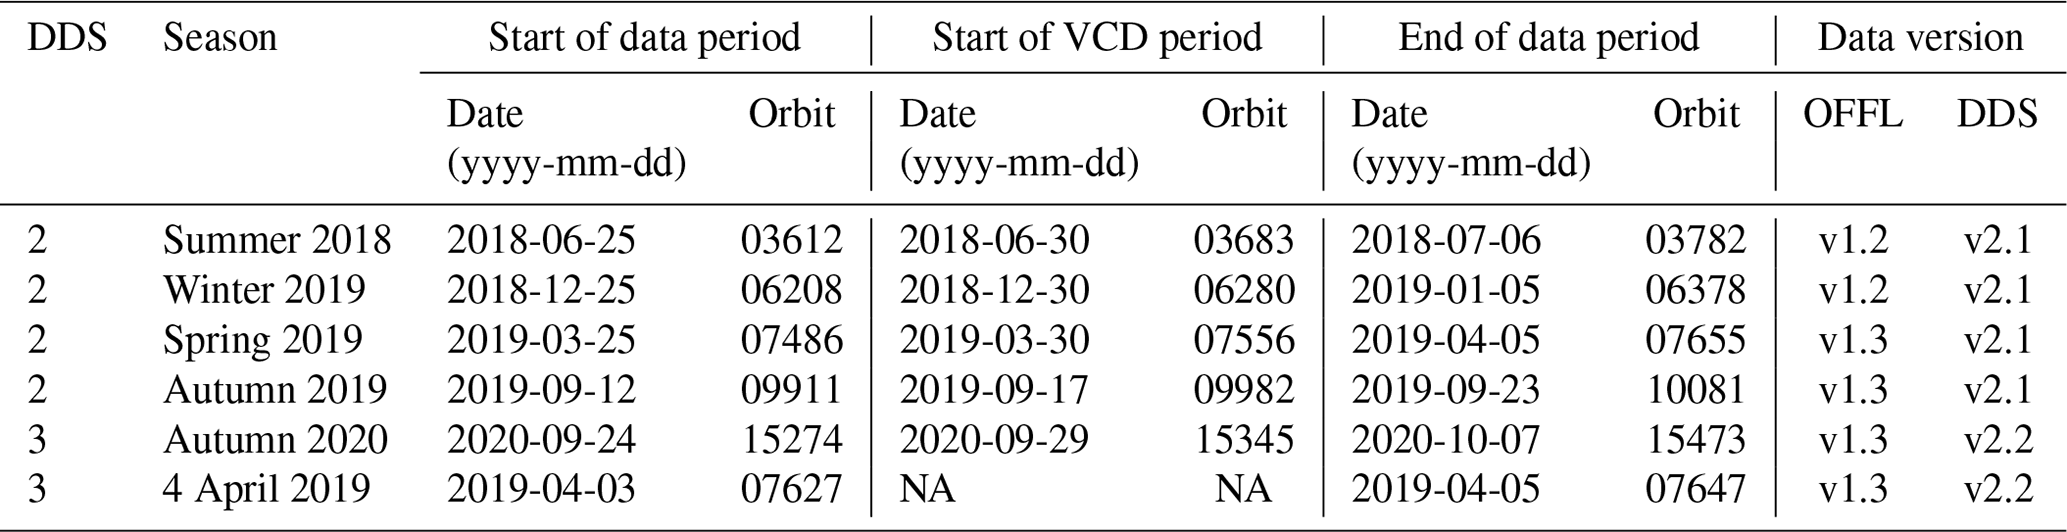
NA: not available.
2.1 TROPOMI aboard Sentinel-5 Precursor
2.1.1 TROPOMI
TROPOMI (Veefkind et al., 2012), launched in October 2017 aboard the European Space Agency's (ESA's) S5P spacecraft, provides measurements in four channels (UV, visible, NIR and SWIR) of various trace gas columns, as well as cloud and aerosol properties, from an ascending Sun-synchronous polar orbit, with an Equator crossing at about 13:30 local time (LT). NO2 retrieval is performed from the visible band (400–496 nm), which has spectral resolution and sampling of 0.54 and 0.20 nm, with a signal-to-noise ratio of around 1500.
Individual ground pixels are 7.2 km (5.6 km as of 6 August 2019) in the along-track and 3.6 km in the across-track directions in the middle of the swath. The full swath width is about 2600 km, with which TROPOMI achieves global coverage each day, except for narrow strips between orbits of about 0.5∘ wide at the Equator. The swath is across-track divided into 450 ground pixels (rows) and their size remains more or less constant towards the edges of the swath (the largest pixels are ∼14 km wide).
2.1.2 TROPOMI observations used in this study
In order to test the NO2 algorithm updates and their impact on the retrieval results, diagnostic datasets were made. DDS-2 (generated in September 2020) consists for NO2 of four periods of 12 d made with test processor version v2.1, and DDS-3 (generated in April 2021) consists of one period of 14 d made with final processor version v2.2; see in Table 1.
To be able to evaluate the new tropospheric and stratospheric VCDs, the full DDS periods are passed through the TM5-MP data assimilation system, starting from v1.x NO2 fields of the day prior to the first day of the DDS periods, which means that TM5-MP needs a few days to adjust (“spin up”) to the new v2.x data. Hence, for analysis of the DDS VCDs (Sect. 4), the first 5 d of each period are skipped, whereas for the analysis of the SCDs (Sect. 3), the full periods are used.
DDS-3 also contains three periods of about 1 d, one of which (4 April 2019) overlaps with one of the DDS-2 periods and is therefore included in Table 1, as it can be used to check the effect on the NO2 SCD retrieval results of changes in the level-1b (ir)radiance spectra between DDS-2 and DDS-3 (Sect. 3.3).
2.1.3 Updates in level-1b (ir)radiance spectra
The NO2 data products of versions v1.x use as input v1.0 level-1b (ir)radiance spectra. As with the switch to v2.2 of the data (cf. section TROPOMI NO2 documentation and data versions), updated v2.0 level-1b (ir)radiance spectra are used. For the DDS processing, the input also consists of v2.0 level-1b spectra.
The pre-launch calibration results, used for most of the v1.0 level-1b spectra, are described by Kleipool et al. (2018), while the updates in the level-1b spectra are detailed by Ludewig et al. (2020); see also the TROPOMI reflectance validation study of Tilstra et al. (2020). The updates most relevant for NO2 are mentioned here, while Sect. 3.3 discusses the impact of the v2.0 level-1b spectra on the NO2 retrieval.
Saturation effects may occur in the detectors of band 4 (visible, e.g. used for NO2 retrieval) and band 6 (NIR, e.g. used for cloud data retrieval) over very bright scenes, such as complexes of high clouds, which result in lower-than-expected radiances for certain spectral (i.e. wavelength) pixels. In addition, large saturation effects may lead to so-called blooming: excess charge flows from saturated into neighbouring detector (ground) pixels in the row direction, resulting in higher-than-expected radiances for certain spectral pixels (Ludewig et al., 2020). Level-1b v1.0 spectra contain flagging for saturation but not for blooming. Level-1b v2.0 also has flagging for blooming (Ludewig et al., 2020), where one error flag number is used for both saturation and blooming. Also improved in v2.0 spectra is flagging for transients, caused by charged particles hitting the detector, relevant all over the world, but in particular over the South Atlantic Anomaly (cf. Sect. 3.2).
In the updated irradiance product (Ludewig et al., 2020) the signal is corrected for optical degradation. In addition, there are improvements in the absolute irradiance calibration and the correction for the solar angle dependence of the irradiance signal. Furthermore, noise and error estimates of the irradiance spectra and the determination of the measurement quality are improved. A change in the absolute reflectance, the ratio between the radiance and irradiance, does not affect the retrieved SCDs, but it has an impact on the scene albedo and cloud fraction and therefore on the AMFs and VCDs.
In the time between the generation of DDS-2 and DDS-3 the calibration key data (CKD) of the level-1b v2.0 spectra, including the irradiance degradation correction, were recalculated using fits over more data (for DDS-2 up to May 2019, for DDS-3 up to February 2021; over the latter period the irradiance degradation was about 2.6 % in band 4 and less than 0.5 % in band 6). This recalculation leads to minor differences for overlapping data periods of DDS-2 and DDS-3: for band 4 both radiance and irradiance differ by less than 0.1 %. The impact on the NO2 SCD retrieval results (Sect. 3.3) is negligible and is therefore not discussed here.
An additional radiance degradation correction and further improved flagging for transients will be implemented; see Sect. 6.3.
Table 2Configuration parameters in the NO2 processing related to saturation in the level-1b radiance spectra and removal of outliers in the NO2 retrieval residual for different versions of the NO2 data, with their respective level-1b spectra version.

NA: not available.
2.2 OMI aboard EOS-Aura
2.2.1 OMI
OMI (Levelt et al., 2006), launched in July 2004 aboard NASA's EOS-Aura spacecraft, provides measurements in three channels (two UV and one visible) of various trace gas columns, as well as cloud and aerosol properties, from an ascending Sun-synchronous polar orbit, with an Equator crossing at about 13:40 LT. NO2 retrieval is performed from the visible band (349–504 nm), which has spectral resolution and sampling of 0.63 and 0.21 nm, with a signal-to-noise ratio of around 500.
Individual ground pixels are 13 km in the along-track and 24 km in the across-track directions in the middle of the swath. The full swath width is about 2600 km, and with that OMI achieves global coverage each day. The swath is across-track divided into 60 ground pixels (rows), and their size increases towards the edges of the swath to ∼150 km.
2.2.2 OMI observations used in this study
Comparisons of the magnitude of the TROPOMI and OMI NO2 column data are done using OMI orbits from the DDS periods (Table 1) processed within the framework of the QA4ECV project (Boersma et al., 2018); validation of those data is discussed by Compernolle et al. (2020) and Pinardi et al. (2020).
Since June 2007 a part of the OMI detector has suffered from a so-called row anomaly, which appears as a signal suppression in the level-1b radiance data at all wavelengths (Schenkeveld et al., 2017), leading e.g. to large uncertainties in the NO2 data in the affected rows 22–53 (0-based), so that effectively the data of these rows have to be skipped from the NO2 analysis.
Due to this issue and the fact that the TROPOMI and OMI orbits do not exactly overlap, because they measure from slightly different altitudes, direct orbit-to-orbit comparisons are not possible. Instead, data comparisons in this paper are performed after conversion to a common longitude–latitude grid.
3.1 Fit window wavelength assignment
The first step in the data processing chain is the selection of the spectral index range [ib:ie] that comprises the wavelength window [λb:λe] needed for the wavelength calibration and DOAS retrieval steps; for the NO2 SCD retrieval, λb=405 nm and λe=465 nm. The selection is done at the nominal wavelength grid assigned to the level-1b (ir)radiance spectra. For a given spectral index, i, the radiance wavelength varies across the detector rows, as illustrated in Fig. 1; this is the so-called spectral smile. Consequently, each detector row has its own [ib:ie]. With λb=405 nm, for example, the level-1b v2.0 radiance nominal wavelength gives ib=36 for the rows along the swath edge and ib=24 for the central rows. Some of the rows around changes in the ib and/or ie have in v1.2–v1.4 a slightly higher SCD error estimate than neighbouring rows. This difference, which is less than 1 µmol m−2 (6×10¹³ molec cm−2), is reduced by two small corrections in the spectral index selection, with little to no effect on other rows.
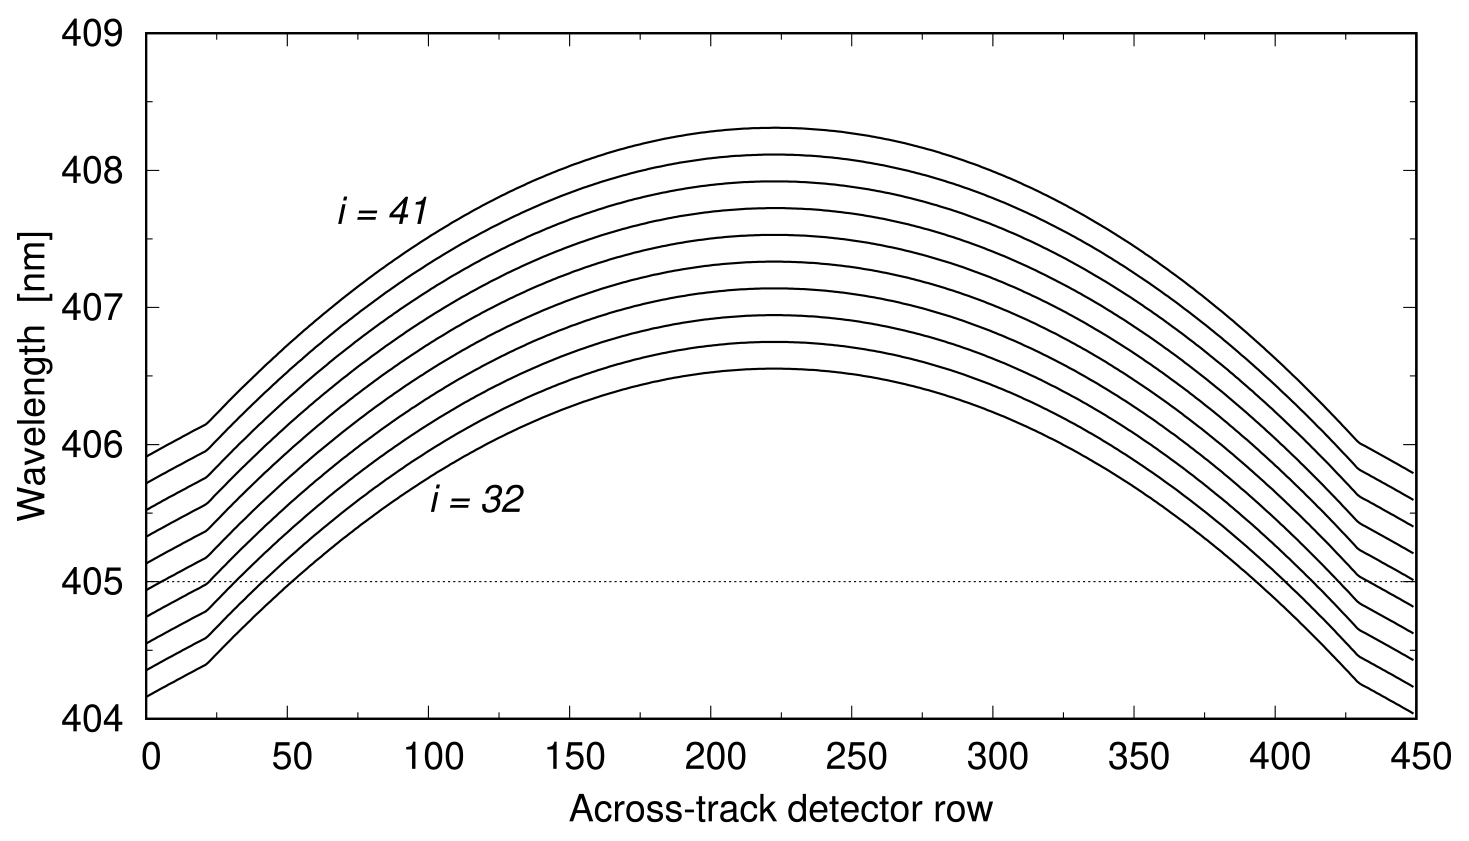
Figure 1Across-track nominal wavelengths of the level-1b radiance spectra of v2.0 for a selected number of spectral indices: i=32 to i=41 of band 4. The horizontal dotted line marks 405 nm.
3.2 Outlier removal
Spectral pixels flagged in the level-1b v1.0 data as suffering from saturation or transients (or other errors) are skipped from the measurement before the spectra are used in the data processing.
Level-1b v1.0 spectra have no flagging for spectral pixels suffering from blooming (cf. Sect. 2.1.3), and hence there may be many problematic spectral pixels around spectral pixels that are flagged as suffering from saturation. These spectral pixels suffering from blooming have radiance levels very different from what is expected, leading to outliers (spikes) in the DOAS fit residual, which is the difference between the measured and DOAS-modelled reflectance. Similarly, level-1b data are flagged for transients caused by charged particles hitting the detector, but not all such events constitute transients and perhaps not all transient events are captured, thus leading to possible outliers in the residual.
Since the NO2 v1.2–v1.4 processor does not have an algorithm that removes the spectral pixels that show such an outlier (“outlier removal”) from the DOAS fit, the maximum fraction of the spectral pixels within the NO2 fit window (405–465 nm, which covers 304 or 305 spectral pixels) allowed with saturation flag without skipping the ground pixels was necessarily low (Table 2). With the introduction of an outlier removal routine in NO2 v2.1 (as announced by van Geffen et al., 2020; see also van Geffen et al., 2021, Appendix F) and the fact that level-1b v2.0 flags the spectral pixels suffering from blooming the same way as saturated pixels (Sect. 2.1.3), a larger fraction of the spectral pixels is allowed to be flagged as saturated (third column in Table 2). In case of outliers in the residual of a given ground pixel caused by charged particles hitting the detector, it appears that the number of spectral pixels showing outliers is usually small (less than five), while in the case of saturation/blooming the number of outliers may be much higher. If the number of outliers is really high, the outlier removal routine may not work well, because it is applied only once (van Geffen et al., 2021), and the maximum number of allowed outliers is for the operational processing set to 10 (Table 2).
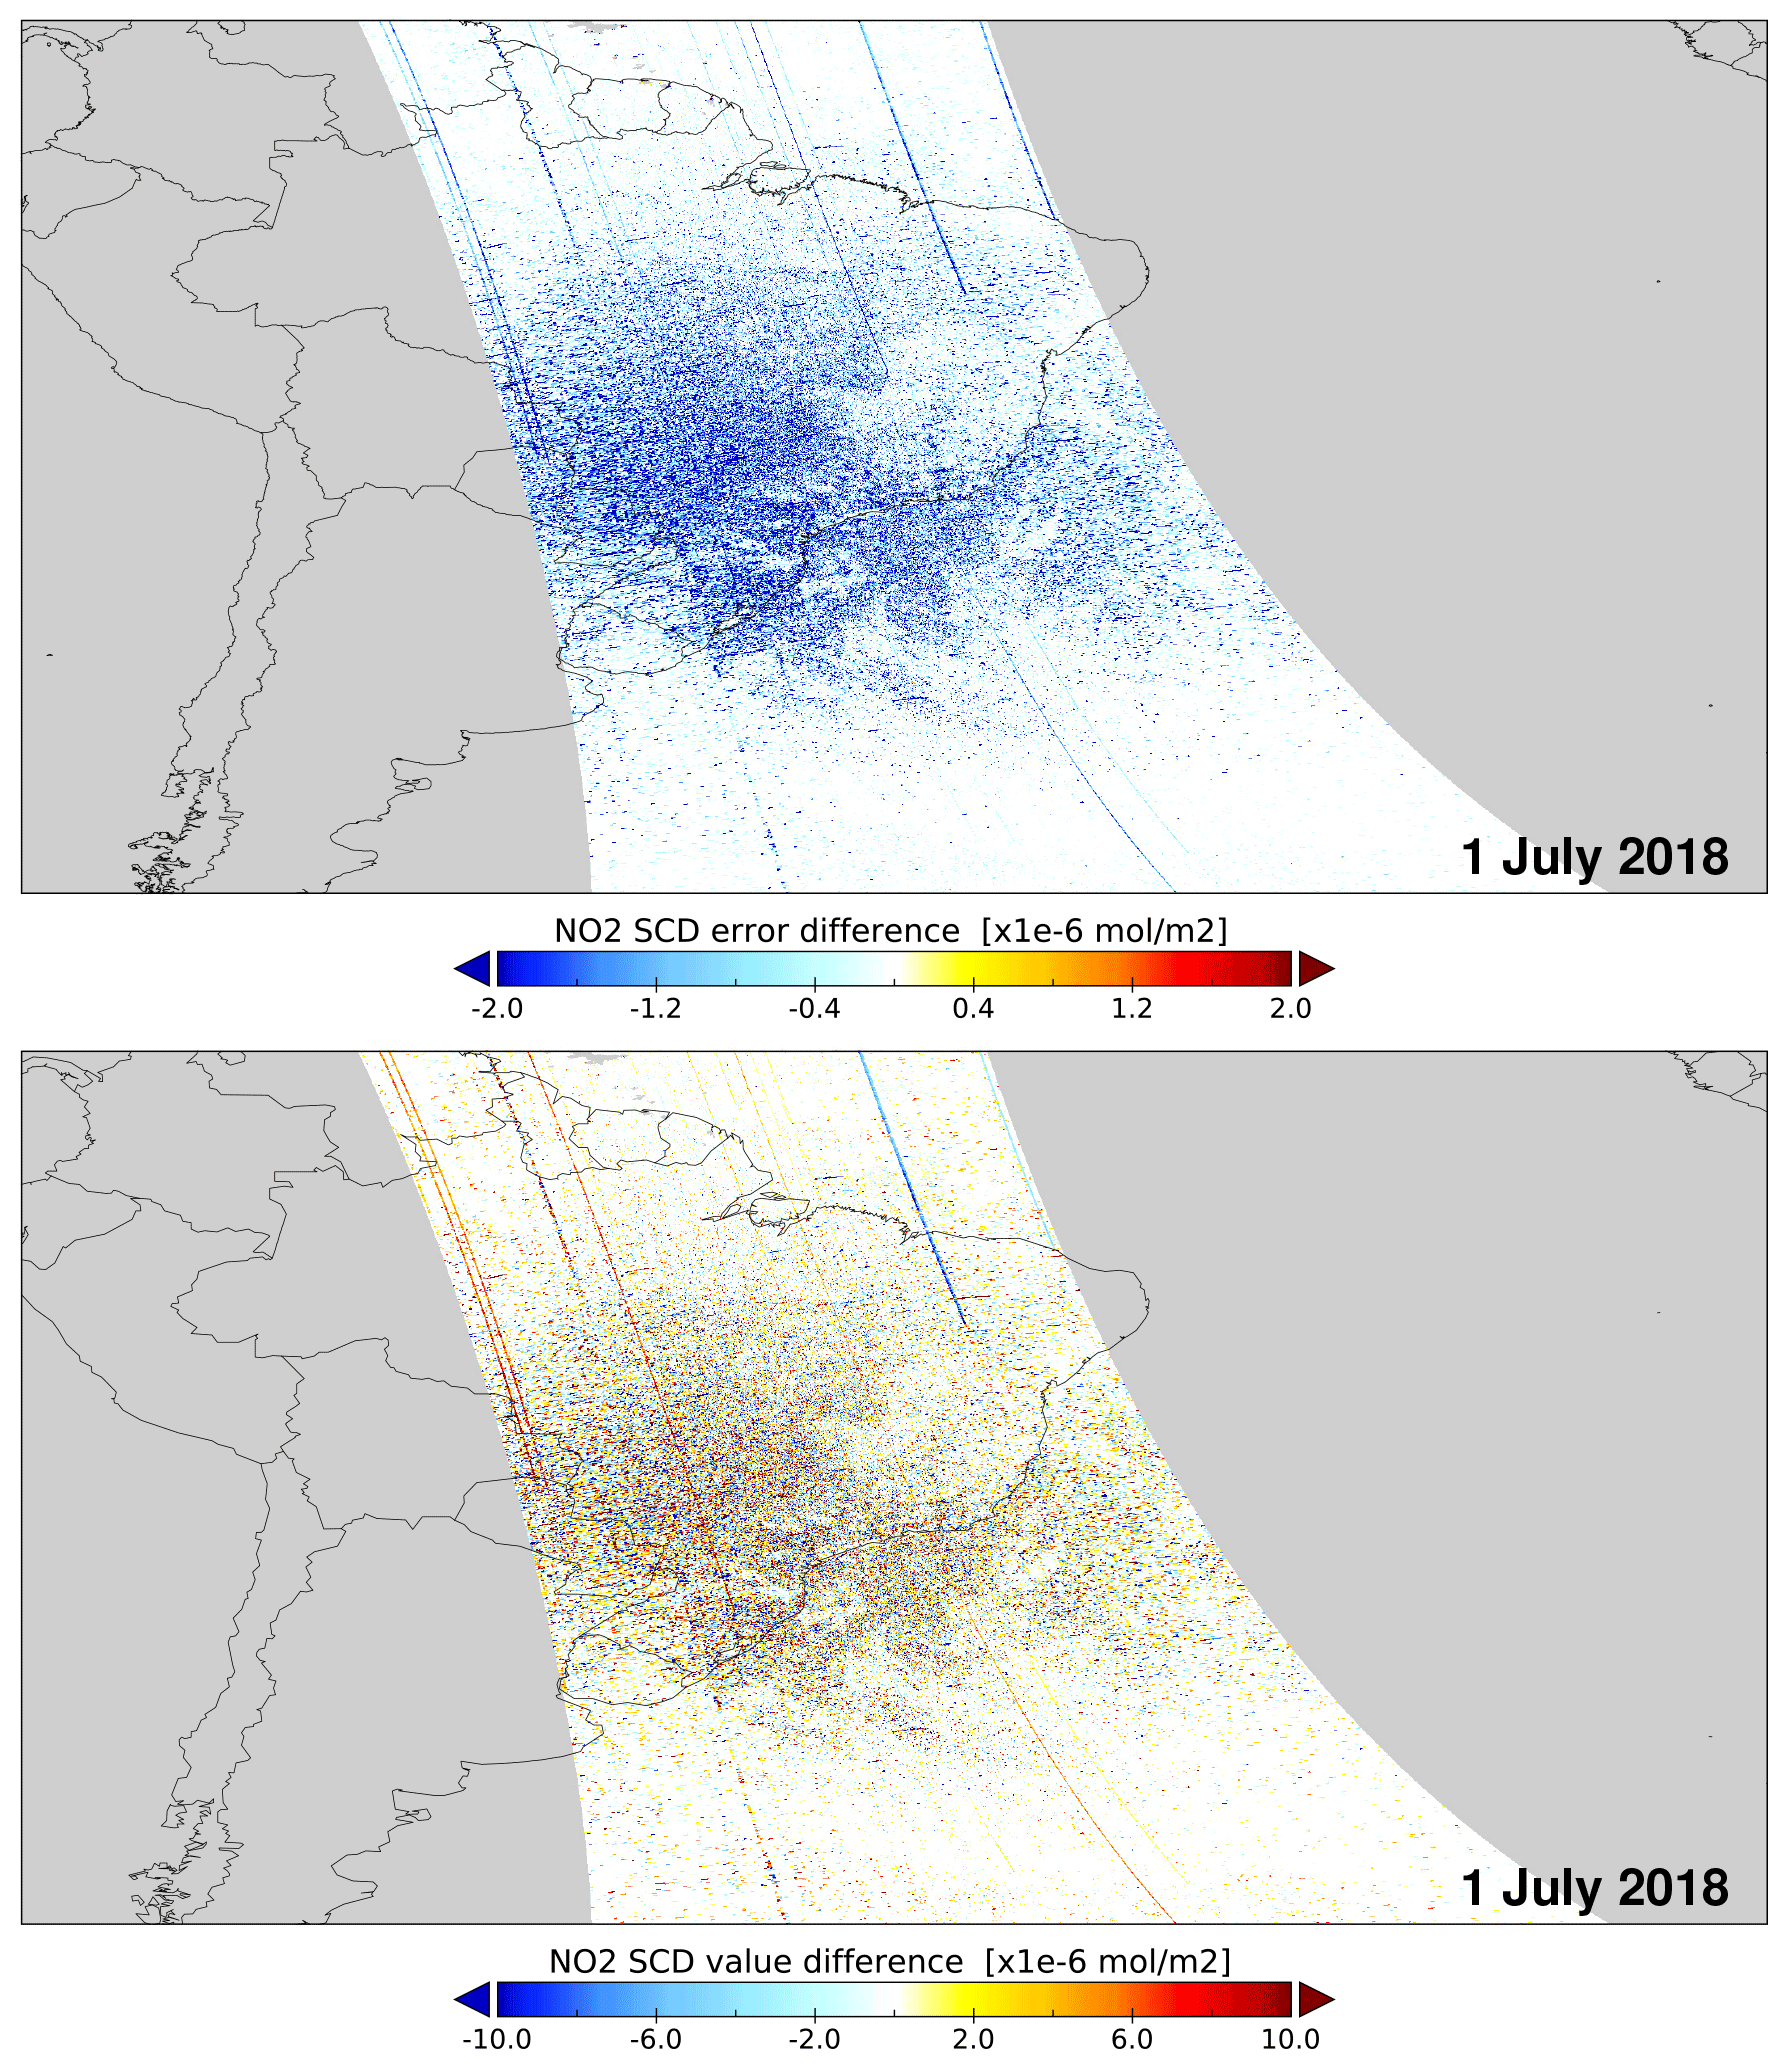
Figure 2Map of the TROPOMI NO2 SCD error (top panel) and SCD value (bottom panel) difference of orbit 03707 of 1 July 2018 over the South Atlantic Anomaly (SAA) due to outlier removal, i.e. the SCD error using the v2.1 settings minus those using the v1.2 settings listed in Table 2, both with level-1b v2.0 spectra as input. The depicted area is longitude [−80 to −10∘], latitude [+50 to +10∘].
Figure 2 shows a map of the difference “v2.1 minus v1.2” (referring to the settings listed in Table 2) in the NO2 SCD error estimate (top panel) and SCD value (bottom panel) from the DOAS fit for an orbit over the South Atlantic Anomaly (SAA) using the level-1b v2.0 (ir)radiance spectra as input. There are a few along-track lines visible in Fig. 2: these are rows for which most v1.2 pixels have exactly one outlier at the beginning of the NO2 fit window while the corresponding v2.1 pixels have not; i.e. these lines are thus related to details of the wavelength assignment (Sect. 3.1) in the pre-v2.1 processor. (As a reference, Fig. A1 shows maps of the SCD error without and with outlier removal.)
Figure 3 shows for the same orbit along-track averages over all 633 scanlines that have a nadir latitude within 40∘ south and north of the Equator. For the southern area outlier removal with the v2.1 settings (blue line) clearly leads to a lower SCD error (panel a) than the v1.2 settings (red line), both made using the level-1b v2.0 spectra. With level-1b v1.0 spectra the SCD error (dotted grey line) is slightly higher than with the level-1b v2.0 spectra, partly because the latter has improved flagging (Sect. 2.1.3). For the northern area outlier removal has little effect on the SCD error: there is no clear difference between the green line (v1.2 settings) and the black line (v2.1 settings), again both made using the level-1b v2.0 spectra. The red and green lines, with the v1.2 settings, show a few peaks due to some strong outliers in the residuals which are not removed. The “jumps” visible at rows 21–22 and 429–430 are caused by changes in the onboard across-track binning of data. For the southern (northern) area the outlier removal removes along a given row outliers every 2–3 (5–10) scanlines.
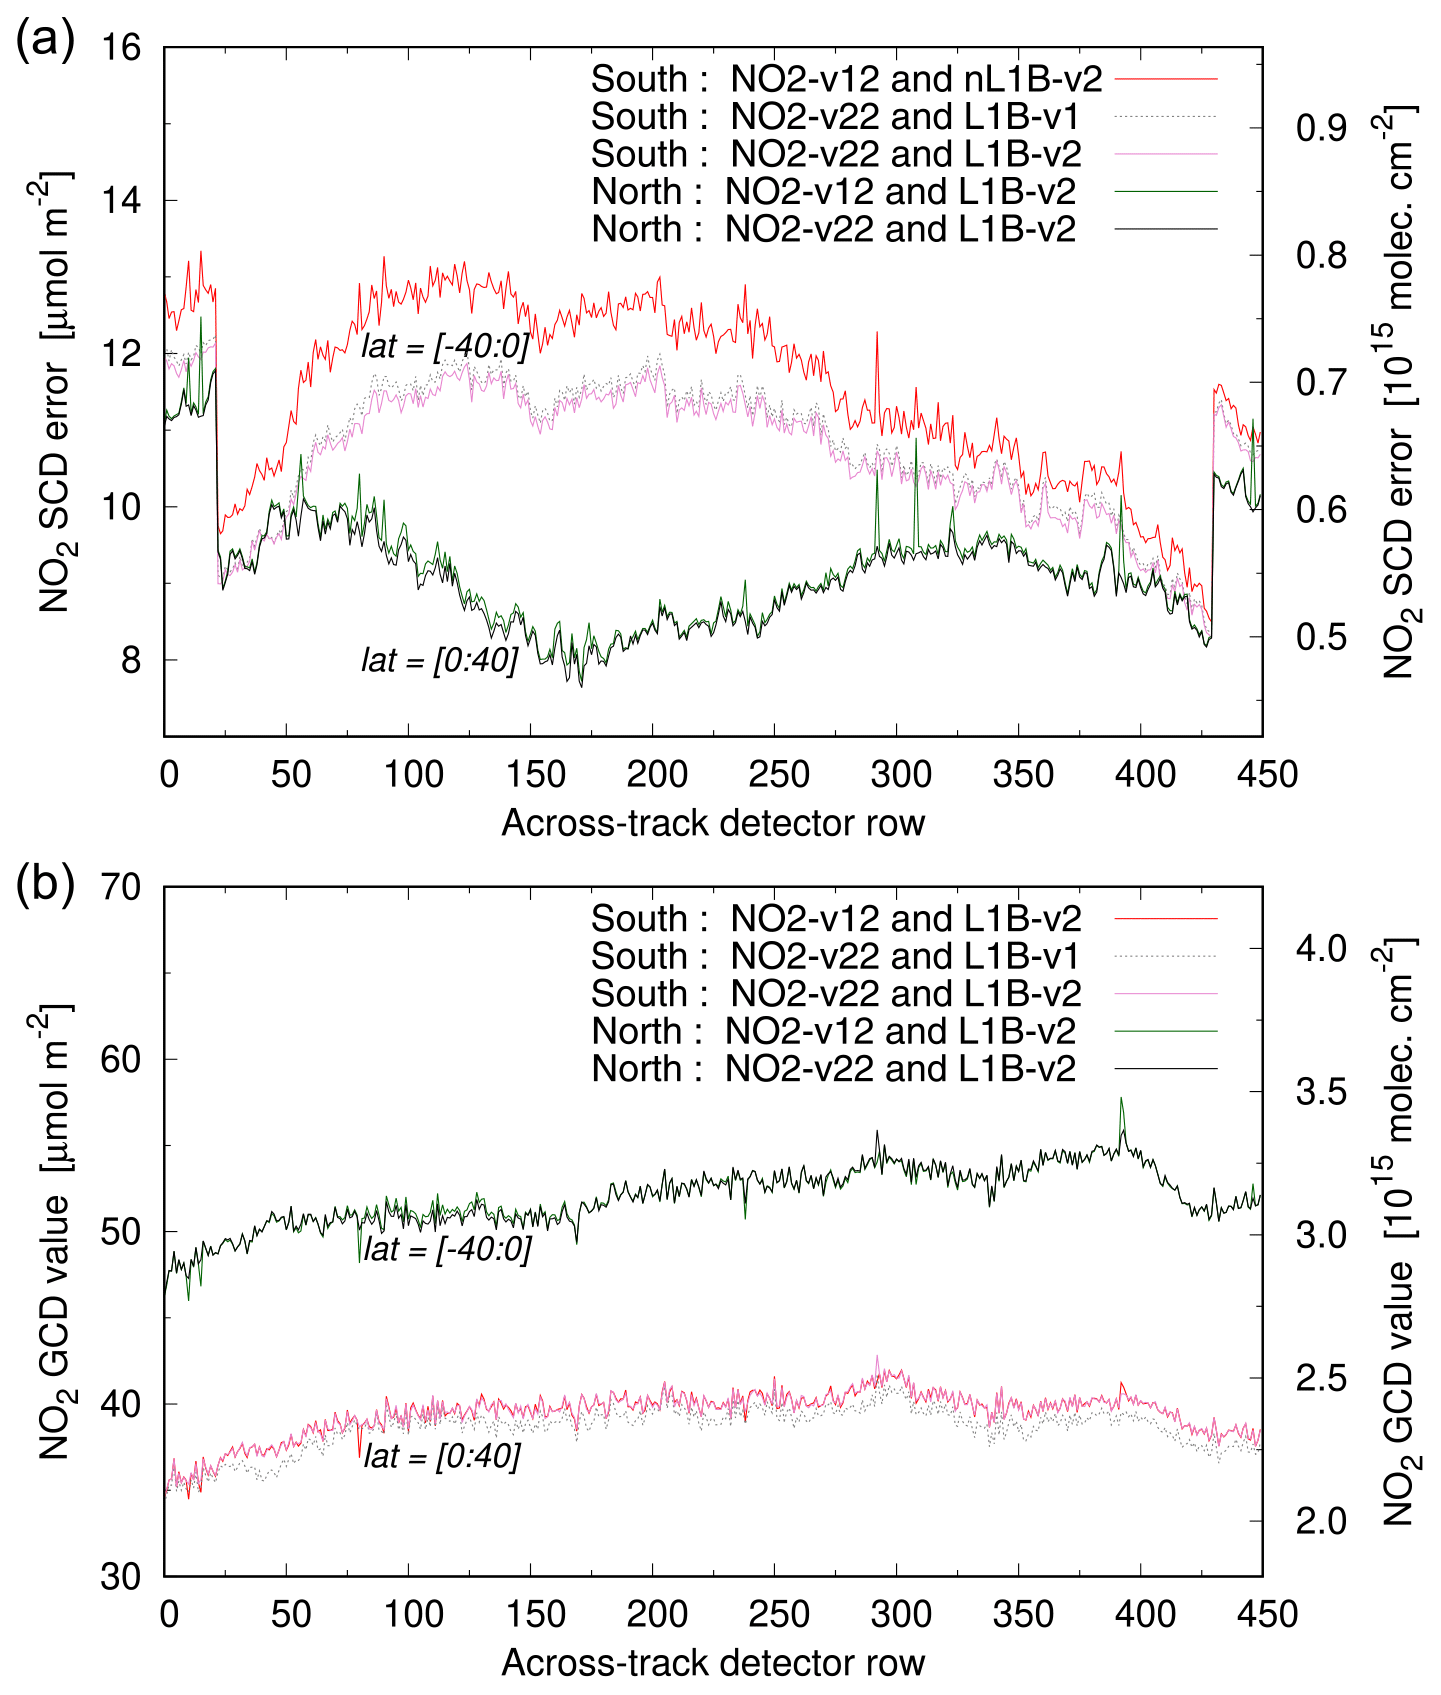
Figure 3Along-track averages over the latitude ranges [0 to +40∘] and [−40∘ to 0] of the SCD error (a) and the SCD in terms of the GCD value (b) of orbit 03707 of 1 July 2018 as a function of the across-track detector row number. The legend refers to the NO2 processor settings for outlier removal listed in Table 2 and the version of the level-1b spectra used as input. See the text for further discussion and details.
The SCD depends strongly on the along-track and across-track variation in the solar and viewing zenith angles. To ease evaluation of the SCD, consider what could be called the geometric column density (GCD), defined as with Mgeo the geometric AMF, which depends only on the viewing angles. Outlier removal does not change the NO2 SCD itself significantly: along-track averages of the GCD (Fig. 3b) differ by <0.4 µmol m−2, except for pixels where (strong) outliers are removed; the average GCDs for the southern and northern areas are ∼50 and ∼40 µmol m−2 (∼3.0 and molec cm−2), respectively.
The NO2 v2.1 processor has been used with level-1b v1.0 spectra to provide dedicated NO2 data files for lightning NOx studies that look at the production of NO2 above bright storm clouds, where saturation/blooming may be a big issue. To this end special configuration settings, listed in the fourth column of Table 2 as “v2.1_test”, are used: more outliers are accepted, but the number of spectral pixels flagged for saturation is limited somewhat because level-1b v1.0 spectra lack flagging for blooming. With these special settings, more ground pixels can be used – but with great care – for such lightning NOx studies (Allen et al., 2021; Pérez-Invernón et al., 2021; Zhang et al., 2021).
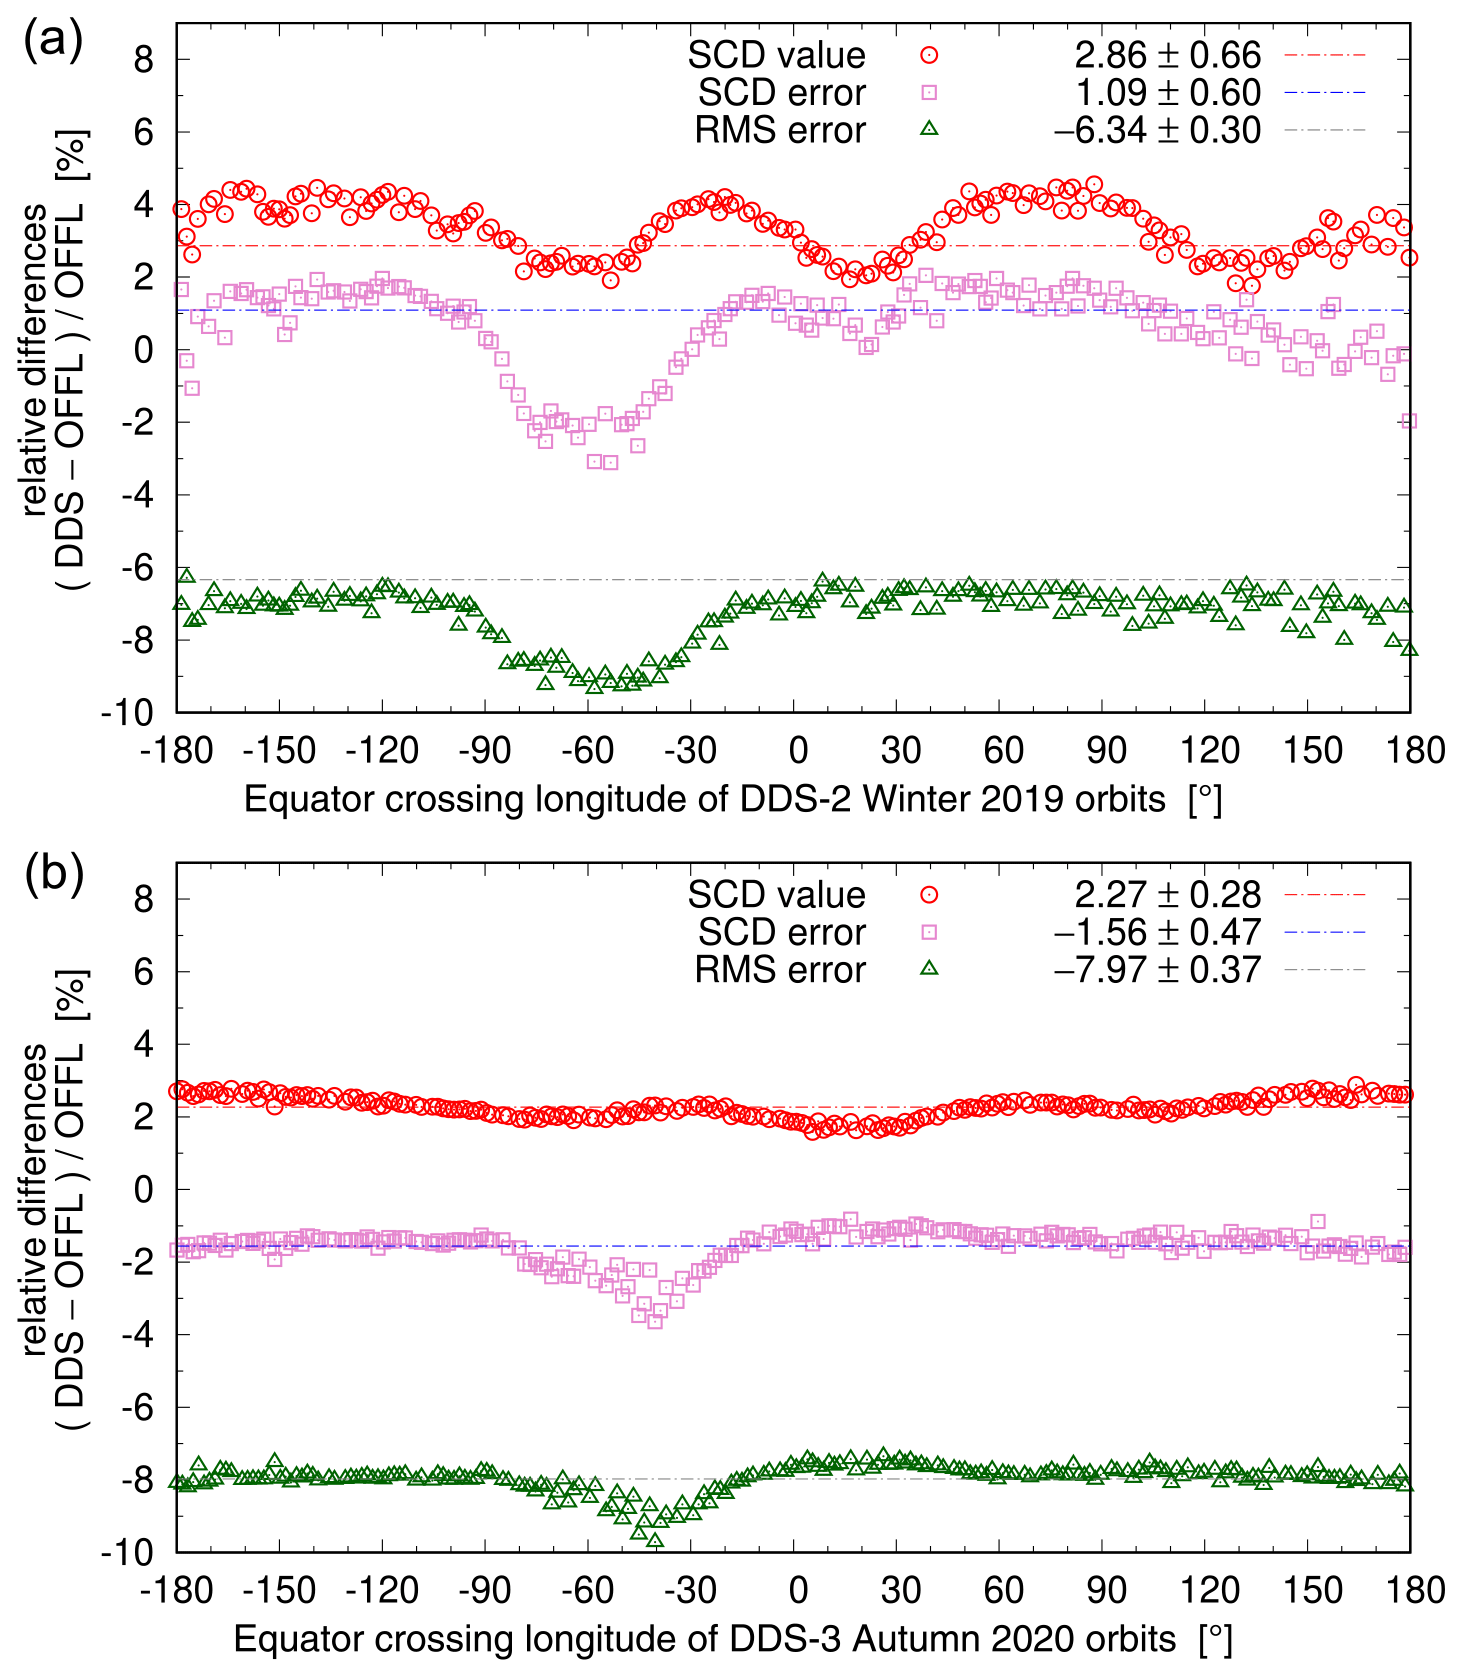
Figure 4Relative differences in the DOAS retrieval results between the TROPOMI DDS and OFFL data, averaged over the 30∘ tropical latitude region during the full DDS-2 winter 2019 (a) and DDS-3 autumn 2020 (b) periods (cf. Table 1), as a function of the Equator-crossing longitude of the orbits. The overall averages are listed in the legend and in Table 3.
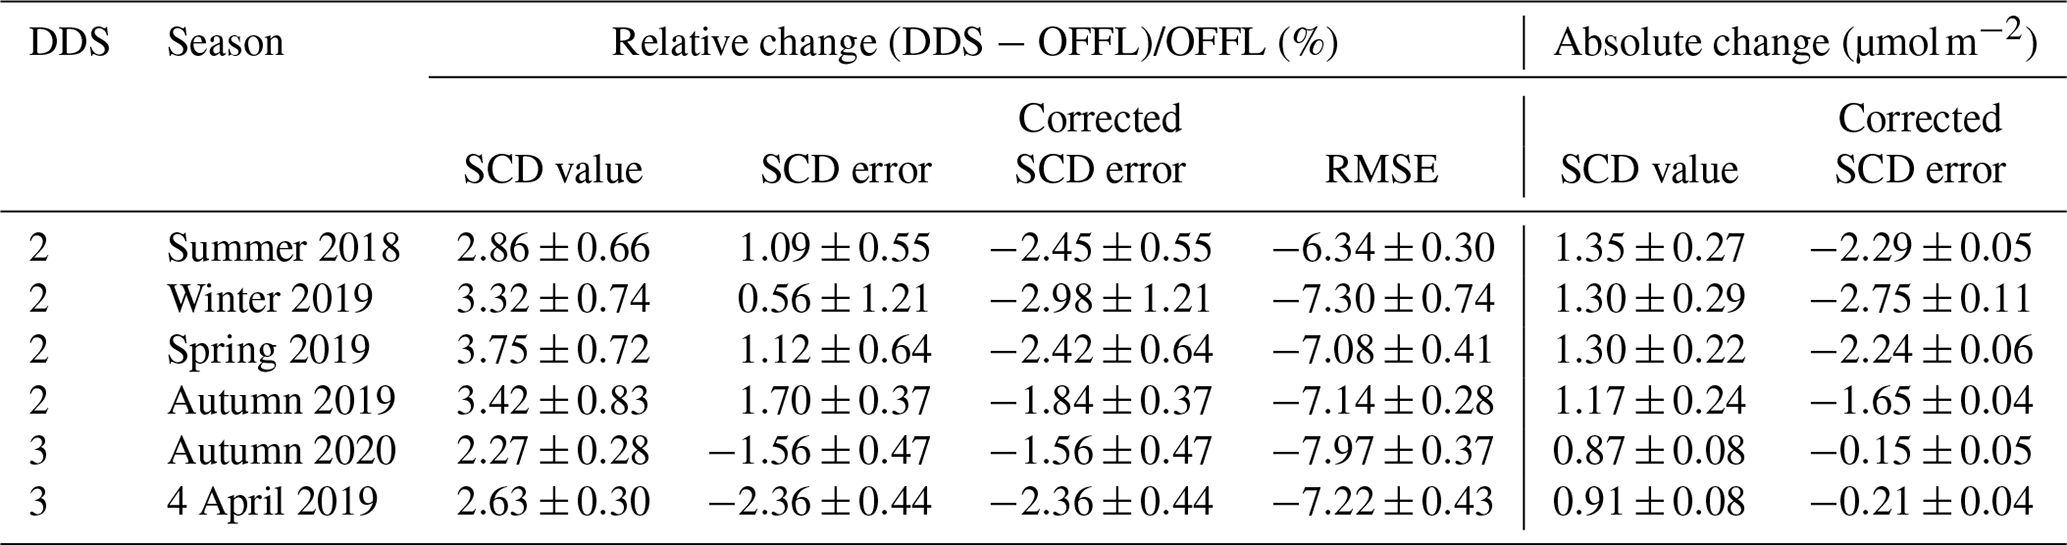
Table 3Relative and absolute differences in some DOAS retrieval results between the DDS and OFFL data averaged over the full DDS-2 and DDS-3 periods (cf. Table 1) for the ground pixels with valid SCD retrieval results in the 30∘ tropical latitude region.
3.3 Impact on SCD retrieval results
Figure 4 shows the relative changes in the main SCD retrieval results for the DDS-2 winter 2019 (top) and DDS-3 autumn 2020 (bottom) periods based on averages over the tropical latitude (TL) region used by van Geffen et al. (2020) for the evaluation of the SCD uncertainties: all scanlines with sub-satellite latitude points – corresponding to the nadir-viewing detector rows – within a 30∘ latitude range that moves along with the seasons, in an attempt to filter out most of the seasonality in the NO2 columns. Table 3 lists relative and absolute changes averaged over all orbits of each of the DDS-2 and DDS-3 periods.
The main SCD retrieval results shown here are the SCD value and the associated error following from the DOAS fit as well as the RMSE: the root-mean-square of the so-called fit residual, i.e. of the difference between the modelled and measured reflectance, which serves as a measure of the quality of the fit. Another such measure is the magnitude χ2, the chi-squared merit function that is minimised in the DOAS fit, which takes into account the uncertainty in the measured reflectance (the RMSE does not). Definitions and other details of the DOAS fit approach are given by van Geffen et al. (2020) and can also be found in the ATBD (van Geffen et al., 2021).
The averages in Fig. 4 and Table 3 are not an exact measure but are a good indicator of the combined impact on SCD retrieval results of the above-mentioned improvements and of the use of level-1b v2.0 spectra combined. Based on the evaluation of only 12 test orbits with the v1.2 NO2 retrieval, van Geffen et al. (2020) estimated that the update of the level-1b (ir)radiance spectra has a small impact on the NO2 SCD value, SCD error and RMSE of on average +2 %, −1 % and −6 %, respectively.
Figure 4 shows that the impact of the new outlier removal over the SAA, discussed in Sect. 3.2, leads to a strong decrease in the SCD error and RMSE around 30–60∘ W, in particular in the winter period (panel a), when the TL region lies just south of the Equator and thus covers a large part of the SAA; in the autumn period (panel b), the TL region lies around the Equator and overlaps less with the SAA, so that for this period the TL region average changes in the error terms are smaller. This SAA “dip” in the SCD error and RMSE leads to a somewhat larger standard deviation of the winter 2019 overall results listed in Table 3.
What stands out from comparing the two panels in Fig. 4 and the numbers given in Table 3 is that the change in the SCD error is very different for DDS-2 and DDS-3: in DDS-2 there is a small increase, while in DDS-3 there is a stronger decrease in the SCD error. The reason for this difference is an unfortunate bug introduced in the v2.1 processor used for DDS-2 that was repaired again in v2.2 used for DDS-3: in v2.1 there is a mistake in the calculation of the noise on the reflectance (from the noise on the (ir)radiance spectra), and this reflectance noise determines in part (i.e. scales) the magnitude of the SCD error, as well as the χ2 of the DOAS fit.
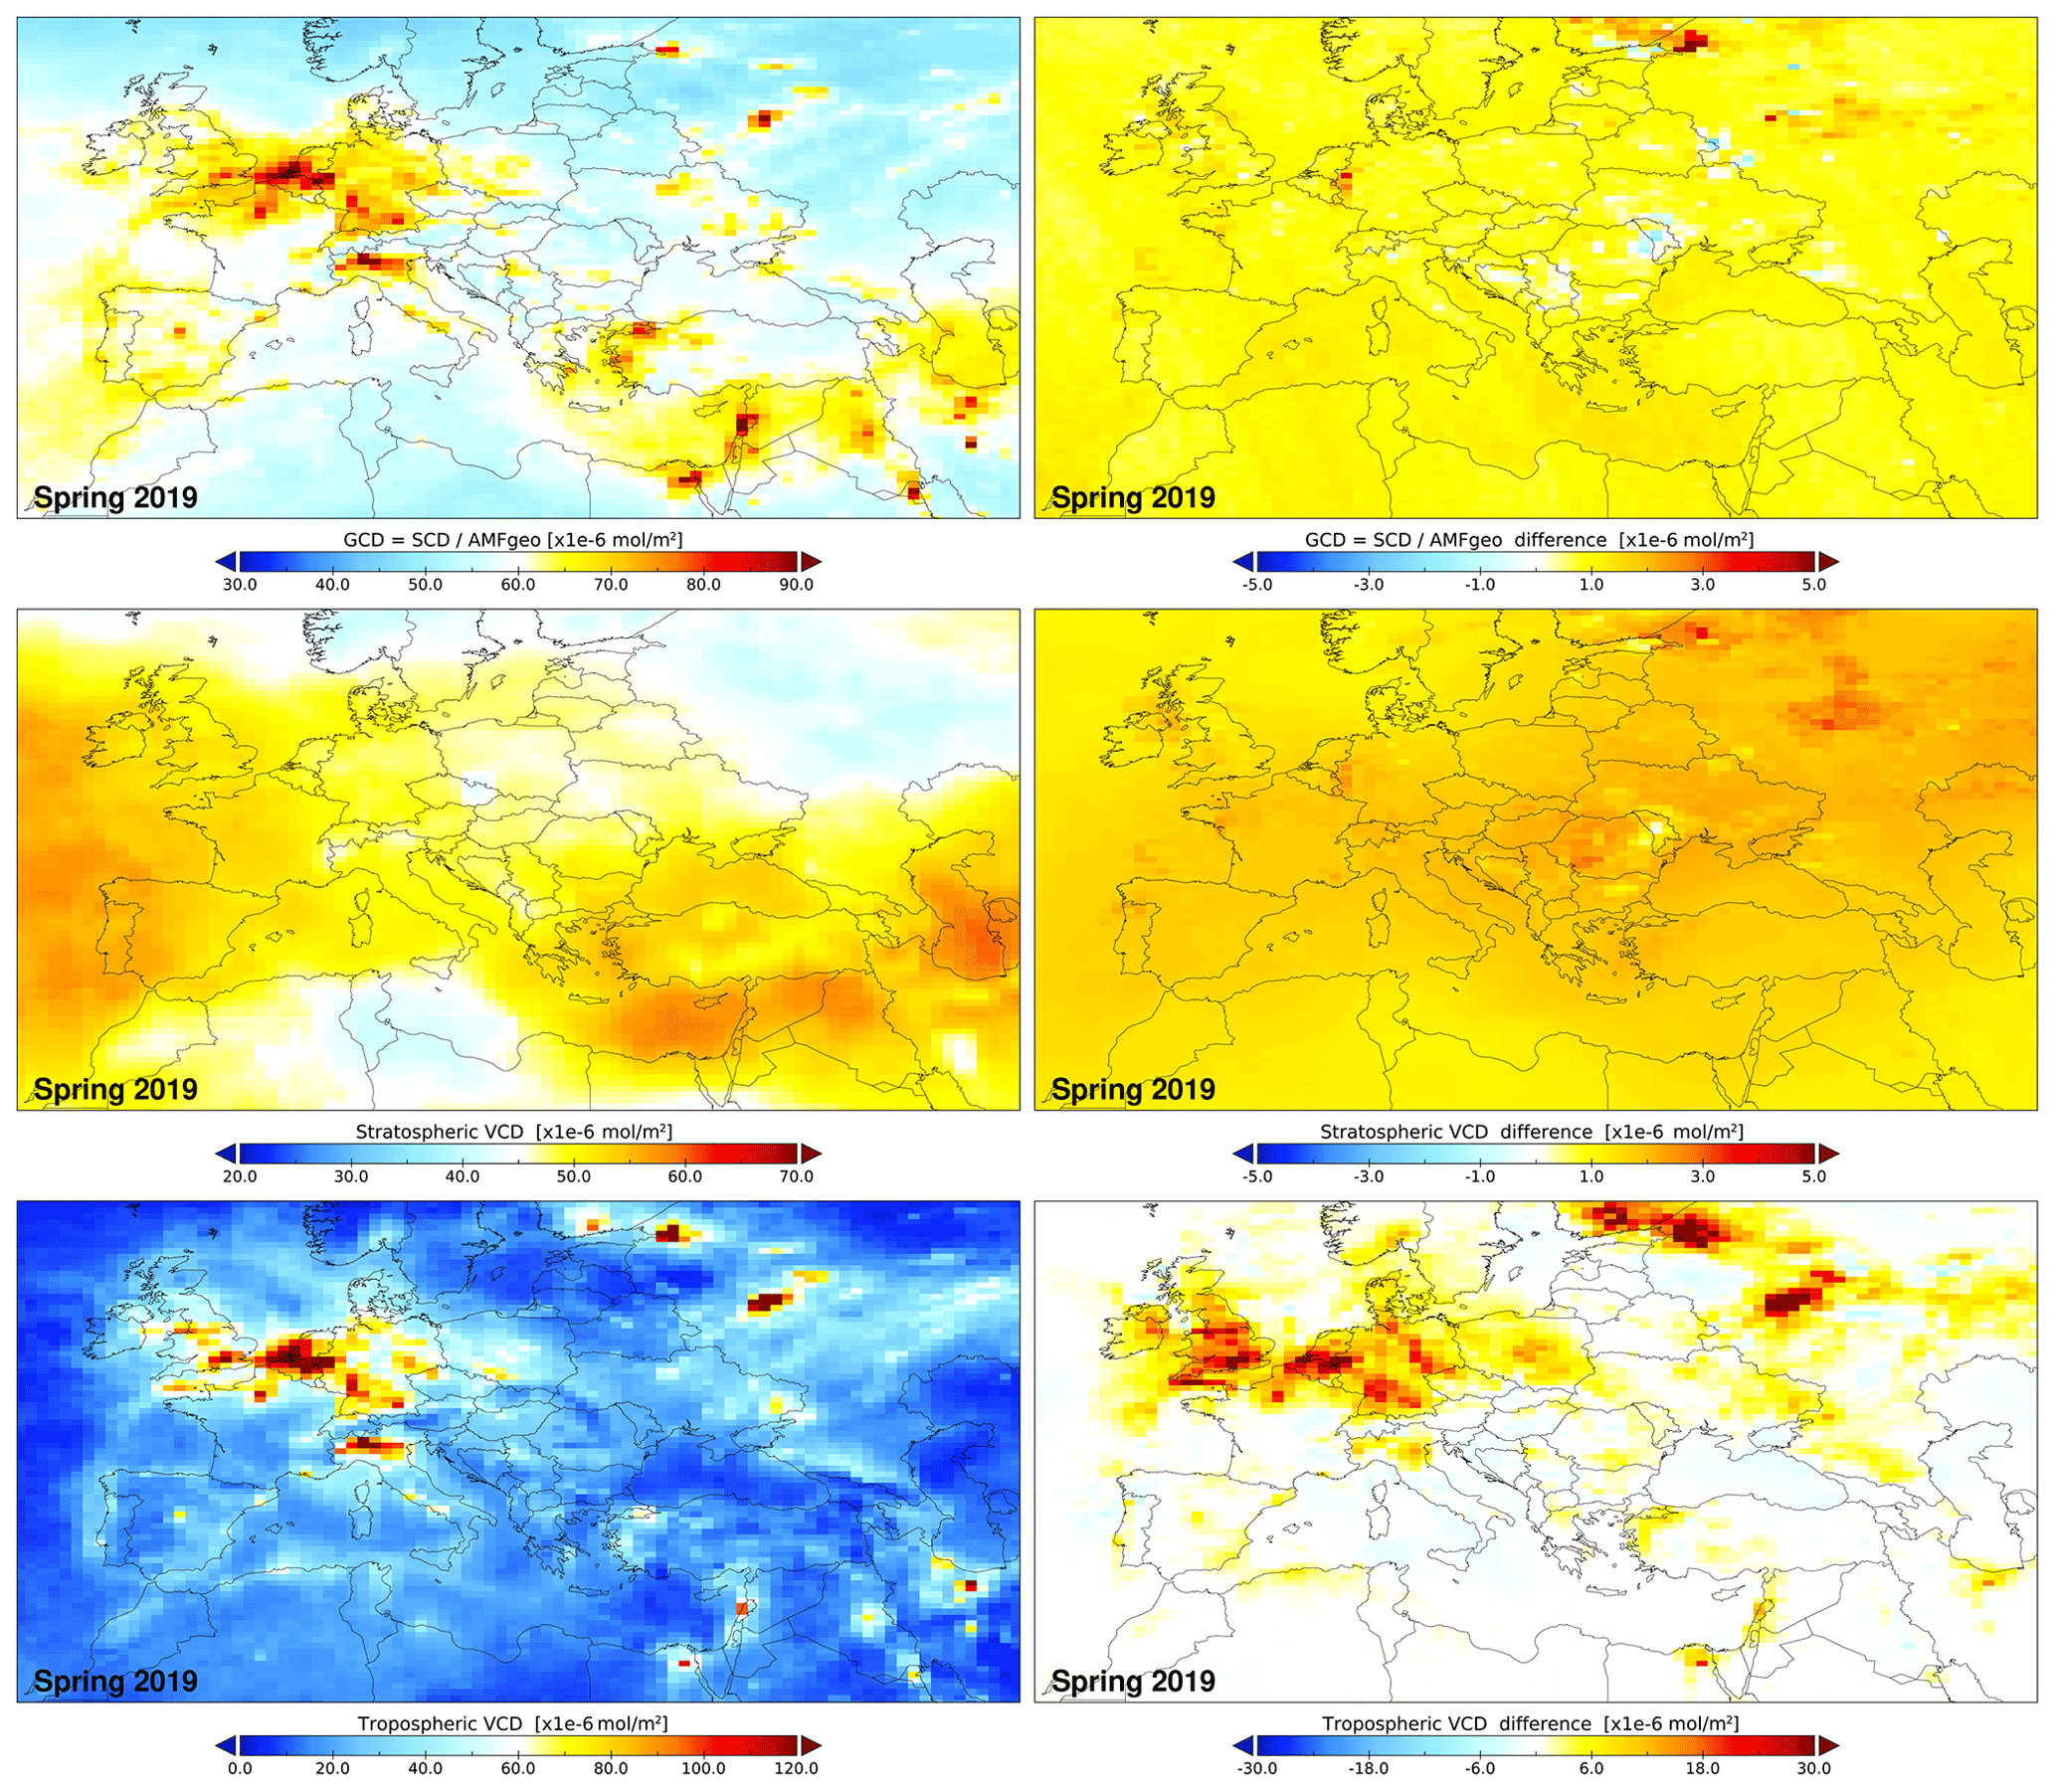
Figure 5Maps of gridded data averaged over the spring 2019 VCD period (cf. Table 1) of all ground pixels with valid retrieval: the NO2 GCD (top row), stratospheric VCD (middle row) and tropospheric VCD (bottom row) values of the v2.1 data (left column) and the “DDS minus OFFL” difference (right column), all in µmol m−2. The depicted area is longitude [−15 to +55∘], latitude [+27.5 to +62.5∘].
Averaging the SCD error changes in the overlapping 21 orbits of the 4 April 2019 test data shows a clear decrease of about 0.33 µmol m−2 or about 3.5 % from DDS-2 to DDS-3. Using this to correct the DDS-2 SCD error differences to the DDS-3 level leads to the numbers in the fifth and eighth columns of Table 3: after the correction all test data periods show more or less the same decrease in the SCD error, with some variation between the periods, which is likely caused by differences in atmospheric circumstances and remaining seasonal effects, despite the use of a moving TL region for the averaging.
The RMSE is not directly affected by the reflectance noise, and the numbers given in Table 3 do not show a clear difference between DDS-2 and DDS-3 (averaged over the 4 April 2019 period, the RMSE of DDS-3 is 0.2 % lower than that of DDS-3), indicating that the quality of the NO2 SCD fit has not been affected by the unfortunate bug. All DDS-2 periods have comparable RMSE decreases, with possibly a somewhat larger decrease in the autumn 2020 DDS-3 period, which may be due to a small change in the level-1b irradiance degradation correction but may also be due to atmospheric circumstances.
The SCD values themselves show an increase of 3 %–4 % for DDS-2 and about 2.5 % for DDS-3, while averaged over the 4 April 2019 test data the DDS-3 SCD values are 1.1 % lower than those of DDS-2. Again, the difference between DDS-2 and DDS-3 may be due to the small change in the irradiance degradation correction (reflectances have changed by less than 0.5 %) and/or to atmospheric circumstances.
In summary, the v2.1–v2.2 DDS data, compared to the v1.2–v1.3 OFFL data, show an improved DOAS fit quality, a reduced SCD error, and a small increase in the SCD values (Table 3).
The SCD increase shows in Fig. 4a some east–west variation, while in Fig. 4b there is hardly any such variation. On the whole, it appears that the SCD increase is more or less uniform across the world, with few or no hotspots. Due to the physics of the subsequent NO2 data assimilation, the more or less homogeneous SCD increase leads to an increase in the stratospheric NO2 vertical column ().
The data assimilation is set up in such a way that the total column is made consistent with the TROPOMI observations over regions with small levels of air pollution (oceans, remote land regions), basically by adjusting the stratospheric column because of the minor contribution of the troposphere in those locations. A uniform increase in the TROPOMI total column will therefore lead to a similar increase in the stratospheric vertical column, while the tropospheric columns will be hardly affected.
Table 4Relative and absolute differences in the stratospheric VCD between the DDS and OFFL data averaged over the VCD periods (cf. Table 1) for the ground pixels with valid SCD retrieval results in the 30∘ tropical latitude region.
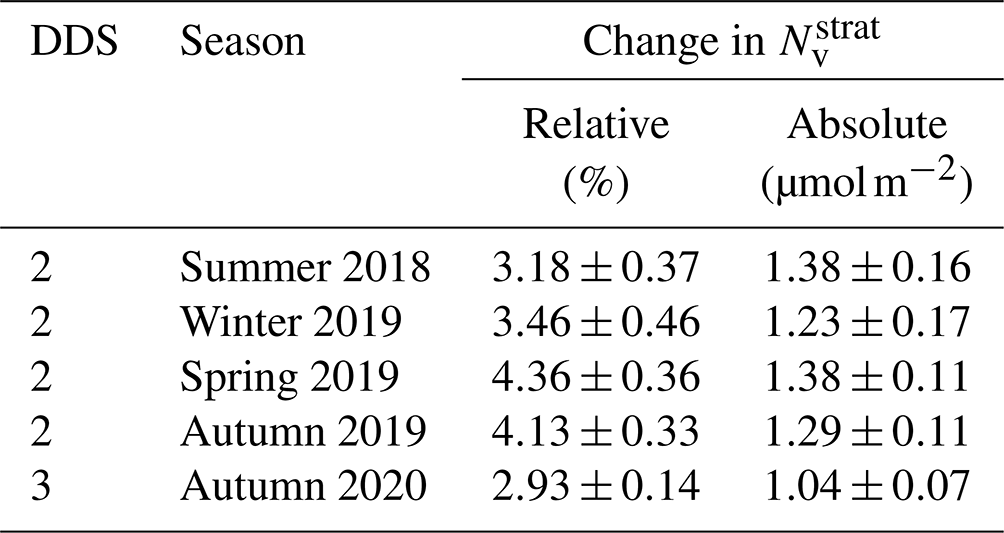
Table 4 lists the relative and absolute differences of the averaged over the TL region using the orbits of the VCD period given in Table 1. For the DDS-3 period the increase in is somewhat less than for the four DDS-2 periods, like with the SCD values and for the same reasons.
Figure 5 shows as example maps over Europe of selected
datasets gridded on and averaged over the VCD part of the spring 2019 period (cf. Table 1) using all pixels with a valid retrieval (qa_value >0.50). The top row shows on the left the GCD of v2.1, with clear hotspots over
polluted areas, while the “DDS minus OFFL” difference on the right is fairly homogeneous.
The second row shows on the left the stratospheric VCD of v2.1 and on the
right the difference between the v2.1 and v1.3 data, which features a more
or less homogeneous increase in the stratospheric VCD, although over some strongly polluted areas, such as Moscow and St. Petersburg, the
stratospheric VCD change can be larger.
As a reference, the bottom row shows the corresponding tropospheric VCD v2.1
value (left) and difference (right), with the latter also influenced by
changes in the AMF discussed in Sect. 4.
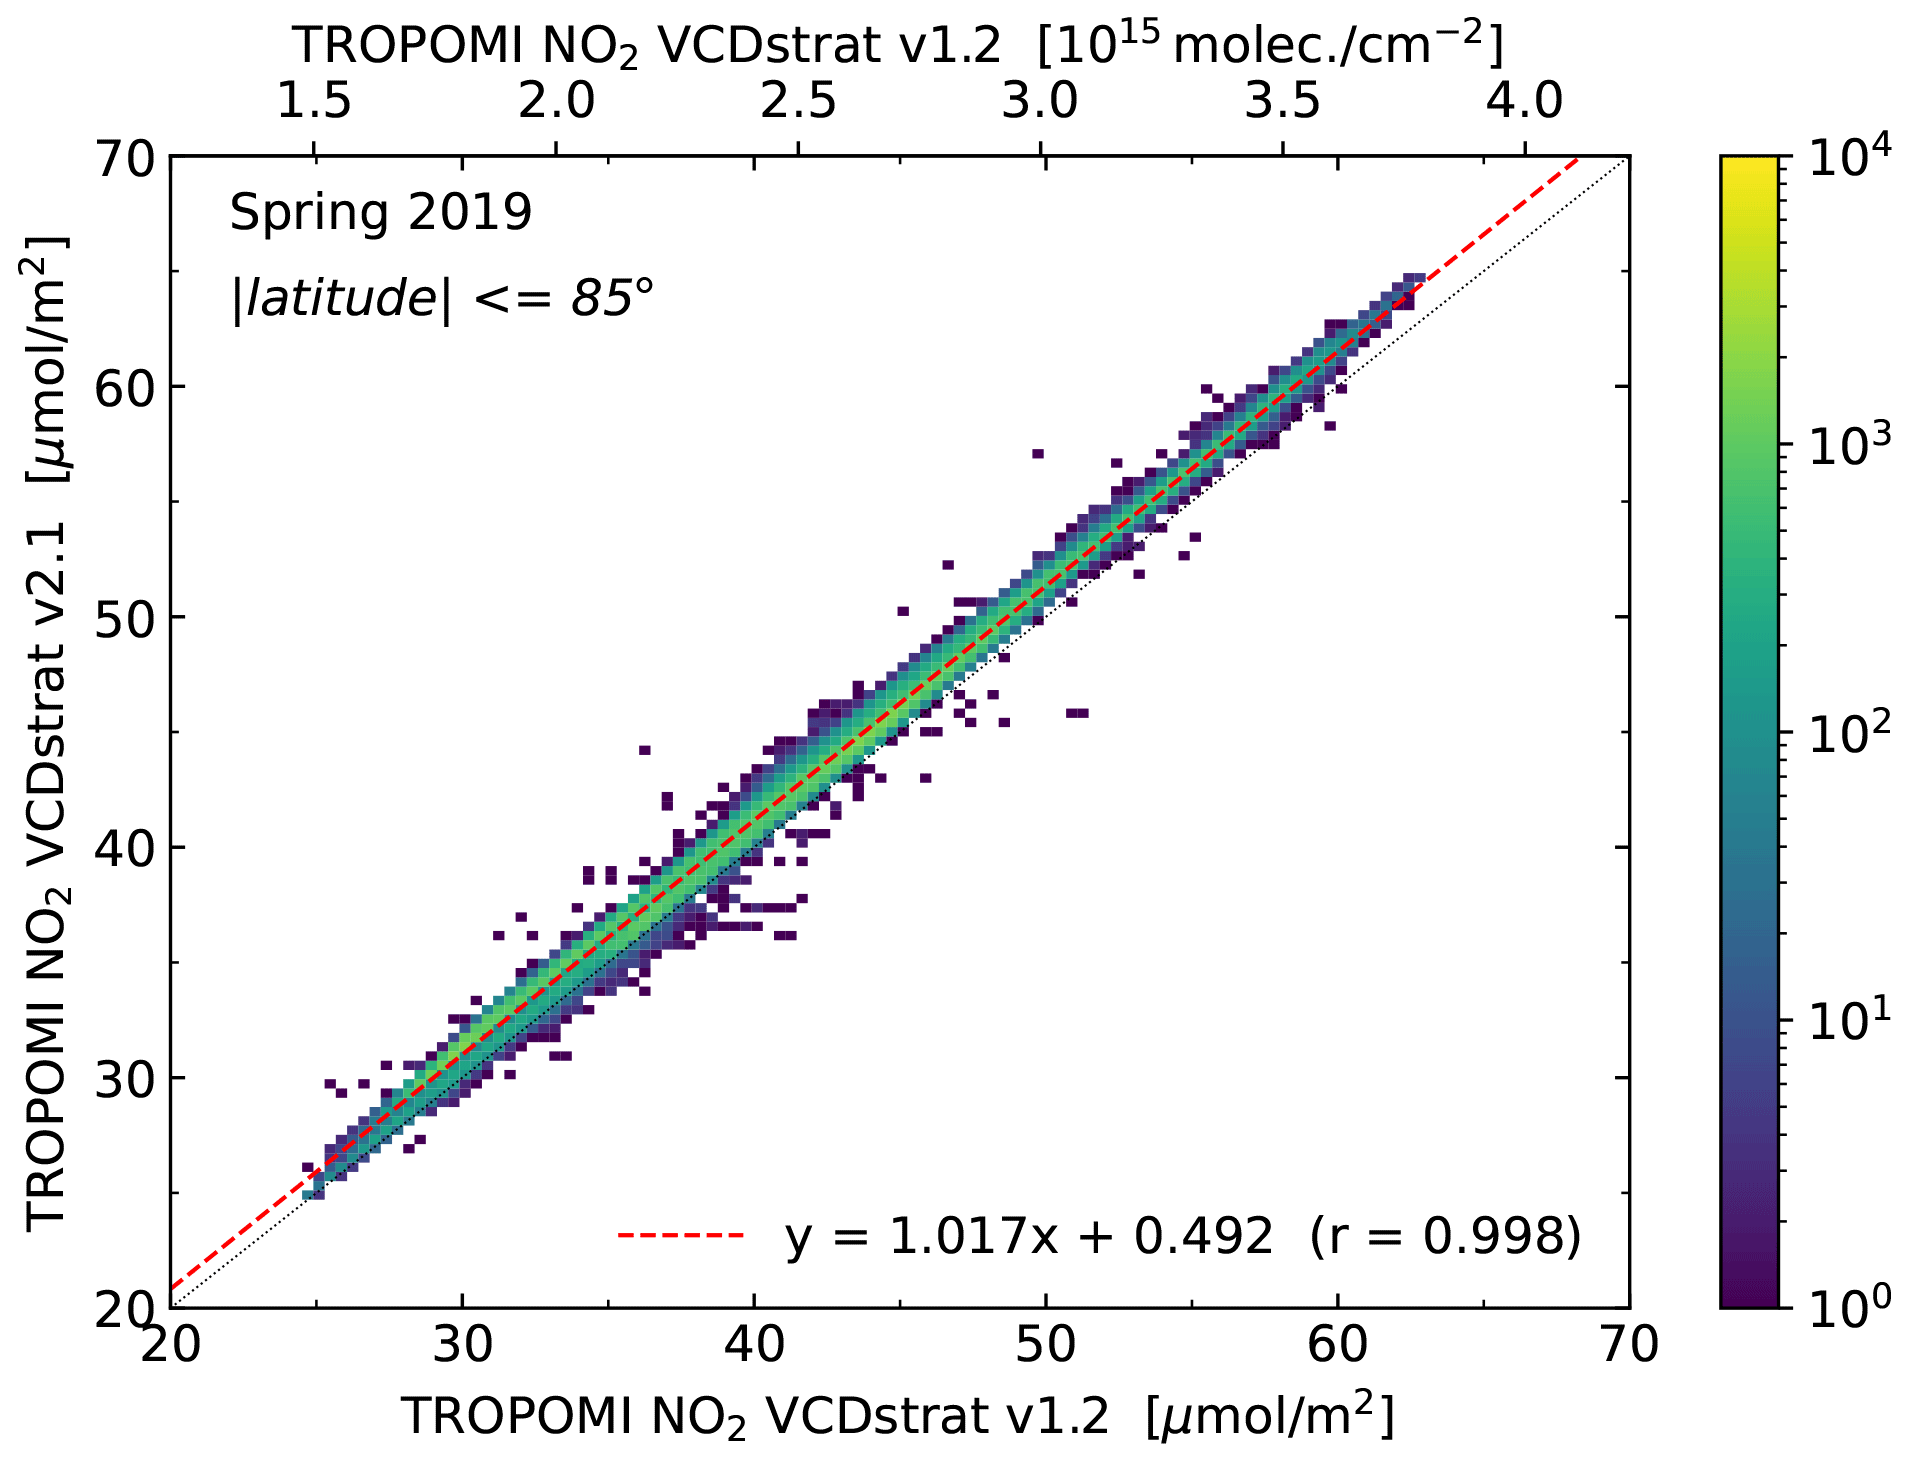
Figure 6Scatter plot of the TROPOMI v1.3 and v2.1 gridded NO2 stratospheric VCDs averaged over the spring 2019 VCD period of all ground pixels with valid retrieval with latitude ≤85∘. The linear fit coefficients and correlation coefficient are given in the legend.
Figure 6 shows a scatter plot of the v2.1 and v1.3 spring 2019 gridded average for all valid pixels with latitude <85∘, which shows that the worldwide average increase in for this period is about 0.50 µmol m−2 (0.30×10¹⁴ molec cm−2). For the other four test periods, the average increase ranges from 0.60 to 1.55 µmol m−2, all with slopes between 0.99 and 1.02. The other three DDS-2 periods have scatter similar to that seen in Fig. 6, while the autumn 2020 DDS-3 period has more scatter but still with high correlation (r=0.981). Scatter plots of the gridded GCD (not shown) reveal linear fits with slopes of 1.00 and offsets ranging from 0.73 to 1.04 µmol m−2, with little scatter for the four DDS-2 periods and more scatter for the DDS-3 period, all with high correlations (r>0.98). Note that linear fits mentioned in Sects. 3 and 4 are all performed with an orthogonal distance regression (ODR), i.e. taking into account that both datasets have uncertainties, rather than only the data along the y axis, while in Sect. 5 a different linear regression approach is used.
According to van Geffen et al. (2020) the NO2 SCDs of OMI and TROPOMI agree quite well, with TROPOMI a few percent higher than OMI, as a result of small differences in the DOAS retrieval details, and with OMI showing more scatter than TROPOMI due to its lower spatial resolution. The above-described minor changes in the TROPOMI SCD values imply that the same conclusion still holds. Linear fits in scatter plots of worldwide average gridded GCD v2.1 and OMI/QA4ECV data (not shown) for the five test VCD periods have slopes ranging from 0.98 to 1.03 and offsets between 1.27 and 2.57 µmol m−2, with high correlation (r>0.94). A more detailed slant column comparison with OMI, based on regional averages, can be seen in Fig. 14 (Sect. 4.4).
4.1 FRESCO cloud pressure and NO2 cloud fraction
The FRESCO+ algorithm (Wang at al., 2008) retrieves cloud information from the O2 A-band around 758 nm (cloud fraction and cloud pressure) as well as scene parameters assuming clear sky (scene albedo and scene pressure) and was developed for the GOME-2 instrument. Due to the high spectral resolution of TROPOMI compared to GOME-2, the fact that TROPOMI has a spectral smile (cf. Sect. 3.1), and because of TROPOMI's row-dependent instrument spectral response function (ISRF, known also as the slit function) with spectral shifts caused by inhomogeneous slit illumination, the FRESCO+ algorithm needed to be re-written, and the corresponding lookup tables needed to be generated once more. The resulting implementation is called FRESCO-S (short for FRESCO-Sentinel), and its cloud pressure data are used for the v1.2–v1.3 NO2 data product. Studies showed that the FRESCO-S cloud pressure is too high for some scenes, in particular for scenes with low cloud fractions and/or a considerable aerosol load (which the FRESCO algorithm sees as an effective cloud), in which case the cloud pressure is close to the surface pressure (cf. Compernolle et al., 2021; Eskes et al., 2022). The consequence of this is that the tropospheric NO2 VCD is too low for these scenes, as shown also in validation comparisons (see the Introduction).
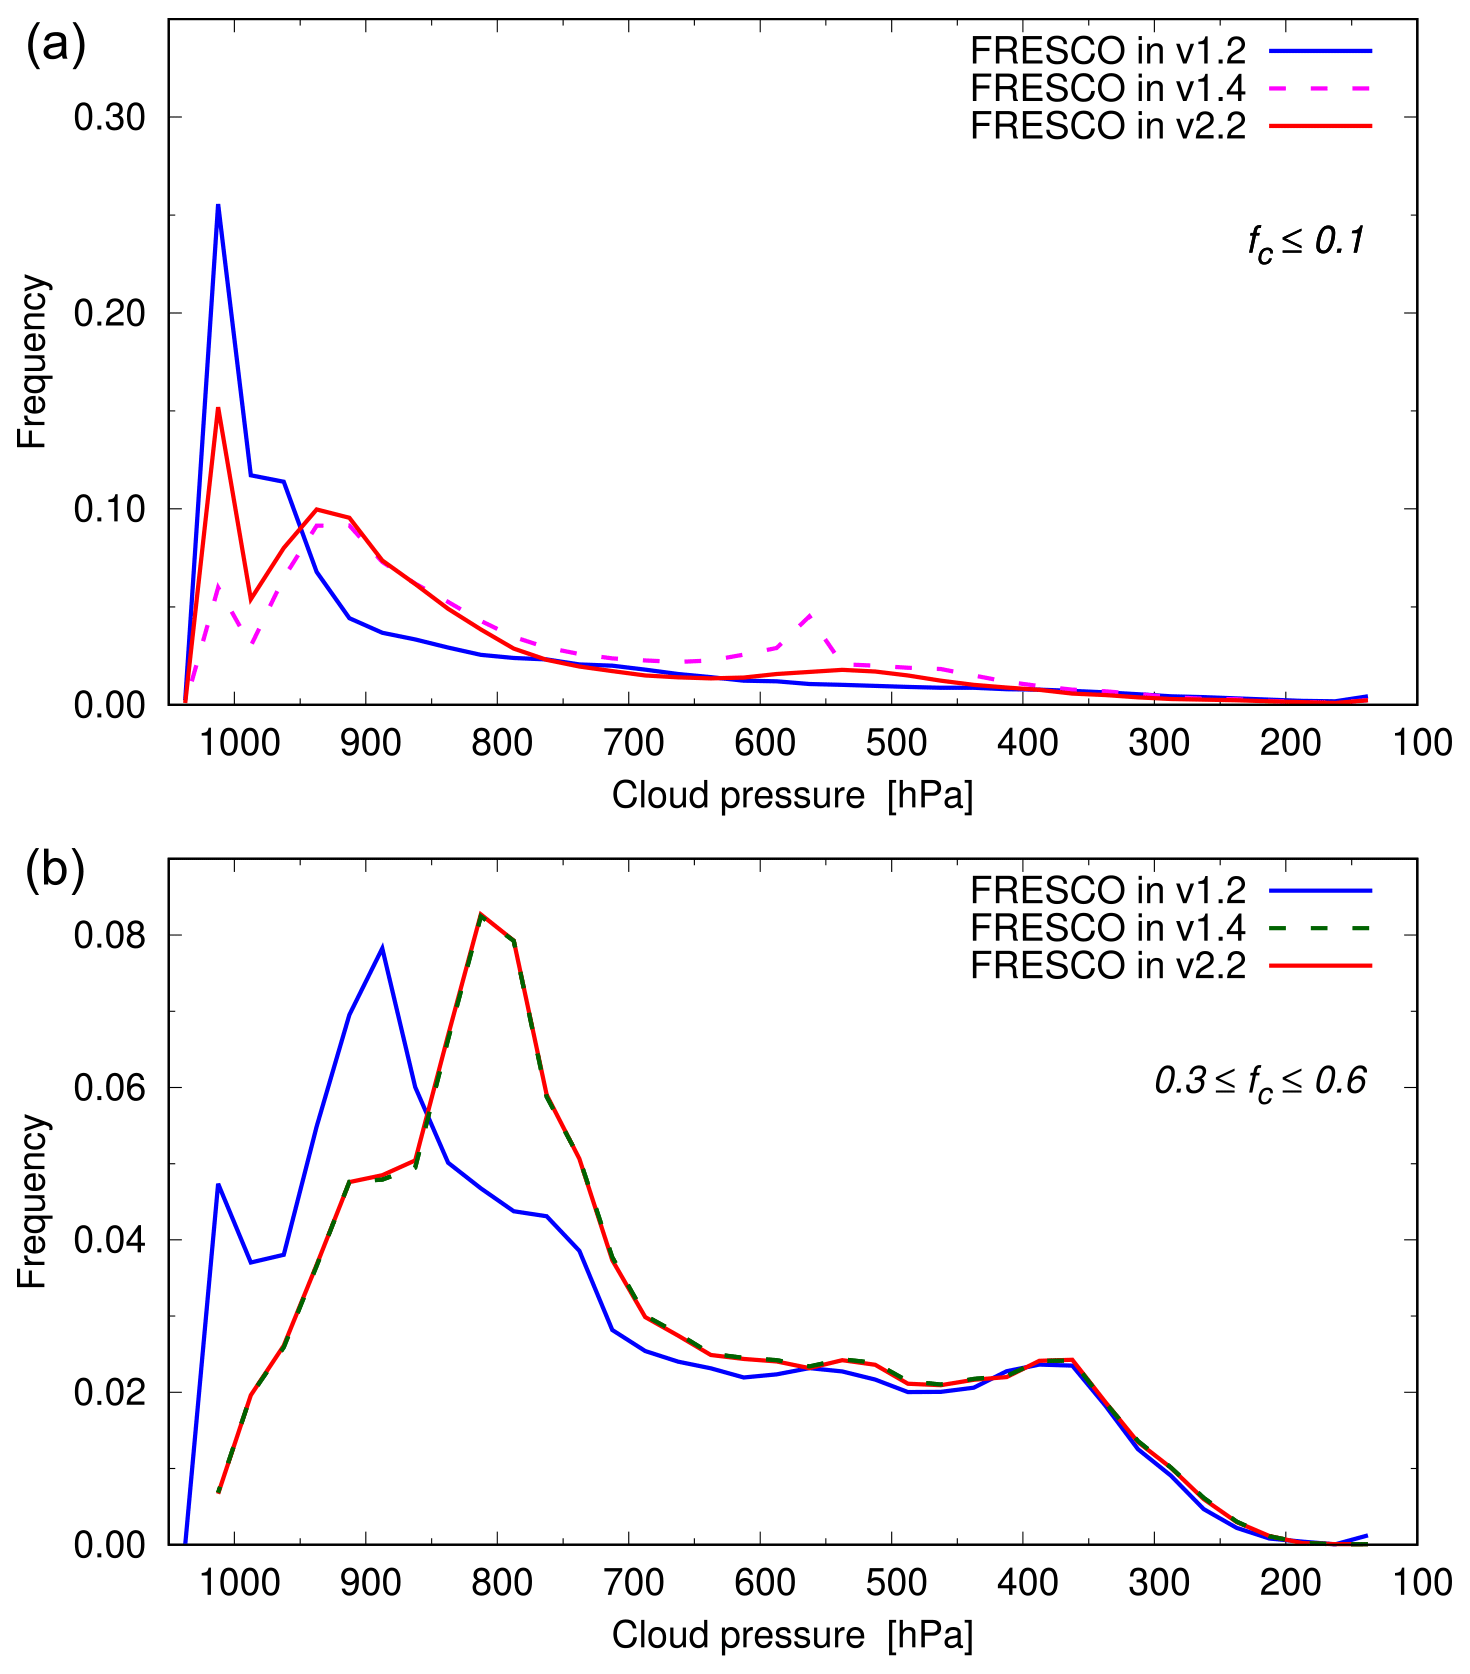
Figure 7Cloud pressure frequency distribution from orbit 03707 on 1 July 2018, considering only ocean and land ground pixels that are free of snow/ice, for small (a) and medium (b) cloud fractions, with a bin size of 25 hPa and fc the cloud fraction in the NO2 fit window. Shown are curves from the FRESCO retrievals in the public v1.2 data (solid blue lines), its implementation in the v1.4 framework with the use of level-1b v1.0 spectra (dashed magenta line), and with level-1b v2.0, i.e. from DDS-2 (solid red line). Note that in (b) the v1.4 and v2.2 lines overlap.
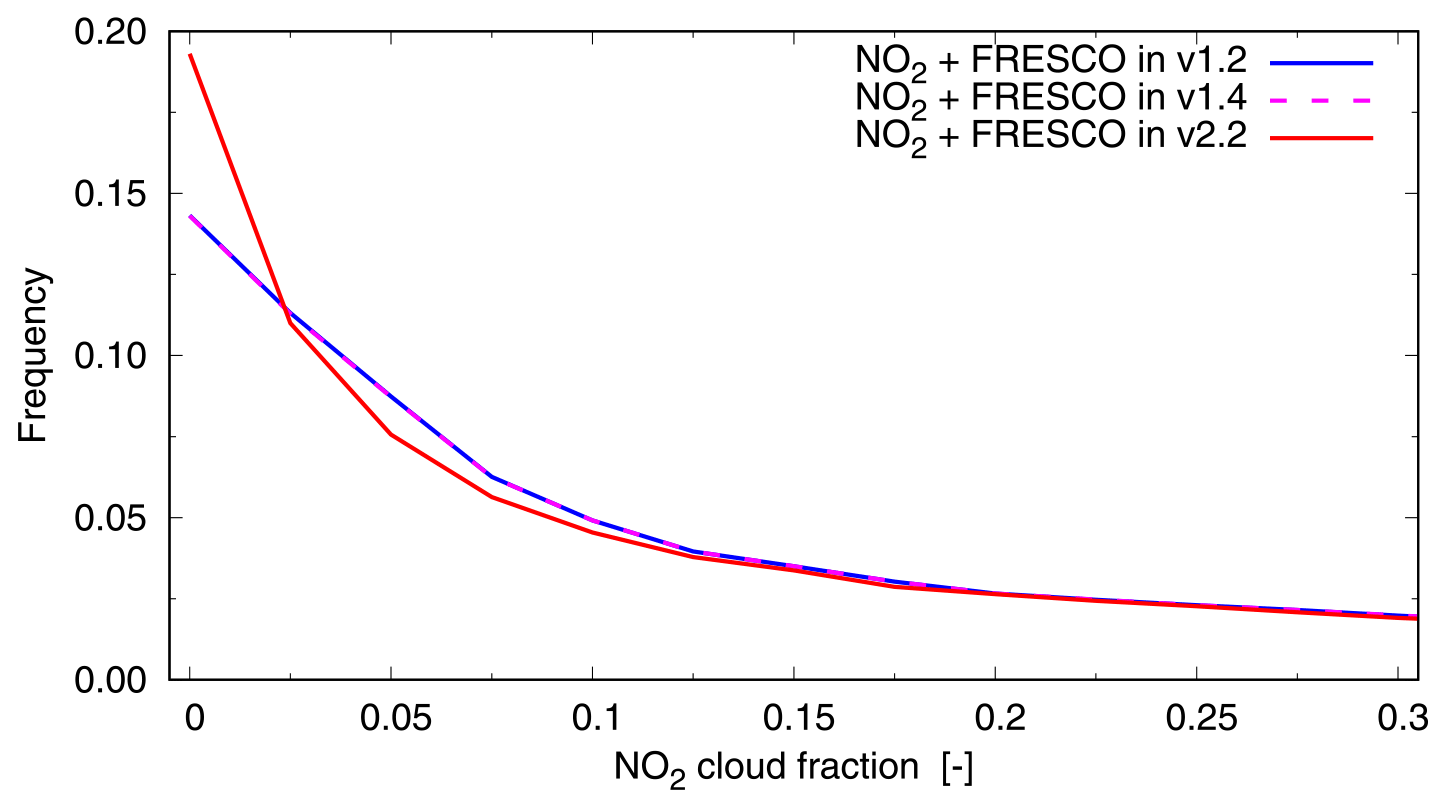
Figure 8Frequency distribution of the cloud fraction in the NO2 fit window from orbit 03707 on 1 July 2018, considering only ocean and land ground pixels that are free of snow/ice, with a bin size of 0.0025 and the first bin centred around 0.0, zooming in on the lower cloud fraction. Shown are curves from the NO2 cloud fraction using the FRESCO cloud pressure in the public v1.2 data (solid blue lines), its implementation in the v1.4 framework with the use of level-1b v1.0 spectra (dashed magenta line), and with level-1b v2.0, i.e. from DDS-2 (solid red line). Note that the v1.2 and v1.4 lines overlap in the figure: the difference between these two is less than 0.3 %.
FRESCO+ (Wang at al., 2008) makes use of the wavelength ranges 758–759, 760–761 and 765–766 nm. For the FRESCO-S implementation the first window, representing the continuum, was shifted a little to 757–758 nm. As a further improvement of the cloud retrieval, nicknamed FRESCO-wide, the third window is extended to 765–770 nm in order to include more of the weaker and narrower O2 absorption lines. This extension mainly impacts the lower clouds, generally decreasing the cloud pressure in the order of 50 hPa, and is relevant for all instruments where FRESCO has been applied. For high clouds the FRESCO versions deliver very similar cloud heights on average. Further details are given in the ATBD (van Geffen et al., 2021).
FRESCO-wide, used as of NO2 v1.4, provides a more realistic estimate of the cloud pressure for scenes with low cloud fractions: the cloud pressure is lower, i.e. the cloud is higher up, as a result of which the tropospheric AMFs decrease, which in turn leads to higher tropospheric NO2 VCDs. To a large extent, this closes the gap between the TROPOMI and validation data, though for certain cases a difference between the two datasets remains.
The FRESCO-wide approach is also used for the cloud pressure in v2.1 (DDS-2) and v2.2 (DDS-3 and its public data release) NO2 data but with the cloud data retrieved from the improved level-1b v2.0 spectra. Figure 7 shows the frequency distribution of the cloud pressure, cp, of a single orbit, considering only ground pixels identified as snow-/ice-free land and ocean by the snow/ice flag (cf. Sect. 4.2), in two cloud fraction regimes: small (fc≤0.1; panel a) and medium (; panel b), with fc the cloud fraction in the NO2 fit window. This example shows that the FRESCO-wide implementation in NO2 v1.4 indeed leads to lower cp; see also the recent study by Riess et al. (2022). The use of level-1b v2.0 in NO2 v2.2 has a smaller impact than the implementation of the FRESCO-wide approach for the lowest cloud fractions (panel a) and appears to lead to somewhat higher cloud pressures in that range. For the medium (panel b) and high (not shown) range cloud fractions, no change is visible due to the switch to level-1b v2.0 spectra.
Inspection of the frequency distribution of the NO2 cloud fraction (Fig. 8) reveals an increase in the number of fully cloud-free pixels in v2.2 at the expense of the number of pixels with small but non-zero cloud fractions due to the use of v2.0 level-1b spectra, while the improvement of the FRESCO cloud pressure in v1.4 has no visible impact on the cloud fraction distributions.
The cloud fraction used in the AMF and VCD steps of the processing is not taken from the FRESCO data but is directly calculated in the NO2 fit window at 440 nm. This NO2 cloud fraction is determined from the surface and cloud albedo (see Sect. 4.3), the surface pressure and the cloud pressure from FRESCO using a look-up table (LUT) that was made with a radiative transfer model (RTM), in the same manner as FRESCO (Wang at al., 2008) determines the cloud fraction in combination with the top-of-atmosphere reflectance RTOA at 440 nm (van Geffen et al., 2021).
The procedure to determine RTOA has changed. In pre-v2.1 data it is determined by averaging the measured reflectance Rmeas over 1 nm around 440 nm. As of v2.1 it is determined as follows:
where P(λ) is the DOAS fit polynomial and Cring is the Ring effect fit parameter, i.e. RTOA is determined from the modelled reflectance Rmod without the terms for the absorption by the trace gasses (for definitions and details of the DOAS fit, see van Geffen et al., 2020). This correction makes RTOA consistent with the fact that the cloud LUT was constructed without trace gas absorption. Because trace gas absorption is in general a negative contribution to Rmod, the v2.1 approach leads to somewhat higher reflectances and hence to somewhat higher cloud fractions. This impact, however, is so small that it does not really show up among the other changes that affect the NO2 cloud fraction.
4.2 Snow/ice flag
It is important to have information on the presence of snow or ice in a given satellite ground pixel, so that if necessary the climatological surface albedo can be adjusted or the AMF calculation can switch from using the cloud fraction and cloud pressure to the use of the effective scene pressure and effective scene albedo (assuming fc=0), because the cloud algorithm has difficulty distinguishing clouds above snow/ice (cf. Eskes et al., 2022; van Geffen et al., 2021).
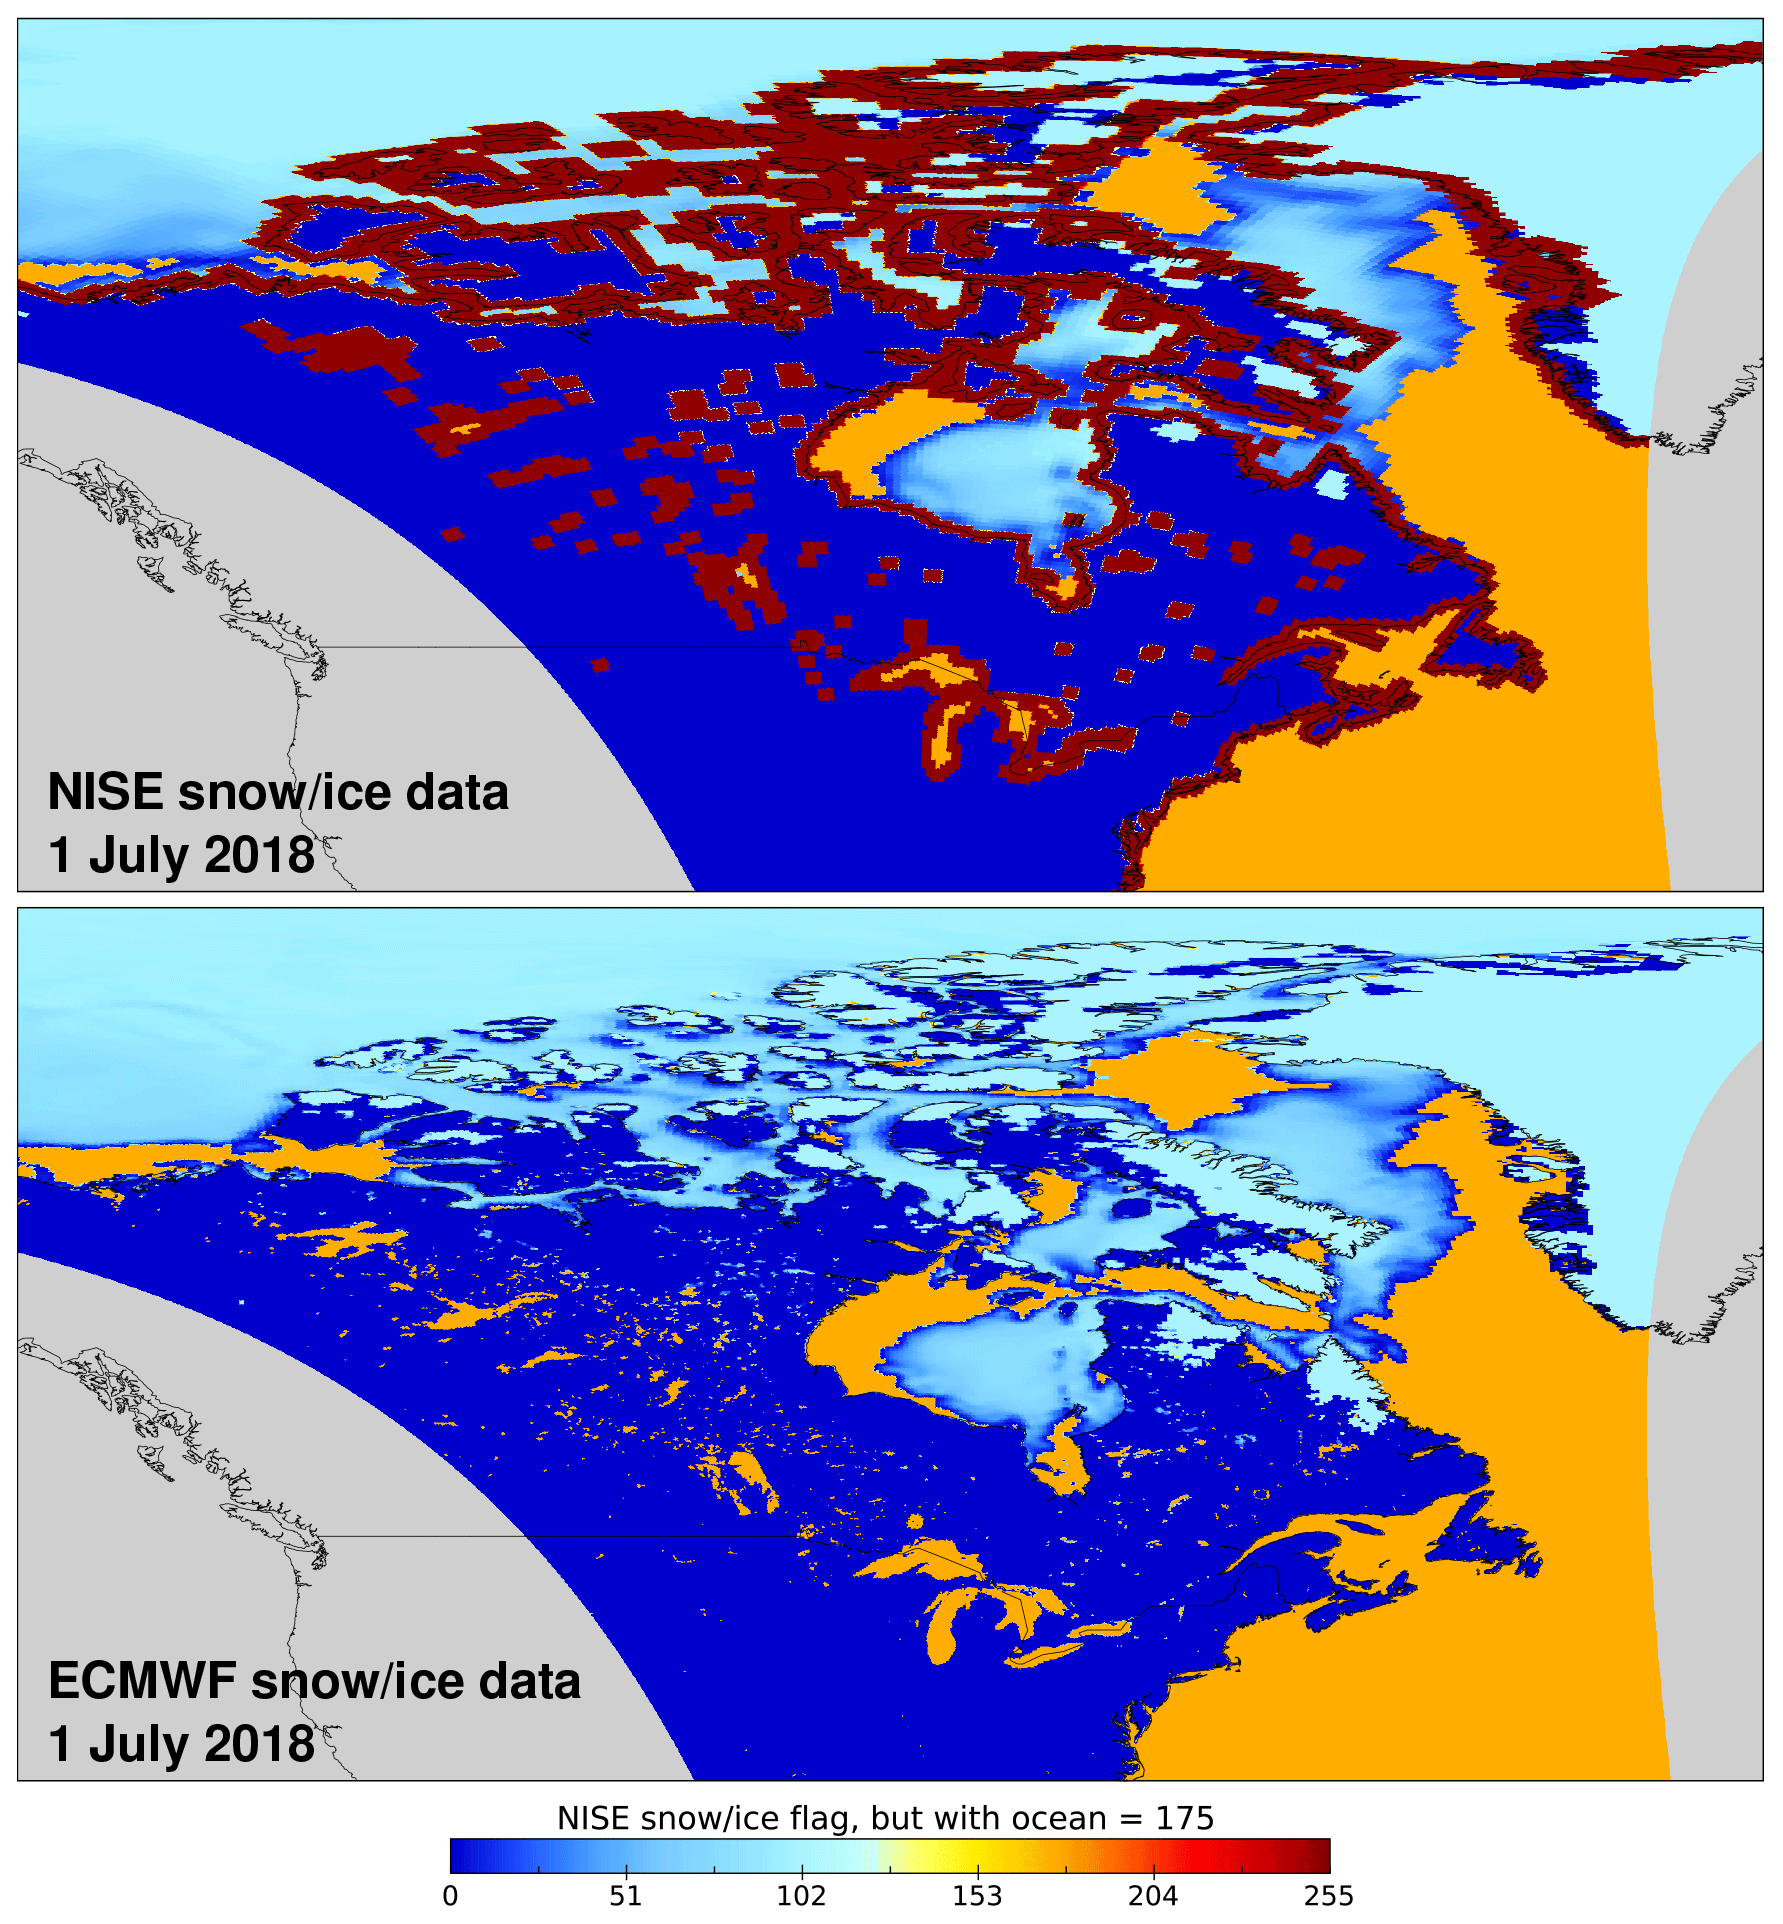
Figure 9Snow/ice flag comparison for the ground pixels of orbits 03707 and 03708 of 1 July 2018 based on NISE (top panel) and ECMWF (bottom panel) snow/ice cover data. The NISE coding for the flags is used, except that “ocean” is coloured with orange (value 175) instead of red for its flag value 255 so as to clearly distinguish it from the flags 252 (mixed pixels at coastlines), 253 (suspect ice value) and 254 (error); the latter three do not occur in the ECMWF data. Other flag meanings are 0: snow-free land, 1–100: percentage sea ice, 101: permanent ice, and 103: snow. The depicted area is longitude [−140 to −40∘], latitude [+35 to +85 ∘].
To this end the v1.2–v1.4 processing uses the daily snow/ice cover database from NISE (Brodzik and Stewart, 2016). The NISE data, however, appear to suffer from a number of problems: they have a rather coarse spatial resolution, for a given day they are based on an average over a few days, and they have problems determining snow/ice content around coastlines. The latter is in particular problematic at high latitudes where snow/ice coverage may be important, while short-term snow episodes occurring at mid latitudes may be missed due to the averaging over multiple days.
As of v2.1 the snow/ice information is taken from the daily ECMWF meteorological data, which solves the issues with NISE, thus improving the reliability of the NO2 data. The ECMWF snow data (De Rosnay et al., 2015) are derived from synoptic data and from the Interactive Multi-sensor Snow and Ice Mapping System (IMS); Cooper et al. (2018) show that the IMS has better agreement with in situ observations over North America and that NISE misses a significant number of snow-covered pixels.
Figure 9 shows an example over Canada of the two snow/ice flag datasets, where the NISE flag numbering is used, except that the ice-free ocean has been given the colour orange (value 175) instead of red for its flag value 255, so as to distinguish it from the problematic NISE flags 252–254. The cloud fraction and cloud pressure are used for the AMF calculation for pixels flagged as ocean (255), snow-free land (000) or a percentage sea-ice flag smaller than 006 for the ECMWF data (in case of NISE data this was smaller than 002, since NISE has the tendency to underestimate snow/ice cover); in case of other flags the scene parameters are used.
Another issue solved with the switch to the ECMWF snow/ice data is that the NISE data over shallow water areas that may run dry during low tide can be wrong. Over the western part of the Waddenzee in the Netherlands, for example, NISE gives on 1 January 2019 3 % sea ice, whereas this area cannot possibly have any sea-ice: the ECMWF data correctly identify pixels as ocean (flag value zero). Because of this corrected identification, the NO2 surface albedo is adjusted from the value of 0.62 in the climatology to a more realistic 0.04. Such adjustments are made only in for cases without any snow or ice reported.
4.3 Surface and cloud albedo
The surface albedo in the NO2 fit window, used in e.g. the computation of the cloud fraction and the AMF (van Geffen et al., 2021), is taken from the 5-year version of the OMI Lambertian-equivalent reflectivity (LER) climatology (Kleipool et al., 2008) at 440 nm, which is given on a grid of , where the “mode LER” is used.
The cloud fraction, fc, is determined in the NO2 fit window at 440 nm following the same approach FRESCO (Wang at al., 2008) uses for the cloud retrieval in the O2 A-band, with an assumed cloud albedo Ac=0.8. On physical grounds fc lies within the range [0:1]. If the actual surface albedo, As, is lower than expected from the climatology, the cloud retrieval leads to fc<0. Up to v1.4 this was clipped to zero, whereas as of v2.1 the As is adjusted (decreased) to match fc=0 and thus ensure radiative closure. Similarly, in case of very bright clouds the cloud retrieval leads to fc>1, which is no longer clipped, but instead the cloud albedo, Ac, is adjusted (increased) to ensure radiative closure with fc=1. (For details, see van Geffen et al., 2021, Appendix C.) This approach of adjusting the surface or cloud albedo to keep the cloud fraction within [0:1] was implemented in the FRESCO cloud retrieval in processor v1.3, leading to more realistic cloud pressures (see the PRF; Eskes and Eichmann, 2021). With the same implementation in use for the NO2 cloud fraction, the treatment is consistent.
Figure 10 shows as an example a map of the difference “v2.1 minus v1.2” in the NO2 surface albedo for a part of an orbit. A lower surface albedo leads to a smaller AMF and thus to a higher tropospheric NO2 VCD. Figure 11 shows for the full orbit the relationship between the NO2 tropospheric VCD of v2.1 (vertical axis) and v1.2 (horizontal axis), considering only ground pixels for which the cloud retrieval gives a cloud fraction fc<0.001 (i.e. effectively zero) and thus for which the surface albedo may have been reduced in v2.1: the tropospheric VCD increases by about 15 %, as the linear fit in Fig. 11 shows. The increase is larger for higher VCDs: for tropospheric VCDs <100 µmol m−2 (6×10¹⁵ molec cm−2) the increase is about 10 % (linear fit: ). This increase is partly related to the use of level-1b v2.0 (ir)radiance spectra as input in the v2.1 processing; a test processing of the orbit with v2.2 (not shown) reveals that level-1b v2.0 spectra give a tropospheric VCD that is about 5 % higher than level-1b v1.0 spectra (linear fit over all positive VCDs: , correlation coefficient: r=0.999). A similar increase is found when looking at the ground pixels for which the cloud radiance fraction (, r=0.982).
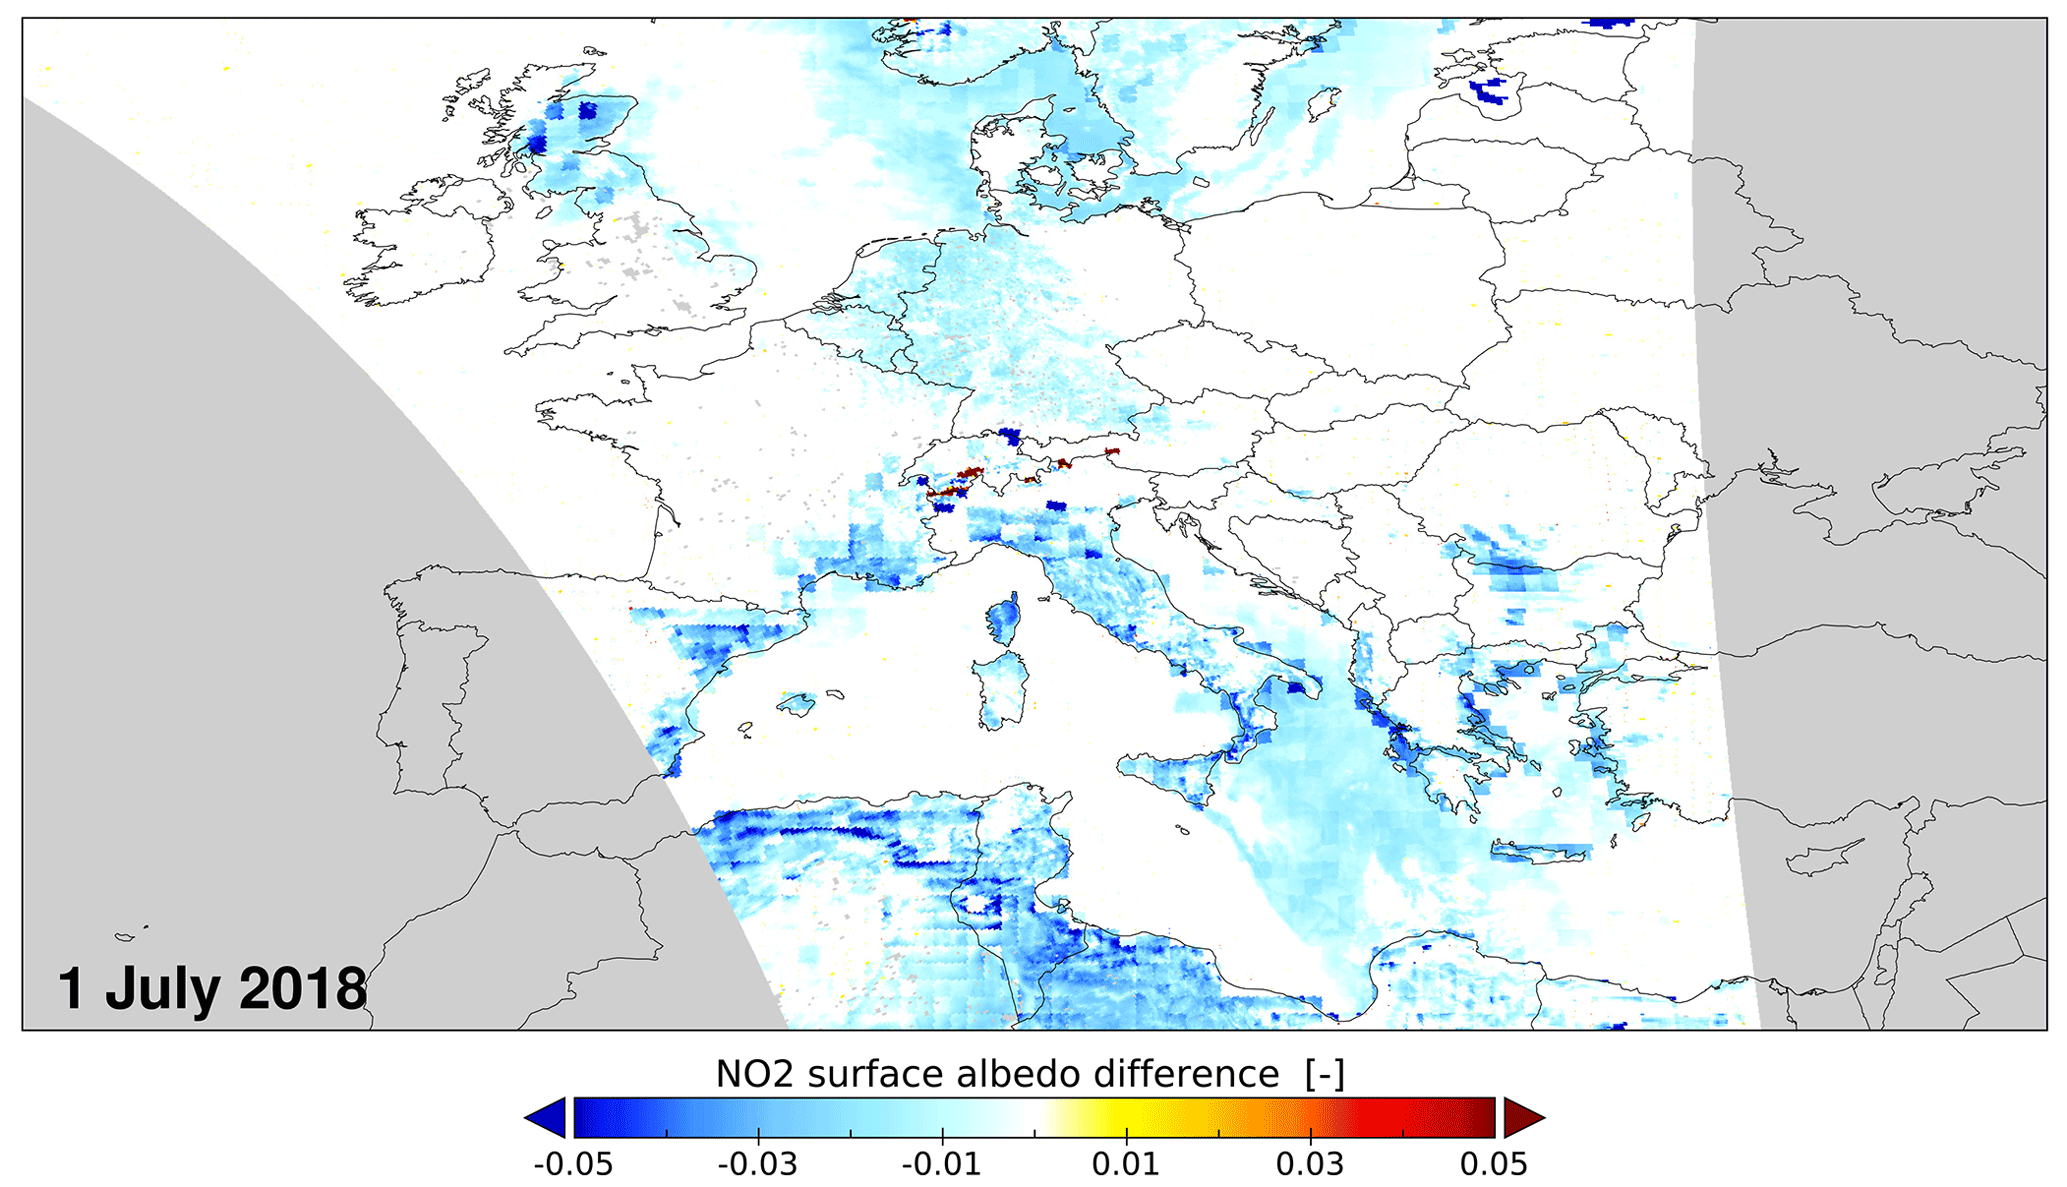
Figure 10Map of the TROPOMI NO2 surface albedo difference “v2.1 minus v1.2” of a part of orbit 03704 of 1 July 2018. See the text for further details. The depicted area is longitude [−20 to +40∘], latitude [+30 to +60∘].

Figure 11Comparison of the TROPOMI NO2 tropospheric VCD of orbit 03704 of 1 July 2018, showing all ground pixels for which both the v1.2 and v2.1 cloud retrievals give zero cloud fraction, i.e. for which the surface albedo may have been adjusted and the tropospheric VCD was found to be positive. See the text for further details. The linear fit coefficients and correlation coefficient are given in the legend.
Table 5Results of linear fit and correlation coefficients (r) of scatter plots of gridded NO2 tropospheric VCD () averaged over the VCD part of the DDS periods using ground pixels with cloud radiance fraction wc<0.50 and latitude ≤85∘. TROPOMI v1.x or OMI/QA4ECV data are along the x axis, and TROPOMI v2.x is along the y axis; the offset, given in µmol m−2, is much smaller than typical column values. The first set of TROPOMI data uses grid cells with all values, while the second set and the OMI set use only grid cells with µmol m−2.
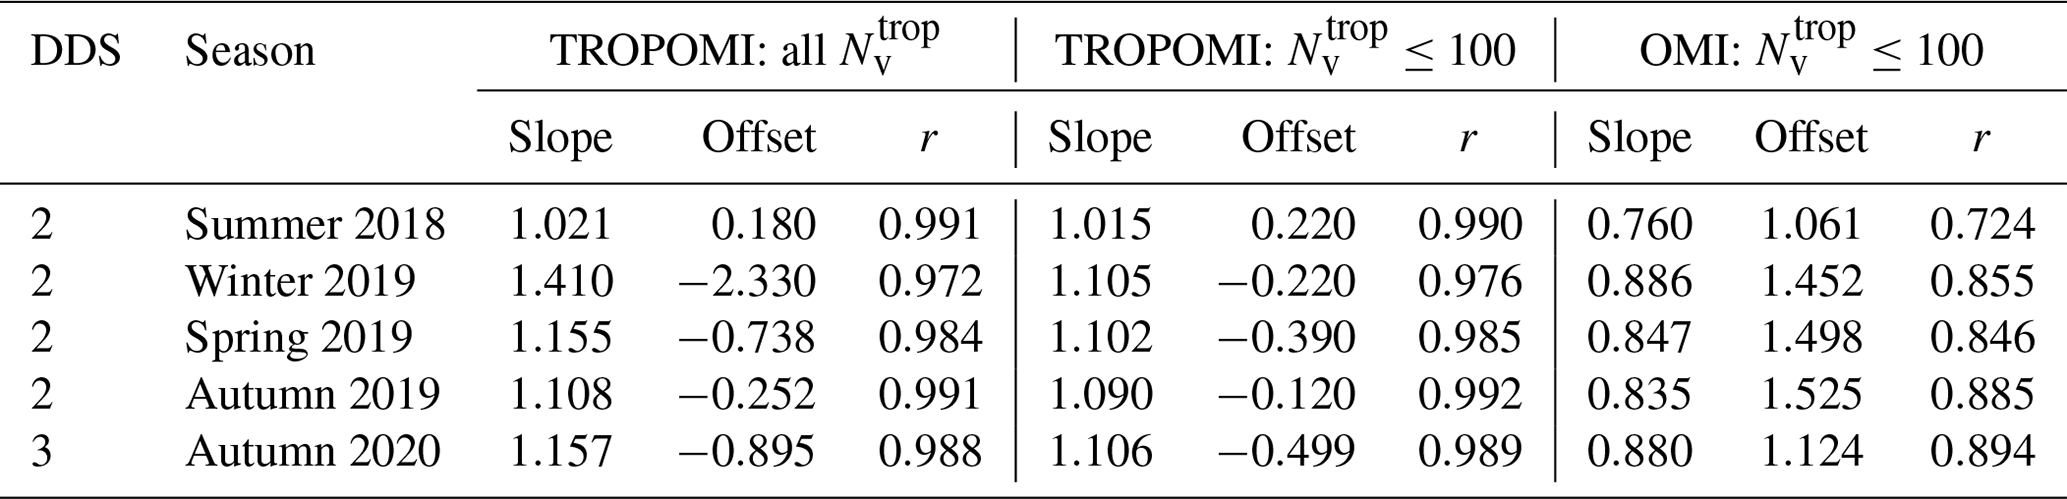
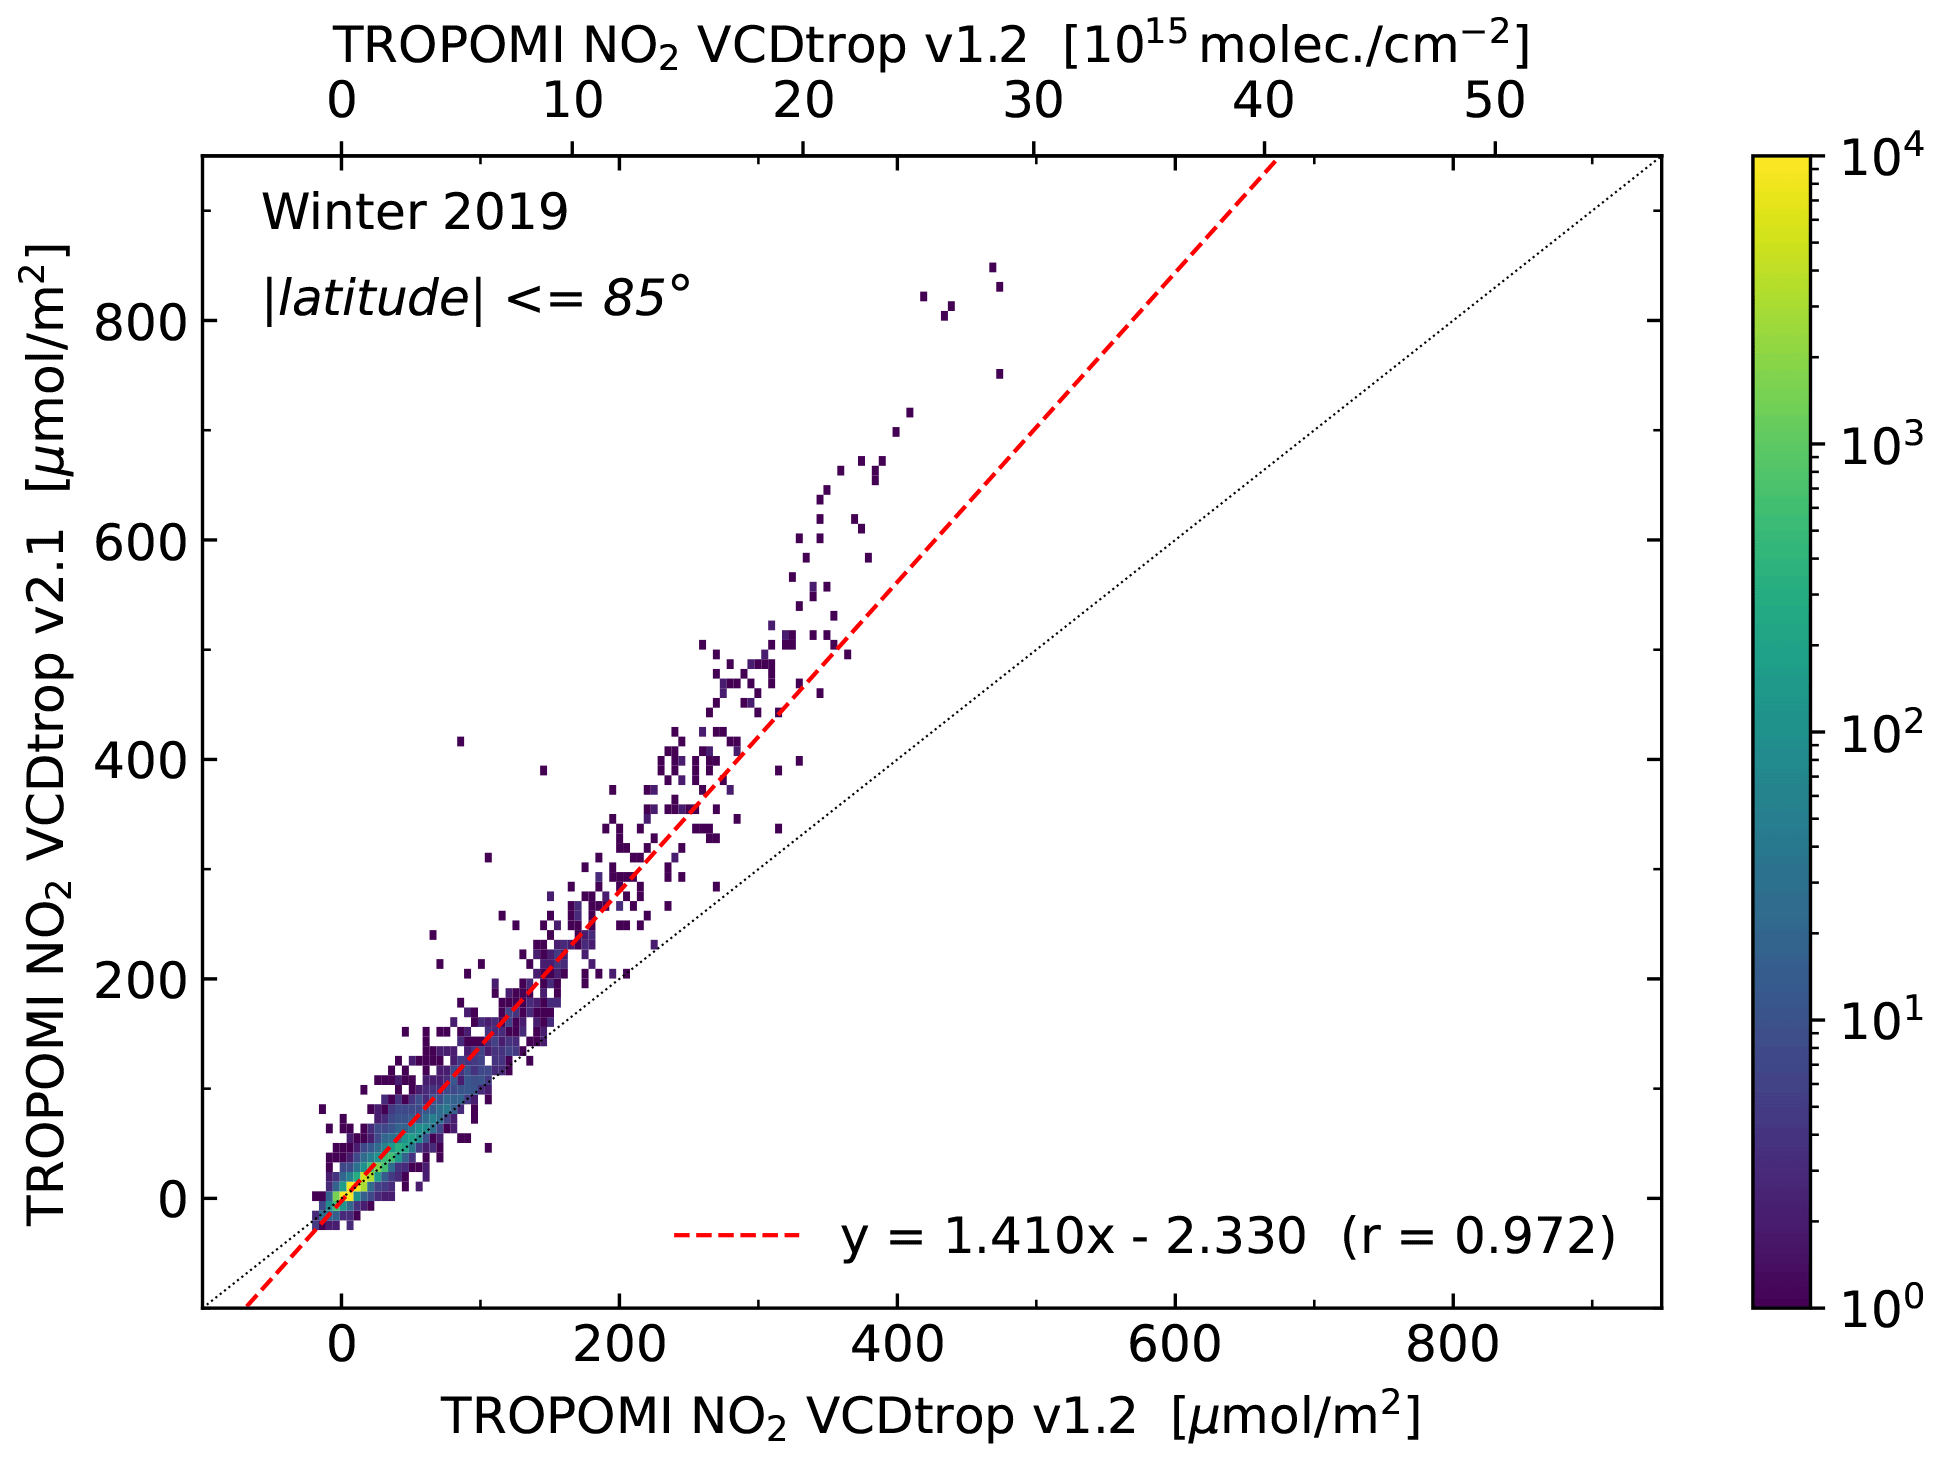
Figure 12Scatter plot of the TROPOMI v1.2 and v2.1 gridded NO2 tropospheric VCDs averaged over the winter 2019 VCD period of ground pixels with cloud radiance fraction wc<0.50 and latitude ≤85∘. The linear fit coefficients and correlation coefficient are given in the legend.
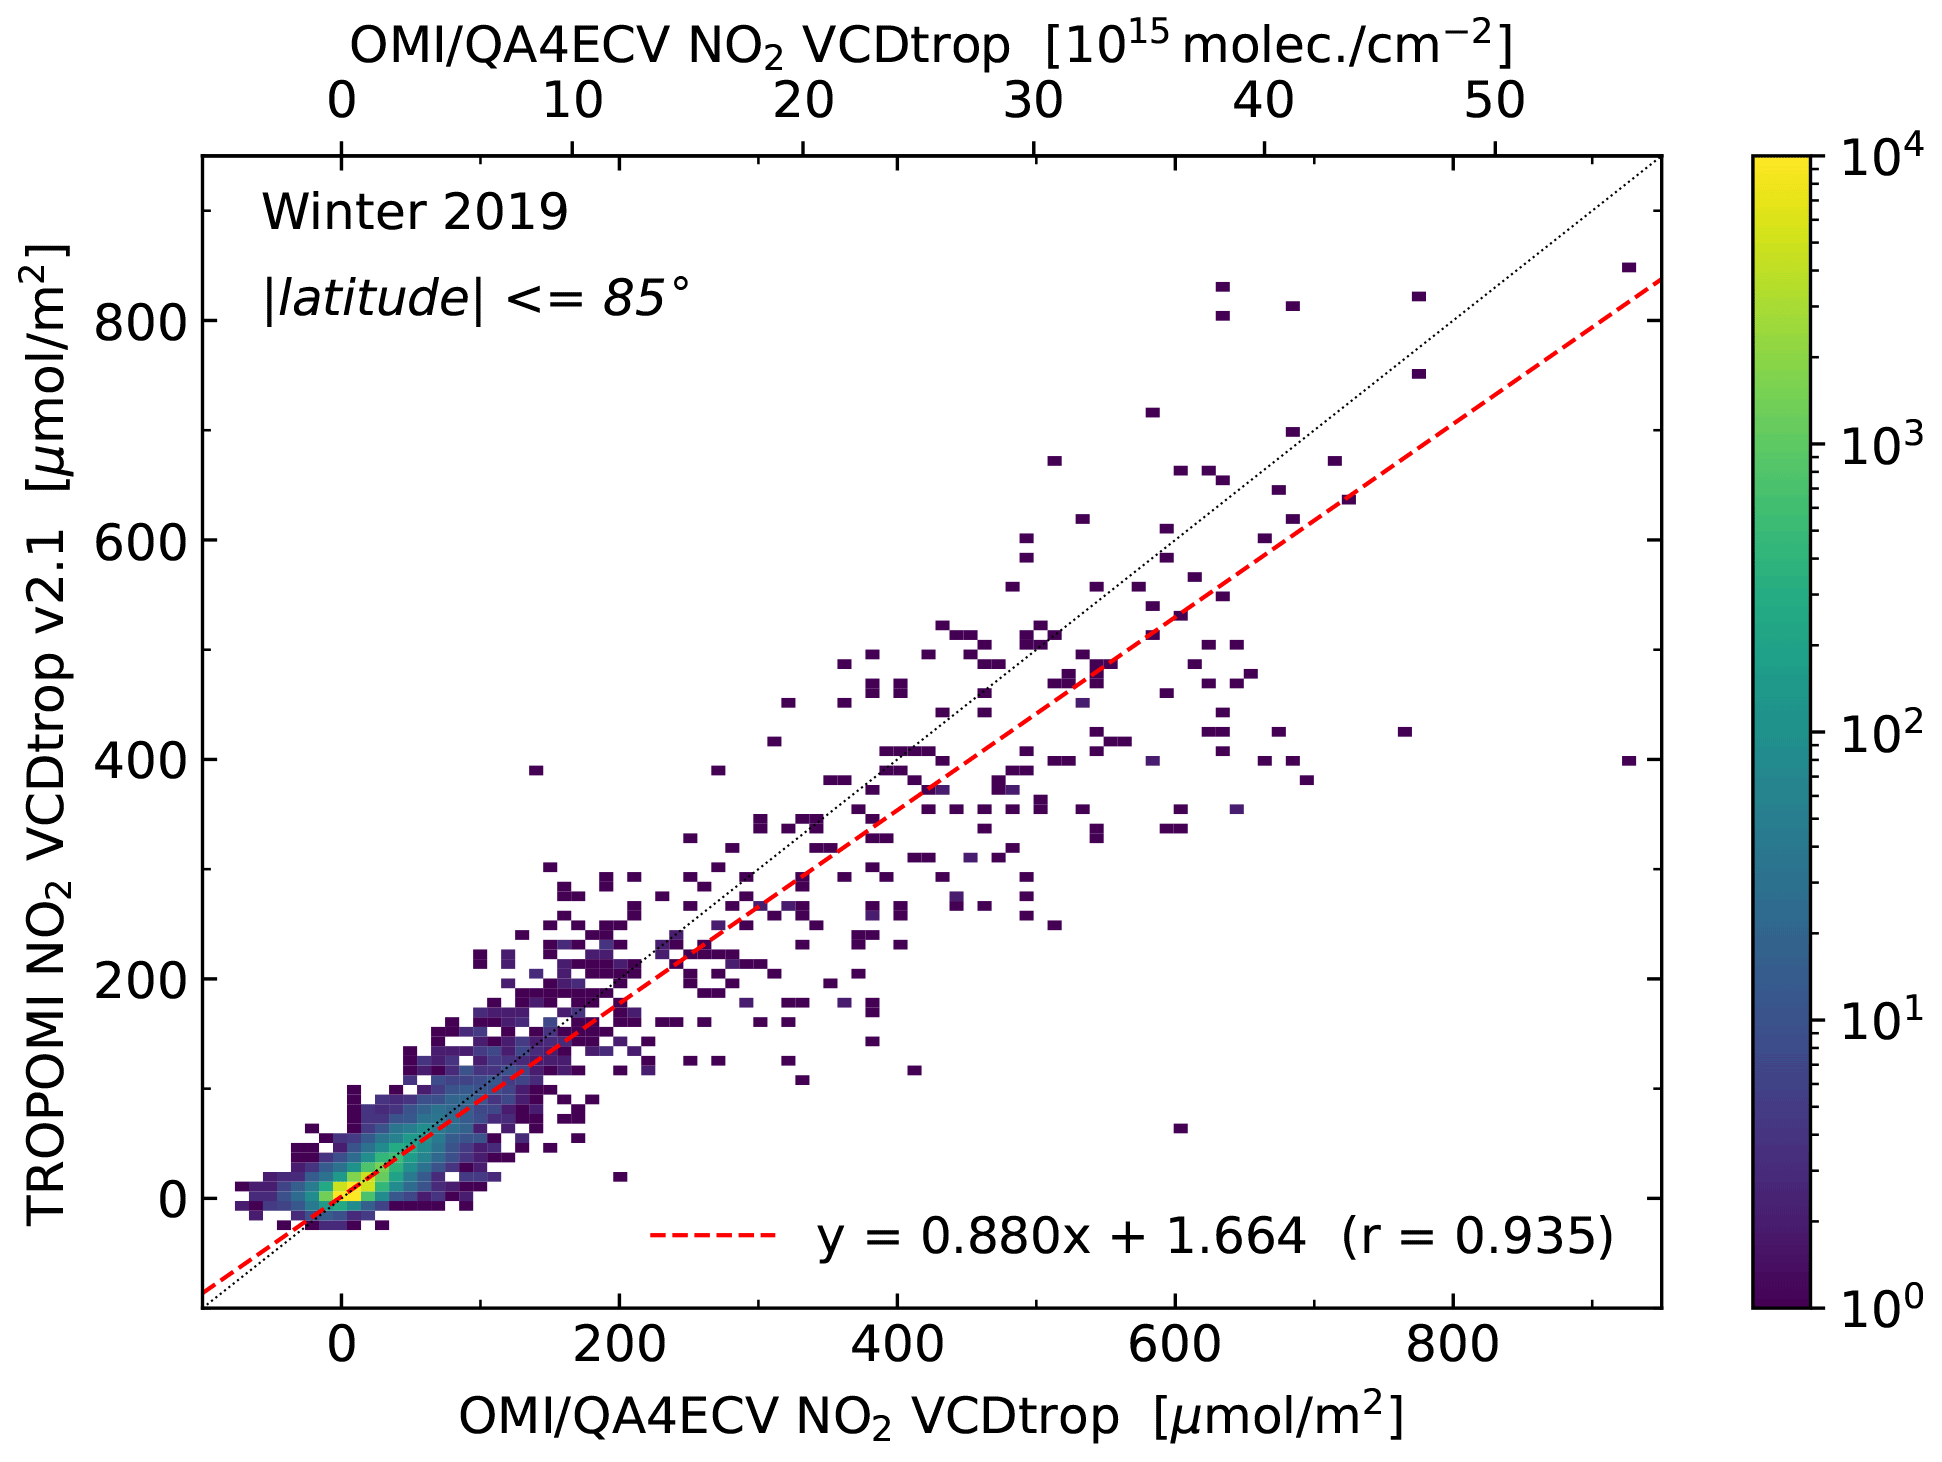

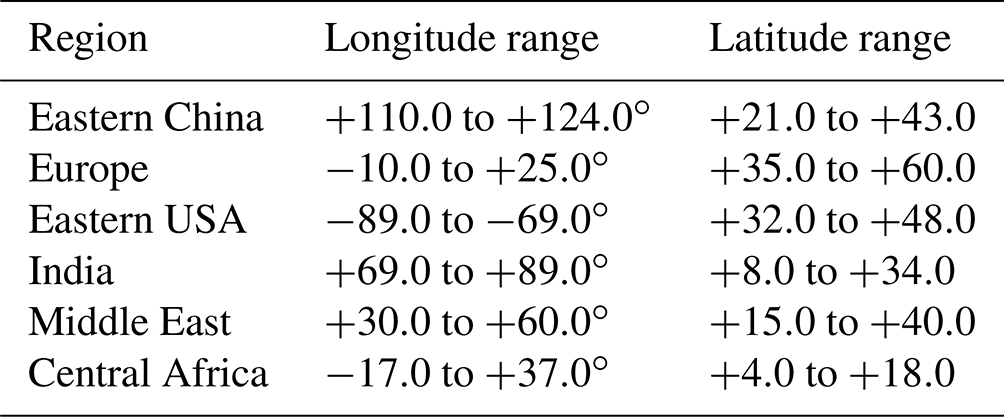
Figure 14Regional averages of the gridded NO2 tropospheric VCD (solid red lines) and GCD (dashed green lines) averaged over the VCD part for the five DDS periods of TROPOMI v1.x (filled symbols) and v2.1 (open symbols) divided by the respective averages of OMI/QA4ECV data. Note the difference in y-axis range of the upper and lower panels. The regions are defined in Table A1.
4.4 Impact on tropospheric VCD results
The impact of processor changes on the tropospheric VCD data is dominated by the update of the FRESCO cloud retrieval, mentioned in Sect. 4.1, as of v1.4: the other updates in the NO2 processor and the inclusion of the level-1b v2.0 spectra come on top of that. Unfortunately none of the DDS periods covers v1.4 data, which means that a differentiation of the results before and after the FRESCO-wide update is not possible without also including the other updates in the NO2 algorithm.
The bottom row of Fig. 5 shows example maps of the
tropospheric VCD () of v2.1 and the difference
between DDS and OFFL data, based on all ground pixels with valid retrieval,
i.e. including cloudy pixels.
For a good comparison of data versions it is,
however, better to consider only (nearly) cloud-free ground pixels with
wc<0.50 (qa_value >0.75), which amounts to cloud fractions of about 0.2 and less.
With this filtering and only 7 or 10 d of data for the average gridded
data, the results are somewhat more noisy than those presented in
Sect. 3.3.
The bottom right panel of Fig. 5 shows some land–sea contrasts in the tropospheric VCD difference: sources of large NO2
concentrations are on land, and the difference between the two retrievals, which is chiefly caused by cloud pressure differences, scales with the
NO2 column value.
Figure 12 shows a scatter plot of the v2.1 and v1.3 winter 2019 gridded average for all ground pixels with wc<0.50 and latitude . The period is chosen as an example because it clearly shows that a linear fit through all the data is dominated by high tropospheric columns: limiting the linear fit to µmol m−2 (6×10¹⁵ molec cm−2) gives a slope of 1.105 rather than 1.410. Table 5 lists the results for the linear fits of the five DDS periods, as in Fig. 12, for all and for µmol m−2.
From Fig. 12 and Table 5 it is clear that the average increases with the improvements in the algorithm. With this increase, the TROPOMI data lie closer to the OMI/QA4ECV tropospheric VCD, as shown in Fig. 13 and the last three columns of Table 5. To further investigate the changes in the TROPOMI data, Fig. 14 shows comparisons of averages over selected regions (defined in Table A1) of the gridded tropospheric VCD (red solid lines) and the GCD (green dashed lines), where the TROPOMI averages are divided by the OMI/QA4ECV averages. Clearly, TROPOMI v2.x gives higher tropospheric VCDs than v1.x, in particular for the winter periods in polluted areas (upper panels in Fig. 14). In most cases the TROPOMI v2.x tropospheric VCD lies closer to OMI than TROPOMI v1.2.
It should be noted here that the OMI/QA4ECV processing does not apply the albedo adjustment discussed in Sect. 4.3 to the OMI data, which means that for these cases the difference with TROPOMI data may now be underestimated. This issue does not affect the improvement of TROPOMI data with regard to ground-based measurements. (The forthcoming collection-4 OMI NO2 reprocessing will contain the albedo adjustment algorithm of TROPOMI.)
To assess the impact of the processor changes on the NO2 VCD data through ground-based validation, both the operational OFFL and the updated DDS data of the five DDS periods for which VCD data are available (cf. Table 1) are compared for three sets of ground-based measurements provided by monitoring networks.
-
NO2 stratospheric column data measured by zenith-scattered-light differential optical absorption spectroscopy (ZSL-DOAS) instruments from the Network for the Detection of Atmospheric Composition Change (NDACC) (Solomon et al., 1987; Pommereau and Goutail, 1988; Kreher et al., 2020)
-
NO2 tropospheric column data from multi-axis DOAS (MAX-DOAS) instruments (Hönninger et al., 2004; Hendrick et al., 2014; Kanaya et al., 2014; Kreher et al., 2020; Pinardi et al., 2020)
-
NO2 total column data from Pandora direct-Sun instruments (Herman et al., 2009, 2019) from the Pandonia Global Network (PGN)
The validation approach is described in Verhoelst et al. (2021). For practical reasons, only the NDACC ZSL-DOAS measurements acquired at sunset were used here for the stratospheric comparisons, after a model-based photo-chemical adjustment of the ground-based twilight column to the satellite overpass time. To ensure robustness of the validation results despite the small size of the DDS data periods, only sites offering at least five co-located data pairs were retained. No harmonisation using averaging kernels nor a priori profiles was performed. More details on ground-based datasets, including station details, and the comparison methodology can be found in Verhoelst et al. (2021), Compernolle et al. (2020), Pinardi et al. (2020), and Kumar et al. (2020).
Ground-based validation results are presented here in the commonly used unit Pmolec cm−2, where 1.0×10¹⁵ molec cm−2 is equal to mol m−2 in SI units. In contrast to the use of ODR for linear fits in Sects. 3 and 4, here two cases of ordinary least squares fits are used: y vs. x and x vs. y, thus considering two limiting cases of attributing all error variances to y and x, respectively.
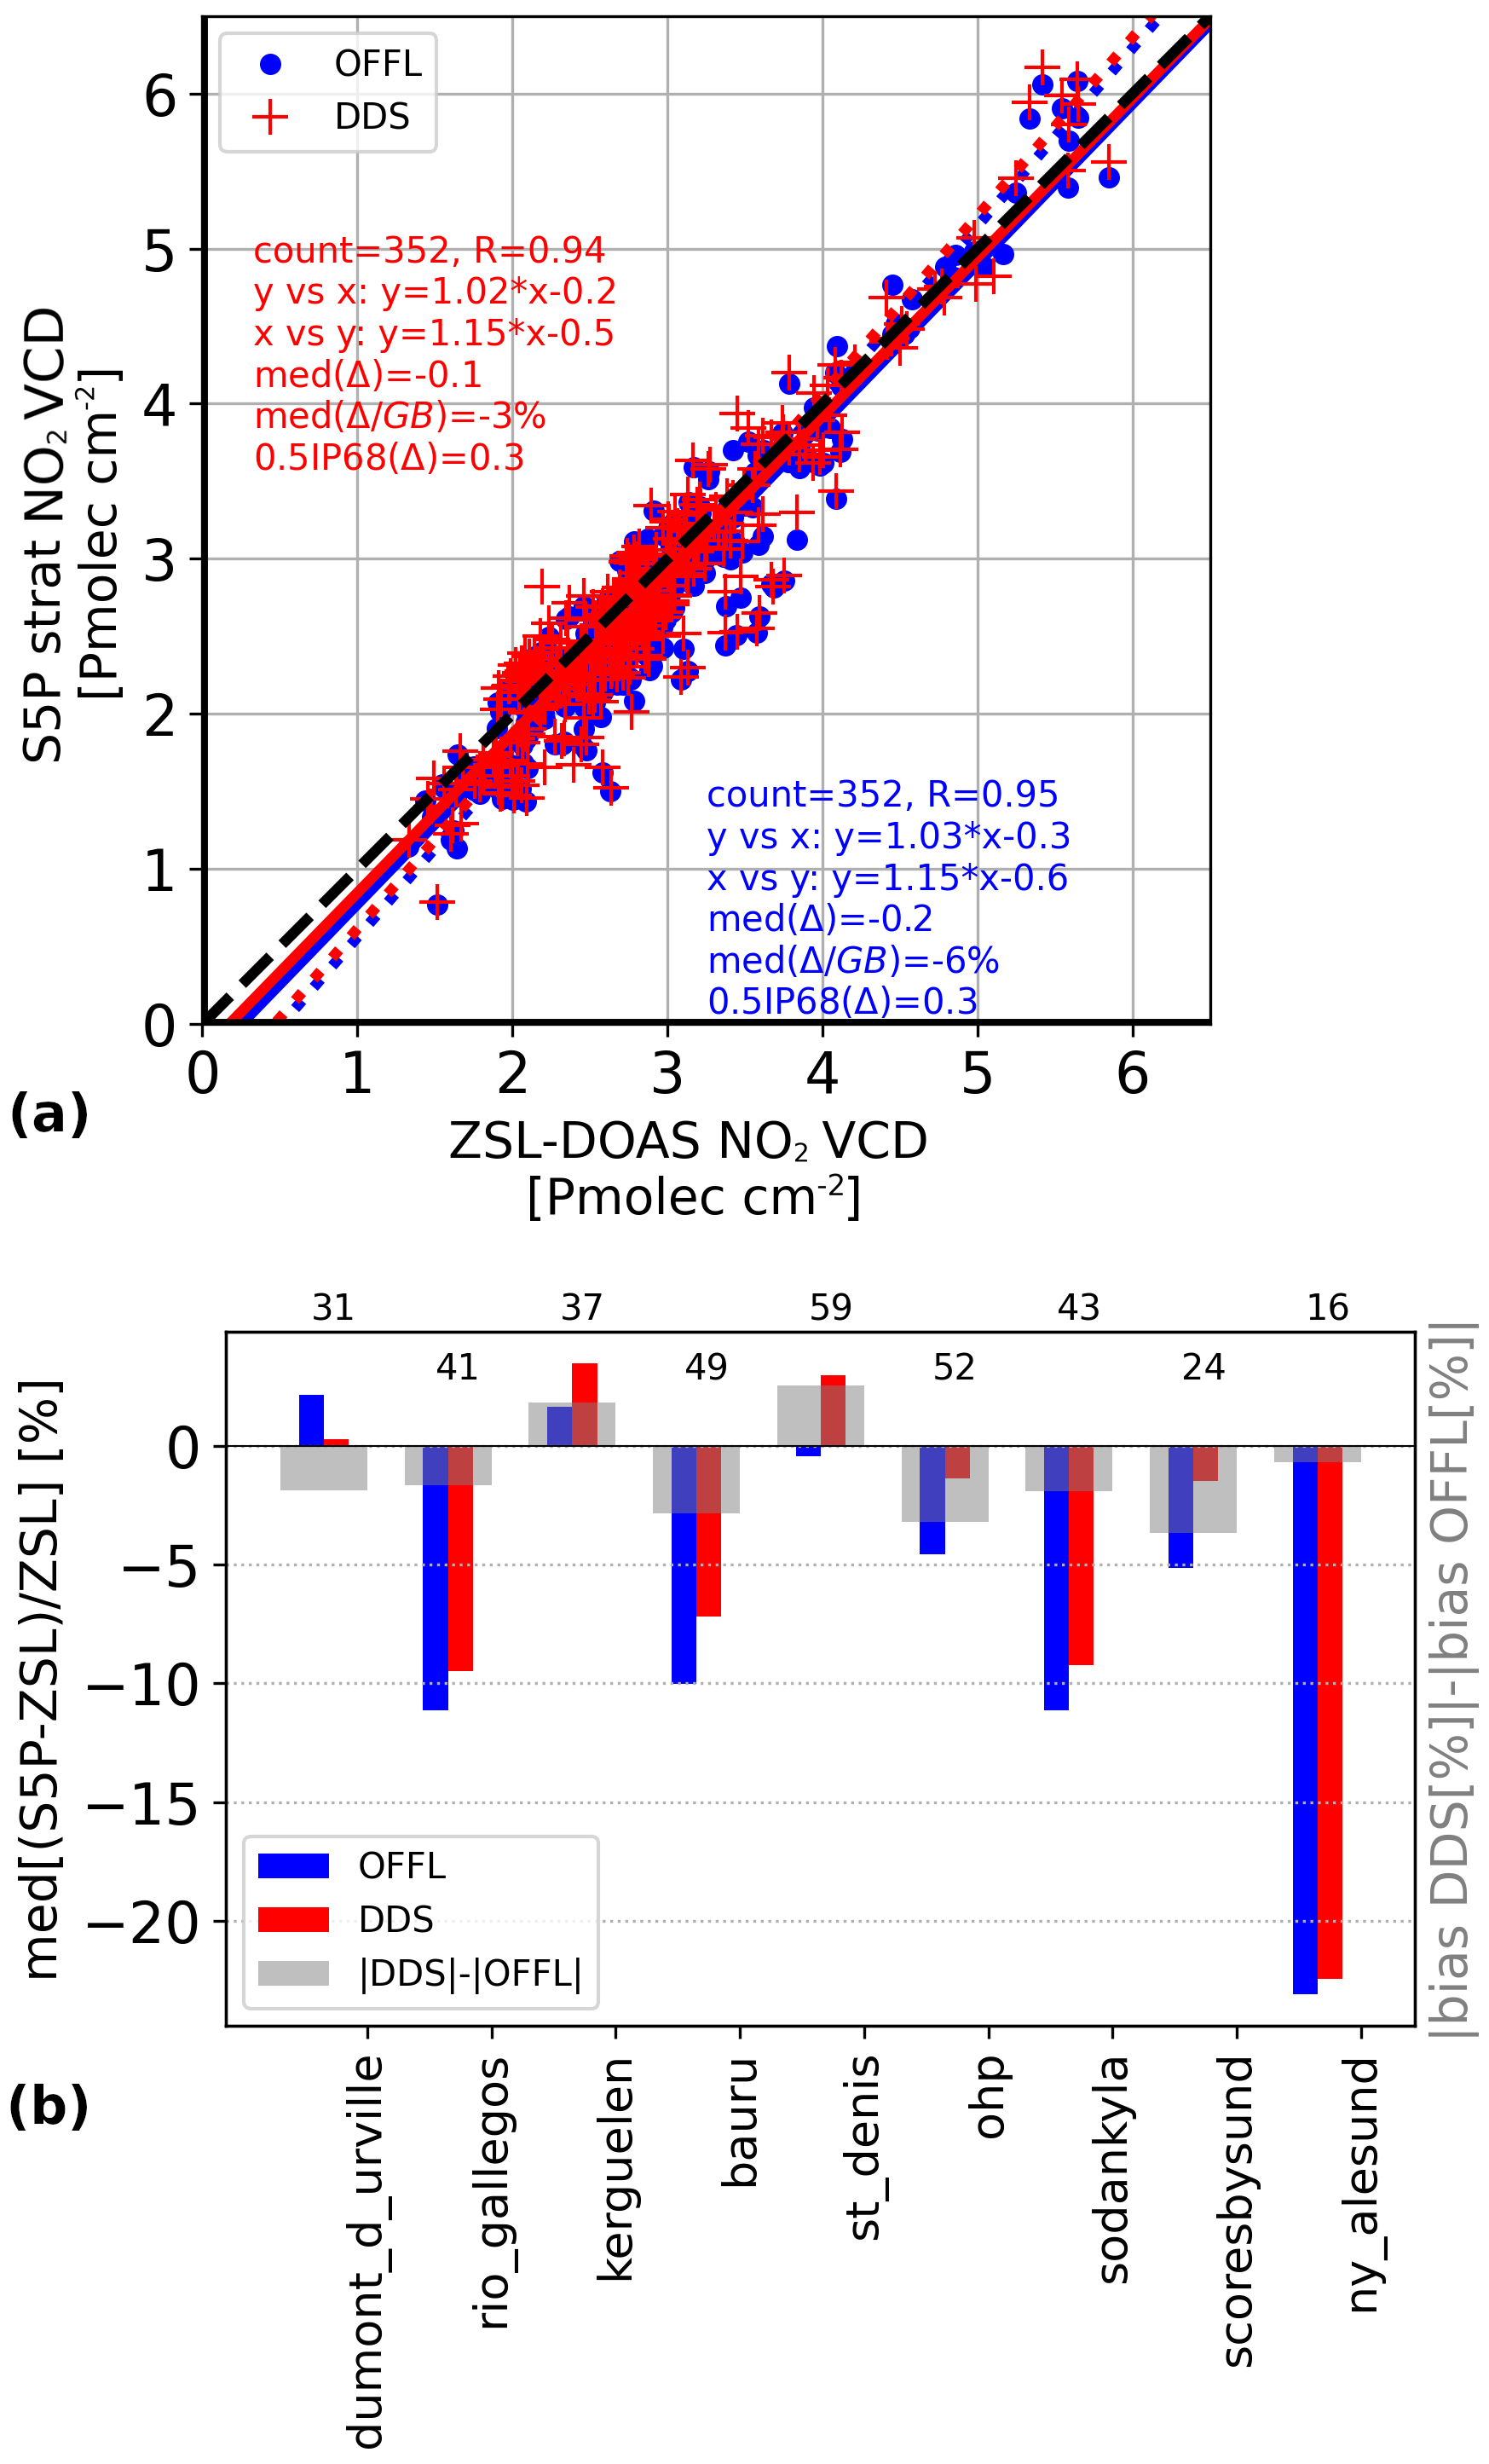
Figure 15(a) Correlation between S5P/TROPOMI and ZSL-DOAS stratospheric NO2 column number densities, after photochemical adjustment of the latter to the satellite overpass time. The operational OFFL data are presented in blue, the reprocessed DDS in red. Ordinary linear regression results are indicated for both y vs. x (solid lines) and x vs. y (dotted lines). IP68 is the central 68 interpercentile range, the difference between the 84th and 16th percentiles, a measure for the dispersion. Δ is the difference “S5P minus GB”, where “GB” stands for ground-based. (b) Median relative difference (bias) between S5P/TROPOMI and ZSL-DOAS stratospheric NO2 column number densities, per station, for both the DDS data (red) and the corresponding OFFL data (blue). The change in the median relative difference is indicated in grey. The number of co-located pairs at each station is provided along the top axis. Stations are ordered per increasing latitude.
5.1 Stratospheric column
The ground-based validation of the stratospheric NO2 column data reveals an improvement in the bias, from a median difference over all co-located pairs of −0.2 Pmolec cm−2 (identical to the bias reported in Verhoelst et al., 2021, and amounting to about −6 %) for the operational OFFL data to −0.1 Pmolec cm−2 (−3 %) for the updated DDS data, which is in line with the slight increase in the TROPOMI stratospheric column mentioned in Sect. 3.3. Typically, stratospheric columns show a seasonal variation between 2 and 3 Pmolec cm−2 for nearly equatorial sites and between 1 and 6 Pmolec cm−2 for sites at very high latitudes. The updated processing does not change significantly the correlation (Pearson R) and the dispersion (half of the central 68 interpercentile, shorthand 0.5 IP68) of the difference between ground-based (“GB”) and S5P stratospheric column data and only slightly the results of a linear regression (see Fig. 15a), as expected from the reduced bias.
Investigating results at individual ground stations (Fig. 15b) shows improvements in bias (reduction of the absolute value of the median difference) at six out of nine stations, almost no change for one, and increases for the last two stations. The large bias at the Ny-Ålesund station, at about 79∘ N, is under investigation; other high-latitude stations, for which there unfortunately were no co-locations in the DDS periods, do not show such a large bias.
5.2 Tropospheric column
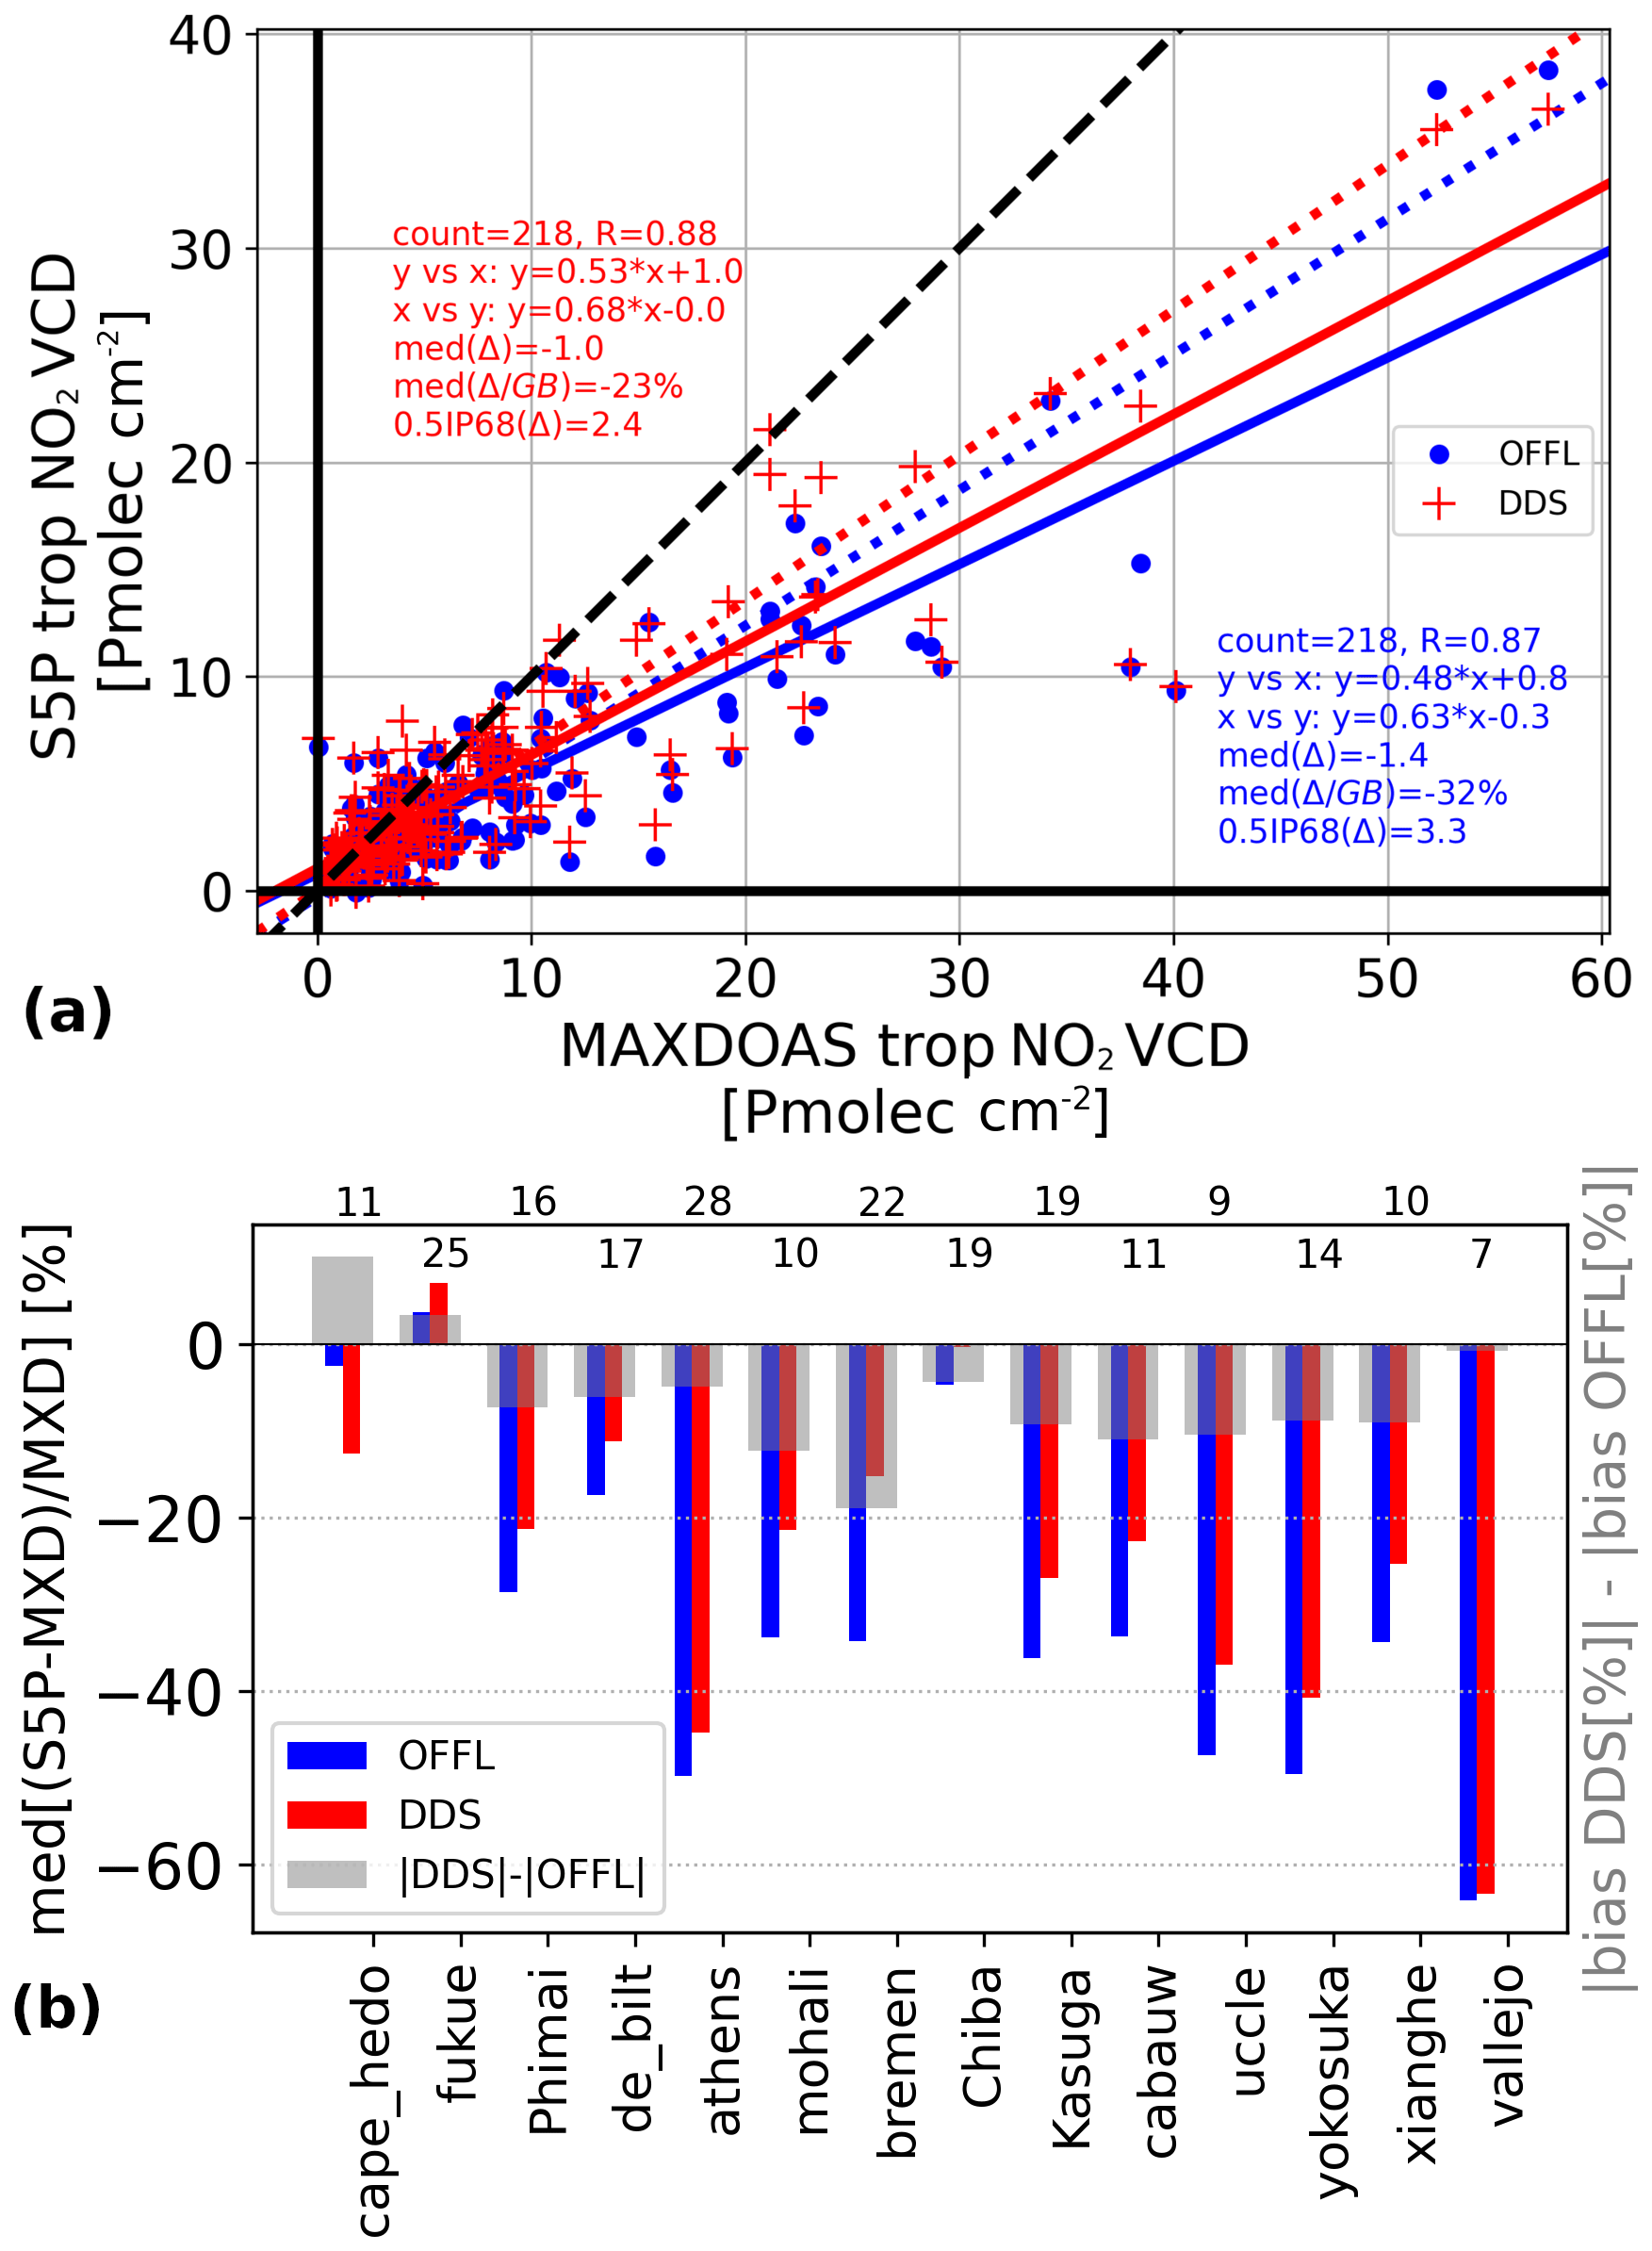
The comparison of TROPOMI to MAX-DOAS tropospheric NO2 column data reveals an improvement in both the bias and the dispersion. The former improves from a median difference over all co-located pairs of −1.4 Pmolec cm−2 (or about −32 % and similar to the bias reported in Verhoelst et al., 2021) for the OFFL to −0.9 Pmolec cm−2 (−23 %) for the DDS data. The dispersion of the difference improves from 3.3 to 2.4 Pmolec cm−2. Figure 16a demonstrates that the linear regression also improves somewhat, with a slight increase in the slope, as expected from the improvement in the derived (multiplicative) bias.
Looking at the change in bias at each individual station (Fig. 16b), the DDS data show lower biases than the OFFL data at all but 2 of the 16 stations. However, results at these two outlying sites cannot be considered meaningful: they represent relatively clean background conditions with small tropospheric column values, with already very small biases in the OFFL data. It is interesting to note that the improvement does not scale with the tropospheric column value: the most polluted site does not benefit from a larger improvement.
5.3 Total column
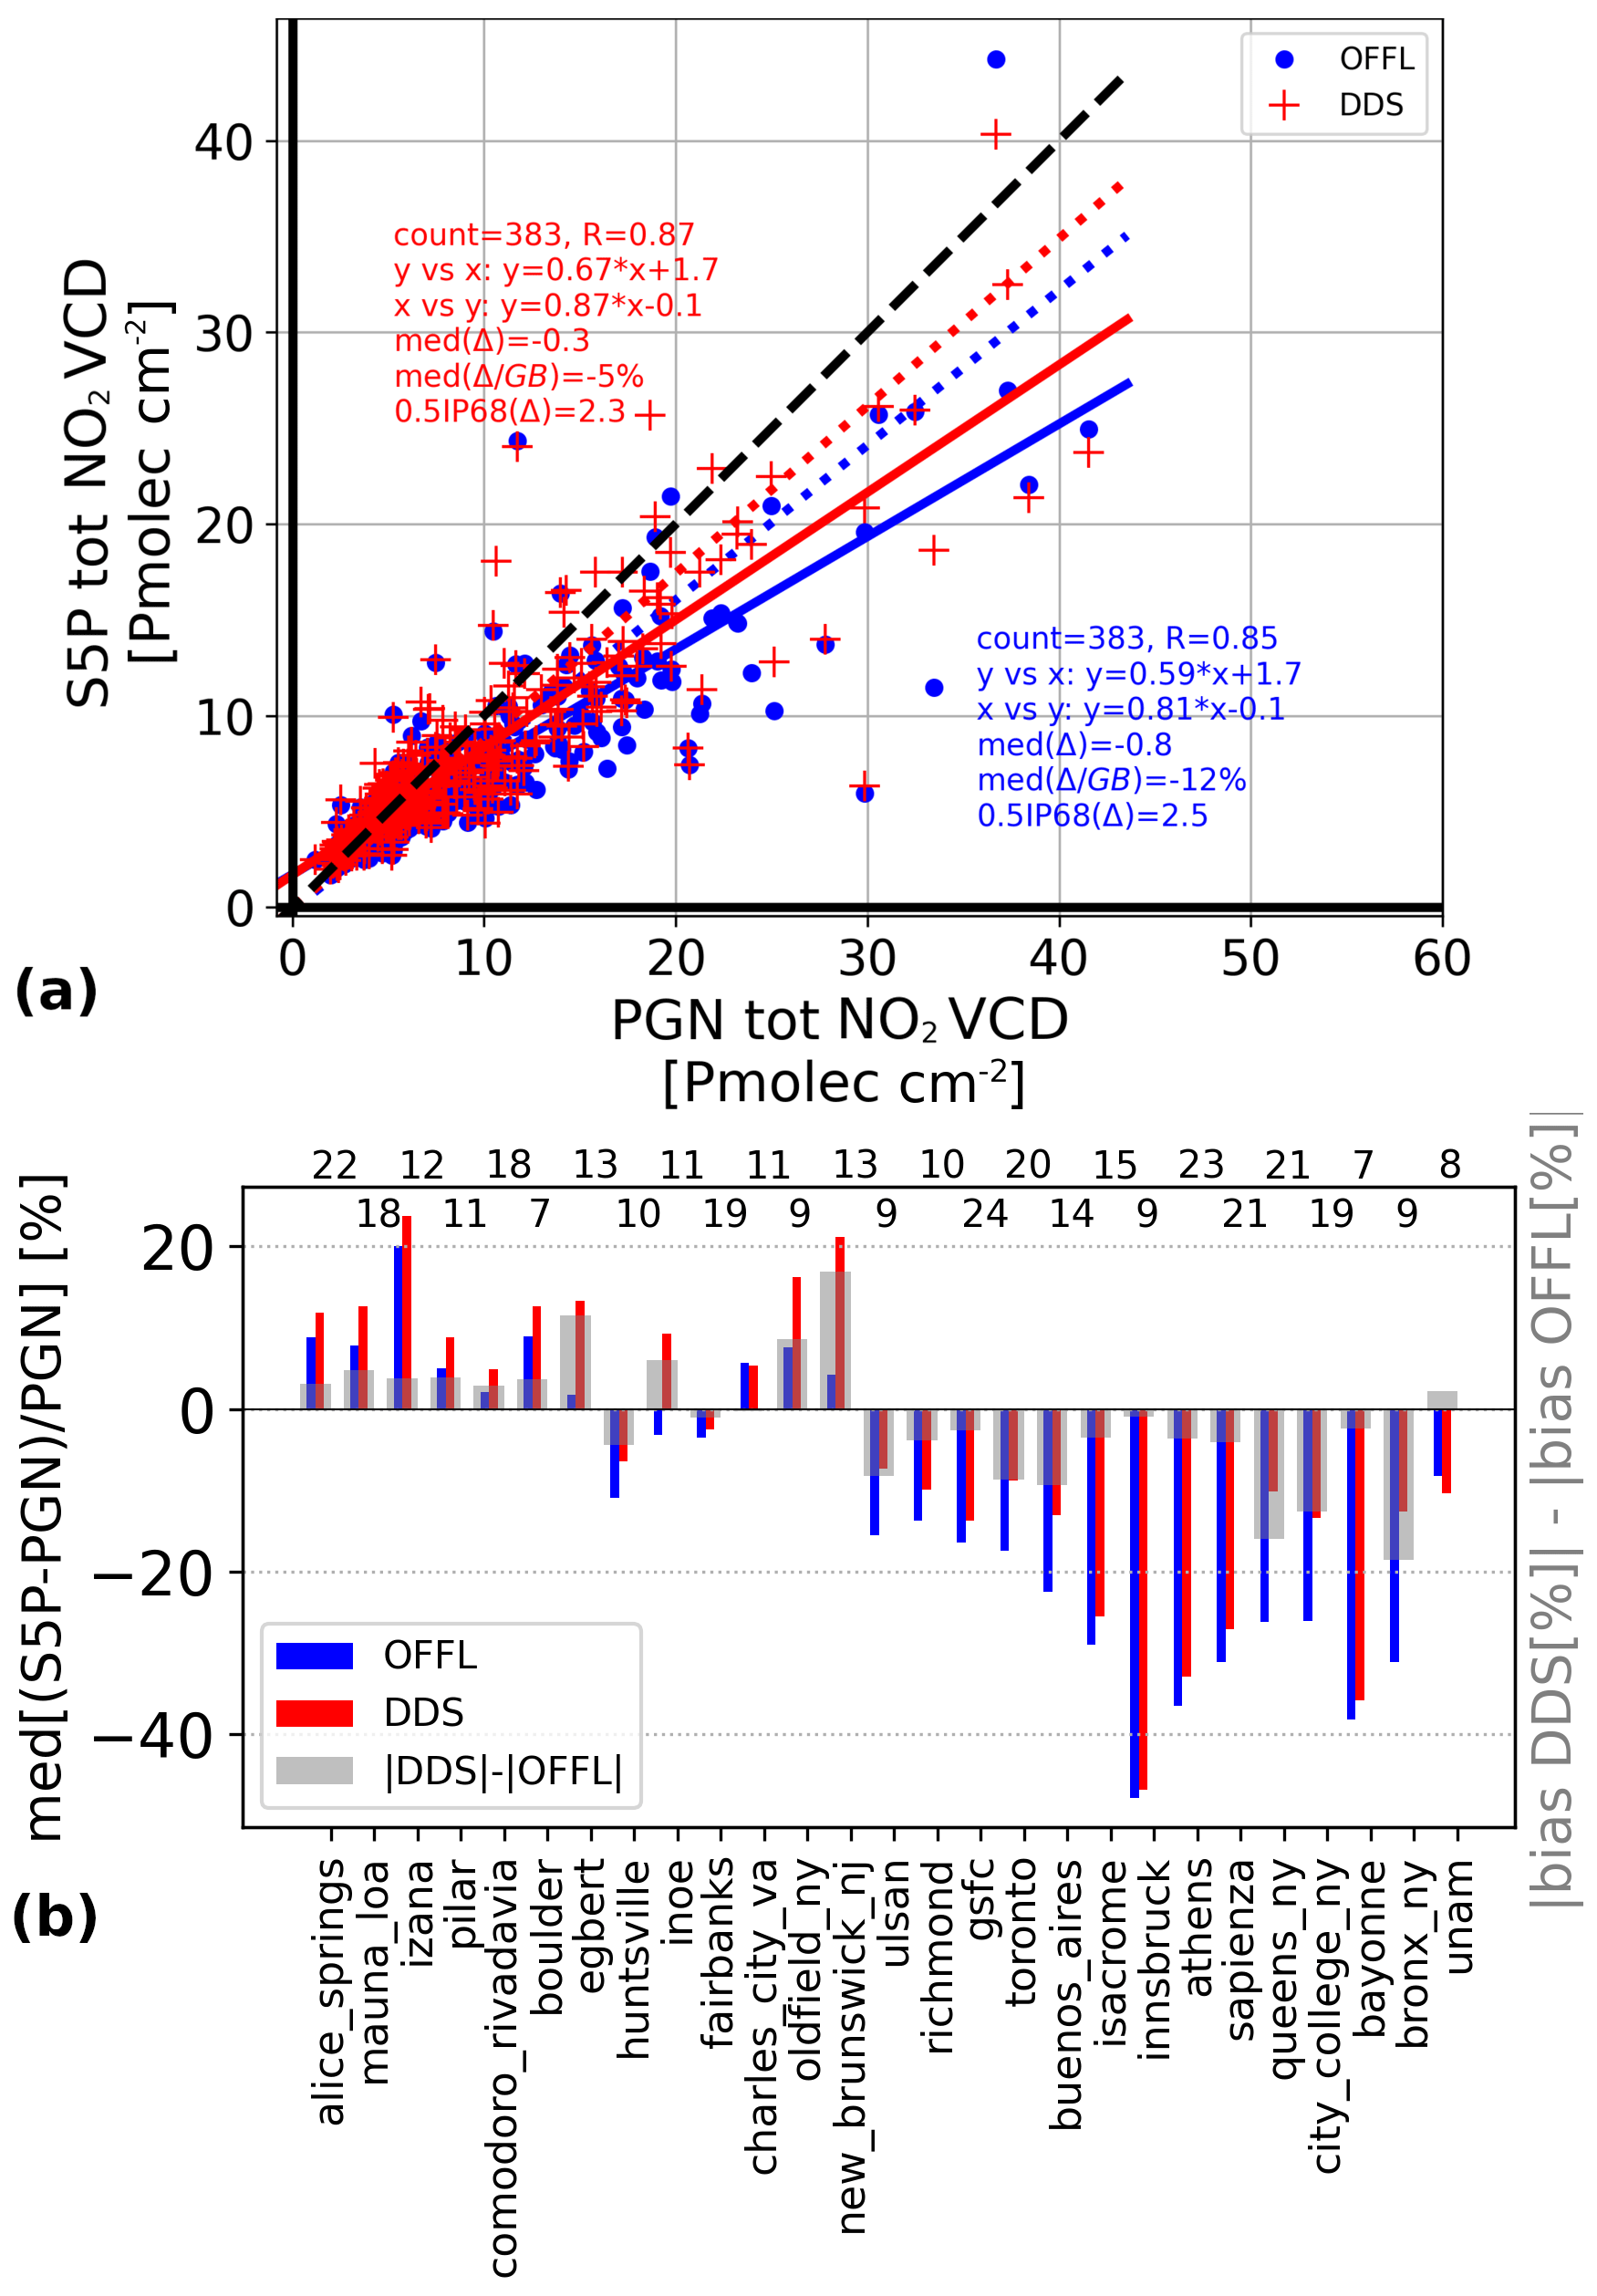
Similar to the tropospheric column validation, the comparison of TROPOMI to PGN total column NO2 data reveals an improvement in both the bias and the dispersion. The former improves from a median difference over all co-located pairs of −0.8 Pmolec cm−2 (or about −12 %) for the OFFL data to −0.3 Pmolec cm−2 (−5 %) for the DDS data. The difference dispersion improves slightly from 2.5 to 2.3 Pmolec cm−2.
Figure 17a shows that the linear regression also improves somewhat, with a clear increase in the slope, as expected from the improvement in the derived (multiplicative) bias.
Looking at the bias per station (Fig. 17b), the situation is more complex to describe than for the tropospheric column. At relatively clean sites with small tropospheric column values, for which the OFFL data already presented slight positive biases with regard to the PGN measurements, the increased columns in the DDS data lead to even larger positive biases. The increased DDS total columns improve the bias only of those sites for which the OFFL data underestimated the PGN columns. This is also broadly true for the right-hand half of the graph, i.e. for sites with larger total columns due to a significant tropospheric contribution, in line with the findings for the MAX-DOAS comparisons (where the network is heavily biased towards sites with significant tropospheric columns).
5.4 Validation summary and discussion
In summary, ground-based validation of the updated DDS NO2 vertical column data, in comparison to the validation of the corresponding operational OFFL data, confirms the improvement (reduction) in the bias of the stratospheric column expected from the increase in the stratospheric column observed in the DDS data. Results presented here are consistent with what was found by Dimitropoulou et al. (2022) in a recent study.
For the tropospheric and total NO2 columns, the dispersion is lower with the DDS data, but whether the bias improves depends on the range of tropospheric column values: at sites with large tropospheric columns, affected by strong negative biases in the OFFL data, the increased tropospheric (and total) columns imply a clear improvement. At clean background sites, however, the increased columns of the DDS data actually worsen the already positive bias of the OFFL data, a finding which is somewhat at odds with the ZSL-DOAS comparisons for the stratospheric columns, where an originally negative bias is reduced. This apparent inconsistency between direct-Sun and zenith-sky measurements was already observed in Verhoelst et al. (2021) and work is ongoing to elucidate and address this, including a reprocessing of the PGN data (upcoming v1.8) with more appropriate absorption cross sections for clean sites where the total column resides mostly in the stratosphere.
Note that the two most polluted measurement sites, which show in the tropospheric (Fig. 16b: Vallejo) and total (Fig. 17b: Unam) column bias a behaviour very different from the other polluted sites, are both located on the Mexican plateau, a situation very different from the other measurement sites.
6.1 O2–O2 cloud data retrieval
Processor version v2.2, used for DDS-3 and operational since 1 July 2021, includes in the NO2 processing chain an implementation of the O2–O2 cloud data retrieval algorithm used for OMI and described by Veefkind et al. (2016), which is based on a DOAS SCD retrieval of the absorption feature of the O2–O2 collision complex in the wavelength window [460:490] nm. The results of this cloud retrieval are included in the standard NO2 data file but are not further used yet: they are still under evaluation for fine-tuning the algorithm settings.
The NO2 cloud (radiance) fraction is currently derived using the FRESCO cloud pressure, as mentioned in Sect. 4.1. Using the O2–O2 cloud pressure instead would mean that the cloud pressure is determined (a) from almost the same wavelengths as NO2 and (b) from measurements by the same detector, thus eliminating the small spatial mismatch between ground pixels of NO2 (band 4) and FRESCO (band 6). In addition, it seems that for certain atmospheric circumstances the O2–O2 cloud pressure may be more realistic than the FRESCO cloud pressure. Riess et al. (2022) included O2–O2 cloud data from OMI in their comparison of FRESCO-S and FRESCO-wide cloud pressures with those of VIIRS (the Visible/Infrared Imager/Radiometer Suite aboard the SUOMI National Polar-orbiting Partnership (SNPP) satellite): O2–O2 cloud pressures are systematically higher at low cloud fractions. Evaluation of the O2–O2 cloud data product quality is ongoing, which may lead to selection rules in the NO2 processor to choose between the two cloud pressures.
6.2 Bug fixes in data version v2.3
Fixes have been included in data processor version v2.3, operational as of 14 November 2021, of minor bugs related to the output of some detailed data not used by most data users (notably wavelength calibration parameters and NO2 DOAS polynomial coefficients) that were accidentally introduced in v2.2 with the inclusion of the O2–O2 cloud retrieval and which do not affect the v2.2 SCD and VCD values or quality.
6.3 Further improvements in the level-1b spectra
The improvements in the level-1b v2 spectra (cf. Sect. 2.1.3; Ludewig et al., 2020) include a correction for the degradation of the irradiance but not for the radiance, because at the time of delivery of the initial level-1b v2.0 CKD the accumulated degradation in the radiance was still too small to reliably determine a degradation correction for it. With a stronger effect and more radiance data available, it has become possible to determine a degradation correction, and updated CKD have been determined.
With this update a new test dataset, DDS-4, was made in autumn 2021. For NO2 the results are as expected: almost no effect on the SCD values, while the SCD error and RMSE are reduced a little due to the degradation correction – given the lack of sufficient overlap days between DDS-4 and DDS-2/3, more precise statements cannot be made as yet. Evaluation of DDS-4 was favourable for all TROPOMI data products, and hence the radiance degradation correction will be included in the operational processor, and these updated level-1b data will have version number v2.1.
Level-1b v2.1 will also include a further improvement of the flagging of transients. Analysis of the NO2 SCD retrieval results of two test orbits, over the SAA and the Pacific Ocean, reveals that this update affects only a very small number of ground pixels (<0.1 % for the SAA orbit and even less over the Pacific Ocean), for which the SCD error and RMSE of the fit may decrease.
NO2-v2.4, due for activation in the operational stream in mid-2022 and due to be used for a full mission reprocessing later in 2022, will make use of level-1b v2.1 spectra.
6.4 TROPOMI surface albedo data
As mentioned in Sect. 4.3, the surface albedo in the NO2 fit window is taken from the 5-year version of the OMI LER climatology (Kleipool et al., 2008), which is given on a grid of and measured at almost the same overpass time as TROPOMI is measuring. The OMI LER, however, does not contain NIR wavelengths, and for the FRESCO cloud retrieval the GOME-2 LER (Tilstra et al., 2017) is used, which is given on a grid of and measured at mid-morning rather than early afternoon. These climatologies are not optimal for TROPOMI, in particular in view of the spatial resolution. Furthermore, the LER approach assumes isotropic reflection of light, while in reality there is a viewing angle dependency in the reflected light (see e.g. Lorente et al., 2018).
For this reason a dedicated TROPOMI surface albedo climatology has been developed, based on TROPOMI measurements, which contains both a traditional LER as well as a directionally dependent LER (DLER), similar to the one developed recently from GOME-2 measurements by Tilstra et al. (2021), at a grid of . The initial release of this dataset is based on level-1b v1.0 spectra and as such it will be used in both the FRESCO and NO2 v2.4 operational processing and planned mission reprocessing. At a later stage, after the mission reprocessing, an update of the TROPOMI climatology will be made using level-1b v2.0 spectra. Whether and if so when that updated DLER will be implemented in the FRESCO and NO2 processing is as yet undecided.
The TROPOMI NO2 data product is widely used for monitoring air pollution levels worldwide, benefitting from TROPOMI's high spatial sampling and excellent signal-to-noise ratio. Since the first data release mid-2018 several improvements have been made, with a major update to version 1.4 at the end of November 2020 (van Geffen et al., 2020, 2021; Eskes et al., 2022; Eskes and Eichmann, 2021). This paper documents the improvements leading to version 2.2 of the TROPOMI NO2 data product, operational as of 1 July 2021. These improvements and their impact on the NO2 SCD and VCD data, studied by comparing so-called DDS test data with operational offline (OFFL) v1.x data, can be summarised as follows.
-
Small corrections in the wavelength assignment of the reflectance used in the DOAS slant column fit reduce the SCD error of ground pixels along some detector rows, without affecting other rows or the SCD values significantly.
-
The introduction of an outlier removal improves the SCD retrieval quality for ground pixels suffering from charged particles hitting the detector (notably over the SAA) and those suffering from saturation and blooming effects (notably over bright clouds), without affecting other ground pixels.
-
The use of improved level-1b v2.0 (ir)radiance spectra, with among others better handling of blooming and transients effects, improved (ir)radiance calibration, and improved irradiance degradation correction, in combination with the above two improvements, leads to (a) a reduction of the SCD error by about 2 %, (b) a reduction of the RMSE of the DOAS fit by about 7 %, and (c) an increase in the SCD values of about 3 %.
-
The increase in the SCD values is fairly homogeneous and leads to an estimated increase in the stratospheric VCD by 2 %–4 % or 0.6–1.5 µmol m−2.
-
The use of the improved level-1b v2.0 leads (a) to a somewhat lower cloud pressure for ground pixels with small clouds fractions, which in turn leads to tropospheric VCDs for those ground pixels to be higher by some 5 %, and (b) to a small increase in the number of fully cloud-free ground pixels.
-
Switching the source of the snow/ice flag from NISE to ECMWF improves the quality of the VCD data because of the higher spatial resolution of the ECMWF flag and its better handling of coastlines and shallow water cases.
-
The climatological surface albedo reduction for cloud-free ground pixels with reflectances lower than expected, in combination with the use of improved level-1b v2.0 spectra, leads to tropospheric VCDs being higher by 10 %–15 % for cloud-free pixels.
The combined effect of all improvements on the vertical column data necessarily includes the impact of an update of the FRESCO cloud retrieval as of v1.4 since there is no DDS that covers v1.4 data. On average the v2.x DDS data have tropospheric NO2 columns that are 10 % to 40 % larger than the v1.x OFFL data, depending on the level of pollution. This increase has brought these VCDs closer to OMI observations, while the underlying SCDs differ by only a few percent.
Ground-based validation of the updated DDS NO2 vertical column data, in comparison to the validation of the corresponding operational OFFL data, shows on average an improvement of the negative bias of the stratospheric (from −6 % for OFFL to −3 % for DDS), tropospheric (from −32 % to −23 %) and total (from −12 % to −5 %) columns. For individual measurement stations, however, the picture is more complex, in particular for the tropospheric and total columns. For most polluted sites the negative bias improves, but improvement is not proportional to the pollution level. And at clean background sites the positive bias seems to get worse, which in turn seems inconsistent with the improved bias in the stratospheric column. Work is ongoing to try to clarify these differences.
Part of the negative bias observed when comparing with ground-based observations is probably due to the relatively coarse () resolution of the a priori profiles used in the retrieval. Douros et al. (2022) show that the use of profile shapes from the CAMS air-quality analyses leads to substantial increases in the retrieved tropospheric columns over emission hotspots of order 20 %, depending on the location.
Processor version 2.3, operational since 14 November 2021, contains only fixes of minor bugs not affecting the SCD or VCD data. Version 2.4, which is due for activation in the operational stream mid-2022 and which will be used for a full mission reprocessing later in 2022, contains further improvements: (a) level-1b v2.1 spectra with a radiance degradation correction and improved transient flagging and (b) use of a dedicated TROPOMI DLER surface albedo climatology, which accounts for viewing angle dependencies, in both the cloud data and NO2 retrieval.
Figure A1 shows the individual SCD error maps of the top panel of Fig. 2.

Figure A1Map of the TROPOMI NO2 SCD error without (top panel) and with (bottom panel) outlier removal, the difference of which is shown in the top panel of Fig. 2.
Table A1 gives the longitudinal and latitudinal extents of the regions in Fig. 14.
Standard TROPOMI NO2 data (v1.2-1.4) are available via ESA's public data hub (https://s5phub.copernicus.eu/, last access: 28 March 2022). Diagnostic datasets DDS-2 (v2.1) and DDS-3 (v2.2) TROPOMI NO2 data are available for registered users via ESA's expert data hub (https://s5pexp.copernicus.eu/, last access: 28 March 2022). Orbits processed with non-standard configuration are available from the lead author upon request. OMI/QA4ECV NO2 (v1.1) data are available via the QA4ECV portal (http://www.qa4ecv.eu/, last access: 28 March 2022; QA4ECV, 2022). The ZSL-DOAS and Pandora data are obtained as part of the Network for the Detection of Atmospheric Composition Change (https://ndacc.org/, last access: 28 March 2022; NDACC, 2022) and the Pandonia Global Network (https://www.pandonia-global-network.org/, last access: 28 March 2022; PGN, 2022), respectively, and are publicly available, while some of the MAX-DOAS data are also available via NDACC.
JvG conducted the research described in this paper and is responsible for the text. HE is responsible for the AMF and VCD steps and the final data product. SC, GP, TV, and JCL carried out the global validation analysis. MS and MtL implemented and tested the retrieval code in the TROPOMI processor. AL is leader of the TROPOMI level-1b team. KFB is involved in the final NO2 data product. JPV is involved in retrieval issues and is the PI of TROPOMI.
At least one of the (co-)authors is a member of the editorial board of Atmospheric Measurement Techniques. The peer-review process was guided by an independent editor, and the authors also have no other competing interests to declare.
Publisher’s note: Copernicus Publications remains neutral with regard to jurisdictional claims in published maps and institutional affiliations.
Part of the reported work was carried out in the framework of the Copernicus Sentinel-5 Precursor Mission Performance Centre (S5P MPC), contracted by the European Space Agency (ESA/ESRIN, contract no. 4000117151/16/I-LG) and supported by the Belgian Federal Science Policy Office (BELSPO), the Royal Belgian Institute for Space Aeronomy (BIRA-IASB), the Netherlands Space Office (NSO), and the German Aerospace Centre (DLR). The authors are grateful to ESA/ESRIN for supporting the ESA Validation Data Centre (EVDC) established at NILU and for running the Fiducial Reference Measurements (FRM) programme and in particular the FRM4DOAS and Pandonia projects.
Part of this work was carried out in the framework of the S5P Validation Team (S5PVT) AO projects NIDFORVAL (ID #28607, PI Gaia Pinardi, BIRA-IASB) and CESAR (ID #28596, PI Arnoud Apituley, KNMI). Steven Compernolle, Gaia Pinardi and Tijl Verhoelst at BIRA-IASB acknowledge national funding from BELSPO and ESA through the ProDEx projects TROVA-E2 (PEA 4000116692). The authors express special thanks to Ann Marie Fjæraa, José Granville, Sander Niemeijer, and Olivier Rasson for post-processing of the network and satellite data and for their dedication to the S5P/TROPOMI operational validation.
Andrea Pazmiño, Ariane Bazureau, Florence Goutail, Jean-Pierre Pommereau are acknowledged for the fast delivery of ZSL-DOAS SAOZ data with the LATMOS Real-Time processing facility, and the PIs and staff at stations from LATMOS/CNRS and NILU for operating SAOZ instruments. The SAOZ network received funding from the French Institut National des Sciences de l'Univers (INSU) of the Centre National de la Recherche Scientifique (CNRS), Centre National d'Etudes Spatiales (CNES) and Institut polaire fraçais Paul Emile Victor (IPEV).
The MAX-DOAS data used in this publication were obtained from John Burrows, Michel Grutter, Hitoshi Irie, Yugo Kanaya, Ankie Piters, Michel Van Roozendael, Vinayak Sinha, Thomas Wagner. Part of the MAX-DOAS data used here are available at the Network for the Detection of Atmospheric Composition Change (NDACC). Fast delivery of MAX-DOAS data tailored to the S5P validation was organized through the S5PVT AO project NIDFORVAL. IUP-Bremen ground-based measurements are funded by DLR-Bonn received through project 50EE1709A. We thank the IISER Mohali atmospheric chemistry facility for supporting the MAX-DOAS measurements at Mohali, India. KNMI ground-based measurements in De Bilt and Cabauw are partly supported by the Ruisdael Observatory project, Dutch Research Council (NWO) contract 184.034.015, by the Netherlands Space Office (NSO) for Sentinel-5p/TROPOMI validation, and by ESA via the EU CAMS-27 project.
We thank the PIs, support staff and funding for establishing and maintaining Pandora instruments at the 27 sites of the PGN used in this investigation, from institutes AEMET, CCNY, CITEDEF, ECCC, EPA, ESA, GA, INOE, LUFTBLICK, NASA.GSFC, NOAA.ESRL, PMOD.WRC, UAF, UAH, UC.BERKELEY, UNAM, UNIST and VCU. The PGN is a bilateral project supported with funding from NASA and ESA.
The authors would further like to thank the following people: Erwin Loots and Emiel van der Plas on level-1b issues, Gijsbert Tilstra on surface albedo issues, Ping Wang on FRESCO cloud retrieval, and Piet Stammes and Jos de Laat on general retrieval issues.
Sentinel-5 Precursor is an ESA mission on behalf of the European Commission (EC). The TROPOMI payload is a joint development by ESA and the Netherlands Space Office (NSO). The Sentinel-5 Precursor ground-segment development has been funded by ESA and with national contributions from the Netherlands, Germany, and Belgium. This work contains modified Copernicus Sentinel-5P TROPOMI data (2018–2021), processed in the operational framework or locally at KNMI, with post-processing for validation purposes performed by BIRA-IASB.
This paper was edited by Lok Lamsal and reviewed by three anonymous referees.
Allen, D., Pickering, K., Bucsela, E., van Geffen, J., Lapiere, J., Koshak, W., and Eskes, H.: Observations of lightning NOx production from TROPOMI case studies over the United States, J. Geophys. Res.-Atmos., 126, e2020JD034174, https://doi.org/10.1029/2020JD034174, 2021. a
Boersma, K. F., Eskes, H. J., Veefkind, J. P., Brinksma, E. J., van der A, R. J., Sneep, M., van den Oord, G. H. J., Levelt, P. F., Stammes, P., Gleason, J. F., and Bucsela, E. J.: Near-real time retrieval of tropospheric NO2 from OMI, Atmos. Chem. Phys., 7, 2103–2118, https://doi.org/10.5194/acp-7-2103-2007, 2007. a
Boersma, K. F., Eskes, H. J., Dirksen, R. J., van der A, R. J., Veefkind, J. P., Stammes, P., Huijnen, V., Kleipool, Q. L., Sneep, M., Claas, J., Leitão, J., Richter, A., Zhou, Y., and Brunner, D.: An improved tropospheric NO2 column retrieval algorithm for the Ozone Monitoring Instrument, Atmos. Meas. Tech., 4, 1905–1928, https://doi.org/10.5194/amt-4-1905-2011, 2011. a
Boersma, K. F., Eskes, H. J., Richter, A., De Smedt, I., Lorente, A., Beirle, S., van Geffen, J. H. G. M., Zara, M., Peters, E., Van Roozendael, M., Wagner, T., Maasakkers, J. D., van der A, R. J., Nightingale, J., De Rudder, A., Irie, H., Pinardi, G., Lambert, J.-C., and Compernolle, S. C.: Improving algorithms and uncertainty estimates for satellite NO2 retrievals: results from the quality assurance for the essential climate variables (QA4ECV) project, Atmos. Meas. Tech., 11, 6651–6678, https://doi.org/10.5194/amt-11-6651-2018, 2018. a, b
Bovensmann, H., Burrows, J. P., Buchwitz, M., Frerick, J., Noel, S., Rozanov, V. V., Chance, K. V., and Goede, A. P. H.: SCIAMACHY: Mission objectives and measurement modes, J. Atmos. Sci., 56, 127–150, https://doi.org/10.1175/1520-0469(1999)056<0127:SMOAMM>2.0.CO;2, 1999. a
Brodzik, M. J. and Stewart, J. S.: Near-real-time SSM/I-SSMIS EASE-grid daily global ice concentration and snow extent, Version 5, Boulder, Colorado USA. NASA National Snow and Ice Data Center [data set], https://doi.org/10.5067/3KB2JPLFPK3R, 2016. a
Burrows, J. P., Weber, M., Buchwitz, M., Rozanov, V., Ladstätter-Weißenmayer, A., Richter, A., Debeek, R., Hoogen, R., Bramstedt, K., Eichmann, K.-U., Eisinger, M., and Perner, D.: The Global Ozone Monitoring Experiment (GOME): Mission concept and first results, J. Atmos. Sci., 56, 151–175, https://doi.org/10.1175/1520-0469(1999)056<0151:TGOMEG>2.0.CO;2, 1999. a
Compernolle, S., Verhoelst, T., Pinardi, G., Granville, J., Hubert, D., Keppens, A., Niemeijer, S., Rino, B., Bais, A., Beirle, S., Boersma, F., Burrows, J. P., De Smedt, I., Eskes, H., Goutail, F., Hendrick, F., Lorente, A., Pazmino, A., Piters, A., Peters, E., Pommereau, J.-P., Remmers, J., Richter, A., van Geffen, J., Van Roozendael, M., Wagner, T., and Lambert, J.-C.: Validation of Aura-OMI QA4ECV NO2 climate data records with ground-based DOAS networks: the role of measurement and comparison uncertainties, Atmos. Chem. Phys., 20, 8017–8045, https://doi.org/10.5194/acp-20-8017-2020, 2020. a, b
Compernolle, S., Argyrouli, A., Lutz, R., Sneep, M., Lambert, J.-C., Fjæraa, A. M., Hubert, D., Keppens, A., Loyola, D., O'Connor, E., Romahn, F., Stammes, P., Verhoelst, T., and Wang, P.: Validation of the Sentinel-5 Precursor TROPOMI cloud data with Cloudnet, Aura OMI O2–O2, MODIS, and Suomi-NPP VIIRS, Atmos. Meas. Tech., 14, 2451–2476, https://doi.org/10.5194/amt-14-2451-2021, 2021. a
Cooper, M. J., Martin, R. V., Lyapustin, A. I., and McLinden, C. A.: Assessing snow extent data sets over North America to inform and improve trace gas retrievals from solar backscatter, Atmos. Meas. Tech., 11, 2983–2994, https://doi.org/10.5194/amt-11-2983-2018, 2018. a
Crutzen, P. J.: The influence of nitrogen oxides on the atmospheric ozone content, Q. J. Roy. Meteor. Soc., 96, 320–325, 1970. a
De Rosnay, P., Isaksen, L., and Dahoui, M.: Snow data assimilation at ECMWF, ECMWF Newsletter No. 143, Spring 2015, 26–31, https://www.ecmwf.int/en/elibrary/14587-newsletter-no-143-spring-2015 (last access: 7 March 2022), 2015. a
Dimitropoulou, E., Hendrick, F., Friedrich, M. M., Tack, F., Pinardi, G., Merlaud, A., Fayt, C., Hermans, C., Fierens, F., and Van Roozendael, M.: Horizontal distribution of tropospheric NO2 and aerosols derived by dual-scan multi-wavelength MAX-DOAS measurements in Uccle, Belgium, Atmos. Meas. Tech. Discuss. [preprint], https://doi.org/10.5194/amt-2021-308, in review, 2022. a
Douros, J., Eskes, H., van Geffen, J., Boersma, K. F., Compernolle, S., Pinardi, G., Blechschmidt, A.-M., Peuch, V.-H., Colette, A., and Veefkind, J. P.: Comparing Sentinel-5P TROPOMI NO2 column observations with the CAMS-regional air quality ensemble, Geosci. Model Dev., submitted, 2022. a, b
Eskes, H. J. and Eichmann K.-U.: S5P MPC Product Readme Nitrogen Dioxide, Report S5P-MPC-KNMI-PRF-NO2, version 2.1, ESA, http://www.tropomi.eu/data-products/nitrogen-dioxide/ (last access: 7 March 2022), 2021. a, b, c
Eskes, H. J., van Geffen, J. H. G. M., Boersma, K. F., and Eichmann K.-U.. Apituley, A., Pedergnana, M., Sneep, M., Veefkind, J. P., and Loyola, D.: S5P/TROPOMI Level-2 Product User Manual Nitrogen Dioxide, Report S5P-KNMI-L2-0021-MA, version 4.0.2, ESA, http://www.tropomi.eu/data-products/nitrogen-dioxide/ (last access: 7 March 2022), 2021. a
Eskes, H. J., van Geffen, J., Boersma, K. F., Sneep, M., ter Linden, M., Richter, A., Beirle, S., and Veefkind, J. P.: High spatial resolution nitrogen dioxide tropospheric column observations derived from Sentinel-5P TROPOMI observations, Atmos. Meas. Tech., in preparation, 2022. a, b, c, d, e
Fuglestvedt, J. S., Berntsen, T., Isaksen, I. S. A., Mao, H., Liang, X.-Z., and Wang, W.-C.: Climatic forcing of nitrogen oxides through changes in tropospheric ozone and methane, Atmos. Environ., 33, 961–977, https://doi.org/10.1016/s1352-2310(98)00217-9, 1999. a
Griffin, D., Zhao, X., McLinden, C. A., Boersma, F., Bourassa, A., Dammers, E., Degenstein, D., Eskes, H., Fehr, L., Fioletov, V., Hayden, K., Kharol, S. K., Li, S.-M., Makar, P., Martin, R. V., Mihele, C., Mittermeier, R. L., Krotkov, N., Sneep, M., Lamsal, L. N., ter Linden, M., van Geffen, J., Veefkind, P., and Wolde, M.: High resolution mapping of nitrogen dioxide with TROPOMI: First results and validation over the Canadian oil sands, Geophys. Res. Lett., 46, 1049–1060, https://doi.org/10.1029/2018GL081095, 2019. a
Hendrick, F., Mahieu, E., Bodeker, G. E., Boersma, K. F., Chipperfield, M. P., De Mazière, M., De Smedt, I., Demoulin, P., Fayt, C., Hermans, C., Kreher, K., Lejeune, B., Pinardi, G., Servais, C., Stübi, R., van der A, R., Vernier, J.-P., and Van Roozendael, M.: Analysis of stratospheric NO2 trends above Jungfraujoch using ground-based UV-visible, FTIR, and satellite nadir observations, Atmos. Chem. Phys., 12, 8851–8864, https://doi.org/10.5194/acp-12-8851-2012, 2012. a
Hendrick, F., Müller, J.-F., Clémer, K., Wang, P., De Mazière, M., Fayt, C., Gielen, C., Hermans, C., Ma, J. Z., Pinardi, G., Stavrakou, T., Vlemmix, T., and Van Roozendael, M.: Four years of ground-based MAX-DOAS observations of HONO and NO2 in the Beijing area, Atmos. Chem. Phys., 14, 765–781, https://doi.org/10.5194/acp-14-765-2014, 2014. a
Herman, J., Cede, A., Spinei, E., Mount, G., Tzortziou, M., and Abuhassan, N.: NO2 column amounts from ground-based Pandora and MFDOAS spectrometers using the direct-sun DOAS technique: Intercomparisons and application to OMI validation, J. Geophys. Res., 114, D13307, https://doi.org/10.1029/2009JD011848, 2009. a
Herman, J., Abuhassan, N., Kim, J., Kim, J., Dubey, M., Raponi, M., and Tzortziou, M.: Underestimation of column NO2 amounts from the OMI satellite compared to diurnally varying ground-based retrievals from multiple PANDORA spectrometer instruments, Atmos. Meas. Tech., 12, 5593–5612, https://doi.org/10.5194/amt-12-5593-2019, 2019. a
Hönninger, G., von Friedeburg, C., and Platt, U.: Multi axis differential optical absorption spectroscopy (MAX-DOAS), Atmos. Chem. Phys., 4, 231–254, https://doi.org/10.5194/acp-4-231-2004, 2004. a
Judd, L. M., Al-Saadi, J. A., Szykman, J. J., Valin, L. C., Janz, S. J., Kowalewski, M. G., Eskes, H. J., Veefkind, J. P., Cede, A., Mueller, M., Gebetsberger, M., Swap, R., Pierce, R. B., Nowlan, C. R., Abad, G. G., Nehrir, A., and Williams, D.: Evaluating Sentinel-5P TROPOMI tropospheric NO2 column densities with airborne and Pandora spectrometers near New York City and Long Island Sound, Atmos. Meas. Tech., 13, 6113–6140, https://doi.org/10.5194/amt-13-6113-2020, 2020. a
Kanaya, Y., Irie, H., Takashima, H., Iwabuchi, H., Akimoto, H., Sudo, K., Gu, M., Chong, J., Kim, Y. J., Lee, H., Li, A., Si, F., Xu, J., Xie, P.-H., Liu, W.-Q., Dzhola, A., Postylyakov, O., Ivanov, V., Grechko, E., Terpugova, S., and Panchenko, M.: Long-term MAX-DOAS network observations of NO2 in Russia and Asia (MADRAS) during the period 2007–2012: instrumentation, elucidation of climatology, and comparisons with OMI satellite observations and global model simulations, Atmos. Chem. Phys., 14, 7909–7927, https://doi.org/10.5194/acp-14-7909-2014, 2014. a
Kleipool, Q. L., Dobber, M. R., De Haan, J. F., and Levelt, P. F.: Earth surface reflectance climatology from 3 years of OMI data, J. Geophys. Res., 113, D18308, https://doi.org/10.1029/2008JD010290, 2008. a, b
Kleipool, Q., Ludewig, A., Babić, L., Bartstra, R., Braak, R., Dierssen, W., Dewitte, P.-J., Kenter, P., Landzaat, R., Leloux, J., Loots, E., Meijering, P., van der Plas, E., Rozemeijer, N., Schepers, D., Schiavini, D., Smeets, J., Vacanti, G., Vonk, F., and Veefkind, P.: Pre-launch calibration results of the TROPOMI payload on-board the Sentinel-5 Precursor satellite, Atmos. Meas. Tech., 11, 6439–6479, https://doi.org/10.5194/amt-11-6439-2018, 2018. a
Kreher, K., Van Roozendael, M., Hendrick, F., Apituley, A., Dimitropoulou, E., Frieß, U., Richter, A., Wagner, T., Lampel, J., Abuhassan, N., Ang, L., Anguas, M., Bais, A., Benavent, N., Bösch, T., Bognar, K., Borovski, A., Bruchkouski, I., Cede, A., Chan, K. L., Donner, S., Drosoglou, T., Fayt, C., Finkenzeller, H., Garcia-Nieto, D., Gielen, C., Gómez-Martín, L., Hao, N., Henzing, B., Herman, J. R., Hermans, C., Hoque, S., Irie, H., Jin, J., Johnston, P., Khayyam Butt, J., Khokhar, F., Koenig, T. K., Kuhn, J., Kumar, V., Liu, C., Ma, J., Merlaud, A., Mishra, A. K., Müller, M., Navarro-Comas, M., Ostendorf, M., Pazmino, A., Peters, E., Pinardi, G., Pinharanda, M., Piters, A., Platt, U., Postylyakov, O., Prados-Roman, C., Puentedura, O., Querel, R., Saiz-Lopez, A., Schönhardt, A., Schreier, S. F., Seyler, A., Sinha, V., Spinei, E., Strong, K., Tack, F., Tian, X., Tiefengraber, M., Tirpitz, J.-L., van Gent, J., Volkamer, R., Vrekoussis, M., Wang, S., Wang, Z., Wenig, M., Wittrock, F., Xie, P. H., Xu, J., Yela, M., Zhang, C., and Zhao, X.: Intercomparison of NO2, O4, O3 and HCHO slant column measurements by MAX-DOAS and zenith-sky UV–visible spectrometers during CINDI-2, Atmos. Meas. Tech., 13, 2169–2208, https://doi.org/10.5194/amt-13-2169-2020, 2020. a, b
Kumar, V., Beirle, S., Dörner, S., Mishra, A. K., Donner, S., Wang, Y., Sinha, V., and Wagner, T.: Long-term MAX-DOAS measurements of NO2, HCHO, and aerosols and evaluation of corresponding satellite data products over Mohali in the Indo-Gangetic Plain, Atmos. Chem. Phys., 20, 14183–14235, https://doi.org/10.5194/acp-20-14183-2020, 2020. a
Lambert, J.-C., Compernolle, S., Eichmann, K.-U., de Graaf, M., Hubert, D., Keppens, A., Kleipool, Q., Langerock, B., Sha, M. K., Verhoelst, T., Wagner, T., Ahn, C., Argyrouli, A., Balis, D., Chan, K. L., De Smedt, I., Eskes, H., Fjæraa, A. M., Garane, K., Gleason, J. F., Goutail, F., Granville, J., Hedelt, P., Heue, K.-P., Jaross, G., Koukouli, M.-L., Landgraf, J., Lutz, R., Nanda, S., Niemeijer, S., Pazmiño, A., Pinardi, G., Pommereau, J.-P., Richter, A., Rozemeijer, N., Sneep, M., Stein Zweers, D., Theys, N., Tilstra, G., Torres, O., Valks, P., van Geffen, J., Vigouroux, C., Wang, P., and Weber, M.: Quarterly Validation Report of the Copernicus Sentinel-5 Precursor Operational Data Products, #13: April 2018 – December 2021, S5P MPC Routine Operations Consolidated Validation Report series, Issue 13.01.00, 189 pp., https://mpc-vdaf.tropomi.eu/index.php/nitrogen-dioxide/ (last access: 7 March 2022), 2021. a, b, c
Levelt, P. F., van den Oord, G. H. J., Dobber, M. R. Dobber, Mälkki, A., Visser, H., de Vries, J., Stammes, P., Lundell, J. O. V., and Saari, H.: The Ozone Monitoring Instrument, IEEE T. Geosci. Remote, 44, 10931101, https://doi.org/10.1109/tgrs.2006.872333, 2006. a, b
Levelt, P. F., Joiner, J., Tamminen, J., Veefkind, J. P., Bhartia, P. K., Stein Zweers, D. C., Duncan, B. N., Streets, D. G., Eskes, H., van der A, R., McLinden, C., Fioletov, V., Carn, S., de Laat, J., DeLand, M., Marchenko, S., McPeters, R., Ziemke, J., Fu, D., Liu, X., Pickering, K., Apituley, A., González Abad, G., Arola, A., Boersma, F., Chan Miller, C., Chance, K., de Graaf, M., Hakkarainen, J., Hassinen, S., Ialongo, I., Kleipool, Q., Krotkov, N., Li, C., Lamsal, L., Newman, P., Nowlan, C., Suleiman, R., Tilstra, L. G., Torres, O., Wang, H., and Wargan, K.: The Ozone Monitoring Instrument: overview of 14 years in space, Atmos. Chem. Phys., 18, 5699–5745, https://doi.org/10.5194/acp-18-5699-2018, 2018. a
Liu, M., Lin, J., Kong, H., Boersma, K. F., Eskes, H., Kanaya, Y., He, Q., Tian, X., Qin, K., Xie, P., Spurr, R., Ni, R., Yan, Y., Weng, H., and Wang, J.: A new TROPOMI product for tropospheric NO2 columns over East Asia with explicit aerosol corrections, Atmos. Meas. Tech., 13, 4247–4259, https://doi.org/10.5194/amt-13-4247-2020, 2020. a
Liu, S., Valks, P., Pinardi, G., Xu, J., Chan, K. L., Argyrouli, A., Lutz, R., Beirle, S., Khorsandi, E., Baier, F., Huijnen, V., Bais, A., Donner, S., Dörner, S., Gratsea, M., Hendrick, F., Karagkiozidis, D., Lange, K., Piters, A. J. M., Remmers, J., Richter, A., Van Roozendael, M., Wagner, T., Wenig, M., and Loyola, D. G.: An improved TROPOMI tropospheric NO2 research product over Europe, Atmos. Meas. Tech., 14, 7297–7327, https://doi.org/10.5194/amt-14-7297-2021, 2021. a
Lorente, A., Boersma, K. F., Stammes, P., Tilstra, L. G., Richter, A., Yu, H., Kharbouche, S., and Muller, J.-P.: The importance of surface reflectance anisotropy for cloud and NO2 retrievals from GOME-2 and OMI, Atmos. Meas. Tech., 11, 4509–4529, https://doi.org/10.5194/amt-11-4509-2018, 2018. a
Ludewig, A., Kleipool, Q., Bartstra, R., Landzaat, R., Leloux, J., Loots, E., Meijering, P., van der Plas, E., Rozemeijer, N., Vonk, F., and Veefkind, P.: In-flight calibration results of the TROPOMI payload on board the Sentinel-5 Precursor satellite, Atmos. Meas. Tech., 13, 3561–3580, https://doi.org/10.5194/amt-13-3561-2020, 2020. a, b, c, d, e
Marais, E. A., Roberts, J. F., Ryan, R. G., Eskes, H., Boersma, K. F., Choi, S., Joiner, J., Abuhassan, N., Redondas, A., Grutter, M., Cede, A., Gomez, L., and Navarro-Comas, M.: New observations of NO2 in the upper troposphere from TROPOMI, Atmos. Meas. Tech., 14, 2389–2408, https://doi.org/10.5194/amt-14-2389-2021, 2021. a
Munro, R., Eisinger, M., Anderson, C., Callies, J., Corpaccioli, E., Lang, R., Lefebvre, A., Livschitz, Y., and Albinana, A. P.: GOME-2 on MetOp, ESA publication SP 628, Paris, ISBN 978-9290929390, 2006. a
Munro, R., Lang, R., Klaes, D., Poli, G., Retscher, C., Lindstrot, R., Huckle, R., Lacan, A., Grzegorski, M., Holdak, A., Kokhanovsky, A., Livschitz, J., and Eisinger, M.: The GOME-2 instrument on the Metop series of satellites: instrument design, calibration, and level 1 data processing – an overview, Atmos. Meas. Tech., 9, 1279–1301, https://doi.org/10.5194/amt-9-1279-2016, 2016. a
Murphy, D. M., Fahey, D. W., Proffitt, M. H., Liu, S. C., Chan, K. R., Eubank, C. S., Kawa, S. R., and Kelly, K. K.: Reactive nitrogen and its correlation with ozone in the lower stratosphere and upper troposphere, J. Geophys. Res., 98, 8751–8773, https://doi.org/10.1029/92JD00681, 1993. a
NDACC (Network for the Detection of Atmospheric Composition Change): ZSL-DOAS and Pandora data, https://ndacc.org/, last access: 28 March 2022. a
Pérez-Invernón, F. J., Huntrieser, H., Erbertseder, T., Loyola, D., Valks, P., Liu, S., Allen, D. J., Pickering, K. E., Bucsela, E. J., Jöckel, P., van Geffen, J., Eskes, H., Soler, S., Gordillo-Vázquez, F. J., and Lapierre, J.: Quantification of lightning-produced NOx over the Pyrenees and the Ebro Valley by using different TROPOMI-NO2 and cloud research products, Atmos. Meas. Tech. Discuss. [preprint], https://doi.org/10.5194/amt-2021-286, in review, 2021. a
PGN (Pandonia Global Network): ZSL-DOAS and Pandora data, https://www.pandonia-global-network.org/, last access: 28 March 2022. a
Pinardi, G., Van Roozendael, M., Hendrick, F., Theys, N., Abuhassan, N., Bais, A., Boersma, F., Cede, A., Chong, J., Donner, S., Drosoglou, T., Dzhola, A., Eskes, H., Frieß, U., Granville, J., Herman, J. R., Holla, R., Hovila, J., Irie, H., Kanaya, Y., Karagkiozidis, D., Kouremeti, N., Lambert, J.-C., Ma, J., Peters, E., Piters, A., Postylyakov, O., Richter, A., Remmers, J., Takashima, H., Tiefengraber, M., Valks, P., Vlemmix, T., Wagner, T., and Wittrock, F.: Validation of tropospheric NO2 column measurements of GOME-2A and OMI using MAX-DOAS and direct sun network observations, Atmos. Meas. Tech., 13, 6141–6174, https://doi.org/10.5194/amt-13-6141-2020, 2020. a, b, c
Pommereau, J. and Goutail, F.: O3 and NO2 ground-based measurements by visible spectrometry during Arctic winter and spring 1988, Geophys. Res. Lett., 15, 891–894, https://doi.org/10.1029/GL015i008p00891, 1988. a
QA4ECV (Quality Assurence for Essential Climate Variables): OMI/QA4ECV NO2 (v1.1) data, http://www.qa4ecv.eu/, last access: 28 March 2022. a
Riess, T. C. V. W., Boersma, K. F., van Vliet, J., Peters, W., Sneep, M., Eskes, H., and van Geffen, J.: Improved monitoring of shipping NO2 with TROPOMI: decreasing NOx emissions in European seas during the COVID-19 pandemic, Atmos. Meas. Tech., 15, 1415–1438, https://doi.org/10.5194/amt-15-1415-2022, 2022. a, b, c
Schenkeveld, V. M. E., Jaross, G., Marchenko, S., Haffner, D., Kleipool, Q. L., Rozemeijer, N. C., Veefkind, J. P., and Levelt, P. F.: In-flight performance of the Ozone Monitoring Instrument, Atmos. Meas. Tech., 10, 1957–1986, https://doi.org/10.5194/amt-10-1957-2017, 2017. a
Seinfeld, J. H. and Pandis, S. N.: Atmospheric Chemistry and Physics – From Air Pollution to Climate Change, 2nd edn., John Wiley & Sons, ISBN 978-0471720188, 2006. a
Sentinel-5P Expert Users Data Hub: DDS-2 (v2.1) and DDS-3 (v2.2) TROPOMI NO2 data, https://s5pexp.copernicus.eu/, last access: 28 March 2022.
Sentinel-5P Pre-Operations Data Hub: Standard TROPOMI NO 2 data (v1.2-1.4), https://s5phub.copernicus.eu/, last access: 28 March 2022.
Sillman, S., Logan, J. A., and Wofsy, S. C.: The sensitivity of ozone to nitrogen oxides and hydrocarbons in regional ozone episodes, J. Geophys. Res., 95, 1837–1851, https://doi.org/10.1029/JD095iD02p01837,1990. a
Solomon, S., Schmeltekopf, A. L., and Sanders, R. W.: On the interpretation of zenith sky absorption measurements, J. Geophys. Res., 92, 8311-8319, https://doi.org/10.1029/JD092iD07p08311, 1987. a
Tack, F., Merlaud, A., Iordache, M.-D., Pinardi, G., Dimitropoulou, E., Eskes, H., Bomans, B., Veefkind, P., and Van Roozendael, M.: Assessment of the TROPOMI tropospheric NO2 product based on airborne APEX observations, Atmos. Meas. Tech., 14, 615–646, https://doi.org/10.5194/amt-14-615-2021, 2021. a
Tilstra, L. G., Tuinder, O. N. E., Wang, P., and Stammes, P.: Surface reflectivity climatologies from UV to NIR determined from Earth observations by GOME-2 and SCIAMACHY, J. Geophys. Res.-Atmos., 122, 4084-4111, https://doi.org/10.1002/2016JD025940, 2017. a
Tilstra, L. G., de Graaf, M., Wang, P., and Stammes, P.: In-orbit Earth reflectance validation of TROPOMI on board the Sentinel-5 Precursor satellite, Atmos. Meas. Tech., 13, 4479–4497, https://doi.org/10.5194/amt-13-4479-2020, 2020. a
Tilstra, L. G., Tuinder, O. N. E., Wang, P., and Stammes, P.: Directionally dependent Lambertian-equivalent reflectivity (DLER) of the Earth's surface measured by the GOME-2 satellite instruments, Atmos. Meas. Tech., 14, 4219–4238, https://doi.org/10.5194/amt-14-4219-2021, 2021. a
van Geffen, J., Boersma, K. F., Eskes, H., Sneep, M., ter Linden, M., Zara, M., and Veefkind, J. P.: S5P TROPOMI NO2 slant column retrieval: method, stability, uncertainties and comparisons with OMI, Atmos. Meas. Tech., 13, 1315–1335, https://doi.org/10.5194/amt-13-1315-2020, 2020. a, b, c, d, e, f, g, h, i, j
van Geffen, J. H. G. M., Eskes, H. J., Boersma, K. F., and Veefkind, J. P.: TROPOMI ATBD of the total and tropospheric NO2 data products, Report S5P-KNMI-L2-0005-RP, version 2.2.0, 2021-06-16, KNMI, De Bilt, The Netherlands, http://www.tropomi.eu/data-products/nitrogen-dioxide/ (last access: 7 March 2022), 2021. a, b, c, d, e, f, g, h, i, j, k
Veefkind, J. P., Aben, I., McMullan, K., Förster, H., de Vries, J., Otter, G., Claas, J., Eskes, H. J., de Haan, J.F., Kleipool, Q., van Weele, M., Hasekamp, O., Hoogeveen, R., Landgraf, J., Snel, R., Tol, P., Ingmann, P., Voors, R., Kruizinga, B., Vink, R., Visser, H. and Levelt, P. F.: TROPOMI on the ESA Sentinel-5 Precursor: A GMES mission for global observations of the atmospheric composition for climate, air quality and ozone layer applications, Remote Sens. Environ., 120, 70–83, https://doi.org/10.1016/j.rse.2011.09.027, 2012. a
Veefkind, J. P., de Haan, J. F., Sneep, M., and Levelt, P. F.: Improvements to the OMI O2–O2 operational cloud algorithm and comparisons with ground-based radar–lidar observations, Atmos. Meas. Tech., 9, 6035–6049, https://doi.org/10.5194/amt-9-6035-2016, 2016. a
Verhoelst, T., Compernolle, S., Pinardi, G., Lambert, J.-C., Eskes, H. J., Eichmann, K.-U., Fjæraa, A. M., Granville, J., Niemeijer, S., Cede, A., Tiefengraber, M., Hendrick, F., Pazmiño, A., Bais, A., Bazureau, A., Boersma, K. F., Bognar, K., Dehn, A., Donner, S., Elokhov, A., Gebetsberger, M., Goutail, F., Grutter de la Mora, M., Gruzdev, A., Gratsea, M., Hansen, G. H., Irie, H., Jepsen, N., Kanaya, Y., Karagkiozidis, D., Kivi, R., Kreher, K., Levelt, P. F., Liu, C., Müller, M., Navarro Comas, M., Piters, A. J. M., Pommereau, J.-P., Portafaix, T., Prados-Roman, C., Puentedura, O., Querel, R., Remmers, J., Richter, A., Rimmer, J., Rivera Cárdenas, C., Saavedra de Miguel, L., Sinyakov, V. P., Stremme, W., Strong, K., Van Roozendael, M., Veefkind, J. P., Wagner, T., Wittrock, F., Yela González, M., and Zehner, C.: Ground-based validation of the Copernicus Sentinel-5P TROPOMI NO2 measurements with the NDACC ZSL-DOAS, MAX-DOAS and Pandonia global networks, Atmos. Meas. Tech., 14, 481–510, https://doi.org/10.5194/amt-14-481-2021, 2021. a, b, c, d, e, f
Wang, P., Stammes, P., van der A, R., Pinardi, G., and van Roozendael, M.: FRESCO+: an improved O2 A-band cloud retrieval algorithm for tropospheric trace gas retrievals, Atmos. Chem. Phys., 8, 6565–6576, https://doi.org/10.5194/acp-8-6565-2008, 2008. a, b, c, d
Wang, P., Piters, A., van Geffen, J., Tuinder, O., Stammes, P., and Kinne, S.: Shipborne MAX-DOAS measurements for validation of TROPOMI NO2 products, Atmos. Meas. Tech., 13, 1413–1426, https://doi.org/10.5194/amt-13-1413-2020, 2020. a
World Health Organisation: Health Aspects of Air Pollution with Particulate Matter, Ozone and Nitrogen Dioxide, World Health Organisation, Bonn, Germany, EUR/03/5042688, 98 pp., https://apps.who.int/iris/handle/10665/107478 (last access: 22 March 2022), 2003. a
Zhang, X., Yin, Y., van der A, R., Eskes, H., van Geffen, J., Li, Y., Kuang, X., Lapierre, J. L., Chen, K., Zhen, Z., Hu, J., He, C., Chen, J., Shi, R., Zhang, J., Ye, X., and Chen, H.: Influence of convection on the upper tropospheric O3 and NOx budget in southeastern China, Atmos. Chem. Phys. Discuss. [preprint], https://doi.org/10.5194/acp-2021-650, in review, 2021. a
- Abstract
- Introduction
- Satellite data sources and data selection
- Updates in the SCD retrieval step
- Updates in the tropospheric VCD step
- Ground-based validation
- Improvements beyond data version 2.2
- Concluding remarks
- Appendix A: Additional figures and tables
- Data availability
- Author contributions
- Competing interests
- Disclaimer
- Acknowledgements
- Review statement
- References