the Creative Commons Attribution 4.0 License.
the Creative Commons Attribution 4.0 License.
 | 07 Apr 2022
Evaluating the consistency and continuity of pixel-scale cloud property data records from Aqua and SNPP (Suomi National Polar-orbiting Partnership)
Eric J. Fetzer
Likun Wang
Brian H. Kahn
Nadia Smith
John M. Blaisdell
Kerry G. Meyer
Mathias Schreier
Bjorn Lambrigtsen
Irina Tkatcheva
The Aqua, SNPP (Suomi National Polar-orbiting Partnership), and JPSS (Joint Polar Satellite System) satellites carry a combination of hyperspectral infrared sounders (AIRS, Atmospheric Infrared Sounder, and CrIS, Cross-track Infrared Sounder) and high-spatial-resolution narrowband imagers (MODIS, Moderate Resolution Imaging Spectroradiometer, and VIIRS, Visible Infrared Imaging Radiometer Suite). They provide an opportunity to acquire high-quality, long-term cloud data records and are a key component of the existing Program of Record of cloud observations. By matching observations from sounders and imagers across different platforms at the pixel scale, this study evaluates the self-consistency and continuity of cloud retrievals from Aqua and SNPP by multiple algorithms, including the AIRS version 7 retrieval algorithm and the Community Long-term Infrared Microwave Combined Atmospheric Product System (CLIMCAPS) version 2 for sounders and the standard Aqua MODIS collection 6.1 and the NASA MODIS–VIIRS continuity cloud products for imagers. Metrics describing detailed statistical distributions at the sounder field of view (FOV) and the joint histograms of cloud properties are evaluated. These products are found to be highly consistent despite their retrieval from different sensors using different algorithms. Differences between the two sounder cloud products are mainly due to cloud clearing and the treatment of clouds in scenes with unsuccessful atmospheric profile retrievals. The sounder subpixel cloud heterogeneity evaluated using the standard deviation of imager retrievals at the sounder FOV shows good agreement between the standard and continuity products from different satellites. However, the impact of algorithm and instrument differences between MODIS and VIIRS is revealed in cloud top pressure retrievals and in the imager cloud distribution skewness. Our study presents a unique aspect to examine NASA's progress toward building a continuous cloud data record with sufficient quality to investigate clouds' role in global environmental change.
- Article
(6914 KB) - Full-text XML
-
Supplement
(1108 KB) - BibTeX
- EndNote


Clouds play an important role in Earth's energy balance and hydrological cycle. They occur with processes involving atmospheric radiation, thermodynamics, and dynamics at various spatial and temporal scales, making clouds a crucial component of the weather and climate system. With daily regional and global coverage, space observations provide a unique vantage point to monitor the change of the cloud properties in the climate system across different timescales. This offers an important observational basis to resolve cloud processes in the background atmospheric circulation, which is widely recognized as a critical challenge within Earth sciences (Bony et al., 2015; IPCC, 2013). The 2017 US National Academy Decadal Survey (National Academies of Sciences, Engineering, and Medicine, 2018) has noted the importance of long-term and sustained observations of many key components of the Earth system, including continuity measurements of clouds. Many of these observations are obtained from the existing Program of Record (POR). Since the “POR forms the foundation upon which the committee's recommendations are established” (National Academies of Sciences, Engineering, and Medicine, 2018), it is crucial to evaluate whether a self-consistent and continuous POR for cloud-related variables is indeed available with sufficient data quality and spatiotemporal coverage.
Cloud retrievals from the NASA's Earth Observing System (EOS) satellites, including Terra and Aqua, the joint NASA–NOAA Suomi National Polar-orbiting Partnership (SNPP), and NOAA's new generation of Joint Polar Satellite System (JPSS) series weather satellites, are a key component in the POR for cloud properties. Through efforts on continuity and consistency by rigorous instrument mission design and ongoing algorithm development, these satellites provide high-quality, long-term cloud data records derived from the top-of-atmosphere (TOA) radiances observed across a wide range of the emission and reflection spectrum. Particularly, Aqua, SNPP, and JPSS-1 (now NOAA-20), which were launched in 2002, 2011, and 2016, respectively, carry high-spatial-resolution narrowband imagers, hyperspectral infrared (IR) sounders, and microwave (MW) sounding measurements. As a result, observations with a similar spatial resolution and coverage and similar spectral resolution at analogous wavelengths are obtained from different satellites. For Aqua, this instrument trio consists of the Atmospheric Infrared Sounder (AIRS), the Advanced Microwave Sounding Unit (AMSU), and the Moderate Resolution Imaging Spectroradiometer (MODIS). For SNPP and JPSS, the trio includes the Cross-track Infrared Sounder (CrIS), the Advanced Technology Microwave Sounder (ATMS), and the Visible Infrared Imaging Radiometer Suite (VIIRS).
Retrieval algorithms to maintain the continuity of the data records across these platforms have been developed. For joint retrievals by IR and MW sounders such as AIRS–AMSU and CrIS–ATMS, the Community Long-term Infrared Microwave Combined Atmospheric Product System (CLIMCAPS; Smith and Barnet, 2019) provides cloud properties together with vertical profiles of atmospheric temperature, water vapor, and trace gases, as well as surface conditions. For imagers like MODIS and VIIRS, the NASA MODIS–VIIRS continuity cloud products have been developed for both cloud mask (CLDMSK; Frey et al., 2020) and cloud optical properties (CLDPROP; Platnick et al., 2021). These continuity algorithms have heritage with NASA operational retrieval products previously developed for individual sensors and satellites, such as the AIRS Science Team retrieval algorithm version 7 (AIRS V7, Yue and Lambrigtsen, 2017, 2020) in the case of CLIMCAPS and the standard Terra and Aqua MODIS collection 6.1 cloud retrievals (MOD35–MYD35 and MOD06–MYD06; Baum et al., 2012; Platnick et al., 2017b) in the case of MODIS–VIIRS. However, significant differences exist between the standard and continuity algorithms, as the focus of the continuity algorithms is to minimize the impact of the instrument between platforms.
The sounder–imager combination on the same sun-synchronous polar-orbiting satellite, together with the temporal coverage overlap between satellites, provides opportunities for utilizing spectral and spatial capabilities from different sensors at the global scale. Previous studies have shown the benefits of using the combined information to intercalibrate and test radiometric consistency among sensors (Tobin et al., 2006; Schreier et al., 2010; Wong et al., 2015; Gong et al., 2018), cross-validate the retrievals (Nasiri et al., 2011; Kahn et al., 2014), further improve atmospheric and surface geophysical parameter retrievals (Irion et al., 2018; Yao et al., 2015), provide simultaneous observations to resolve complex physical processes (Yue et al., 2013, 2016, 2019; McCoy et al., 2017), quantify the subpixel heterogeneity (Li et al., 2004; Kahn et al., 2015), and enhance the utilization of satellite observations in numerical weather prediction and climate models (Eresmaa, 2014). Therefore, the sounder–imager combination is an important aspect of data record continuity and consistency among sensors across different platforms. This helps provide robust monitoring of long-term changes in cloud properties, an important capability expected from the POR.
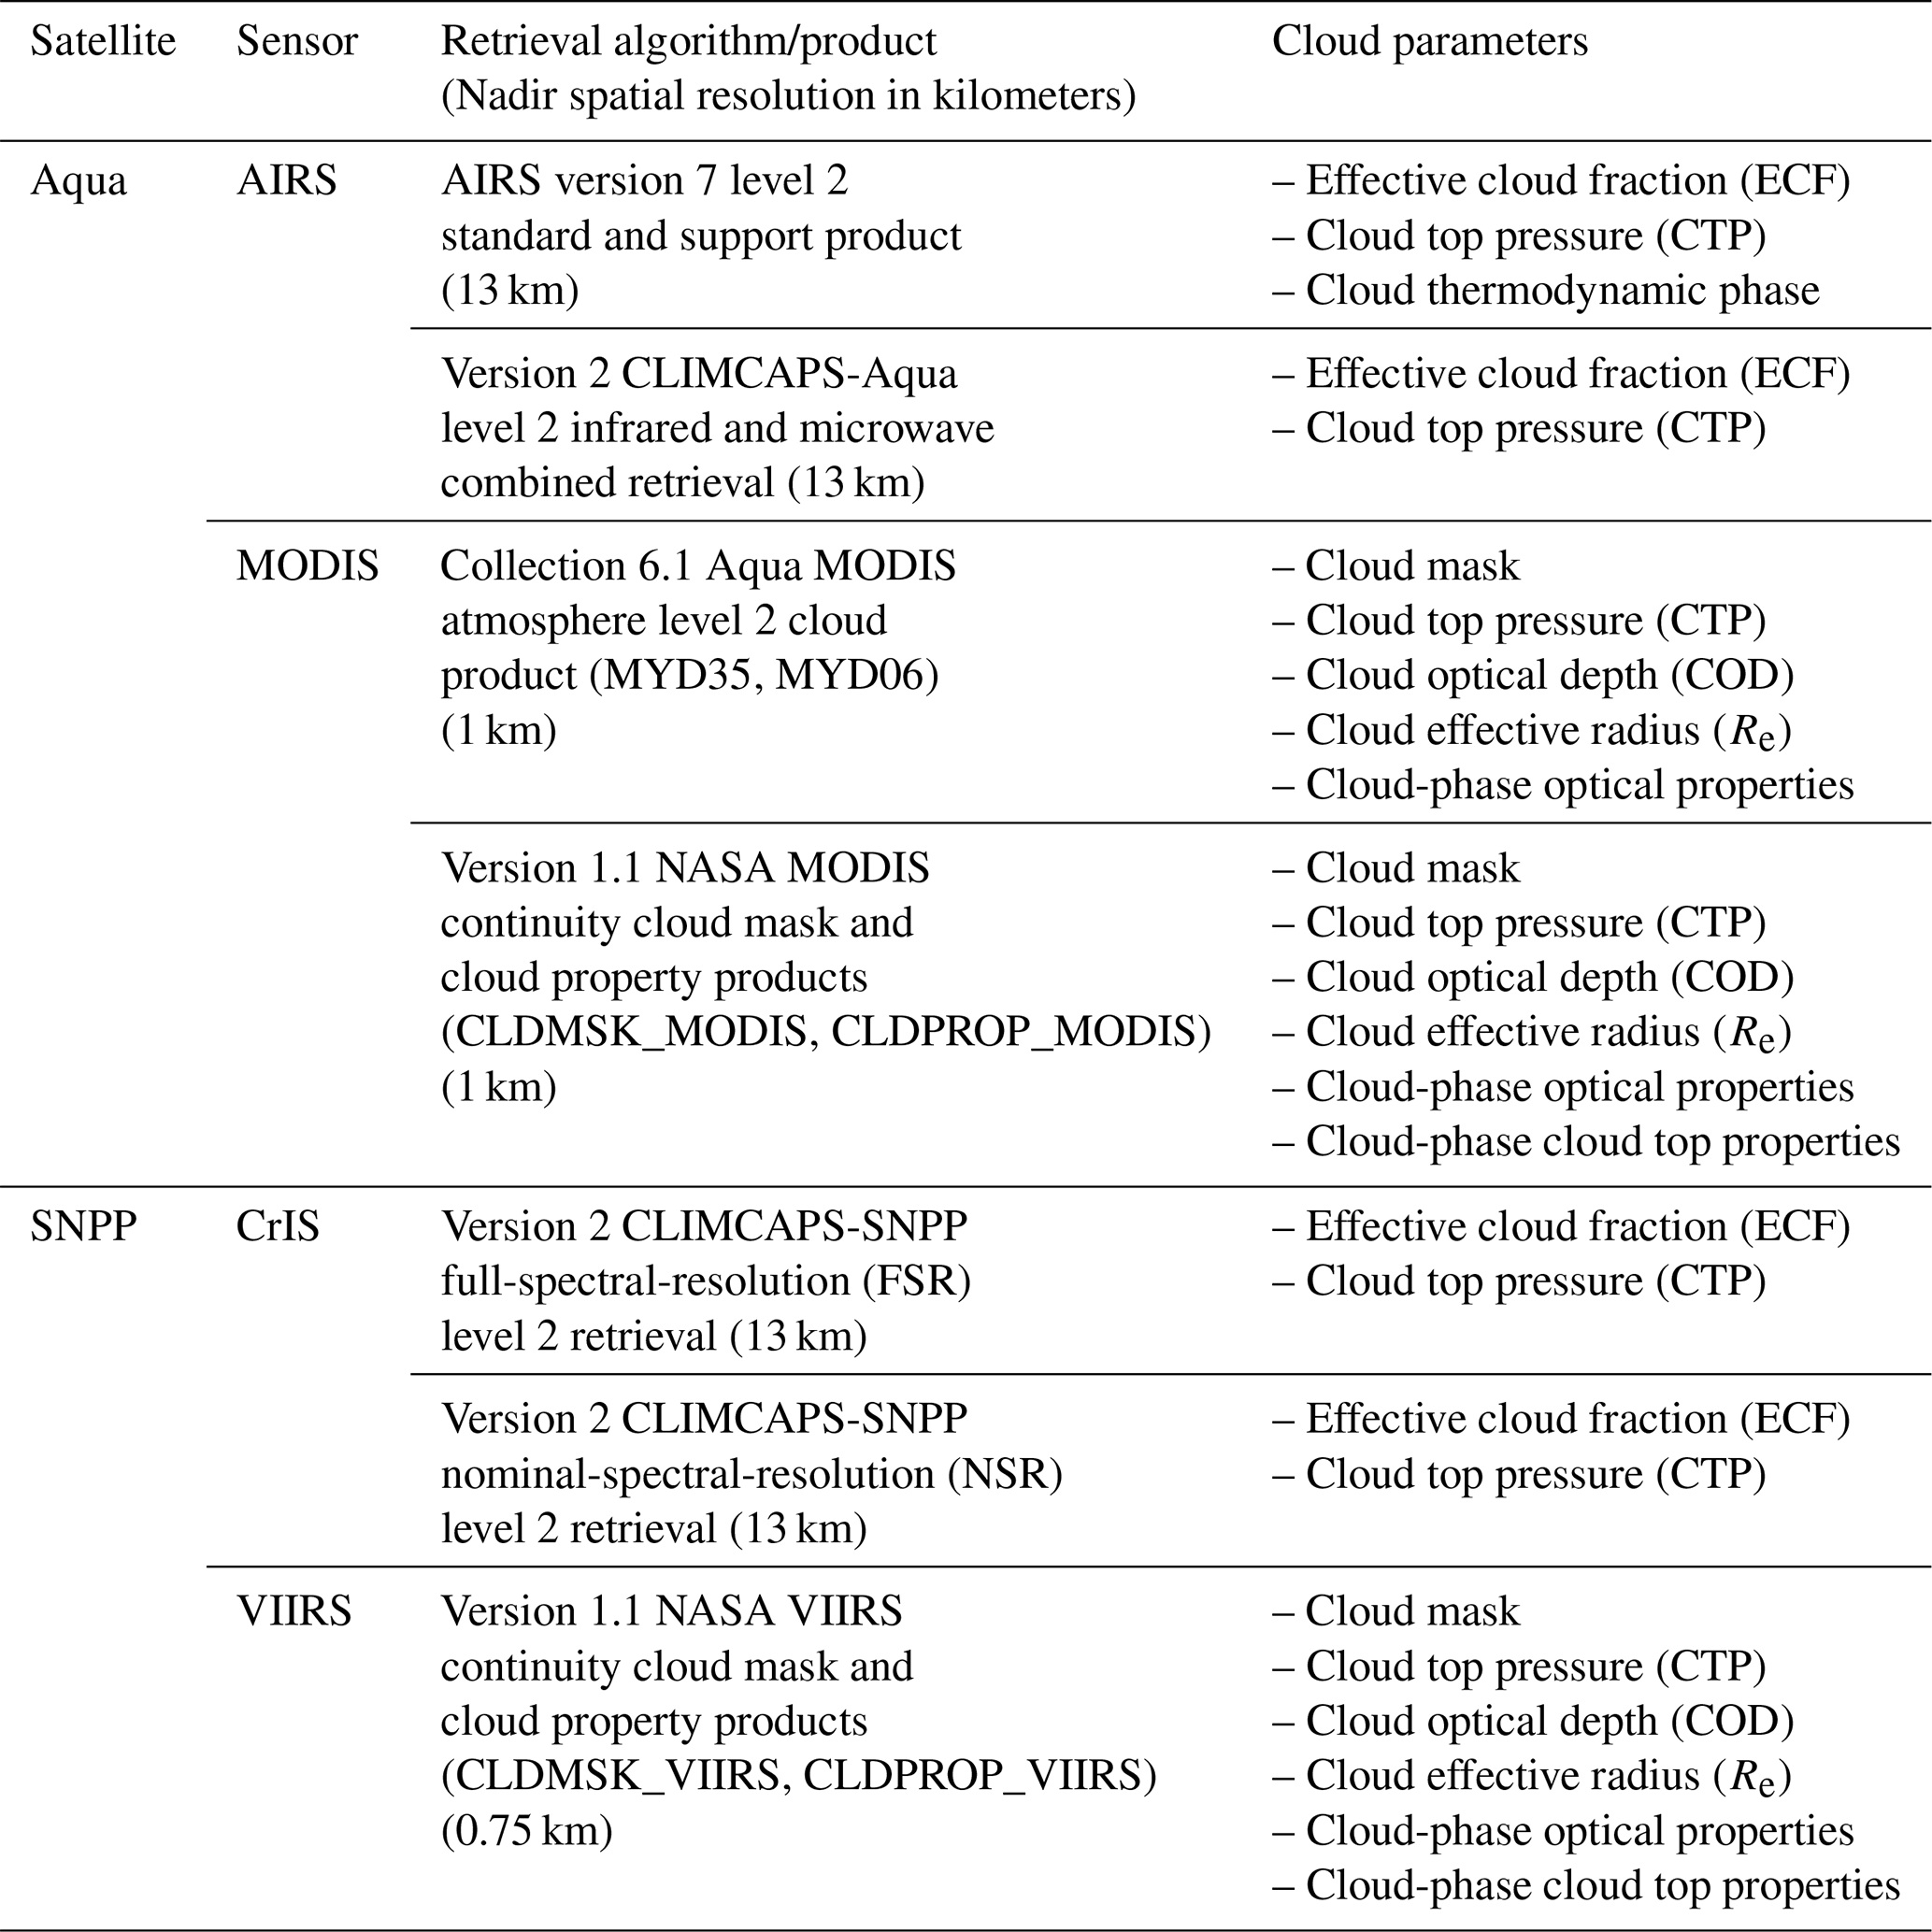
Pixel-scale analyses are an effective and unique way to investigate the consistency and continuity of these data records because of the one-to-one relationships established by these comparisons and their direct links to algorithm performance. This includes examining differences of (1) the same physical parameters observed by different sensors or satellites but processed using the same (or similar) algorithms and (2) the same parameters obtained from the same sensor but from different algorithms. Both of these differences are quantified at the pixel scale in this study. The cloud properties determined by the sounder and imager pairs on board Aqua and SNPP, namely AIRS–MODIS and CrIS–VIIRS, are investigated using the collocated sounder–imager fields of view (FOVs) for sets of pixels obtained during simultaneous nadir observations (SNOs) between Aqua AIRS and SNPP CrIS. This approach ensures nearly identical viewing geometry by the two satellites while pixel-scale cloud assessment is carried out by comparing cloud parameters determined by hyperspectral IR sounders and high-spatial-resolution imagers at the minimum spatial scale of individual instrument fields of view. Using this approach, products from both the heritage NASA standard retrieval algorithms and the newly developed continuity cloud algorithms are analyzed (Table 1). This is essential for retrieval algorithm development and cross validation of multiple sensors and products on Aqua and SNPP and also important for data continuity extending to future JPSS satellites.
Table 1The satellite cloud parameters examined in this study and the retrieval algorithms and products from which these parameters are obtained.
This article is organized as follows. Section 2 describes various cloud products and their retrieval algorithms analyzed in this study, as well as the method used to create pixel-scale collocated datasets between sounders and imagers across different satellites. Section 3 shows the detailed comparisons of cloud properties and their joint histograms from different algorithms and sensors and the discussions on implications on retrieval algorithm development and instrument differences. A summary and set of conclusions are presented in Sect. 4.
2.1 Cloud products and algorithms
Table 1 summarizes the cloud parameters analyzed in this study from various level 2 (L2) retrieval products derived from the sounders and imagers aboard Aqua and SNPP. For AIRS and MODIS, both the standard operational and continuity products are evaluated: the AIRS V7 and CLIMCAPS-Aqua version 2 (V2) retrievals for AIRS and the collection 6.1 Aqua MODIS atmosphere level 2 cloud product (MYD06) and version 1.1 NASA Aqua MODIS continuity cloud property products (CLDPROP_MODIS). For SNPP CrIS and VIIRS, only the continuity products are evaluated, which are the V2 CLIMCAPS-SNPP and version 1.1 SNPP-VIIRS continuity cloud property products (CLDPROP_VIIRS). The CLIMCAPS-SNPP products were produced using version 2 of the CrIS level 1B product in nominal spectral resolution (NSR) and full spectral resolution (FSR), which differ in the spectral resolution of the shortwave and mid-IR CrIS observations transmitted from SNPP (Monarrez et al., 2020). The spectral-resolution differences cause subtle differences between the CLIMCAPS FSR and NSR retrievals, especially in the upper-tropospheric humidity and trace gases (Wang et al., 2021).
In both the AIRS V7 and CLIMCAPS algorithms for AIRS and CrIS, the radiatively effective cloud amount (effective cloud fraction, ECF) and cloud top pressure (CTP) are retrieved by matching the calculated cloudy radiances with the observed radiances for a set of channels that are sensitive to clouds. Then the cloud top temperature (CTT) is derived as the atmospheric temperature matching the retrieved CTP. In this process, best estimates of surface and atmospheric parameters are used to calculate the cloudy radiances, either from the a priori state or from the physical retrieval after the cloud-clearing step (Susskind et al., 2003, 2006; Smith and Barnet, 2019). The cloud-clearing approach (Chahine, 1974) is applied in both the AIRS Science Team algorithms and CLIMCAPS. It predicts a single cloud-cleared radiance at one AMSU or ATMS field of regard (FOR) using a priori temperature, water vapor, and surface information and a linear combination of IR radiances from nine AIRS or CrIS FOVs that are co-registered with one AMSU or ATMS FOR (Susskind et al., 2003). The cloud-cleared radiances are subsequently used to retrieve surface and atmospheric parameters. Flowcharts of the retrieval steps and differences in these two sounder retrieval systems are given in Thrastarson et al. (2021b).
The ECF is the product of cloud areal fraction and the IR cloud emissivity, the latter of which is assumed to be spectrally flat in the retrieval of ECF (Susskind et al., 2003). Previous studies show that the AIRS ECF is consistent with the cloud properties such as the cloud frequency and cloud optical depth measured by CloudSat and MODIS (Yue et al., 2011; Kahn et al., 2014). The AIRS and CrIS retrievals of ECF and cloud top properties (CTT and CTP) are reported for up to two cloud layers in each IR sounder FOV (∼13.5 km spatial resolution at nadir).
There are distinct differences between the AIRS V7 and CLIMCAPS V2 algorithms regarding cloud retrievals as summarized here. The first major difference is how cloud clearing is iterated in the retrieval flow. The second major algorithm difference is quality control (QC) procedures when (1) the physical retrieval of atmosphere and surface is not successful and (2) the final-stage cloud clearing is not successful (Susskind et al., 2014). The third major difference is the choice of the prior states for the two algorithms. The AIRS Science Team algorithms, including both V6 and V7, iterate cloud clearing multiple times, and cloud parameters are determined after the last iteration of cloud clearing using the retrieved surface and atmospheric conditions (Fetzer et al., 2020). In contrast, CLIMCAPS V2 performs a single cloud-clearing pass, and cloud properties are retrieved using the surface and atmospheric parameters from successful retrievals of surface and atmospheric properties (Smith and Barnet, 2019; Thrastarson et al., 2021a, b). The QC procedure used in the two sounder cloud retrievals are also different. AIRS V7 produces case-by-case QC indicators for each retrieved variable, while CLIMCAPS V2 derives one QC value based on the cloud-clearing and retrieval status of temperature and water vapor, and the same QC value is assigned to all retrieved variables for the given FOV, including the cloud parameters. Particularly, in AIRS V7 cloud retrieval process, the final stage of cloud clearing and cloud retrievals uses the retrievals of the surface and atmospheric variable, except for cases over ocean when the retrieved surface temperature differs from the first guess by more than 5 K. For these cases, the a priori surface temperature and surface emissivity are used instead, and cloud properties retrieved under this condition are flagged as valid with QC=1, indicating successful cloud retrievals but potentially higher uncertainty than QC=0. This surface test effectively filters out cases when the cloud top is misidentified as surface and causes extremely small ECF values for overcast cloudy conditions over ocean. For ∼1 % of cases the final cloud retrieval step does not complete successfully, and a QC=2 flag is assigned to cloud parameters to indicate invalid retrievals. As a result, the AIRS V7 cloud retrievals produce a much higher percentage of cases with successful cloud retrievals (cloud variable QC=0 or QC=1) than its temperature and water vapor profile products. For CLIMCAPS V2, cloud clearing is not iterated and cloud parameters follow the QC procedure in the physical atmospheric-state retrievals. As a result, a much larger number of cases with QC=2 cloud retrievals are reported by CLIMCAPS V2 compared to AIRS V7, especially for cloudier conditions or cases with large cloud-clearing errors, typically those FORs with low cloud contrast between associated FOVs. Different a priori data in the two retrieval systems impact their cloud retrievals. AIRS V7 uses the stochastic cloud clearing–neural network (SCCNN) solution as a priori data on atmospheric temperature and water vapor profiles and surface temperature trained using a few months of AIRS–AMSU radiances and European Center for Medium-Range Weather Forecasting (ECMWF) Integrated Forecast System (IFS) 3-hourly forecast fields that are collocated to AIRS observations (including updates since CY31R1, https://www.ecmwf.int/en/forecasts/documentation-and-support/changes-ecmwf-model, last access: 1 November 2021) (Milstein and Blackwell, 2016). For land and sea ice surface emissivity prior estimates, AIRS V7 uses the University of Wisconsin–Madison Baseline Fit Emissivity Database (Seemann et al., 2008), which is based on the monthly climatology of the MODIS land surface emissivity product (MOD11) in 2008 (Thrastarson et al., 2021a). The CLIMCAPS system (Smith and Barnet, 2020; Smith et al., 2021), instead, uses concurrent fields from the version 2 Modern-Era Retrospective analysis for Research and Application (MERRA-2, Gelaro et al., 2017) as the a priori data and implements the Combined ASTER (Advanced Spaceborne Thermal Emission and Reflection Radiometer) and MODIS Emissivity for Land database (Hook, 2019; Borbas et al., 2018; Feltz et al., 2018). Over ocean, both systems use the Masuda IR sea surface emissivity model (Masuda et al., 1988) as modified by Wu and Smith (1997). Since the a priori temperature, water vapor, and surface properties are used in the cloud-clearing step, differences in the a priori data contribute to the differences between the retrieval products, including cloud properties (Yue and Lambrigtsen, 2020; Yue et al., 2021). Cloud clearing plays an important role in both retrieval systems, and physical retrievals of surface and atmospheric parameters are obtained from the cloud-cleared radiances, which, in turn, impact the determination of cloud properties.
In addition to these major differences, the two sounder retrieval systems differ in the prior estimates used for ECF and CTP. CLIMCAPS starts the cloud retrieval with background estimates of 0.5 and 0.25 ECF at 350 and 800 hPa CTP for the upper and lower cloud layers, respectively. AIRS V7 uses ECF at 350 hPa for the upper layer and ECF at 850 hPa (or 100 hPa above surface in elevated terrain) for the lower cloud layer. However, since the final cloud retrievals of both systems are shown to diverge significantly from their prior data (Yue and Lambrigtsen, 2020; Yue et al., 2021), it is unlikely that different cloud prior estimates are a main contributor to the sounder cloud retrieval product differences.
Although their spectral resolution is coarser than that of AIRS and CrIS, instruments like MODIS and VIIRS provide high-spatial-resolution cloud properties through information in multiple narrowband channels covering the visible and IR spectral regions. However, significant differences exist between the two imagers. MODIS measures the reflectance or radiance in 36 spectral bands, while VIIRS has an analogous subset of these bands (20 channels) plus a day/night visible channel (Oudrari et al., 2015). The lack of near-IR and IR water vapor and CO2 absorption channels in VIIRS has important implications on the available information content for clouds with respect to MODIS. This impacts the determination of clouds, especially the detection of multilayer clouds and clear sky in polar night conditions, and the determination of cloud thermodynamic phase. It also impacts the retrieval of cloud top properties, especially for high thin clouds. Moreover, the difference of spectral location of the VIIRS 2.25 µm channel compared to the analogous 2.13 µm MODIS channel has implications on the retrievals of cloud particle size, optical depth, and thermodynamic phase (Platnick et al., 2020), which will be briefly summarized in the following discussions. On the other hand, VIIRS provides a higher spatial resolution of 750 m at nadir in cloud property retrievals, compared to the 1 km resolution in the collection 6.1 MYD06 and cloud mask products. In addition, VIIRS has an onboard detector aggregation scheme that limits the across-swath pixel growth. The VIIRS edge-of-scan pixel size is roughly 1.625 km×1.625 km versus roughly 2 km×4.9 km for MODIS (Platnick et al., 2021). The MYD06 products have been shown to provide stable and well-characterized cloud data records since 2002 (e.g., Yue et al., 2017). Given these instrument differences between MODIS and VIIRS and a need to develop a continuous data record extending beyond the MODIS era, the MODIS–VIIRS cloud mask (CLDMSK; Frey et al., 2020) and cloud top and optical-property (CLDPROP; Platnick et al., 2021) continuity algorithms were developed. By applying common algorithms to a subset of channels available on both instruments, the continuity algorithms accommodate the detailed channel differences between the two instruments while maximizing the information content on cloud parameters.
The continuity CLDPROP products use only spectral channels common to both MODIS and VIIRS. The algorithm has direct heritage with the collection 6.1 MODIS atmosphere cloud retrievals (MYD06), with cloud top property datasets provided by the CLouds from AVHRR (Advanced Very High Resolution Radiometer) – Extended (CLAVR-x) processing system (Heidinger et al., 2012, 2014) to account for more limited information for cloud top property retrieval. CLAVR-x produces cloud phase reported as Cloud_Phase_Cloud_Top_Properties in the MODIS–VIIRS continuity cloud products. Since VIIRS does not have IR channels in the 13 µm CO2 absorption band, the MODIS CO2-slicing solution for cloud top pressure retrievals for cold clouds is replaced with an IR window channel optimal estimation approach coupled with CALIPSO-derived (Cloud-Aerosol Lidar and Infrared Pathfinder Satellite Observations) a priori data (Heidinger et al., 2019). This in turn affects the optical-property cloud-phase algorithm (reported as Cloud_Phase_Optical_Properties in CLDPROP products), which removes the cold-cloud sanity check applied in the MOD06–MYD06 that is based on the CO2-slicing solution. The spectral mismatch of the MODIS 2.13 µm and VIIRS 2.25 µm channels also bring further changes to the Cloud_Phase_Optical_Properties retrieval by modifying the spectral cloud effective radius (Re) test approach. In the version 1.1 MODIS–VIIRS continuity cloud product used in this study, the 2.25 µm test is omitted, and the 1.61 µm test is duplicated. Moreover, this channel spectral differences compel changes in the lookup tables (LUTs) of spectral liquid cloud reflectance used in the retrieval, which include the use of an updated liquid water imaginary index-of-refraction dataset in the shortwave infrared region (Kou et al., 1993) and an updated complex index-of-refraction dataset for 3.7 µm (Wagner et al., 2005). Such differences in LUTs result in changes of cloud effective particle size (Re) (Platnick et al. (2020) that, along with cloud optical depth (COD), are used to derive cloud water path. Moreover, the ice crystal absorption at 2.25 µm is weaker than that at 2.13 µm. Differences with the collection 6.1 MODIS cloud retrieval algorithms, as well as inter-sensor differences between MODIS and VIIRS, have been reported in detail in recent studies such as Frey et al. (2020) and Platnick et al. (2021), which are based on granule comparisons and long-term mean statistics.
2.2 Simultaneous nadir observations (SNOs) of collocated satellites
The pixel-scale comparisons will use SNOs between Aqua AIRS and SNPP CrIS. These SNOs contain pixel pairs of observations from the two instruments when they observe the same location at approximately the same scan angle and time. The AIRS CrIS SNOs used herein were originally developed by the Jet Propulsion Laboratory (JPL) Sounder Science Investigator-led Processing System (SIPS) for inter-calibration of two sounders (Manning and Aumann, 2015). In order to ensure a close match between the instruments, the following criteria are used to identify candidate SNOs.
-
FOV centers between Aqua AIRS and SNPP CrIS are within 8 km.
-
Observations are made within 10 min.
-
Both instruments observe within 3.3∘ of nadir, which corresponds with ±1 FOR of AMSU for AIRS or ATMS for CrIS.
2.3 Pixel-scale collocations of imagers and sounders
Utilizing the multi-sensor capability at the pixel scale requires accurate and computationally efficient collocation of sounder and imager measurements. Various collocation methods exist (Schreier et al., 2010; Nagle and Holz, 2009; Yue et al., 2013). In this study, the method developed by Wang et al. (2016) is applied by matching the instantaneous multi-sensor observations directly based on line-of-sight (LOS) pointing vectors, defined as the vector from the satellite position to the Earth surface pixel location. The details of this method and its accuracy are discussed at length in Wang et al. (2016).
In this study, the same collocation method is applied to both Aqua and SNPP to match the finer-resolution imager pixels (MODIS and VIIRS) within a given sounder FOV (AIRS and CrIS). The LOS vectors are calculated using the geolocation datasets for different sensors, which contain latitude, longitude, satellite range, satellite azimuth, and zenith angles. Collocation is performed using the criterion that the angular difference between the LOS vectors for sounder and imager should be less than half of the sounder FOV size angle. The CrIS FOV is treated as a 0.963∘ circle which corresponds to ∼41 % of the peak response and collects ∼98 % of total radiation falling on the detector (Wang et al., 2013). AIRS has a FOV half-power width of 1.1∘ (Fishbein et al., 2001). However, 0.963∘ is used for both AIRS and CrIS in the collocation. After obtaining collocation indices, the L2 cloud properties from both the imagers and sounders are populated accordingly. The high-spatial-resolution information from MODIS and VIIRS is retained using higher statistical moments and frequency distributions of cloud properties retrieved by imagers within the collocated sounder FOV. These statistical metrics include the mean, standard deviation, skewness, and kurtosis of MODIS and VIIRS cloud properties; the occurrence frequency of cloud types and cloud phase reported by the variables of cloud mask and cloud thermodynamic phase; and joint histograms on the COD and CTP two-dimensional space following the convention of the International Satellite Cloud Climatology Project (ISCCP, Rossow and Schiffer, 1999). In addition to summarizing fine imager spatial information over a coarser-resolution sounder instrument, these statistical metrics physically describe a variety of cloud processes at both regional and global scales for a range of cloud types in different climate regimes, which are particularly relevant to sub-grid cloud parameterization in numerical models (e.g., Zhu and Zuidema, 2009; Kawai and Teixeira, 2010, 2012; Kahn et al., 2017). The ISCCP type of joint histograms have been widely used to dissect the uncertainty of the cloud radiative forcing (e.g., Pincus et al., 2012) and climate feedback (e.g., Zelinka et al., 2012; Yue et al., 2016, 2019) by cloud regimes (e.g., Oreopoulos et al., 2016).
By combining the SNOs and the sounder–imager collocated datasets, a multi-sensor multi-satellite investigation is conducted to evaluate, at the pixel scale, the self-consistency of cloud properties, to benchmark data continuity from the US polar-orbiting operational environmental satellites.
Both Aqua and SNPP are in the 13:30 local equatorial crossing time sun-synchronous polar orbits but at different altitudes. This altitude difference gives a ∼2.667 d repeating pattern for AIRS and SNPP CrIS observations at the same location. Accordingly, the number of SNOs between these two IR sensors varies with time, and a large fraction are located at the high latitudes. In this study, 7 focus days in January 2016 are selected for their large numbers of SNO pairs and the full operation for all four instruments. Table 2 lists the focus days and gives the number of observations obtained on each day. Figure 1 shows the latitudinal distribution of the focus day SNOs (black bars, y axis on the left, Table 2). A significant number of observations (>2500) are available at all latitudes, including the midlatitudes and tropics, where SNOs are harder to obtain.
Table 2Number of SNOs between Aqua AIRS and SNPP CrIS on the 7 focus days used in this study.
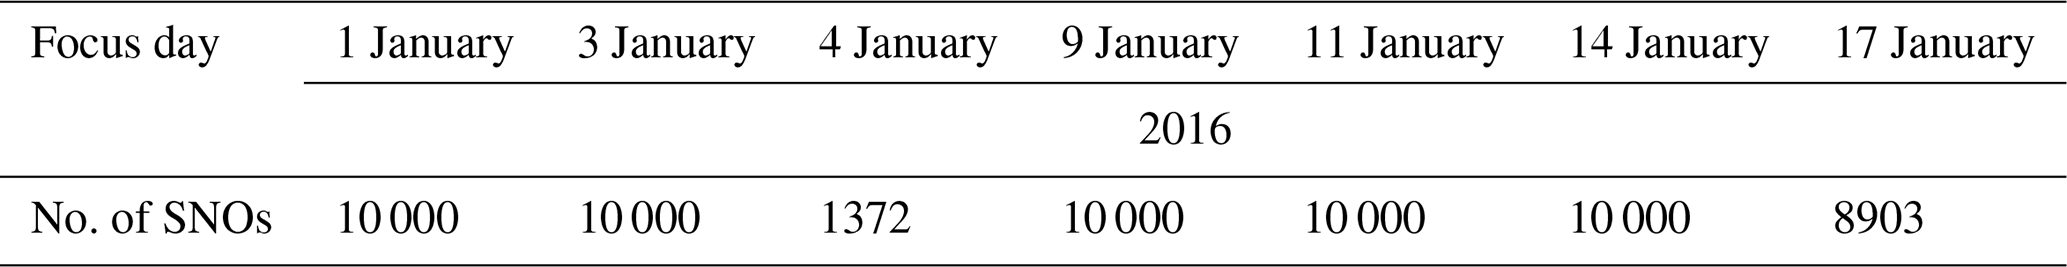
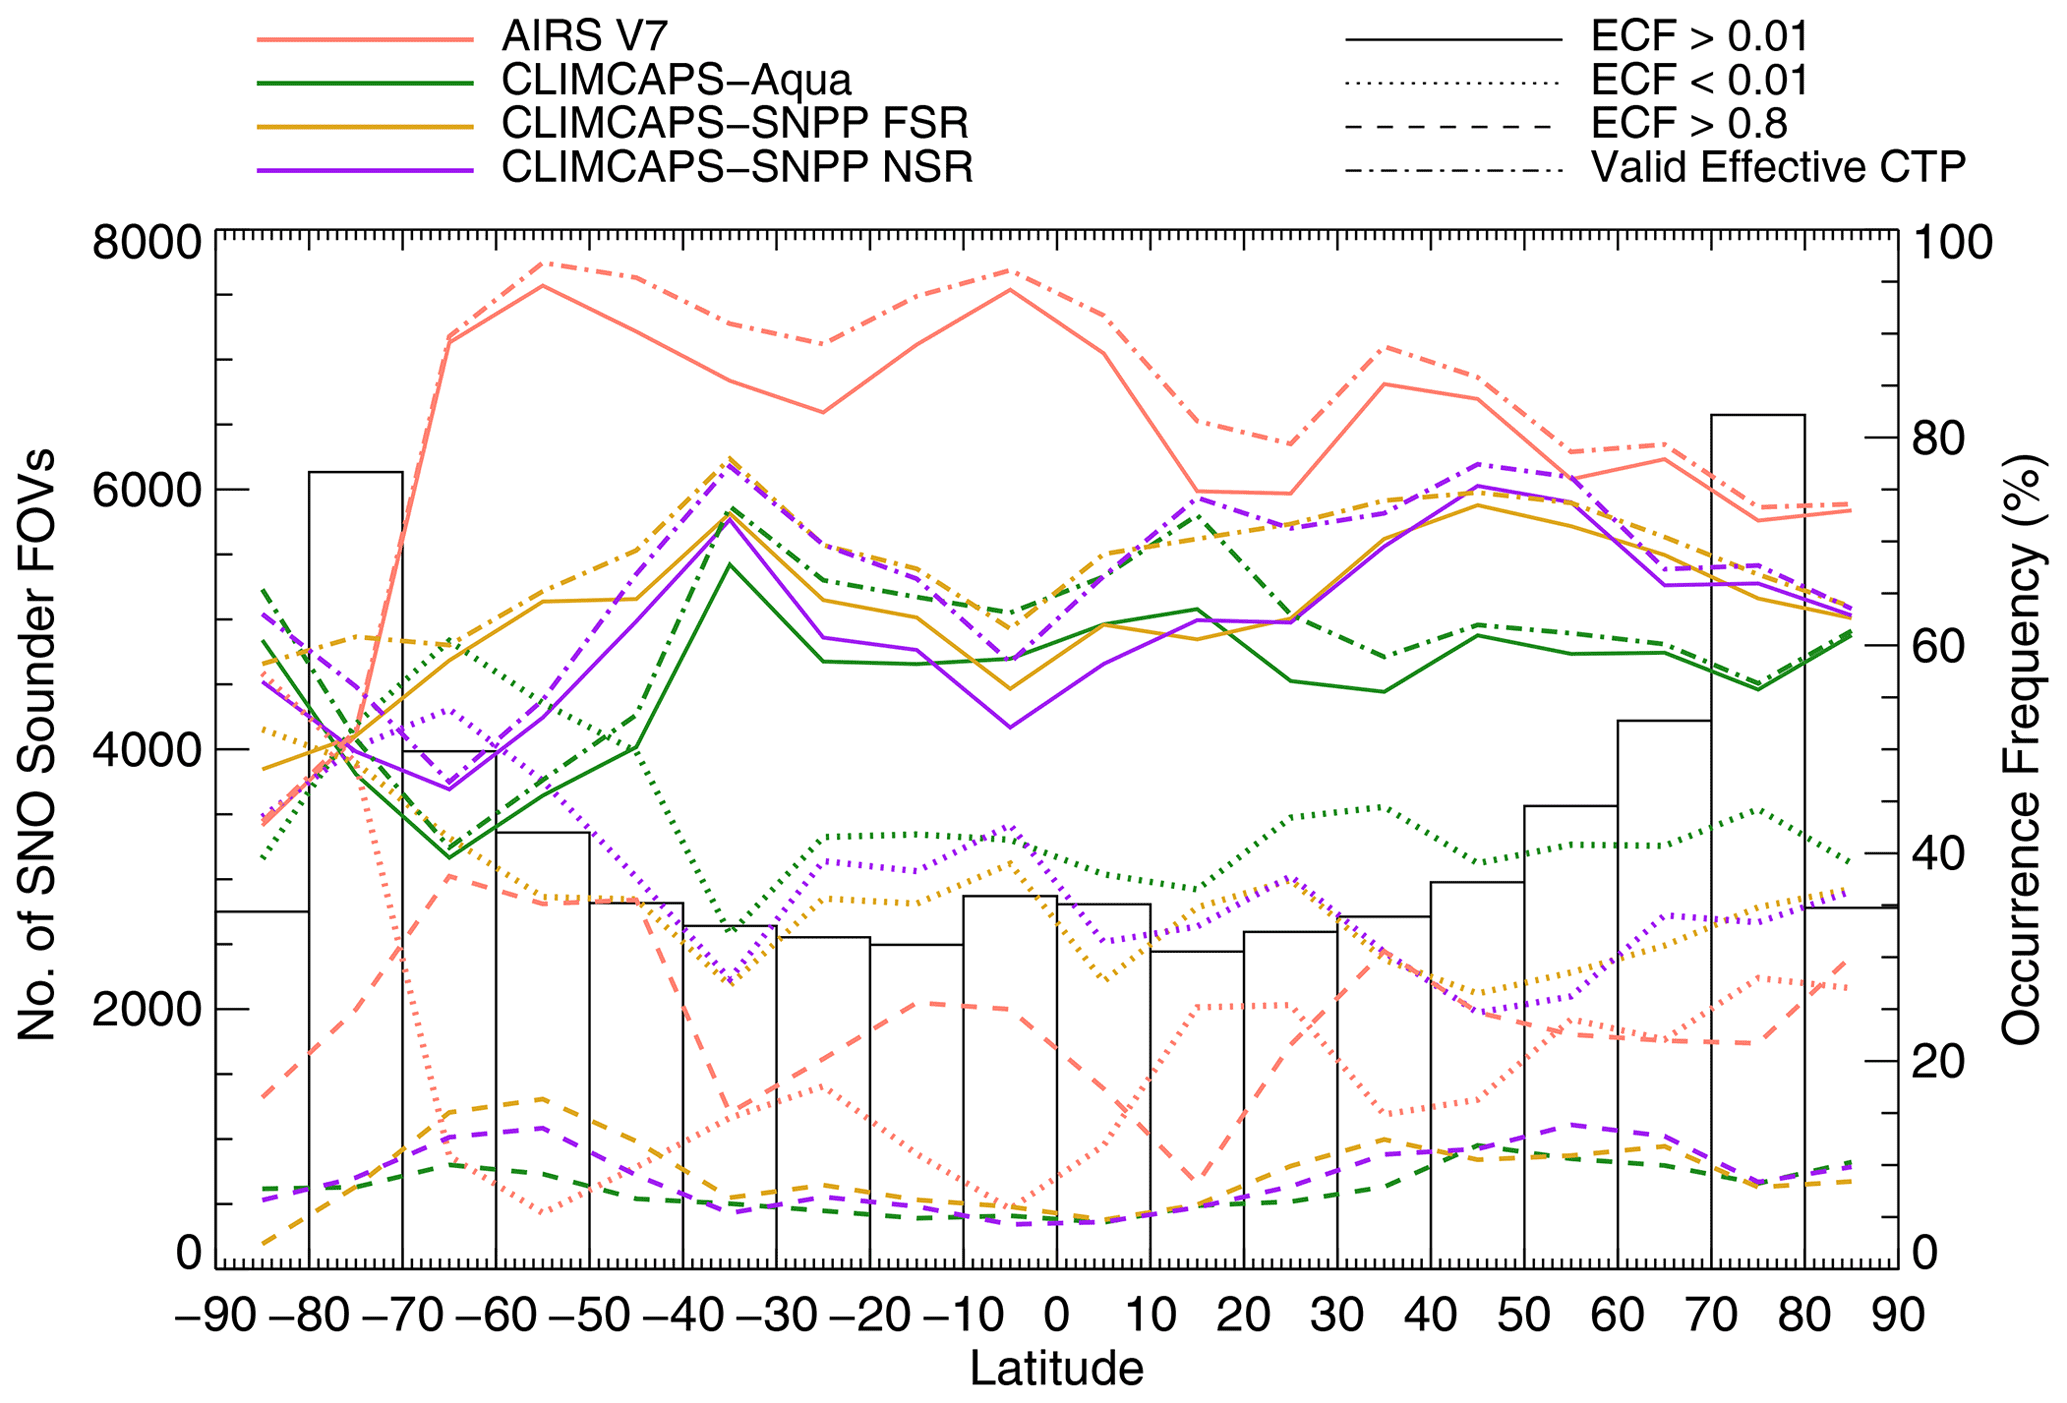
Figure 1The latitudinal distribution of the SNO pairs for Aqua AIRS and SNPP CrIS (black bars) and the occurrence frequencies of various sounder retrieved cloud parameters (right y axis, %) for four composites that satisfy the following four conditions, respectively: ECF >0.01 (solid lines, general cloudy condition), ECF ≤0.01 (dotted lines, clear or very thin clouds), ECF >0.8 (dashed lines, overcast or very thick clouds), and cases with successful CTP retrievals (dash-dotted lines, QC for CTP is 0 or 1). Data from the 7 focus days are used (see Table 2) and binned by latitude of the sounder FOVs in 10∘ latitude bins. Four different sounder retrieval products are shown by colored lines: AIRS version 7 (AIRS V7, pink), CLIMCAPS-Aqua (green), CLIMCAPS-SNPP FSR (yellow), and CLIMCAPS-SNPP NSR (purple). Occurrence frequency is calculated as the percentage of AIRS or CrIS FOVs with successful cloud retrievals (quality control indicator is 0 or 1) satisfying the aforementioned four conditions to the total number of FOVs in each latitudinal bin.
Figure 2 shows the latitudinal variations of cloud frequency and zonal-mean ECF and COD based on the data from the 7 focus days. To determine the detection of clouds in the sounder FOV, two threshold values of ECF are used: 0.05 (solid lines) and 0.01 (dashed lines). For MODIS and VIIRS, the frequency of cloudy and uncertain cases as reported by the cloud mask variable is shown for the MYD06 (black), MODIS continuity (red), and VIIRS continuity (blue) cloud products. Although it is difficult to directly compare the mean cloud properties retrieved by imagers and sounders; AIRS V7 produces similar general patterns of latitudinal variation of cloud frequency with the imager products, which shows peaks of cloud occurrence in the tropics and midlatitude storm tracks and troughs in the subtropics. However, CLIMCAPS V2 cloud retrievals do not show these variations, and its mean ECF values are much lower than AIRS V7 at all latitudes. A higher percentage of cloud frequency in the low-latitude regions is reported by AIRS V7 than by imagers, consistent with previous findings showing higher sensitivity of hyperspectral IR sounders to optically thin clouds (Kahn et al., 2014; Yue et al., 2016). An increase of COD with latitude at midlatitude to high-latitude regions is detected by imagers, compared to a nearly flat or even decreasing mean ECF retrieved by the sounders. These differences will be further assessed in the following discussions.
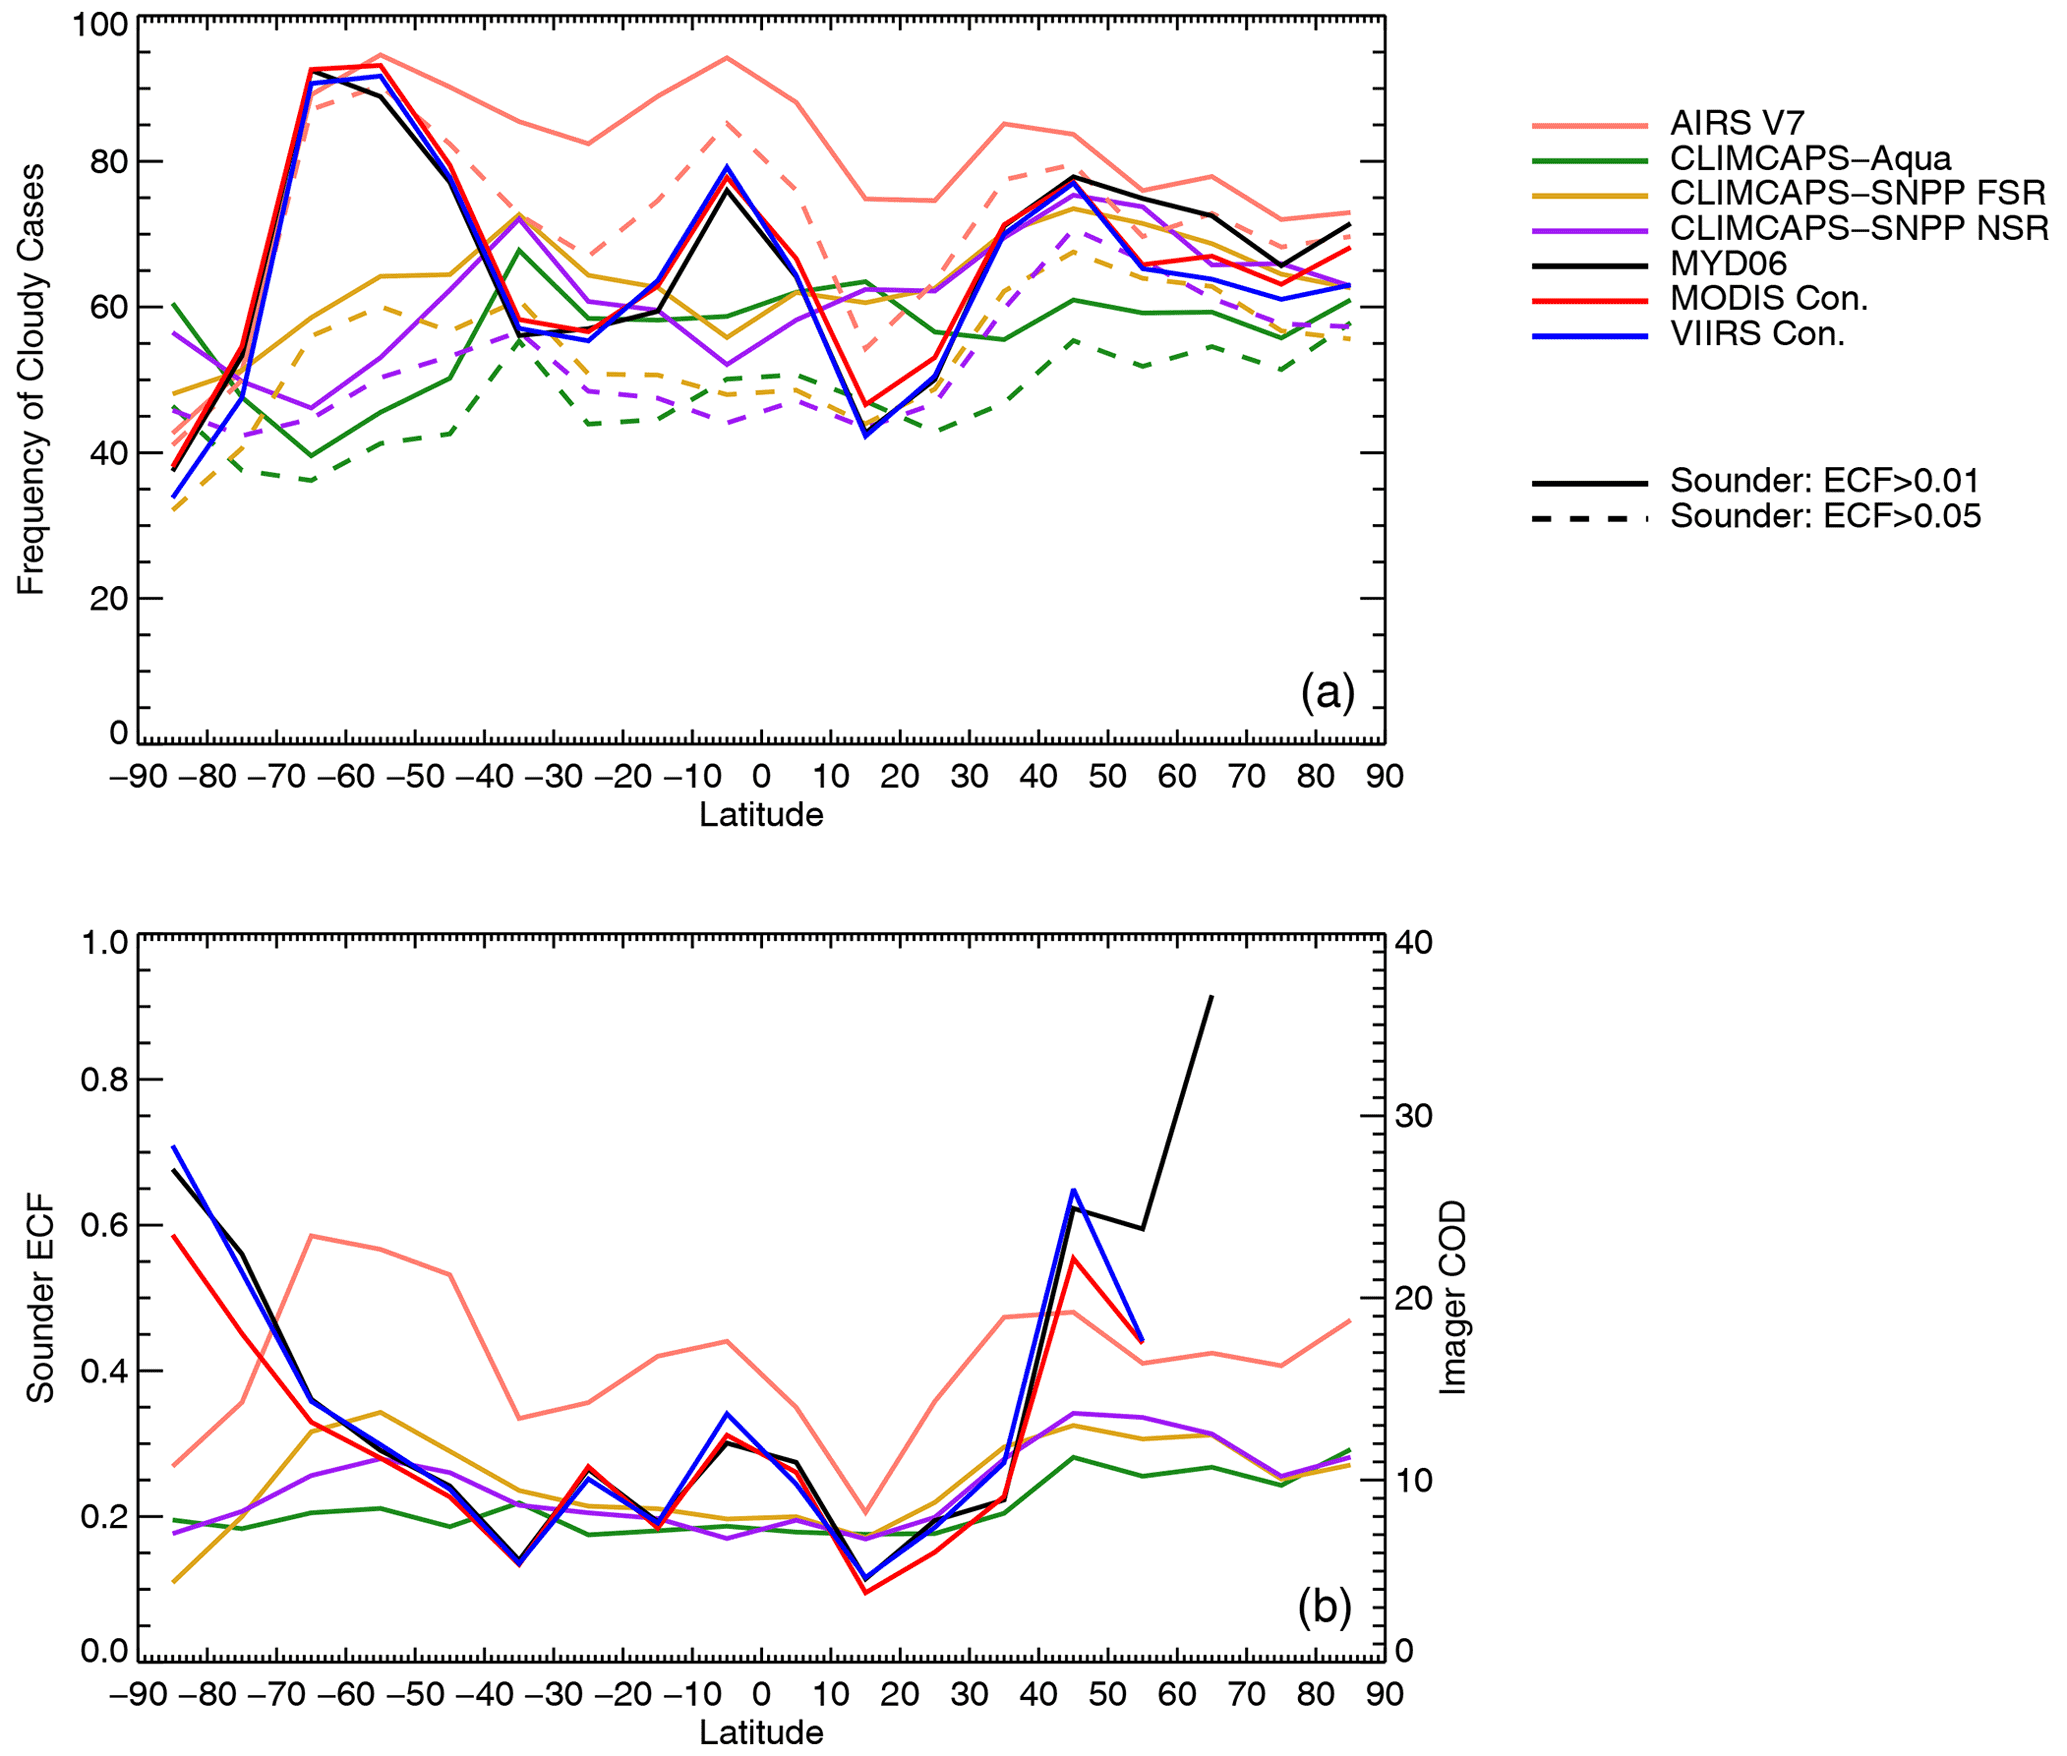
Figure 2(a) Zonal-mean frequency of cloudy cases as observed by hyperspectral sounders and imagers. For MODIS and VIIRS, frequency of cloudy and uncertain cases as reported by cloud mask is shown for MYD06 (black), MODIS continuity (red), and VIIRS continuity (blue) cloud products. For AIRS and CrIS, solid and dashed lines show frequencies of sounder FOVs with ECF >0.01 and ECF >0.05, respectively. Results for AIRS version 7 (AIRS V7, pink), CLIMCAPS-Aqua (green), CLIMCAPS-SNPP FSR (yellow), and CLIMCAPS-SNPP NSR (purple) are shown for sounder cloud products. (b) Zonal-mean values of sounder ECFs (left y axis) and imager COD (right y axis) from these retrieval algorithms.
3.1 Clouds retrieved by hyperspectral IR sounders
In Fig. 1, overlapped with the SNO count histograms are the occurrence frequency of sounder FOVs (colored lines, y axis on the right) for four composites that satisfy the following four conditions, respectively: ECF>0.01 (general cloudy condition), ECF≤0.01 (clear or very thin clouds), ECF>0.8 (overcast or very thick clouds), and cases with successful CTP retrievals (QC for CTP is 0 or 1). These ECF values are selected based on the relationships between clouds and the IR sounder spectral information, as well as the retrieval uncertainty. The fraction of the highest-quality atmospheric-state retrievals below clouds, obtained from IR spectral information, decreases with higher ECF (Fetzer et al., 2006). The combination of IR and MW radiances can facilitate the retrieval of vertically resolved temperature and humidity profiles up to ECF values of 0.7–0.8 (Yue et al., 2011; Yue and Lambrigtsen, 2020; Yue et al., 2021). The ECF value of 0.01 is often used as the threshold of cloud detection by IR sounders (e.g., Kahn et al., 2014). Moreover, it has been shown that AIRS V7 cloud retrievals present higher uncertainty on thin, broken clouds and cloud edges when ECF<0.01 (Yue and Lambrigtsen, 2020).
For each composite, the occurrence frequency is calculated as the percentage of AIRS or CrIS FOVs with successful cloud retrievals that satisfy the composite condition relative to the total number of FOVs in each latitudinal bin. The QC flags for each cloud parameter are reported in the L2 products and used to determine whether the algorithm reports a successful cloud retrieval (when QC=0 or 1). Different colors are used to indicate retrieval algorithms for the two sounders. Since AIRS V7 and CLIMCAPS retrieve cloud properties up to two cloud layers over each IR sounder FOV, an effective CTP is calculated as the weighted mean CTP by the ECF reported at each cloud layer.
These results show large differences between the AIRS V7 clouds and those from CLIMCAPS. AIRS V7 produces a much larger number of cloudy observations (solid pink line in Fig. 1) and a higher yield for CTP retrievals (dash-dotted line, Fig. 1), except in the Antarctic region. The magnitude of this difference reaches up to 30 % over the Southern Hemisphere and the tropics. Furthermore, AIRS V7 produces much more overcast or very thick clouds (dashed lines, Fig. 1) but fewer clear or very thin cloudy cases (dotted lines, Fig. 1) than CLIMCAPS, which is consistent with smaller mean ECF and lower cloud frequency in the tropics and midlatitude storm track regions by CLIMCAPS V2 in Fig. 2. As discussed previously, this is related to the differences between the two algorithms for AIRS in cloud-clearing and cloud retrieval QC, as well as the use of different a priori. These differences are further evaluated in the following sections using the imager observations.
Despite the differences of sensors, satellites, and spectral resolutions, the three CLIMCAPS version 2 retrievals evaluated in this study present similar latitudinal distributions of the cloud property distribution and cloud detection. As seen from Fig. 1, CLIMCAPS-Aqua (green dotted line) reports a higher percentage of clear or very thin cloudy cases than those for SNPP (yellow dotted line for CLIMCAPS-SNPP FSR and purple for CLIMCAPS-SNPP NSR), especially in the midlatitude region. Among the three CLIMCAPS products, CLIMCAPS-Aqua (green solid line) reports fewer cloudy cases than CLIMCAPS-SNPP (yellow and purple solid lines) in midlatitudes but more cloudy cases in the tropics. The finer spectral resolution for CLIMCAPS-SNPP FSR retrievals produces a higher percentage of cloudy FOVs than the coarser-spectral-resolution radiances used by the NSR retrieval.
Figure 3 further characterizes the four IR sounder cloud retrievals using the joint distributions of observations among different algorithms. It is known that larger uncertainty of both sounder and imager retrievals exists over snow- and ice-covered surfaces (Chan and Comiso, 2013; Yue and Lambrigtsen, 2020), so in this comparison the data points located in regions poleward of 60∘ are excluded. Cases are only included if both data products in the comparison (indicated by x and y axes of the plot) report valid retrievals. The three CLIMCAPS retrievals (x axes) are compared with AIRS V7 (y axes) for both ECF and CTP. The generally good agreement among the algorithms and sensors, especially for CTP, is encouraging, which shows the robustness of these products and consistency of information for clouds in hyperspectral IR sounders. However, CLIMCAPS reports a large number of cases with ECFs between 0 and 0.1, for which AIRS V7 reports ECFs ranging from 0 (clear sky) and 1 (completely cloudy). This issue is further illustrated in Fig. 4. For cases where ECF retrieved from CLIMCAPS-Aqua V2 is less than 0.1, AIRS V7 (the magenta line) shows two peaks in the ECF occurrence frequency. The first peak is located at a V7 value of ECF<0.1, indicating the two algorithms agree with each other in cloud amount detection. The larger second peak shows that more than 25 % of cases with CLIMCAPS values of ECF<0.1 have AIRS V7 ECF values of 0.8–0.9. As a result, the correlation coefficient (r) between ECF retrievals from AIRS V7 and CLIMCAPS V2 is only 0.27, which increases to 0.79 when neglecting ECF<0.1 observations. Further separating the sounder FOVs into ice- and liquid-cloud-only categories shows that such inconsistency in cloud amount detection between the sounder algorithms exist in both categories as illustrated in Figs. S1 and S2 in the Supplement. The sounder FOV is determined as ice-/liquid-cloud-only when over 80 % of collocated cloudy MODIS pixels are in the ice/liquid thermodynamic phase in the MYD06 optical-property cloud-phase retrievals. Better agreements between sounder cloud products are found for ice-cloud-only FOVs.
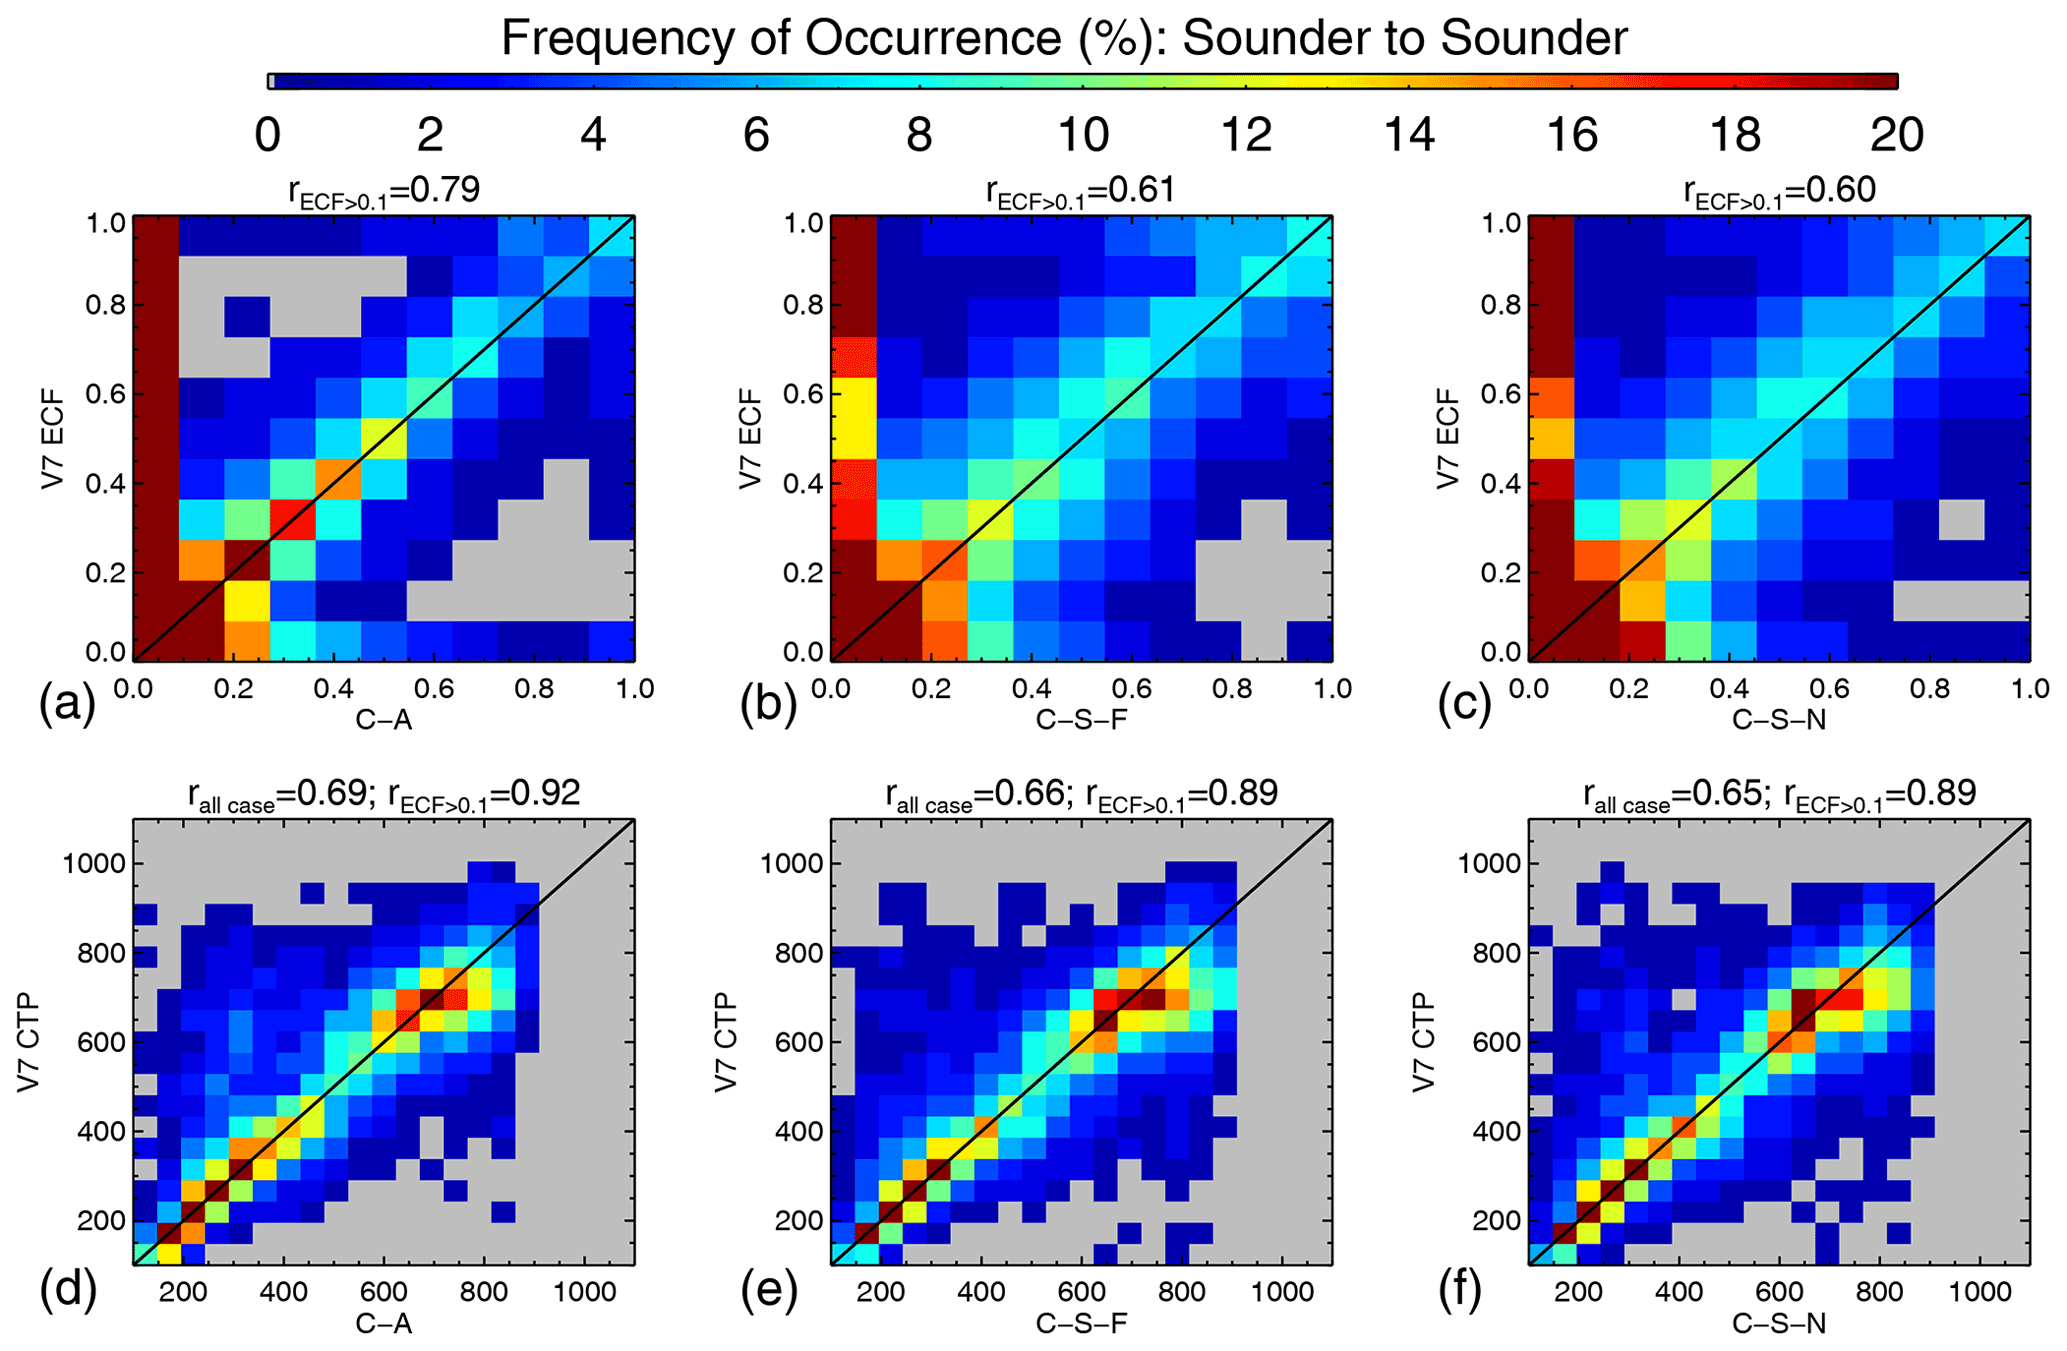
Figure 3Comparisons of ECF (a–c) and effective CTP (d–f) derived from different sounder retrieval algorithms. Linear correlation coefficients are calculated for cloud properties obtained from retrieval products indicated on the axes and are given on top of each plot. From left to right, results comparing AIRS version 7 with CLIMCAPS-Aqua (C-A), CLIMCAPS-SNPP FSR (C-S-F), and CLIMCAPS-SNPP NSR (C-S-N) are shown using joint distributions of frequency of occurrence ( %). The data points located in regions poleward of 60∘ are excluded. Cases are included only when both retrievals in comparison (x and y axes of the plot) report valid retrievals.
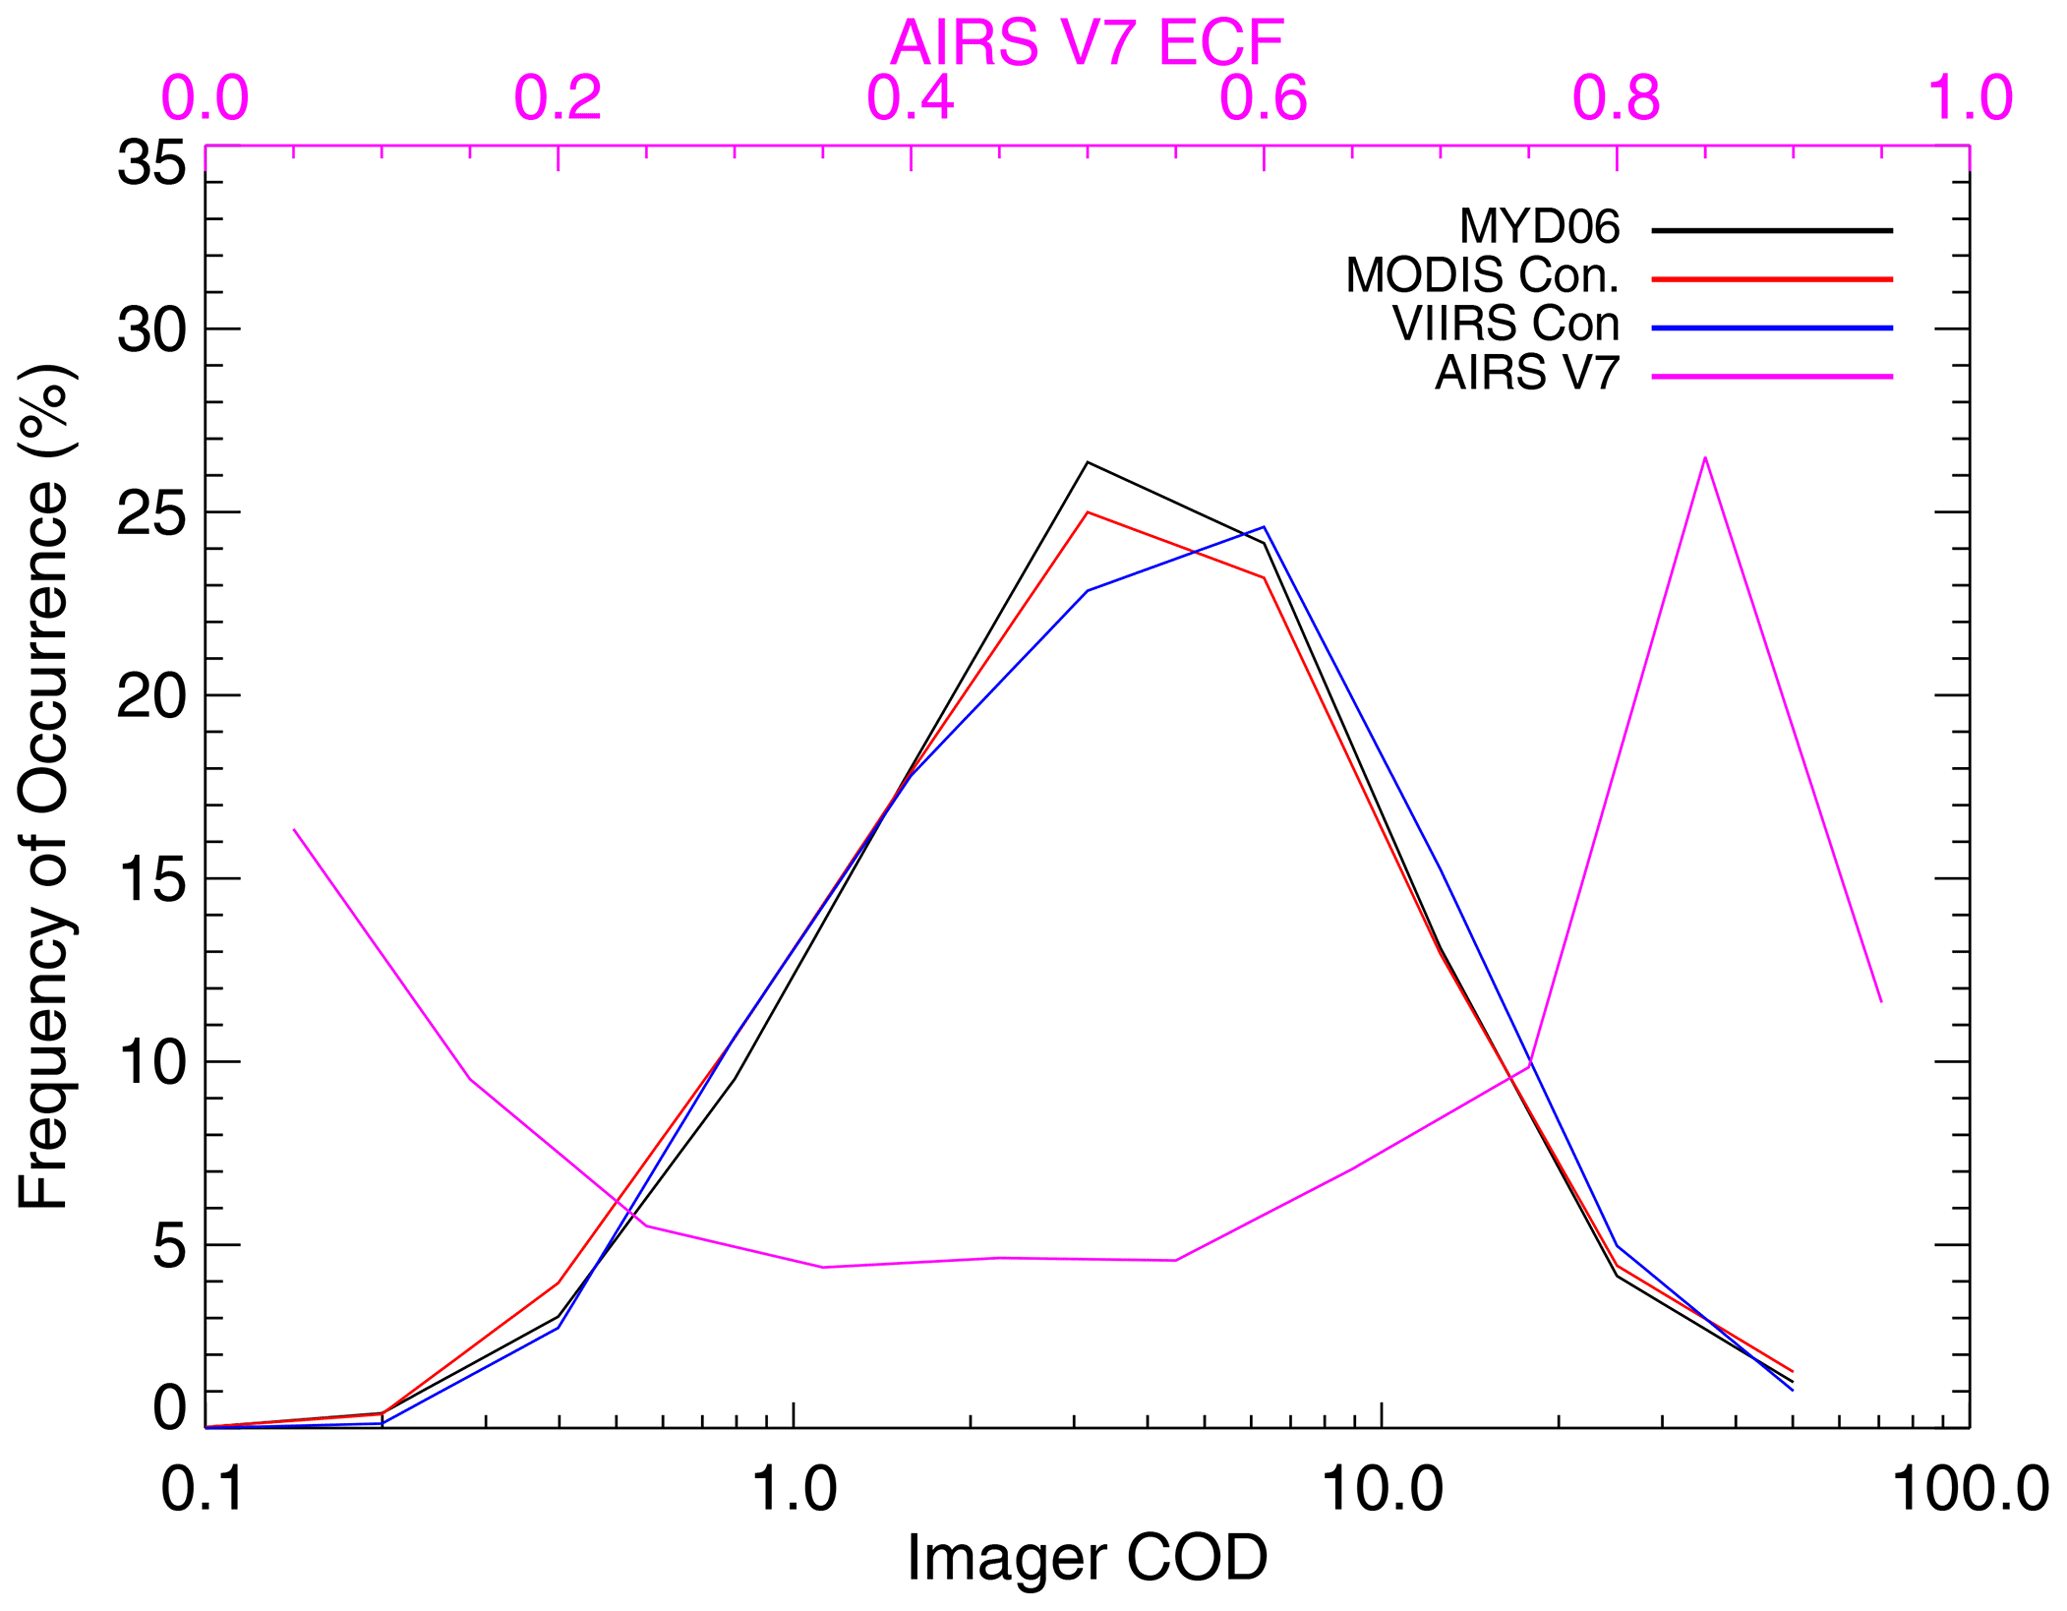
Figure 4Frequency histograms showing the density distributions of imager cloud optical depth (COD, bottom x axis) and AIRS V7 ECF (magenta, upper x axis) for cases where V2 CLIMCAPS-Aqua retrieves an ECF value less than 0.1. Different imager cloud products are included: MYD06 (black), Aqua MODIS continuity cloud products (MODIS Con, red), and SNPP VIIRS continuity cloud products (VIIRS Con, blue).
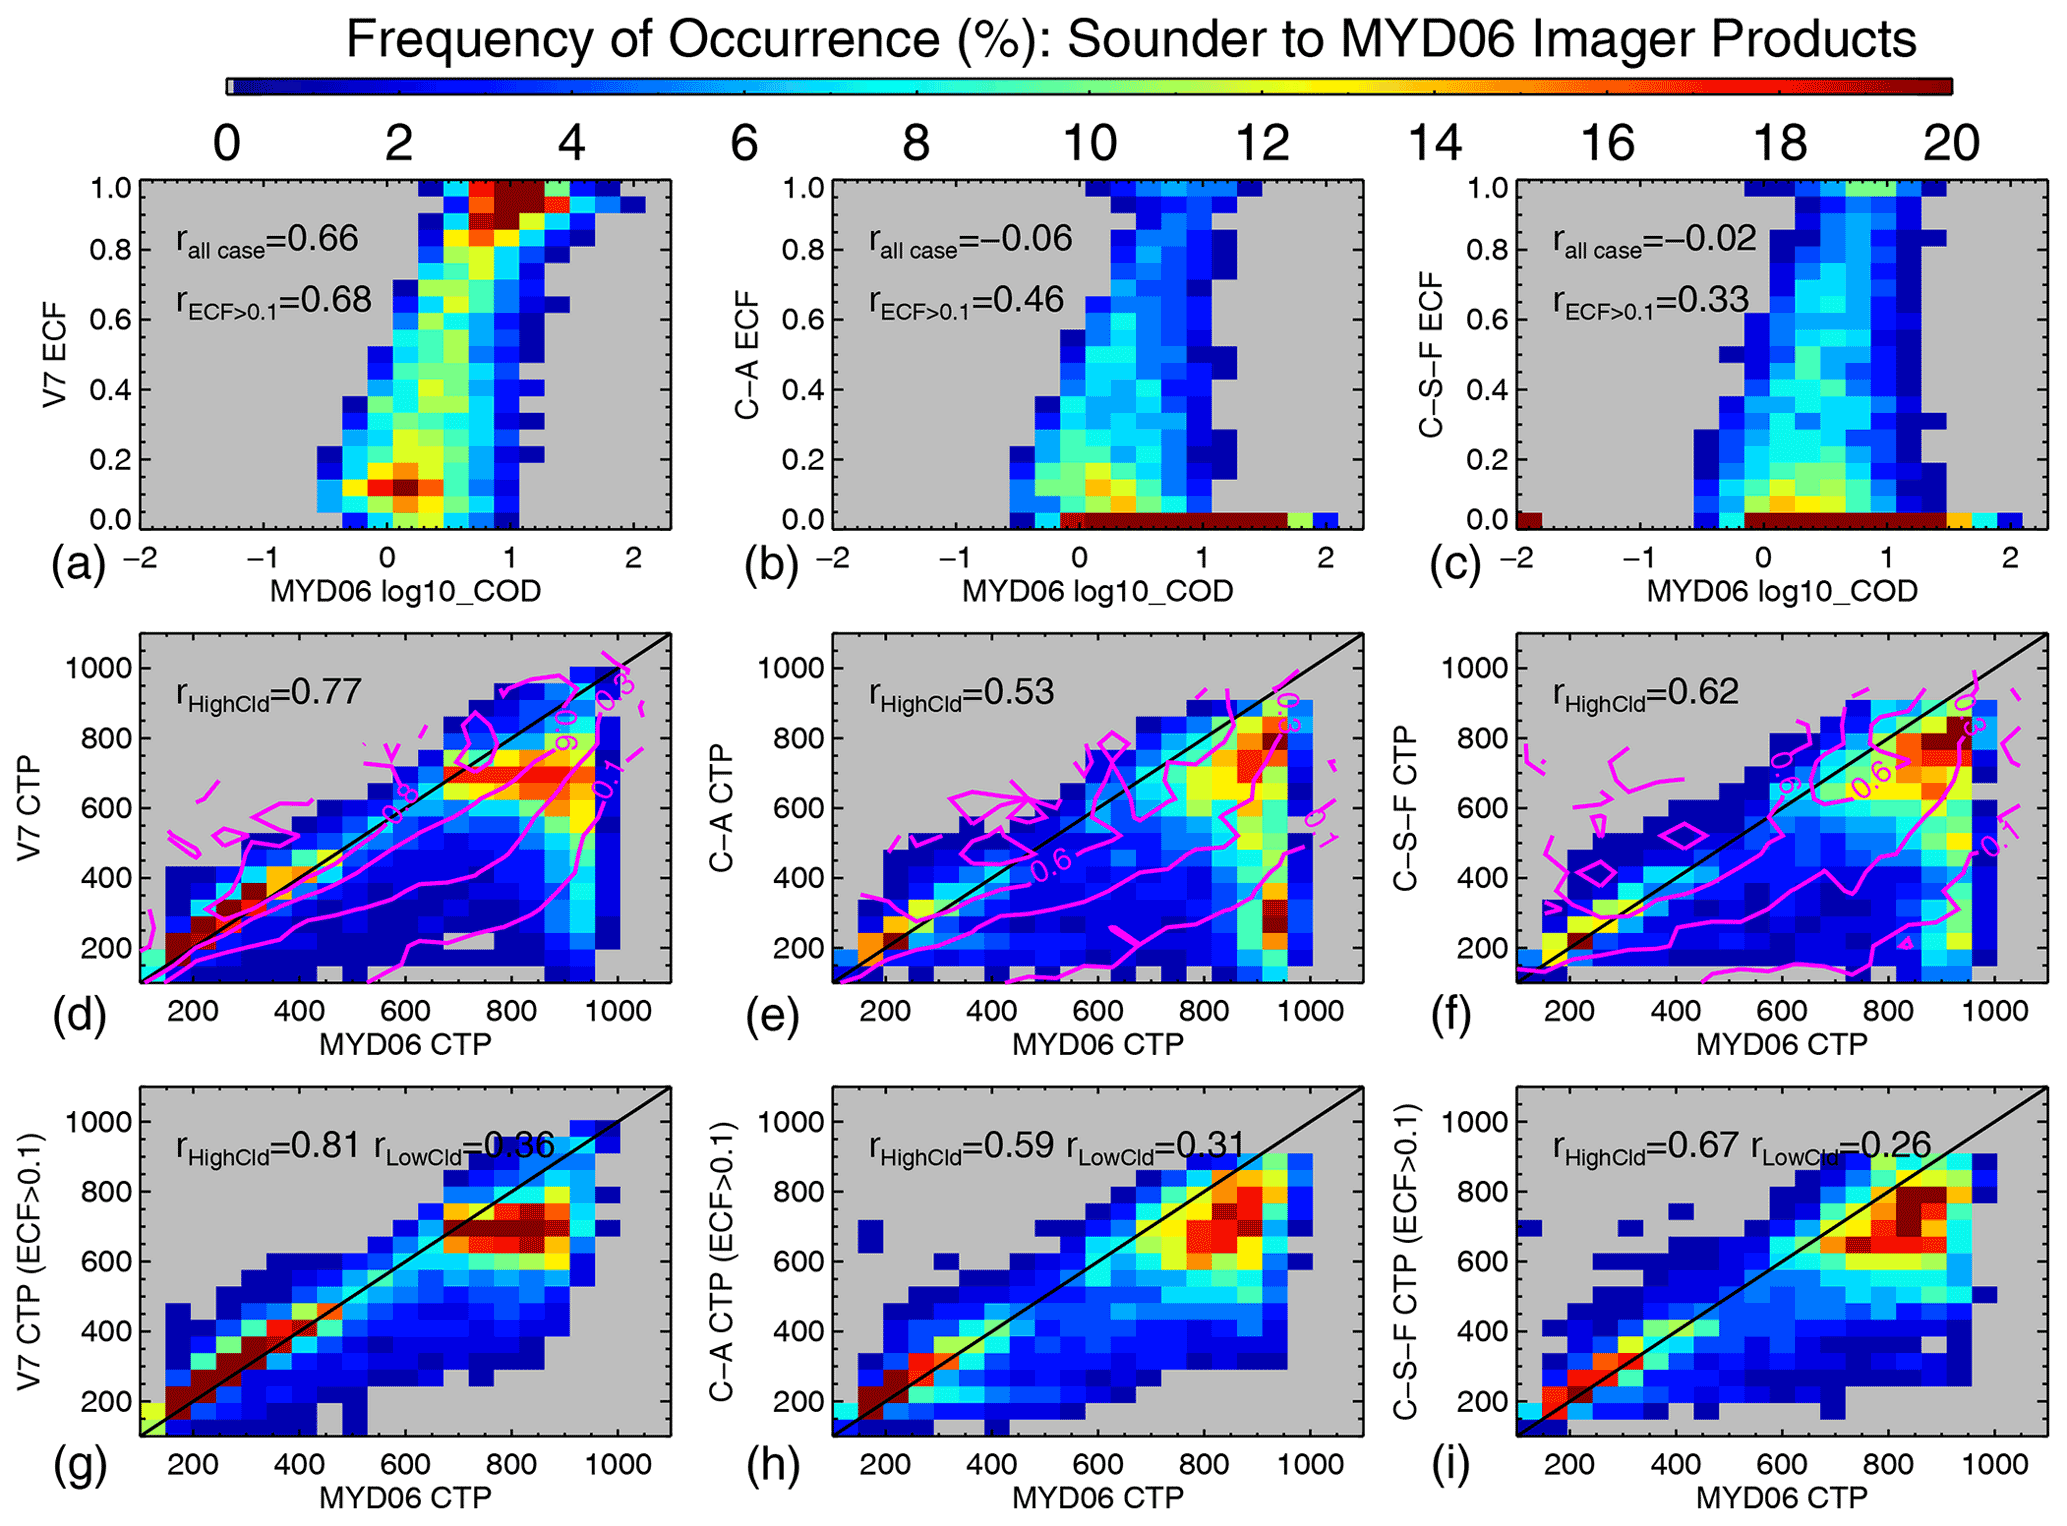
Figure 5Comparisons of sounder- and imager-derived cloud properties shown by joint distribution of case frequency of occurrence. Panels (a), (b), and (c) show the evaluation of sounder-derived ECF by cloud optical depth (COD, on a log 10 scale) from the MYD06 products. Panels (d), (e), and (f) compare the sounder effective CTP with CTP from MYD06 overlaid by the magenta contours showing the mean ECF from the corresponding sounder retrievals. Panels (g), (h), and (i) are similar to panels (d), (e), and (f) except that the cases with sounder ECF <0.1 are removed from the comparison. Different sounder retrieval algorithms are included. From left to right, data from AIRS version 7, CLIMCAPS-Aqua (C-A), and CLIMCAPS-SNPP FSR (C-S-F) are used. The data points located in regions poleward of 60∘ are excluded. Cases are included only when both retrievals in comparison (x and y axes of the plot) report valid retrievals. The cloud properties from MODIS pixels collocated within the same sounder FOV are averaged before comparison with the IR sounder data. Linear correlation coefficients between the variables on the x and y axes for different conditions are given in each plot.
A tighter agreement between CLIMCAPS V2 and AIRS V7 is seen for CTP retrievals as shown by points densely located along the identity line in Fig. 3. The correlation coefficients between CLIMCAPS-Aqua and AIRS V7 CTP are 0.69 for all cases and 0.92 for ECF>0.1, respectively. High-cloud cases (AIRS V7 CTP<440 hPa) show a much higher CTP correlation (r=0.87) than for low clouds (AIRS V7 CTP>600 hPa, r=0.43). When both algorithms identify low clouds in the FOV, CLIMCAPS reports a slightly lower cloud top (larger CTP) than AIRS V7, with a median value difference of 12 hPa, whereas for high clouds, CLIMCAPS V2 reports a higher cloud top with its median CTP 13 hPa being smaller than the one by AIRS V7.
In the next section, these differences among the various sounder cloud retrieval products are further evaluated using the cloud parameters determined by collocated MODIS and VIIRS data.
3.2 Comparison of sounder cloud properties and collocated imager measurements
Figures 5 and 6 compare the cloud properties retrieved from various sounder algorithms with the collocated imager cloud retrievals in the MYD06 and CLDPROP_MODIS products, respectively. Comparisons with CLDPROP_VIIRS are similar to those using CLDPROP_MODIS and hence are not shown in these figures. The cloud properties from MODIS pixels are averaged within the collocated sounder FOV before this comparison.
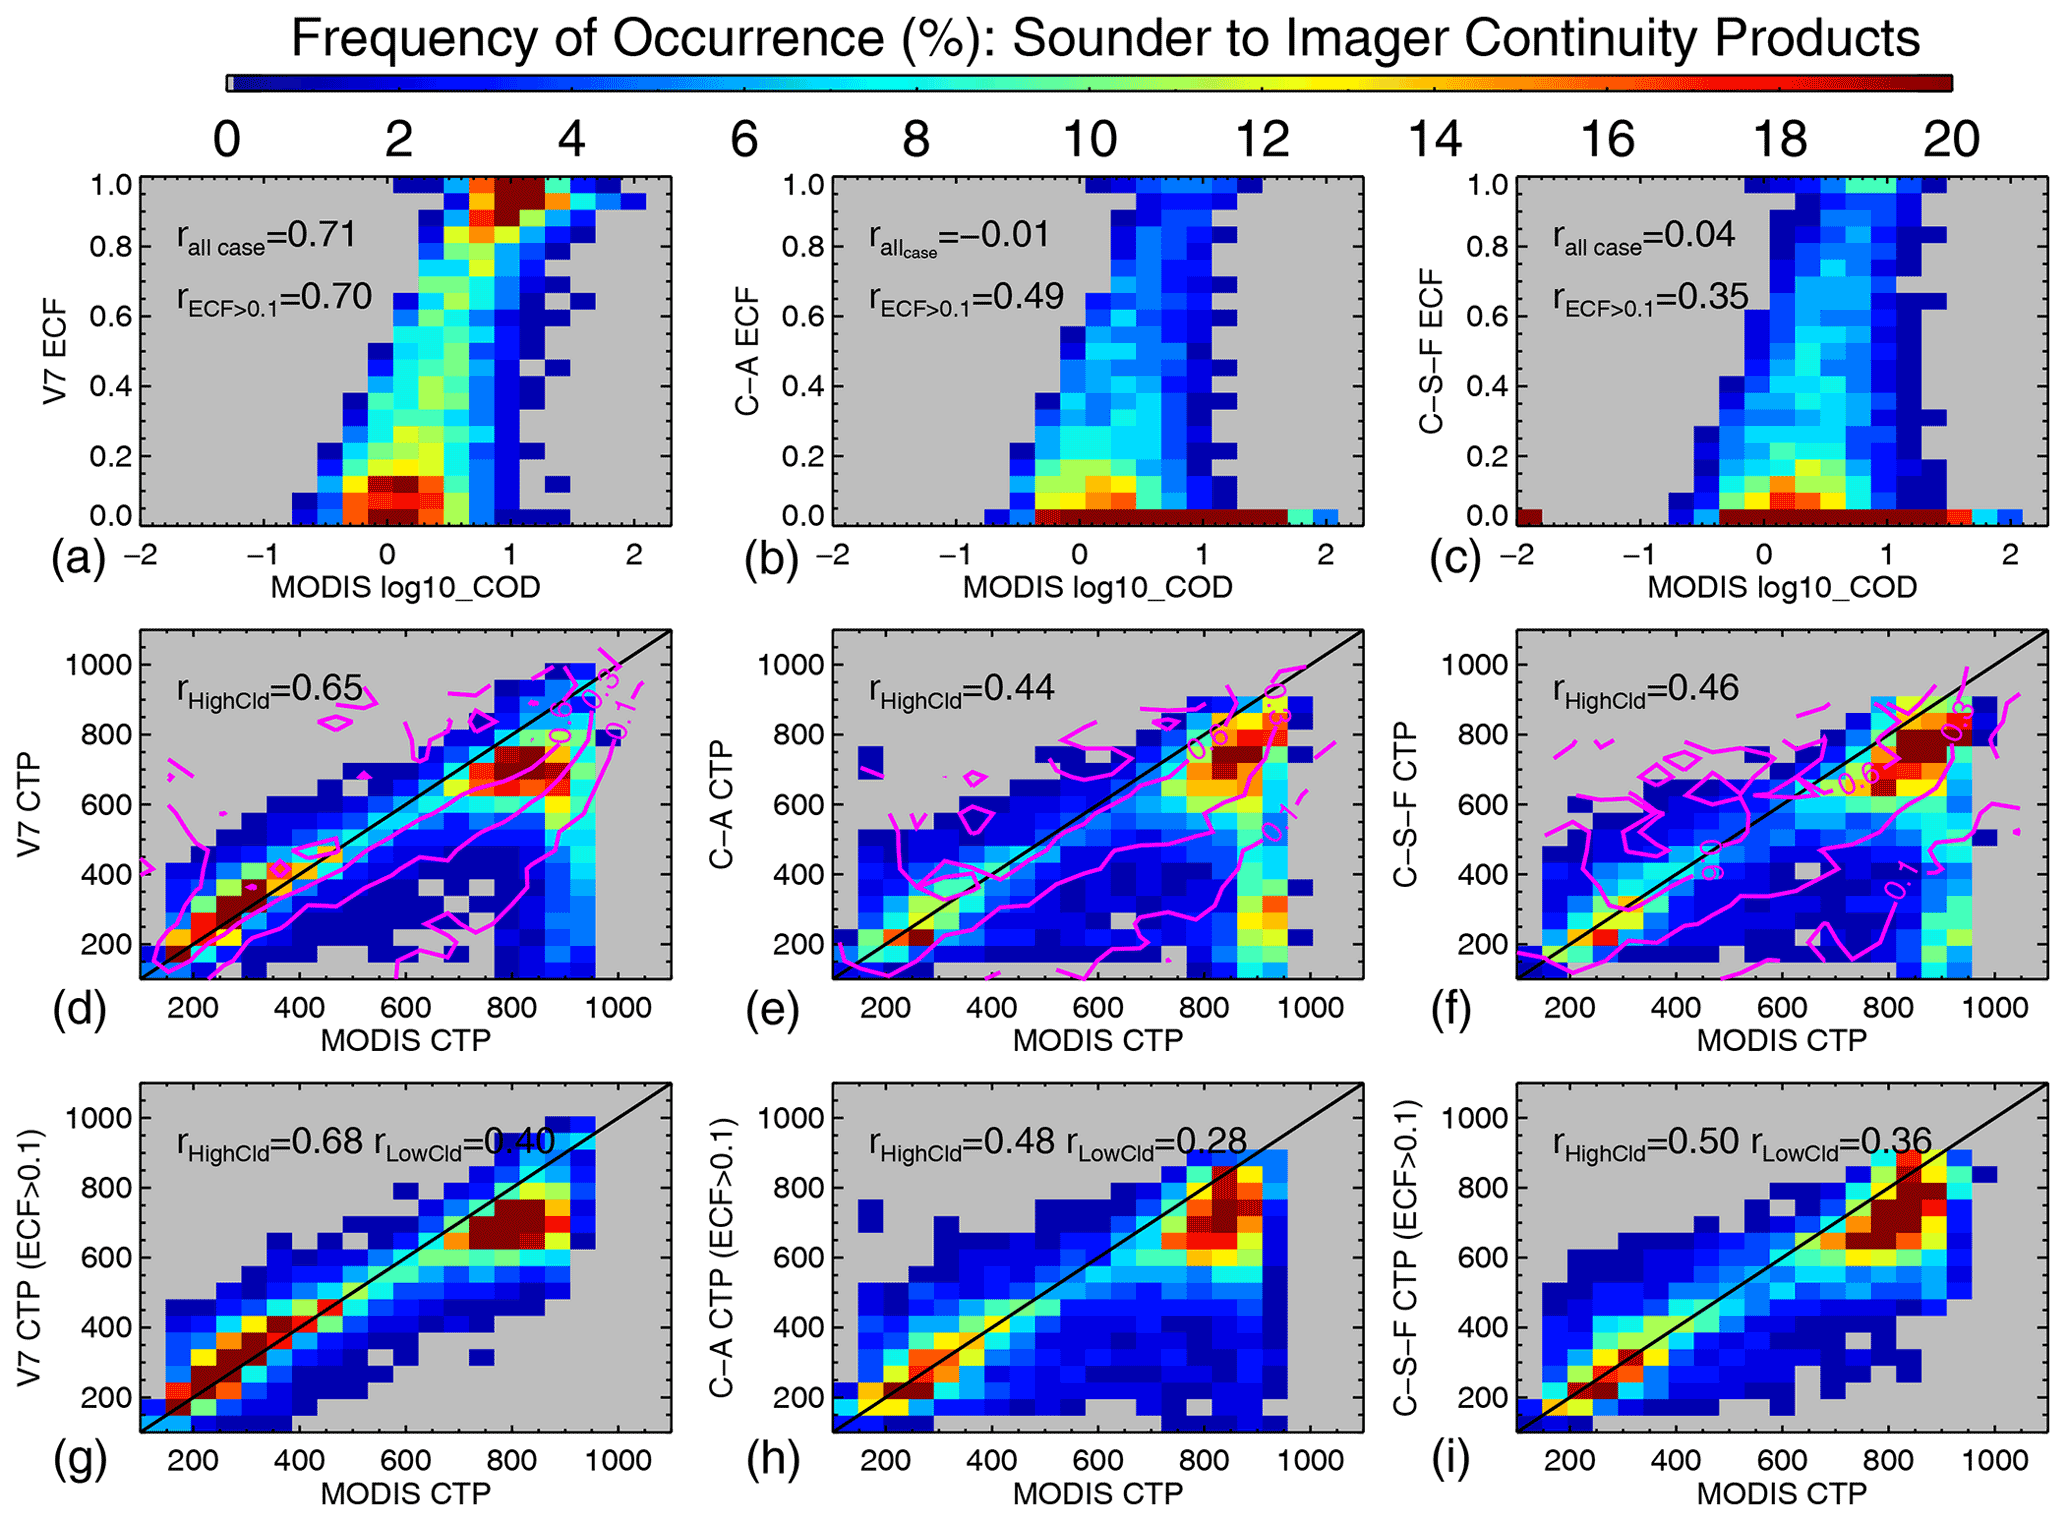
The IR-sounder-retrieved ECF is positively correlated with the imager-observed COD in the top rows of Figs. 5 and 6, showing the consistency of cloud amount determined using different sensors. However, two main differences are noticed. First, it is clear that CLIMCAPS V2 (for both Aqua and SNPP) misidentifies a significant number of cloudy cases as clear or thin clouds. As shown in Fig. 4, more than 50 % of these cases are optically thick clouds with a large cloud amount (ECF>0.7) reported by AIRS V7 and COD values ranging from 2 to 10 by MODIS and VIIRS. Secondly, the comparisons between CLIMCAPS and imager cloud products do not have the cluster corresponding to cases with both high ECF and large COD values, as in the comparison between AIRS V7 and imagers. As discussed previously, this is related to misidentification of cloudy cases as clear or thin-cloud conditions by CLIMCAPS. However, another main cause is that CLIMCAPS cloud retrievals have the same QC flags as the physical atmospheric-state retrievals; as a result, cases with a large cloud amount are filtered out. In general, AIRS V7 products exhibit better agreement with MODIS and VIIRS in detecting cloud amount and occurrence. CLIMCAPS V2 cloud retrievals could be further improved with better cloud-clearing flow and more careful treatment when retrieving clouds with unsuccessful atmosphere physical retrievals.
The sounder and imager CTP retrievals are also compared in the bottom rows of Figs. 5 and 6. Despite instrument and algorithm differences, when both the sounder and imager detect high clouds (CTP<440 hPa, including ECF<0.1 cases), CTP retrievals agree with each other well. The correlation coefficients with MYD06 CTP are 0.77, 0.52, and 0.62 for AIRS V7, CLIMCAPS-Aqua, and CLIMCAPS-SNPP FSR, respectively. When imagers detect low clouds (CTP>680 hPa), IR sounders determine the majority of cases as low clouds but with a tail toward CTP values corresponding to high and mid clouds (middle row). The disagreement mainly occurs when sounder-retrieved ECF is less than 0.1 as shown by the magenta contour lines. These are cases when larger uncertainty in infrared cloud retrieval exists, as discussed previously. After removing these cases, the sounder–imager discrepancy in the low-cloud conditions is reduced greatly (bottom row), especially for AIRS V7. These differences are consistent with the known limitation of imagers such as MODIS, which tend to miss high and thin cloud layers (Holz et al., 2008) when compared with AIRS (Kahn et al., 2014). However, the analysis presented here cannot completely rule out the impact of uncertainty in the IR sounder cloud retrievals. When both hyperspectral sounders and narrowband imagers detect low clouds, sounders tend to retrieve a smaller CTP value than imagers. For AIRS V7, the median difference in this condition is −65, −77, and −80 hPa with the MYD06, CLDPROP_MODIS, and CLDPROP_VIIRS products, respectively. The results are further analyzed for ice- and liquid-cloud-only sounder FOVs (Figs. S3–S6), which are determined using the same criteria as in the previous section. It is clear that the disagreements between the sounder and imager CTP retrievals mainly originated from the liquid-cloud-only sounder FOVs (Figs. S5 and S6), while good agreements are found for ice-cloud-only conditions (Figs. S3 and S4).
3.3 Clouds retrieved by imagers
Figure 7 compares COD, CTP, and Re retrieved by different MODIS and VIIRS cloud algorithms, with mean imager cloud properties over corresponding sounder FOVs being shown. Very good agreement between MODIS and VIIRS and between the MYD06 and continuity products is seen. All correlation coefficients are greater than 0.8. For the three cloud parameters, correlation is always the highest between products derived from the same instrument (MYD06 and CLDPROP_MODIS), and the lowest is between MYD06 and CLDPROP_VIIRS (but still reaching 0.81, 0.88, and 0.81 for COD, CTP, and Re, respectively) when both the instrument and algorithm are different. From the same instrument of MODIS but different algorithms, the correlation is lowest for CTP retrievals (r=0.89) compared to COD (r=0.97) and Re (r=0.97). This is because MYD06 and the continuity cloud algorithm uses different methods and spectral channels to determine CTP, especially for cold clouds as shown in Fig. S7, where the correlation coefficients for CTPs from different imager cloud retrievals are less than 0.52 for ice-cloud-only conditions (Fig. S7) but larger than 0.79 for liquid-cloud-only cases (Fig. S8). However, a nearly one-to-one relationship is still seen clearly, indicating the consistency between the operational and continuity cloud products from MODIS, at least for the cloud properties averaged at the sounder resolution (∼13.5 km). Correlations between the MODIS and VIIRS cloud products are lower than those from MODIS alone (with different algorithms), even when both products are derived from the same continuity algorithm. The degradation of agreement is larger for COD and Re than for CTP (Fig. 6). Separating results into ice- and liquid-cloud-only conditions, the COD (Re) correlation coefficients between the MODIS and VIIRS continuity cloud products are 0.84 (0.70) and 0.82 (0.75) for ice- and liquid-cloud-only conditions, respectively, as shown in Figs. S7 and S8. Although such good agreements between the two imagers are encouraging, the correlation for Re from the two CLDPROP products is lower than that for COD, with a much weaker correlation on the ice cloud Re retrievals. This reflects the effect of spectral-channel and spatial-resolution differences between MODIS and VIIRS, as well as the related adjustments made to the continuity algorithms, such as the liquid-phase LUT for cloud microphysical retrievals, especially the impact of weaker ice crystal absorption at 2.25 µm (VIIRS) than at 2.13 µm (MODIS). Another possible factor is the collocation error existing in the SNOs, but this is ruled out, since results with more conservative collocation criteria remain largely the same (not shown).

Figure 7Comparison of cloud optical depth (COD, on a log 10 scale), cloud top pressure (CTP, hPa), and effective particle size (Re, µm) retrieved by MODIS and VIIRS cloud algorithms. The mean imager cloud properties over corresponding sounder FOVs are compared over the SNOs. From left to right, results of the following comparisons: Aqua MODIS continuity cloud products (CLDPROP_MODIS) with MYD06, CLDPROP_MODIS with SNPP VIIRS continuity cloud products (CLDPROP_VIIRS), and MYD06 with CLDPROP_VIIRS, respectively. Linear correlation coefficients between the variables on the x and y axes are given in each plot.
To further analyze the differences between the imager cloud products and the subpixel cloud heterogeneity over the sounder FOVs, the standard deviation and skewness of the imager cloud property distributions over the sounder FOVs are shown in Figs. 8 and 9, respectively. Correlations are weaker in these higher statistical moments, yet for standard deviation they remain larger than 0.6. Similar to comparisons for mean values, tight one-to-one relationships are seen for standard deviation at the sounder FOV scale between the two MODIS cloud products. Similar to mean value comparisons, the CTP standard deviation has the lowest correlation coefficient (r=0.63) compared to the ones for COD (r=0.96) and Re (r=0.87), with a much lower correlation on CTP (r=0.44) for ice-cloud-only conditions (Fig. S9) but a high correlation (r=0.71) for liquid-cloud-only FOVs (Fig. S10). However, skewness only shows significant correlations for COD (r=0.78) and Re (r=0.70) between the two MODIS datasets but poor correlations (r<0.3) for CTP. The impact from the differences in CTP algorithms thus shows up more strongly on the higher statistical moments and on cold-cloud scenes. When evaluating data from different sensors, no correlation is seen for skewness of any of the cloud parameters even with the same retrieval algorithms (Fig. 9, middle and right columns), different from the comparisons using the mean value and standard deviation (Figs. 7 and 8, middle and right columns).
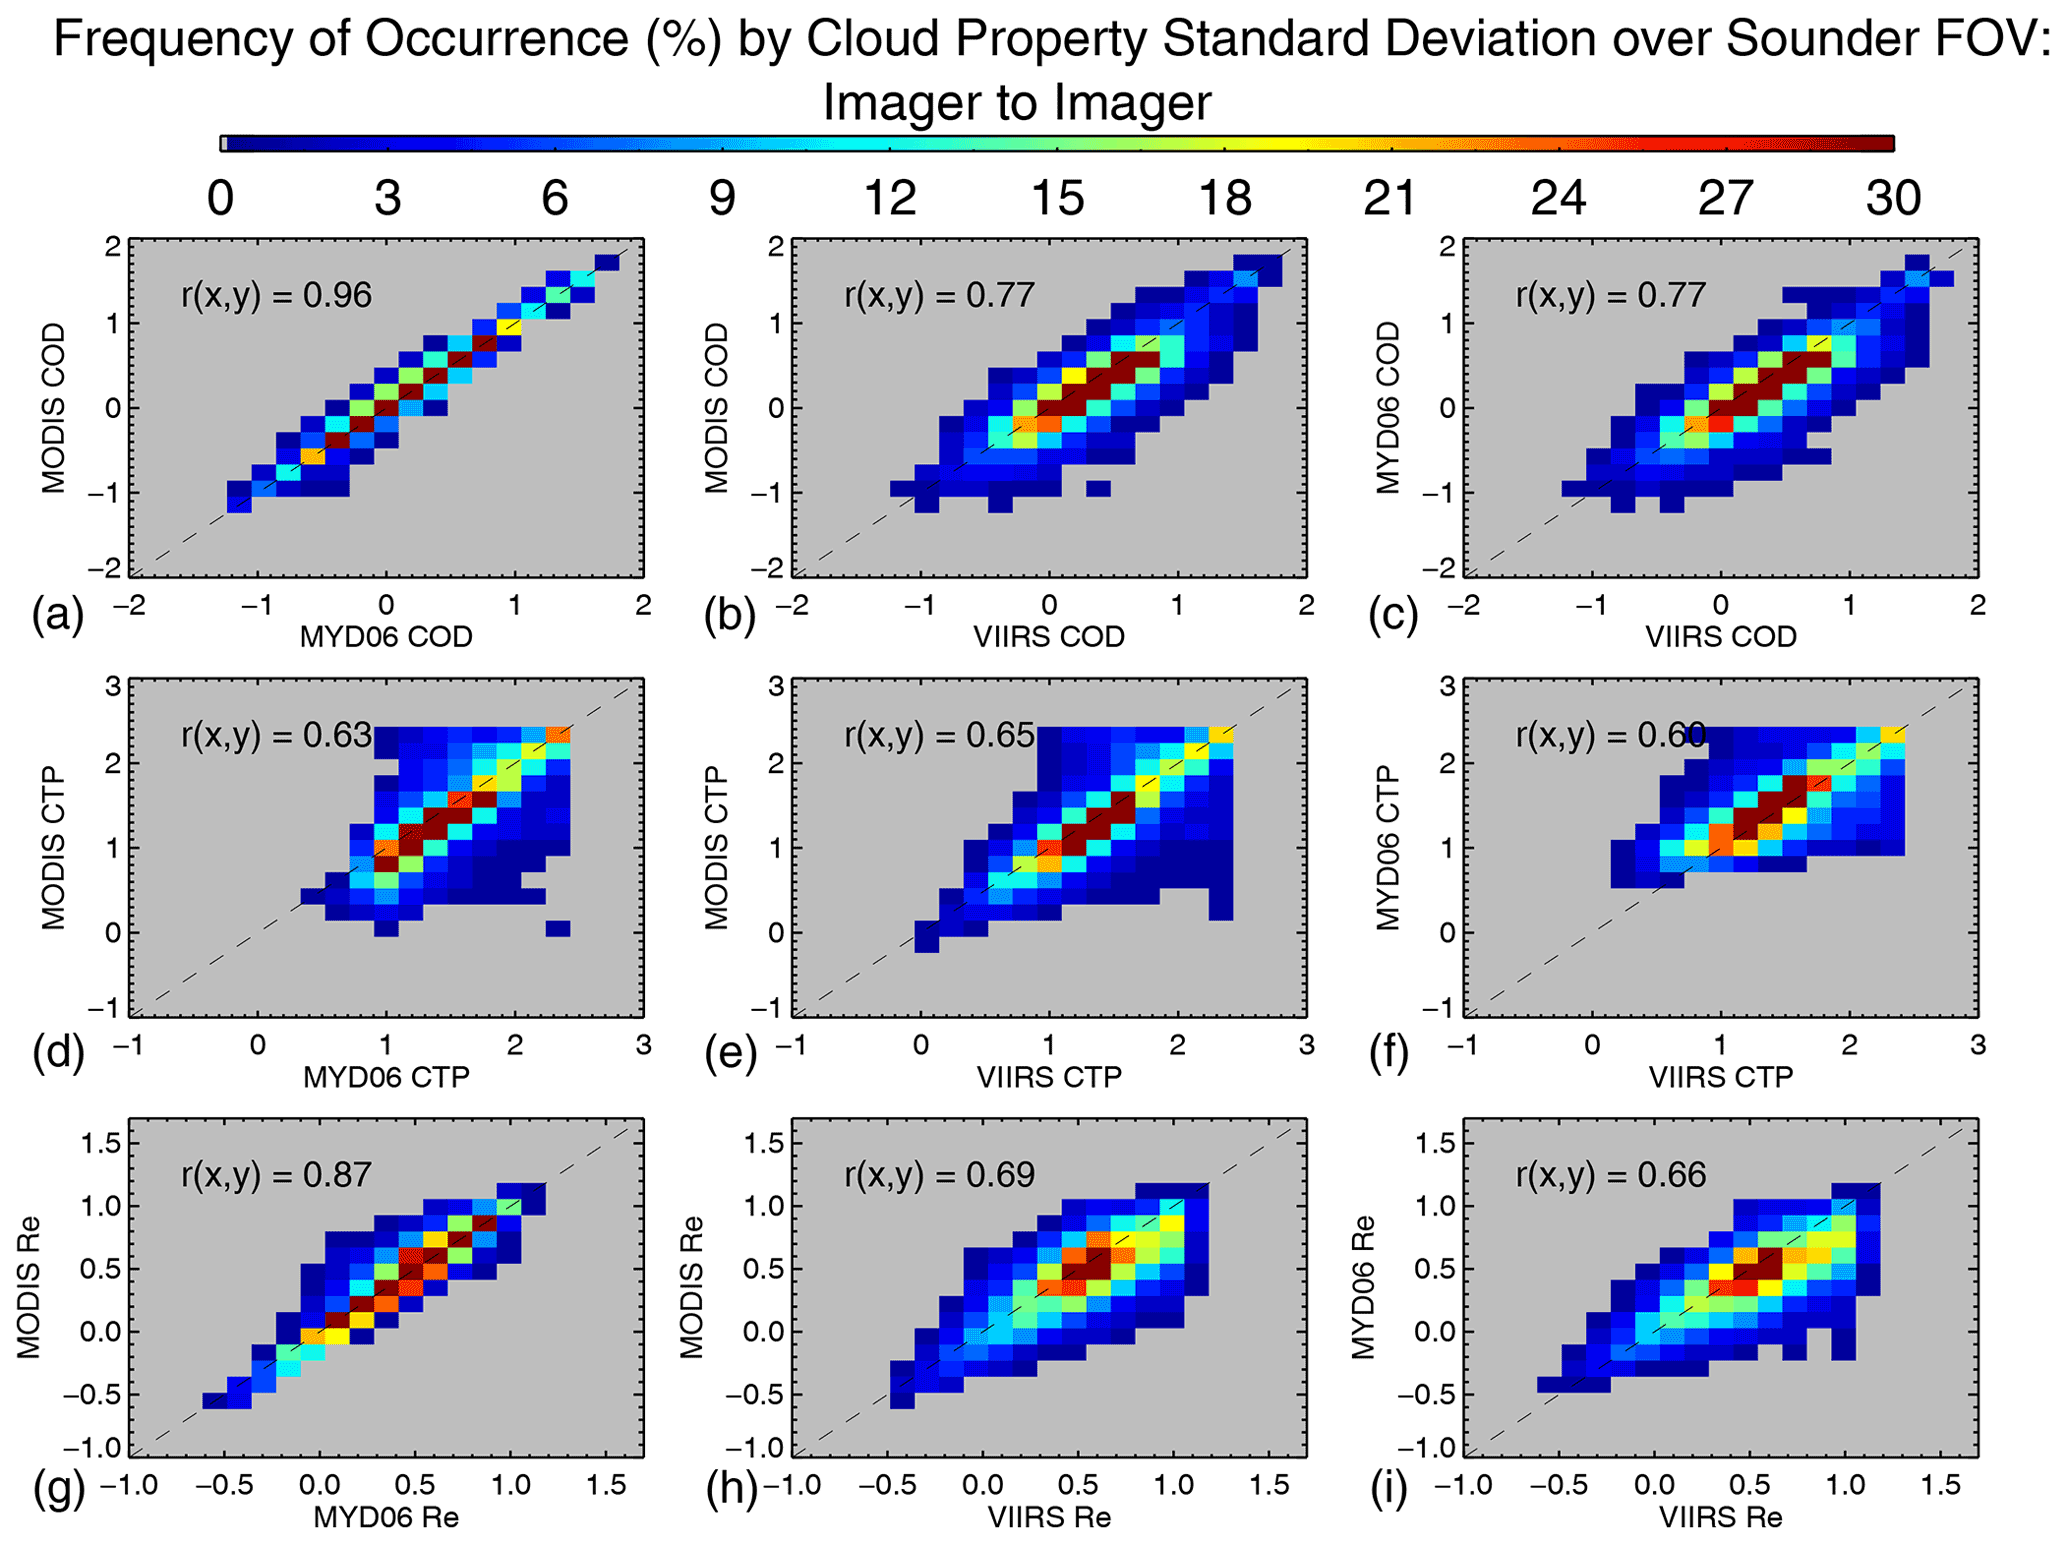
Figure 8Similar to Fig. 7, except showing comparisons of the standard deviation of cloud properties over the sounder FOV, which are calculated using the finer-resolution imager observations collocated with the same sounder FOV. All the results are presented on a log 10 scale. Linear correlation coefficients between the variables on the x and y axes are given in each plot.
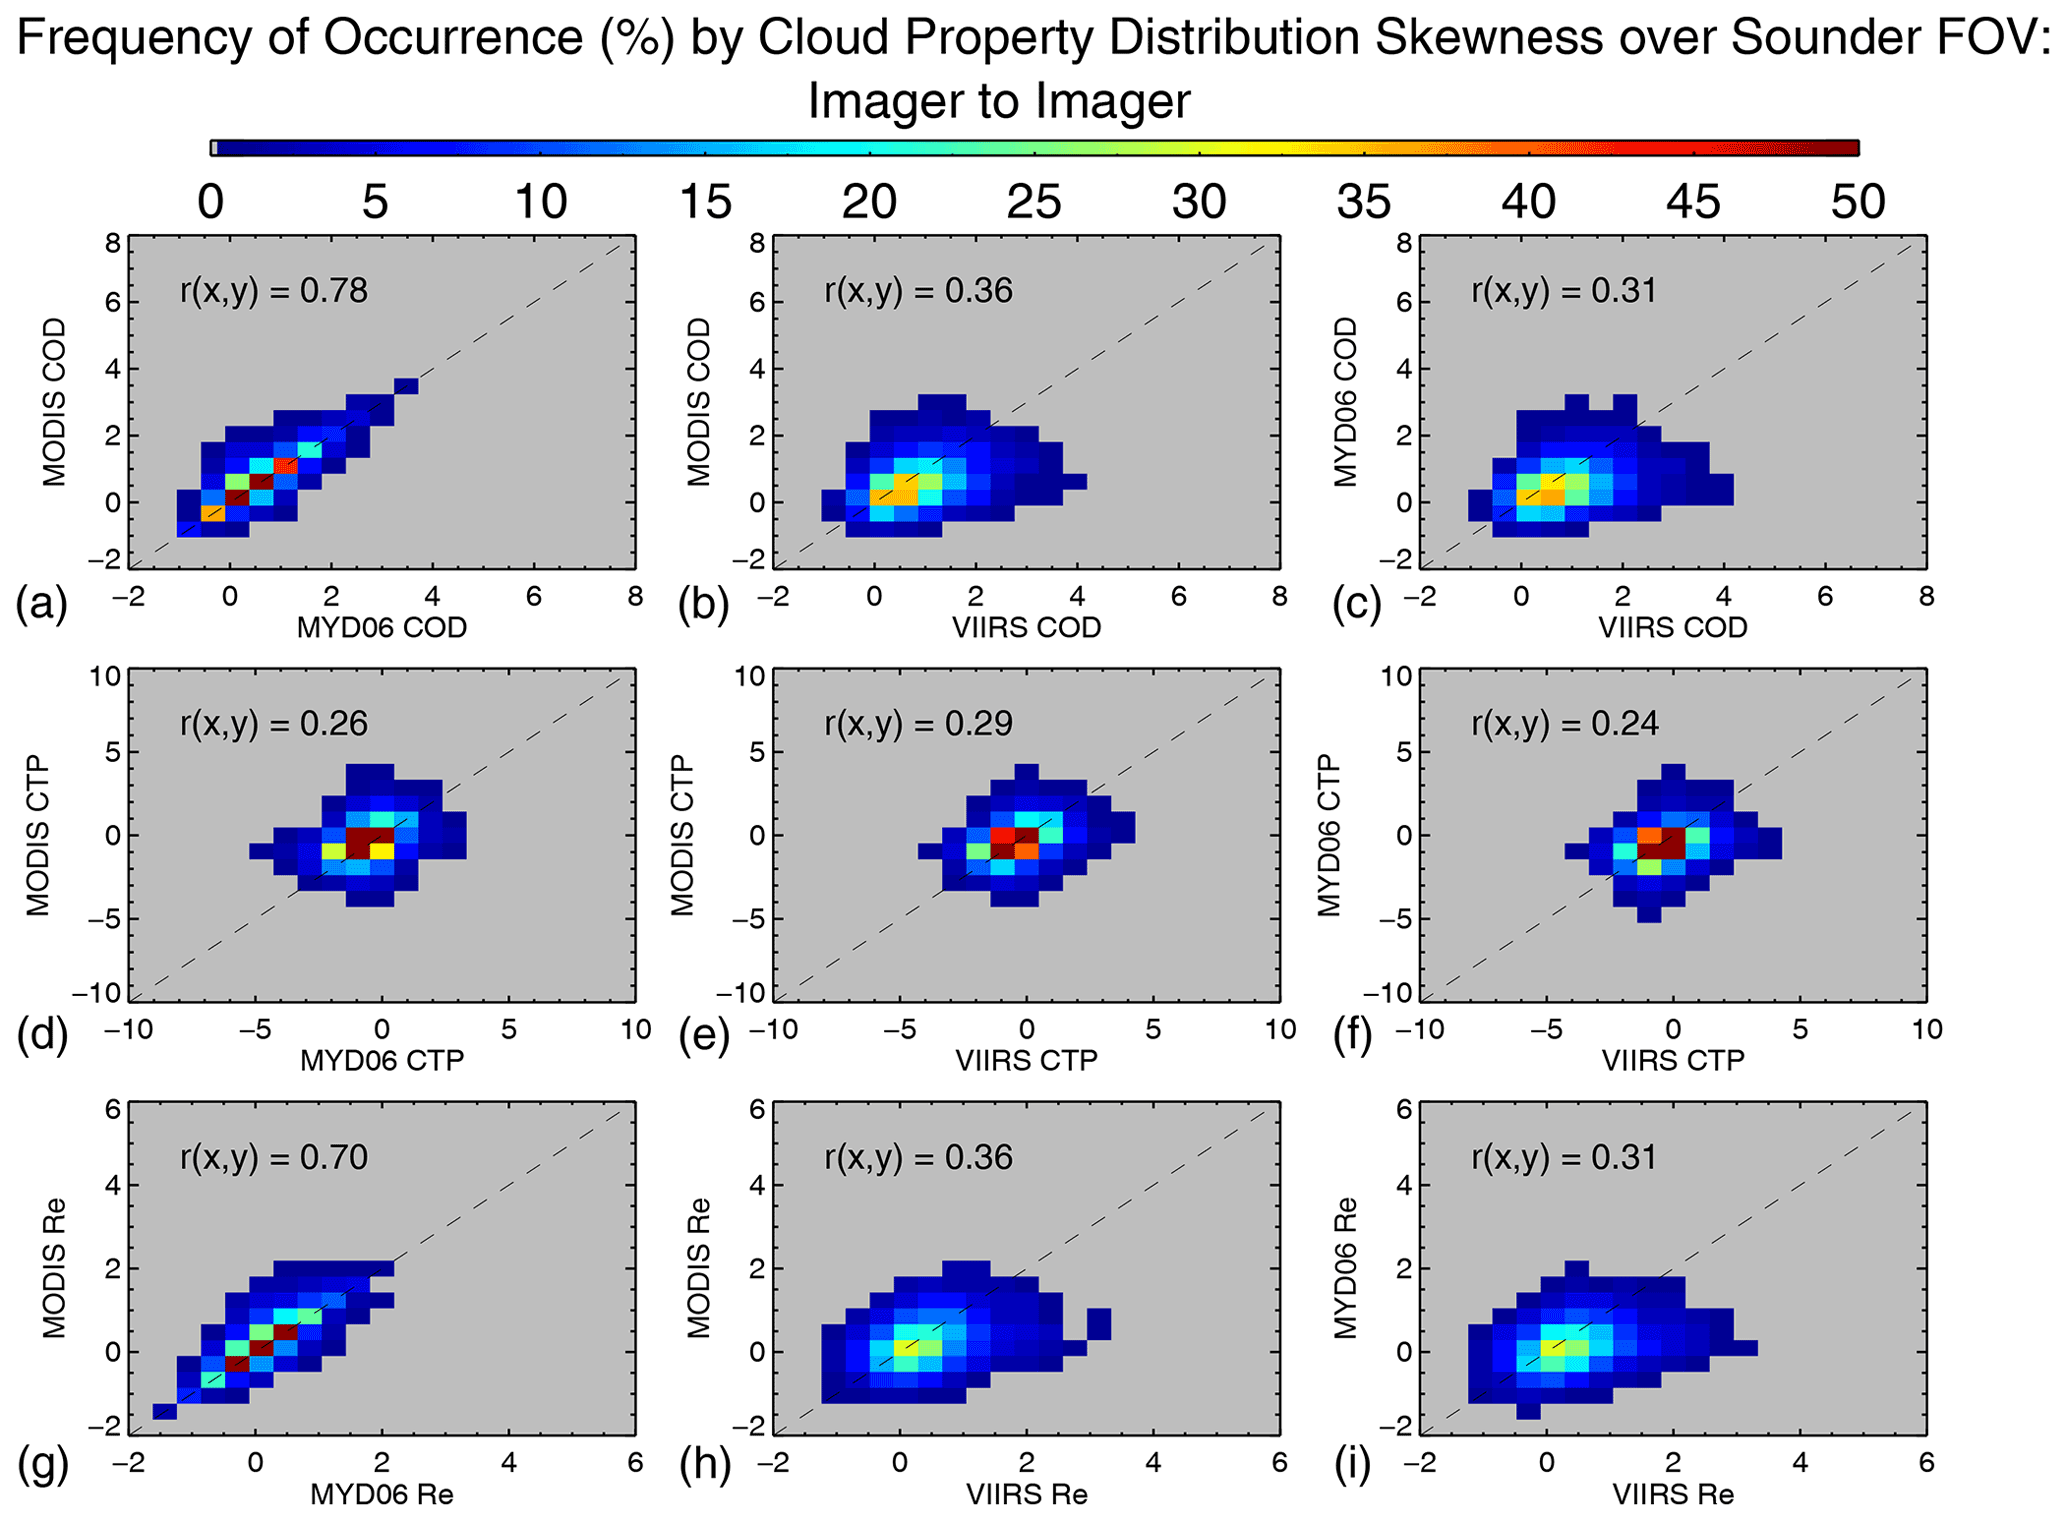
Figure 9Similar to Figs. 8 and 7, except cloud property skewness over sounder FOV is used in the comparison. Results are shown on a linear scale. Linear correlation coefficients between the variables on the x and y axes are given in each plot.
3.4 Joint histograms, cloud types, and cloud thermodynamic phase
3.4.1 Cloud type by cloud property joint histograms
Figures 10–13 show the two-dimensional cloud histograms calculated using SNOs from the focus days over different surface types and regions, including the tropics (30∘ N–30∘ S), over ocean (land fraction <0.1 at 60∘ N–60∘ S), over land (land fraction >0.9 at 60∘ N–60∘ S), and over ice- and snow-covered surfaces (frozen surfaces), respectively. The land fraction and surface classes are obtained from the AIRS V7 L2 product under the variable names of landFrac and SurfClass, respectively. For MODIS and VIIRS, the ISCCP type of CTP–COD joint histograms are generated by summing the joint distributions over individual AIRS and CrIS FOVs, with no averaging over sounder FOVs. For AIRS and CrIS, joint distributions are calculated on the CTP and ECF space.

Figure 10The two-dimensional histograms calculated using SNOs from the focus days in the tropics (30∘ N–30∘ S). (a–c) Results for MODIS and VIIRS, for which the ISCCP type of COD–CTP joint histograms are presented by summarizing the histograms over individual AIRS and CrIS FOV. Note that no averaging over sounder FOV is taken for this comparison. From left to right, results of MYD06, Aqua MODIS continuity, and SNPP VIIRS continuity cloud products. (d–g) Results for AIRS and CrIS and joint distributions are calculated on the imager effective CTP and ECF space. From left to right, data from AIRS version 7 (AIRS V7), CLIMCAPS-Aqua (C-AIRS), CLIMCAPS-SNPP FSR (C-SNPP-FSR), and CLIMCAPS-SNPP NSR (C-SNPP-NSR) are used in the calculation.
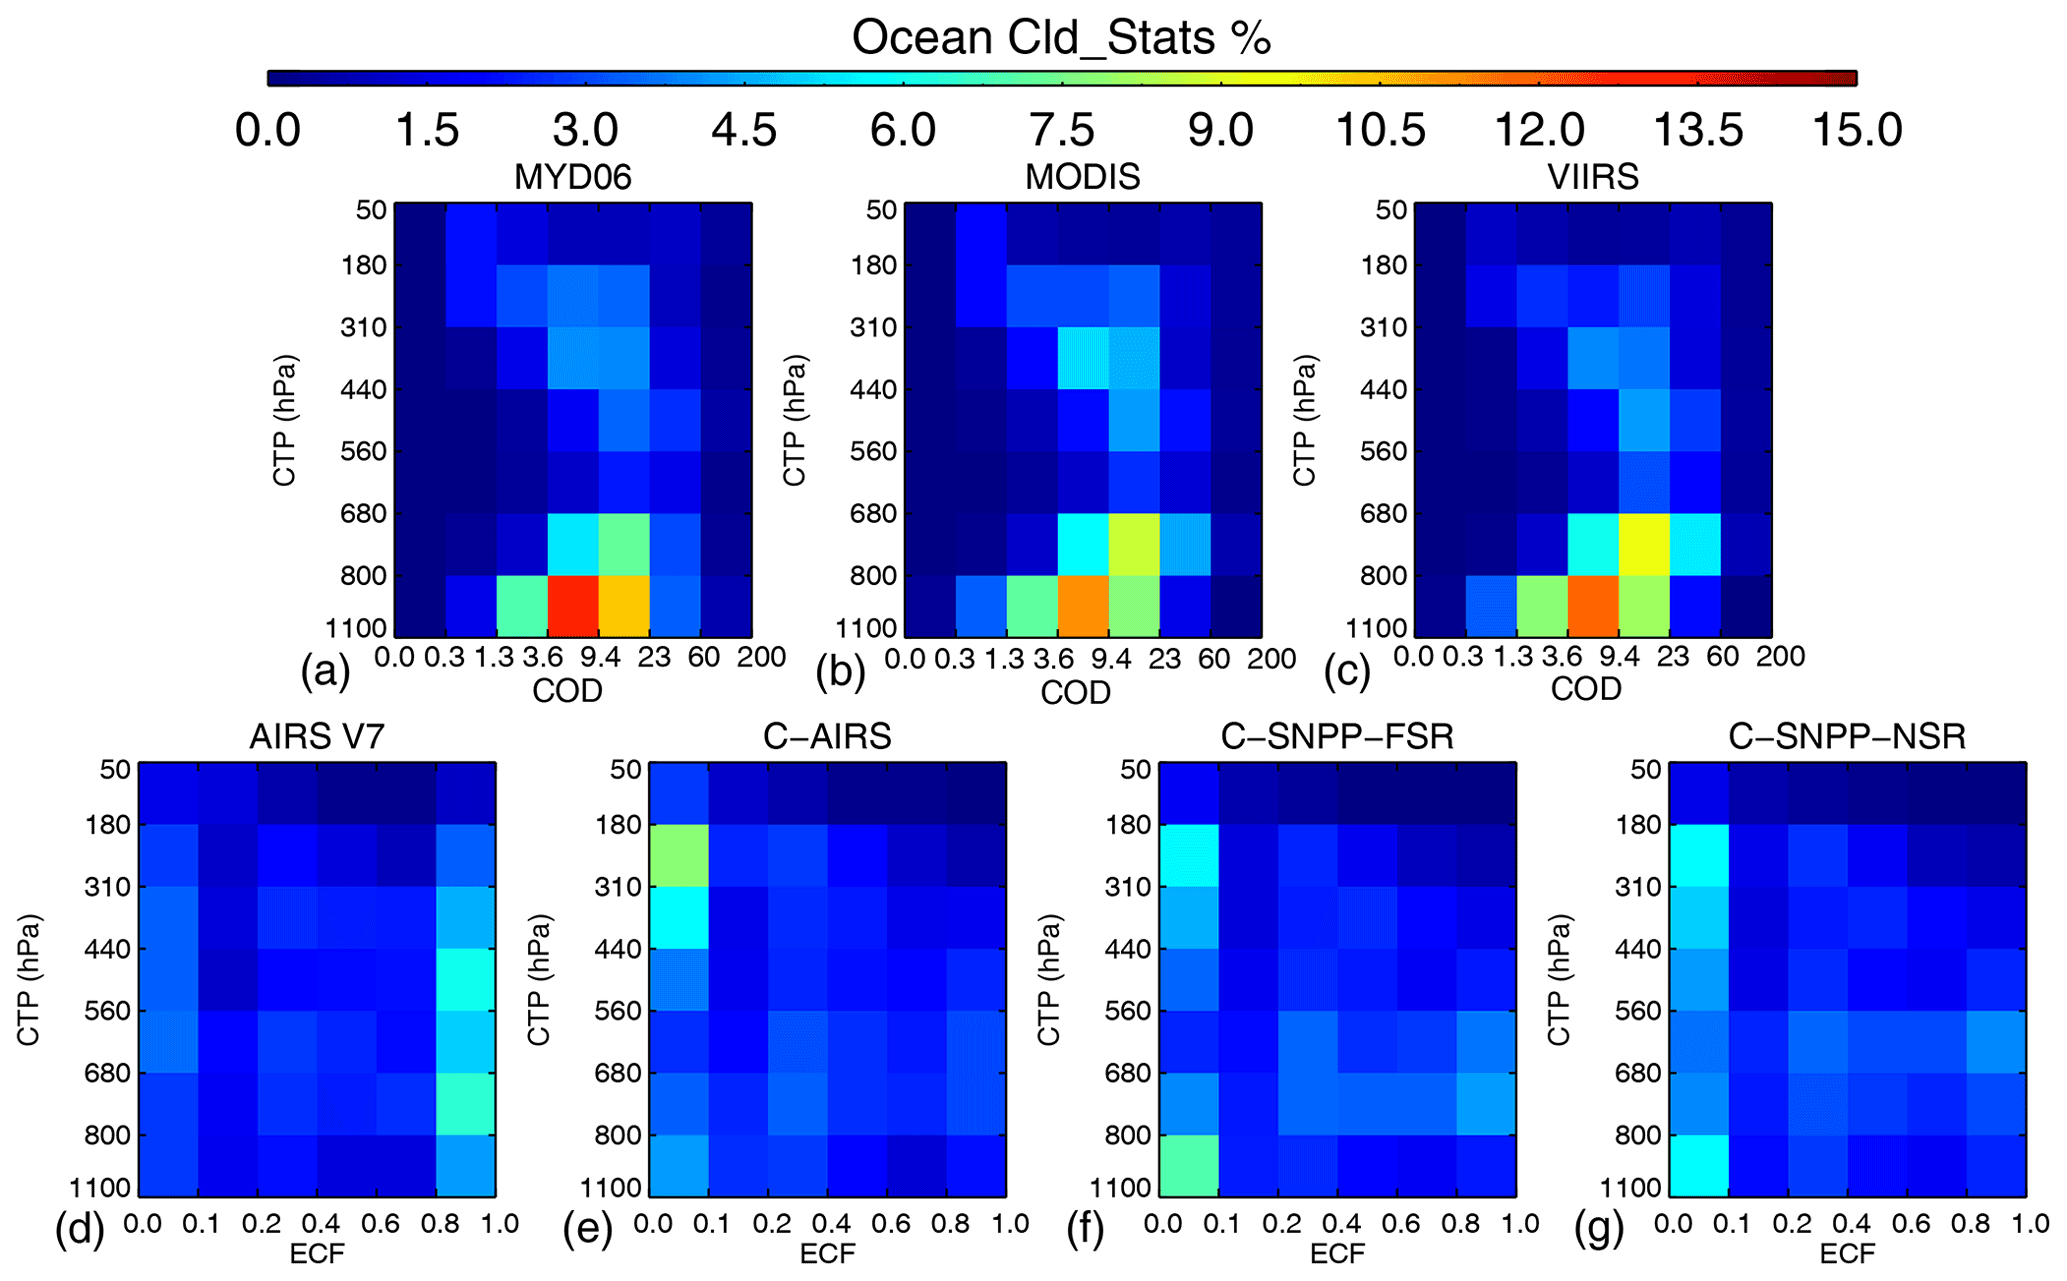
Figure 11Similar to Fig. 10, except showing results calculated using data over ocean at 60∘ N–60∘ S. Sounder land fraction <0.1 is used to determine ocean surfaces.
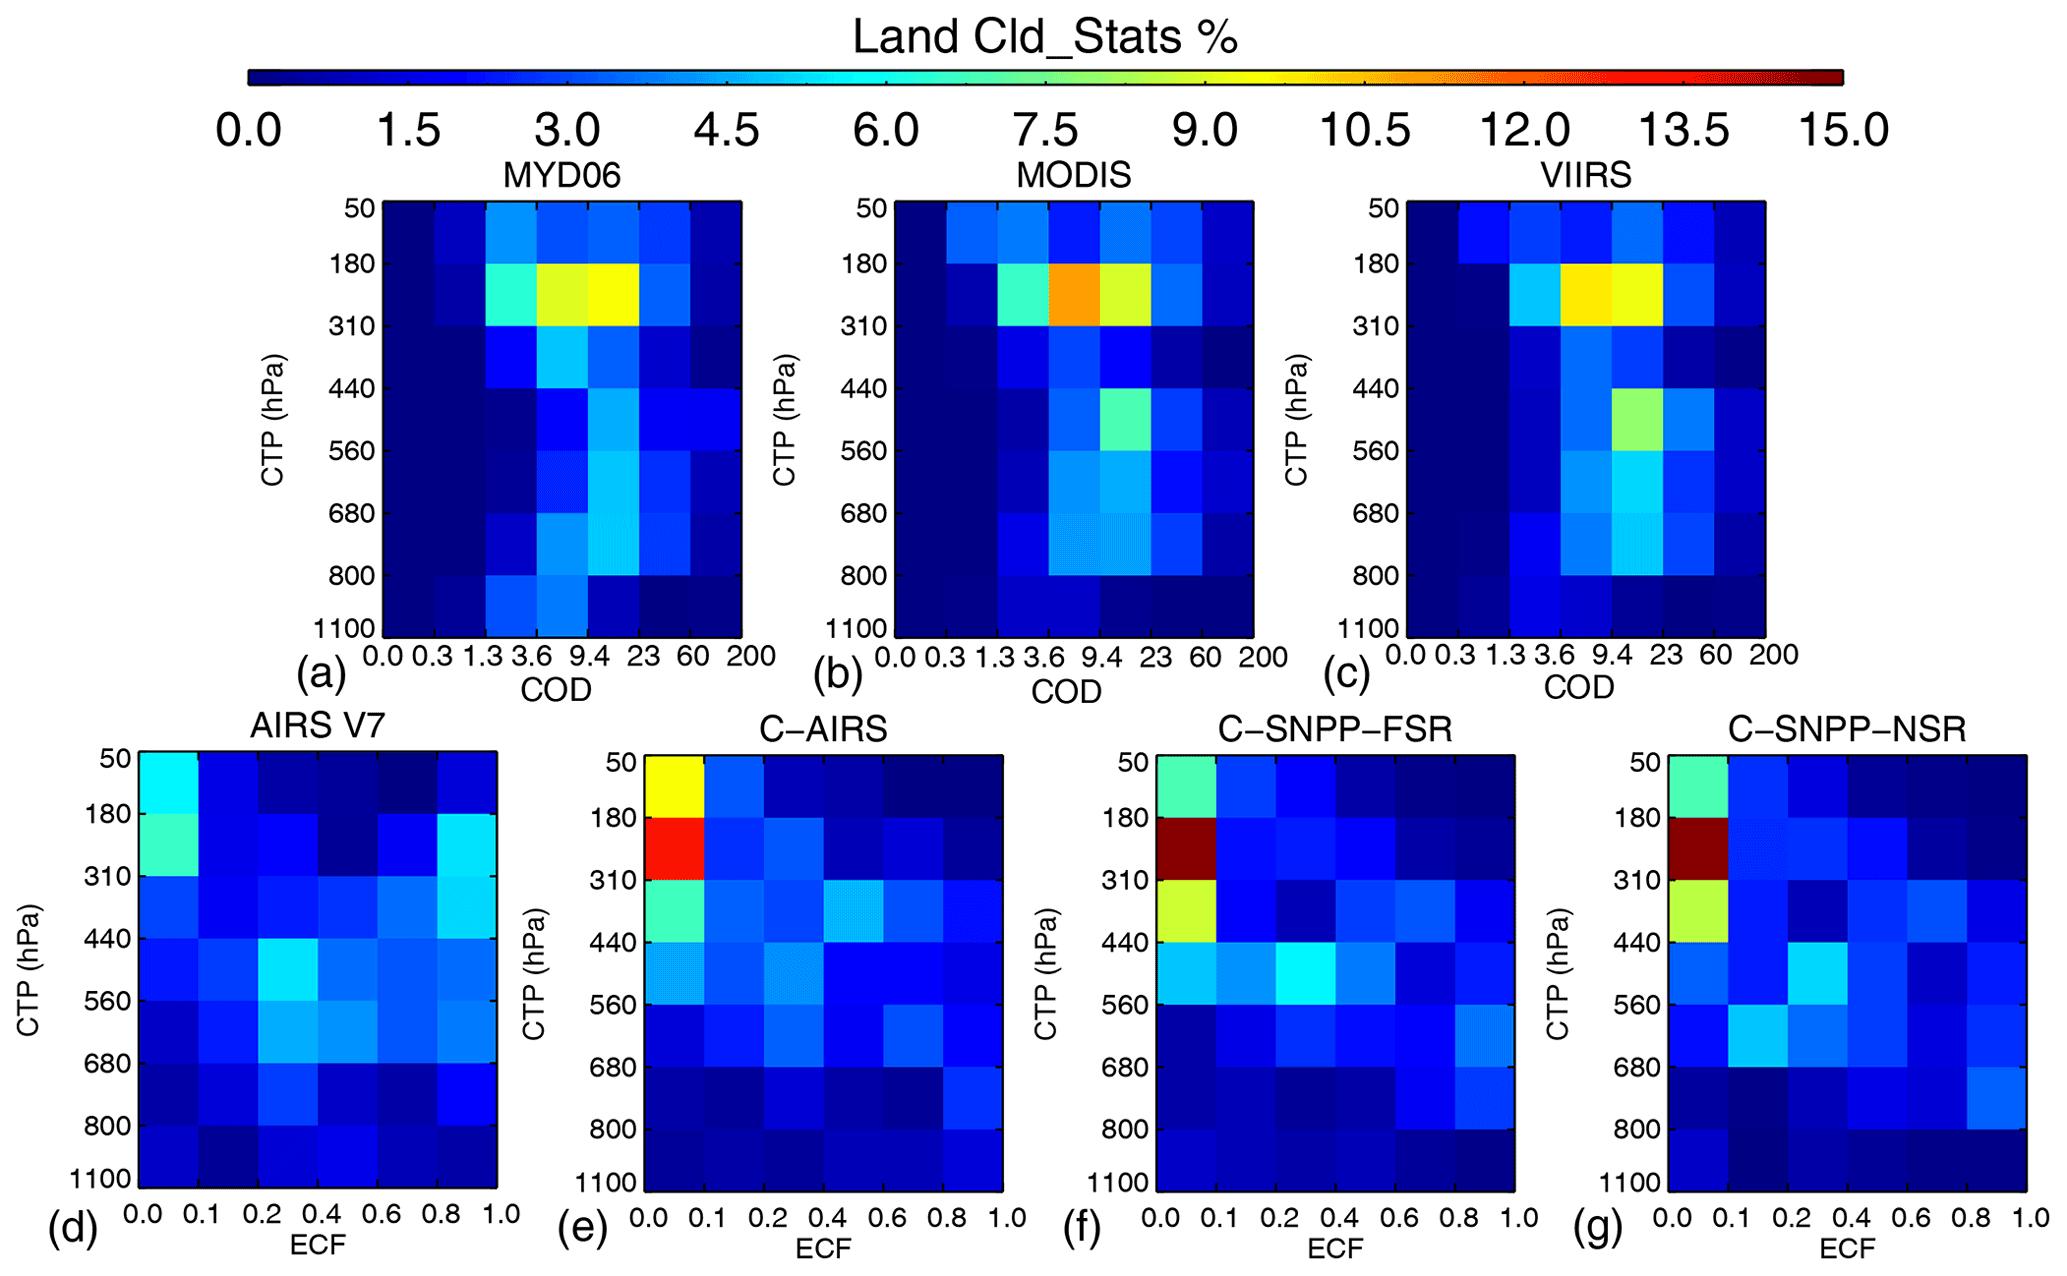
Figure 12Similar to Figs. 11 and 10, except showing results calculated using data over land at 60∘ N–60∘ S. Sounder land fraction >0.9 is used to determine land surfaces.
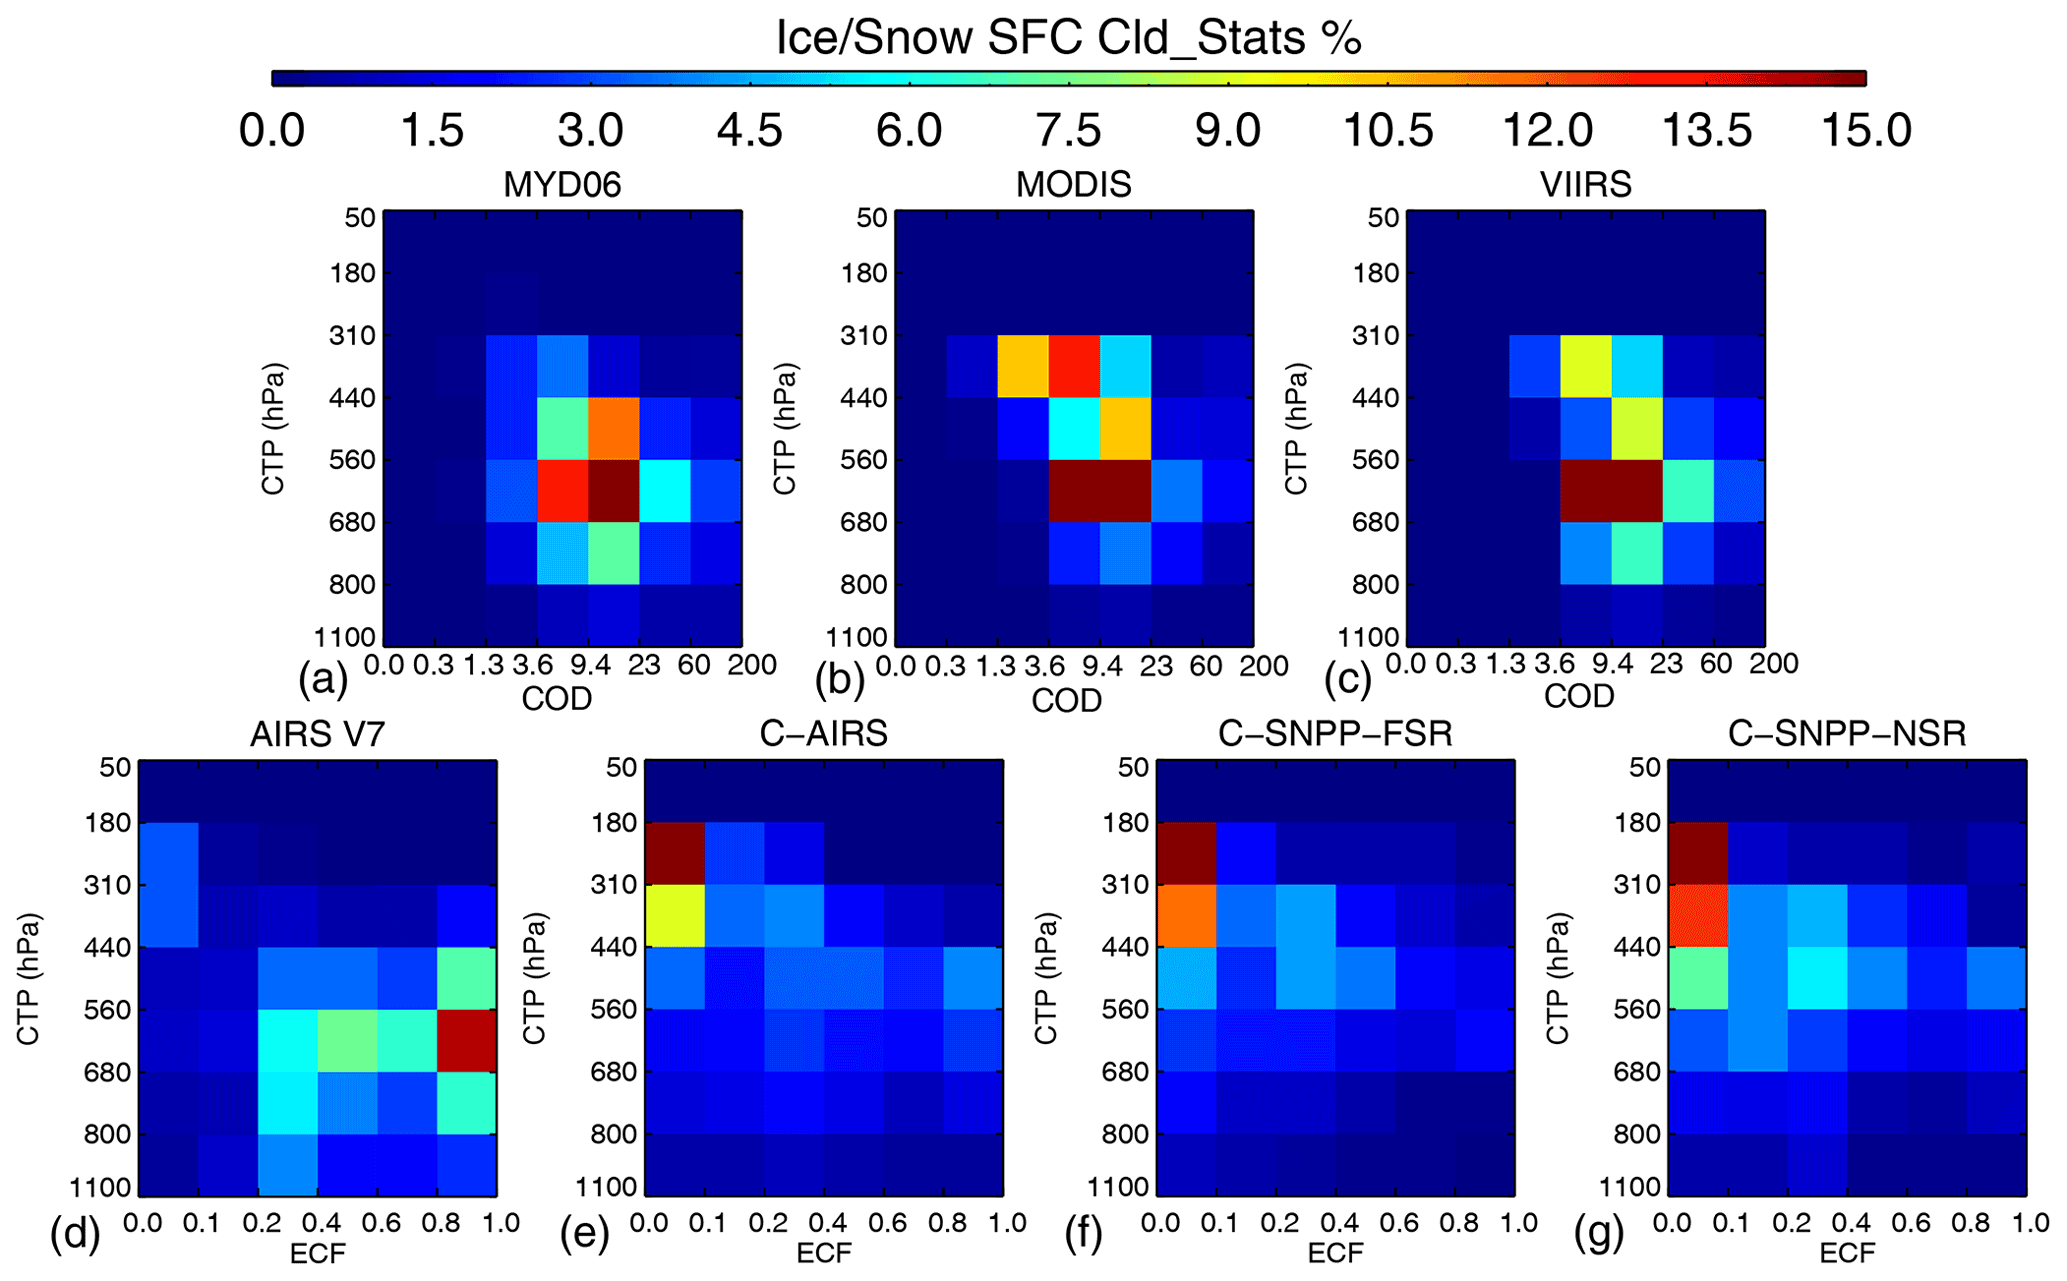
Figure 13Similar to Figs. 10–12, except showing results calculated using data over snow- and ice-covered surfaces (Ice/Snow SFC). Sounder retrieved surface classes are used to identify cases.
Consistent with results in previous sections, AIRS V7 shows peaks of both thin and thick clouds, while CLIMCAPS V2 products show a single peak distribution of thin clouds. Better consistency of AIRS V7 with imager cloud products is also shown by the joint histograms. For example, in the tropics (Fig. 10), clusters corresponding to optically thick high clouds, thin cirrus clouds, and broken or optically thin low clouds are seen in the AIRS V7 CTP–ECF histogram, consistent with the patterns in the MODIS and VIIRS CTP–COD histograms. Agreement between AIRS V7 and imager clouds is also found for mid- and low-cloud clusters over ocean (Fig. 11) and for high and mid clouds over land (Fig. 12). Over frozen surfaces (Fig. 13), the sounder clouds show optically thin and high clouds, especially in CLIMCAPS V2; a large percentage of mid clouds with medium to large ECF values are seen in AIRS V7, more consistent with the cloud histograms from imager observations. However, MODIS and VIIRS cloud detection and retrievals suffer a higher uncertainty over frozen surfaces (Chan and Comiso, 2013), and the small atmospheric thermal contrast with frozen surfaces presents additional challenges for hyperspectral IR sounder retrievals (Yue and Lambrigtsen, 2020). Therefore, more accurate cloud measurements from in situ or active spaceborne instruments are needed to further quantify the quality of these imager and sounder cloud retrieval products in snow- and ice-covered regions.
Because of its long temporal coverage since 1999 when Terra MODIS began operating, high-quality data; the distinct physical characteristics of different cloud types; and the MODIS cloud data record, especially the CTP–COD joint histograms, have been widely used in different aspects of climate studies. These include detailed analyses on the radiative effect of different cloud types (Yue et al., 2016; Oreopoulos et al., 2016); evaluation of climate model simulations of clouds (Pincus et al., 2012); quantification of the cloud feedback by different cloud types (Zhou et al., 2013; Yue et al., 2019); and investigations of cloud impacts on the hydrological cycle and the global circulation (Su et al., 2017), especially in the tropics. Therefore, the differences of the cloud frequency histograms from various imager retrieval products in the tropics are further analyzed here. In Fig. 14, the MODIS continuity product (depicted in Fig. 10) is used as the common base to evaluate the differences caused by algorithms and sensors: (1) between current NASA standard MODIS retrievals and the MODIS continuity algorithms and (2) between the MODIS and VIIRS continuity cloud data records. The magnitude of differences of joint frequency histograms is within ±5 % using the focus day observations. MYD06 shows more clouds with CTP<180 hPa but fewer low clouds with CTP>800 hPa than the continuity product, consistent with findings in Platnick et al. (2021). VIIRS continuity cloud retrievals produce higher frequencies of clouds with COD between 9.4 and 60 but fewer high clouds with COD<9.4. Whether and how these differences will impact the long-term trend and short-term variability of clouds as seen by the imagers warrants further study.

Figure 14Differences of the imager CTP–COD cloud histograms in the tropics: between the MYD06 and Aqua MODIS continuity products (a) and between the Aqua MODIS and SNPP VIIRS continuity cloud products (b).
3.4.2 Cloud thermodynamic phase
Both MYD06 and continuity cloud products provide cloud thermodynamic phases (Table 1), given by the optical-property retrieval (Cloud_Phase_Optical_Properties, in both MYD06 and continuity products) and the CLAVR-x processing system (Cloud_Phase_Cloud_Top_Properties, continuity products only). The Cloud_Phase_Cloud_Top_Properties variable reports flags determining pixels to be cloud free, water clouds, ice clouds, mixed-phase clouds, or of an undetermined phase. The Cloud_Phase_Optical_Properties flags indicate that the cloud mask is not determined for pixels, clear skies, liquid water clouds, ice clouds, or an undetermined phase, the last of which includes mixed-phase clouds (Marchant et al., 2016). AIRS thermodynamic cloud phase, which is available in the AIRS V6 and V7 level 2 support product, is based on a set of brightness temperature differences and threshold tests using the channels in 960, 1231, 930, and 1227 cm−1 (Nasiri and Kahn, 2008; Kahn et al., 2014). These tests are applied to AIRS FOVs, where ECF>0.01, and classify the AIRS FOV as containing liquid, ice, or unknown cloud phases. Detailed comparisons of AIRS cloud phases with CALIPSO indicate good agreement with CALIPSO on ice-phase detection and conservative liquid-phase determination (Jin and Nasiri, 2014; Peterson et al., 2020). These studies also show that the unknown class of AIRS cloud phase corresponds to scenes containing both ice and liquid particles, as well as low-level liquid clouds, especially in the trade-wind cumulus cloud regime.
Figures 15–18 show the histograms of the cloud thermodynamic phase (solid color bars for imagers and magenta symbols for AIRS) for the same set of focus day SNOs. Similar to joint histograms in Figs. 10–13, each figure shows results over the four types of surfaces and regions: tropics, ocean, land, and frozen surfaces. MODIS and VIIRS cloud mask histograms (hollow color bars) are also shown in the figures, together with the frequency of clear sky detected by IR sounders (ECF<0.01, colored solid circles). Note that for MODIS and VIIRS, the mixed-phase or undetermined-phase category is shown with the y axis on the right due to their much smaller frequency of occurrence. For clear-sky detection, the cloud-mask clear frequencies from all the imager products are similar except over the frozen surfaces, where the VIIRS cloud mask shows a 10 % higher frequency than MODIS. For IR sounders, AIRS V7 produces significantly lower clear-sky frequency than CLIMCAPS and imager cloud products over non-frozen surfaces. Over frozen surfaces, more frequent clear conditions are reported by AIRS V7 than CLIMCAPS, although AIRS V7 is more consistent with the clear frequency from MODIS and VIIRS data.
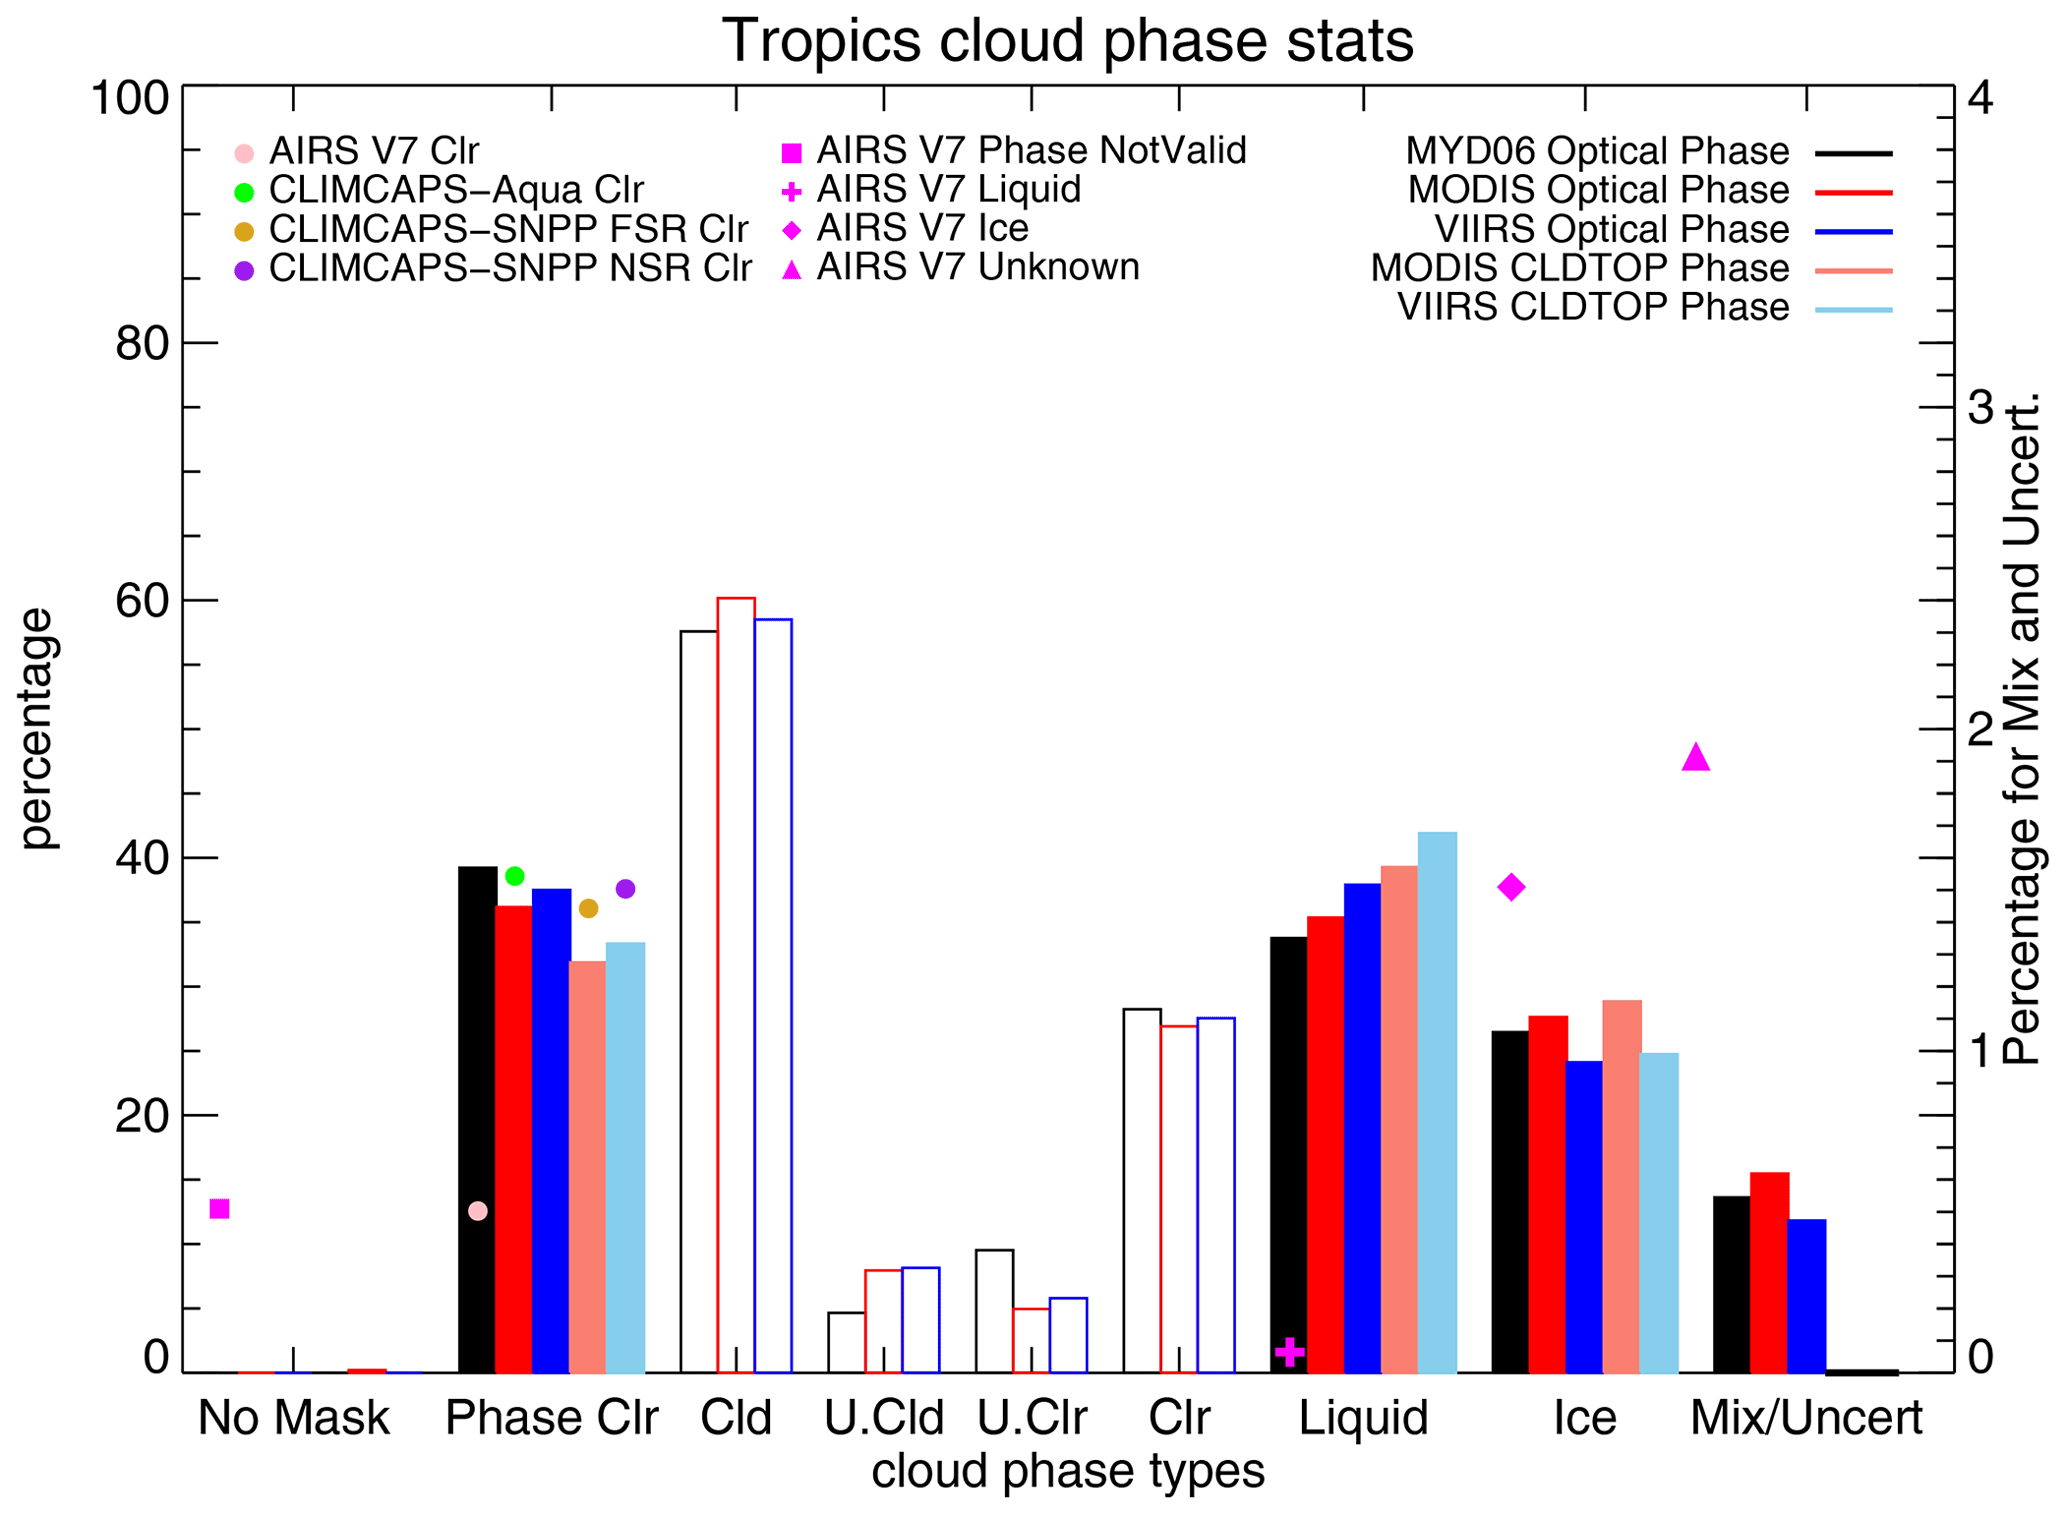
Figure 15The histograms of cloud thermodynamic phases (solid color bars) and cloud mask (hollow color bars) in the tropics (30∘ N–30∘ S) from the imager cloud products calculated using retrievals on SNOs from the 7 focus days. The frequency of clear sky detected by IR sounders using thresholds of ECF <0.01 is also shown by colored solid circles. AIRS version 7 cloud thermodynamic phase is shown by magenta symbols. Color of the bars corresponds with different imager cloud retrievals for cloud mask and cloud thermodynamic phase determined in the optical-property retrieval (Cloud_Phase_Optical_Properties): black for MYD06, red for Aqua MODIS continuity products (CLDPROP_MODIS), and blue for SNPP VIIRS continuity products (CLDPROP_VIIRS), respectively. The Cloud_Phase_Optical_Properties variable reports flags indicating cloud mask not determined for pixel (No Mask), clear sky (Phase Clr), liquid water cloud (Liquid), ice cloud (Ice), or undetermined phase (Mix/Uncert). Cloud phases reported by Cloud_Phase_Cloud_Top_Properties in the MODIS–VIIRS continuity cloud products are also evaluated, and results are shown with pink (MODIS) and light-blue (VIIRS) bars, which show flags indicating cloud free (Phase Clr), water cloud (Liquid), ice cloud (Ice), or mixed-phase cloud or undetermined phase (Mix/Uncert). Note that the mixed-phase cloud or undetermined phase (Mix/Uncert) category for imager products is shown with the y axis on the right due to its much smaller frequency of occurrence. Cloud mask histograms of not determined (No Mask), cloudy (Cld), uncertain (U. Cld), probably clear (U. Clr), and confidently clear (Clr) are shown in the figure following this color convention but using hollow bars. For IR sounder clear-sky frequency, results from AIRS V7 (pink), CLIMCAPS-Aqua (green), CLIMCAPS-SNPP FSR (yellow), and CLIMCAPS-SNPP NSR (purple) are overlaid on top of the clear-sky (Phase Clr) histograms for sounder–imager clear-sky detection comparison.
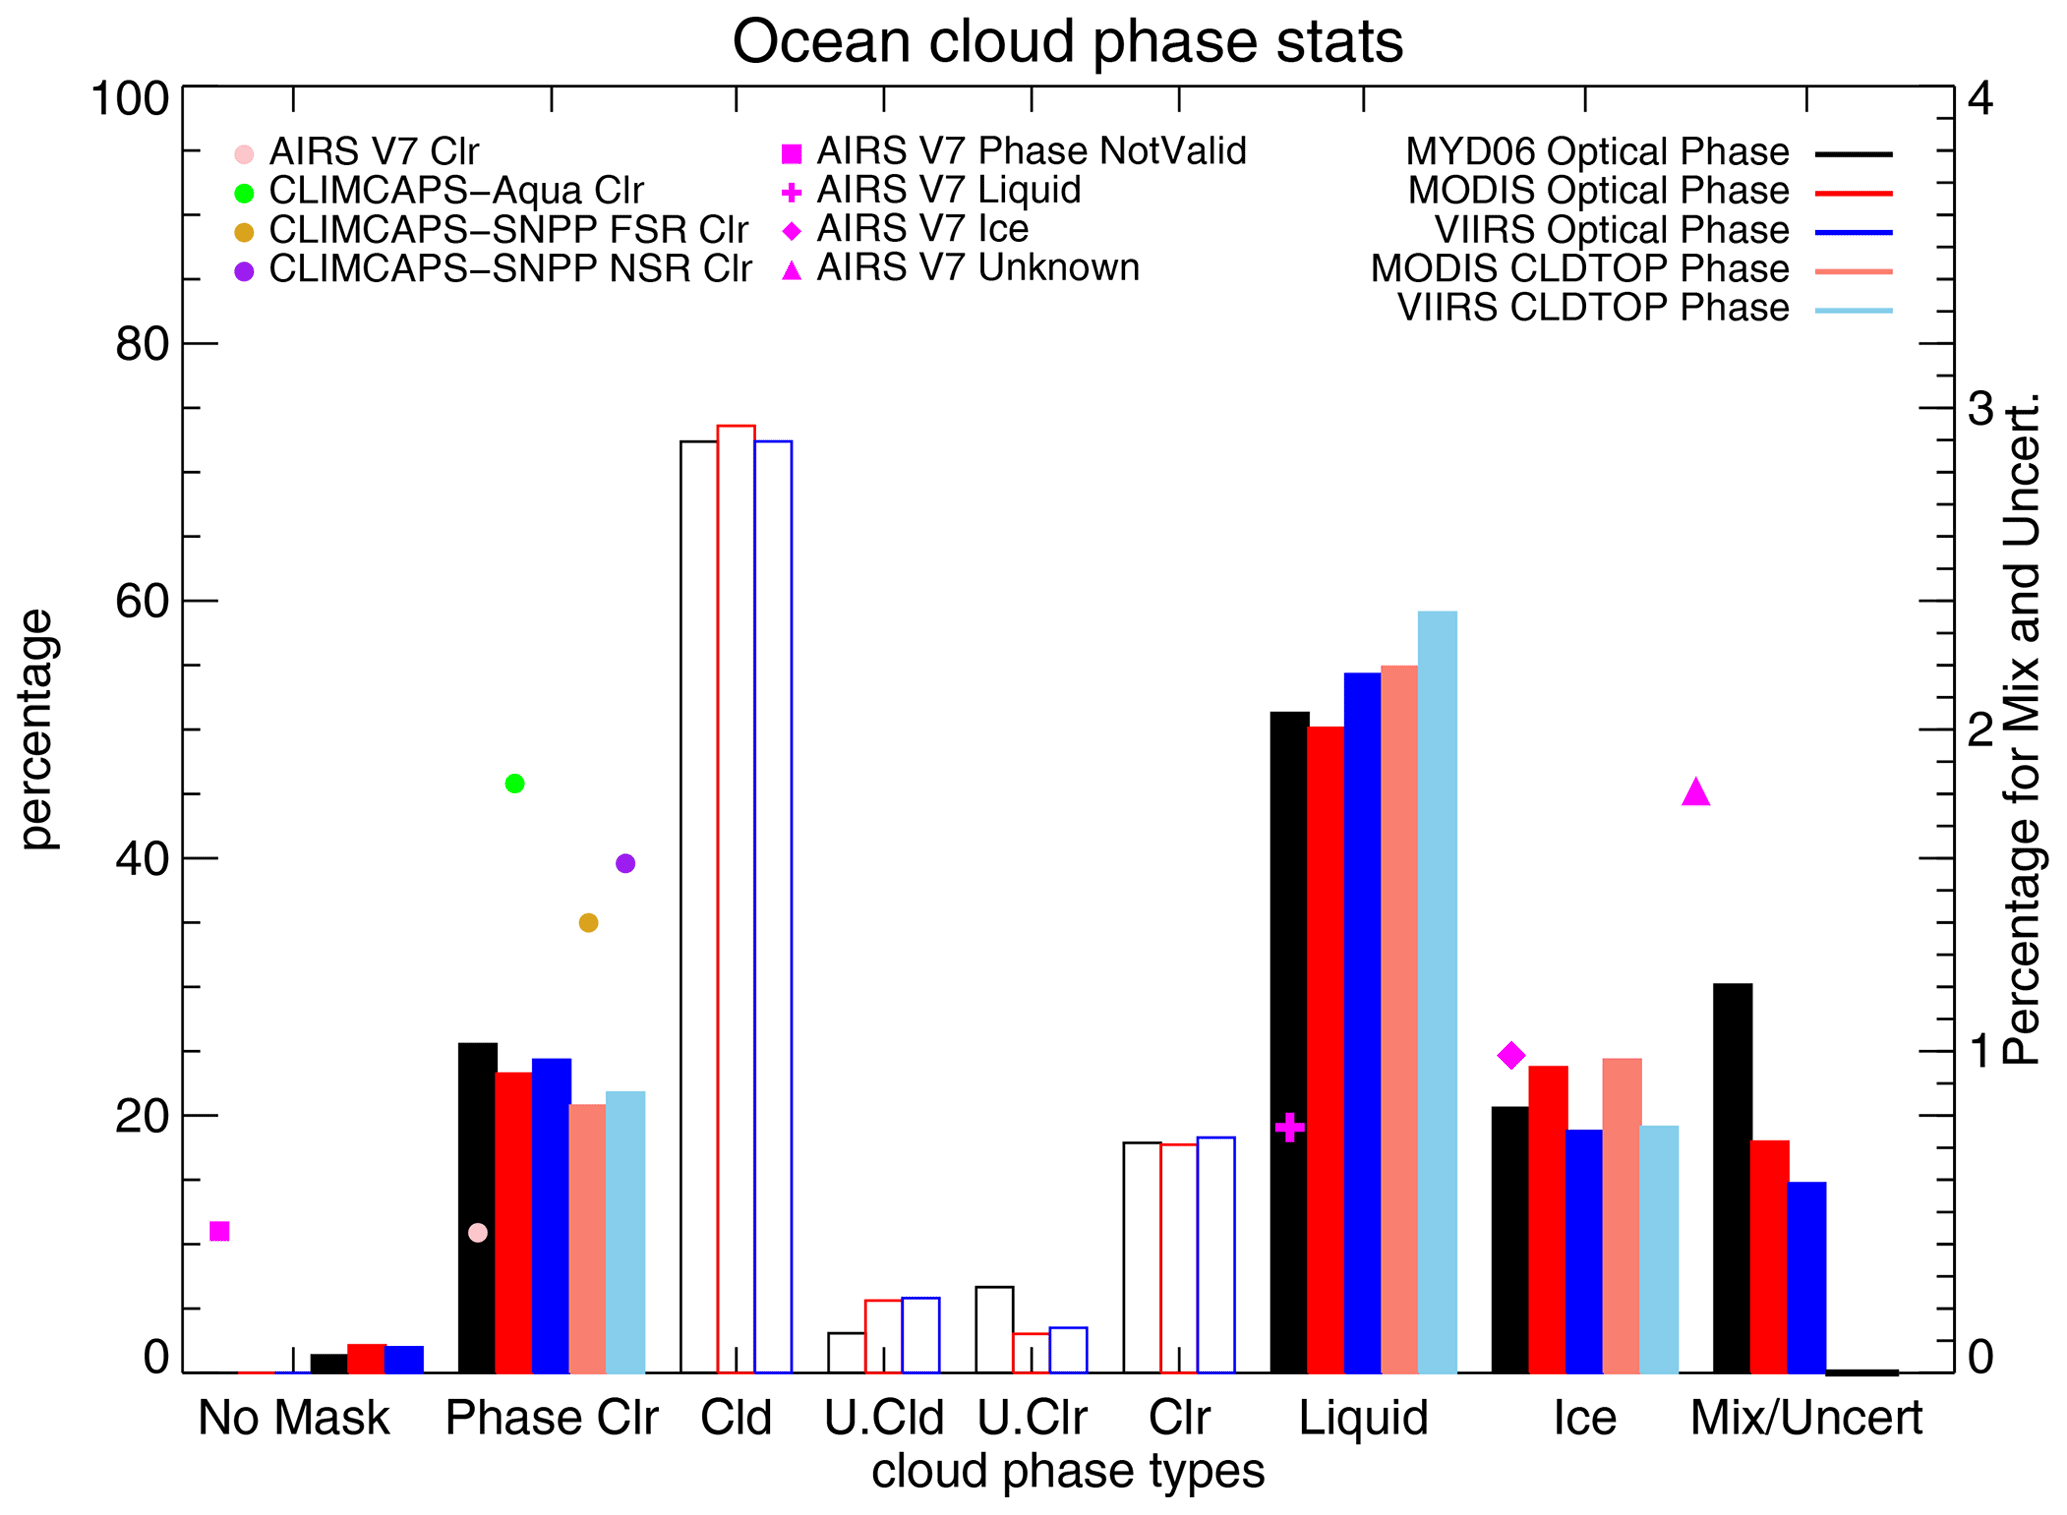
Figure 16Similar to Fig. 15, except showing results calculated using data over ocean at 60∘ N–60∘ S. Sounder land fraction <0.1 is used to determine ocean surfaces.
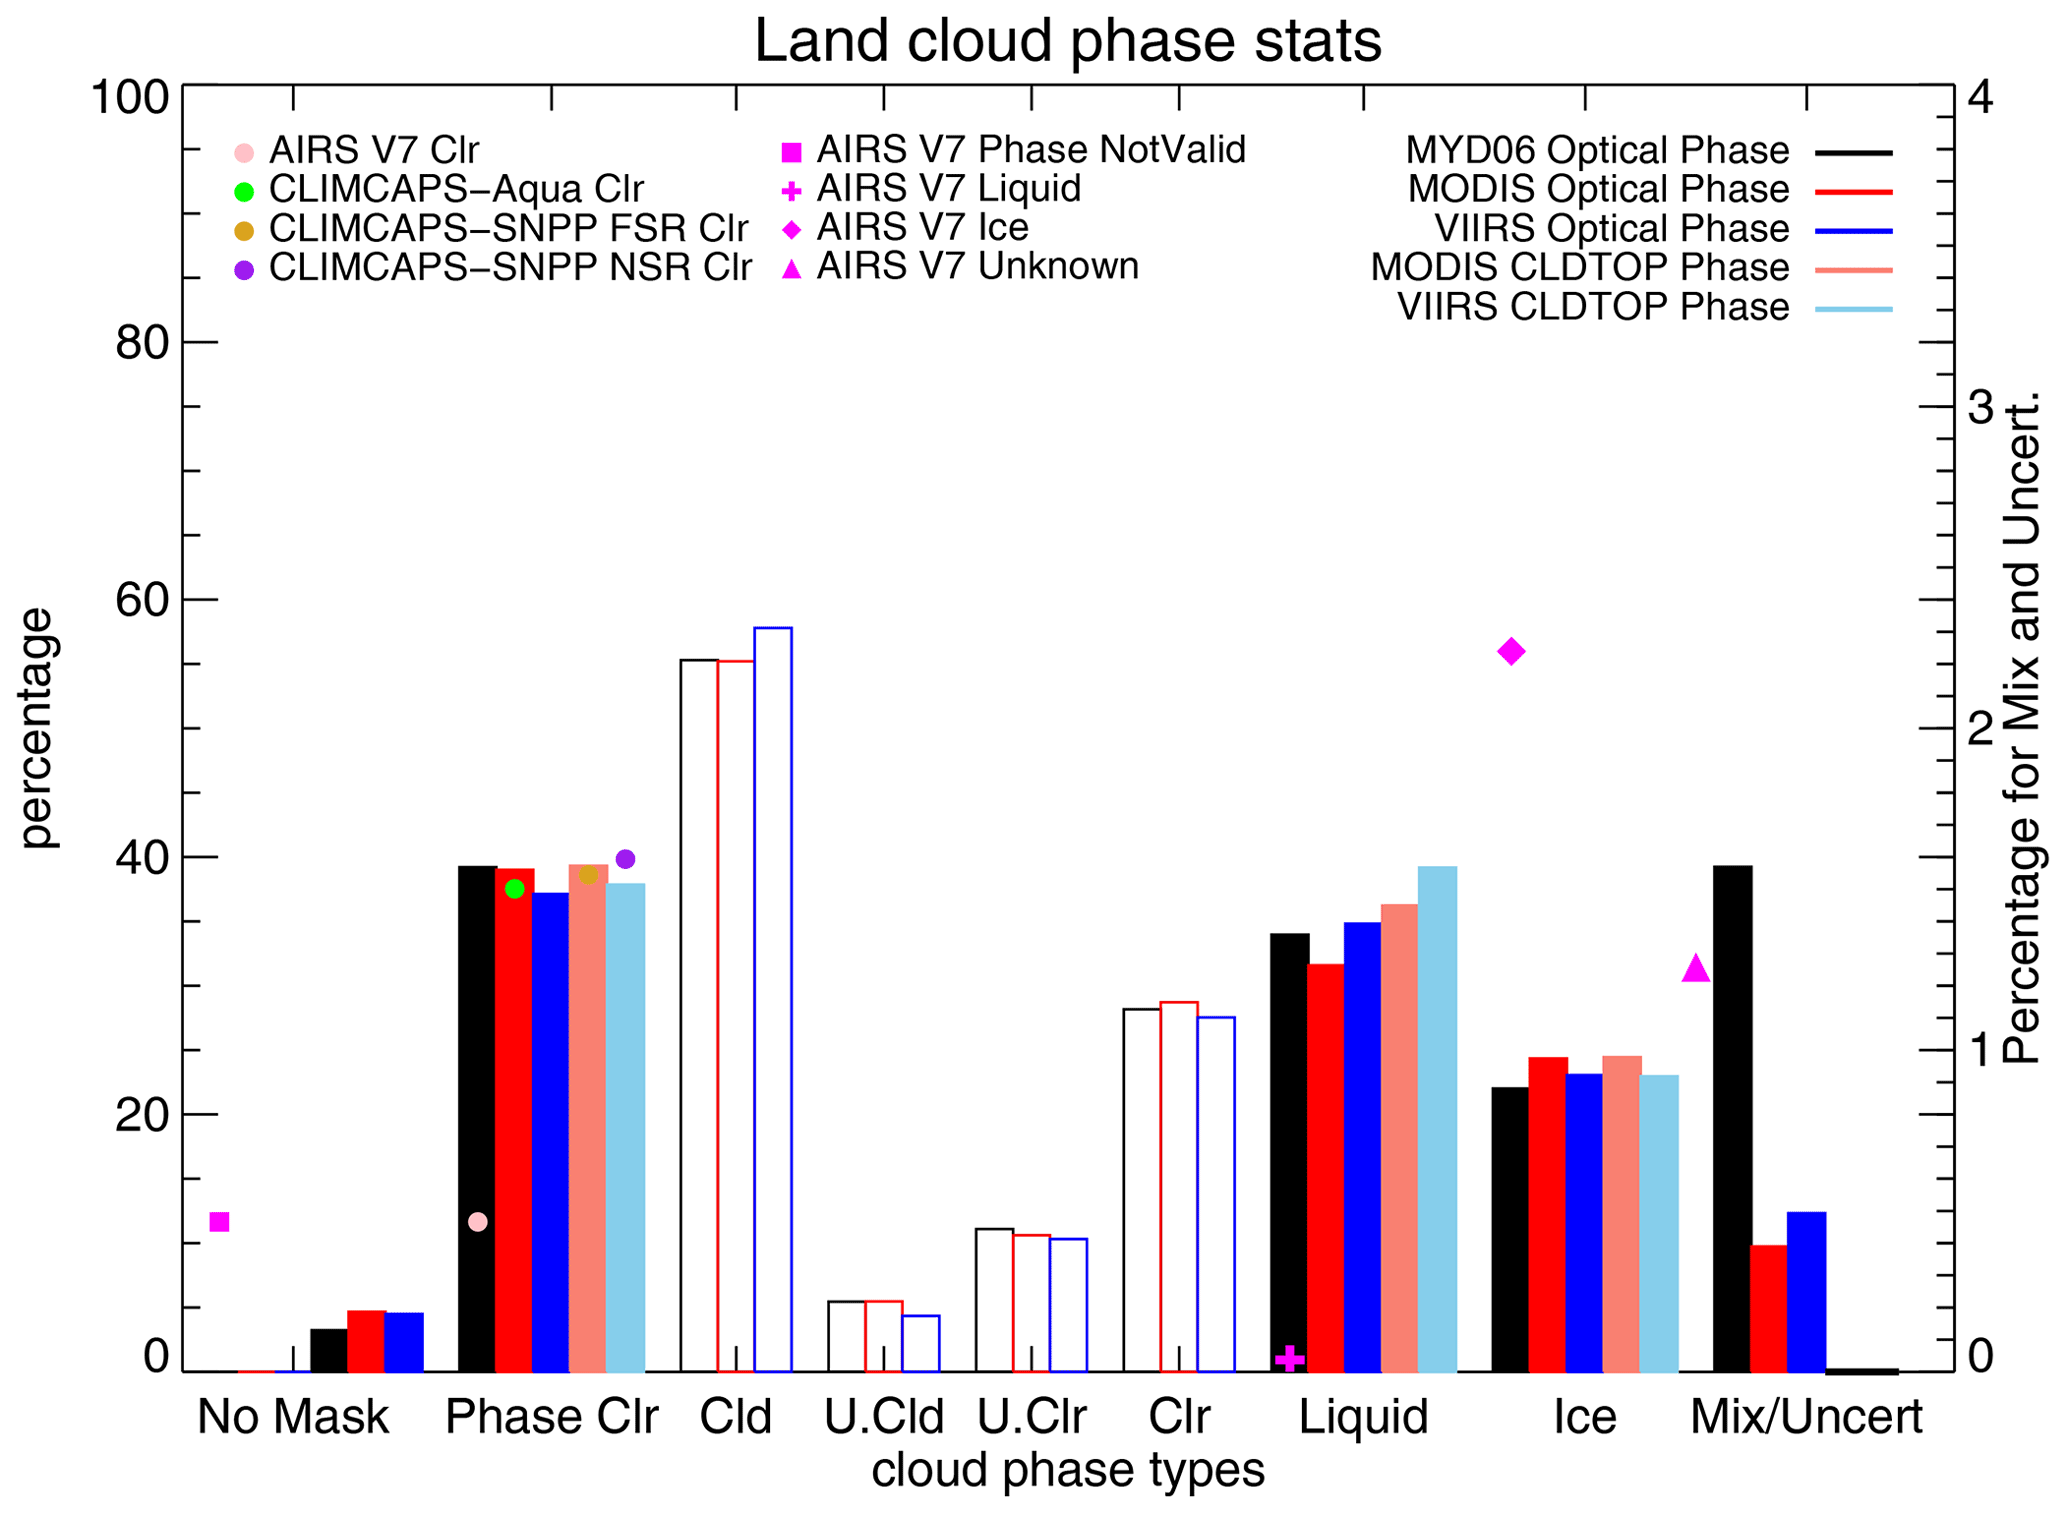
Figure 17Similar to Figs. 16 and 15, except showing results calculated using data over land at 60∘ N–60∘ S. Sounder land fraction >0.9 is used to determine land surfaces.
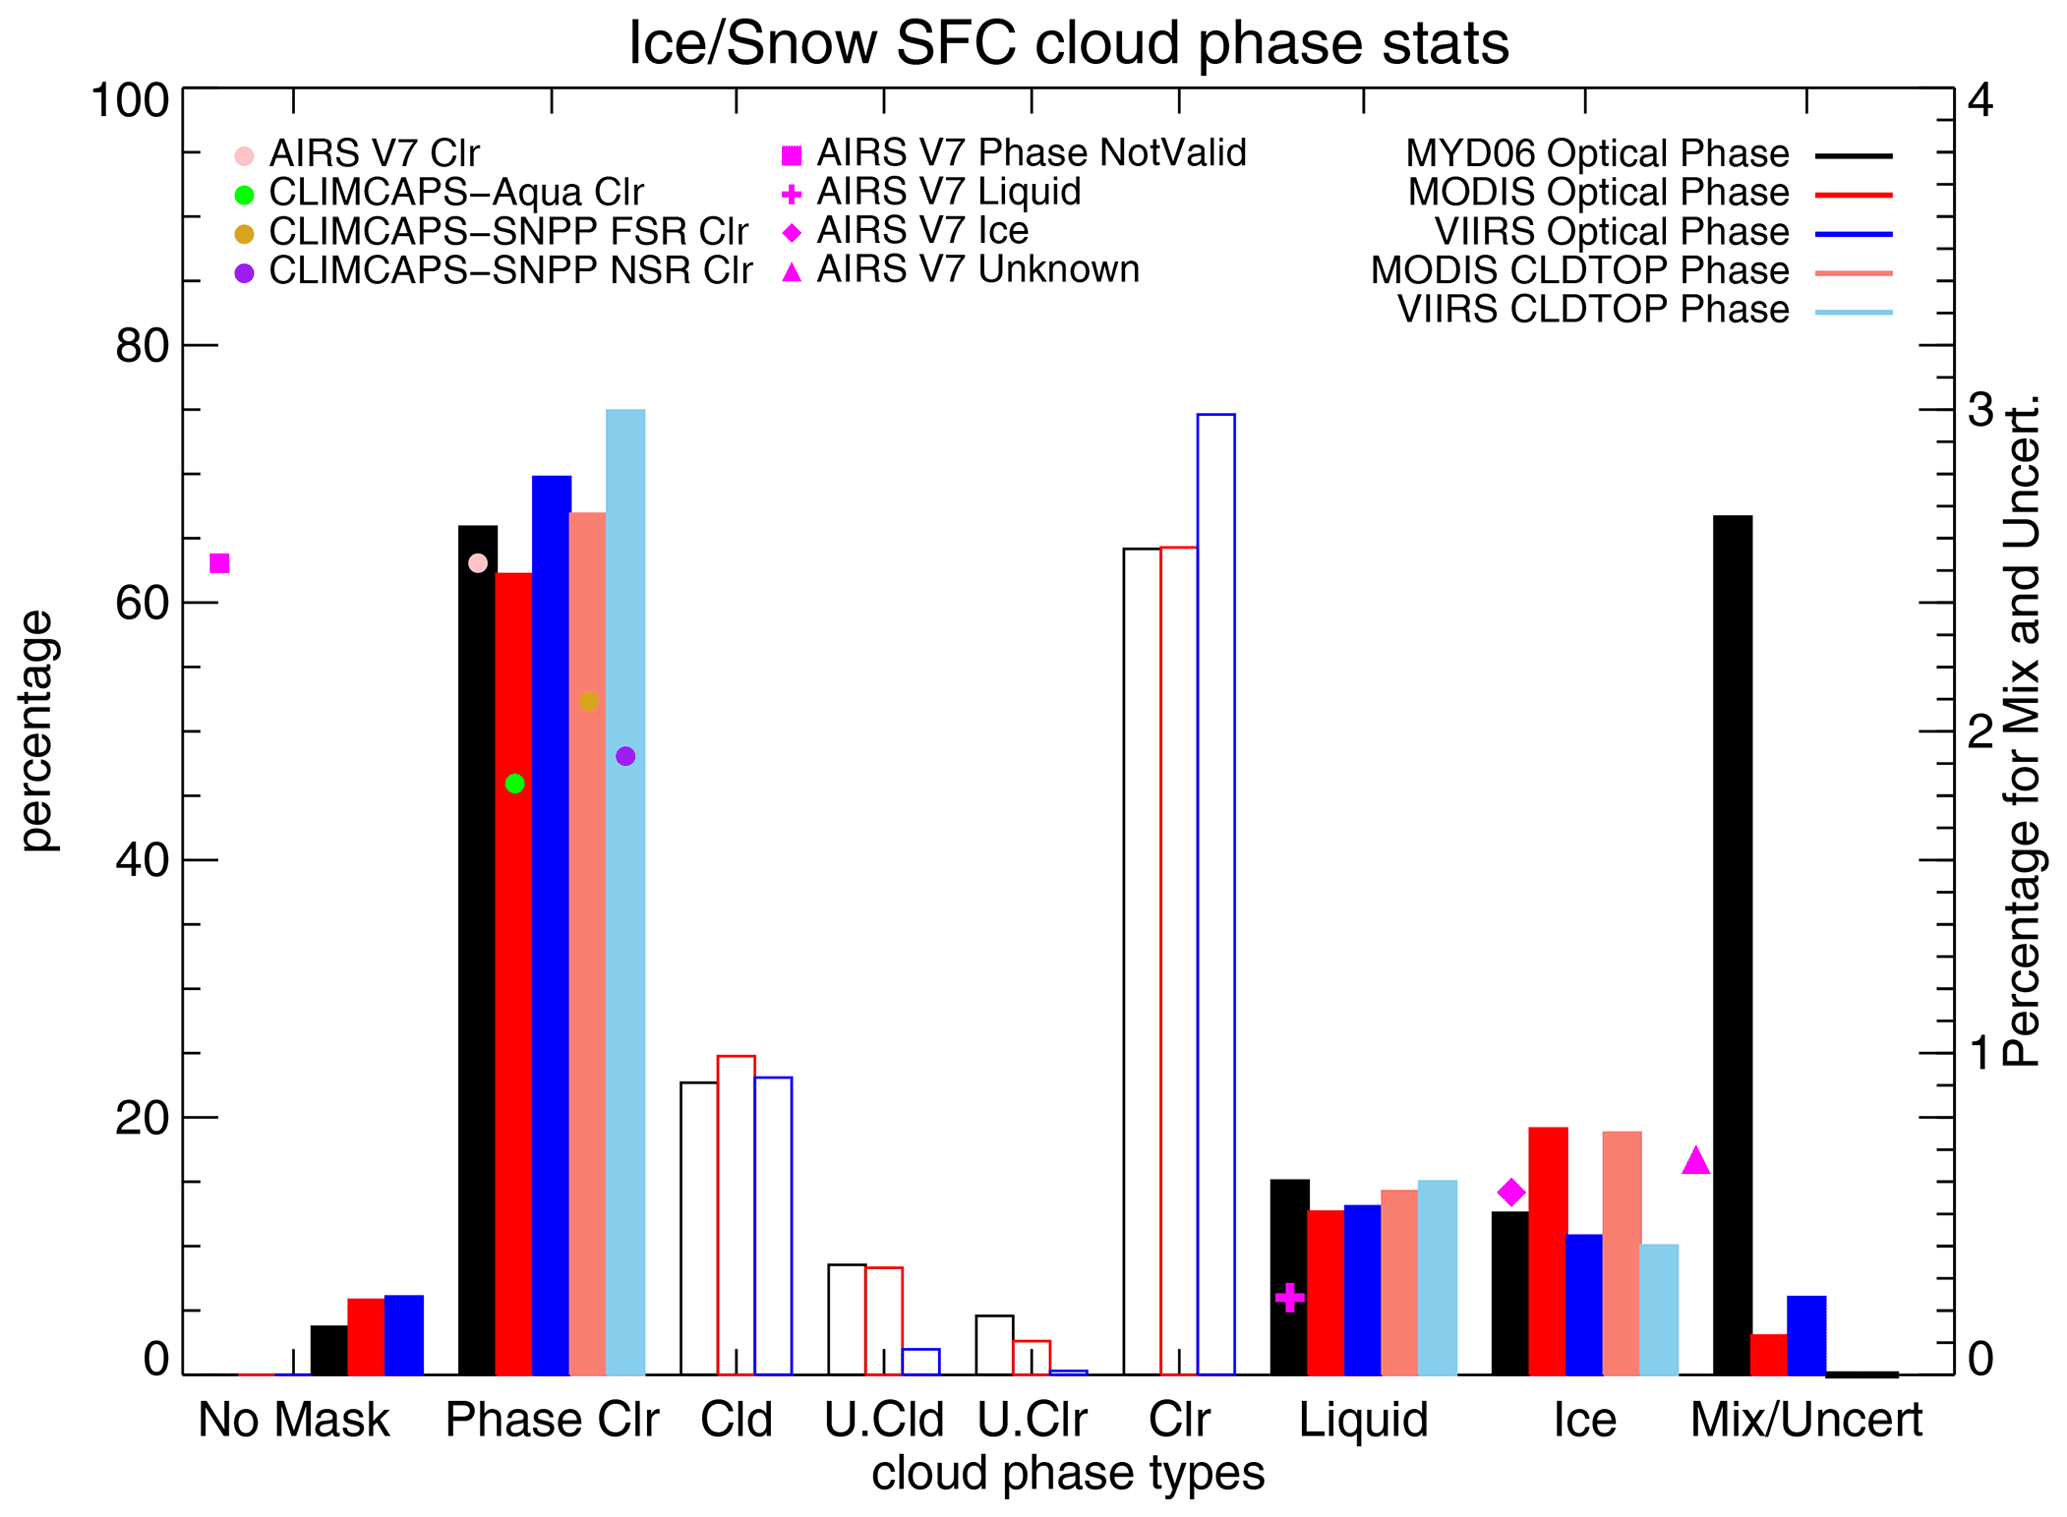
Figure 18Similar to Figs. 15–17, except showing results calculated using data over snow- and ice-covered surfaces. Sounder retrieved surface classes are used to identify cases.
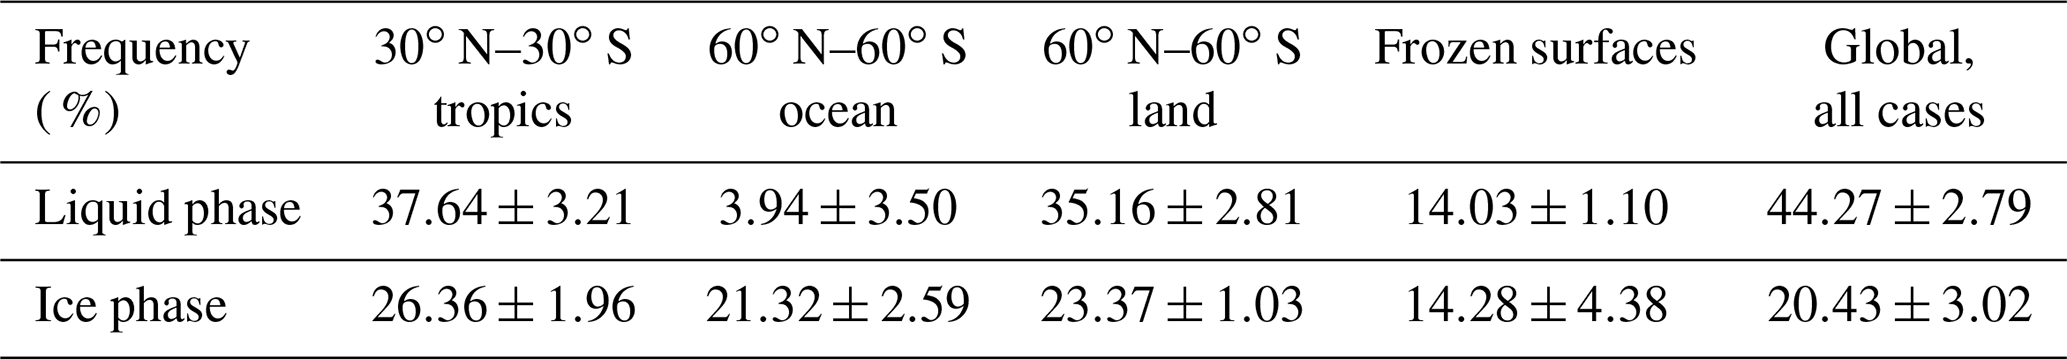
The frequencies of liquid- or ice-phase clouds are highly consistent between two cloud-phase variables in various imager cloud products, except for ice-phase determination over frozen surfaces. This is supported by the low uncertainty range of the ice and liquid phase for these four conditions as shown in Table 3. Here uncertainty is roughly characterized by the standard deviation of estimates from different products and variables. The Cloud_Phase_Cloud_Top_Properties variable reports a higher percentage of the liquid phase than Cloud_Phase_Optical_Properties. In particular, the VIIRS cloud top cloud-phase product always reports the highest frequency of liquid clouds. From both cloud-phase variables, MODIS reports more ice and fewer liquid clouds than VIIRS. When looking at Cloud_Phase_Optical_Properties for MODIS, ice (liquid) cloud frequency is higher (lower) in MYD06 than in the CLDPROP_MODIS products. The undetermined phase by the Cloud_Phase_Optical_Properties variable includes both mixed and uncertain phases (Baum et al., 2012). Except in the tropics, MYD06 has a higher frequency of undetermined cases than the continuity cloud products, and this is most prominent over the frozen surfaces with MYD06 reporting ∼2.8 %.
Table 3The mean value and uncertainty range of the occurrence frequencies of ice- and liquid-phase clouds based on the variables of the cloud thermodynamic phase from the three imager cloud retrievals: MYD06, CLDRPOP_MODIS, and CLDPROP_VIIRS. Results over the five types of surfaces and regions are shown, respectively, for tropics, ocean, land, frozen surfaces, and global. For each condition, five estimates of cloud-phase frequencies are available based on two types of imager-derived cloud thermodynamic phase: Cloud_Phase_Optical_Properties determined by the optical-property retrieval (provided in both MYD06 and the two continuity products) and Cloud_Phase_Cloud_Top_Properties obtained through the CLAVR-x processing system applied in the continuity cloud algorithm (provided in the CLDPROP_MODIS and CLDPROP_VIIRS cloud products). The uncertainty range is characterized by the standard deviation of the five estimates obtained in each region.
AIRS cloud-phase retrievals report a higher frequency of ice clouds than imagers under all conditions, especially in the tropics (Fig. 15) and over land (Fig. 17). However, a much lower frequency of liquid clouds is retrieved by AIRS, which is consistent with a more conservative liquid-phase determination approach applied by AIRS cloud-phase algorithm (Kahn et al., 2014). The unknown phase of AIRS ranges from ∼15 % over frozen surfaces to ∼45 % over ocean and in the tropics, which corresponds with broken and thin low clouds and scenes with both ice and liquid cloud particles (Jin and Nasiri, 2014).
In this study, the pixel-scale collocation between the hyperspectral infrared (IR) sounders (AIRS and CrIS) and high-spatial-resolution imagers (MODIS and VIIRS) is performed on the pairs of simultaneous nadir observations (SNOs) between Aqua AIRS and SNPP CrIS. Using this approach, the cloud parameters retrieved by various algorithms for IR sounders and imagers from different platforms are evaluated at the pixel level. Quantifying uncertainty in the cloud observational data records is important for constraining the high uncertainty of clouds in weather and climate research. This is also crucial in improving the retrieval of atmospheric, surface, and radiation properties, since satellite observations are highly subject to uncertainties and limitations associated with cloud conditions in the instrument field of view (FOV) (e.g., Yue et al., 2013; Wong et al., 2015; Tian and Hearty, 2020). Moreover, narrowband imagers and hyperspectral sounders provide important components of the long-term sustained observations of cloud properties in the Program of Record (POR), as noted by the 2017 US National Academy Decadal Survey (National Academies of Sciences, Engineering, and Medicine, 2018). The analyses presented here will help to assess the capability of the POR to identify potential gaps in the POR for cloud properties.
Both the NASA standard and continuity retrieval algorithms for sounders and imagers are investigated here in order to quantify the differences among the retrieval products and to examine the consistency and continuity of the data products from multiple sensors across different satellites. This is essential to the goal of building a continuous record of satellite data using the Terra, Aqua, SNPP, and JPSS series satellites, with sufficient quality to detect and quantify global environmental change.
Multiple cloud parameters are analyzed (Table 1). Comparisons are made by investigating the mean cloud parameters and higher statistical moments of cloud property distributions measured by MODIS and VIIRS over the corresponding AIRS and CrIS FOV. Cloud types indicated by the joint histograms of cloud properties and cloud thermodynamic phases are included. Through these comparisons, good agreement is found between the sounder- and imager-retrieved cloud products, yet with distinct differences likely arising from algorithm and sensor differences. For IR sounders, cloud top pressure (CTP) retrieved by AIRS version 7 (V7) and CLIMCAPS (CLIMCAPS-Aqua and CLIMCAPS-SNPP) version 2 (V2) agree, as shown by correlation coefficients of 0.69 for all cases and 0.92 for cases with an effective cloud fraction (ECF) greater than 0.1, respectively. Compared to AIRS V7, CLIMCAPS tends to produce a lower cloud top (CTP 12 hPa larger) for low clouds but higher cloud top (CTP 13 hPa smaller) for high clouds. However, CLIMCAPS V2 significantly overestimates the frequency of clear and optically thin cloud (ECF <0.1), relative to AIRS V7 and imager products from both MODIS and VIIRS. This is due to the algorithmic differences between CLIMCAPS V2 and AIRS V7 cloud retrieval algorithms. These differences include whether an iteration of cloud clearing is performed, the surface/atmospheric states used in the cloud retrieval, the quality control procedures used, and different a priori states used by AIRS V7 and CLIMCAPS. How these differences affect the downstream atmospheric and surface retrievals in the two algorithms, as well as the attribution of impacts from each factor, is beyond the scope of this study and warrants further investigation.
High consistency is seen among different imager cloud products, especially in the mean and standard deviation of cloud properties from the MODIS atmosphere cloud property retrieval (MYD06) and the MODIS–VIIRS continuity cloud products (CLDPROP). The magnitude of the correlation coefficients closely reflects the impact of algorithm differences and instrument spectral and resolution differences, with the highest correlations being obtained between two MODIS products (same sensor but different algorithms) and lowest between MYD06 and CLDPROP_VIIRS (different sensors and different algorithms). The correlation coefficients are always higher for cloud optical depth (COD) and particle effective radius (Re) than for CTP. For mean cloud properties, they are as large as 0.97 between MYD06 and CLDPROP_MODIS and 0.89 for CTP. For standard deviations within the sounder FOV, the correlations are smaller than those for mean cloud properties, ranging from 0.77 to 0.96 for COD and 0.66 to 0.97 for Re but only 0.60 to 0.63 for CTP.
This is likely due to the fact that completely different CTP retrieval methods are used in the MODIS operational and continuity cloud algorithms to accommodate the lack of near-IR and IR water vapor and CO2 absorption channels in VIIRS. Such algorithm and instrument impacts are more apparent in the higher moment statistics of cloud properties such as skewness. The correlations of COD and Re skewness between MYD06 and CLDPROP_MODIS drop to 0.78 and 0.70, respectively. They are further reduced to below 0.4 when comparing MODIS and VIIRS cloud products. For CTP skewness, the correlation coefficients are less than 0.3.
Two different retrievals of the cloud thermodynamic phase are available from imager observations, which are obtained by the optical-property retrieval (Cloud_Phase_Optical_Properties in both the MYD06 and MODIS–VIIRS continuity products) and the CLAVR-x processing system (Cloud_Phase_Cloud_Top_Properties in the continuity products only). The frequencies of liquid- or ice-phase clouds are very consistent between two cloud-phase variables in different imager cloud products, with uncertainty usually generally less than 4 %. The largest uncertainty is reported for ice-phase determination over snow- and ice-covered surfaces. MODIS retrievals report more ice and fewer liquid clouds than VIIRS, consistent with findings by Platnick et al. (2020). Comparing the two different cloud-phase retrievals, the Cloud_Phase_Cloud_Top_Properties variable reports higher percentages of the liquid phase than Cloud_Phase_Optical_Properties, and the Cloud_Phase_Optical_Properties variable in MYD06 detects higher (lower) frequencies of ice (liquid) clouds than that in the CLDPROP_MODIS products.
The general consistency of cloud observations among different sensors aboard Aqua and SNPP from various algorithms is encouraging, especially for achieving a continuous multi-decadal climate data record of clouds that can extend beyond the A-Train era and well into the 2030s with the JPSS series. The quantification of algorithm differences has important implications for future retrieval algorithm developments and will further improve the capability and accuracy of such climate data records.
MODIS data are available as follows: MYD06 at https://doi.org/10.5067/MODIS/MYD06_L2.061 (Platnick et al., 2017a), MYD35 at https://doi.org/10.5067/MODIS/MYD35_L2.061 (Ackerman et al., 2017), CLDPROP_MODIS at https://doi.org/10.5067/VIIRS/CLDPROP_L2_VIIRS_SNPP.001 (Platnick et al., 2017c), and CLDMSK_MODIS at https://doi.org/10.5067/MODIS/CLDMSK_L2_MODIS_Aqua.001 (Ackerman et al., 2019a).
VIIRS data are available as follows: CLDPROP_VIIRS at https://doi.org/10.5067/VIIRS/CLDPROP_L2_VIIRS_SNPP.001 (Platnick et al., 2017c) and CLDMSK_VIIRS at https://doi.org/10.5067/VIIRS/CLDMSK_L2_VIIRS_SNPP.001 (Ackerman et al., 2019b).
AIRS data are available as follows: AIRS V7 level 2 support product at https://doi.org/10.5067/APJ6EEN0PD0Z (AIRS project, 2019) and CLIMCAPS-Aqua version 2 level 2 at https://doi.org/10.5067/JZMYK5SMYM86 (Barnet, 2020).
CrIS data are available as follows: CLIMCAPS-SNPP version 2 FSR at https://doi.org/10.5067/62SPJFQW5Q9B (Barnet, 2019a) and CLIMCAPS-SNPP version 2 NSR at https://doi.org/10.5067/9HR0XHCH3IGS (Barnet, 2019b).
The AIRS and CrIS datasets were obtained from the NASA Goddard Earth Sciences Data Information and Services Center (GESDISC) and can be accessed at https://earthdata.nasa.gov/ (last access: 1 November 2021, NASA GESDISC, 2022). The collocation code is publicly available at https://doi.org/10.5281/zenodo.6369192 (Wang, 2022).
The multi-sensor cloud datasets used to generate the figures and tables in this study are available as https://doi.org/10.5281/zenodo.6368564 (Yue, 2022).
The supplement related to this article is available online at: https://doi.org/10.5194/amt-15-2099-2022-supplement.
QY conceptualized the study, developed the methodology and datasets, carried out the formal analyses, and contributed to the writing of the manuscript. EJF, BHK, NS, JB, and BL contributed to the data curation, validation, investigation, and the writing of the manuscript. LW, IT, MM, and KGM contributed to the data curation and software.
The contact author has declared that neither they nor their co-authors have any competing interests.
Publisher’s note: Copernicus Publications remains neutral with regard to jurisdictional claims in published maps and institutional affiliations.
The research was carried out at the Jet Propulsion Laboratory, California Institute of Technology, under a contract with the National Aeronautics and Space Administration (no. 80NM0018D0004). Qing Yue, Eric J. Fetzer, Brian H. Kahn, and Bjorn Lambrigtsen were supported by NASA's Making Earth System Data Records for Use in Research Environments (MEaSUREs) program. Qing Yue was supported by the NASA CloudSat and CALIPSO Science Team Recompete grant (no. NNH15ZDA001N-CCST). Qing Yue, Eric J. Fetzer, Mathias Schreier, and Brian H. Kahn acknowledge the support of the AIRS project at JPL and the sounder SIPS at JPL.
This research has been supported by the National Aeronautics and Space Administration (grant nos. MEaSUREs and NNH15ZDA001N-CCST) and the National Aeronautics and Space Administration (AIRS Project and Sounder SIPS).
This paper was edited by Alexander Kokhanovsky and reviewed by two anonymous referees.
Ackerman, S., Menzel, P., Frey, R., and Baum, B.: MODIS Atmosphere L2 Cloud Mask Product, NASA MODIS Adaptive Processing System, Goddard Space Flight Center [data set], https://doi.org/10.5067/MODIS/MOD35_L2.061, 2017.
Ackerman, S., et al.: MODIS/Aqua Cloud Mask and Spectral Test Results 5-Min L2 Swath 1km, Version-1, NASA Level-1 and Atmosphere Archive & Distribution System (LAADS) Distributed Active Archive Center (DAAC) [data set], Goddard Space Flight Center, USA, https://doi.org/10.5067/MODIS/CLDMSK_L2_MODIS_Aqua.001, 2019a.
Ackerman, S., et al.: VIIRS/SNPP Cloud Mask and Spectral Test Results 6-Min L2 Swath 750m, Version-1. NASA Level-1 and Atmosphere Archive & Distribution System (LAADS) Distributed Active Archive Center (DAAC) [data set], Goddard Space Flight Center, USA, https://doi.org/10.5067/VIIRS/CLDMSK_L2_VIIRS_SNPP.001, 2019b.
AIRS project: Aqua/AIRS L2 Support Retrieval (AIRS-only) V7.0, Goddard Earth Sciences Data and Information Services Center (GES DISC) [data set], Greenbelt, MD, USA, https://doi.org/10.5067/APJ6EEN0PD0Z, 2019.
Barnet, C.: Sounder SIPS: Suomi NPP CrIMSS Level 2 CLIMCAPS Full Spectral Resolution: Atmosphere cloud and surface geophysical state V2, Goddard Earth Sciences Data and Information Services Center [data set] (GES DISC), Greenbelt, MD, USA, https://doi.org/10.5067/62SPJFQW5Q9B, 2019a.
Barnet, C.: Sounder SIPS: Suomi NPP CrIMSS Level 2 CLIMCAPS Normal Spectral Resolution: Atmosphere, cloud and surface geophysical state V1, Goddard Earth Sciences Data and Information Services Center (GES DISC) [data set], Greenbelt, MD, USA, https://doi.org/10.5067/8RUZI1F8U1UX, 2019b.
Barnet, C: Sounder SIPS: AQUA AIRS IR + MW Level 2 CLIMCAPS: Atmosphere, cloud and surface geophysical state V2, Goddard Earth Sciences Data and Information Services Center (GES DISC) [data set], Greenbelt, MD, USA, https://doi.org/10.5067/JZMYK5SMYM86, 2020.
Baum, B. A., Menzel, W. P., Frey, R. A., Tobin, D. C., Holz, R. E., Ackerman, S. A., Heidinger, A. K., and Yang, P.: MODIS Cloud-Top Property Refinements for Collection 6, J. Appl. Meteorol. Clim., 51, 1145–1163, 2012.
Bony, S, Stevens, B., Frierson, D. M. W., Jakob, C., Kageyama, M., Pincus, R., Shepherd, T. G., Sherwood, S. C., Siebesma, A. P., Sobel, A. H., Watanabe, M., and Webb, M. J.: Clouds, circulation and climate sensitivity, Nat. Geosci., 261–268, https://doi.org/10.1038/ngeo2398, 2015.
Borbas, E. E., Hulley, G., Feltz, M., Knuteson, R., and Hook, S.: The Combined ASTER MODIS Emissivity over Land (CAMEL) Part 1: Methodology and High Spectral Resolution Application, Remote Sensing, 10, 643, https://doi.org/10.3390/rs10040643, 2018.
Chahine, M. T.: Remote sounding of cloudy atmospheres. I. The single cloud layer, J. Atmos. Sci., 31, 233–243, 1974.
Chan, M. A. and Comiso, J. C.: Arctic Cloud Characteristics as Derived from MODIS, CALIPSO, and CloudSat, J. Climate, 26, 3285–3306, 2013.
Eresmaa, R.: Imager-assisted cloud detection for assimilation of infrared atmospheric sounding interferometer radiances, Q. J. Roy. Meteor. Soc., 140, 2342–2352, 2014.
Feltz, M., Borbas, E., Knuteson, R., Hulley, G., and Hook, S.: The Combined ASTER MODIS Emissivity over Land (CAMEL) Part 2: Uncertainty and Validation, Remote Sensing, 10, 664, https://doi.org/10.3390/rs10050664, 2018.
Fetzer, E. J., Lambrigtsen, B. H., Eldering, A., Aumann, H. H., and Chahine, M. T.: Biases in total precipitable water vapor climatologies from Atmospheric Infrared Sounder and Advanced Microwave Scanning Radiometer, J. Geophys. Res., 111, D09S16, https://doi.org/10.1029/2005JD006598, 2006.
Fetzer, E. J., Yue, Q., Thrastarson, H. Th., and Ruzmaikin, A. (Eds.): ALGORITHM THEORETICAL BASIS DOCUMENT, AIRS-Team Retrieval For Core Products and Geophysical Parameters: Versions 6 and 7 Level2, Jet Propulsion Laboratory, California Institute of Technology, Pasadena, CA, https://docserver.gesdisc.eosdis.nasa.gov/public/project/AIRS/L2_ATBD.pdf (last access: 11 January 2021), 2020.
Fishbein, E., Lee, S.-Y., and Fetzer, E. J.: Atmospheric Infrared Sounder (AIRS) Level 2 Simulation System Description Document, Jet Propulsion Laboratory, California Institute of Technology, Pasadena, CA, http://asl.umbc.edu/pub/airs/jpldocs/sim/AIRS_L2_Simulation_Desc.pdf (last access: 10 January 2021), 2001.
Frey, R. A., Ackerman, S. A., Holz, R. E., Steven, D., and Griffith, Z.: The Continuity MODISVIIRS Cloud Mask, Remote Sensing, 12, 3334, https://doi.org/10.3390/rs12203334, 2020.
Gelaro, R., McCarty, W., Suárez, M. J., Todling, R., Molod, A., Takacs, L., Randles, C. A., Darmenov, A., Bosilovich, M. G., Reichle, R., Wargan, K., Coy, L., Cullather, R., Draper, C., Akella, S., Buchard, V., Conaty, A., da Silva, A. M., Gu, W., Kim, G.-K., Koster, R., Lucchesi, R., Merkova, D., Nielsen, J. E., Partyka, G., Pawson, S., Putman, W., Rienecker, M., Schubert, S. D., Sienkiewicz, M., and Zhao, B.: The modern-era retrospective analysis for research and applications, Version 2 (MERRA-2), 30, 5419–5454, https://doi.org/10.1175/JCLI-D-16-0758.1, 2017.
Gong, X., Li, Z., Li, J., Moeller, C. C., Cao, C., Wang, W., and Menzel, W. P.: Intercomparison between VIIRS and CrIS by taking into account the CrIS subpixel cloudiness and viewing geometry, J. Geophys. Res.-Atmos., 123, 5335–5345, https://doi.org/10.1029/2017JD027849, 2018.
Heidinger, A. K., Evan, A. T., Foster, M. J., and Walther, A.: A naive Bayesian cloud detection scheme derived from CALIPSO and applied with PATMOS-x, J. Appl. Meteorol. Clim., 51, 1129–1144, 2012.
Heidinger, A. K., Foster, M. J., Walther, A., and Zhao, X.: The Pathfinder AtmospheresExtended AVHRR climate dataset, B. Am. Meteorol. Soc., 95, 909–922, https://doi.org/10.1175/BAMS-D-12-00246.1, 2014.
Heidinger, A. K., Bearson, N., Foster, M. J., Li, Y., Wanzong, S., Ackerman, S., Holz, R. E., Platnick, S., and Meyer, K.: Using Sounder Data to Improve Cirrus Cloud Height Estimation from Satellite Imagers, J. Atmos. Ocean. Tech., 36, 1331–1342, https://doi.org/10.1175/JTECH-D-18-0079.1, 2019.
Holz, R. E., Ackerman, S. A., Nagle, F. W., Frey, R., Dutcher, S., Kuehn, R. E., Vaughan, M. A., and Baum, B.: Global Moderate Resolution Imaging Spectroradiometer (MODIS) cloud detection and height evaluation using CALIOP, J. Geophys. Res., 113, D00A19, https://doi.org/10.1029/2008JD009837, 2008.
Hook, S.: Combined ASTER and MODIS Emissivity database over Land (CAMEL) Emissivity Monthly Global 0.05Deg V002, NASA EOSDIS Land Processes DAAC [data set], https://doi.org/10.5067/MEASURES/LSTE/CAM5K30EM.002, 2019.
IPCC: Climate Change 2013: The Physical Science Basis. Contribution of Working Group I to the Fifth Assessment Report of the Intergovernmental Panel on Climate Change, edited by: Stocker, T. F., Qin, D., Plattner, G.-K., Tignor, M., Allen, S. K., Boschung, J., Nauels, A., Xia, Y., Bex, V., and Midgley, P. M., Cambridge University Press, Cambridge, United Kingdom and New York, NY, USA, 1535 pp., https://doi.org/10.1017/CBO9781107415324, 2013.
Irion, F. W., Kahn, B. H., Schreier, M. M., Fetzer, E. J., Fishbein, E., Fu, D., Kalmus, P., Wilson, R. C., Wong, S., and Yue, Q.: Single-footprint retrievals of temperature, water vapor and cloud properties from AIRS, Atmos. Meas. Tech., 11, 971–995, https://doi.org/10.5194/amt-11-971-2018, 2018.
Jin, H. C. and Nasiri, S. L.: Evaluation of AIRS cloud-thermodynamic-phase determination with CALIPSO, J. Appl. Meteorol. Clim., 53, 1012–1027, https://doi.org/10.1175/JAMC-D-13-0137.1, 2014.
Kahn, B. H., Irion, F. W., Dang, V. T., Manning, E. M., Nasiri, S. L., Naud, C. M., Blaisdell, J. M., Schreier, M. M., Yue, Q., Bowman, K. W., Fetzer, E. J., Hulley, G. C., Liou, K. N., Lubin, D., Ou, S. C., Susskind, J., Takano, Y., Tian, B., and Worden, J. R.: The Atmospheric Infrared Sounder version 6 cloud products, Atmos. Chem. Phys., 14, 399–426, https://doi.org/10.5194/acp-14-399-2014, 2014.
Kahn, B. H., Schreier, M. M., Yue, Q., Fetzer, E. J., Irion, F. W., Platnick, S., Wang, C., Nasiri, S. L., and L'Ecuyer, T. S.: Pixel-scale assessment and uncertainty analysis of AIRS and MODIS ice cloud optical thickness and effective radius, J. Geophys. Res.-Atmos., 120, 11669–11689, https://doi.org/10.1002/2015JD023950, 2015.
Kahn, B. H., Matheou, G., Yue, Q., Fauchez, T., Fetzer, E. J., Lebsock, M., Martins, J., Schreier, M. M., Suzuki, K., and Teixeira, J.: An A-train and MERRA view of cloud, thermodynamic, and dynamic variability within the subtropical marine boundary layer, Atmos. Chem. Phys., 17, 9451–9468, https://doi.org/10.5194/acp-17-9451-2017, 2017.
Kawai, H. and Teixeira, J.: Probability density functions of liquid water path and cloud amount of marine boundary layer clouds: Geographical and seasonal variations and controlling meteorological factors, J. Climate, 23, 2079–2092, 2010.
Kawai, H. and Teixeira, J.: Probability Density Functions of Liquid Water Path and Total Water Content of Marine Boundary Layer Clouds: Implications for Cloud Parameterization, J. Climate, 25, 2162–2177, 2012.
Kou, L., Labrie, D., and Chylek, P.: Refractive-indexes of water and ice in the 0.65- to 2.5-µm spectral range, Appl. Optics, 32, 3531–3540, 1993.
Li, J., Menzel, W. P., Sun, F., Schmit, T. J., and Gurka, J.: AIRS Subpixel Cloud Characterization Using MODIS Cloud Products, J. Appl. Meteorol., 43, 1083–1094, 2004.
Manning, E. M. and Aumann H. H: Tropical simultaneous nadir observations for IR sounder evaluation and comparison, Proc. SPIE, Earth Observing Systems XX, 96070L, https://doi.org/10.1117/12.2187151, 2015.
Marchant, B., Platnick, S., Meyer, K., Arnold, G. T., and Riedi, J.: MODIS Collection 6 shortwave-derived cloud phase classification algorithm and comparisons with CALIOP, Atmos. Meas. Tech., 9, 1587–1599, https://doi.org/10.5194/amt-9-1587-2016, 2016.
Masuda, K., Takashima, T., and Takayama, Y.: Emissivity of pure and sea waters for the model sea surface in the infrared window regions, Remote Sens. Environ., 24, 313–329, https://doi.org/10.1016/0034-4257(88)90032-6, 1988.
McCoy, D. T., Eastman, R., Hartmann, D. L., and Wood, R.: The change in low cloud cover in a warmed climate inferred from AIRS, MODIS, and ERA-interim, J. Climate, 30, 3609–3620, https://doi.org/10.1175/JCLI-D-15-0734.1, 2017.
Milstein, A. B. and Blackwell, W. J.: Neural network temperature and moisture retrieval algorithm validation for AIRS/AMSU and CrIS/ATMS, J. Geophys. Res.-Atmos., 121, 1414–1430, https://doi.org/10.1002/2015JD024008, 2016.
Monarrez, R. (Ed.): NASA-SNPP and NOAA-20 (JPSS-1) CLIMCAPS CrIS and ATMS Level-2 Products User Guide: File Format and Definition, GES DISC, https://docserver.gesdisc.eosdis.nasa.gov/public/project/Sounder/CLIMCAPS.V2.README.pdf (last access: 10 January 2021), 2020.
Nagle, F. W. and Holz, R. E.: Computationally Efficient Methods of Collocating Satellite, Aircraft, and Ground Observations, J. Atmos. Ocean. Tech., 26, 1585–1595, 2009.
NASA Goddard Earth Sciences Data Information and Services Center (GESDISC): https://earthdata.nasa.gov/, last access: 1 November 2021.
Nasiri, S. L. and Kahn, B. H.: Limitations of bispectral infrared cloud phase determination and potential for improvement, J. Appl. Meteorol. Clim., 47, 2895–2910, https://doi.org/10.1175/2008JAMC1879.1, 2008.
Nasiri, S. L., Dang, V. T., Kahn, B. H., Fetzer, E. J., Manning, E. M., Schreier, M. M., and Frey, R. A.: Comparing MODIS and AIRS Infrared-Based Cloud Retrievals, J. Appl. Meteorol. Clim., 50, 1057–1072, 2011.
National Academies of Sciences, Engineering, and Medicine: Thriving on Our Changing Planet: A Decadal Strategy for Earth Observation from Space, The National Academies Press, Washington, DC, https://doi.org/10.17226/24938, 2018.
Oreopoulos, L., Cho, N., Lee, D., and Kato, S.: Radiative effects of global MODIS cloud regimes, J. Geophys. Res.-Atmos., 121, 2299–2317, https://doi.org/10.1002/2015JD024502, 2016.
Oudrari, H., McIntire, J., Xiong, X., Butler, J., Lee, S., Lei, N., Schwarting, T., and Sun, J.: Prelaunch radiometric characterization and calibration of the SNPP VIIRS sensor, IEEE T. Geosci. Remote, 53, 2195–2210, 2015.
Peterson, C. A., Yue, Q., Kahn, B. H., Fetzer, E., and Huang, X.: Evaluation of AIRS Cloud Phase Classification over the Arctic Ocean against Combined CloudSat–CALIPSO Observations, J. Appl. Meteorol. Clim., 59, 1277–1294, 2020.
Pincus, R., Platnick, S., Ackerman, S. A., Hemler, R. S., and Patrick Hofmann, R. J.: Reconciling Simulated and Observed Views of Clouds: MODIS, ISCCP, and the Limits of Instrument Simulators, J. Climate, 25, 4699–4720, 2012.
Platnick, S., Ackerman, S., King, M., Wind, G., Meyer, K., Menzel, P., Frey, R., Holz, R., Baum, B., and Yang, P.: MODIS atmosphere L2 cloud product (06_L2), NASA MODIS Adaptive Processing System, Goddard Space Flight Center [data set], https://doi.org/10.5067/MODIS/MOD06_L2.061, 2017a.
Platnick, S., Meyer, K. G., Yang, P., Ridgway, W. L., Riedi, J. C., King, M. D., Wind, G., Amarasinghe, N., Marchant, B., Arnold, G. T., Zhang, Z., Hubanks, P. A., Holz, R. E., Yang, P., Ridgway, W. L., and Riedi, J.: The MODIS Cloud Optical and Microphysical Products: Collection 6 Updates and Examples from Terra and Aqua, IEEE T. Geosci. Remote, 55, 502–525, 2017b.
Platnick, S., Meyer, K. G., Heidinger, A. K., and Holz, R.: VIIRS Atmosphere L2 Cloud Properties Product, Version-1, NASA Level-1 and Atmosphere Archive & Distribution System (LAADS) Distributed Active Archive Center (DAAC) [data set], Goddard Space Flight Center, USA, https://doi.org/10.5067/VIIRS/CLDPROP_L2_VIIRS_SNPP.001, 2017c (data available at: https://ladsweb.modaps.eosdis.nasa.gov/missions-and-measurements/products/CLDPROP_L2_MODIS_Aqua/#product-information, last access: 1 November 2021).
Platnick, S., Meyer, K., Amarasinghe, N., Wind, G., Hubanks, P. A., and Holz, R. E.: Sensitivity of Multispectral Imager Liquid Water Cloud Microphysical Retrievals to the Index of Refraction, Remote Sensing, 12, 4165, https://doi.org/10.3390/rs12244165, 2020.
Platnick, S., Meyer, K., Wind, G., Holz, R. E., Amarasinghe, N., Hubanks, P. A., Marchant, B., Dutcher, S., and Veglio, P.: The NASA MODIS-VIIRS Continuity Cloud Optical Properties Products, Remote Sensing, 13, 2, https://doi.org/10.3390/rs13010002, 2021.
Rossow, W. B. and Schiffer, R. A.: Advances in understanding clouds from ISCCP, B. Am. Meteorol. Soc., 80, 2261–2287, https://doi.org/10.1175/1520-0477(1999)080<2261:AIUCFI>2.0.CO;2, 1999.
Schreier, M. M., Kahn, B. H., Eldering, A., Elliott, D. A., Fishbein, E., Irion, F. W., and Pagano, T. S.: Radiance comparisons of MODIS and AIRS using spatial response information, J. Atmos. Ocean. Tech., 27, 1331–1342, 2010.
Seemann, S. W., Borbas, E. E., Knuteson, R. O., Stephenson, G. R., and Huang, H.-L.: Development of a Global Infrared Land Surface Emissivity Database for Application to Clear Sky Sounding Retrievals from Multi-spectral Satellite Radiance Measurements, J. Appl. Meteorol. Clim., 47, 108–123, 2008.
Smith, N. and Barnet, C. D.: Uncertainty Characterization and Propagation in the Community Long-Term Infrared Microwave Combined Atmospheric Product System (CLIMCAPS), Remote Sensing, 11, 1227, https://doi.org/10.3390/rs11101227, 2019.
Smith, N. and Barnet, C. D.: CLIMCAPS observing capability for temperature, moisture, and trace gases from AIRS/AMSU and CrIS/ATMS, Atmos. Meas. Tech., 13, 4437–4459, https://doi.org/10.5194/amt-13-4437-2020, 2020.
Smith, N., Esmaili, R., and Barnet, C. D.: Community Long-Term Infrared Microwave Combined Atmospheric Product System (CLIMCAPS) Science Application Guides, Science and Technology Corpoeration, Hampton, VA, https://docserver.gesdisc.eosdis.nasa.gov/public/project/Sounder/CLIMCAPS_V2_L2_science_guides.pdf, last access: 1 October 2021.
Su, H., Jiang, J. H., Neelin, J. D., Shen, T. J., Zhai, C., Yue, Q., Wang, Z., Huang, L., Choi, Y.-S., Stephens, G. L., and Yung, Y. L.: Tightening of Hadley ascent and tropical high cloud region key to precipitation change in a warmer climate, Nat. Commun., 8, 15771, https://doi.org/10.1038/ncomms15771, 2017.
Susskind, J., Barnet, C. D., and Blaisdell, J. M.: Retrieval of atmospheric and surface parameters from AIRS/AMSU/HSB data in the presence of clouds, IEEE T. Geosci. Remote, 41, 390–409, 2003.
Susskind, J., Barnet, C., Blaisdell, J., Iredell, L., Keita, F., Kouvaris, L., Molnar, G., and Chahine, M.: Accuracy of geophysical parameters derived from Atmospheric Infrared Sounder/Advanced Microwave Sounding Unit as a function of fractional cloud cover, J. Geophys. Res., 111, D09S17, https://doi.org/10.1029/2005JD006272, 2006.
Susskind, J., Blaisdell, J. M., and Iredell, L.: Improved methodology for surface and atmospheric soundings, error estimates, and quality control procedures: the atmospheric infrared sounder science team version-6 retrieval algorithm, Journal of Applied Remote Sensing, 8, 084994, https://doi.org/10.1117/1.JRS.8.084994, 2014.
Tian, B. and Hearty, T.: Estimating and removing the sampling biases of the AIRS Obs4MIPs V2 data, Earth and Space Science, 7, e2020EA001438, https://doi.org/10.1029/2020EA001438, 2020.
Thrastarson, H. Th. (Ed.): AIRS/AMSU/HSB Version 7 Level 2 Product User Guide, Jet Propulsion Laboratory California Institute of Technology, Pasadena, CA, https://docserver.gesdisc.eosdis.nasa.gov/public/project/AIRS/V7_L2_Product_User_Guide.pdf, last access: 1 October 2021a.
Thrastarson, H. Th., Fetzer, E. F., Ray, S., Hearty, T., and Smith, N.: Overview of the AIRS Mission: Instruments, Processing Algorithms, Products, and Documentation, 2nd edn., Jet Propulsion Laboratory California Institute of Technology, Pasadena, CA, https://docserver.gesdisc.eosdis.nasa.gov/public/project/AIRS/Overview_of_the_AIRS_Mission.pdf, last access: 1 October 2021b.
Tobin, D. C., Revercomb, H. E., Moeller, C. C., and Pagano, T. S.: Use of atmospheric infrared sounder high–spectral resolution spectra to assess the calibration of moderate resolution imaging spectroradiometer on EOS Aqua, J. Geophys. Res., 111, D09S05, https://doi.org/10.1029/2005JD006095, 2006.
Wagner, R., Benz, S., Möhler, O., Saathoff, H., Schnaiter, M., and Schurath, U.: Mid-infrared Extinction Spectra and Optical Constants of Supercooled Water Droplets, J. Phys. Chem. A, 109, 7099–7112, 2005.
Wang, L.: wanglikun1973/CrIS_VIIRS_collocation: VIIRS and CrIS collocation code, Version v0.1, Zenodo [code], https://doi.org/10.5281/zenodo.6369192, 2022.
Wang, L., Tremblay, D. A., Han, Y., Esplin, M., Hagan, D. E., Predina, J., Suwinski, L., Jin, X., and Chen, Y.: Geolocation assessment for CrIS sensor data records, J. Geophys. Res.-Atmos., 118, 12690–12704, 2013.
Wang, L., Tremblay, D., Zhang, B., and Han, Y.: Fast and Accurate Collocation of the Visible Infrared Imaging Radiometer Suite Measurements with Cross-Track Infrared Sounder, Remote Sens., 8, 76, https://doi.org/10.3390/rs8010076, 2016.
Wang, T., Roman, J., Yue, Q., and Wong, S. (Eds.): Test Report of Performance of CLIMCAPS-SNPP and CLIMCAPS-JPSS1 Retrievals, Jet Propulsion Laboratory, California Institute of Technology, CA, https://docserver.gesdisc.eosdis.nasa.gov/public/project/Sounder/CLIMCAPS.V2.Test.Report.pdf, last access: 1 October 2021.
Wong, S., Fetzer, E. J., Schreier, M., Manipon, G., Fishbein, E. F., Kahn, B. H., Yue, Q., and Irion, F. W.: Cloud-induced uncertainties in AIRS and ECMWF temperature and specific humidity, J. Geophys. Res.-Atmos., 120, 1880–1901, https://doi.org/10.1002/2014JD022440, 2015.
Wu, X. and Smith, W. L.: Emissivity of rough sea surface for 8–13 µm: modeling and verification, Appl. Optics, 36, 2609–2619, https://doi.org/10.1364/AO.36.002609, 1997.
Yao, Z., Li, J., and Zhao, Z.: Synergistic use of AIRS and MODIS for dust top height retrieval over land, Adv. Atmos. Sci., 32, 470–476, https://doi.org/10.1007/s00376-014-4046-y, 2015.
Yue, Q.: Datasets for Yue et al. (2022), Atmospheric Measurement Techniques: “Evaluating the Consistency and Continuity of Pixel-Scale Cloud Property Data Records From Aqua and SNPP”, Version V1, Zenodo [data set], https://doi.org/10.5281/zenodo.6368564, 2022.
Yue, Q. and Lambrigtsen, B. (Eds.): AIRS V6 Test Report Supplement: Performance of AIRS+AMSU vs. AIRS-only Retrievals, Jet Propulsion Laboratory, California Institute of Technology, CA, https://docserver.gesdisc.eosdis.nasa.gov/repository/Mission/AIRS/3.3_ScienceDataProduct_Documentation/3.3.5_ProductQuality/V6_Test_Report_Supplement_Performance_of_AIRS+AMSU_vs_AIRS-Only_Retrievals.pdf (last access: 1 October 2021), 2017.
Yue, Q. and Lambrigtsen, B. (Eds.): AIRS V7 L2 Performance Test and Validation Report, Jet Propulsion Laboratory, California Institute of Technology, CA, https://docserver.gesdisc.eosdis.nasa.gov/public/project/AIRS/V7_L2_Performance_Test_and_Validation_report.pdf (last access: 1 October 2021), 2020.
Yue, Q., Kahn, B. H., Fetzer, E. J., and Teixeira, J.: Relationship between marine boundary layer clouds and lower tropospheric stability observed by AIRS, CloudSat, and CALIOP, J. Geophys. Res., 116, D18212, https://doi.org/10.1029/2011JD016136, 2011.
Yue, Q., Kahn, B. H., Xiao, H., Schreier, M. M., Fetzer, E. J., Teixeira, J., and Suselj, K.: Transitions of cloud-topped marine boundary layers characterized by AIRS, MODIS, and a large eddy simulation model, J. Geophys. Res.-Atmos., 118, 8598–8611, 2013.
Yue, Q., Kahn, B. H., Fetzer, E. J., Schreier, M., Wong, S., Chen, X., and Huang, X.: Observation-based Longwave Cloud Radiative Kernels Derived from the A-Train, J. Climate, 29, 2023–2040, https://doi.org/10.1175/JCLI-D-15-0257.1, 2016.
Yue, Q., Kahn, B. H., Fetzer, E. J., Wong, S., Frey, R., and Meyer, K. G.: On the response of MODIS cloud coverage to global mean surface air temperature, J. Geophys. Res.-Atmos., 122, 966–979, 2017.
Yue, Q., Fetzer, E. J., Kahn, B. H., Wong, S., Huang, X., and Schreier, M.: Temporal and Spatial Characteristics of Short-term Cloud Feedback on Global and Local Interannual Climate Fluctuations from A-Train Observations, J. Climate, 32, 1875–1893, https://doi.org/10.1175/JCLI-D-18-0335.1, 2019.
Yue, Q., Lambrigtsen, B., Wang, T., Roman, J. (Eds.): Version 2 CLIMCAPS-Aqua Retrieval Product Performance Test Report, Jet Propulsion Laboratory, California Institute of Technology, CA, https://docserver.gesdisc.eosdis.nasa.gov/public/project/Sounder/CLIMCAPS.V2.Test.Report.Aqua.pdf, last access: 1 October 2021.
Zelinka, M. D., Klein, S. A., and Hartmann D. L.: Computing and Partitioning Cloud Feedbacks Using Cloud Property Histograms. Part I: Cloud Radiative Kernels, J. Climate, 25, 3715–3735, 2012.
Zhou, C., Zelinka, M. D. , Dessler, A. E., and Yang, P.: An analysis of the short-term cloud feedback using MODIS data, J. Climate, 26, 4803–4815, https://doi.org/10.1175/JCLI-D-12-00547.1, 2013.
Zhu, P. and Zuidema, P.: On the use of PDF schemes to parameterize sub-grid clouds, Geophys. Res. Lett., 36, L05807, https://doi.org/10.1029/2008GL036817, 2009.