the Creative Commons Attribution 4.0 License.
the Creative Commons Attribution 4.0 License.
 | 08 Apr 2022
Characterization of soot produced by the mini inverted soot generator with an atmospheric simulation chamber
Virginia Vernocchi
Marco Brunoldi
Silvia G. Danelli
Franco Parodi
Paolo Prati
The performance of a mini inverted soot generator (MISG) has been investigated at ChAMBRe (Chamber for Aerosol Modelling and Bio-aerosol Research) by studying the properties of soot particles generated by ethylene and propane combustion. This work deepens and expands the existing characterization of the MISG, which also exploits an atmospheric simulation chamber (ASC). Different from previous works, MISG performance has been also tested at different fuel flows and higher global equivalence ratios. MISG exhausts were investigated after their injection inside the atmospheric simulation chamber, which is another novelty of this work. Starting from an extensive classification of combustion conditions and resulting flame shapes, the MISG exhaust was characterized in terms of concentration of emitted particles and gases, particle size distribution, and optical properties. Soot particles were also collected on quartz fibre filters and then analysed by optical and thermal–optical techniques to measure the spectral dependence of the absorption coefficient babs and their composition in terms of elemental carbon and organic carbon (EC and OC). Significant differences could be observed when the MISG was fuelled with ethylene and propane in terms of particle size. In particular, the production of super-micrometric aggregates was observed for ethylene combustion. With equal combustion conditions, ethylene produced a higher number concentration of particles and smaller mode diameters. Soot particles produced by propane combustion resulted in higher EC : TC (total carbon) ratios and they were more light absorbing than particles generated by ethylene combustion. Values of the mass absorption cross section (MAC) and of the Ångström absorption exponent (AAE) turned out to be compatible with the literature, even if there were some specific differences. The comprehensive characterization of the MISG soot particles is an important piece of information to design and perform experiments in atmospheric simulation chambers. Particles with well-known properties can be used, for example, to investigate the possible interactions between soot and other atmospheric pollutants, the effects of meteorological variables on soot properties, and the oxidative and toxicological potential of soot particles.
- Article
(1154 KB) - Full-text XML
-
Supplement
(792 KB) - BibTeX
- EndNote


The term “soot” refers to combustion-generated carbonaceous particles that are a by-product of the incomplete combustion of fossil fuels and/or biomass burning (Nordmann et al., 2013; Moore et al., 2014). When investigated by optical techniques, soot particles are generally referred to as black carbon (BC; Petzold et al., 2013), while the result of thermal–optical characterizations is referred as elemental carbon (EC; Bond and Bergstrom, 2006). However, both BC and EC are defined in operative terms that do not identify the same compounds (Massabò and Prati, 2021) and often produce non-negligible differences in concentration values.
Soot particles constitute an important fraction of anthropogenic particulate matter (PM), especially in urban environments (Weijers et al., 2011), and are emitted by traffic, domestic stoves, industrial chimneys, and by any incomplete combustion process. Several works state adverse effects of soot both on climate (Ackerman et al., 2000; Menon et al., 2002; Quinn et al., 2008; Ramanathan and Carmichael, 2008; Bond et al., 2013) and human health (Pope et al., 2002; Anenberg et al., 2010; Gan et al., 2011; Cassee et al., 2013; Lelieveld et al., 2015). From the climatic point of view, soot particles absorb the solar radiation, causing a positive radiative forcing. BC is considered to be one of the most significant radiative forcing agents, second only to CO2 (Ramanathan and Carmichael, 2008; Bond et al., 2013). Another positive effect on radiative forcing is related to the darkening of glacier surfaces due to the deposition of BC (Skiles et al., 2018). Soot also contributes to air pollution via reactions with several gas species, such as NO2, SO2, and O3 (Finlayson-Pitts and Pitts, 2000; Nienow and Roberts, 2006). Effects on health include cardiopulmonary morbidity and mortality (Janssen et al., 2012). Soot particles are suspected to be particularly hazardous to human health because they are sufficiently small to penetrate the membranes of the respiratory tract and enter the bloodstream or be transported along olfactory nerves into the brain (Nemmar et al., 2002; Oberdörster et al., 2005). The understanding of the properties and behaviour of soot particles when they are suspended in the atmosphere is thus necessary to fully assess their adverse effects, and the use of proxies with controlled and known properties can be useful. In this context, soot generators are employed as stable sources of soot particles. So far, soot generators have been employed for studies on optical properties (Zhang et al., 2008; Cross et al., 2010; Mamakos et al., 2013; Utry et al., 2014b; Bescond et al., 2016), instrument calibration (Onasch et al., 2012; Durdina et al., 2016), and several other purposes, such as studies on the atmospheric processing of soot particles and the characterization of uncoated/coated and fresh/denuded of soot particles (Pagels et al., 2009; Henning et al., 2012; Ghazi et al., 2013; Ghazi and Olfert 2013; Hu et al., 2021). The inverted-flame burner (Stipe et al., 2005) is often considered as an ideal soot source (Moallemi et al., 2019 and references therein), due to its capacity to generate almost pure EC particles and the stability of the flame and of its exhaust (Stipe et al., 2005). To such a category also belongs the mini inverted soot generator (MISG; Argonaut Scientific Corp., Edmonton, AB, Canada; model MISG-2), used in this work.
The MISG can be operated with different fuels, such as ethylene (Kazemimanesh et al., 2019) and propane (Moallemi et al., 2019; Bischof et al., 2019), and theoretically also with ethane or fuel blends with methane and nitrogen, even if, to our knowledge, no literature is available on such configurations. The air-to-fuel flow ratio can be adjusted to control the concentration and size of the generated particles. The maximum reachable concentration declared by the manufacturer is about 107 particles per cubic metre, while particle size ranges from few tens to few hundreds of nanometres.
The behaviour of soot particles can be efficiently studied in/by atmospheric simulation chambers (ASCs). These are exploratory platforms which allow the study of atmospheric processes under controlled conditions that can be maintained for periods long enough to reproduce realistic environments and to study interactions among their constituents (Finlayson-Pitts and Pitts, 2000; Becker, 2006). ASC experiments are the best compromise between laboratory and field experiments, since they simulate quasi-real situations but without the uncertainties and variability typical of field measurements. Recent examples of ASC applications concern the investigation of the optical properties of mineral dust (Caponi et al., 2017) and wood-burning exhausts (Kumar et al., 2018; Hu et al., 2021).
Coupling the MISG to an ASC allows systematic experiments on the properties of soot particles to be exposed and maintained in different conditions. In this work, we mainly investigated the differences between MISG exhausts produced by ethylene and propane burning. Differently from previous works (Bischof et al., 2019; Kazemimanesh et al., 2019; Moallemi et al., 2019), the MISG has been connected directly to an atmospheric simulation chamber; performance has also been tested at different fuel flows and higher global equivalence ratios. The present characterization deepens and expands the existing knowledge on particles and gases produced by this soot generator. The comprehensive characterization of the MISG soot particles is an important piece of information to design the subsequent experiments. Well-characterized soot particles could be used to investigate the effects that atmospheric parameters can have on soot particles and to study the interactions between soot particles and other pollutants.
2.1 Mini inverted soot generator
The MISG, introduced by Kazemimanesh et al. (2019), is a combustion-based soot generator working as an inverted-flame burner (Stipe et al., 2005), where air and fuel flow in an opposite direction to the buoyancy force of the hot exhaust gases. The resulting co-flow diffusion flame is more stable thanks to a reduced flickering of the flame tip (Kirchstetter and Novakov, 2007; Stipe et al., 2005), and consequently, the soot particle generation is more stable.
The MISG is fed with air and fuel supplied by specific cylinders. We used both ethylene and propane, two fuels with a well-known capability for producing soot (Kazemimanesh et al., 2019; Moallemi et al., 2019). The air and fuel flow rates are controlled by two mass flow controllers (MFCs; Bronkhorst High-Tech BV, Ruurlo, the Netherlands; models F-201CV-10K-MGD-22-V and FG-201CV-MGD-22-V-AA-000, respectively) operated via a homemade National Instruments (NI) LabVIEW code. The air and fuel flows can be controlled in the range 0–12 L min−1 (i.e. litres per minute) and 0–200 mL min−1 (i.e. millilitres per minute), respectively. Differently from other commercial generators, the MISG does not require a third gas (i.e. N2) to be used as a carrier (quenching gas), and the air flow is internally split between the combustion and the dilution of the exhaust product. This implies that the ratio of comburent and carrier gas is not controllable, and the user can only adjust the comburent to fuel ratio.
The efficiency of the combustion process can be given in terms of the global equivalence ratio that is the ratio between actual and stoichiometric fuel-to-air ratio as follows:
where () is actual fuel-to-air ratio, and is the stoichiometric fuel-to-air ratio.
The fuel-to-air ratio is calculated as the opposite of the air-to-fuel ratio (AFR) that is the ratio between air and fuel masses. The stoichiometric AFR value is 15.64 (inverse value is 0.064) and 14.75 (inverse value is 0.068) for propane and ethylene, respectively.
The flame is classified as fuel rich and fuel lean when ϕ > 1 and ϕ < 1, respectively. Mamakos et al. (2013) reported that low fuel-to-air ratios (i.e. ϕ < 1) generate particles with a large fraction of EC, while semi-volatile organics are generated by high fuel-to-air ratios (i.e. ϕ > 1). In this work, only fuel-lean conditions were investigated.
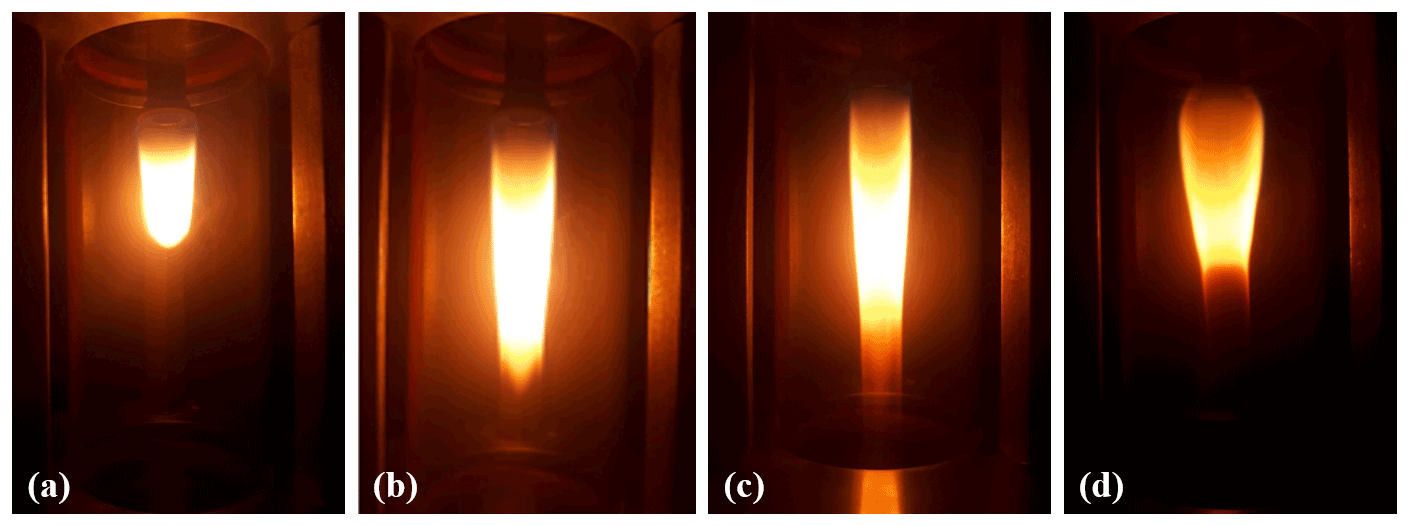
Figure 1Examples of different flame shapes. (a) Closed tip. (b) Open tip. (c) Partially open tip. (d) Curled base flame.
Since the combustion process can produce flame shapes having different characteristics, we first explored the range of combustion flows from 2 to 10 L min−1, in 0.5 L min−1 steps, and from 30 to 100 mL min−1, in 5 mL min−1 steps, respectively, for air and fuel. Flame types can be distinguished (Kazemimanesh et al., 2019; Moallemi et al., 2019) as follows:
-
Closed tip flame (Fig. 1a), which generates low concentrations of soot particles (i.e. around 103 cm−3), generally forming particle aggregates at the fuel tube nozzle.
-
Partially open tip flame (Fig. 1b), which is the transition between the open and closed tip.
-
Open tip flame (Fig. 1c), which generates high concentrations of soot particles (i.e. > 105 cm−3).
-
Asymmetric flame, which shows a large variability (very short, flickering, etc.) and can form particle aggregates at the fuel tube nozzle.
-
Curled base flame (Fig. 1d), which is a particular shape of the asymmetric flames that can also form particles aggregates at the fuel tube nozzle.
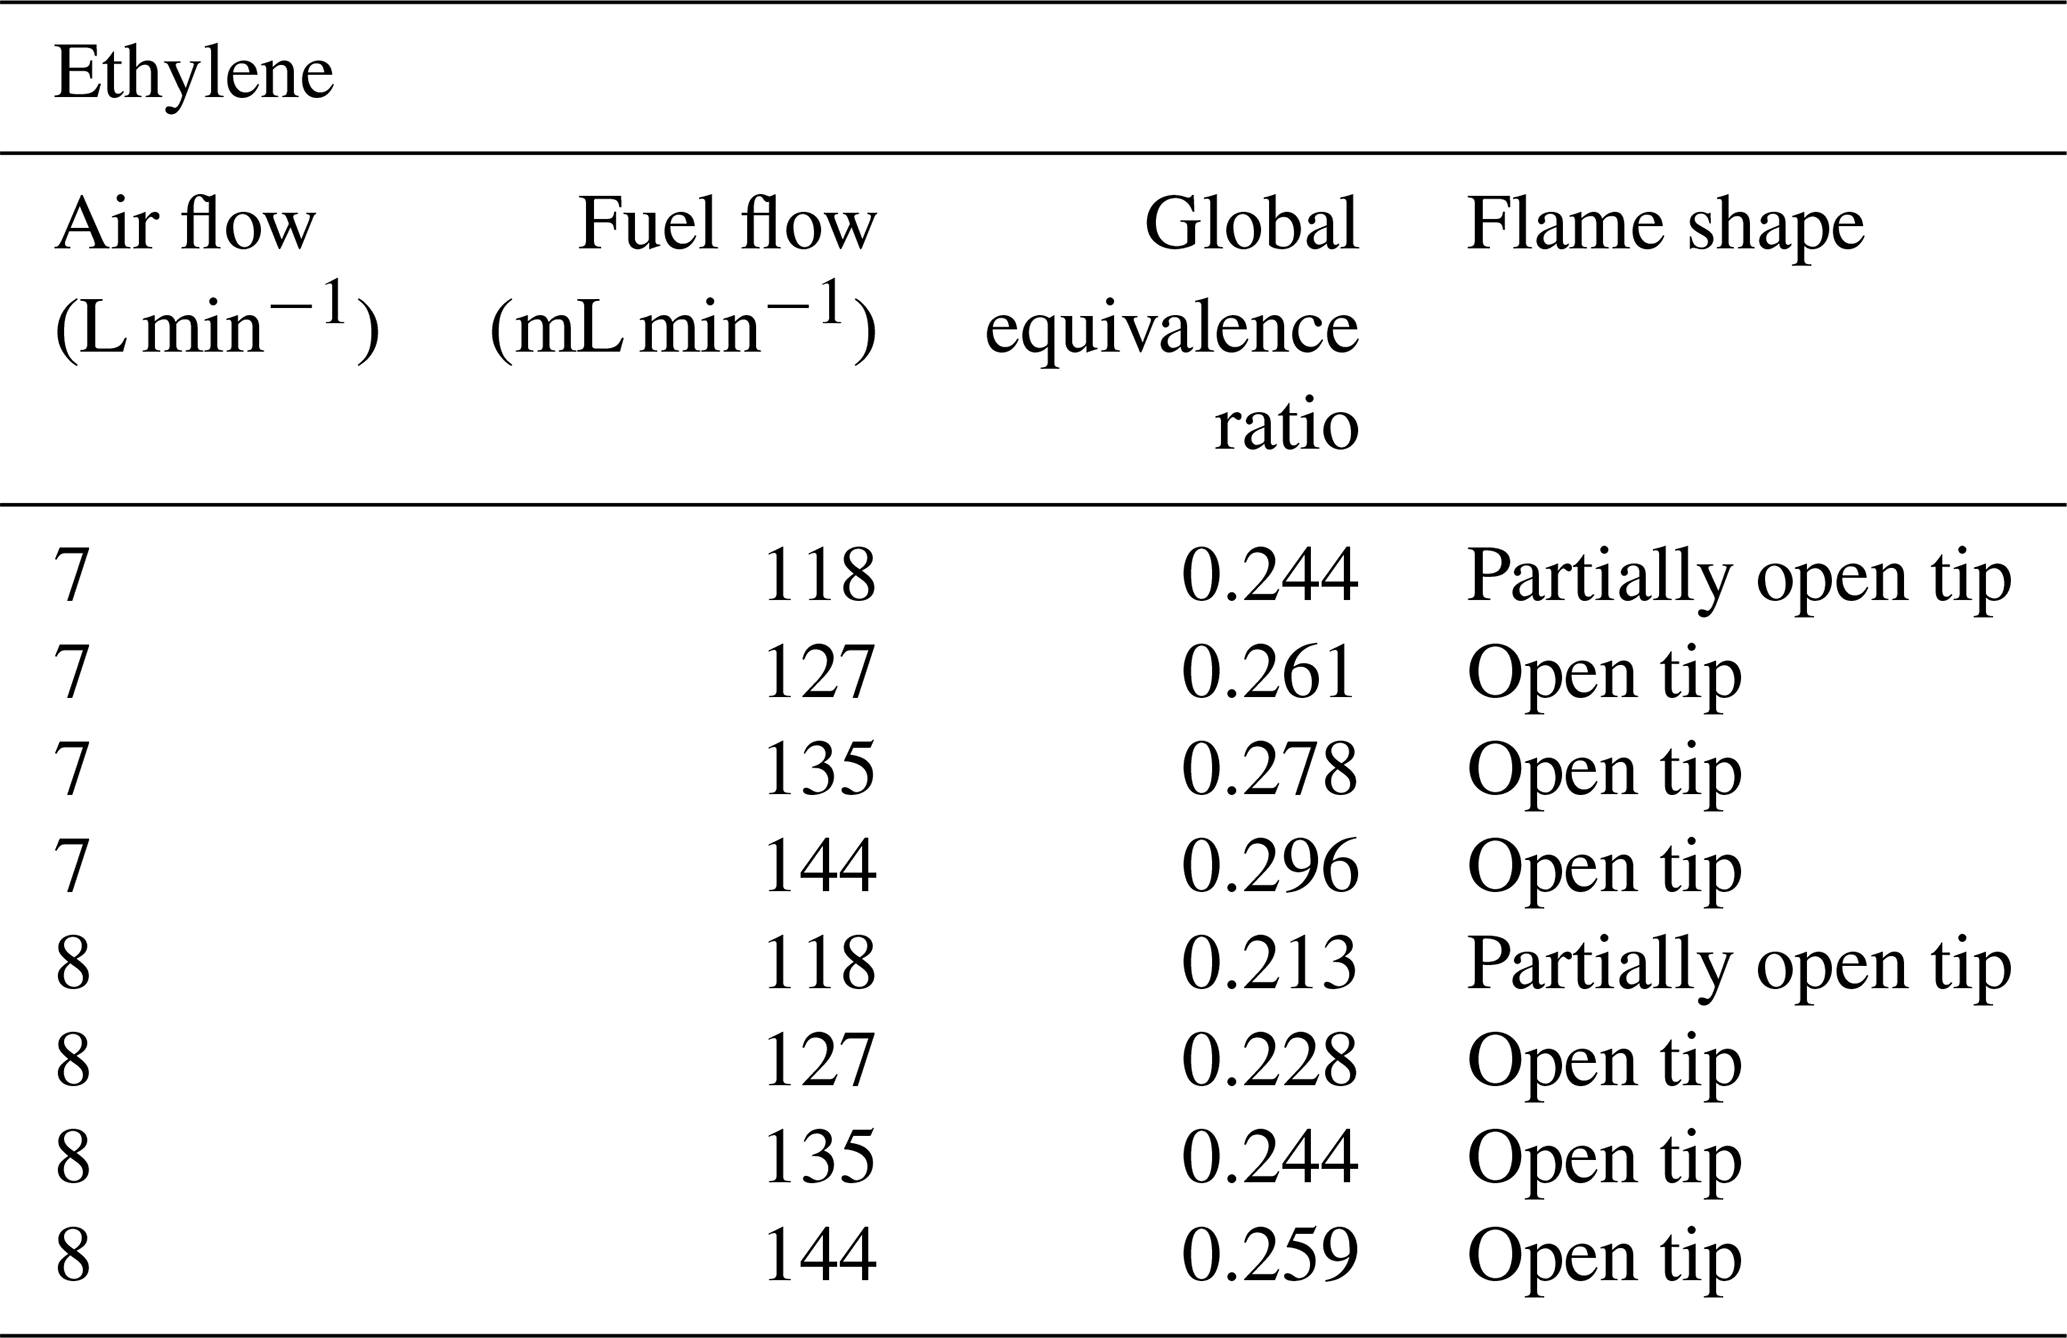
By observing the flames, we selected the more interesting combustion conditions (i.e. open tip flames) to perform the characterization experiments. We focused on open tip flames because these are the flames that generates higher concentrations of soot particles. Operative conditions selected for propane and ethylene combustion are reported in Tables 1 and 2. We maintained the same air flow and global equivalence ratio with both of the fuels.
Table 1Combustion parameters and flame shapes selected for propane.
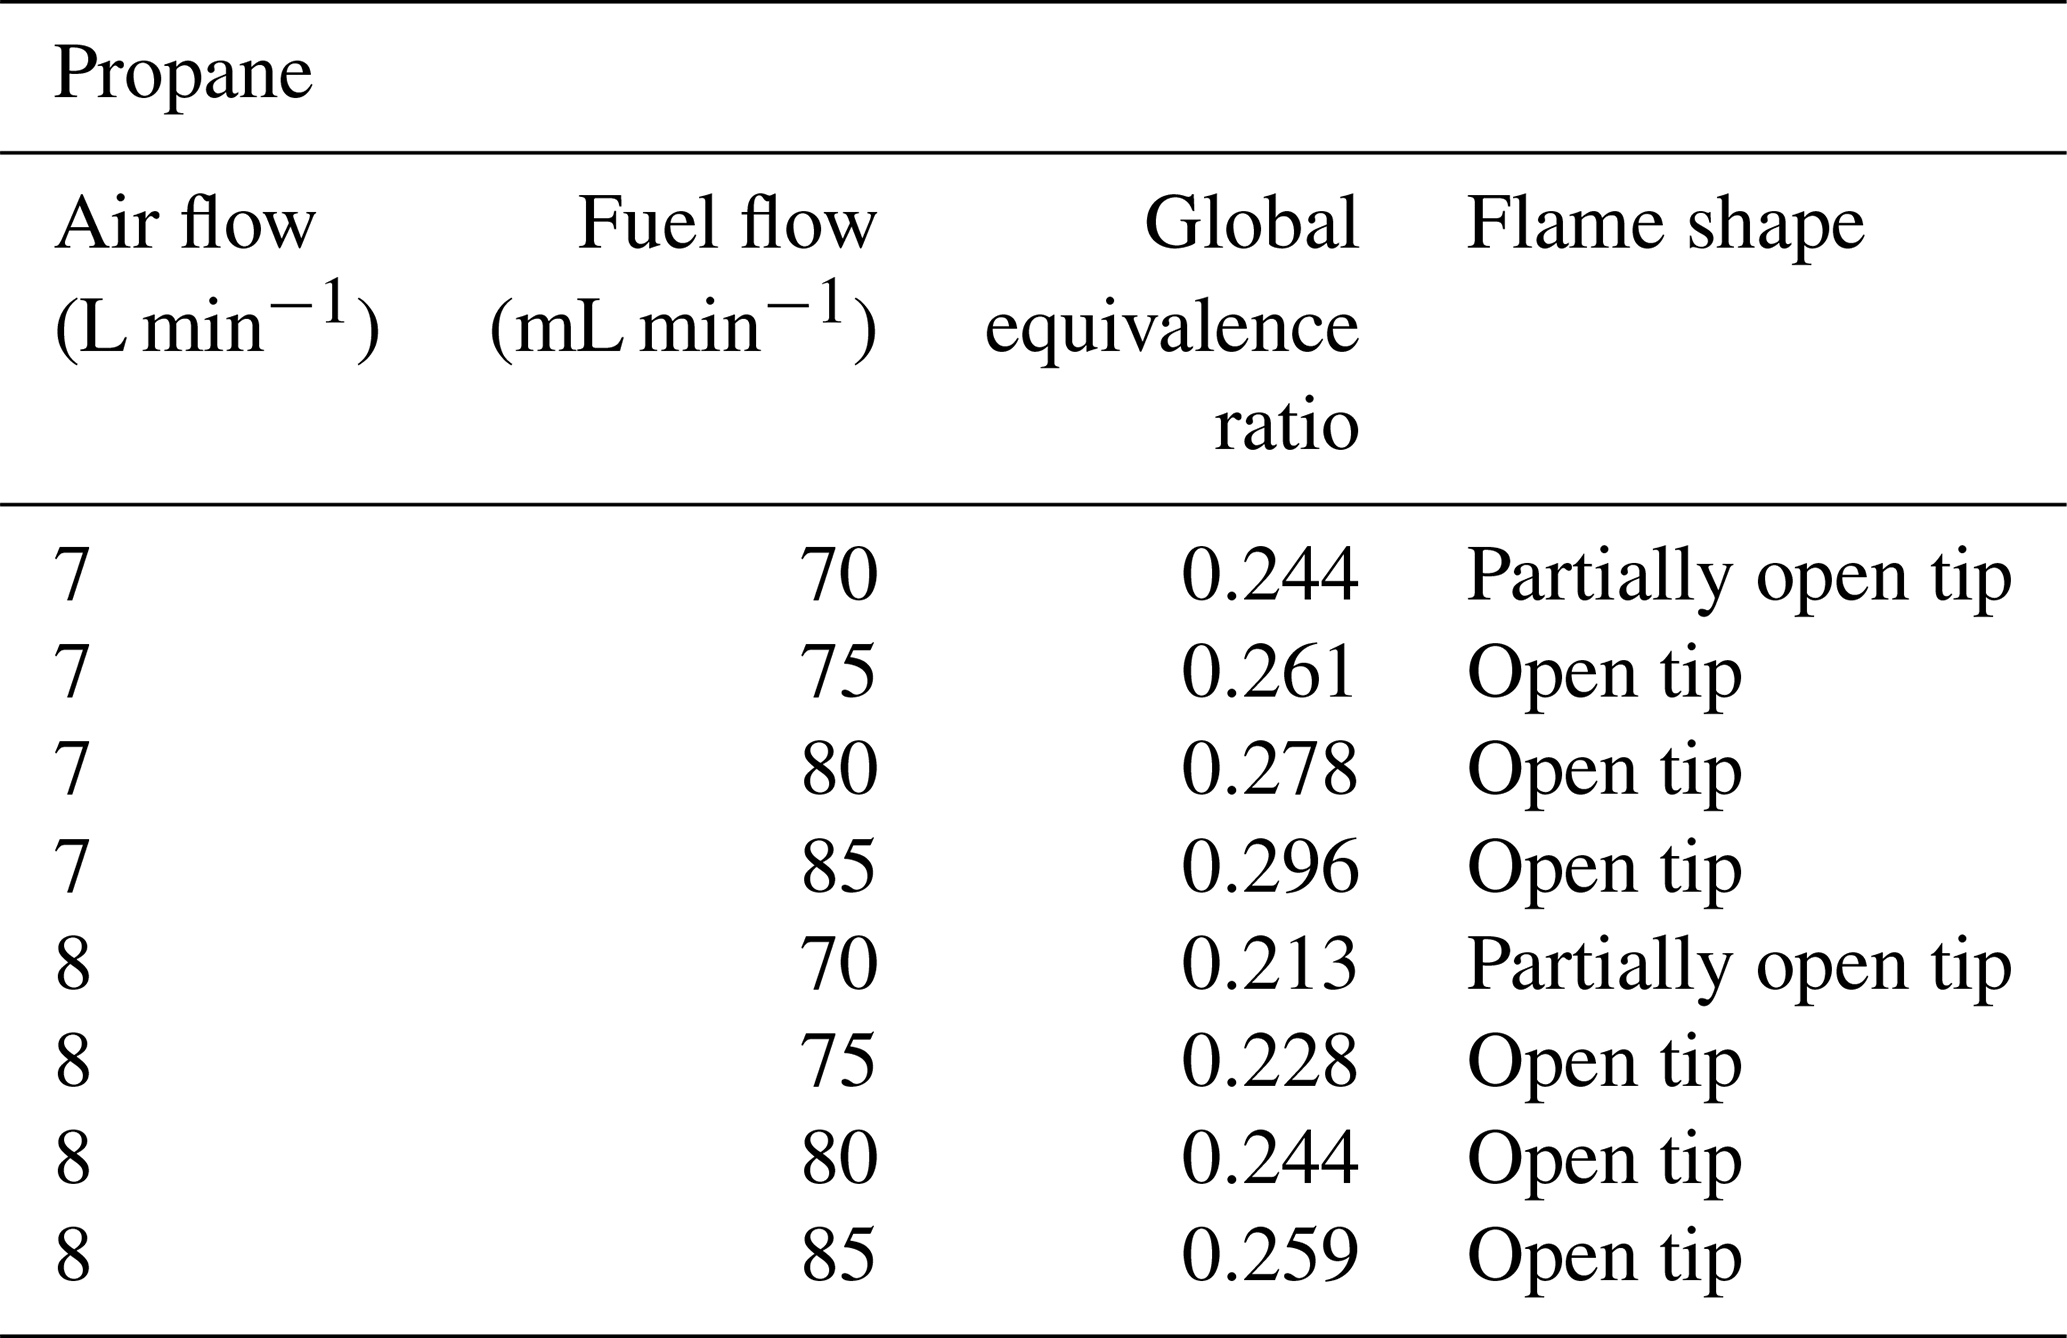
Table 2Combustion parameters and flame shapes selected for ethylene.
2.2 ChAMBRe set-up
Experiments took place at the ChAMBRe (Chamber for Aerosol Modelling and Bio-aerosol Research) facility (Massabò et al., 2018; Danelli et al., 2021) located at the Physics Department of the University of Genoa.
ChAMBRe is a stainless-steel chamber, with a volume of about 2.2 m3. Inside the chamber, relative humidity, temperature, and pressure are continuously monitored by a HMT334 Vaisala® HUMICAP® transmitter and a MKS Instruments 910 DualTrans™ vacuum transducer, respectively. A total of two gas analysers from Environnement SA, continuously monitored the concentration of NO NO2 (model AC32e), and CO CO2 (model CO12e) inside the chamber or, alternatively, in the laboratory. The mixing of gas and aerosol species is favoured by a fan installed at the bottom of the chamber. The mixing time for gaseous species is of about 180 s, with a fan rotating speed of 1.6 revolutions per second. A composite pumping system (rotary pump TRIVAC® D65B, Leybold vacuum, root pump RUVAC WAU 251, Leybold vacuum, and Leybold Turbovac 1000) allows the evacuation of the internal volume down to 10−5 mbar. In this way, ChAMBRe is cleaned before each experiment. Before and during the experiments, ambient air enters the chamber throughout a five-stage filtering/purifying inlet (including a HEPA filter; model PFIHE842; NW25/40 inlet/outlet – 25/55 SCFM; 99.97 % efficient at 0.3 µm). The whole set-up is managed by a custom NI LabVIEW SCADA (supervisory control and data acquisition).
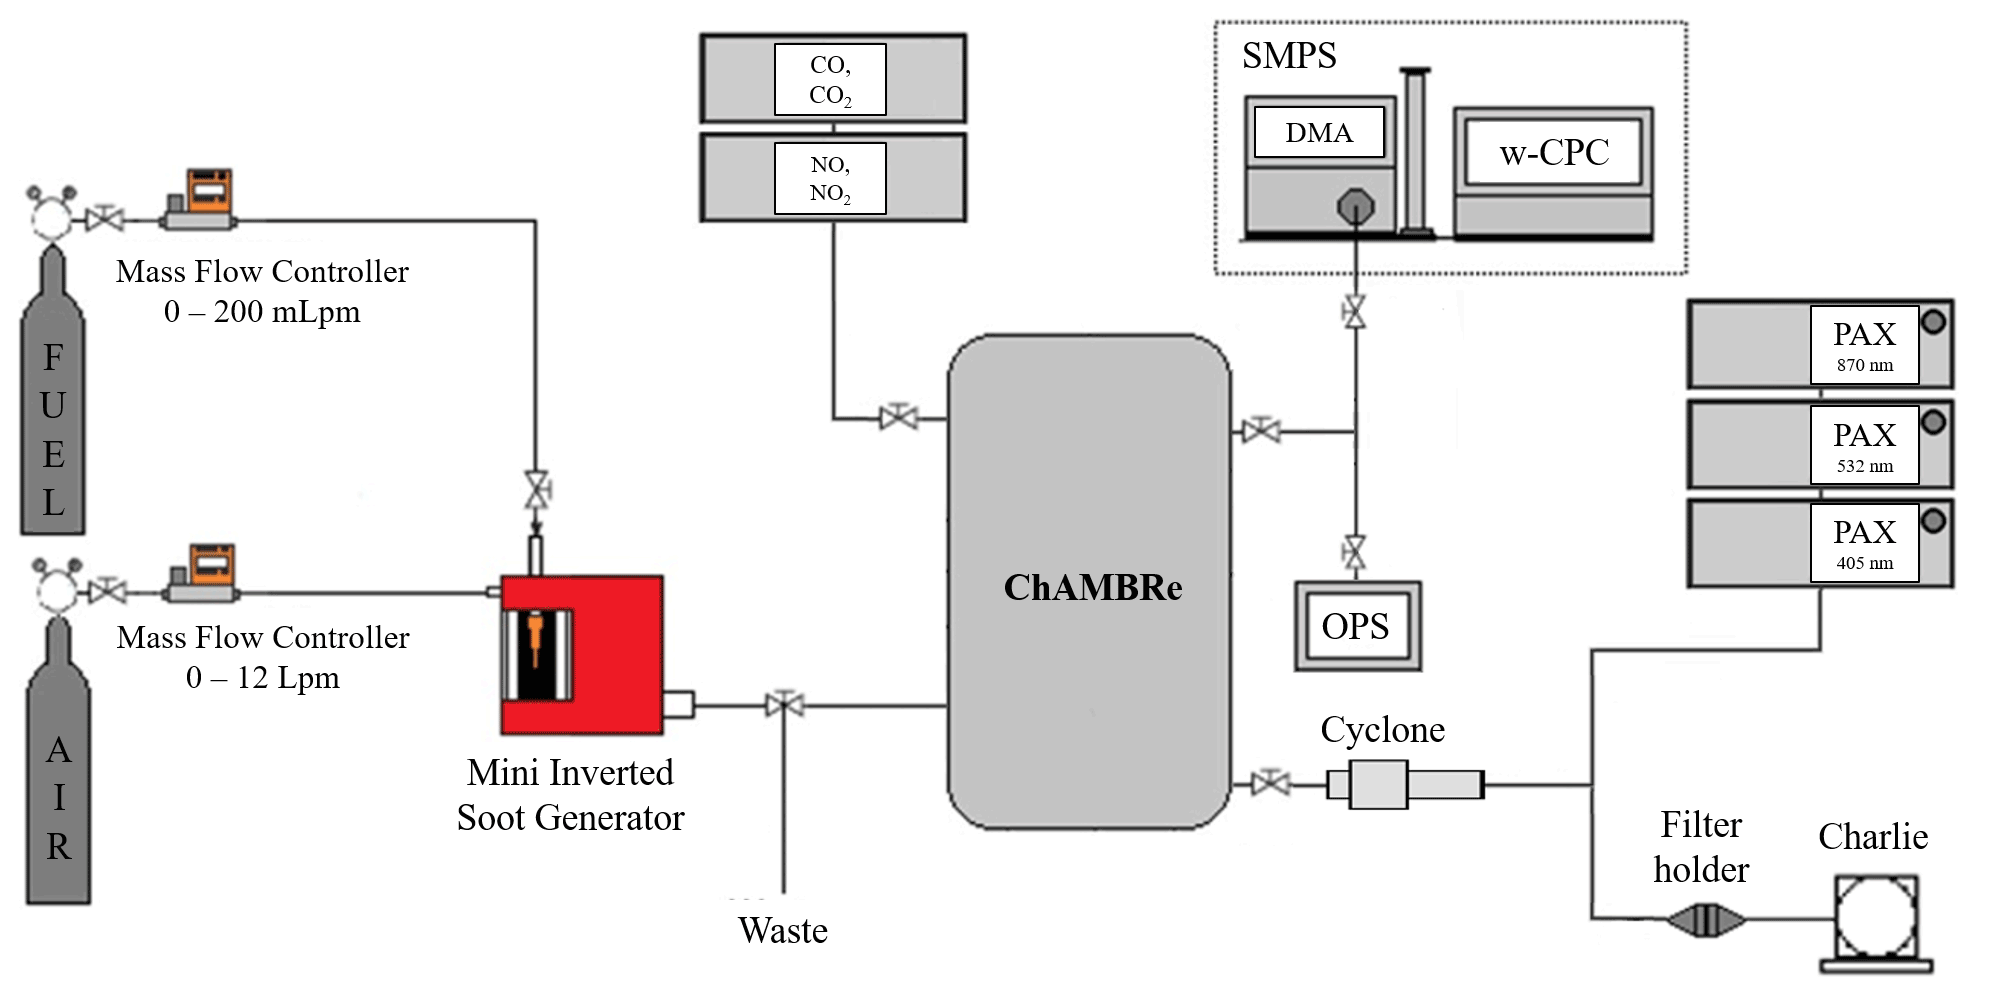
The layout of the experimental configuration adopted for the MISG characterization is shown in Fig. 2.
The MISG was warmed for about 45 min before injecting soot particles inside the chamber. Injection of the soot particles inside ChAMBRe lasted 2 or 3 min, depending on the soot concentration required for each experiment. We performed some fluid dynamic evaluations with the Particle Loss Calculator software tool (PLC; von der Weiden et al., 2009). The connection between MISG and ChAMBRe was made by Swagelok Adaptors (size ; 19.05) and ISO-K flanges (16 mm diameter) to avoid any possible leak. The length of the line was 65 cm. The geometry of our experimental set-up, combined with particle size and used flow rates, resulted in particle losses lower than 0.1 % in the dimensional range of 80–2000 nm. All the experiments were performed at atmospheric pressure, 19 ∘C 21 ∘C, and RH < 50 %.
2.3 Size distribution measurements
Particle concentration and size distribution inside the chamber were measured by a scanning mobility particle sizer (SMPS; TSI Inc., Shoreview, MN, USA; model 3938) composed of a differential mobility analyzer (DMA; TSI Inc., Shoreview, MN, USA; model 3081A) and a water condensation particle counter (w-CPC; TSI Inc., Shoreview, MN, USA; model 3789). The w-CPC is filled using technical demineralized water (conductivity of 20 ∘C; max 1.5 µS cm−1; Avantor). The SMPS was set to measure particles with a mobility diameter from 34 to 649 nm. The aerosol sample and sheath airflow rates were fixed at 0.17 and 1.60 L min−1, respectively, while the scanning period for each cycle was 70 s. The DMA unit integrates an impactor with an orifice of 0.0508 cm, resulting in a cutoff capability at 50 % of 940 nm, which useful for excluding all the particles larger than this size from entering in the column. Frequent cleaning of this part was necessary to ensure proper operation and avoid clogging. At the end of each experiment, the whole impactor system was cleaned using compressed air and isopropyl alcohol.
We corrected the diffusion losses in the instrument by using the option included in the instrument software; size distributions were not corrected for multiple charge effects through the TSI proprietary software (Aerosol Instrument Manager, version 11-0-1). An example of a comparison between the size distribution that is corrected and uncorrected by the multiple charge correction algorithm is shown in the Supplement (see Fig. S1).
Among the other chamber instruments, an optical particle sizer (OPS; TSI Inc., Shoreview, MN, USA; model 3330) was used for short times to spot the particle size distribution in the range 0.3–10 µm.
2.4 Online optical measurements
In total, three photoacoustic extinction meters (PAXs; Droplet Measurement Technologies, Boulder, CO, USA) were deployed, providing the online determination of the soot particles absorption coefficients at λ equal to 870, 532, and 405 nm. PAXs are constituted by a measurement cell, where aerosol optical properties are measured by two different mechanisms (https://www.dropletmeasurement.com/, last access: 4 April 2022; PAX Operator Manual). The sample flow rate (1 L min−1) is split into two different sectors of the cell and both are crossed at the same time by the light of a modulated laser diode. In the absorption sector, soot particles absorb light and release acoustic waves which are then detected by an ultra-sensitive microphone. The intensity of the acoustic signal is interpreted to infer the particle absorption coefficient. In the other sector, a wide-angle reciprocal nephelometer measures the scattering coefficient instead. It is noteworthy that no correction for the truncation angle is applied by the manufacturer. This can lead to a substantial underestimation of the scattering coefficient, which generally grows as the particle size increases and the single scattering albedo (SSA) approaches unity. Few papers in the literature deal with the correction for truncation errors in nephelometer measurements (Bond et al., 2009; Modini et al., 2021) for highly absorbing particles, and little is known about the dependency of the scattering phase function on the particle morphology and how this might impact truncation. However, since particles produced by soot generators have dimensions generally lower than 1 µm and SSA values lower than 0.3 (Moallemi et al., 2019), we disregarded this issue. At the time of the experiments, the three PAXs had been just calibrated by the manufacturer.
In some experiments, soot concentration inside the chamber was too high to be measured directly by PAXs, and a diluter (eDiluter Pro, Dekati Ltd, Kangasala, Finland) was deployed. Dry air from a cylinder was merged prior to the PAXs inlet with a dilution factor of 1 : 100. Tests performed with and without the diluter demonstrated the substantial reproducibility of the optical properties measured by the PAXs when the proper dilution factor is considered.
2.5 Offline analysis
Soot particles were also collected on pre-fired 47 mm diameter quartz fibre filters (Pallflex Tissuquartz 2500 QAO-UP) held in a stainless-steel filter holder to allow for additional offline analysis. The sampling started when the stable gas and particle concentration values were reached inside the chamber (i.e. about 3 min, corresponding to the chamber mixing time, after switching the MISG off). For each working condition, three filters with different loadings were obtained by a low-volume sampler (TECORA – Charlie HV) working at a fixed sampling flow (i.e. 10 L min−1 during experiments without cyclone and 13.67 L min−1 during experiments with cyclone).
For each sample, the EC and OC mass concentration was determined by thermal–optical transmittance analysis (TOT) using a Sunset Laboratory Inc. Sunset EC OC analyzer and the NIOSH 5040 protocol (NIOSH, 1999) corrected for temperature offsets. We also performed some tests by adding a back-up filter during the sampling to determine the volatile fraction of OC.
Prior to EC OC determination, particle-loaded filters were analysed by the multi-wavelength absorbance analyzer (MWAA; Massabò et al., 2013, 2015), a laboratory instrument for the offline direct quantification of the aerosol absorption coefficients at five different wavelengths (λ equal to 850, 635, 532, 405, and 375 nm). Such features have previously been exploited in the frame of several field campaigns in urban and rural sites (Scerri et al., 2018; Massabo et al., 2019, 2020; Moschos et al., 2021) and in remote sites (Massabò et al., 2016; Saturno et al., 2017; Baccolo et al., 2020).
2.6 Cyclone experiments
Soot aggregates are also generated by the MISG. Kazemimanesh et al. (2019) retrieved super-aggregates larger than 2 µm for ethylene combustion, while Moallemi et al. (2019) showed aggregate structures larger than 1 µm with propane. On this basis, confirmed by some short checks by the OPS, we replicated each experiment (see Sect. 2.1) both without and with a cyclone (PM1 Sharp Cut Cyclone – SCC 2.229; MesaLabs, Lakewood, CO, USA) inserted upstream of the PAXs and filter sampler (Fig. 2). The cyclone has a cutoff of 1 µm at a nominal flow of 16.66 L min−1.
3.1 Characterization tests
The categories of the flame shape observed in the range of air and fuel flows discussed in Sect. 2.1 are summarized in Supplement (see Tables S1 and S2), for propane and ethylene, respectively. The MISG characterization with propane has been published previously (Moallemi et al., 2019), and we used it as a reference. Fuel flows higher than 85 mL min−1 were not investigated due to instrumental limitation. A similar characterization with ethylene also exists, but it only partly covers the flow ranges explored in the present work. We found some differences, especially in the transition range to open tip flames, probably due to the different set-ups. In addition, the subjectivity of the visual determination, which is user-dependent, can lead to differences. It is noteworthy that no correlation could be found between the global equivalence ratio (ϕ) and the shape of the corresponding flame. This means that the fundamental parameter of the combustion process cannot be used to predict the flame shape.
The repeatability and stability of the MISG emissions were investigated for all the combustion conditions listed in Tables 1 and 2 in terms of number concentration and size distribution of the generated soot particles. Different combustion conditions were selected, and four experiments were performed for each combination of air and fuel flows. We chose to keep the air flow fixed to observe the differences produced by different fuel flows that correspond to different flame shapes (i.e. partially open tip or open tip). In each test, we recorded the values of the total particle number concentration, peak concentration, and mode diameter. The repeatability was calculated as the percentage ratio between the standard deviation and mean value (i.e. the relative standard deviation) of identical repeated experiments. With propane, mode reproducibility turned out to be 6 %, while total concentration and peak concentration showed a 16 % repeatability. With ethylene, the repeatability was 4 % and 10 %, respectively, for the mode and total/peak concentration. In addition, we monitored the combustion gases. CO2 and NO concentration varied by about 2 % and 3 %, respectively, with propane and ethylene.
3.2 Comparison between propane and ethylene exhausts
Previous works investigated the exhausts of MISG fuelled by ethylene (Kazemimanesh et al., 2019) and propane (Moallemi et al., 2019). We expand here to a detailed comparison between the two fuels, focusing on ASC experiments. In addition, we reproduced some of the conditions investigated in the previous works, obtaining a good agreement for the mode diameter and SSA figures (see Sect. S3 in the Supplement for details).
3.2.1 Size distribution
The mean size distributions observed at ChAMBRe are given in Fig. 3 for all the selected operative conditions. Data were acquired, starting 3 min (i.e. after the chamber mixing time) after the MISG was switched off, for a specific time interval (i.e. 4 to 10 min). All the curves are normalized to the same injection time (i.e. 3 min of injection inside the chamber).
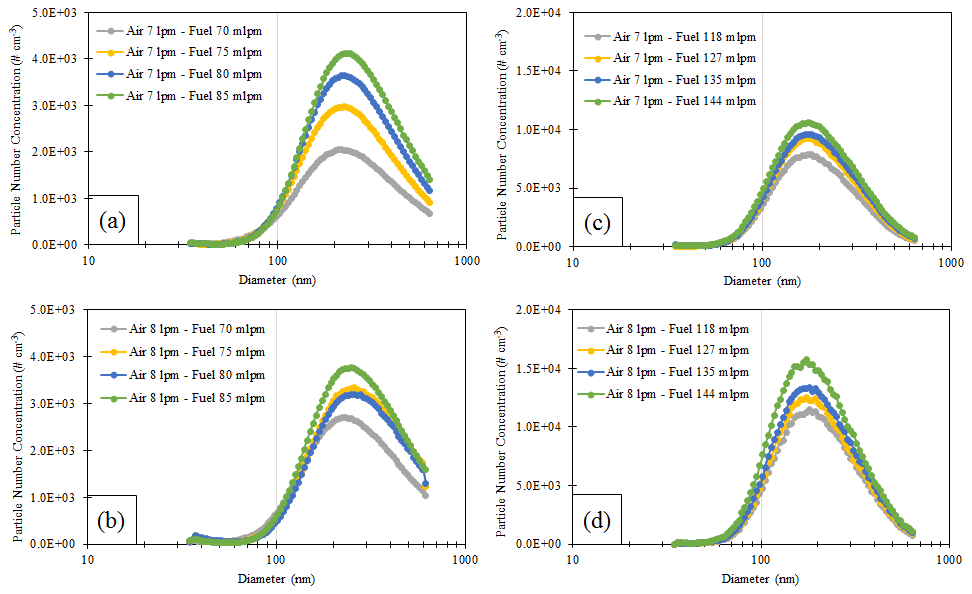
Figure 3Mean size distributions measured by SMPS. MISG was fuelled with propane (a, b) and ethylene (c, d), with the air and fuel flows indicated in the frame of the plots.
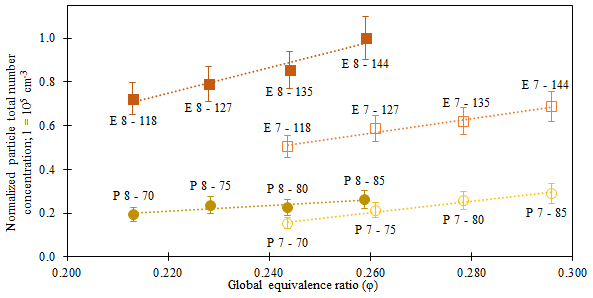
Figure 4Particle number concentration vs. the global equivalence ratio. Values are normalized to the highest of the whole set. Each point is labelled with E or P (ethylene or propane) and a pair of numbers indicating air and fuel flow rate, respectively (L min−1; mL min−1). Dotted lines aim to guide the reader's eye.
For a better comparison of different experiments, particle concentration values were normalized to the maximum recorded in the whole set of tests and, therefore, varied in the 0–1 range. Figure 4 shows the result for the total particle number concentration. We can notice the following:
-
At fixed air flow, the particle number concentration increases with the fuel flow (i.e. with the global equivalence ratio).
-
Under the same combustion conditions (i.e. same air flow and same global equivalence ratio), ethylene generates more particles than propane.
-
With ethylene and at a fixed fuel flow, the particle number concentration increases with the air flow. The same holds in some cases with propane but with much smaller variations.
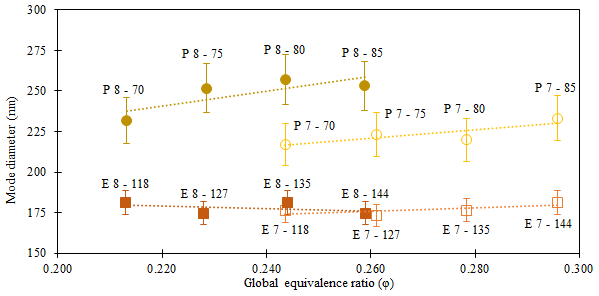
Figure 5Mode diameter vs. the global equivalence ratio. Each point is indicated by E or P (ethylene or propane) and a pair of numbers indicating air and fuel flow rate, respectively (L min−1; mL min−1). Dotted lines aim to guide the reader's eye.
A similar comparison is shown in Fig. 5 for the particle mode diameter. While the values are basically constant for ethylene, the mode diameter with propane slightly increases with air flow (at fixed fuel flow). Furthermore, at each ϕ value, propane generated particles bigger than ethylene.
Even if the direct comparison between our findings and results from previous works (Bischof et al., 2019; Kazemimanesh et al., 2019; Moallemi et al., 2019) are not directly comparable (since feeding flows and global equivalence ratios are different), some similarities can be identified. Previous works observed that, by increasing the fuel flow, the particle number concentration increases too, which is in agreement with what we observed for both fuels. In addition, Bischof et al. (2019) reported that, with propane, the particle mode diameter did not depend on the global equivalence ratio; we observed this behaviour for ethylene instead. Kazemimanesh et al. (2019) showed a clear increase in mode diameter, corresponding to an increase in fuel flow rate that reached quite a constant value (i.e. around 240–270 nm) for ethylene. This trend differs from our observations, since the mode diameter in our case turned out to be quite stable at about 175 nm and independently on feeding flows. This difference is probably due to the global equivalence ratios used. While in Kazemimanesh et al. (2019) the global equivalence ratios are lower than 0.206, in our case they are higher than 0.213. In Moallemi et al. (2019), instead, they observed an opposite behaviour for mode diameters, and they retrieved that at a fixed fuel flow, where a higher air flow produced a slight decrease in the mode diameter. Both Moallemi et al. (2019) and Bischof et al. (2019) measured mode diameters < 200 nm, but they used different combustion conditions (i.e. lower global equivalence ratios resulting from higher air flow or lower fuel flow). We can conclude that, as expected, global equivalence ratio is the principal parameter affecting the size distributions of soot particles.
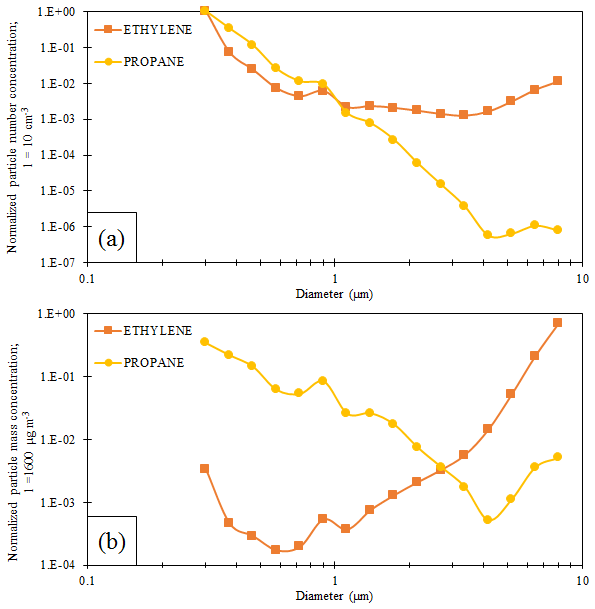
Figure 6Particle concentration normalized to the total vs. particle diameter, as measured by OPS. Panel (a) shows the number distribution. Panel (b) shows the mass distribution. MISG was fuelled with 7 L min−1 of air and 75 mL min−1 of fuel during the propane experiment and 127 mL min−1 of fuel during ethylene experiment. No cyclone was used.
Significant differences between the two fuels emerge when considering the super-micrometric range measured by the OPS. Ethylene combustion produced a number of big particles, likely super-aggregates, probably formed in the stagnation plane at the bottom part of the combustion cell (Chakrabarty et al., 2012). This hypothesis was confirmed by dedicated experiments, with the set-up specifically modified with respect to the basic one (see Fig. S2). Kazemimanesh et al. (2019) also observed the formation of aggregates, even with smaller dimensions (i.e. about 2 µm of the maximum Feret diameter). The particle number concentration, normalized to the total particle number concentration, is shown in Fig. 6a. We calculated the super-micrometric fraction of the total number concentration measured by the OPS with both the fuels (Fig. 6a). This resulted to be about 3 % with ethylene and 0.2 % with propane. Particles larger than 4 µm (i.e. optical equivalent diameter) were about 2 % with ethylene and totally negligible with propane. Considering the particle mass distribution (see Fig. 6b), the difference is enhanced, and the super-micrometric fraction is about 99 % of the total mass concentration with ethylene and 9 % only with propane. Particles larger than 4 µm contribute to the total mass (and hence to the soot concentration) for about 98 % and 1 %, respectively with ethylene and propane.
Anyway, super-aggregate formation by ethylene combustion can be partly reduced by using lower air and fuel flow rates (see Fig. S3, for example).
3.2.2 Gaseous exhaust
Gaseous emissions were characterized too, by focusing on the most abundant gases, i.e. CO2 and NO. The pattern is similar for both the gases. At a fixed air flow rate, the gas concentration increased with the fuel flow, while no significant differences emerged at fixed fuel flow rate and changing the air flow. At equal operative conditions (i.e. the same combustion conditions, injection time, and time from the injection), gaseous emissions were higher with ethylene than with propane. With the same normalization introduced in Fig. 3, the CO2 and NO production are compared in Figs. 7 and 8 for each selected MISG configuration. Maximum values were 360 ppm (parts per million) and 980 ppb (parts per billion), respectively, for CO2 and NO, after 3 min of soot injection.
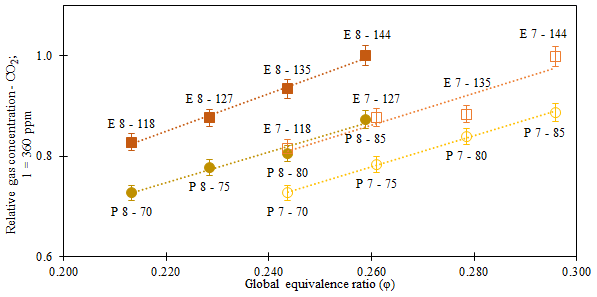
Figure 7CO2 concentration vs. the global equivalence ratio. Each value was normalized to the highest of the whole set. Data points are labelled with E or P (ethylene or propane) and a pair of numbers indicating air and fuel flow, respectively (L min−1; mL min−1). Dotted lines aim to guide the reader's eye.

Figure 8NO concentration vs. the global equivalence ratio. Each value was normalized to the highest of the whole set. Data points are labelled with E or P (ethylene or propane) and a pair of numbers indicating air and fuel flow, respectively (L min−1; mL min−1). Dotted lines aim to guide the reader's eye.
3.2.3 EC OC quantification
The EC OC composition was quantified by thermal–optical analysis of samples collected on quartz fibre filters during each experiment. The EC : TC (total carbon) concentration ratios resulted to be around 0.7 and 0.9, with propane and ethylene, respectively. In addition, the EC : TC concentration ratios increased with the global equivalence ratio. All the results are given in Fig. 9a and b for experiments without and with cyclone, respectively, adopting the same normalization already introduced in Fig. 3. When removing large particles (see Sect. 3.2.1), the EC : TC concentration ratio gave higher results with propane (0.83 against 0.79 measured with ethylene). It is worth noting that, with ethylene, about 40 % of the EC concentration was associated with particles larger than 1 µm. With both fuels, the EC : OC ratios increase with the global equivalence ratios whether the cyclone is present or not, in agreement with Kazemimanesh et al. (2019) and Moallemi et al. (2019).
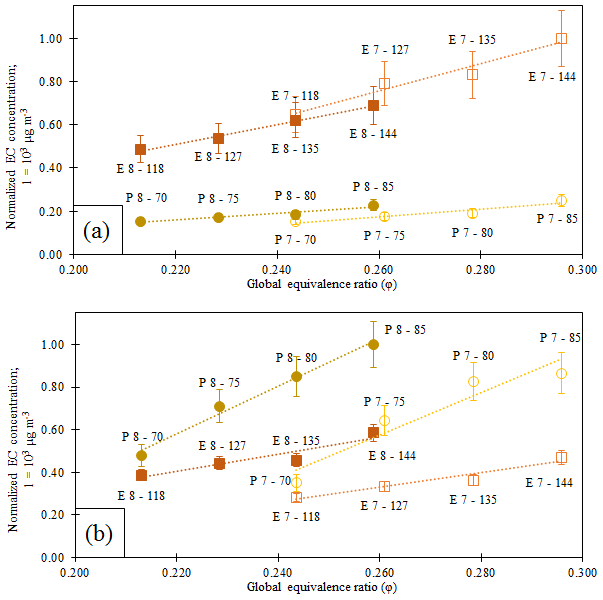
Figure 9EC mass concentration vs. the global equivalence ratio. Each value was normalized to the highest of the whole set. Each point is labelled with E or P (ethylene or propane) and a pair of numbers indicating air and fuel flow rate, respectively (L min−1; mL min−1). (a) No cyclone. (b) Cyclone upstream of the filter. Dotted lines aim to guide the reader's eye.
The OC : TC ratio varies from 0.27 for propane to 0.11 for ethylene, without cyclone, and 0.20 for ethylene to 0.16 for propane, when the cyclone was used. In each series of experiments (i.e. air flow rate of 7 or 8 L min−1 for ethylene or propane), the OC fraction turned out to be inversely proportional to the fuel flow with a minimum at the lowest fuel flow (i.e. 70 L min−1 with propane and 118 L min−1 with ethylene). This is likely due to the shape of the flame because flames generated by the lowest fuel flow conditions have a partially open tip, with less capability to generate soot particles and, hence, EC, so the EC : TC ratio has lower results.
We also performed some tests to determine the volatile fraction of OC. The OC concentration values measured on back-up filters showed high variability, but they were compatible with those on not-sampled filters. We analysed 13 blank filters from different bunches, and the average concentration of OC resulted in 〈 OC 〉 = 0.5 ± 0.2 µg cm−2, while the OC concentration on back-up filters was 〈 OCBF 〉 = 0.6 ± 0.2 µg cm−2. Since the average OC concentration on the corresponding main filters was 1.4 ± 0.7 µg cm−2, and the average EC concentration collected on this subset of filter was 12.3 ± 0.2 µg cm−2, the volatile fraction phase can be considered negligible. A relationship between OC concentration on the back-up filter and the global equivalence ratio was instead reported in Kazemimanesh et al. (2019). Actually, in that study, the range of investigated global equivalence ratio values was 0.129 < ϕ < 0.186 and compared with ϕ > 0.210 adopted in this work.
3.2.4 Optical properties
The optical properties of the MISG aerosol were determined in terms of the absorption coefficient (babs; i.e. the absorbance per unit length; Massabò and Prati, 2021). The babs definition applies both to measurements directly performed on the aerosol dispersed in the atmosphere (by PAXs, in this work) and to offline analyses on aerosol sampled on filters (by MWAA, in this work), provided a proper data reduction is adopted (Massabò and Prati, 2021; and references therein).
The online measured babs values were normalized to the total particle number concentration inside ChAMBRe reached in each single experiment. At each wavelength, the babs values did not show any dependence on the global equivalence ratio, with the propane producing particles more absorbent than ethylene (see Figs. S4 and S5 for the experiments without and with cyclone, respectively). Similar results were obtained even for experiments without cyclone and for the babs values measured by the MWAA. Optical properties such as absorption depend on several parameters, mainly composition, mixing state, ageing, and size. Considering all the experiments reported in this work, no differences in composition can be expected, since only EC particles were present. This means that differences in absorption cannot depend on particle composition. Also, the mixing state and ageing cannot explain this difference. The soot inside the chamber was fresh. We can explain the higher light-absorbing capability of propane by considering differences in the size distributions (see Figs. 3–5) and morphology/density of the particles produced by the burning of the two different fuels.
In the literature, only data for the IR-PAX (where the PAX unit is 870 nm) in terms of the single scattering albedo (SSA) for propane soot are reported. SSA (IR) values, measured during propane experiments, in our work varied from 0.15 to 0.18, which is in agreement with those obtained by Moallemi et al. (2019), which ranged from 0.15 to 0.25.
The babs values, together with the EC concentration measured on the filter sampled during each single experiment, can be used to retrieve the mass absorption coefficient (MAC) of the produced aerosol, through the following relation:
where babs (Mm−1) is the absorption coefficient, MAC (m2 g−1) is the mass absorption coefficient, and EC (µg m−3) is the elemental carbon concentration.
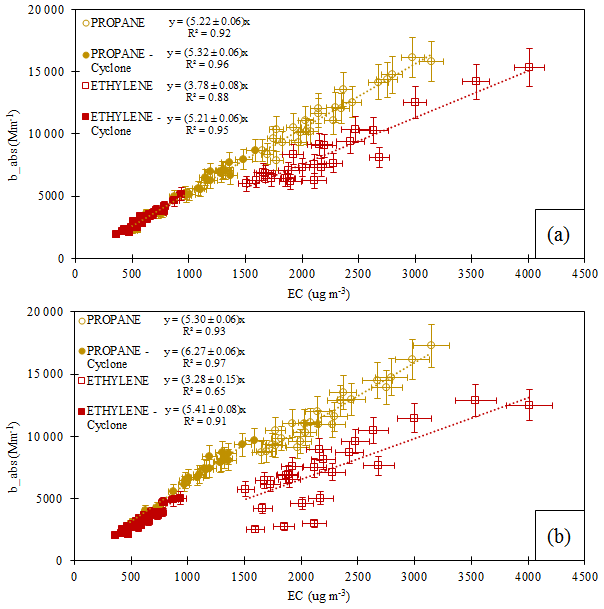
Figure 10Absorption coefficient at 850 nm, measured by MWAA (a), and at 870 nm, measured by PAX (b) vs. EC concentration. The slope of each fit corresponds to the mass absorption coefficient.

The babs values were calculated directly online by the PAXs and offline by the MWAA analysis and performed at five wavelengths on the sampled filters (see Sect. 2.5). This gave the possibility to extend the characterization of the MISG and to compare two optical analyses on the same carbonaceous aerosol. Since the experiments were repeated with two different set-ups (i.e. with and without the cyclone) and two different fuels (propane and ethylene), four different particle populations can be compared. The comparison was carried out at the three wavelengths (nearly) common to PAXs and MWAA (i.e. λ = 870/850, 532, and 405 nm). Figure 10 shows the comparison at λ = 870/850 nm, while comparisons at λ = 532 and 405 nm are reported in the Supplement (see Figs. S6 and S7, respectively). We divided the results by fuel, air flow, and those with/without cyclone. Each point in the plots sums up the observations at different global equivalence ratio values. All the measured MAC values, including the other two wavelengths available for the MWAA (i.e. 635 and 375 nm) too, are summarized in Table 3.
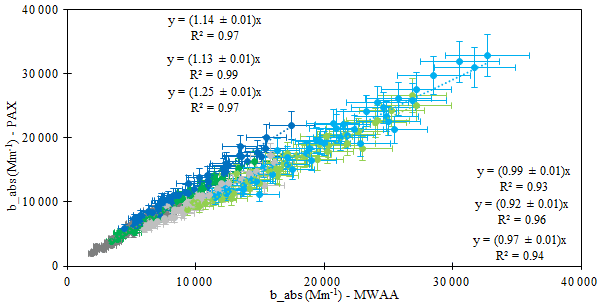
Figure 11Correlation study between the absorption coefficient measured by PAX and MWAA. The colours of the dots identify the wavelength of the analysis, where grey refers to 870 nm, green to 532 nm, and blue to 405 nm. Events with cyclone, where light grey refers to 870 nm, light green to 532 nm, and light blue to 405 nm, and without cyclone are shown.
The MWAA analysis at λ = 870 nm (Fig. 10a) returned compatible MAC values for both of the propane series (with/without cyclone) and for the ethylene series with cyclone, while a consistently lower MAC value was found for the ethylene series (worse correlation) without the PM1 cutting. The same picture turned out at the other two wavelengths (see Figs. S6 and S7). By comparing PAX absorption coefficients and EC concentrations at λ = 870 nm (Fig. 10b), obtained MAC values are more variable, with similar values only in the case of propane without cyclone and ethylene with cyclone. At λ = 532, in the case of MWAA, similar MAC values have been found for both of the propane series, while, for the ethylene series, MAC values were slightly higher when cyclone was used and lower when not. Considering the optical data from PAX, a similar MAC for both the fuels was found when the cyclone was present, while it slightly differed in the case of propane without cyclone, and it was much lower in the case of ethylene without cyclone. At λ = 405 nm, the MWAA responses for propane series were still in agreement, while the ethylene series showed a higher MAC value when using the cyclone, and a lower MAC value without using it. PAXs returned a different MAC value for each of the four conditions. To summarize, if only series with cyclone are considered, MAC values show small differences, depending on the fuel, which are larger in the case of PAXs. The ethylene series without cyclone showed the lowest MAC values of the whole data set. The most likely reason for this difference is the presence of super-micrometric particles (see Sect. 3.2.1 and Fig. 6) when the cyclone was not used. With MWAA, the MAC values turned out to be the same in all the runs, but in the case of the ethylene data collected without the cyclone. With the PAX analysis, MAC values turned out higher in the series with cyclone. This happened at all the three wavelengths and for both fuels. Since PAX data showed a higher variability in MAC values, photoacoustic measurements are supposed to be more sensitive to particle size than filter based MWAA analysis.
MAC values are close to theoretical figures for soot (Bond and Bergstrom, 2006), for both the fuels and at all the wavelengths. IR values are similar to those obtained by Moallemi et al. (2019) for propane exhaust. With both the fuels, MAC values increase when super-micrometric particles were removed by the cyclone; propane particles also showed higher MAC values than ethylene ones.
In Moallemi et al. (2019), only IR-MAC values for propane are reported, resulting slightly lower than the values quoted here. This difference could depend on the techniques used to quantify the EC concentration. We measured EC values by thermal optical analysis, while Moallemi et al. (2019) reported the BC concentration measured by laser-induced incandescence (LII).
Discrepancies between MAC values obtained by PAXs and MWAA, for the same experiment, are compatible with the differences of measured babs values. The latter are directly compared in Fig. 11, merging all the data collected by the two set-ups (i.e. with and without the cyclone) and for the two fuels. The agreement between the two instruments turned out to be within 25 % and 7 %, respectively, without and with the cyclone.
In addition, the spectral dependence of the absorption coefficient babs and, consequently, the Ångström absorption exponent (AAE; Moosmüller et al., 2011) can be calculated by the power law as follows:
where babs (Mm−1) is the absorption coefficient, λ (nm) is the wavelength used for the analysis, and AAE is the Ångström absorption exponent.
Table 4AAE values obtained in different experimental conditions through the analysis of PAX and MWAA raw data.
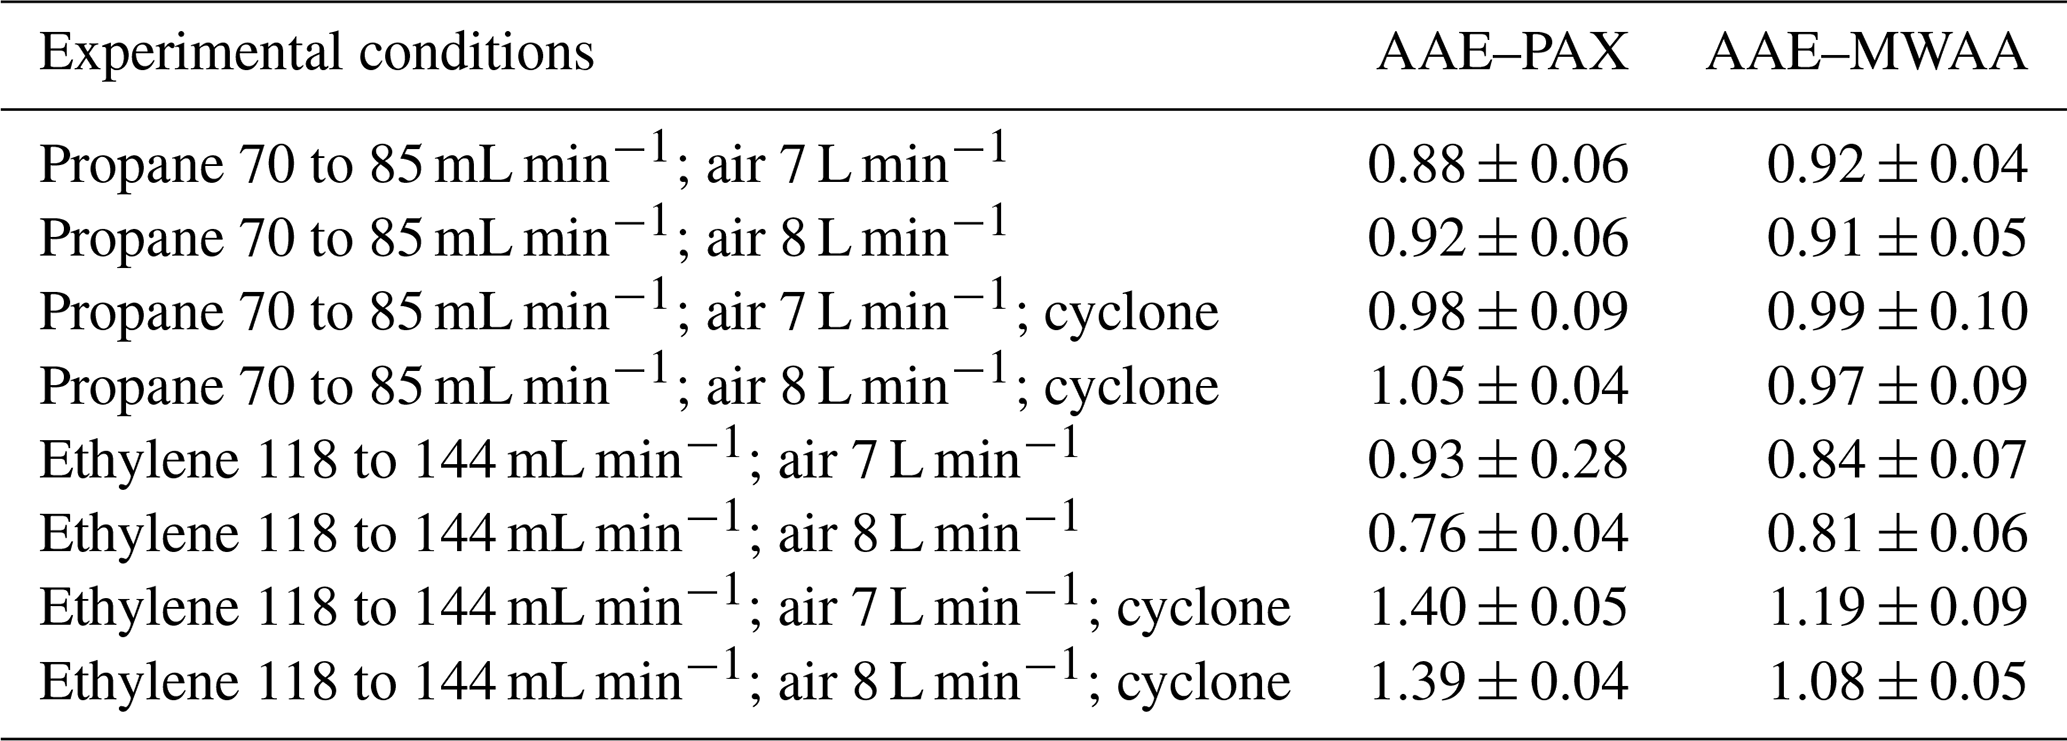
The averages of the resulting AAE values for the different experimental conditions are reported in Table 4 by fitting the data for the three and five available wavelengths in the case of PAXs and MWAA, respectively.
Experimental determinations of the AAE had been reported in the literature as being dependent on aerosol chemical composition (Kirchstetter et al., 2004; Utry et al., 2013) and size and morphology (Lewis et al., 2008; Lack et al., 2012; Lack and Langridge, 2013; Filep et al., 2013; Utry et al., 2014a). Particulate generated by fossil fuel combustion (i.e. black carbon) typically has AAE values close to 1.0 (Harrison et al., 2013, and references therein). The AAE values measured in this work for the MISG exhausts are generally close to 1.0, with higher figures for the cyclone-selected aerosol.
Since the fit to three points could not be reliable, in the Supplement (Table S4), we reported the two-wavelength calculations of the AAE for PAXs.
A mini inverted soot generator (MISG) was coupled with an atmospheric simulation chamber (ChAMBRe) to compare the emissions when the burner is fed by two different fuels, ethylene, and propane. Different combustion conditions (i.e. air and fuel flow and the global equivalence ratio) were characterized in terms of size distribution, particle and gas composition, optical properties, and EC concentration in the exhausts.
The MISG turned out to be a stable and reproducible soot particles source that is suitable for experiments in atmospheric simulation chambers. In addition, properties of emitted soot particles can be slightly modulated by varying the combustion conditions, i.e. tuning the global equivalence ratio and/or varying the fuel used for combustion.
With equal conditions, ethylene combustion produced particles with higher number concentration and a smaller diameter than propane. Anyway, particles generated by both the fuels were larger than the typical exhausts of modern engines, such as aircraft and diesel vehicle engines, which emit ultrafine soot particles. Furthermore, it is noteworthy that ethylene combustion also generates super-micrometric aggregates. These are likely formed in the stagnation plane at the bottom part of the combustion cell. This information should be kept in mind when planning experiments, since super-aggregates, if not desired, could affect the analysis.
The carbonaceous compounds produced by propane are generally characterized by higher EC to TC ratios than ethylene.
From the optical point of view, particles generated by propane turned out to be more light absorbing than those formed by ethylene, although burning conditions (in terms of global equivalence ratio) were the same. The values of the MAC parameter show a substantial agreement, except for those retrieved from the data collected in the ethylene no cyclone experiments. The latter resulted in lower MAC values, probably due to the presence of super-aggregates in the chamber.
This work opens the way to new and more complex experiments. Well-characterized soot particles could be used to investigate the effects that atmospheric parameters such as temperature and relative humidity can have on soot particles and to study the interactions between soot particles and gaseous pollutants, solar radiation, or bio-aerosol.
Research data are available from the laboratory website at https://labfisa.ge.infn.it/index.php/data-repository?view=document&id=10:research-data-for-manuscript-amt-2021-346&catid=10 (last access: 6 April 2022, Vernocchi et al., 2022).
The supplement related to this article is available online at: https://doi.org/10.5194/amt-15-2159-2022-supplement.
VV and DM prepared the experimental set-up and performed all the experiments and the data analysis. DM, FP, SGD, and PP designed and built ChAMBRe. MB designed and implemented the acquisition software. VV and DM prepared the article, with contributions from the other authors.
The contact author has declared that neither they nor their co-authors have any competing interests.
Publisher’s note: Copernicus Publications remains neutral with regard to jurisdictional claims in published maps and institutional affiliations.
This article is part of the special issue “Simulation chambers as tools in atmospheric research (AMT/ACP/GMD inter-journal SI)”. It is not associated with a conference.
This research has been supported by the Horizon 2020 (EUROCHAMP-2020; grant no. 730997) and MIUR (PON project PIR_00015 “Per ACTRIS IT”).
This paper was edited by Christian George and reviewed by four anonymous referees.
Ackerman, A., Toon, O., Stevens, D., Heymsfield, A., Ramanathan, V., and Welton, E.: Reduction of tropical cloudiness by soot, Science, 288, 1042–1047, https://doi.org/10.1126/science.288.5468.1042, 2000.
Anenberg, S. C., Horowitz, L. W., Tong, D. Q., and West, J. J.: An estimate of the global burden of anthropogenic ozone and fine particulate matter on premature human mortality using atmospheric modelling, Environ. Health Perspec., 118, 1189–95, https://doi.org/10.1289/ehp.0901220, 2010.
Baccolo, G., Nastasi, M., Massabò, D., Clason, C., Di Mauro, B., Di Stefano, E., Łokas, E., Prati, P., Previtali, E., Takeuchi, N., Delmonte, B., and Maggi, V.: Artificial and natural radionuclides in cryoconite as tracers of supraglacial dynamics: Insights from the Morteratsch glacier (Swiss Alps), CATENA, 191, 104577, https://doi.org/10.1016/j.catena.2020.104577, 2020.
Becker, K. H.: Overview on the Development of Chambers for the Study of Atmospheric Chemical Processes, in: Environmental Simulation Chambers: Application to Atmospheric Chemical Processes, edited by: Barnes I. and Rudzinski K. J., Springer, Amsterdam, 1–26, https://doi.org/10.1007/1-4020-4232-9_1, 2006.
Bescond, A., Yon, J., Ouf, F. X., Roze, C., Coppalle, A., Parent, P., Ferry, D., and Laffon, C.: Soot optical properties determined by analyzing extinction spectra in the visible near-UV: Toward an optical speciation according to constituents and structure, J. Aerosol Sci. 101, 118–32, https://doi.org/10.1016/j.jaerosci.2016.08.001, 2016.
Bischof, O. F., Weber, P., Bundke, U., Petzold, A., and Kiendler-Scharr, A.: Characterization of the Miniaturized Inverted Flame Burner as a Combustion Source to Generate a Nanoparticle Calibration Aerosol, Emission Contr. Sci. Technol., 6, 37–46, https://doi.org/10.1007/s40825-019-00147-w, 2019.
Bond, T. C. and Bergstrom, R. W.: Light Absorption by Carbonaceous Particles: An Investigative Review, Aerosol Sci. Tech., 40, 27–67, https://doi.org/10.1080/02786820500421521, 2006.
Bond, T. C., Covert, D. S., and Müller, T.: Truncation and Angular-Scattering Corrections for Absorbing Aerosol in the TSI 3563 Nephelometer, Aerosol Sci. Tech., 43, 866–871, https://doi.org/10.1080/02786820902998373, 2009.
Bond, T. C., Doherty, S. J., Fahey, D. W., Forster, P. M., Berntsen, T., DeAngelo, B. J., Flanner, M. G., Ghan, S., Kärcher, B., Koch, D., Kinne, S., Kondo, Y., Quinn, P. K., Sarofim, M. C., Schultz, M. G., Schulz, M., Venkataraman, C., Zhang, H., Zhang, S., Bellouin, N., Guttikunda, S. K., Hopke, P. K., Jacobson, M. Z., Kaiser, J. W., Klimont, Z., Lohmann, U., Schwarz, J. P., Shindell, D., Storelvmo, T., Warren, S. G., and Zender, C. S.: Bounding the role of black carbon in the climate system: A scientific assessment, J. Geophys. Res.-Atmos., 118, 5380–5552, https://doi.org/10.1002/jgrd.50171, 2013.
Caponi, L., Formenti, P., Massabó, D., Di Biagio, C., Cazaunau, M., Pangui, E., Chevaillier, S., Landrot, G., Andreae, M. O., Kandler, K., Piketh, S., Saeed, T., Seibert, D., Williams, E., Balkanski, Y., Prati, P., and Doussin, J.-F.: Spectral- and size-resolved mass absorption efficiency of mineral dust aerosols in the shortwave spectrum: a simulation chamber study, Atmos. Chem. Phys., 17, 7175–7191, https://doi.org/10.5194/acp-17-7175-2017, 2017.
Cassee, F. R., Héroux, M. E., Gerlofs-Nijland, M. E., and Kelly, F. J.: Particulate matter beyond mass: Recent health evidence on the role of fractions, chemical constituents and sources of emission, Inhal. Toxicol., 25, 802–812, https://doi.org/10.3109/08958378.2013.850127, 2013.
Chakrabarty, R. K., Moosmüller, H., Garro, M. A., and Stipe, C. B.: Observation of Superaggregates from a Reversed Gravity Low-Sooting Flame, Aerosol Sci. Tech., 46, i–iii, https://doi.org/10.1080/02786826.2011.608389, 2012.
Cross, E. S., Onasch, T. B., Ahern, A., Wrobel, W., Slowik, J. G., Olfert, J., Lack, D., Massoli, P., Cappa, C. D., Schwarz, J., Spackman, J., Fahey, D., Sedlacek, A., Trimborn, A., Jayne, J., Freedman, A., Williams, L., Ng, N., Mazzoleni, C., and Davidovcits, P.: Soot particle studies-instrument inter-comparison-project overview, Aerosol Sci. Tech., 44, 592–611, https://doi.org/10.1080/02786826.2010.482113, 2010.
Danelli, S. G., Brunoldi, M., Massabò, D., Parodi, F., Vernocchi, V., and Prati, P.: Comparative characterization of the performance of bio-aerosol nebulizers in connection with atmospheric simulation chambers, Atmos. Meas. Tech., 14, 4461–4470, https://doi.org/10.5194/amt-14-4461-2021, 2021.
Durdina, L., Lobo, P., Trueblood, M. B., Black, E. A., Achterberg, S., Hagen, D. E., Brem, B. T., and Wang, J.: Response of real-time black carbon mass instruments to mini-CAST soot, Aerosol Sci. Tech., 50, 906–918, https://doi.org/10.1080/02786826.2016.1204423, 2016.
Filep, Á., Ajtai, T., Utry, N., Pintér, M. D., Nyilas, T., Takács, S., Máté, Z., Gelencsér, A., Hoffer, A., Schnaiter, M., Bozóki, Z., and Szabó, G.: Absorption spectrum of ambient aerosol and its correlation with size distribution in specific atmospheric conditions after a red mud accident, Aerosol Air Qual. Res., 13, 49–59, 2013.
Finlayson-Pitts, B. J. and Pitts Jr., J. N.: Chemistry of the upper and lower atmosphere: Theory, experiments and applications, Academic Press, San Diego, CA, ISBN 978-0-12-257060-5, 2000.
Gan, W. Q., Koehoorn, M., Davies, H. W., Demers, P. A., Tamburic, L., and Brauer, M.: Long-term exposure to traffic-related air pollution and the risk of coronary heart disease hospitalization and mortality, Environ. Health Persp., 119, 501–507, https://doi.org/10.1289/ehp.1002511, 2011.
Ghazi, R. and Olfert, J. S.: Coating mass dependence of soot aggregate restructuring due to coatings of oleic acid and dioctyl sebacate, Aerosol Sci. Tech., 47, 192–200, https://doi.org/10.1080/02786826.2012.741273, 2013.
Ghazi, R., Tjong, H., Soewono, A., Rogak, S. N., and Olfert, J. S.: Mass, mobility, volatility, and morphology of soot particles generated by a McKenna and inverted burner, Aerosol Sci. Tech., 47, 395–405, https://doi.org/10.1080/02786826.2012.755259, 2013.
Harrison, R. M., Beddows, D. C. S., Jones A. M., Calvo A., Alves C., and Pio C.: An evaluation of some issues regarding the use of aethalometers to measure woodsmoke concentrations, Atmos. Environ., 80, 540–548, 2013.
Henning, S., Ziese, M., Kiselev, A., Saathoff, H., Möhler, O., Mentel, T. F., Buchholz, A., Spindler, C., Michaud, V., Monier, M., Sellegri, K., and Stratmann, F.: Hygroscopic growth and droplet activation of soot particles: uncoated, succinic or sulfuric acid coated, Atmos. Chem. Phys., 12, 4525–4537, https://doi.org/10.5194/acp-12-4525-2012, 2012.
Hu, D., Alfarra, M. R., Szpek, K., Langridge, J. M., Cotterell, M. I., Belcher, C., Rule, I., Liu, Z., Yu, C., Shao, Y., Voliotis, A., Du, M., Smith, B., Smallwood, G., Lobo, P., Liu, D., Haywood, J. M., Coe, H., and Allan, J. D.: Physical and chemical properties of black carbon and organic matter from different combustion and photochemical sources using aerodynamic aerosol classification, Atmos. Chem. Phys., 21, 16161–16182, https://doi.org/10.5194/acp-21-16161-2021, 2021.
Janssen, N., Gerlofs-Nijland, M., Lanki, T., Salonen, R., Cassee, F., Hoek, G., Fischer, P., Brunekreef, B., and Krzyzanowski, M.: Health effects of black carbon, Res. Rep., World Health Organization, Regional Office for Europe, Copenhagen, Denmark, ISBN 978 92 89002653, 2012.
Kazemimanesh, M., Moallemi, A., Thomson, K., Smallwood, G., Lobo, P., and Olfert, J. S.: A novel miniature inverted-flame burner for the generation of soot nanoparticles, Aerosol Sci. Tech., 53, 184–195, https://doi.org/10.1080/02786826.2018.1556774, 2019.
Kirchstetter, T. W. and Novakov, T.: Controlled generation of black carbon particles from a diffusion flame and applications in evaluating black carbon measurement methods, J. Atmos. Env., 41, 1874–1888, https://doi.org/10.1016/j.atmosenv.2006.10.067, 2007.
Kirchstetter, T. W., Novakok, T., and Hobbs, P. V.: Evidence that the spectral dependence of light absorption by aerosols is affected by organic carbon, J. Geophys. Res., 109, D21208, https://doi.org/10.1029/2004JD004999, 2004.
Kumar, N. K., Corbin, J. C., Bruns, E. A., Massabó, D., Slowik, J. G., Drinovec, L., Močnik, G., Prati, P., Vlachou, A., Baltensperger, U., Gysel, M., El-Haddad, I., and Prévôt, A. S. H.: Production of particulate brown carbon during atmospheric aging of residential wood-burning emissions, Atmos. Chem. Phys., 18, 17843–17861, https://doi.org/10.5194/acp-18-17843-2018, 2018.
Lack, D. A. and Langridge, J. M.: On the attribution of black and brown carbon light absorption using the Ångström exponent, Atmos. Chem. Phys., 13, 10535–10543, https://doi.org/10.5194/acp-13-10535-2013, 2013.
Lack, D. A., Langridge, J. M., Bahreini, R., Cappa, C. D., Middlebrook, A. M., and Schwarz, J. P.: Brown carbon and internal mixing in biomass burning particles, P. Natl. Acad. Sci. USA, 109, 14802–14807, 2012.
Lelieveld, J., Evans, J. S., Fnais, M., Giannadaki, D., and Pozzer, A.: The contribution of outdoor air pollution sources to premature mortality on a global scale, Nature 525, 367–371, https://doi.org/10.1038/nature15371, 2015.
Lewis, K., Arnott, W. P., Moosmüller, H., and Wold, C. E.: Strong spectral variation of biomass smoke light absorption and single scattering albedo observed with a novel dual-wavelength photoacoustic instrument, J. Geophys. Res., 113, D16203, https://doi.org/10.1029/2007JD009699, 2008.
Mamakos, A., Khalek, I., Giannelli, R., and Spears, M.: Characterization of Combustion Aerosol Produced by a Mini-CAST and Treated in a Catalytic Stripper, Aerosol Sci. Tech., 47, 927–936, https://doi.org/10.1080/02786826.2013.802762, 2013.
Massabò, D. and Prati P.: An overview of optical and thermal methods for the characterization of carbonaceous aerosol, Riv. Nuovo Cimento, 44, 145–192, https://doi.org/10.1007/s40766-021-00017-8, 2021.
Massabò, D., Bernardoni, V., Bove, M., Brunengo, A., Cuccia, E., Piazzalunga, A., Prati, P., Valli, G., and Vecchi, R.: A multi-wavelength optical set-up for the characterization of carbonaceous particulate matter, J. Aerosol Sci., 60, 34–46, https://doi.org/10.1016/j.jaerosci.2013.02.006, 2013.
Massabò, D., Caponi, L., Bernardoni, V., Bove, M. C., Brotto, P., Calzolai, G., Cassola, F., Chiari, M., Fedi, M. E., Fermo, P., Giannoni, M., Lucarelli, F., Nava, S., Piazzalunga, A., Valli, G., Vecchi, R., and Prati, P.: Multi-wavelength optical determination of black and brown carbon in atmospheric aerosols, Atmos. Environ., 108, 1–12, 2015.
Massabò, D., Caponi, L., Bove, M. C., and Prati, P.: Brown carbon and thermal-optical analysis: a correction based on optical multiwavelength apportionment of atmospheric aerosols, Atmos. Environ., 125, 119–125, https://doi.org/10.1016/j.atmosenv.2015.11.011, 2016.
Massabò, D., Danelli, S. G., Brotto, P., Comite, A., Costa, C., Di Cesare, A., Doussin, J. F., Ferraro, F., Formenti, P., Gatta, E., Negretti, L., Oliva, M., Parodi, F., Vezzulli, L., and Prati, P.: ChAMBRe: a new atmospheric simulation chamber for aerosol modelling and bio-aerosol research, Atmos. Meas. Tech., 11, 5885–5900, https://doi.org/10.5194/amt-11-5885-2018, 2018.
Massabò, D., Altomari, A., Vernocchi, V., and Prati, P.: Two-wavelength thermal–optical determination of light-absorbing carbon in atmospheric aerosols, Atmos. Meas. Tech., 12, 3173–3182, https://doi.org/10.5194/amt-12-3173-2019, 2019.
Massabò, D., Prati, P., Canepa, E., Bastianini, M., Van Eijk, A. M. J., Missamou, T., and Piazzola, J.: Characterization of carbonaceous aerosols over the Northern Adriatic Sea in the JERICO-NEXT project framework, Atmos. Environ., 228, 117449, https://doi.org/10.1016/j.atmosenv.2020.117449, 2020.
Menon, S., Hansen, J., Nazarenko, L., and Luo, Y.: Climate effects of black carbon aerosols in China and India, Science, 297, 2250–2253, https://doi.org/10.1126/science.1075159, 2002.
Moallemi, A., Kazemimanesh, M., Corbin, J. C., Thomson, K., Smallwood, G., Olfert, J. S., and Lobo, P.: Characterization of black carbon particles generated by a propane-fueled miniature inverted soot generator, J. Aerosol Sci., 135, 46–57, https://doi.org/10.1016/j.jaerosci.2019.05.004, 2019.
Modini, R. L., Corbin, J. C., Brem, B. T., Irwin, M., Bertò, M., Pileci, R. E., Fetfatzis, P., Eleftheriadis, K., Henzing, B., Moerman, M. M., Liu, F., Müller, T., and Gysel-Beer, M.: Detailed characterization of the CAPS single-scattering albedo monitor (CAPS PMssa) as a field-deployable instrument for measuring aerosol light absorption with the extinction-minus-scattering method, Atmos. Meas. Tech., 14, 819–851, https://doi.org/10.5194/amt-14-819-2021, 2021.
Moore, R. H., Ziemba, L. D., Dutcher, D., Beyersdorf, A. J., Chan, K., Crumeyrolle, S., Raymond, T. M., Thornhill, K. L., Winstead, E. L., and Anderson, B. E.: Mapping the Operation of the Miniature Combustion Aerosol Standard (Mini-CAST) Soot Generator, Aerosol Sci. Tech., 48, 467–479, https://doi.org/10.1080/02786826.2014.890694, 2014.
Moosmüller, H., Chakrabarty, R. K., Ehlers, K. M., and Arnott, W. P.: Absorption Ångström coefficient, brown carbon, and aerosols: basic concepts, bulk matter, and spherical particles, Atmos. Chem. Phys., 11, 1217–1225, https://doi.org/10.5194/acp-11-1217-2011, 2011.
Moschos, V., Gysel-Beer, M., Modini, R. L., Corbin, J. C., Massabò, D., Costa, C., Danelli, S. G., Vlachou, A., Daellenbach, K. R., Szidat, S., Prati, P., Prévôt, A. S. H., Baltensperger, U., and El Haddad, I.: Source-specific light absorption by carbonaceous components in the complex aerosol matrix from yearly filter-based measurements, Atmos. Chem. Phys., 21, 12809–12833, https://doi.org/10.5194/acp-21-12809-2021, 2021.
Nemmar, A., Hoet, P. H. M., Vanquickenborne, B., Dinsdale, D., Thomeer, M., Hoylaerts, M. F., Vanbilloen, H., Mortelmans, L., and Nemery, B.: Passage of inhaled particles into the blood circulation in humans, Circulation, 105, 411–414, https://doi.org/10.1161/hc0402.104118, 2002.
Nienow, A. M. and Roberts, J. T.: Heterogeneous Chemistry of Carbon Aerosols, Annu. Rev. Phys. Chem., 57, 105–128, https://doi.org/10.1146/annurev.physchem.57.032905.104525, 2006.
NIOSH: Method 5040 Issue 3: Elemental Carbon (Diesel Exhaust), in: NIOSH Manual of Analytical Methods, National Institute of Occupational Safety and Health, Cincinnati, OH, https://www.cdc.gov/niosh/docs/2003-154/pdfs/5040f3.pdf (last access: 4 April 2022), 1999.
Nordmann, S., Birmili, W., Weinhold, K., Müller, K., Spindler, G., and Wiedensohler, A.: Measurements of the mass absorption cross section of atmospheric soot particles using Raman spectroscopy, J. Geophys. Res.-Atmos., 118, 12075–12085, https://doi.org/10.1002/2013JD020021, 2013.
Oberdörster, G., Oberdörster, E., and Oberdörster, J.: Nanotoxicology: An Emerging Discipline Evolving from Studies of Ultrafine Particles, Environ. Health Persp., 113, 823–839, https://doi.org/10.1289/ehp.7339, 2005.
Onasch, T. B., Trimborn, A., Fortner, E. C., Jayne, J. T., Kok, G. L., Williams, L. R., Davidovits, P., and Worsnop, D. R.: Soot particle aerosol mass spectrometer: Development, validation, and initial application, Aerosol Sci. Tech., 46, 804–817, https://doi.org/10.1080/02786826.2012,663948, 2012.
Pagels, J., Khalizov, A. F., McMurry, P. H., and Zhang, R. Y.: Processing of soot by controlled sulphuric acid and water condensation – Mass and mobility relationship, Aerosol Sci. Tech., 43, 629–640, https://doi.org/10.1080/02786820902810685, 2009.
Petzold, A., Ogren, J. A., Fiebig, M., Laj, P., Li, S.-M., Baltensperger, U., Holzer-Popp, T., Kinne, S., Pappalardo, G., Sugimoto, N., Wehrli, C., Wiedensohler, A., and Zhang, X.-Y.: Recommendations for reporting “black carbon” measurements, Atmos. Chem. Phys., 13, 8365–8379, https://doi.org/10.5194/acp-13-8365-2013, 2013.
Pope, C. A., Burnett, R. T., Thun, M. J., Calle, E. E., Krewski, D., Ito, K., and Thurston, G. D.: Lung Cancer, Cardiopulmonary Mortality, and Long-term Exposure to Fine Particulate Air Pollution, J. Am. Med. Assoc., 287, 1132–1141, 2002.
Quinn, P. K., Bates, T. S., Baum, E., Doubleday, N., Fiore, A. M., Flanner, M., Fridlind, A., Garrett, T. J., Koch, D., Menon, S., Shindell, D., Stohl, A., and Warren, S. G.: Short-lived pollutants in the Arctic: their climate impact and possible mitigation strategies, Atmos. Chem. Phys., 8, 1723–1735, https://doi.org/10.5194/acp-8-1723-2008, 2008.
Ramanathan, V. and Carmichael, G.: Global and regional climate changes due to black carbon, Nat. Geosci., 1, 221–227, https://doi.org/10.1038/ngeo156, 2008.
Saturno, J., Pöhlker, C., Massabò, D., Brito, J., Carbone, S., Cheng, Y., Chi, X., Ditas, F., Hrabě de Angelis, I., Morán-Zuloaga, D., Pöhlker, M. L., Rizzo, L. V., Walter, D., Wang, Q., Artaxo, P., Prati, P., and Andreae, M. O.: Comparison of different Aethalometer correction schemes and a reference multi-wavelength absorption technique for ambient aerosol data, Atmos. Meas. Tech., 10, 2837–2850, https://doi.org/10.5194/amt-10-2837-2017, 2017.
Scerri, M. M., Kandler, K., Weinbruch, S., Yubero, E., Galindo N., Prati, P., Caponi, L., and Massabò, D.: Estimation of the contributions of the sources driving PM2.5 levels in a Central Mediterranean coastal town, Chemosphere, 211, 465–481, https://doi.org/10.1016/j.chemosphere.2018.07.104, 2018.
Skiles, S. M., Flanner, M., Cook, J. M., Dumont, M., and Painter, T. H.: Radiative forcing by light-absorbing particles in snow, Nat. Clim. Change, 8, 964–971, https://doi.org/10.1038/s41558-018-0296-5, 2018.
Stipe, C. B., Higgins, B. S., Lucas, D., Koshland, C. P., and Sawyer, R. F.: Inverted co-flow diffusion flame for producing soot, Rev. Sci. Instrum., 76, 023908, https://doi.org/10.1063/1.1851492, 2005.
Utry, N., Ajtai, T., Filep, Á., Dániel P. M., Hoffer, A., Bozoki, Z., and Szabó, G.: Mass specific optical absorption coefficient of HULIS aerosol measured by a four-wavelength photoacoustic spectrometer at NIR, VIS and UV wavelengths, Atmos. Environ., 69, 321–324, 2013.
Utry, N., Ajtai, T., Filep, Á., Pintér, M., Török, Z., Bozóki, Z., and Szabó, G.: Correlations between absorption Angström exponent (AAE) of wintertime ambient urban aerosol and its physical and chemical properties, Atmos. Environ., 91, 52–59, 2014a.
Utry, N., Ajtai, T., Pinter, M., Bozóki, Z., and Szabó, G.: Wavelength-dependent optical absorption properties of artificial and atmospheric aerosol measured by a multiwavelength photoacoustic spectrometer, Int. J. Thermophys., 35, 2246–2258, https://doi.org/10.1007/s10765-014-1746-6, 2014b.
Vernocchi, V., Prati, P., and Massabò, D.: Research Data for Manuscript amt-2021-345, Environmental Physics Laboratory, University of Genoa, https://labfisa.ge.infn.it/index.php/data-repository?view=document&id=10:research-data-for-manuscript-amt-2021-346&catid=10, last access: 6 April 2022.
von der Weiden, S.-L., Drewnick, F., and Borrmann, S.: Particle Loss Calculator – a new software tool for the assessment of the performance of aerosol inlet systems, Atmos. Meas. Tech., 2, 479–494, https://doi.org/10.5194/amt-2-479-2009, 2009.
Weijers, E. P., Schaap, M., Nguyen, L., Matthijsen, J., Denier van der Gon, H. A. C., ten Brink, H. M., and Hoogerbrugge, R.: Anthropogenic and natural constituents in particulate matter in the Netherlands, Atmos. Chem. Phys., 11, 2281–2294, https://doi.org/10.5194/acp-11-2281-2011, 2011.
Zhang, R., Khalizov, A. F., Pagels, J., Zhang, D., Xue, H., and McMurry, P. H.: Variability in morphology, hygroscopicity, and optical properties of soot aerosols during atmospheric processing, P. Natl. Acad. Sci. USA, 105, 10291–1096, https://doi.org/10.1073/pnas.0804860105, 2008.