the Creative Commons Attribution 4.0 License.
the Creative Commons Attribution 4.0 License.
 | 28 Apr 2022
Improved ozone monitoring by ground-based FTIR spectrometry
Esther Sanromá
Matthias Schneider
Frank Hase
Sergio Fabián León-Luis
Thomas Blumenstock
Eliezer Sepúlveda
Alberto Redondas
Virgilio Carreño
Carlos Torres
Natalia Prats
Accurate observations of atmospheric ozone (O3) are essential to monitor in detail its key role in atmospheric chemistry. The present paper examines the performance of different O3 retrieval strategies from FTIR (Fourier transform infrared) spectrometry by using the 20-year time series of the high-resolution solar spectra acquired from 1999 to 2018 at the subtropical Izaña Observatory (IZO, Spain) within NDACC (Network for the Detection of Atmospheric Composition Change). In particular, the effects of two of the most influential factors have been investigated: the inclusion of a simultaneous atmospheric temperature profile fit and the spectral O3 absorption lines used for the retrievals (the broad spectral region of 1000–1005 cm−1 and single micro-windows between 991 and 1014 cm−1). Additionally, the water vapour (H2O) interference in O3 retrievals has been evaluated, with the aim of providing an improved O3 strategy that minimises its impact and, therefore, could be applied at any NDACC FTIR station under different humidity conditions. The theoretical and experimental quality assessments of the different FTIR O3 products (total column (TC) amounts and volume mixing ratio (VMR) profiles) provide consistent results. Combining a simultaneous temperature retrieval with the optimal selection of single O3 micro-windows results in superior FTIR O3 products, with a precision of better than 0.6 %–0.7 % for O3 TCs as compared to coincident NDACC Brewer observations taken as a reference. However, this improvement can only be achieved provided the FTIR spectrometer is properly characterised and stable over time. For unstable instruments, the temperature fit is found to exhibit a strong negative influence on O3 retrievals due to the increase in the cross-interference between the temperature retrieval and instrumental performance (given by the instrumental line shape function and measurement noise), which leads to a worsening of the precision of FTIR O3 TCs of up to 2 %. This cross-interference becomes especially noticeable beyond the upper troposphere/lower stratosphere, as documented theoretically as well as experimentally by comparing FTIR O3 profiles to those measured using electrochemical concentration cell (ECC) sondes within NDACC. Consequently, it should be taken into account for the reliable monitoring of the O3 vertical distribution, especially over long-term timescales.
- Article
(4759 KB) - Full-text XML
- BibTeX
- EndNote


Monitoring atmospheric composition is crucial for understanding the present climate and foreseeing possible future changes, and is, therefore, the basis for the design and implementation of efficient climate-change mitigation and adaptation policies. Among the atmospheric gases with important climate effects, ozone (O3) plays a vital role in atmospheric chemistry. In the stratosphere, it absorbs a large part of the biologically damaging ultraviolet sunlight, allowing only a small amount to reach the earth's surface. Likewise, absorption of the ultraviolet radiation heats, stratifies, and determines the vertical stability of the middle atmosphere. In the troposphere, O3 absorbs infrared radiation, acting as an important greenhouse gas; it affects the oxidising capacity of the atmosphere; and it is a phytotoxicant that is harmful to public health (Cuevas et al., 2013; WMO, 2014a, 2018; Gaudel et al., 2018, and references therein).
Stratospheric O3 abundances have shown a significant decrease in global levels from the 1980s to the 1990s, mainly attributable to the increase in anthropogenic emissions of ozone-depleting substances (ODSs) during that period (WMO, 2014a, 2018). The implementation of the 1987 Montreal Protocol and its amendments and adjustments has stopped global O3 decay by controlling ODS emissions: O3 concentrations have approximately stabilised since stratospheric ODS abundances reached their maximum at the end of the 1990s. As a result, the global O3 content is expected to slowly increase and return to pre-1980 levels during the 21st century (e.g. Weatherhead et al., 2000; Austin and Butchart, 2003; Eyring et al., 2010; WMO, 2014a, 2018). However, O3 concentrations are affected not only by the presence of ODSs, but also by a wide variety of factors (increases in greenhouse gas concentrations, changes in the Brewer–Dobson circulation and stratospheric temperatures, etc.), making it very challenging to predict how, when, and where the O3 recovery will take place. In the troposphere, since O3 is highly variable (depending on time period, region, and proximity to fresh O3 precursor emissions), there is no consistent picture of O3 tropospheric changes around the world (Steinbrecht et al., 2017; Gaudel et al., 2018; WMO, 2018). Hence, high-quality and long-term O3 measurements are essential for further improving our understanding of the O3 response to natural and anthropogenic forcings, as well as to estimate consistent trends at a global scale (Vigouroux et al., 2015; Gaudel et al., 2018; GCOS, 2021).
Within NDACC (Network for the Detection of Atmospheric Composition Change, http://www.ndaccdemo.org, last access: 31 March 2022), high-resolution solar absorption infrared spectra have been continuously recorded since the 1990s by ground-based FTIR (Fourier transform infrared) spectrometers distributed at a global scale. By analysing the measured spectra, these instruments are currently capable of providing both high-quality O3 total column (TC) amounts and low-resolution O3 vertical volume mixing ratio (VMR) profiles at about 20 sites (e.g. Barret et al., 2002; Schneider and Hase, 2008; Schneider et al., 2008a, b; Vigouroux et al., 2008; Viatte et al., 2011; García et al., 2012, 2014; Vigouroux et al., 2015, and references therein). In recent years, the NDACC Infrared Working Group (IRWG, http://www2.acom.ucar.edu/irwg, last access: 31 March 2022) has made considerable efforts to standardise the data acquisition protocols and inversion strategies used to derive O3 concentrations at the different NDACC stations and, hence, produce uniform and consistent O3 datasets (Hase et al., 2004; IRWG, 2014; Vigouroux et al., 2015). Nonetheless, scientific discussions seeking improvements in O3 monitoring and network-wide consistency are ongoing.
In this context, the present paper examines the effect of using different retrieval approaches on the quality of the FTIR O3 products, with the aim of providing an improved O3 strategy that could be applied at any NDACC FTIR station. The influences of two of the most important settings are assessed: the spectral region used for O3 retrievals and the simultaneous fitting of the atmospheric temperature profile. To our knowledge, so far, such analysis has been approached separately in most of the studies present in the literature, or has not been addressed in detail yet. Previous studies have shown, for example, that optimised selection of the O3 absorption lines or the inclusion of an additional temperature fitting significantly improves the precision of FTIR O3 TCs and VMR profiles (e.g. Schneider and Hase, 2008; Schneider et al., 2008b; García et al., 2012, 2014). Nonetheless, possible combined effects were not analysed by those works.
The analysis was performed at the O3 super-site of Izaña Observatory (IZO), where ground-based FTIR observations have been carried out coincidentally with other high-quality O3 measurement techniques since 1999. By using those data, a comprehensive assessment of the precision and long-term consistency of new O3 retrieval strategies from ground-based FTIR spectrometry can be carried out. To this end, the current paper is structured as follows. Section 2 describes the Izaña Observatory, FTIR measurements, and ancillary data considered to assess the quality of the new FTIR O3 products (Brewer TC observations and electrochemical concentration cell (ECC) vertical sondes). Section 3 presents the different FTIR O3 retrieval strategies and their theoretical characterisation in terms of vertical sensitivity and expected uncertainty. Section 4 examines the quality and long-term reliability of the different FTIR O3 TCs and VMR profiles by comparing them to the independent O3 datasets. Finally, Sect. 5 summarises the main results and conclusions drawn from this work.
Izaña Observatory is a high-mountain station located on the island of Tenerife (Spain) in the subtropical North Atlantic Ocean (28.3∘ N, 16.5∘ W) at an altitude of 2370 m a.s.l. The observatory is managed by the Izaña Atmospheric Research Centre (IARC, https://izana.aemet.es, last access: 31 March 2022), which belongs to the State Meteorological Agency of Spain (AEMet, https://www.aemet.es, last access: 31 March 2022). IZO is located below the descending branch of the northern subtropical Hadley cell, under a quasi-permanent subsidence regime, and typically above a stable trade wind inversion layer that acts as a natural barrier for local and regional pollution. This strategic location ensures clean air and clear-sky conditions during most of the year, making IZO an excellent station for in situ and remote-sensing observations (Cuevas et al., 2020, and references therein).
For many years, IZO has run a comprehensive O3 monitoring programme by using different measurement techniques: FTIR, Brewer, and DOAS (differential optical absorption spectroscopy) spectrometers, as well as ECC O3 sondes and in situ ultraviolet photometric analysers. The first four techniques routinely contribute to NDACC, with the aim being to monitoring changes in the troposphere and stratosphere with an emphasis on the long-term evolution of the O3 layer, while the in situ O3 records are taken in the framework of the WMO/GAW (World Meteorological Organization/Global Atmospheric Watch) programme. Please refer to Cuevas et al. (2020) for more details about IZO and its atmospheric monitoring programmes.
2.1 FTIR measurements
The IZO FTIR programme has been gathering high-resolution solar spectra within NDACC since 1999, when a Bruker IFS 120M spectrometer was installed due to a collaborative agreement between the IMK-ASF (Institute of Meteorology and Climate Research–Atmospheric Trace Gases and Remote Sensing of Karlsruhe Institute of Technology, KIT, https://www.kit.edu, last access: 31 March 2022) and AEMet-IARC. In 2005, this instrument was replaced with an upgraded model, the Bruker IFS 120/5HR, which is one of the best-performing FTIR spectrometers commercially available. For the present study, the measurements taken from 1999 to 2018, encompassing the operation of the two FTIR instruments, have been used.
Among the activities of NDACC, the IZO FTIR spectrometer records direct solar absorption spectra in the middle-infrared spectral region, i.e. 740–4250 cm−1 (corresponding to 13.5–2.4 µm), by using a set of different field stops, narrow-bandpass filters, and detectors. Nevertheless, for O3 retrievals, only the 960–1015 cm−1 spectral region is considered, which is measured with NDACC filter 6 using a potassium bromide (KBr) beam splitter and a cooled mercury cadmium telluride (MCT) detector. The solar spectra were taken at a high spectral resolution of 0.0036 cm−1 (250 cm maximum optical path difference, OPD, OPDmax) until April 2000, and at 0.005 cm−1 (OPD cm) subsequently. The IFS 120M's field-of-view (FOV) angle was varied between 0.17 and 0.29∘ depending on the measurement period, while it was always limited to 0.2∘ for the IFS 120/5HR. In order to increase the signal-to-noise ratio, eight single scans are co-added and thereby the acquisition of one spectrum takes about 10 min.
NDACC FTIR solar spectra are only recorded when the line of sight (LOS) between the instrument and the sun is cloud free. Given the IZO's location, cloud-free conditions are very common, and thus FTIR measurements are typically taken about two or three times a week. For the 1999–2018 period, the total number of NDACC measurement days for O3 retrievals amounts to 1975, with an annual average of ∼ 100 measurement days a year. For further details about the FTIR measurements at IZO, refer to García et al. (2021).
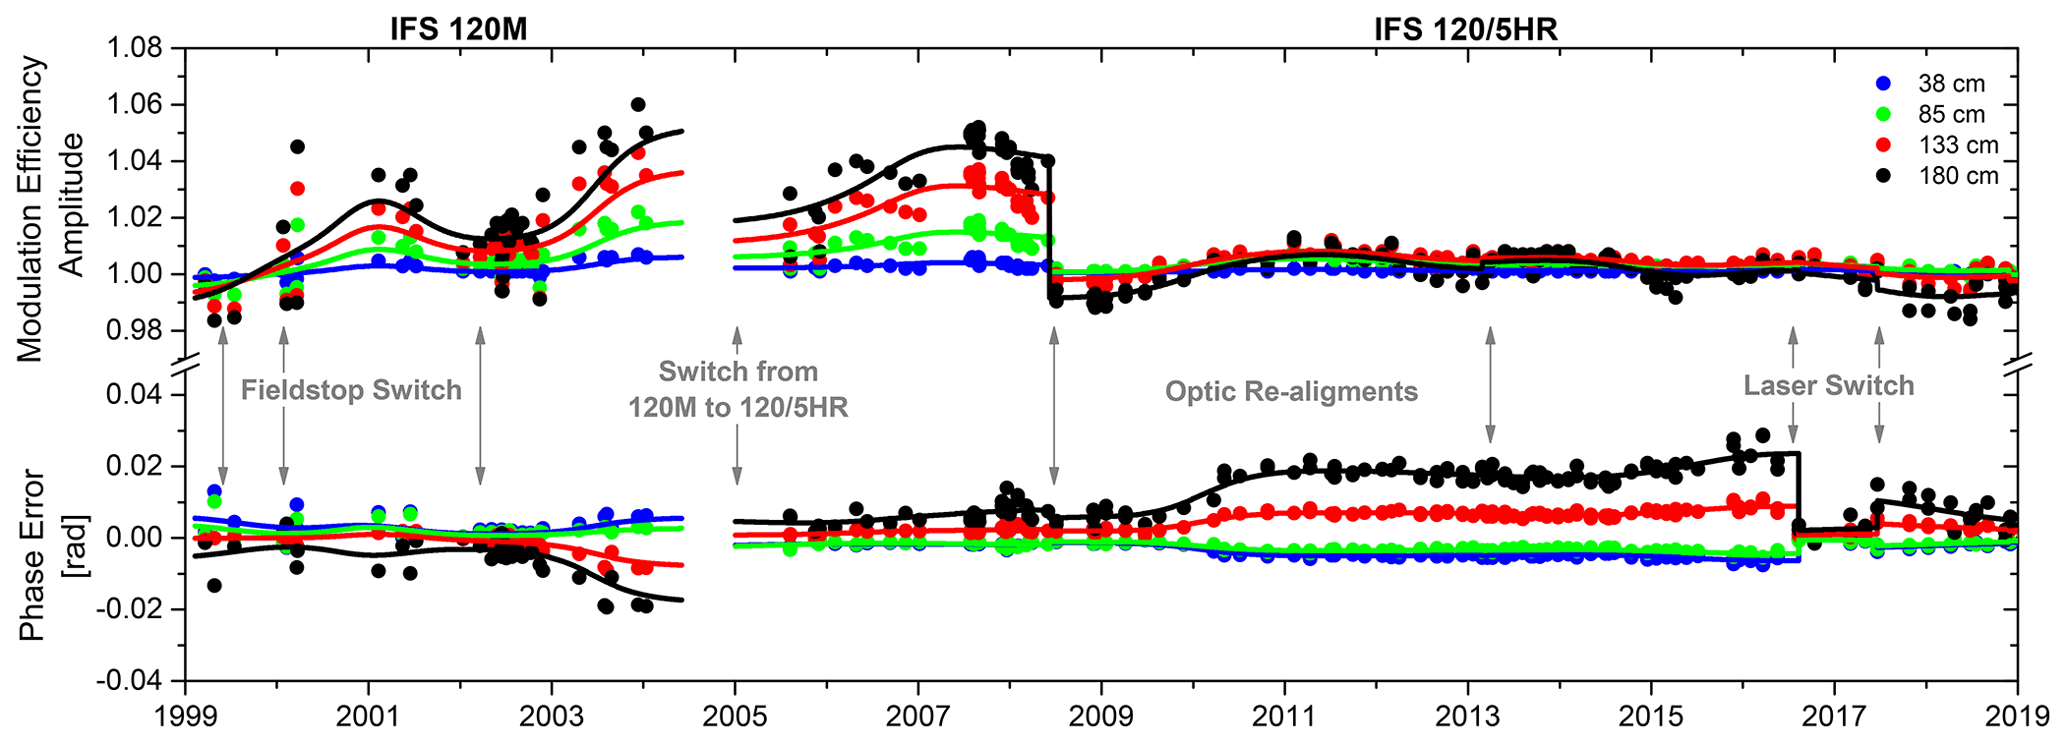
Figure 1Time series of the normalised modulation efficiency amplitude (MEA) and phase error (PE, rad) at four optical path differences (33, 85, 133, and 180 cm) for the NDACC O3 measurement settings (filter 6 and MCT detector) of the IZO FTIR spectrometers between 1999 and 2018. Data points represent individual N2O-cell measurements and solid lines depict smoothed MEA and PE curves. Solid grey arrows indicate punctual interventions for the instruments: different changes of field stops between 1999 and 2004, the switch from the IFS 120M to the IFS 120/5HR system in 2005, optic re-alignments in June 2008 and February 2013, and internal laser replacements in August 2016 and June 2017.
In order to characterise the instrumental performance of the IZO FTIR spectrometers, the instrumental line shape (ILS) function has been routinely monitored about every 2 months since 1999 using low-pressure N2O-cell measurements and LINEFIT software (v14.5), as detailed in Hase (2012). This ILS treatment ensures the independence of the FTIR trace gas retrievals and instrumental characterisation, but it also allows the instrumental alignment and its temporal stability to be verified. Figure 1 depicts the time series of the ILS's modulation efficiency amplitude (MEA) and phase error (PE) parameters between 1999 and 2018, as used for O3 retrievals. Three periods with different features affecting the IZO FTIR measurements can be distinguished: (1) during 1999–2004, although N2O-cell measurements were routinely carried out, the ILS estimation is imprecise due to the instability of the IFS 120M spectrometer; (2) during 2005–May 2008, the IFS 120/5HR instrument exhibits a gradual temporal drift, but the ILS function is properly assessed; and (3) during June 2008–2018, the IFS 120/5HR instrument is optically well-aligned (the ILS is nearly nominal). Therefore, these three periods will be independently analysed in the present work in order to examine the influence of instrument status on FTIR O3 products.
2.2 Ancillary data: Brewer and ECC sondes
At IZO, Brewer spectrometers, managed by AEMet, have been continuously operating since 1991. In 2001, these activities were accepted by NDACC and, 2 years later, the RBCC-E (Regional Brewer Calibration Centre for Europe, http://www.rbcc-e.org, last access: 31 March 2022) of the WMO/GAW programme was established at IZO. By recording direct solar absorption spectra in the ultraviolet spectral region, IZO RBCC-E reference instruments can provide O3 TCs with a total uncertainty (standard uncertainty, k=1) of 1.2 %–1.5 % (Gröbner et al., 2017). The high quality and long-term stability of IZO Brewer observations make them a useful reference for validating ground- and satellite-based instruments (León-Luis et al., 2018).
The O3 sonde programme on Tenerife, also run by AEMet, started in November 1992, and has operated since March 2001 within the framework of NDACC. The O3 sounding is based on the ECC, which senses O3 as it reacts with a dilute solution of potassium iodide (KI) to produce an electrical current proportional to the atmospheric O3 concentrations (Komhyr, 1986). ECC sondes (Scientific Pumps 5A and 6A) were launched once weekly from Santa Cruz de Tenerife station (30 km north-east of IZO, 36 m a.s.l.) until 2010 and, since then, from the Botanic Observatory (13 km north of IZO, 114 m a.s.l.). The expected total uncertainty of the ECC sondes is ±5 %–15 % in the troposphere and ±5 % in the stratosphere (WMO, 2014b), which is a composite of different instrumental error contributions (i.e. sensor and background current, conversion efficiency, etc.).
Note that for the purposes of the present work, both the Brewer and the ECC sonde databases fully cover the entire FTIR 1999–2018 period.
3.1 Ozone retrieval strategies
To analyse the influence of the spectral region and the simultaneous temperature fit on the quality of FTIR O3 products, six different approaches have been defined. They combine three spectral regions and the possibility of performing a simultaneous temperature retrieval (referred to as retrieval setups 1000, 4MWs, 5MWs, 1000T, 4MWsT, and 5MWsT hereafter; Fig. 2). Setup 1000 uses a broad spectral window covering 1000–1005 cm−1, which is the one recommended by the NDACC IRWG (IRWG, 2014). This spectral region has been traditionally used by the FTIR community when reporting high-quality O3 products (e.g. Barret et al., 2002; Schneider et al., 2008a; Vigouroux et al., 2008; Lindenmaier et al., 2010; García et al., 2012; Vigouroux et al., 2015). Setup 5MWs uses five single micro-windows between 991 and 1014 cm−1, which is a simplification of the approach suggested by Schneider and Hase (2008). Schneider et al. (2008a) found that this strategy provides more precise O3 estimations than those retrieved from the broad 1000–1005 micro-window when compared to independent measurements. Setup 4MWs is the same as 5MWs, but the micro-window at the greatest wavenumbers is discarded in order to avoid any possible saturation of the strong O3 absorption lines contained in this region, especially at high O3 concentrations and low solar elevations. Setups 1000T, 4MWsT, and 5MWsT use the same micro-windows as setups 1000, 4MWs, and 5MWs respectively, but an optimal estimation of the atmospheric temperature profile is simultaneously carried out. To this end, four CO2 micro-windows are added between 962.80 and 969.60 cm−1 according to García et al. (2012).
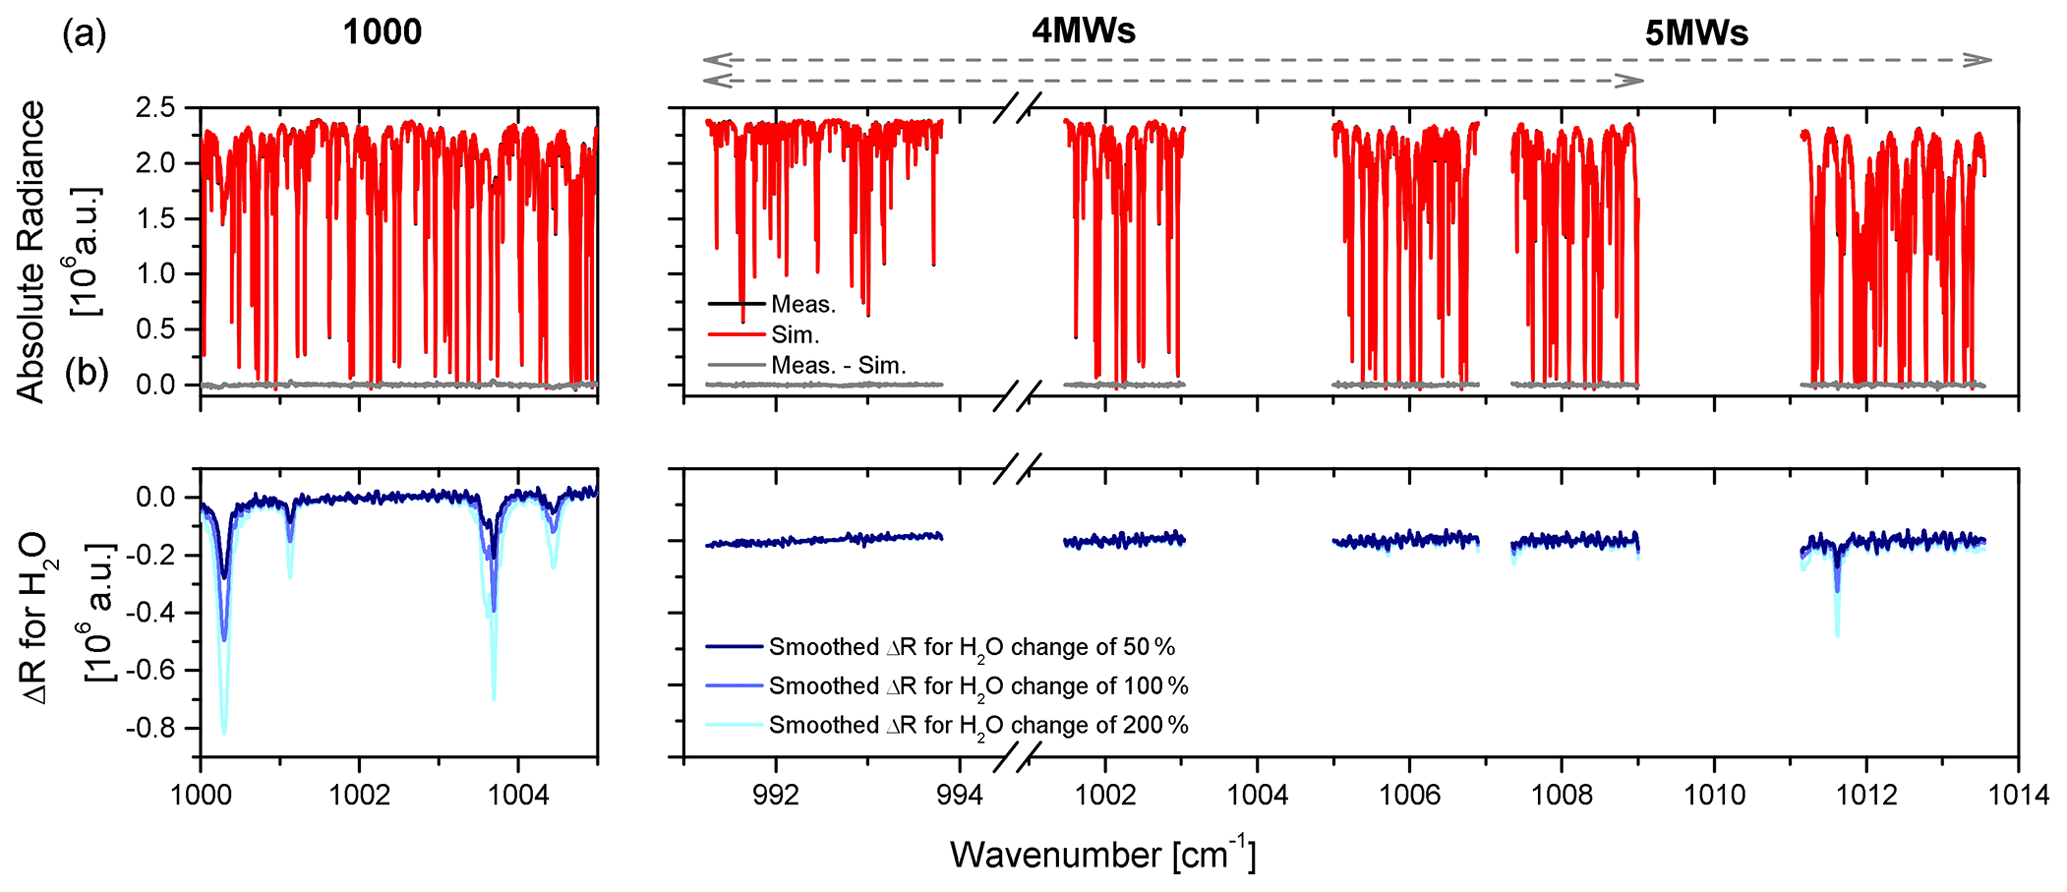
Figure 2(a) Spectral regions considered in the different FTIR O3 retrieval strategies: the broad window used in the setups 1000 and 1000T (encompassing the 1000–1005 cm−1 spectral region) and the four and five micro-windows used in the setups 4MWs/4MWsT (between ∼ 991 and 1009 cm−1) and 5MWs/5MWsT (between ∼ 991 and 1014 cm−1), respectively. Red and black lines depict, respectively, examples of the simulated and measured spectra taken on 31 August 2007 (at a solar zenith angle (SZA) of ≈ 50∘, an O3 amount in the slant column (O3 SC) of 390 DU, and an H2O TC of 10.7 mm). Grey lines show the difference between the measurement and simulation. (b) Spectral changes in the measured FTIR radiances (ΔR) due to changes in the H2O content of 50 % (TC of 16.1 mm), 100 % (TC of 21.5 mm), and 200 % (TC of 32.3 mm).
With the exception of the spectral region and temperature treatment, the retrieval strategy is identical for the six approaches. The O3 VMR profiles are derived from the measured solar absorption spectra by means of the PROFFIT code (PROFile FIT, Hase et al., 2004), using an ad hoc Tikhonov–Phillips slope constraint (TP1 constraint) on a logarithmic scale. Since O3 concentrations are very variable around the tropopause, logarithmic inversion has proved to be superior to the linear approach (e.g. Schneider and Hase, 2008; Schneider et al., 2008a, b). Then, the O3 TCs are computed by integrating the retrieved VMR profiles from the FTIR altitude up to the top of the atmosphere. The remaining settings are based on the NDACC IRWG recommendations (IRWG, 2014):
-
The interfering species considered are H2O, CO2, C2H4, and the main O3 isotopologues (666, 686, 668, 667, and 676 in HITRAN notation). Spectroscopic line parameters of these absorbers are taken from HITRAN 2008 (Rothman et al., 2009), with a 2009 update for H2O (http://www.cfa.harvard.edu, last access: 31 March 2022).
-
All setups use the same a priori gas profiles, which are taken from the climatological model WACCM (Whole Atmosphere Community Climate Model, http://waccm.acd.ucar.edu, last access: 31 March 2022) version 6, generated by the NCAR (National Center for Atmospheric Research, James Hannigan, personal communication, 2014).
-
All setups apply the actual ILS time series evaluated from independent N2O-cell measurements (Fig. 1).
-
The pressure and temperature profiles for forward simulations are taken from the NCEP (National Centers for Environmental Predictions) 12:00 UT daily database.
-
For those approaches performing a simultaneous optimal estimation of the atmospheric temperature profile, the NCEP 12:00 UT daily temperature profiles are used as the a priori profiles. The a priori temperature covariance matrix (SaT) is constructed following Schneider et al. (2008a).
Given the importance of H2O absorption across the infrared spectrum, the treatment of H2O in O3 retrievals should be carefully considered in the inversion strategy, as illustrated in Fig. 2. This figure shows an example of the changes in the FTIR radiances for the O3 spectral micro-windows due to changes in the H2O content of 50 %, 100 %, and 200 %. These values, which correspond to extreme conditions at IZO, might account for typical H2O contents and variations at sites with greater humidity. As observed, the spectral signatures of H2O variations are much stronger in the broad 1000 spectral region than in the narrow micro-windows (4MWs/5MWs), indicating that the quality of the O3 products in that region strongly depends on the correct interpretation of the spectroscopic H2O signal. Therefore, in order to minimise interference errors due to H2O, a two-step inversion strategy has been applied (García et al., 2012, 2014): firstly, the actual H2O profile is derived using a dedicated H2O retrieval (Schneider et al., 2012), and then the O3 retrieval is simultaneously performed with an H2O scaling fit, which uses the previously derived H2O state. The remaining interfering gases are simultaneously estimated with O3 in the second step. As discussed in detail in Appendix A, the H2O cross-interference is reduced by the two-step strategy when the temperature retrieval is considered, which suggests that this approach could be valid for humid FTIR sites.
Once FTIR retrievals are computed, they are filtered according to (1) the number of iterations at which the convergence is reached and (2) residuals of the simulated–measured spectrum comparison. This ensures that unstable or imprecise observations are not considered (which would likely be introduced, for example, by thin clouds) (García et al., 2016). These two quality flags are applied independently on the six O3 datasets, and only those measurements available for all setups are considered in subsequent analysis. This leads to a total of 5393 O3 observations between 1999 and 2018 that are coincident and quality filtered (∼ 90 % of the original dataset).
3.2 Theoretical quality assessment
3.2.1 Vertical sensitivity and fitting residuals
Because the vertical resolution of ground-based FTIR measurements is limited, a proper description of the relation between the retrieved and true states must be provided together with the retrieved vertical profile. This information is theoretically characterised by the averaging kernel matrix (A) obtained in the retrieval procedure (Rodgers, 2000). The rows of this matrix describe the altitude regions that mainly contribute to the retrieved profile and therefore the vertical distribution of the FTIR sensitivity, while its trace (also called the degrees of freedom for signal, DOFS) gives the number of independent O3 layers detectable by the remote-sensing FTIR instrument. As an example, Fig. 3a depicts the A rows for the 5MWs setup for the measurement of Fig. 2, while Table 1 summarises the DOFS statistics for the six retrieval strategies considered.
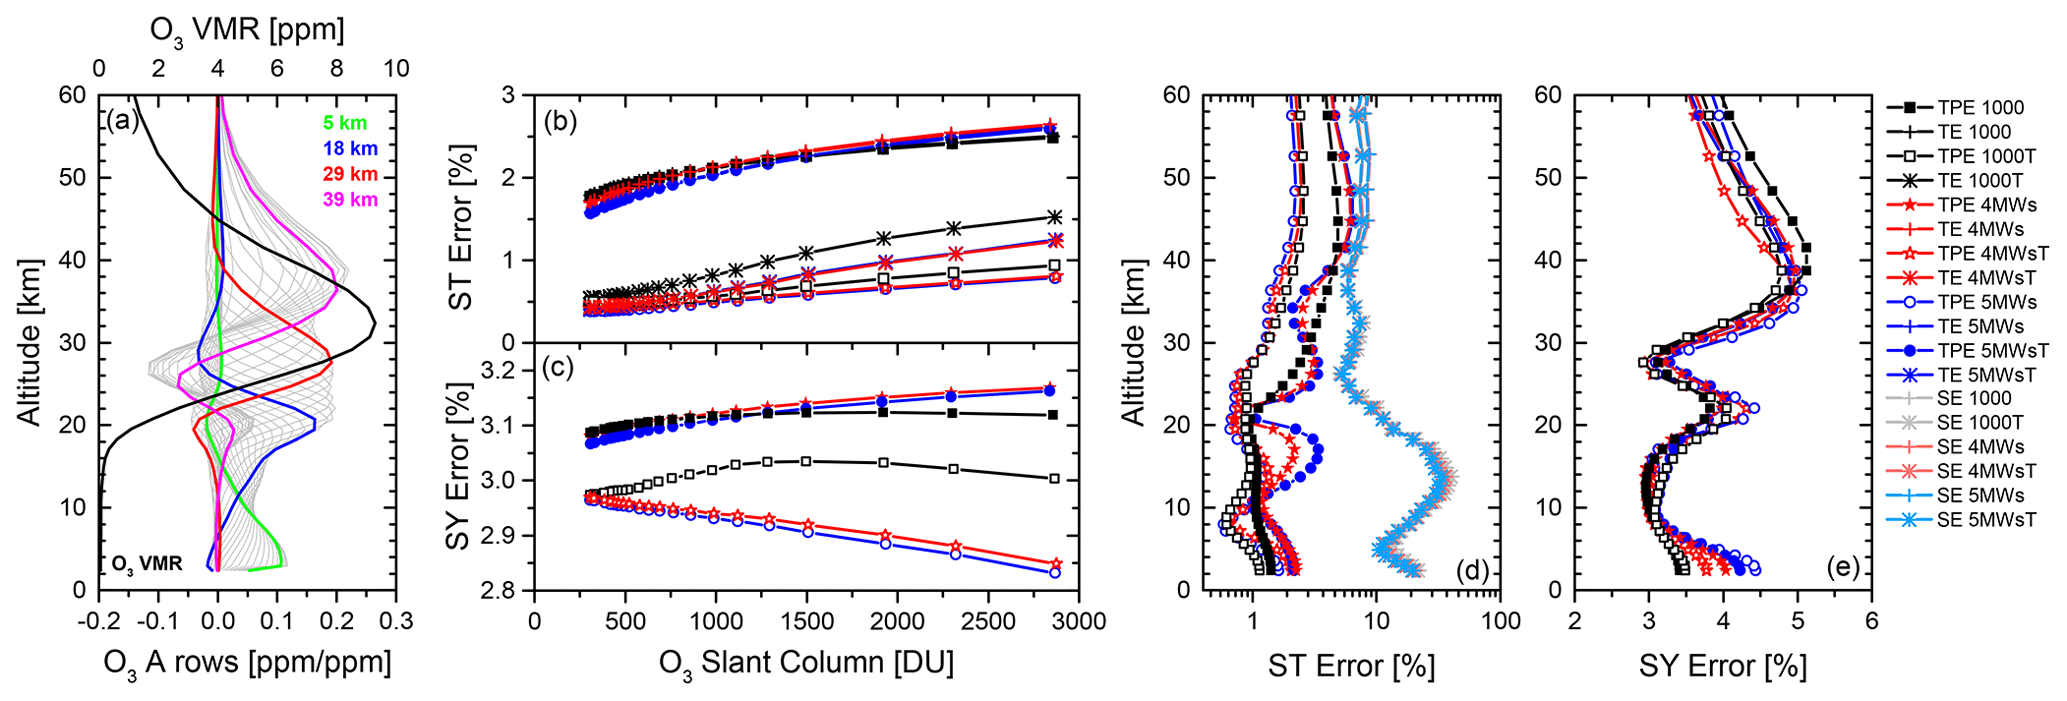
Figure 3Summary of the theoretical quality assessment. (a) Example of averaging kernel (A) rows for the 5MWs setup on a logarithmic scale for the measured spectrum of Fig. 2. Coloured lines highlight the A rows at altitudes of 5, 18, 29, and 39 km, which are representative of the four layers detectable by the FTIR instrument (total DOFS of 4.41). The retrieved O3 VMR profile is also shown. (b) Statistical (ST) and (c) systematic (SY) contributions of the total parameter error (TPE, in %) and total error (TE, in %) for O3 TCs retrieved from the setups 1000/1000T, 4MWs/4MWsT, and 5MWs/5MWsT as a function of O3 slant column (DU) for measurements taken on 31 August 2007 from SZAs between 84∘ (∼ 07:00 UT) and 21∘ (∼ 13:30 UT). TPE is computed as the square root of the quadratic sum of all ST and SY error sources considered with the exception of the smoothing error (SE), while the TE considers the TPE and SE. Examples of the ST (d) and SY (e) contributions of the TPE and SE profiles (%) for all setups for the measured spectrum of Fig. 2.
Table 1Summary of statistics of the DOFS and fitting residuals for the setups 1000/1000T, 4MWs/4MWsT, and 5MWs/5MWsT for the periods 1999–2004, 2005–May 2008, and June 2008–2018 and for the entire time series (1999–2018). Shown are the median (M) and standard deviation (σ) for each period. The number of quality-filtered measurements is 519, 745, and 4219 for the three periods, respectively, and 5393 for the whole dataset. The strategies showing the best performance, in terms of largest DOFS and smallest residuals, are highlighted in bold for each period.

The A rows are quite similar for all setups, with a median total DOFS value of ∼ 4, meaning that the FTIR system is able to roughly resolve four independent atmospheric O3 layers: the troposphere (2.37–13 km), the upper troposphere/lower stratosphere (UTLS) or tropopause region (12–23 km), the middle stratosphere around the ozone maximum (22–29 km), and the upper stratosphere (28–42 km). However, the total DOFS values are found to be greater for those setups using narrower micro-windows than for the broad spectral window (see Table 1), whereby the former configurations seem to offer better vertical sensitivity (especially the 5MWs setup). This pattern is independent of the FTIR instrument and consistent over time, as observed for the three periods analysed (1999–2004, 2005–May 2008, and June 2008–2018). The comparison between the instruments also reveals, as expected, a lower sensitivity to the O3 concentrations of the IFS 120M spectra as compared to the IFS 120/5HR measurements. Overall, the total DOFS values differ by 5.5 % (1000) and 5.1 % (5MWs) between the 1999–2004 and 2008–2018 periods, respectively. When simultaneously fitting the atmospheric temperature profile, the median DOFS values slightly decrease for all strategies because the information contained in the measured spectra is then split into O3 and temperature retrievals (the retrieved state vector space is not perfectly orthogonal). Likewise, the differences between both instruments become more accentuated (e.g. 6.6 % and 5.7 % between the 1999–2004 and 2008–2018 periods for 1000T and 5MWsT, respectively). As with the DOFS analysis, the fitting residuals are smaller for those setups that use narrow micro-windows and apply the temperature fit, allowing a more detailed interpretation of the measured spectra to be obtained (as also summarised in Table 1). In addition, the IFS 120M retrievals are found to be considerably more variable than the IFS 120/5HR data. However, it is fair to admit that the differences among retrieval strategies lie within the respective error confidence intervals, so no robust conclusions can be reached. Note that, in order to make a fair comparison, the fitting residuals are computed as the noise-to-signal ratio for a common spectral region present in all setups (1001.47–1003.04 cm−1).
3.2.2 Uncertainty analysis
The characterisation of the different FTIR O3 products is completed by performing an uncertainty analysis, which evaluates how different error sources could be propagated into the retrieved products. The theoretical error assessment carried out in the present paper is based on Rodgers (2000) and analytically performed by the PROFFIT package. The Rodgers formalism distinguishes three types of error: (1) smoothing error (SE) associated with the limited vertical sensitivity of the remote-sensing FTIR instruments, (2) spectral measurement noise, and (3) uncertainties in the input/model parameters (instrumental characteristics, spectroscopy data, …), which are split into statistical (ST) and systematic (SY) contributions. Given that SE can be considered an inherent characteristic of the remote-sensing technique, it is not included in the uncertainty assessment suggested by the NDACC IRWG (IRWG, 2014). Therefore, it has been separately considered in this work by distinguishing the total parameter error (TPE), which is calculated as the the square root of the quadratic sum of all error sources considered with the exception of the SE, and the total error (TE), which considers both the TPE and SE. A detailed description of the uncertainty assessment is given in Appendix B.
In order to assess the effect of O3 absorption signatures on the uncertainty budget, the dependence of the estimated errors on the O3 slant column (SC) amounts for each retrieval setup has been examined. This analysis allows possible inconsistencies between the setups or saturations of O3 absorption lines at high O3 concentrations to be detected. As shown in Fig. 3, both statistical and systematic uncertainties do depend on the O3 spectroscopic signatures for all setups due to the increase in most of the error sources considered at larger O3 SCs (see details in Appendix B). Figure 3 also documents that the inclusion of a simultaneous temperature retrieval significantly improves the theoretical performance for all FTIR O3 products. Although this fit generates a negative cross-interference with the ILS, measurement noise, and smoothing error (especially for the 1000T setup, Fig. B1), in return, the temperature error contribution is nearly eliminated, decreasing the total ST budget by ∼ 1 %. The TPE and TE range from 1.5 % to 2.5 % (between 250 and 3000 DU) for setups without a simultaneous temperature fit, while the TPE varies from 0.5 % to 1.0 % (or to 1.5 % for the TE due to the influence of the SE) when including the temperature retrieval. The total systematic contributions also drop by 0.3 % (at high O3 SCs) with mean values of ∼ 3 %. It is worth highlighting that an inconsistency between the 4MWsT/5MWsT and 1000T setups has been detected in the systematic uncertainty budget, which is determined by the spectroscopy errors. For the 1000T configuration, the spectroscopic SY error exhibits a reverse smile curve with O3 concentrations, and is considerably greater than for the narrow micro-window setups. This result might point to a possible saturation of the deeper O3 lines contained in the broad window or some inconsistency in the spectroscopy parameters. For example, an erroneous parameterisation of the temperature dependence of the O3 line width may produce systematic differences between actual and retrieved temperature profiles (Schneider and Hase, 2008), therefore affecting the absolute value of O3 FTIR products.
Vertically, the most important contribution is the SE reaching ∼ 40 % in the UTLS region (Fig. 3d), where the O3 concentrations are very variable and the profile might be highly structured. The FTIR system is not able to resolve such fine vertical structures. Excluding the SE, the statistical TPE profiles are strongly linked to the atmospheric temperature, with maximal errors beyond the UTLS region (where the maximum FTIR sensitivity and the largest O3 concentrations are also located, see Fig. 3a). This pattern is consistently observed for both setups with and without fitting the atmospheric temperature profiles. However, the error values drastically drop when considering the temperature in the retrieval procedure. TPE values of 1.0 %–1.5 % are expected for the 1000T, 4MWsT, and 5MWsT setups, and values as high as 6 % when the temperature fit is not taken into account. In relation to the systematic uncertainty profiles (Fig. 3e), they range from 3 % in the UTLS and middle stratosphere (around 30 km) to 5 % in the upper stratosphere. As with statistical errors, the temperature contribution decreases when including the atmospheric temperature profile in the retrieval, leading to smaller systematic errors in O3 TCs, as mentioned above.
The error estimation presented here assumes the same set of uncertainty values for all setups, which is representative of the IFS 120/HR instrument in the period 2005–2008 (Table B1 in Appendix B). However, some error sources do strongly depend on instrument status (particularly the ILS function, solar pointing, and measurement noise), affecting the total uncertainty budget. In order to account for the different quality periods of the IZO FTIR instruments, the uncertainty analysis for different sets of error values is included in Appendix B.
To summarise, using several narrow micro-windows instead of a single broad region and applying a temperature profile fit has been found to provide more precise FTIR O3 estimations by increasing the vertical sensitivity and decreasing the expected uncertainties. The simultaneous temperature retrieval could be a suitable approach provided the FTIR system is properly characterised, with a continuous assessment of ILS function, and is stable over time (e.g. IFS 120/5HR spectrometers), in order to minimise the negative influence of the ILS uncertainties and measurement noise on O3 retrievals. Finally, although the narrow micro-window setups provide very consistent results, the 5MWsT setup has been theoretically shown to be superior for the typical O3 concentrations observed at tropical and subtropical latitudes.
4.1 FTIR and Brewer ozone total columns
The performance of each of the six FTIR O3 retrieval strategies has been assessed by comparison with coincident NDACC Brewer O3 TC data. In order to mitigate the influence of the O3 intra-day variations on comparisons, only FTIR and Brewer measurements within a temporal coincidence of 5 min have been paired, which makes a total of 2231 coincidences between 1999 and 2018.
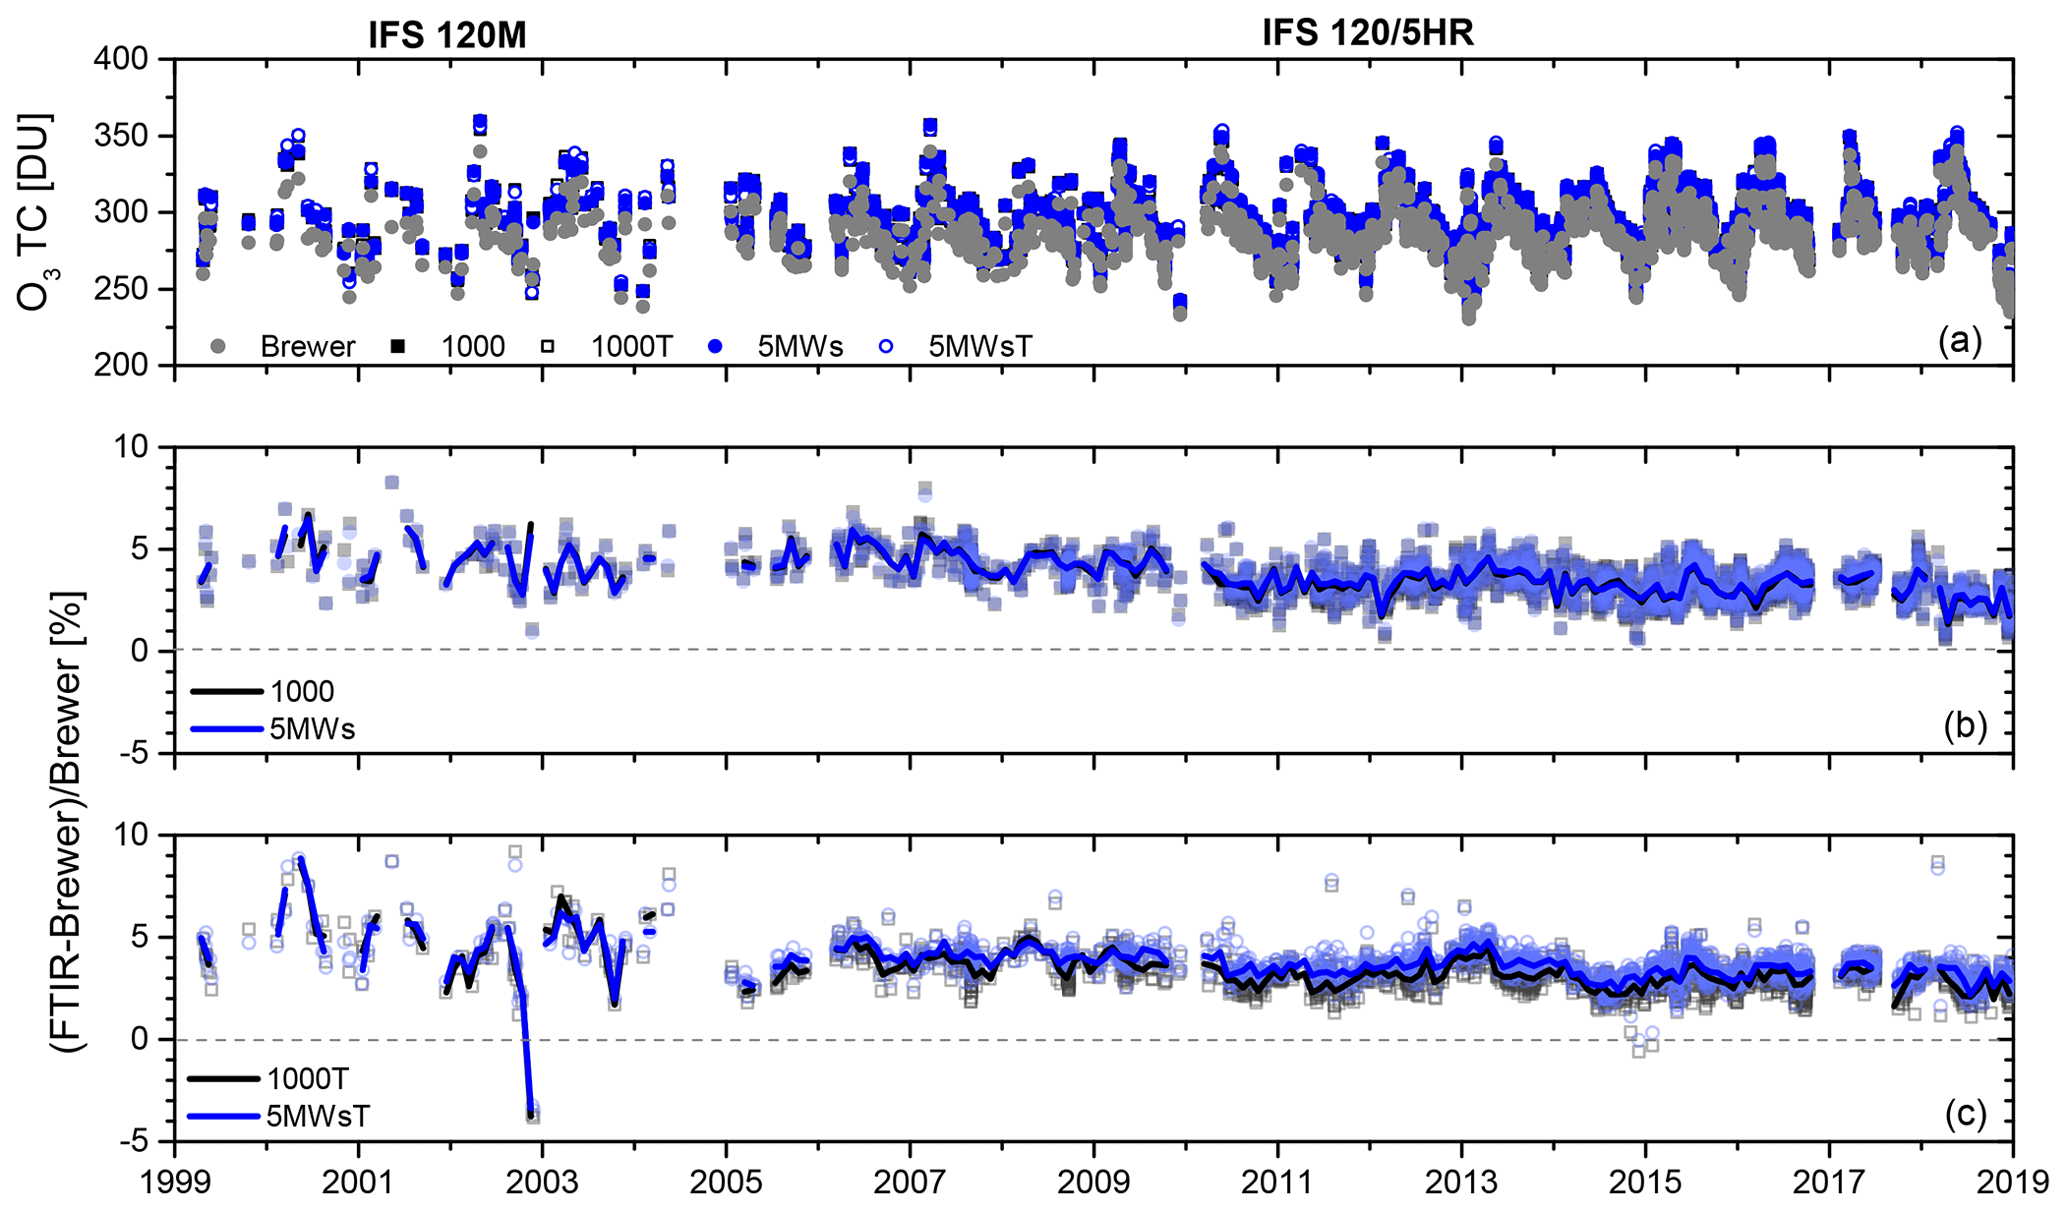
Figure 4Summary of the FTIR–Brewer comparison from 1999 to 2018. (a) Time series of O3 TCs (DU) as observed by Brewer and FTIR 1000/1000T and 5MWs/5MWsT setups. (b) Time series of relative differences (RD) for the setups 1000 and 5MWs, which were calculated as , where X and Y refer to FTIR and Brewer, respectively. (c) As for (b), but for the setups 1000T and 5MWsT. Solid lines in (b) and (c) correspond to monthly medians.
Figure 4 displays the time series of the Brewer observations together with four examples of FTIR retrievals (for simplicity, only the setups 1000/1000T and 5MWs/5MWsT are depicted), as well as the time series of corresponding relative differences (RD, FTIR–Brewer). The temporal O3 TCs variations are in general reproduced well by all FTIR products. However, this figure makes the difference in performance of the two FTIR instruments evident: while the RD values of the IFS 120/5HR instrument are very stable over time, the IFS 120M instrument exhibits more erratic behaviour. Besides the greater variability of the IFS 120M and the switching of instruments in 2005, the most remarkable feature is a discontinuity detected at the beginning of 2010 by a non-parametric change-point test (Lanzante, 1996) (at the 99 % confidence level). The systematic jump is ∼ 1.1 % for the setups without temperature fitting, and is partially corrected by retrieving the temperature: ∼ 0.7 %. The change point, already reported by García et al. (2014), is likely due to modifications of the IFS 120/5HR spectrometer (failure of the interferometer’s scanner motor and its subsequent replacement). Another change point was detected by Lanzante's approach around the beginning of 2014, but was less intense. It is worth highlighting that both discontinuities were also detected in the differences of O3 TCs retrieved from the different FTIR setups, especially by those including the temperature fit. Hence, when no independent observations are available, the analysis of different FTIR products could offer additional tools for identifying inconsistencies and documenting the long-term instrumental stability.
Figure 4 also reveals that, although the scatter in the RD is significantly improved by the temperature retrieval, these strategies generally present more extreme values as compared to the Brewer data. The RD range between the 0.1st and 99.9th percentiles is 7.4 % and 7.0 % for the 1000 and 5MWs setups, respectively, while it is 9.3 % and 8.6 % for the 1000T and 5MWsT configurations, respectively. Note that, for example, the extreme RD values obtained for the 1000T and 5MWsT setups at the beginning of 2000 and at the end of 2002 (Fig. 4c) are not reproduced by the 1000 and 5MWs strategies (Fig. 4b). This pattern is consistently observed for all setups and over time. The extreme RD values may indicate measurement days with an unusual temperature vertical stratification, which might be wrongly captured by the Brewer and FTIR products that assume a fixed temperature (and pressure) profile. For forward calculations of those FTIR strategies without a simultaneous temperature fit, the temperature and pressure profiles are updated daily from the NCEP database, as previously mentioned, but they are kept constant during the O3 retrieval procedure. Regarding Brewer, no temperature or pressure dependence is considered in the operational data processing (Redondas et al., 2014; Rimmer et al., 2018). In particular, the Brewer O3 TCs are computed using the so-called effective O3 cross sections throughout the atmosphere (Bass and Paur, 1985), corresponding to an O3 effective height of 22 km and a fixed effective temperature of the O3 layer of −45 ∘C. These simplifications can produce systematic (seasonal dependence) and random errors (Redondas et al., 2014; Gröbner et al., 2021). In fact, at IZO, the effective temperature and O3 height significantly differ from the values assumed by Brewer processing in winter months, when the extreme RD values are observed (Fig. 4c). Nevertheless, a more dedicated study would be desirable to deeply investigate the causes driving these anomalous values.
Table 2Summary of statistics for the FTIR–Brewer comparison for the setups 1000/1000T, 4MWs/4MWsT, and 5MWs/5MWsT: the median (M, in %) and standard deviation (σ, in %) of the relative differences and Pearson correlation coefficient (R) of the direct comparison are shown for the periods 1999–2004, 2005–May 2008, and June 2008–2018 and for the entire time series (1999–2018). Also shown are the median of the theoretical TPE (MTPE), SE (MSE), and TE (MTE) uncertainties. The number of coincident FTIR–Brewer measurements is 93, 185, and 1892 for the three periods, respectively, and 2170 for the whole dataset. The strategies showing the best performance in terms of smallest σ and MTE are highlighted in bold for each period.
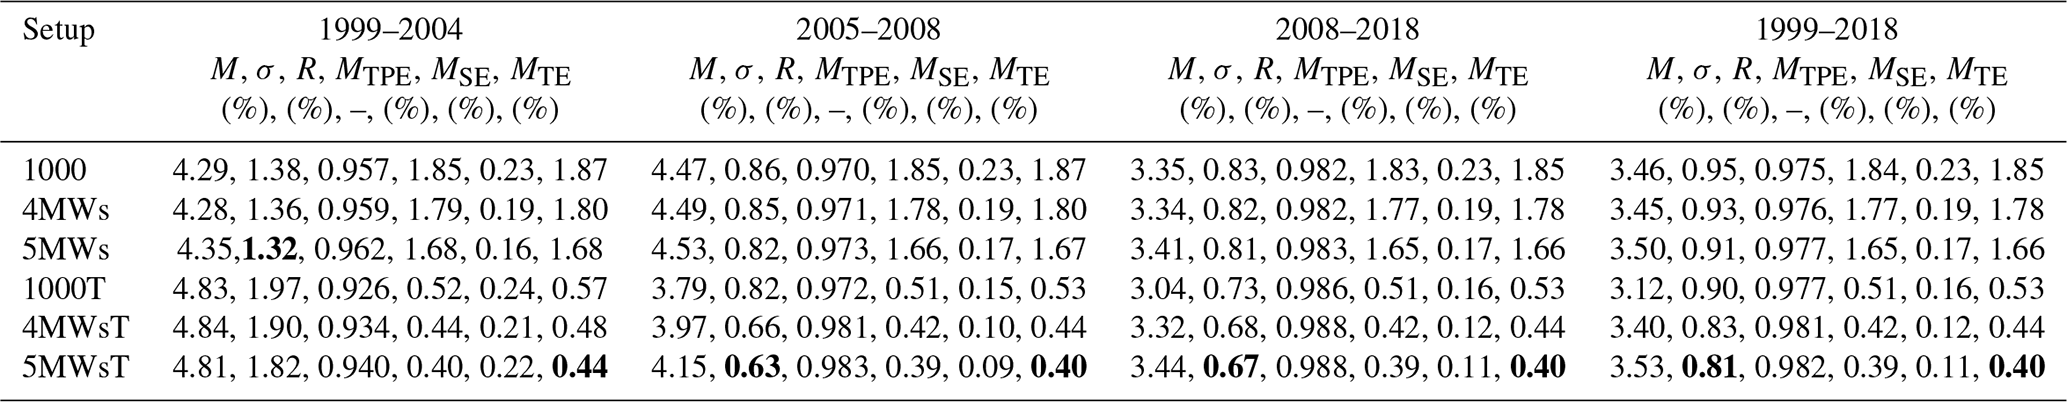
When analysing in detail the intercomparison results (Table 2), it is confirmed that, first, the more refined setups using narrow micro-windows offer the best performance (especially 5MWs/5MWsT) independently of the treatment of the atmospheric temperature profile, and second, the effect of the simultaneous temperature fit on the FTIR O3 quality depends on the instrumental stability. The agreement between the FTIR and Brewer observations significantly worsens for the more unstable IFS 120M spectrometer when the temperature fit is included in the retrieval procedure (the largest median bias and scatter and the least correlation for the 1999–2004 period). Opposite behaviour is documented for the IFS 120/5HR periods: the temperature retrieval consistently improves the precision and accuracy of all FTIR O3 products by considerably reducing the dispersion and bias of the RD distributions. Thus, the best performance is obtained by those setups using narrow micro-windows, with a RD scatter of only ∼ 0.6 %–0.7 % (this increases up to ∼ 0.8 % for the broader region setup) for the IFS 120/5HR instrument; while it is as high as 2 % for the IFS 120M when the simultaneous temperature fit is carried out. These values perfectly agree with previous studies (e.g. Schneider et al., 2008a; García et al., 2012) and lie within the expected precision of both instruments (see Sects. 2.2 and 3.2.2 and Appendix B). In fact, as shown in Appendix B, total statistical errors of ∼ 0.5 %–1.5 % can be expected depending on the instrument status (i.e. the instrumental degradation and solar pointing errors). Nonetheless, Table 2 also documents that the scatter found in the RD is noticeably lower than that predicted when the temperature fit is not considered, especially for the IFS 120/5HR instrument (see MTE values). This fact could indicate that sources of uncertainty partially cancel each other out, which is not fully reproduced by the theoretical error assessment, and/or the possible overestimation of the assumed temperature uncertainty. As also shown in Appendix B, reducing the latter would contribute to reconciling the experimental and theoretical results. Note that the scatter values found for the IFS 120/5HR spectrometer can be used to derive a conservative value for the precision of the FTIR O3 TC estimations, since they can be interpreted as the root of the sum of squares of the precision of the Brewer or FTIR instrument.
Regarding the systematic differences, a median bias of ∼ 3 %–5 % is obtained. Such discrepancies are consistent with previous studies (e.g. Schneider et al., 2008a; García et al., 2012, 2016), and are mainly attributed to inconsistencies between infrared and ultraviolet spectroscopic parameters (e.g. Piquet-Varrault et al., 2005; Gratien et al., 2010; Drouin et al., 2017; Tyuterev et al., 2019). In fact, as recently presented by Gordon et al. (2022), the most recent release of the HITRAN spectroscopic database (HITRAN 2020) improves the O3 line intensities in the 1000 cm−1 spectral band by applying a scaling factor of 3 %. This correction agrees well with our theoretical uncertainty estimations and the overestimation found for the FTIR products.
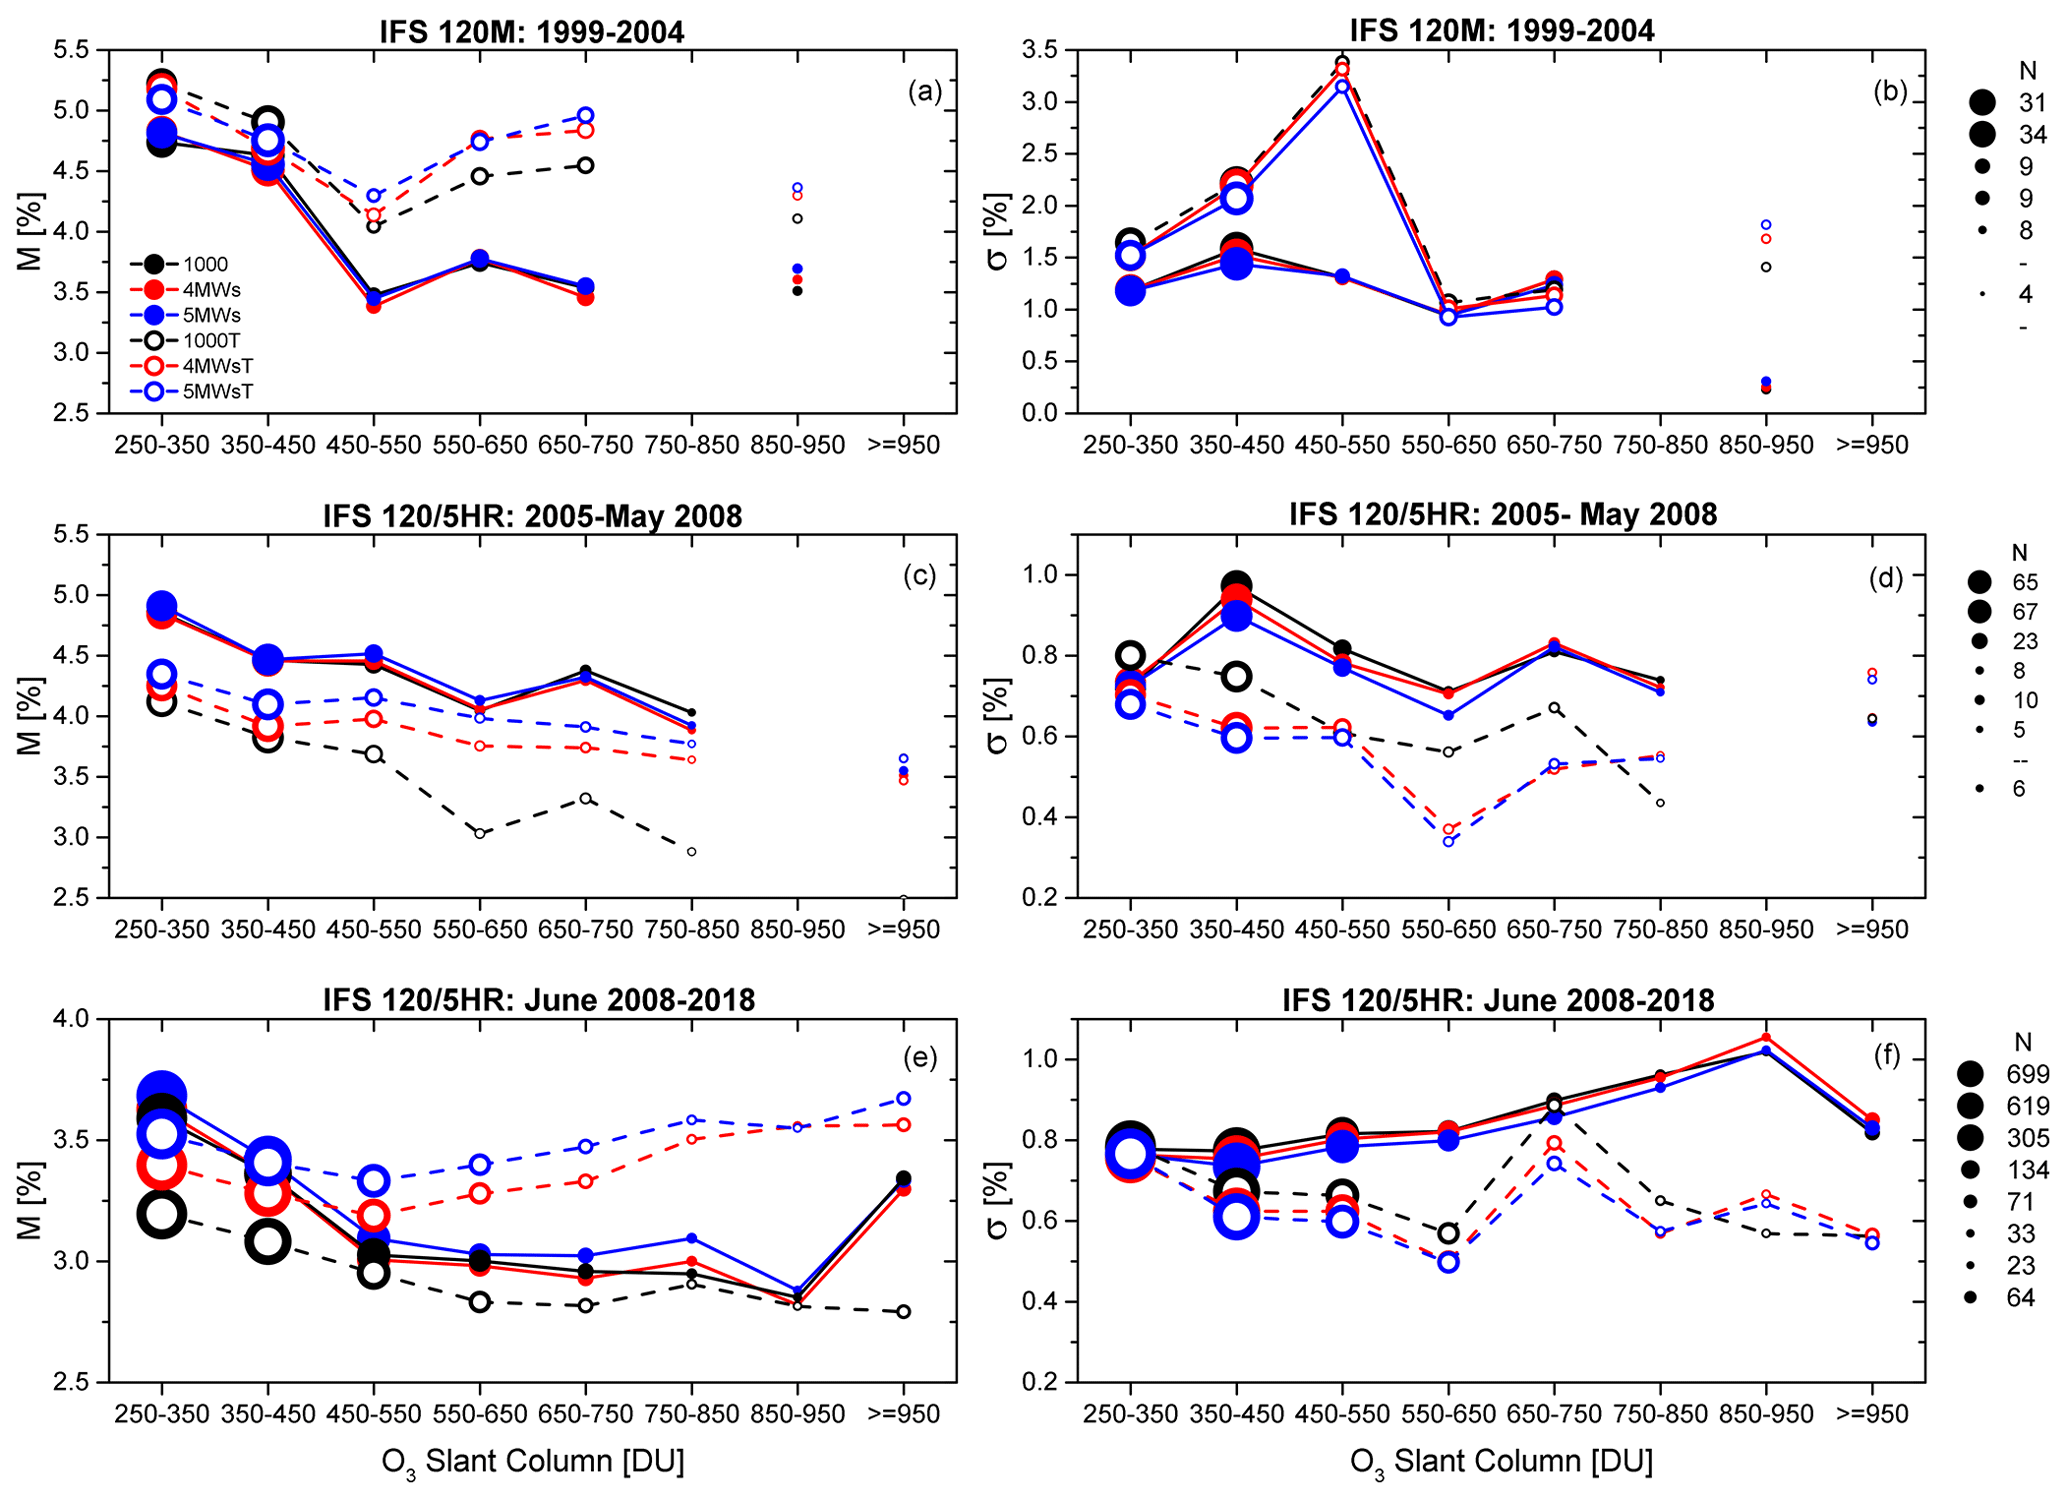
Figure 5Median and standard deviation of relative differences (RD, FTIR–Brewer) with respect to the Brewer O3 slant column (DU) for the periods 1999–2004, 2005–May 2008, and June 2008–2018. Panels (a), (c), and (e) show median RD (M, in %) values for the three periods, respectively, and (b), (d), and (f) show the same but for the standard deviation of the RD (σ, in %). Dotted area indicates the number of coincident FTIR–Brewer measurements for each O3 SC interval (N), which are included in the legend of each subplot. For better visualisation, a scale factor of 3, 2, and 1 was applied to the dotted area for the periods 1999–2004, 2005–May 2008, and June 2008–2018, respectively.
Similar conclusions can be reached in general when the comparison is performed as a function of O3 signatures in the slant path (Fig. 5). The temperature fit improves the performance of the stable instrument and makes it worse for the more unstable instrument, independently of the O3 SC range covered at IZO. In addition, the bias between FTIR and Brewer data decreases by ∼ 1 % overall as the O3 SCs increase for all setups (Fig. 5a, c, and e). This dependence can in part be accounted for the Brewer systematic uncertainties in the absolute calibration process, which are amplified for low O3 SCs (up to 0.5 %; Schneider et al., 2008a). However, for the more stable IFS 120/5HR period (Fig. 5e), the bias alters this behaviour for O3 SCs beyond ∼ 550 DU for setups using narrow micro-windows when the simultaneous temperature retrieval is considered. This issue could be attributed to inconsistencies in the spectroscopic parameters at higher wavenumbers, which gain importance as O3 concentrations increase, and is in line with the theoretical systematic inconsistency found between the 1000T and 4MWsT/5MWsT setups (Sect. 3.2.2). However, the number of FTIR–Brewer coincidences at IZO is rather small for O3 SCs greater than 550 DU (i.e. less than ∼ 20 % of the Brewer data in the 1999–2018 period); therefore, a more robust dataset would be recommended to better understand what drives this different pattern.
As pointed out by the theoretical uncertainty analysis, statistical errors are expected to increase with O3 SCs for all setups. This can be seen in the scatter of the RD for the IFS 120/5HR periods (Fig. 5d and f) when the temperature fit is not applied (i.e. the scatter of the RD increases by 0.2 % in the 2008–2018 period at larger O3 SCs). However, the intercomparison results seem not to exhibit a similar dependence when the temperature retrieval is considered, as expected. At larger O3 SCs, including this fit can lead to differences of 0.2 % compared to when this fit is not included. This could be attributed to an underestimation of the ILS and/or baseline errors in the theoretical assessment: the ILS contribution to the total uncertainty budget decreases as the O3 SCs increase and becomes more important when the temperature fit is applied (see Fig. B1). The same behaviour is found for the baseline error (data not shown). Hence, an increment in the assumed uncertainties for these two error sources when the temperature is included in the retrieval procedure could partially reduce discrepancies between the theoretical and experimental assessments. Note that while the 1000/1000T setups provide the most accurate O3 TCs with respect to Brewer data for the whole O3 SC range for both instruments, the 5MWs/5MWsT setups offer the most precise O3 TCs. This result further corroborates that the broad region seems to be less sensitive to the improvement generated by the temperature retrieval.
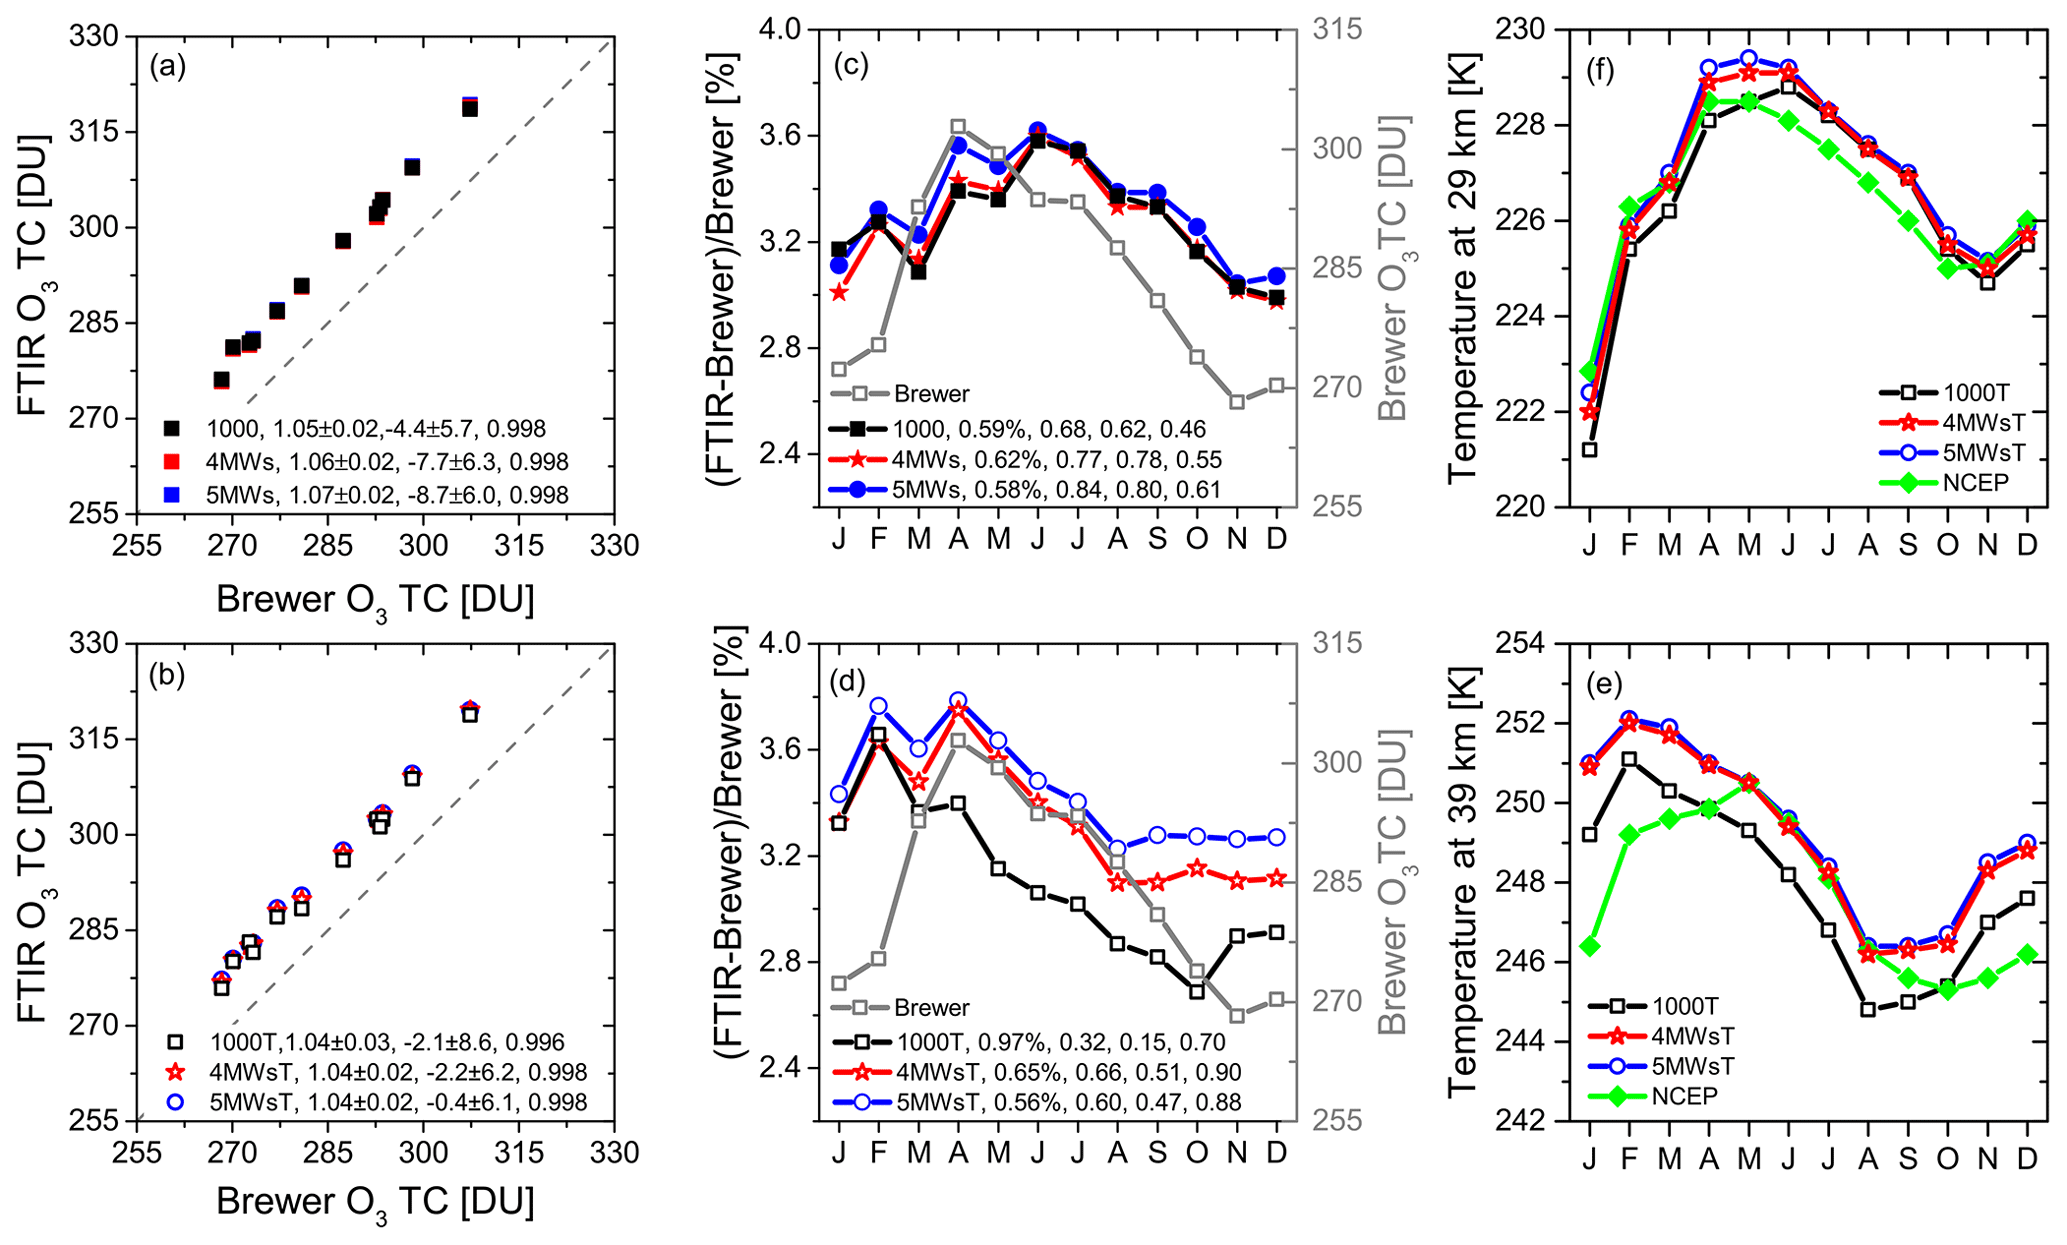
Figure 6Summary of the FTIR–Brewer comparison at a seasonal scale for the 2009–2018 period. (a, b) Scatter plots of the Brewer and FTIR O3 TCs for the setups 1000/4MWs/5MWs and 1000T/4MWsT/5MWsT, respectively. (c, d) Averaged annual cycles of the Brewer O3 TC and RD for the setups 1000/4MWs/5MWs, and 1000T/4MWsT/5MWsT, respectively. (e, f) Averaged annual cycles of the atmospheric temperature at 29 km and 39 km, respectively, retrieved from the setups 1000T, 4MWsT, and 5MWsT, as well as the NCEP database. The legends in (a) and (b) display the slope, offset, and Pearson correlation coefficient of the least-squares fit, and the legends in (c) and (d) show the amplitude of the RD annual cycle (in %), the Pearson correlation coefficient between the RD and Brewer O3 TC annual cycles, and the annual cycle of atmospheric temperature (at 29 and 39 km, respectively).
The long-term FTIR time series used in this study allows us to investigate not only the overall quality and long-term consistency of new products, but also the effects at different timescales. At a seasonal scale, the agreement between FTIR and Brewer is excellent: the annual cycles are completely in phase, with Pearson correlation coefficients of greater than 0.99 for all retrieval strategies considered (Fig. 6a and b). However, the bias between both techniques depends on the O3 amounts, leading to a seasonal effect on RD, which is likely due to the fact that the Brewer and FTIR products exhibit different responses to O3 seasonal variations. On the one hand, the FTIR sensitivity is strongly anti-correlated with the O3 SC annual cycle: the lower the O3 amounts, the less saturated the O3 absorption lines. This results in minimum (maximum) DOFS in winter (spring/summer) (García et al., 2012). On the other hand, the different treatments of the atmospheric temperature and the O3 vertical distribution in the Brewer data processing and the FTIR data processing also generate seasonal artefacts, as stated above for the extreme RD values. In fact, including the temperature retrieval significantly modifies the RD seasonal patterns, as observed in Fig. 6c and d.
For those approaches without a simultaneous temperature fit (Fig. 6c), the RD annual cycle seems to follow the typical O3 TC seasonality at the subtropical latitudes: peak values in spring and minimum in autumn–winter, as a result of the joint effect of the annual shift in the height of the subtropical tropopause and the annual cycle of O3 photochemical production associated with tropical insolation (e.g. García et al., 2014, 2021). Hence, a significant correlation between the averaged RD and O3 TC annual cycles for all setups is found, with Pearson correlation coefficients ranging from 0.68 to 0.84 for the 1000 and 5MWs strategies, respectively. This relationship drops to correlation values between 0.32 and 0.60 for the 1000T and 5MWsT setups, respectively. However, in return, a seasonal dependence on the upper-stratospheric temperature is detected (Fig. 6f displays, as an example, the annual cycle of averaged temperature at 39 km from the NCEP database along with those retrieved from the FTIR setups). The correlation between the averaged annual cycles of the upper-stratospheric temperature and RD is ∼ 0.70 and ∼ 0.90 for the broad and narrow micro-window setups, respectively, when the temperature fit is included; it is limited to between 0.46 and 0.61 when the temperature retrieval is not considered. Note that a subtle relationship with the temperature in the middle or lower stratosphere (e.g. at 29 km in Fig. 6e) is found. Additionally, it has been found that the RD seasonal amplitudes are augmented overall by the temperature retrieval. The broad spectral region seems to be the most sensitive to this effect: the RD peak-to-peak amplitude goes from 0.59 % (1000) to 0.97 % (1000T), while it is modified by less than 0.05 % for the 4MWs/5MWs setups.
4.2 FTIR and ECC ozone vertical profiles
In order to evaluate the influences of the six retrieval strategies on the O3 vertical distribution, Fig. 7 displays the vertical profiles of the relative differences between FTIR and ECC sondes for the three periods considered, while Table 3 summarises the comparison for the O3 layers that are sufficiently detectable by the FTIR system, i.e. the partial column (PC) at 2.37–13, 12–23, and 22–29 km (the DOFS for all these layers is typically larger than 1). For this comparison, the approach suggested by Schneider et al. (2008b) and García et al. (2012) was followed, whereby the ECC sondes were corrected daily by comparing them to coincident Brewer data. By means of this correction, the quality and long-term stability of the ECC sonde data can be significantly improved. In addition, the highly resolved ECC profiles (xECC) were vertically degraded () by applying the averaging kernels obtained in the FTIR O3 retrieval procedure (Rodgers, 2000) as follows:
where xa is the a priori O3 VMR profiles. The ECC smoothing allows, on the one hand, the limited sensitivity of FTIR data to be taken into account and, on the other hand, the effects of the different strategies on retrieved O3 profiles to be directly assessed. Note that, in order to homogenise the comparison, only the ECC sondes with continuous measurements up to 29 km have been considered. Beyond this altitude, the ECC data were completed using the a priori profiles used in FTIR O3 retrievals for computing . Finally, the temporal collocation window between FTIR and ECC sondes extends to ±3 h around the sonde launch (typically at 12:00 UT) to ensure sufficient pairs for a robust comparison (N=272 in the 1999–2018 period).
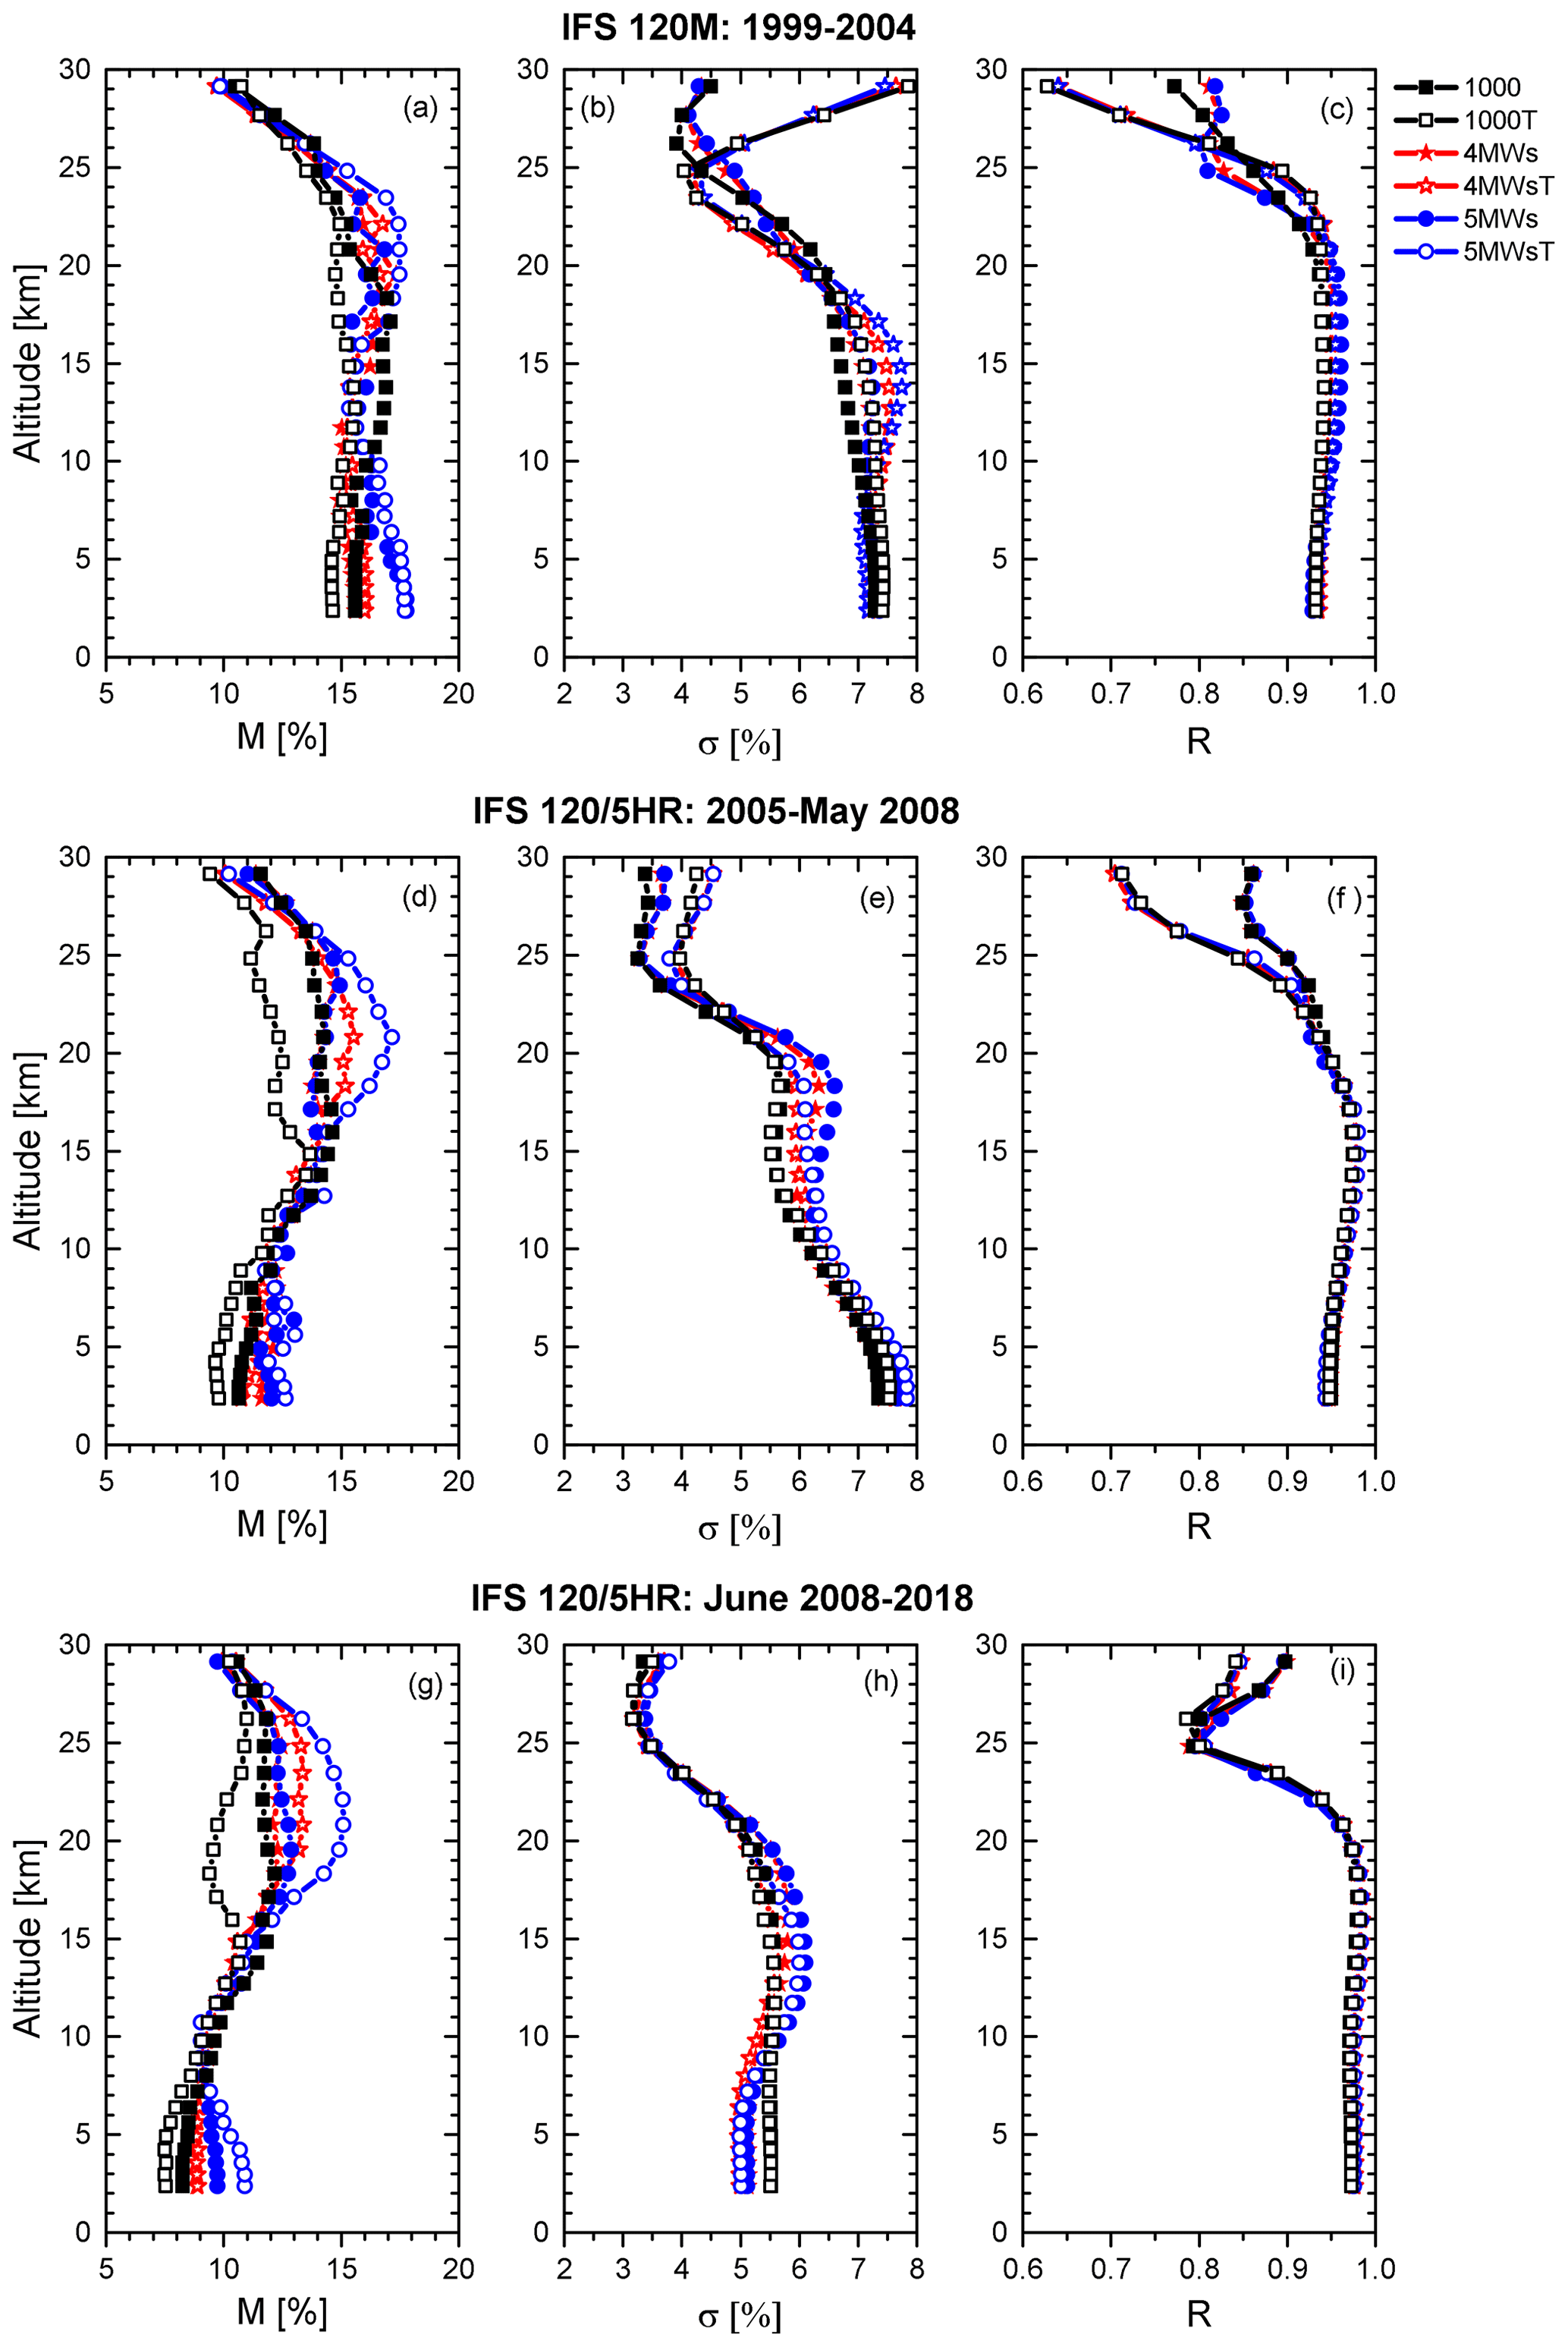
Figure 7Summary of the FTIR–smoothed ECC comparison for the periods 1999–2004, 2005–May 2008, and June 2008–2018. Panels (a), (d), and (g) display the vertical profiles of median (M) RD (FTIR–ECC, in %) for the three periods, respectively. (b, e, h) As for (a), (d), and (g), but for the standard deviation of the RD distribution (σ, in %). (c, f, i) As for (a), (d), and (g), but for the Pearson correlation coefficient. The number of coincident FTIR–ECC measurements is 56, 49, and 167 for the periods 1999–2004, 2005–May 2008, and June 2008–2018, respectively.
Table 3Same as Table 2, but for the FTIR–smoothed ECC comparison for the O3 partial columns computed for 2.37–13, 12–23, and 22–29 km. The number of coincident FTIR–ECC measurements is 56, 49, and 167 for the three periods, respectively, and 272 for the whole dataset. The strategies showing the best performance, in terms of smallest σ and MTE, are highlighted in bold for each period.

The RD profiles show a strong vertical stratification, whereby the three independent layers detectable by the FTIR systems up to ∼ 30 km are clearly discernible (troposphere, UTLS, and middle stratosphere; recall Fig. 3). In particular, beyond the UTLS region, the influence of ILS uncertainties on the retrieved O3 profiles becomes important with altitude, since the full width at half maximum of the narrow O3 absorption lines and the ILS function becomes comparable. For all setups and periods, the simultaneous temperature fit is found to worsen the agreement between FTIR and ECC sondes at higher altitudes (see the standard deviation profiles in Fig. 7b, e, and h). However, as the instrument becomes better aligned and more stable over time, the effect of this cross-interference becomes less significant, until no noticeable differences are observed for the 2008–2018 period. For example, the scatter at 29 km for the FTIR–ECC comparison only changes from 3.6 % to 3.8 % for the 5MWs and 5MWsT setups, respectively, for the 2008–2018 period, while the variation ranges between 4.3 % and 7.5 % for the 1999–2004 period. In the UTLS region, overall, the best agreement is found for those setups without temperature profile fitting. This may indicate that the negative effect of the ILS uncertainties and measurement noise prevails over the improvement attributed to the temperature fit. The same pattern is documented for the tropospheric O3 concentrations, even though the differences among retrieval strategies are not as significant as those at higher altitudes. Note that these scatter values agree well with the expected uncertainty for ECC sondes (∼ 5 %–15 %) and with the FTIR theoretical error estimation (recall Sect. 3.2.2), as well as with previous works (Schneider et al., 2008b; García et al., 2012; Duflot et al., 2017, and references therein). As stated in those studies, the limited vertical sensitivity of the FTIR profiles could account for part of the dispersion observed between both datasets. Other sources of discrepancies might be the different observing geometries (i.e. the two measurement techniques sample different air masses).
The vertical stratification observed in the median RD profiles also differs between both FTIR instruments (Fig. 7a, d, and g). While all setups consistently show larger biases up to the UTLS region for the IFS 120M, the differences between the instruments are minimised beyond the middle stratosphere. The median bias varies from ∼ 17 % to ∼ 10 % at 5 km for the 5MWs/5MWsT in the 1999–2004 and 2008–2018 periods, respectively, while the bias is ∼ 10 % at 29 km for the same configurations for both periods.
In summary, considering the integrated PCs (which are less dependent on the FTIR vertical sensitivity) and the 2008–2018 period as a reference (due to better instrumental alignment and more FTIR–ECC coincidences), the best overall performance is documented for the setups using narrow micro-windows and simultaneous temperature fits in the troposphere and stratosphere regions (Table 3). At UTLS altitudes, where O3 is particularly variable, the broad micro-window strategy seems to provide the best agreement with respect to ECC data. Nevertheless, the differences among strategies lie within the respective error confidence intervals, and so no robust conclusions can be reached. In addition, it is fair to admit that the ECC comparison only allows the FTIR vertical profiles to be analysed in detail up to ∼ 30 km. However, compensations among the ILS, temperature, measurement errors, and O3 vertical distribution should occur at higher altitudes, meaning that the usage of narrow micro-windows (and a temperature fit) clearly provides the best results in the integrated total columns, as documented by the FTIR–Brewer comparison. Unfortunately, ECC sondes do not usually reach altitudes higher than 30–34 km, so other measurement techniques, such as microwave or lidar O3 profiles, would be of great use for further completing the quality assessment.
Accurate ozone (O3) products are mandatory to monitor the evolution of the Earth's atmosphere system. In this context, the current paper has assessed the effect of using different retrieval strategies on the quality of O3 products from ground-based FTIR spectrometry, with the aim of providing an improved O3 retrieval that could be applied at any NDACC FTIR station. For this purpose, the high-quality NDACC FTIR measurements taken at the subtropical Izaña Observatory (IZO) between 1999 and 2018 have been utilised. The 20-year time series of O3 observations allowed us to, on the one hand, assess the quality and long-term consistency of the different FTIR O3 products and, on the other hand, evaluate the influence of instrumental status on the O3 retrievals.
The quality of the FTIR O3 products improves as the retrieval strategies become more refined by considering O3 absorption lines in specific narrow micro-windows (between 991 and 1014 cm−1) instead of using the traditional broad spectral region (between 1000 and 1005 cm−1). Approaches using narrow micro-windows proved, both theoretically and experimentally, to be superior due to the their greater vertical sensitivity, smaller expected uncertainties, and better agreement with respect to independent data. Optimal selection of the spectral O3 micro-windows enhanced the precision of FTIR O3 TCs by ∼ 0.1 %–0.2 % with respect to the coincident NDACC Brewer observations taken as reference, leading to a conservative precision of ∼ 0.6 %–0.7 % for the FTIR products. But, at the same time, they were shown to be consistent with the standard NDACC setup (i.e. no important biases were found between the different retrieval strategies).
In addition, independently of the O3 absorption lines used, simultaneous atmospheric temperature retrieval was found to be a very useful tool for O3 monitoring by ground-based NDACC FTIR systems. The scatter with respect to the Brewer data was found to be reduced up to ∼ 0.2 % when applying a temperature fit for those strategies that also use narrow O3 absorption lines. However, this improvement can only be reached provided the FTIR instrument is properly characterised and stable over time (e.g. the IFS 120/5HR spectrometer). For more unstable instruments, such as the IFS 120M, the inclusion of the atmospheric temperature fit in the O3 retrieval procedure may not be recommendable, since it worsens the quality of FTIR O3 products due to the increase in cross-interference with instrumental performance. The broad 1000 cm−1 region seems to be most sensitive to this effect. Another fact that strongly distinguishes the broad and narrow setups is the presence of strong H2O absorption lines in the 1000 cm−1 region, which could be critical for humid FTIR sites if the H2O cross-interference is not properly taken into account. In this sense, using one-step or two-step retrieval strategies (retrieving H2O and O3 in the same step or in two separate steps, respectively) has been found to be valid and to provide consistent results.
Regarding the vertical O3 distribution, the significant cross-interference between the O3 and temperature profiles and the instrumental status causes the best-performing setup to depend on the altitude range considered. The best overall performance is documented for the setups using narrow micro-windows and simultaneous temperature fits in the troposphere and stratosphere regions, while at tropopause altitudes, the broad micro-window strategy seems to provide the best agreement with respect to ozonesonde data.
The effects of the most influential settings on the FTIR O3 retrieval procedure have been examined in this paper. Nevertheless, there is great potential for further improving the precision and accuracy of FTIR O3 products, as well as their harmonisation within the NDACC IRWG community (comprising instruments and retrieval strategies). Additional efforts could be made with the treatment of the instrumental response through the evaluation of the instrumental line shape function in a consistent manner, given its important effects on O3 retrievals. In addition, testing the proposed O3 setups at different NDACC FTIR stations (under different humidity conditions, latitudes, altitudes, etc.) would indeed motivate the NDACC FTIR community to revise the standard O3 retrieval strategy. Improved O3 monitoring could help to estimate the small expected signal of the recovery or decline in O3 concentrations more precisely, for both integrated total columns and vertical distributions, at a global scale. This is particularly challenging in those regions where O3 concentrations are less variable, such as at tropical and subtropical latitudes. Furthermore, there will be new opportunities to better understand the different and the main impacts of O3 on the earth's climate system, improving their representation in current global climate models and, thus, knowledge of their long-term evolution.
This appendix addresses the impact of the treatment of H2O on O3 retrievals for all O3 setups comparing the one-step and two-step retrieval strategies, where:
-
The one-step approach refers to the simultaneous retrieval of the H2O and O3 profiles using a Tikhonov–Phillips slope constraint for both gases, so that the micro-window of 896.4–896.6 cm−1 is added for better H2O determination (as done at the NDACC FTIR Lauder and Wollongong sites in Vigouroux et al., 2015).
-
The two-step approach refers to the strategy followed in the current paper and explained in detail in Sect. 3.1, where H2O a priori profiles, previously retrieved from dedicated H2O micro-windows for each spectrum, are then scaled in the O3 retrieval.
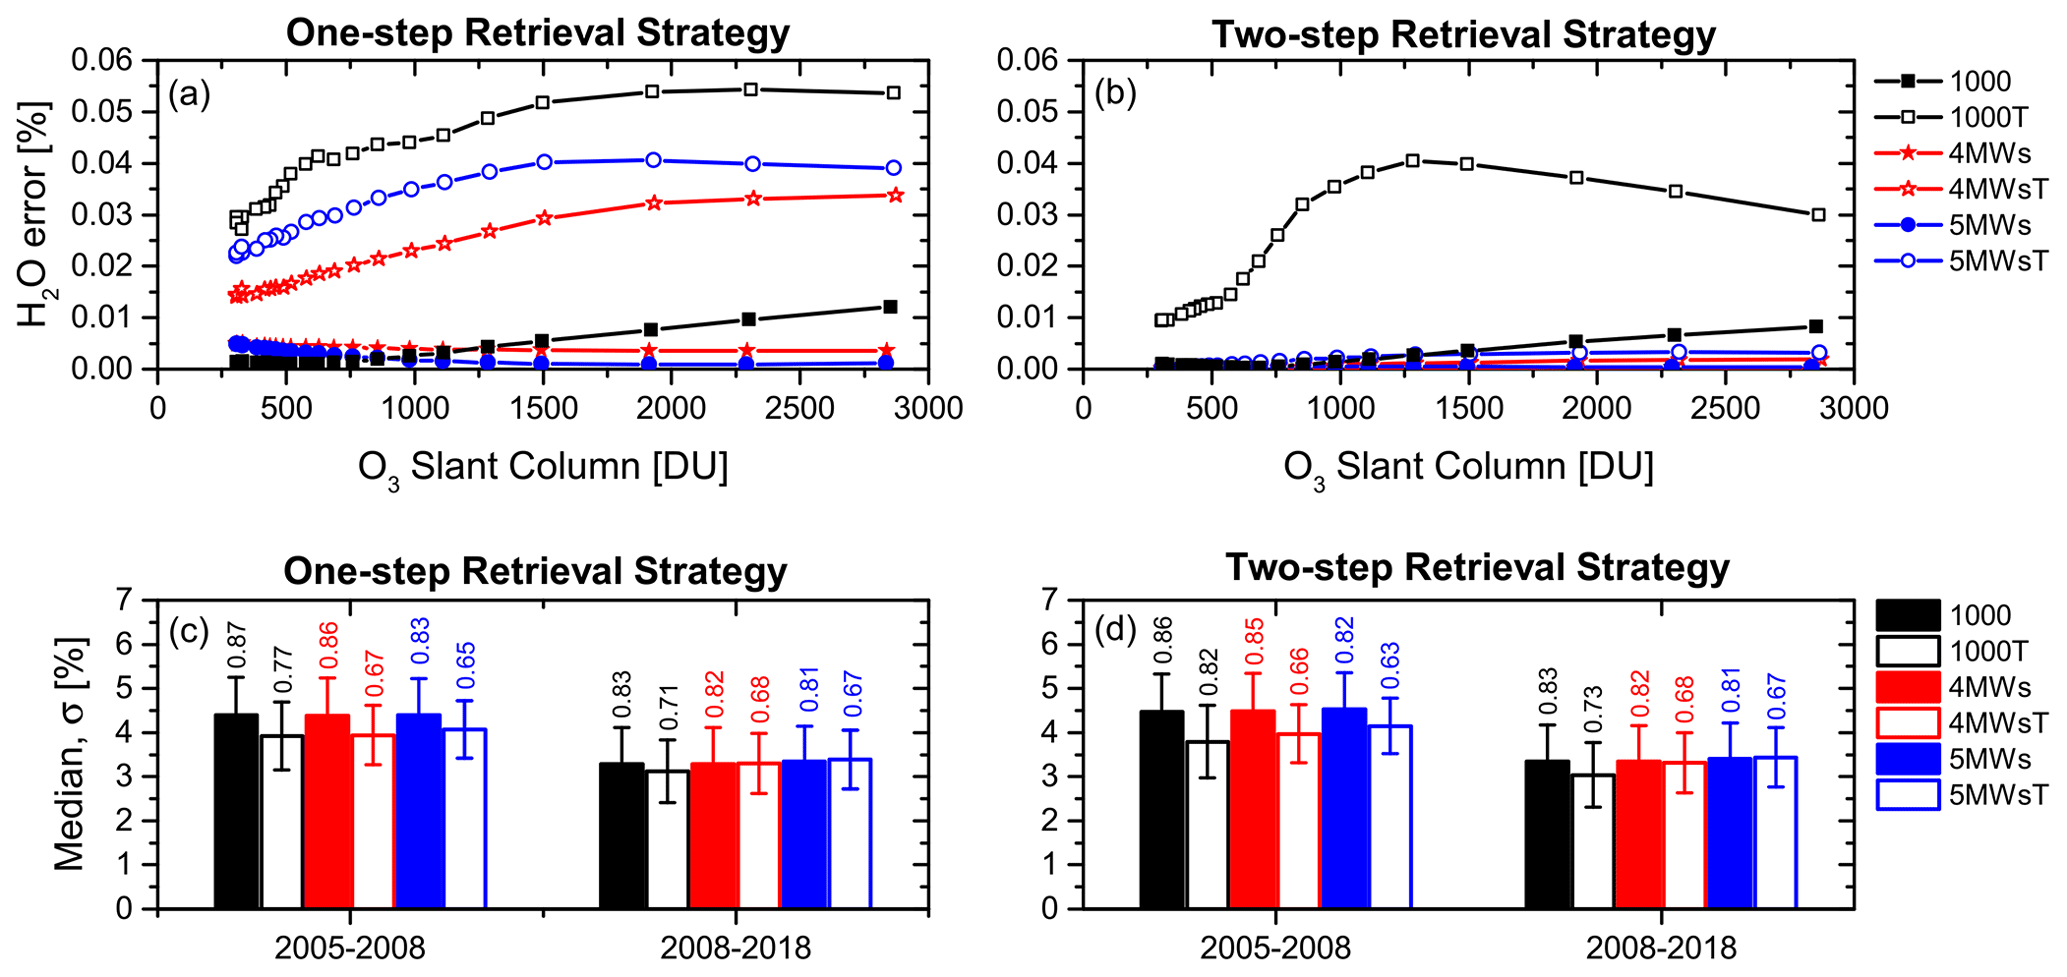
Figure A1Summary of the impact of the treatment of H2O on O3 retrievals for all O3 setups. (a, b) H2O cross-interference error in the O3 total column (%) using the one-step and two-step retrieval strategies, respectively, as a function of O3 slant column (DU) for the measurements of Fig. 3. (c, d) Statistics for the FTIR–Brewer relative differences using the one-step and two-step retrieval strategies, respectively, for the periods 2005–May 2008 and June 2008–2018. Median (M, in %) and standard deviation (σ, presented as error bars and numerals in %) values are shown.
Figure A1 illustrates the theoretical assessment of the H2O cross-interference for both retrieval strategies (García et al., 2014), where it can be seen that the H2O interfering error is noticeable, but not critical, given the especially dry conditions at IZO (the water vapour mixing ratio is less than 0.06 %) (García et al., 2021). Nevertheless, it has been found that the H2O interference strongly depends on the micro-windows used for the O3 retrievals (the highest impact is observed for the 1000 spectral region, as expected from Fig. 2), as well as on the treatment of the atmospheric temperature profile. For all setups, the one-step and two-step approaches provide consistent results when a simultaneous temperature fit is not included, so it is valid to use either to correctly minimise the H2O interference. Nonetheless, provided the documented improvement of the temperature retrieval is pursued, the two-step strategy ought to be used. In this sense, the two-step strategy drastically reduces the H2O interfering error for those setups using narrow micro-windows when the simultaneous temperature fit is included (4MWsT/5MWsT), leading to expected errors in the O3 total columns smaller than 0.01 %. The interfering effect of H2O also drops for the 1000 spectral region, but to a lesser extent, given the presence of important H2O absorption lines in that region (recall Fig. 2). This should be especially taken into account for FTIR stations located in humid environments.
A comparison to Brewer observations (Fig. A1c and d) also corroborates the theoretical results. It is worth highlighting the fact that the differences found between the two strategies are in excellent agreement with the estimated H2O interfering error values (Fig. A1a and b).
Theoretical uncertainties of FTIR products can be estimated by following the formalism detailed by Rodgers (2000), which includes the effects of smoothing error (SE), spectral measurement noise, and different model parameter sources. The difference between the retrieved state and the real state x can therefore be written as a linear combination of the a priori state xa, the real and estimated model parameters p and , respectively, and the measurement noise ϵ:
where G represents the gain matrix, Kp is the sensitivity matrix to the model parameters, I is the identity matrix, and A is the averaging kernel matrix.
The first term of Eq. (B1) refers to the smoothing error, which has been calculated as (A−I) (A−I)T. The matrix is the O3 a priori covariance matrix, which has been computed in this work from the 1999–2018 ECC sonde climatology at IZO according to Schneider and Hase (2008). Note that ECC sondes usually burst between 30 and 34 km, hence this climatology was completed beyond 31 km by using the WACCM version 6 simulations for subtropical latitudes.
The error covariance matrix for measurement noise (Sx,ϵ) is analytically calculated by
where Sy,ϵ is the covariance matrix for measurement noise in the measurement.
The error contribution of the model parameters p can be analytically estimated through the respective error covariance matrices Sx,p:
where Sp is the covariance matrix of the uncertainties Δp. In the current paper, Sp is estimated considering error sources, values, and the partitioning between random and systematic contributions listed in Table B1. They have been identified as the typical error sources and values affecting the different FTIR products (e.g. Hase, 2007; Schneider and Hase, 2008; García et al., 2016; Gordon et al., 2022, and references therein). The statistical and systematic contributions of total parameter errors (TPE, displayed in Fig. 3) are then calculated as the square root of the sum of the squares of all statistical and systematic errors considered, respectively. Note that measurement noise is considered to be purely random, while spectroscopic parameters are purely systematic.
Table B1Error sources and assumed values used in the theoretical uncertainty estimation. The last column shows the contributions of statistical (ST) and systematic (SY) sources to the total error. chann.: channelling; MEA: modulation efficiency amplitude; PE: phase error; int.: intensity; ν-scale: spectral position; S: intensity parameter; ν: pressure-broadening parameter.
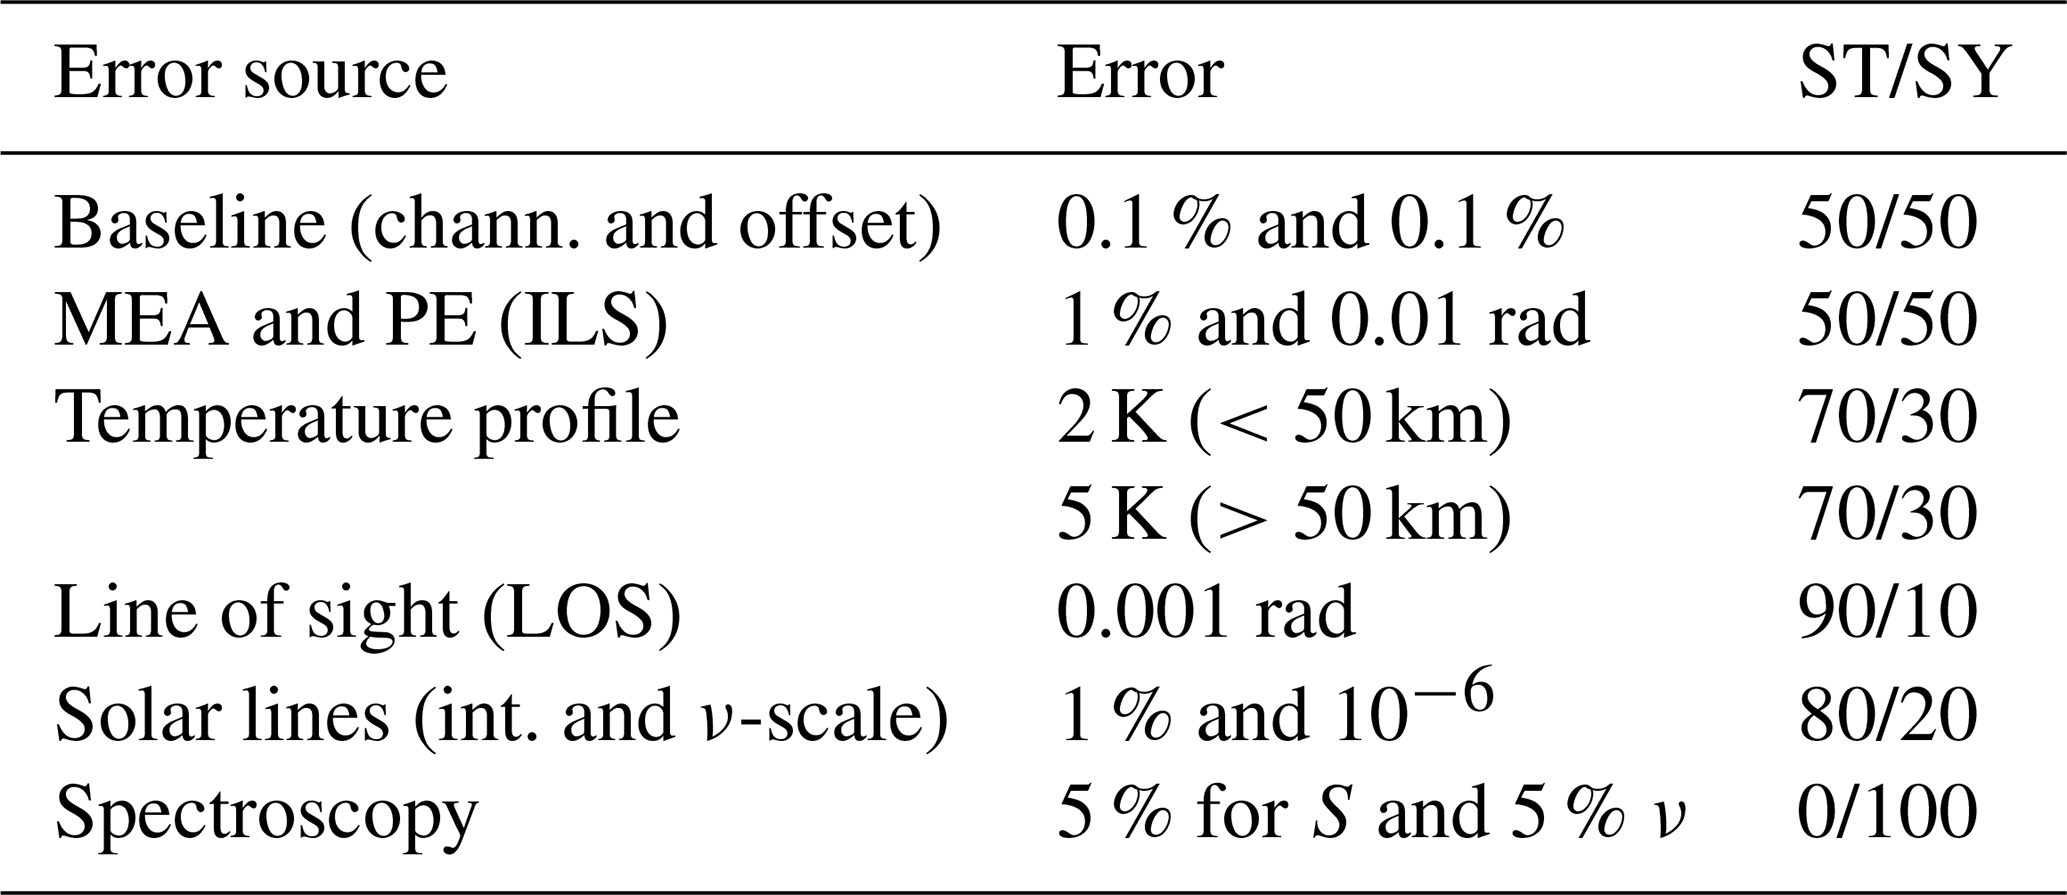
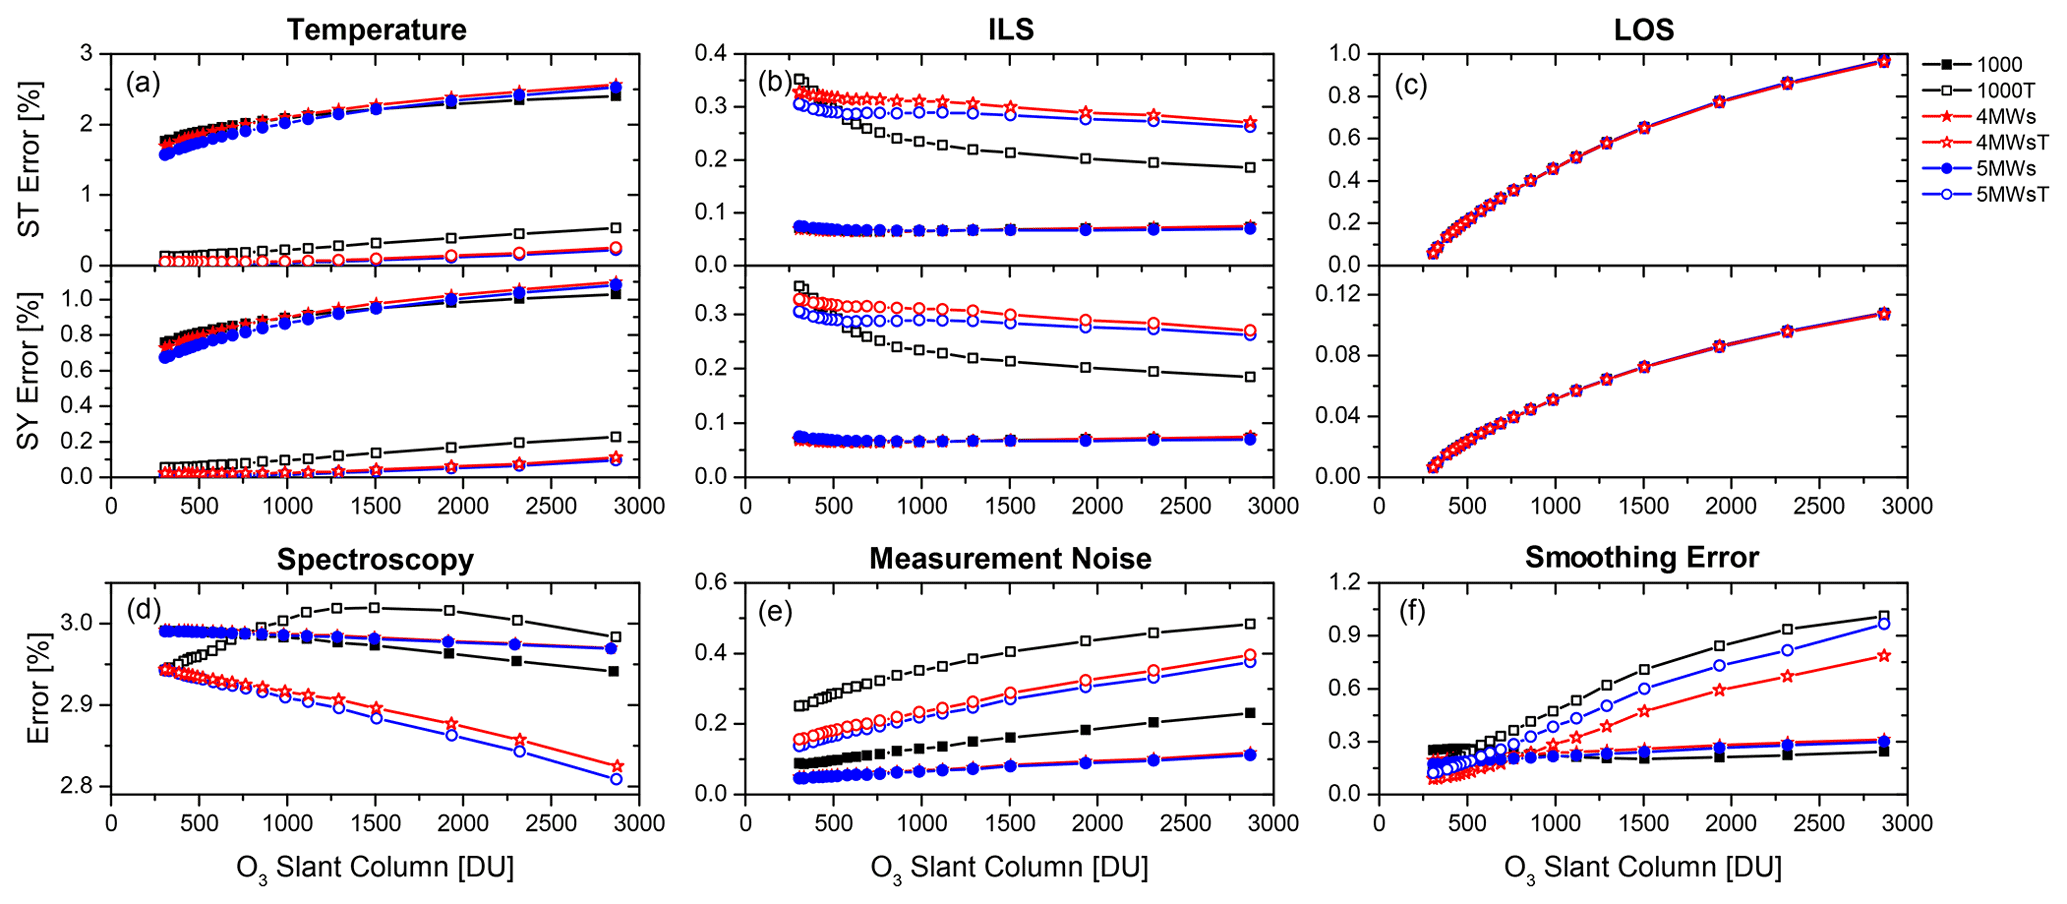
Figure B1Estimated statistical (ST) and systematic (SY) errors (%) for O3 TCs retrieved from all setups for different error sources (a, atmospheric temperature profile, b, ILS function, c, LOS, d, spectroscopic parameters, e, measurement noise, and f, smoothing error) as a function of O3 slant column (DU) for the measurements of Fig. 3.
As shown in Fig. B1, when considering statistical error sources, the main contributors are the atmospheric temperature profile for setups without a temperature fit (error values of 2.0 %–2.5 %) and possible misalignments of the FTIR's solar tracker, given by the LOS, for all setups (error values of up to 1.0 % at larger O3 concentrations). By contrast, O3 TCs are almost insensitive to errors due to ILS uncertainties and measurement noise (error values are smaller than 0.1 %–0.2 %). For the setups with a simultaneous temperature retrieval, this fit generates a significant cross-interference with the ILS function, leading to an increment of the ILS error contribution (Schneider and Hase, 2008; García et al., 2012), but also with the measurement noise and smoothing error (especially for the 1000T setup). However, in return, the temperature error contribution is nearly eliminated, leading to a considerable improvement of ∼ 1 % in the total ST budget. It is worth highlighting that the negative cross-interference between the temperature retrieval and SE is significant for O3 SCs beyond ∼ 500 DU due to the loss of FTIR vertical sensitivity as O3 SCs increase (this threshold encompasses less than 20 % of the O3 observations at IZO). For the typical O3 concentrations observed at IZO, the SE is improved by the temperature fit and is smaller for the 4MWsT/5MWsT setups. This result is corroborated by a comparison to coincident Brewer observations, as shown in Table 2.
Note that in the current work, the measurement noise depends on the quality of the fitted spectra (Hase et al., 2004). Therefore, large values of the measurement noise error are observed where the fit residuals are slightly larger (especially in the broad spectral region, see Fig. B1).
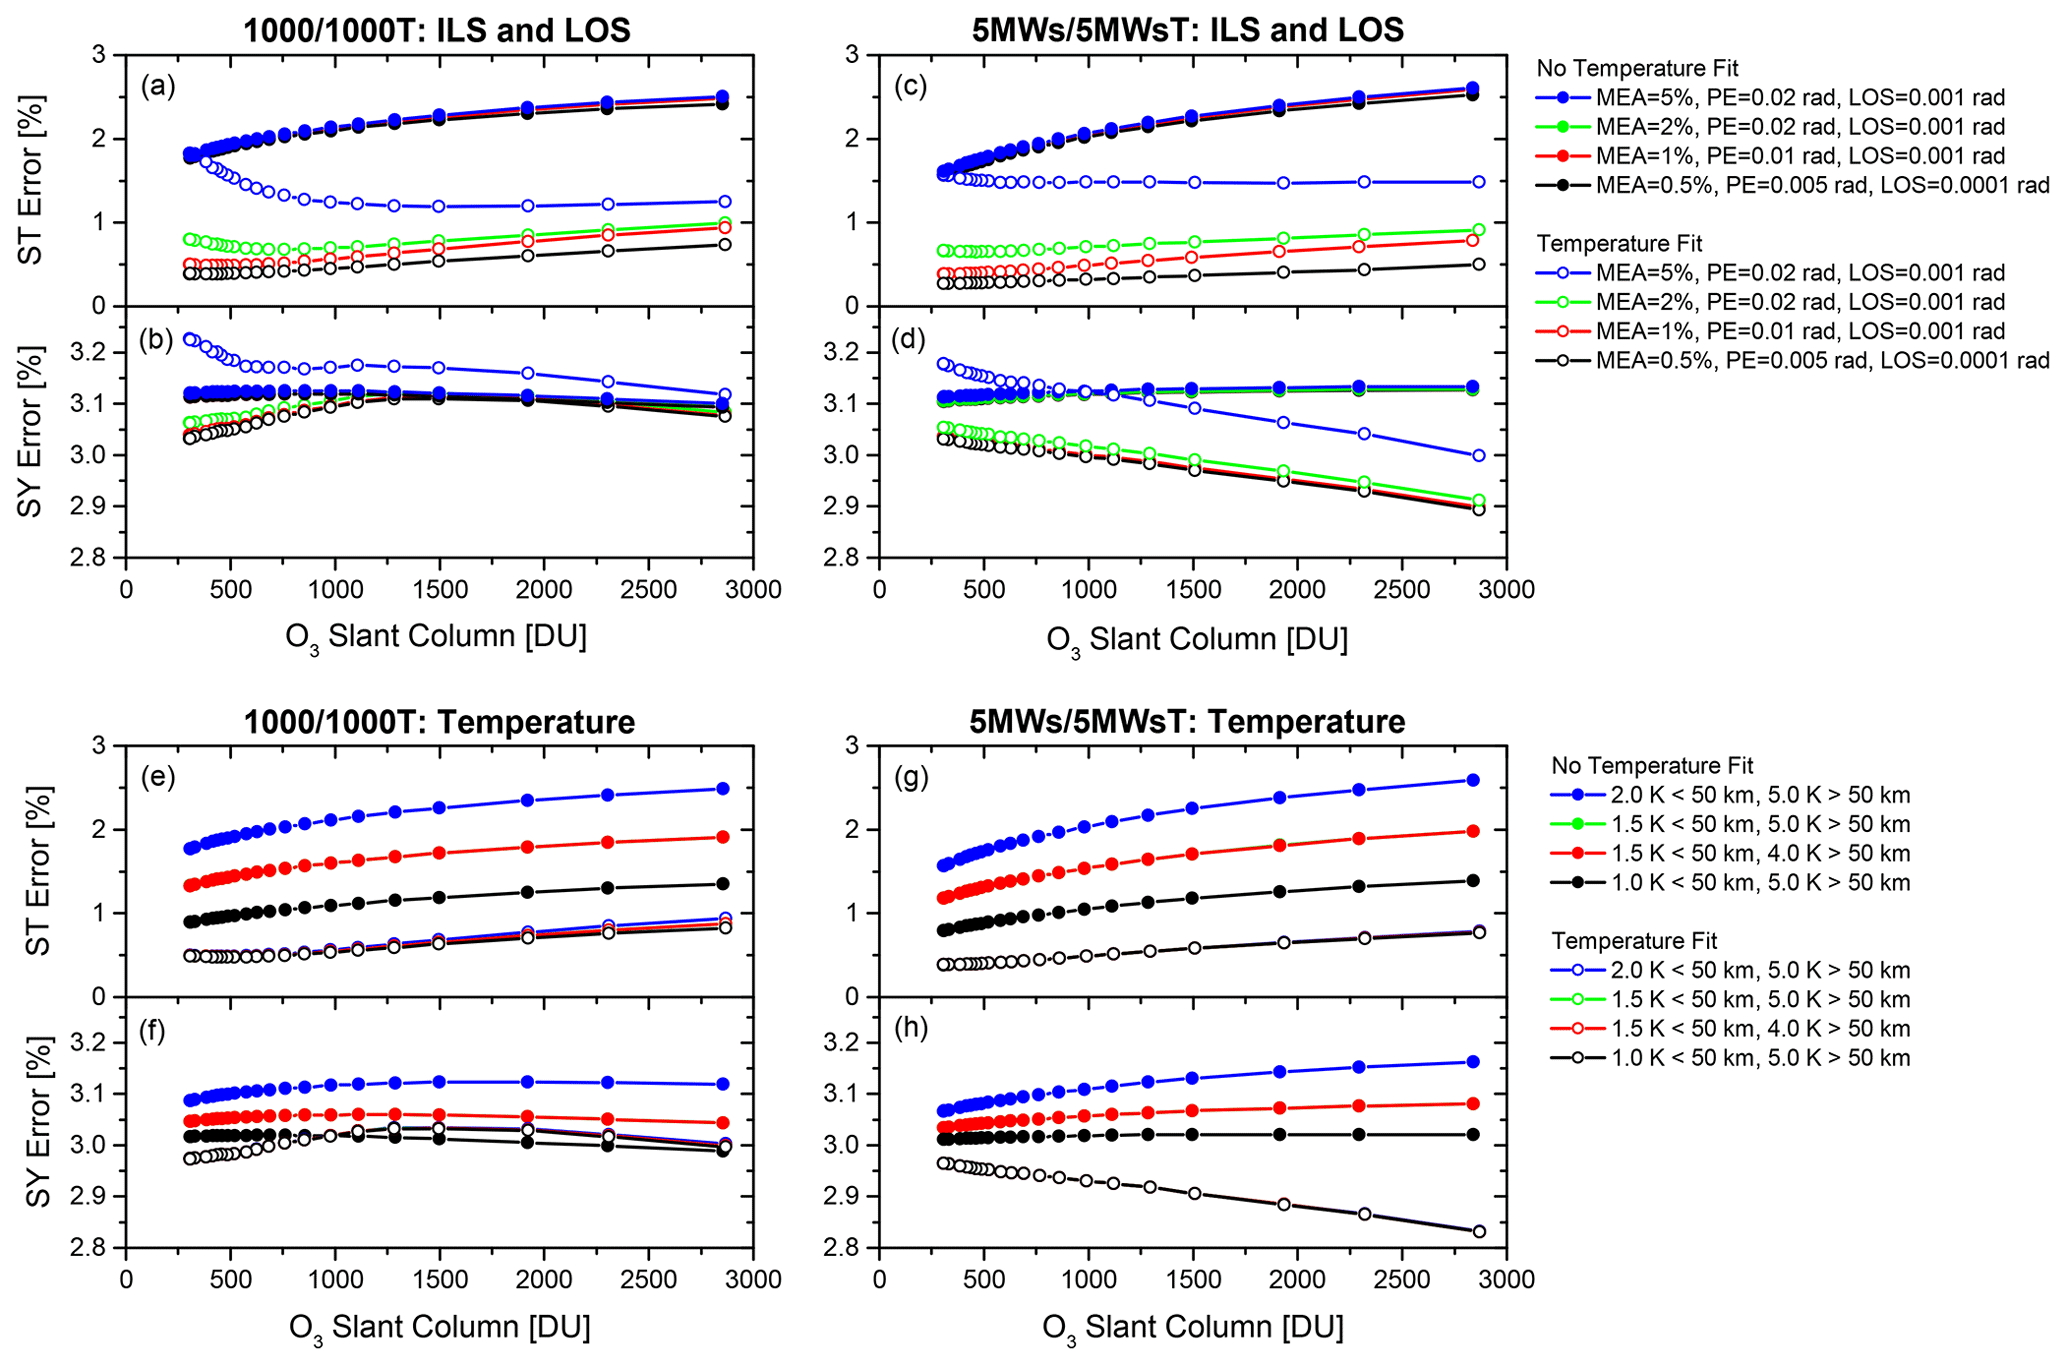
Figure B2Estimated statistical (ST) and systematic (SY) TPE (%) for O3 TCs retrieved from the setups 1000/1000T (a, b, e, f) and 5MWs/5MWsT (c, d, g, h) for different error configurations of the ILS function, LOS, and atmospheric temperature profile as a function of O3 slant column (DU) for the measurements of Fig. 3.
Table B1 lists representative uncertainty values of the IFS 120/HR instrument in the period 2005–2008. However, the error sources associated with instrument status (i.e. ILS function, solar pointing, and measurement noise) can differ depending on the FTIR spectrometer quality and stability. In order to account for this fact, Fig. B2 summarises the effects of the different sets of error values on O3 TCs for the measurement day of Fig. B1. Note that this figure only includes the error estimations for different ILS and LOS configurations (keeping the temperature profile and measurement errors fixed) and for the 1000/1000T and 5MWs/5MWsT setups (the 4MWs/4MWsT error estimations are quite similar to the 5MWs/5MWsT ones, so they have been omitted for simplicity).
The effect of different error sets is only noticeable when the temperature profile is simultaneously estimated with O3 concentrations, likely due to the interference between the ILS function and temperature retrieval. Under these conditions, statistical TPE values range from ∼ 0.5 % for uncertainties of 0.5 % in the MEA and 0.005 rad in the PE (representative of the well-aligned IFS 120/5HR instrument for the period 2008–2018) up to ∼ 1.5 % for an MEA error of 5 % and a PE error of 0.02 rad (representative of the unstable IFS 120M spectrometer). These estimated uncertainties reproduce the changes observed in FTIR O3 quality for the different periods well when compared to Brewer observations (see Table 2). The cross-interference between the temperature fit and other error sources is also evident for systematic contributions, especially for the worst scenario of ILS degradation (MEA uncertainty values of 5 %). Note that the inconsistency for the 1000T setup is also observed for different ILS set errors, corroborating the findings discussed in Sect. 3.2.2.
The FTIR and Brewer data are available by request from the corresponding authors, while the ECC ozonesonde data are available from the NDACC archive (https://www-air.larc.nasa.gov/missions/ndacc/data.html?station=izana/ames/o3sonde/, Torres et al., 2021).
OEG and EsS designed and wrote the structure and methodology of the current paper and computed the calculations required. MS, FH, and TB participated in the retrieval analysis. FH is the author of the LINEFIT and PROFFIT codes. OEG, MS, EsS, and ElS took the routine FTIR measurements and performed the maintenance and quality control of the FTIR instruments. AR, SFLL, and VC are responsible for the maintenance and quality control of the Brewer spectrometers, as well as for estimating the NDACC Brewer ozone observations. CT and NP are in charge of the ozonesonde programme at Izaña Observatory. Finally, all authors discussed the results and contributed to the final paper.
The contact author has declared that neither they nor their co-authors have any competing interests.
Publisher’s note: Copernicus Publications remains neutral with regard to jurisdictional claims in published maps and institutional affiliations.
The Izaña FTIR station has been supported by the German Bundesministerium für Wirtschaft und Energie (BMWi), the Helmholtz Association, the Karlsruhe Institute of Technology (KIT) and the State Meteorological Agency of Spain. The authors also acknowledge the support of the KIT and Izaña staff for maintaining the instrumentation, thus ensuring the quality of the data.
The Izaña FTIR station has been supported by the German Bundesministerium für Wirtschaft und Energie (BMWi) via DLRunder grants 50EE1711A and by the Helmholtz Association via the research programme ATMO. In addition, this research research has been supported by the European Research Council under FP7/(2007–2013)/ERC grant agreement no. 256961 (project MUSICA), by the Deutsche Forschungsgemeinschaft for the project MOTIV (Geschäftszeichen SCHN 1126/2-1), by the Ministerio de Economía y Competitividad of Spain through the projects CGL2012-37505 (project NOVIA) and CGL2016-80688-P (project INMENSE), and by EUMETSAT under its fellowship programme (project VALIASI).
This paper was edited by Christof Janssen and reviewed by Corinne Vigouroux and two anonymous referees.
Austin, J. and Butchart, N.: Coupled chemistry–climate model simulations for the period 1980 to 2020: Ozone depletion and the start of ozone recovery, Q. J. Roy. Meteor. Soc., 129, 3225–3249, https://doi.org/10.1256/qj.02.203, 2003. a
Barret, B., de MazièRe, M., and Demoulin, P.: Retrieval and characterization of ozone profiles from solar infrared spectra at the Jungfraujoch, J. Geophys. Res., 107, 4788, https://doi.org/10.1029/2001JD001298, 2002. a, b
Bass, A. M. and Paur, R. J.: The ultraviolet cross-sections of ozone. I. The measurements, II – Results and temperature dependence, in: Atmospheric Ozone: Proceedings of the Quadrennial Ozone Symposium, Halkidiki, Greece, 3–7 September 1984, vol. 1, 606–616, ISBN 902771942X, 1985. a
Cuevas, E., González, Y., Rodríguez, S., Guerra, J. C., Gómez-Peláez, A. J., Alonso-Pérez, S., Bustos, J., and Milford, C.: Assessment of atmospheric processes driving ozone variations in the subtropical North Atlantic free troposphere, Atmos. Chem. Phys., 13, 1973–1998, https://doi.org/10.5194/acp-13-1973-2013, 2013. a
Cuevas, E., Milford, C., Bustos, J. J., R., García, O. E., García, R. D., Gómez-Peláez, A. J., Guirado-Fuentes, C., Marrero, C., Prats, N., Ramos, R., Redondas, A., Reyes, E., Rivas-Soriano, P. P., Rodríguez, S., Romero-Campos, P. M., Torres, C. J., Schneider, M., Yela, M., Belmonte, J., del Campo-Hernández, R., Almansa, F., Barreto, A., López-Solano, C., Basart, S., Terradellas, E., Werner, E., Afonso, S., Bayo, C., Berjón, A., Carreño, V., Castro, N. J., Chinea, N., Cruz, A. M., Damas, M., De Ory-Ajamil, F., García, M., Gómez-Trueba, V., Hernández, C., Hernández, Y., Hernández-Cruz, B., León-Luís, S. F., López-Fernández, R., López-Solano, J., Parra, F., Rodríguez, E., Rodríguez-Valido, M., Sálamo, C., Sanromá, E., Santana, D., Santo Tomás, F., Sepúlveda, E., and Sosa, E.: Izaña Atmospheric Research Center Activity Report 2017–2018, edited by: Cuevas, E., Milford, C., and Tarasova, O., State Meteorological Agency (AEMET), Madrid, Spain, and World Meteorological Organization (WMO), Geneva, Switzerland, WMO/GAW Report No. 247, https://doi.org/10.31978/666-20-010-X, 2020. a, b
Drouin, B. J., Crawford, T. J., and Yu, S.: Validation of ozone intensities at 10 µm with THz spectrometry, J. Quant. Spectrosc. Ra., 203, 282–292, https://doi.org/10.1016/j.jqsrt.2017.06.035, 2017. a
Duflot, V., Baray, J.-L., Payen, G., Marquestaut, N., Posny, F., Metzger, J.-M., Langerock, B., Vigouroux, C., Hadji-Lazaro, J., Portafaix, T., De Mazière, M., Coheur, P.-F., Clerbaux, C., and Cammas, J.-P.: Tropospheric ozone profiles by DIAL at Maïdo Observatory (Reunion Island): system description, instrumental performance and result comparison with ozone external data set, Atmos. Meas. Tech., 10, 3359–3373, https://doi.org/10.5194/amt-10-3359-2017, 2017. a
Eyring, V., Cionni, I., Bodeker, G. E., Charlton-Perez, A. J., Kinnison, D. E., Scinocca, J. F., Waugh, D. W., Akiyoshi, H., Bekki, S., Chipperfield, M. P., Dameris, M., Dhomse, S., Frith, S. M., Garny, H., Gettelman, A., Kubin, A., Langematz, U., Mancini, E., Marchand, M., Nakamura, T., Oman, L. D., Pawson, S., Pitari, G., Plummer, D. A., Rozanov, E., Shepherd, T. G., Shibata, K., Tian, W., Braesicke, P., Hardiman, S. C., Lamarque, J. F., Morgenstern, O., Pyle, J. A., Smale, D., and Yamashita, Y.: Multi-model assessment of stratospheric ozone return dates and ozone recovery in CCMVal-2 models, Atmos. Chem. Phys., 10, 9451–9472, https://doi.org/10.5194/acp-10-9451-2010, 2010. a
García, O. E., Schneider, M., Redondas, A., González, Y., Hase, F., Blumenstock, T., and Sepúlveda, E.: Investigating the long-term evolution of subtropical ozone profiles applying ground-based FTIR spectrometry, Atmos. Meas. Tech., 5, 2917–2931, https://doi.org/10.5194/amt-5-2917-2012, 2012. a, b, c, d, e, f, g, h, i, j, k
García, O. E., Schneider, M., Hase, F., Blumenstock, T., Sepúlveda, E., and González, Y.: Quality assessment of ozone total column amounts as monitored by ground-based solar absorption spectrometry in the near infrared (> 3000 cm−1), Atmos. Meas. Tech., 7, 3071–3084, https://doi.org/10.5194/amt-7-3071-2014, 2014. a, b, c, d, e, f
García, O. E., Sepúlveda, E., Schneider, M., Hase, F., August, T., Blumenstock, T., Kühl, S., Munro, R., Gómez-Peláez, Á. J., Hultberg, T., Redondas, A., Barthlott, S., Wiegele, A., González, Y., and Sanromá, E.: Consistency and quality assessment of the Metop-A/IASI and Metop-B/IASI operational trace gas products (O3, CO, N2O, CH4, and CO2) in the subtropical North Atlantic, Atmos. Meas. Tech., 9, 2315–2333, https://doi.org/10.5194/amt-9-2315-2016, 2016. a, b, c
García, O. E., Schneider, M., Sepúlveda, E., Hase, F., Blumenstock, T., Cuevas, E., Ramos, R., Gross, J., Barthlott, S., Röhling, A. N., Sanromá, E., González, Y., Gómez-Peláez, Á. J., Navarro-Comas, M., Puentedura, O., Yela, M., Redondas, A., Carreño, V., León-Luis, S. F., Reyes, E., García, R. D., Rivas, P. P., Romero-Campos, P. M., Torres, C., Prats, N., Hernández, M., and López, C.: Twenty years of ground-based NDACC FTIR spectrometry at Izaña Observatory – overview and long-term comparison to other techniques, Atmos. Chem. Phys., 21, 15519–15554, https://doi.org/10.5194/acp-21-15519-2021, 2021. a, b, c
Gaudel, A., Cooper, O., Ancellet, G., Barret, B., Boynard, A., Burrows, J., Clerbaux, C., Coheur, P.-F., Cuesta, J.and Cuevas, E., Doniki, S., Dufour, G., Ebojie, F., Foret, G., García, O., Granados Muños, M., Hannigan, J., Hase, F., Huang, G., Hassler, B., Hurtmans, D., Jaffe, D., Jones, N., Kalabokas, P., Kerridge, B., Kulawik, S., Latter, B., Leblanc, T., Le Flochmoën, E., Lin, W., Liu, J., Liu, X., Mahieu, E., McClure-Begley, A., Neu, J., Osman, M., Palm, M., Petetin, H., Petropavlovskikh, I., Querel, R., Rahpoe, N., Rozanov, A., Schultz, M., Schwab, J., Siddans, R., Smale, D., Steinbacher, M., Tanimoto, H., Tarasick, D., Thouret, V., Thompson, A., Trickl, T., Weatherhead, E., Wespes, C., Worden, H., Vigouroux, C., Xu, X., Zeng, G., and Ziemke, J.: Tropospheric Ozone Assessment Report: Present-day distribution and trends of tropospheric ozone relevant to climate and global atmospheric chemistry model evaluation, Elementa: Science of the Anthropocene, 6, 39, https://doi.org/10.1525/elementa.291, 2018. a, b, c
GCOS: The Status of the Global Climate Observing System 2021: The GCOS Status Report (GCOS-240), Tech. rep., World Meteorological Organization, Geneva, Switzerland, 2021. a
Gordon, I., Rothman, L., Hargreaves, R., Hashemi, R., Karlovets, E., Skinner, F., Conway, E., Hill, C., Kochanov, R., Tan, Y., Wcisło, P., Finenko, A., Nelson, K., Bernath, P., Birk, M., Boudon, V., Campargue, A., Chance, K., Coustenis, A., Drouin, B., Flaud, J., Gamache, R., Hodges, J., Jacquemart, D., Mlawer, E., Nikitin, A., Perevalov, V., Rotger, M., Tennyson, J., Toon, G., Tran, H., Tyuterev, V., Adkins, E., Baker, A., Barbe, A., Canè, E., Császár, A., Dudaryonok, A., Egorov, O., Fleisher, A., Fleurbaey, H., Foltynowicz, A., Furtenbacher, T., Harrison, J., Hartmann, J., Horneman, V., Huang, X., Karman, T., Karns, J., Kassi, S., Kleiner, I., Kofman, V., Kwabia–Tchana, F., Lavrentieva, N., Lee, T., Long, D., Lukashevskaya, A., Lyulin, O., Makhnev, V., Matt, W., Massie, S., Melosso, M., Mikhailenko, S., Mondelain, D., Müller, H., Naumenko, O., Perrin, A., Polyansky, O., Raddaoui, E., Raston, P., Reed, Z., Rey, M., Richard, C., Tóbiás, R., Sadiek, I., Schwenke, D., Starikova, E., Sung, K., Tamassia, F., Tashkun, S., Vander Auwera, J., Vasilenko, I., Vigasin, A., Villanueva, G., Vispoel, B., Wagner, G., Yachmenev, A., and Yurchenko, S.: The HITRAN2020 molecular spectroscopic database, J. Quant. Spectrosc. Ra., 277, 107949, https://doi.org/10.1016/j.jqsrt.2021.107949, 2022. a, b
Gratien, A., Picquet-Varrault, B., Orphal, J., Doussin, J.-F., and Flaud, J.-M.: New Laboratory Intercomparison of the Ozone Absorption Coefficients in the Mid-infrared (10 µm) and Ultraviolet (300–350 nm) Spectral Regions, J. Phys. Chem., 114, 10045–10048, https://doi.org/10.1021/jp103992f, 2010. a
Gröbner, J., Redondas, A., Weber, M., and Bais, A.: Final report of the project Traceability for atmospheric total column ozone (ENV59, ATMOZ), Tech. rep., EURAMET, https://www.euramet.org/research-innovation/search-research-projects/details/project/traceability-for-atmospheric-total-column-ozone/ (last access: 31 March 2022), 2017. a
Gröbner, J., Schill, H., Egli, L., and Stübi, R.: Consistency of total column ozone measurements between the Brewer and Dobson spectroradiometers of the LKO Arosa and PMOD/WRC Davos, Atmos. Meas. Tech., 14, 3319–3331, https://doi.org/10.5194/amt-14-3319-2021, 2021. a
Hase, F.: Error Estimation in PROFFIT revisited, in: NDSC IRWG Meeting, Tenerife, Spain, 1–3 May 2007, NDACC/IRWG, https://www2.acom.ucar.edu/irwg (last access: 31 March 2022), 2007. a
Hase, F.: Improved instrumental line shape monitoring for the ground-based, high-resolution FTIR spectrometers of the Network for the Detection of Atmospheric Composition Change, Atmos. Meas. Tech., 5, 603–610, https://doi.org/10.5194/amt-5-603-2012, 2012. a
Hase, F., Hannigan, J., Coffey, M., Goldman, A., Hopfner, M., Jones, N., Rinsland, C., and Wood, S.: Intercomparison of retrieval codes used for the analysis of high-resolution, ground-based FTIR measurements, J. Quant Spectrosc. Ra., 87, 25–52, https://doi.org/10.1016/j.jqsrt.2003.12.008, 2004. a, b, c
IRWG: Uniform Retrieval Parameter Summary, NDACC/IRWG, http://www.acom.ucar.edu/irwg/IRWG_Uniform_RP_Summary-3.pdf (last access: 31 March 2022), 2014. a, b, c, d
Komhyr, W.: Operations handbook – Ozone measurements to 40 km altitude with model 4AECC-ozone sondes, Tech. rep., National Oceanic and Atmospheric Administration, Technical Memorandum ERL-ARL-149, 1986. a
Lanzante, J. R.: Resistant, robust and non-parametric techniques or the analysis of climate data: theory and examples, including applications to historical radiosonde station data, Int. J. Climatol., 16, 1197–1226, 1996. a
León-Luis, S. F., Redondas, A., Carreño, V., López-Solano, J., Berjón, A., Hernández-Cruz, B., and Santana-Díaz, D.: Internal consistency of the Regional Brewer Calibration Centre for Europe triad during the period 2005–2016, Atmos. Meas. Tech., 11, 4059–4072, https://doi.org/10.5194/amt-11-4059-2018, 2018. a
Lindenmaier, R., Batchelor, R. L., Strong, K., Fast, H., Goutail, F., Kolonjari, F., C. T. McElroy, R. L. M., and Walker, K. A.: An evaluation of infrared microwindows for ozone retrievals using the Eureka Bruker 125HR Fourier transform spectrometer, J. Quant. Spectrosc. Ra., 111, 569–585, https://doi.org/10.1016/j.jqsrt.2009.10.013, 2010. a
Piquet-Varrault, B., Orphal, J., Doussin, J. F., Carlier, P., and Flaud, J. M.: Laboratory Intercomparaison of the Ozone Absorption Coefficients in the Mid-infrared (10 µm) and Ultarviolet (300–350 nm) Spectral Regions, J. Phys. Chem., 109, 1008–1014, https://doi.org/10.1021/jp0405411, 2005. a
Redondas, A., Evans, R., Stuebi, R., Köhler, U., and Weber, M.: Evaluation of the use of five laboratory-determined ozone absorption cross sections in Brewer and Dobson retrieval algorithms, Atmos. Chem. Phys., 14, 1635–1648, https://doi.org/10.5194/acp-14-1635-2014, 2014. a, b
Rimmer, J. S., Redondas, A., and Karppinen, T.: EuBrewNet – A European Brewer network (COST Action ES1207), an overview, Atmos. Chem. Phys., 18, 10347–10353, https://doi.org/10.5194/acp-18-10347-2018, 2018. a
Rodgers, C.: Inverse Methods for Atmospheric Sounding: Theory and Praxis, World Scientific Publishing Co., Singapore, ISBN 981-02-2740-X, 2000. a, b, c, d
Rothman, L., Gordon, I., Barbe, A., Benner, D., Bernath, P., Birk, M., Boudon, V., Brown, L., Campargue, A., Champion, J.-P., Chance, K., Coudert, L., Dana, V., Devi, V., Fally, S., Flaud, J.-M., Gamache, R., Goldman, A., Jacquemart, D., Kleiner, I., Lacome, N., Lafferty, W., Mandin, J.-Y., Massie, S., Mikhailenko, S., Miller, C., Moazzen-Ahmadi, N., Naumenko, O., Nikitin, A., Orphal, J., Perevalov, V., Perrin, A., Predoi-Cross, A., Rinsland, C., Rotger, M., Šimečková, M., Smith, M., Sung, K., Tashkun, S., Tennyson, J., Toth, R., Vandaele, A., and Auwera, J. V.: The HITRAN 2008 molecular spectroscopic database, J. Quant. Spectrosc. Rad., 110, 533–572, https://doi.org/10.1016/j.jqsrt.2009.02.013, 2009. a
Schneider, M. and Hase, F.: Technical Note: Recipe for monitoring of total ozone with a precision of around 1 DU applying mid-infrared solar absorption spectra, Atmos. Chem. Phys., 8, 63–71, https://doi.org/10.5194/acp-8-63-2008, 2008. a, b, c, d, e, f, g, h
Schneider, M., Redondas, A., Hase, F., Guirado, C., Blumenstock, T., and Cuevas, E.: Comparison of ground-based Brewer and FTIR total column O3 monitoring techniques, Atmos. Chem. Phys., 8, 5535–5550, https://doi.org/10.5194/acp-8-5535-2008, 2008a. a, b, c, d, e, f, g, h
Schneider, M., Hase, F., Blumenstock, T., Redondas, A., and Cuevas, E.: Quality assessment of O3 profiles measured by a state-of-the-art ground-based FTIR observing system, Atmos. Chem. Phys., 8, 5579–5588, https://doi.org/10.5194/acp-8-5579-2008, 2008b. a, b, c, d, e
Schneider, M., Barthlott, S., Hase, F., González, Y., Yoshimura, K., García, O. E., Sepúlveda, E., Gomez-Pelaez, A., Gisi, M., Kohlhepp, R., Dohe, S., Blumenstock, T., Wiegele, A., Christner, E., Strong, K., Weaver, D., Palm, M., Deutscher, N. M., Warneke, T., Notholt, J., Lejeune, B., Demoulin, P., Jones, N., Griffith, D. W. T., Smale, D., and Robinson, J.: Ground-based remote sensing of tropospheric water vapour isotopologues within the project MUSICA, Atmos. Meas. Tech., 5, 3007–3027, https://doi.org/10.5194/amt-5-3007-2012, 2012. a
Steinbrecht, W., Froidevaux, L., Fuller, R., Wang, R., Anderson, J., Roth, C., Bourassa, A., Degenstein, D., Damadeo, R., Zawodny, J., Frith, S., McPeters, R., Bhartia, P., Wild, J., Long, C., Davis, S., Rosenlof, K., Sofieva, V., Walker, K., Rahpoe, N., Rozanov, A., Weber, M., Laeng, A., von Clarmann, T., Stiller, G., Kramarova, N., Godin-Beekmann, S., Leblanc, T., Querel, R., Swart, D., Boyd, I., Hocke, K., Kämpfer, N., Maillard Barras, E., Moreira, L., Nedoluha, G., Vigouroux, C., Blumenstock, T., Schneider, M., García, O., Jones, N., Mahieu, E., Smale, D., Kotkamp, M., Robinson, J., Petropavlovskikh, I., Harris, N., Hassler, B., Hubert, D., and Tummon, F.: An update on ozone profile trends for the period 2000 to 2016, Atmos. Chem. Phys., 17, 10675–10690, https://doi.org/10.5194/acp-17-10675-2017, 2017. a
Torres, C., Prats, N., Redondas, A., and Cuevas, E.: ECC Ozonesondes data from Izaña (Spain), Network for the Detection of Atmospheric Composition Change [data set], https://www-air.larc.nasa.gov/missions/ndacc/data.html?station=izana/ames/o3sonde/ (last access: 31 March 2022), 2021. a
Tyuterev, V. G., Barbe, A., Jacquemart, D., Janssen, C., Mikhailenko, S. N., and Starikova, E. N.: Ab initio predictions and laboratory validation for consistent ozone intensities in the MW, 10 and 5 µm ranges, J. Chem. Phys., 150, 184303, https://doi.org/10.1063/1.5089134, 2019. a
Viatte, C., Schneider, M., Redondas, A., Hase, F., Eremenko, M., Chelin, P., Flaud, J.-M., Blumenstock, T., and Orphal, J.: Comparison of ground-based FTIR and Brewer O3 total column with data from two different IASI algorithms and from OMI and GOME-2 satellite instruments, Atmos. Meas. Tech., 4, 535–546, https://doi.org/10.5194/amt-4-535-2011, 2011. a
Vigouroux, C., De Mazière, M., Demoulin, P., Servais, C., Hase, F., Blumenstock, T., Kramer, I., Schneider, M., Mellqvist, J., Strandberg, A., Velazco, V., Notholt, J., Sussmann, R., Stremme, W., Rockmann, A., Gardiner, T., Coleman, M., and Woods, P.: Evaluation of tropospheric and stratospheric ozone trends over Western Europe from ground-based FTIR network observations, Atmos. Chem. Phys., 8, 6865–6886, https://doi.org/10.5194/acp-8-6865-2008, 2008. a, b
Vigouroux, C., Blumenstock, T., Coffey, M., Errera, Q., García, O., Jones, N. B., Hannigan, J. W., Hase, F., Liley, B., Mahieu, E., Mellqvist, J., Notholt, J., Palm, M., Persson, G., Schneider, M., Servais, C., Smale, D., Thölix, L., and De Mazière, M.: Trends of ozone total columns and vertical distribution from FTIR observations at eight NDACC stations around the globe, Atmos. Chem. Phys., 15, 2915–2933, https://doi.org/10.5194/acp-15-2915-2015, 2015. a, b, c, d, e
Weatherhead, E. C., Reinsel, G. C., Tiao, G. C., Jackman, C. H., Bishop, L., Frith, S. M. H., DeLuisi, J., Keller, T., Oltmans, S. J., Fleming, E. L., Wuebbles, D. J., Kerr, J. B., Miller, A. J., Herman, J., McPeters, R., Nagatani, R. M., and Frederick, J. E.: Detecting the recovery of total column ozone, J. Geophys. Res., 105, 22201–22210, https://doi.org/10.1029/2000JD900063, 2000. a
WMO: Scientific Assessment of Ozone Depletion: 2014, Global Ozone Research and Monitoring Project–Report No. 55, Tech. rep., World Meteorological Organization, Geneva, Switzerland, 2014a. a, b, c
WMO: Quality assurance and quality control for ozonesonde measurements in GAW, World Meteorological Organization (WMO)-Report No. 201, Tech. rep., edited by: Smit, H. G. J. and ASOPOS panel, World Meteorological Organization, Geneva, Switzerland, 2014b. a
WMO: Scientific Assessment of Ozone Depletion: 2018, Global Ozone Research and Monitoring Project – Report No. 58, Tech. rep., World Meteorological Organization, Geneva, Switzerland, 588 pp., ISBN 978-1-7329317-1-8, 2018. a, b, c, d
- Abstract
- Introduction
- Izaña Observatory and its ozone programme
- FTIR ozone observations
- Comparison to reference observations
- Summary and conclusions
- Appendix A: Water vapour treatment
- Appendix B: Uncertainty analysis
- Data availability
- Author contributions
- Competing interests
- Disclaimer
- Acknowledgements
- Financial support
- Review statement
- References