the Creative Commons Attribution 4.0 License.
the Creative Commons Attribution 4.0 License.
 | 02 May 2022
Development, characterization, and application of an improved online reactive oxygen species analyzer based on the Monitor for AeRosols and Gases in ambient Air (MARGA)
Jiyan Wu
Chi Yang
Chunyan Zhang
Fang Cao
Aiping Wu
Excessive reactive oxygen species (ROS) in the human body is an important factor leading to diseases. Therefore, research on the content of reactive oxygen species in atmospheric particles is necessary. In recent years, the online detection technology of ROS has been developed. However, there are few technical studies on online detection of ROS based on the dithiothreitol (DTT) method. Here, to modify the instrument, a DTT experimental module is added that is protected from light and filled with nitrogen at the end based on the Monitor for AeRosols and Gases in ambient Air (MARGA). The experimental study found that the detection limit of the modified instrument is 0.024 nmol min−1. The DTT consumption rate of blank sample (ultrapure water) is reduced by 44 %, which eliminates the influence of outside air and light in the experiment. And the accuracy of the online instrument is determined by comparing the online and offline levels of the samples, which yielded good consistency (slope 0.97, R2=0.95). It shows that the performance of the instrument is indeed optimized, the instrument is stable, and the characterization of ROS is accurate. The instrument not only realizes online detection conveniently and quickly, but also achieves the hour-by-hour detection of ROS based on the DTT method. Meanwhile, reactive oxygen and inorganic ions in atmospheric particles are quantified using the online technique in the northern suburbs of Nanjing. It is found that the content of ROS during the day is higher than that at night, especially after it rains; ROS peaks appear in the two time periods of 08:00–10:00 and 16:00–18:00 (China Standard Time, UTC+8:00; expressed here in local time – LT). In addition, examination of the online ROS, water-soluble ion (, , , Na+, Ca2+, K+), BC, and polluting gas (SO2, CO, O3, NO, NOx) measurements revealed that photo-oxidation and secondary formation processes could be important sources of aerosol ROS. This breakthrough enables the quantitative assessment of atmospheric particulate matter ROS at the diurnal scale, providing an effective tool to study sources and environmental impacts of ROS.
- Article
(2229 KB) - Full-text XML
-
Supplement
(477 KB) - BibTeX
- EndNote


Air quality is a major issue affecting human health, and prolonged exposure to high ambient particulate concentrations can lead to a significant increase in the probability of respiratory and cardiovascular diseases, which can seriously impair human health (Delfino et al., 2005; Ghio et al., 2012; Pöschl and Shiraiwa, 2015). The production of reactive oxygen species (ROS) in the human body is the most reliable pathophysiological mechanism proposed, and excessive reactive oxygen species can cause an imbalance between the oxidative system and the antioxidant system, causing oxidative stress and tissue damage (Ahmad et al., 2021; Akhtar et al., 2010; Borm et al., 2007; Delfino et al., 2013; Lodovici and Bigagli, 2011). Thus, oxidative potential (OP) has been proposed as a more biologically relevant indicator than particulate matter (PM) mass concentration to represent the combined effects of multiple toxic components in PM (Ayres et al., 2008; Hellack et al., 2015; Janssen et al., 2015). Understanding the generation mechanism and source characteristics of reactive oxygen species is essential for making reasonable pollution control decisions and reducing their impact on human health.
In recent years, the analysis method of oxidation potential has had cell detection and cell-free detection. To provide a simpler and quicker way to determine the oxidation potential of environmental particulate matter, cell-free methods such as electron spin (or paramagnetic) resonance (OPESR), dithiothreitol assays (OPDTT), ascorbic acid assays (OPAA), high-performance liquid chromatography (HPLC), and glutathione assays (OPGSH) are often used as the main measurement methods for ROS (Bates et al., 2019; Ghio et al., 2012). Through the comparison and analysis of these various methods by a large number of researchers, the DTT method is generally considered to be the most common and comprehensive method to reflect the magnitude of the chemical oxidation potential of particulate matter (Hedayat et al., 2014; Xiong et al., 2017).
Generally, the cell-free method still has problems with detection delays and degradation of particulate chemical components during sample storage, which not only leads to inaccurate detection data, but also the inability to capture daily changes. Therefore, the development of online detection technology has become necessary (Charrier et al., 2016; Dou et al., 2015; Fang et al., 2017; Li et al., 2012; Liu et al., 2014; Velali et al., 2016; Vreeland et al., 2017). So far, the development of online detection technology has mainly been based on the 2,7-dichlorofluorescein (DCFH) method and the DTT method. On the one hand, online detection technology based on the DCFH method has been reported previously (Eiguren-Fernandez et al., 2017; Huang et al., 2016; Sameenoi et al., 2012; Wragg et al., 2016). However, some researchers believe that in the DCFH method, the horseradish peroxidase (HRP) will promote the production of hydroxyl free radicals, leading to an overestimation of ROS content (Pal et al., 2012). On the other hand, the DTT method can be used to develop online detection technology (Fang et al., 2015; Puthussery et al., 2018), The semiautomatic detection system researched by Fang et al. (2015) based on the DTT method cannot realize an online collection of environmental samples. On this basis, Puthussery et al. (2018) used a mist chamber (MC) to continuously collect PM2.5 in environmental water and realized fully automatic hourly ROS detection.
However, these detection methods ignore the influence of air and light on the experiment. As the main reagent of the experiment, dithiothreitol (DTT) and 5,5'-dithiobis (2-nitrobenzoic acid) (DTNB) are easily oxidized by air (Chen et al., 2010). We achieve accurate measurement of the oxidation potential of environmental particulates by shielding the experiment from light and filling with nitrogen. In addition, the present study is developed on the basis of the MARGA, which is a state-of-art instrument. MARGA measures near-real-time water-soluble particulate species and their gaseous precursors (Chen et al., 2017). MARGA is used to collect particulate matter and is connected to the optimized DTTV detection part to observe the oxidation potential hour by hour. The system realizes simultaneous observation of oxidation potential and inorganic ions. Here, we optimize the performance of the instrument and measure the hourly averaged OP of ambient PM2.5. The reliability of online detection of oxidation potential data is supported by analyzing the correlation between ions, polluting gases, BC, and oxidation potential.
2.1 Instrument setup and improvement
Figure 1 shows the scheme and schematic diagram of the system for DTT online detection. The instrument is set up in the atmospheric environmental monitoring laboratory on the roof of the Wende Building of the Nanjing University of Information Engineering (30 m above the ground), and the room temperature is maintained at 20 ∘C. The entire system is composed of the MARGA, the automatic sample-receiving device, and the DTT experimental reaction device. The MARGA is used as an instrument for detecting atmospheric aerosols and inorganic components of gases (water-soluble ions Cl−, , , , Na+, K+, Mg2+, Ca2+), and it collects gases using a wet rotary separator and aerosols using steam injection; it absorbs gases and aerosols into the aqueous phase separately to separate them from each other. Then, the resulting solution is analyzed by ion chromatography equipped with a conductivity detector. That is, the gas and aerosol are analyzed separately to detect the gas precursors and different ionic compositions in the aerosol.
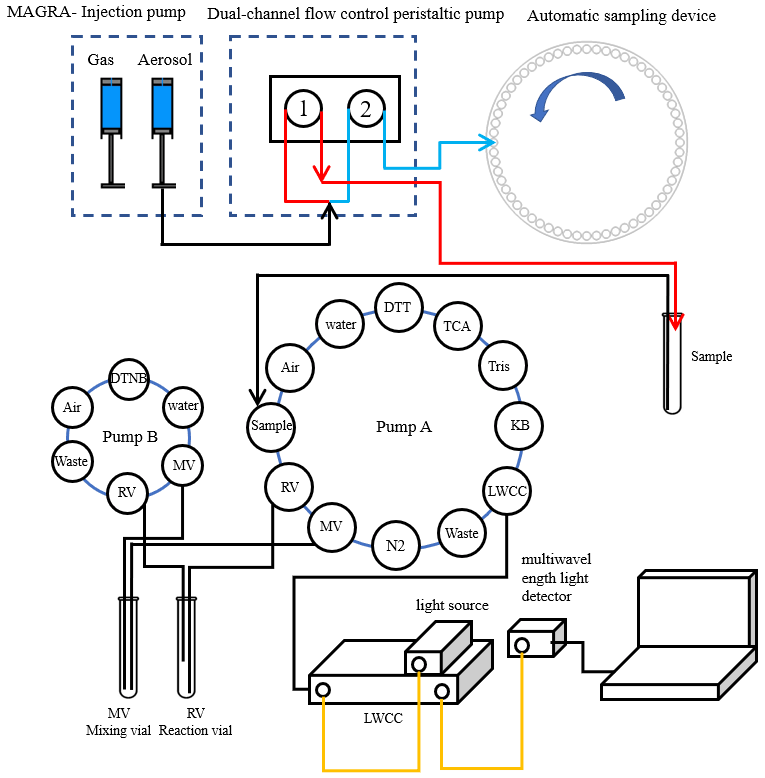
Figure 1Automated system setup (red line: peristaltic pump 1 runs at a flow rate of 23 mL h−1 for the first 4 min of each hour; blue line: peristaltic pump 2 runs at a flow rate of 27 mL h−1 for the remaining 56 min of each hour; yellow line: optical fiber).
In past studies, MARGA was often used to detect the content of inorganic components of atmospheric aerosols and gases in cities around the world (Rumsey et al., 2014). And Chen et al. conducted a special evaluation study on the accuracy and precision of MARGA (Chen et al., 2017). In addition, Stieger et al. (2019) achieved quantitative analysis of low-molecular-weight organic acids in the atmospheric gas phase and particle phase by modifying MARGA (Stieger et al., 2019). Hemmilä et al used a MARGA ligation, an electrospray ionization quadrupole mass spectrometer (MS), to achieve 1 h resolution quantification of seven different amines in gas and particulate phases in forest air in northern Finland (Hemmilä et al., 2018). As a mature commercial instrument, MARGA can measure the inorganic components of atmospheric aerosols and gases with 1 h resolution. In this study, based on MARGA, the DTT experimental part is connected to realize the hour-by-hour simultaneous detection of aerosol inorganic components and ROS.
In the DTT reaction module, to avoid the influence of light and air on the experiment, all pipelines, reaction flasks, and mixing flasks are sealed and protected from light by aluminum foil. The whole DTT experimental part was filled with N2 by pump A and pump B before the experiment started. In addition, we added a refrigerator to store DTT, DTNB, and other experimental solutions. During the DTT experiment, the reaction tube and mixing tube were placed in an incubator at 37 ∘C to simulate the temperature of human lungs. To realize the subsequent DTT experimental reactions, as in Fig. 1, we collected the liquid-phase aerosols into sample tubes through a dual-channel split-flow controlled-volume peristaltic pump and set peristaltic pump 1 speed to 1.55 mL h−1 to finish 1.5 mL h−1 of sample volume.
Finally, the determination of DTT activity is achieved by the continuous regular operation of the programmable pumps A and B and the detection of the spectrophotometer (see Sect. 2.2.1 for details).
2.2 Method
2.2.1 Online DTT assay measurement
The whole measurement step is divided into three steps: sample collection, DTT reaction part, and spectrophotometer detection. In the first step (the sample collection), the MARGA will discharge 25 mL of aerosol liquid every hour and use the dual-channel split-flow controlled-volume peristaltic pump 1 to add 1.55 mL of the solution (to ensure 1.5 mL of sample) into the sample tube, and the rest will enter the automatic sampling device through the peristaltic pump 2 (the automatic sampler is set to rotate one grid per hour).
In the second step (the part is protected from light and in a nitrogen environment), the reaction part is divided into a DTT oxidation step and a DTT determination step (Wang et al., 2019). First (DTT oxidation step), use pump A to add 5 mL of potassium phosphate buffer (0.1 mol L−1), 1.5 mL of aerosol extract sample, and 0.5 mL of DTT (1 mmol L−1) into the mixing bottle (MV) in sequence. Take in ultrapure water to clean the syringe of pump A. DTT reacts with the aerosol extract in MV. To adapt to the experimental process, the concentration and addition volume of each substance are changed in the experiment, but the concentration of each substance in the mixed solution is similar to that of Cho et al. (2005). Lin et al. found that the initial DTT concentration will affect the final DTTV value (Lin and Yu, 2019). During the experiment, the initial DTT concentration was always kept at 1 mM, so it did not affect the judgment of the daily change in ROS content.
Second (DTT determination step), after completing the first step, at 0.10.20.30.40 min, use pump A to draw 1 mL of mixed solution in the mixing bottle and add it to the reaction bottle. Then, immediately add 1 mL of TCA (10 % ; quencher) to the reaction vial (RV, wrapped in aluminum foil to prevent possible light interference) using pump A. Add 0.05 mL of DTNB (1 mmol L−1) via pump B and mix. The residual DTT reacts with DTNB to form light absorption product 2-nitro-5-thiobenzoic acid (TNB) with high extinction performance at 412 nm.
In the third step, in the detection part of the spectrophotometer, use pump A to add 4 mL of tris buffer (0.4 mol L−1, containing 20 mmol L−1 EDTA) into the reaction flask (RV). After the reaction is completed, use pump A to add the final mixture solution in the reaction flask to the LWCC for the absorbance test. The data acquisition software (Spectra Suite) records the absorbance at 412 and 700 nm every 10 min (select the baseline absorbance of TNB). Then, the system uses deionized water (deionized water) for self-cleaning to eliminate any residual liquid in the reaction flask, tubing, syringe, and LWCC. To determine the rate of DTT consumption, the time interval is 10 min, and a total of 6 (0, 10, 20, 30, 40, 50 min) data points of DTT concentration over time are generated. Finally, the automated system performs the self-cleaning procedure again to ensure that there is no residue, and the system repeats the above operations in the next hour to realize hourly detection of DTT activity.
Here, σAbs is the slope of absorbance versus time, Abs0 is the initial absorbance calculated from the intercept of the linear regression of absorbance versus time, and N0 is the initial moles of DTT added in the reaction vial. ΔDTTs (nmol min−1) is the DTTv consumption rate of the sample, ΔDTTb (nmol min−1) is the blank DTT consumption rate, Vt (m3) is the sampling volume corresponding to the sample, Vs (mL) is the injection volume, and Ve (mL) is the sampling volume.
2.2.2 Online DTT instrument performance
The performance of the automated system is characterized by testing to determine the instrument response, limit of detection (LOD), precision, and accuracy, while using a large flow sampler to collect samples for offline and online comparative analysis (see Sect. 3.1 for details).
We perform DTT activity detection and comparison on samples collected by 9,10-phenanthraquinone (PQN) and offline high-flow samplers. First, we select PQN with concentrations of 0.01, 0.02, 0.025, 0.05, and 0.085 nmol L−1 to compare online and offline DTT activity detection to determine the error of online and offline experiments. The details of PQN analysis can be found in Sect. S1 in the Supplement. Secondly, select 10 offline-collected samples for online and offline comparison, and then combine the experimental error between online and offline determined by PQN (PQN online and offline orthogonal fitting) to analyze the accuracy of online and offline.

Figure 2Schematic diagram of the DTT reaction part (1–4 represent the DTT oxidation step, 5–9 represent the DTT determination step). Blue indicates the ventilation line, and all pipelines are wrapped in aluminum foil to protect them from light.

Figure 3Comparison of blank DTT consumption rate and standard deviation after system optimization (the dotted line is the average value).
2.2.3 Instrument maintenance
The MARGA is calibrated using internal and external standards. The internal standard is a 10 mg L−1LiBr solution. The external standard calibration is performed after replacing the anion and cation columns, and the replacement cycle is generally 4 to 5 months. At the same time, the MARGA system is cleaned with 1 % hydrogen peroxide and 10 % acetone solution, and the airflow is calibrated every 2 months. In the DTT experimental module, DTT and DTNB solutions are prepared every 4 d. Before each test, perform a comprehensive light and nitrogen bag inspection. To ensure the accuracy of the experimental data, a standard curve was measured before each experiment. The instrument pipeline is cleaned once a week, as shown in Fig. 2. The programmable pump A and pump B are connected to the ultrapure water channel. During the cleaning process, all pipelines, reaction tubes, and mixing tubes are cleaned.
2.3 Collection and preparation of environmental samples
The sampling point is located on the roof of the seventh floor of the maintenance branch (34∘58′ N, 117∘26′ E) of the power company, Yunlong District, Xuzhou city. The surrounding buildings mainly include auto repair shops, logistics centers, pharmaceutical factories, and large residential areas and farmland. A large flow PM2.5 sampler (KC-6120) is used for continuous sampling, and a total of 10 samples are collected (21–31 October 2018). When sampling, the flow rate is 1.0 m3 min−1, and each sampling time is 24 h. In this study, we collected samples using quartz filters and stored them in a refrigerator at −26 ∘C. Before the start of the experiment, the collected samples were subjected to extraction processing; a sample film with a diameter of 16 mm was cut into a brown glass bottle, 5 mL of ultrapure water was added to shake for 30 min, and the solution was filtered with a 0.22 µm polytetrafluoroethylene (PTFE) syringe filter to remove insoluble substances.
3.1 Instrument performance
3.1.1 Improvement of the instrument
As is well known, photo-oxidation promotes the generation of ROS (Fang et al., 2016; Visentin et al., 2016; Yang et al., 2014). In addition, during the measurement process, the ingress of air inside the instrument will also cause the DTT activity to increase. Therefore, before on-site deployment, the online DTT inspection instrument is optimized by filling in nitrogen gas and shielding the whole setup from light as well as to respectively detect the DTT consumption rate (ΔDTT) of 10 blanks (ultrapure water) before and after optimization. As shown in Fig. 3, before the system optimization, we found that the average ΔDTT measured by 10 blanks was 0.25±0.04 nmol min−1, and there is a big fluctuation. After optimization, the average ΔDTT is 0.14±0.008 nmol min−1. It shows that air and light do promote the generation of ROS, and the nitrogen environment and avoidance of light contribute to the stability of the system. The optimized system is more accurate in measuring the oxidation potential of environmental particulate matter. To further prove the optimization effect, the performance of the instrument is studied (see Sect. 3.1.4 for details).
3.1.2 Calibration of DTTV measurement and analysis system
In past studies, PQN was often used as a standard sample of atmospheric particulate matter (Charrier and Anastasio, 2011; Charrier and Anastasio, 2015; Xiong et al., 2017). At pH 7.0, almost 100 % of DTT was transformed to DTT-disulfide by the catalyst 9,10-PQN (Li et al., 2009). The analytical measurement part of the online DTT instrument is calibrated by measuring the DTT activity of PQN at different concentrations. Shown in Fig. 4 is the linear graph of DTT consumption rate and PQN concentration, which is after subtracting the blank DTT consumption rate. The online detection slope is 3.66±0.26, and the coefficient is R2=0.992. During the on-site operation, PQN's online and offline testing is measured at least once a month to ensure online accuracy.
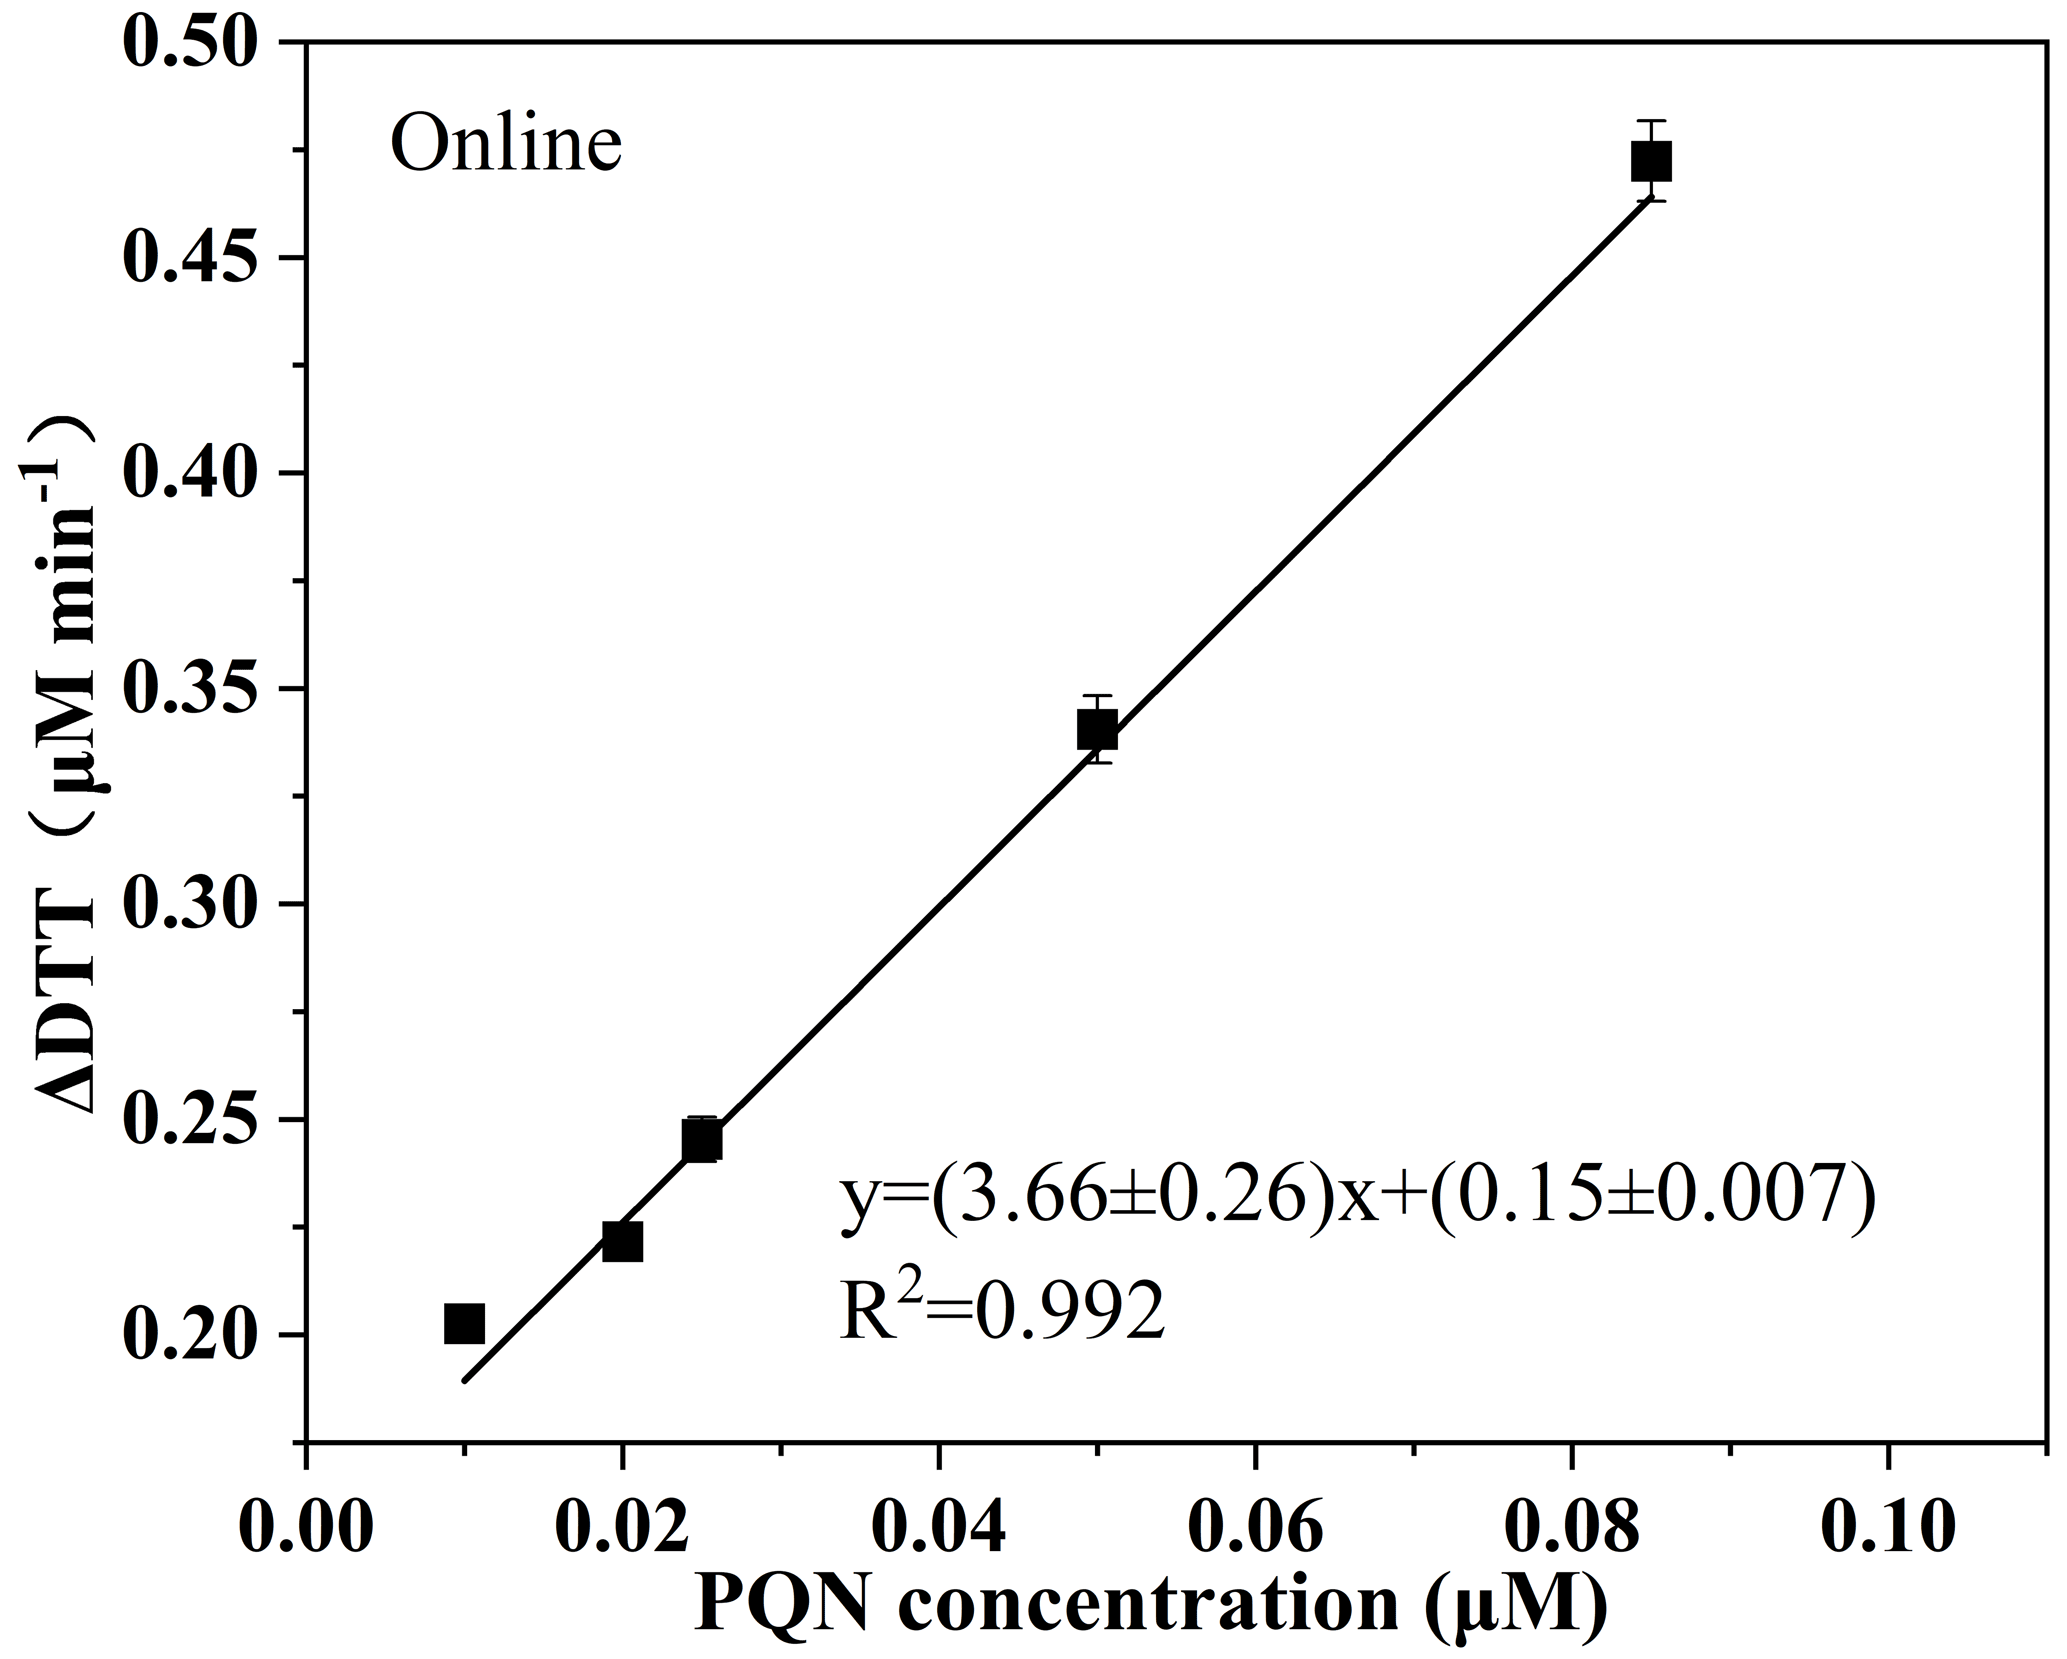
Figure 4Blank-corrected DTT consumption rate as a function of PQN used as a positive control. Each error bar represents the standard deviation of three independent DTT measurements on each concentration.
3.1.3 Limit of detection and precision
The limit of detection (LOD) of the system is defined as 3 times the standard deviation of the deionized water blank (N=23), i.e., 0.024 nmol min−1, which is significantly lower than the LOD of Puthussery et al. (2018) (0.24 nmol min−1) and Fang et al. (0.31 nmol min−1) (Fang et al., 2015; Puthussery et al., 2018). To ensure the accuracy of the system, the deionized water blank samples are taken once a day (14 d) during the sampling period, besides the 10 continuously measured during the optimization of the system.
Use deionized water to evaluate the accuracy of the environmental sample automation system and analyze the DTT activity. The low standard deviation (coefficient of variation, CV = 5.61 %) of 0.024 nmol min−1 indicates that the system has sufficiently high accuracy for environmental samples.
3.1.4 Accuracy
The accuracy of the system is verified by comparing the DTT activity of the positive control and environmental particulate samples obtained from the automated method with the results obtained from the same experimental protocol performed manually (Cho et al., 2005).
Five concentrations of PQN solutions (0.01, 0.02, 0.025, 0.05, 0.085 nmol L−1) are run in the automatic system, which is very close to the results of the manual system (the standard deviation of the automatic system is kept at 0.008 nmol min−1, and the coefficient of variation is 2.28 %; the standard deviation for the manual system is 0.0044 nmol min−1, and the coefficient of variation is 1.48 %). As shown in Fig. 5, the slope (manual automatic) obtained by orthogonal fitting is 1.14, the intercept is 0.12, and the correlation coefficient (R2) is 0.997. The manual detection results are slightly higher than the automatic detection results, and we assume that this is due to the instrument error caused by the complicated piping system of the online instrument. To ensure the high accuracy of the online system and the offline system, as a further verification, we used online and offline manual methods to conduct DTT activity analysis on 10 environmental particulate matter samples.
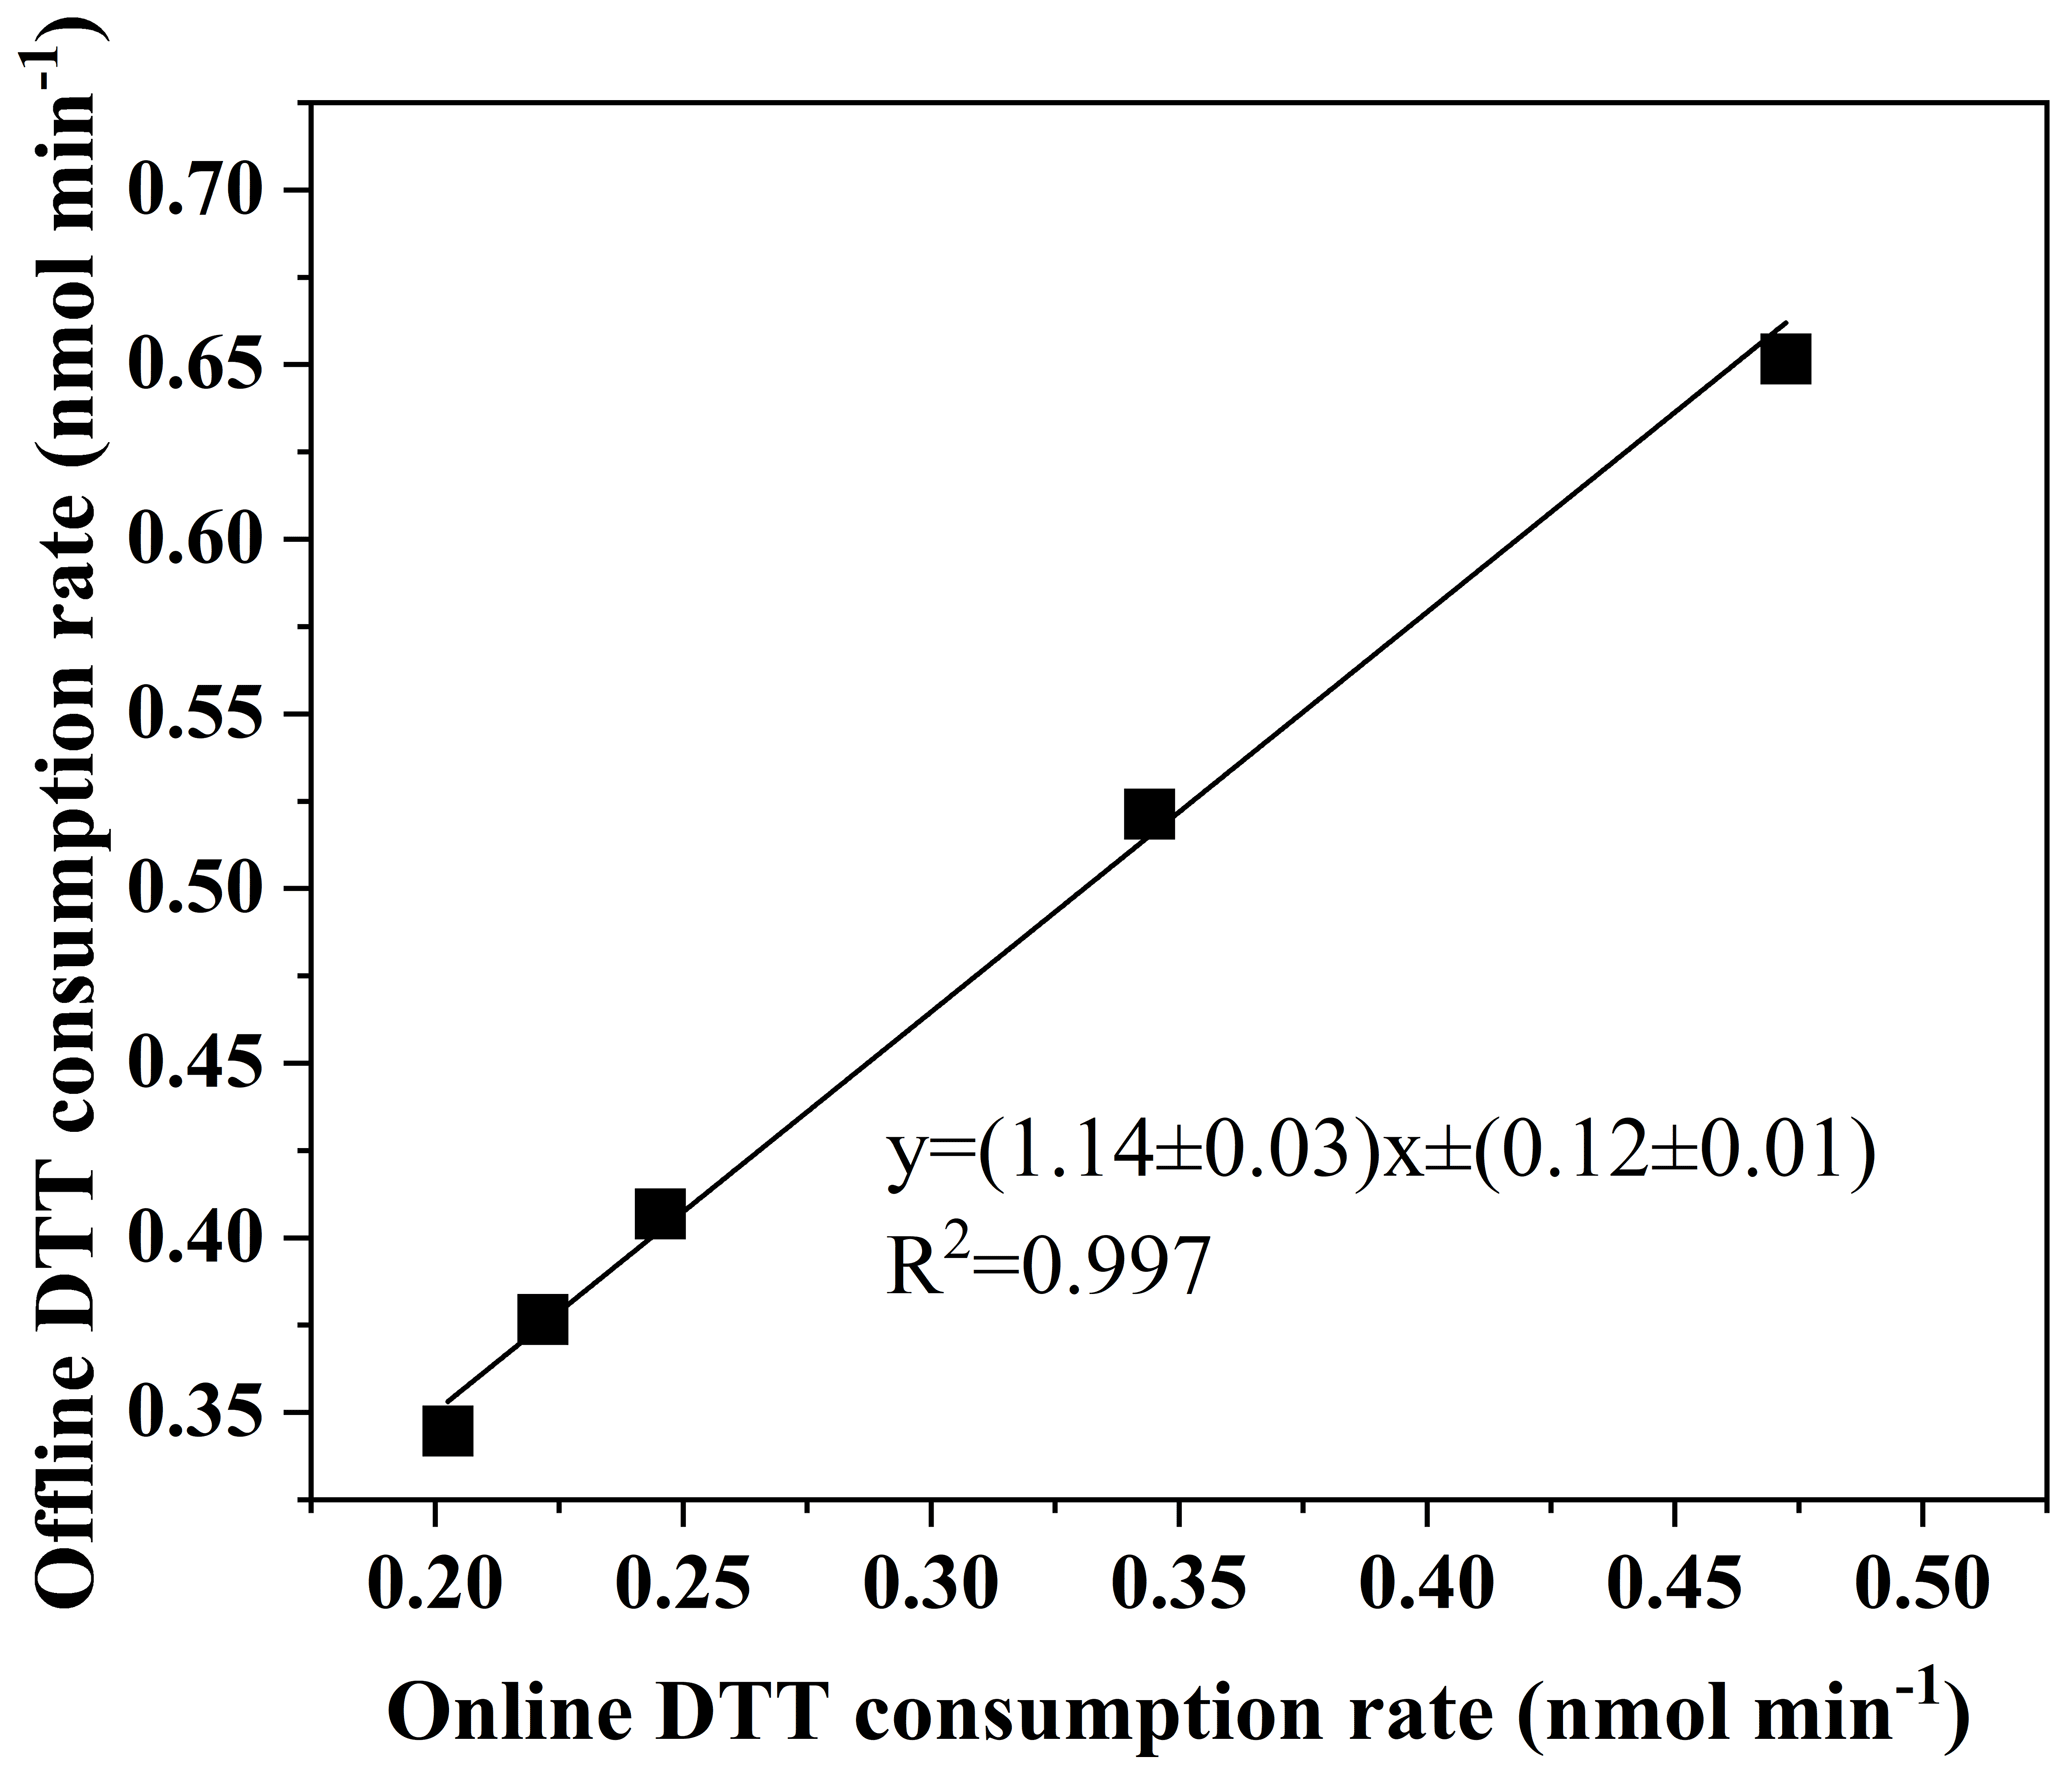
Figure 5Comparison of the automated system with manual operation using PQN (9,10-phenanthraquinone).
As shown in Fig. 6 for the online and offline analysis of the DTT activity of 10 ambient particles, the slope (manual automatic) obtained by orthogonal fitting is 1.14, the intercept is 0.19, and the correlation coefficient (R2) is 0.954. We found that the real samples tested also had slightly higher offline results than online results. This is similar to our assumption. Therefore, we use the PQN online and offline DTT consumption rate orthogonal fitting result to correct the error, as shown in Fig. 6, through the offline and online orthogonal fitting of 10 environmental particulate matter samples before and after the error correction. We found that the corrected results are better (the slope at 0.97 is closer to 1, the intercept at 0.05 is closer to 0, R2=0.954). The good agreement between the two sampling systems indicates that the DTT measurement of environmental samples has high overall accuracy. These tests also proved the necessity of optimization.
3.2 DTT activity of ambient samples
The volume-normalized oxidation potential DTTV is used as an index of exposure to inhaled air to point out the inherent ability of particles to deplete relevant antioxidants. During the observation period, the daily change in DTTV in Nanjing is shown in Fig. 7. The average DTTV is 0.83±0.38 nmol min−1 m−3. Compared with Beijing's DTTV in the spring of 2012 (urban area: 0.24 nmol min−1 m−3) (Liu et al., 2014; Wang et al., 2019) and Zhejiang University's annual DTTV average of 0.62 nmol min−1 m−3 (Yu et al., 2019), our results are on the high side. Compared with Peking University's 2015 annual DTTV (12.26±6.82 nmol min−1 m−3) (Perrone et al., 2016) and Guangzhou's in the winter of 2017 (DTTV: 4.67±1.06 nmol min−1 m−3) and in the spring of 2018 (DTTV: 4.45±1.02 nmol min−1 m−3), our values are low, which may be related to the current season and emission factors. In addition, we found that the rain during the sampling period caused significant changes in the 24 h DTTV. To better understand the environmental factors affecting DTTV, hourly data obtained by running the instrument are composited to obtain a diurnal profile of the DTT activity. As shown in Fig. S2, the daily distribution of 24 h DTT activities during the entire sampling period (a), before rain (b), during rain (c), and after rain (d) are divided. Figure S2a represents the hourly change in DTTV during the entire sample period. We found that the highest value of DTTV in a day occurs at 11:00–12:00 LT, and DTTV is greater during the day than at night, which is similar to the study by Puthussery et al. (2018). Before the rain, the average DTTV was 0.81±0.17 nmol min−1 m−3. There is a peak at 10:00–12:00 LT, but the overall situation is relatively flat, and there is no obvious difference between day and night. The average value of DTTV during the rain is 0.55±0.10 nmol min−1 m−3, which decreased significantly. There is no doubt that this is caused by rain settling the polluting components of the atmosphere. In contrast, there is significant daily activity in DTTV following rain, with peaks occurring mainly between 08:00–10:00 and 16:00–18:00 LT, and DTTV is significantly higher during the day than at night, which is similar to the Puthussery study (Puthussery et al., 2018). However, there are no obvious diurnal variations in PM2.5 mass concentration. Therefore, the diurnal variation of DTT activity is assumed to be mainly attributed to different emission sources at the site.
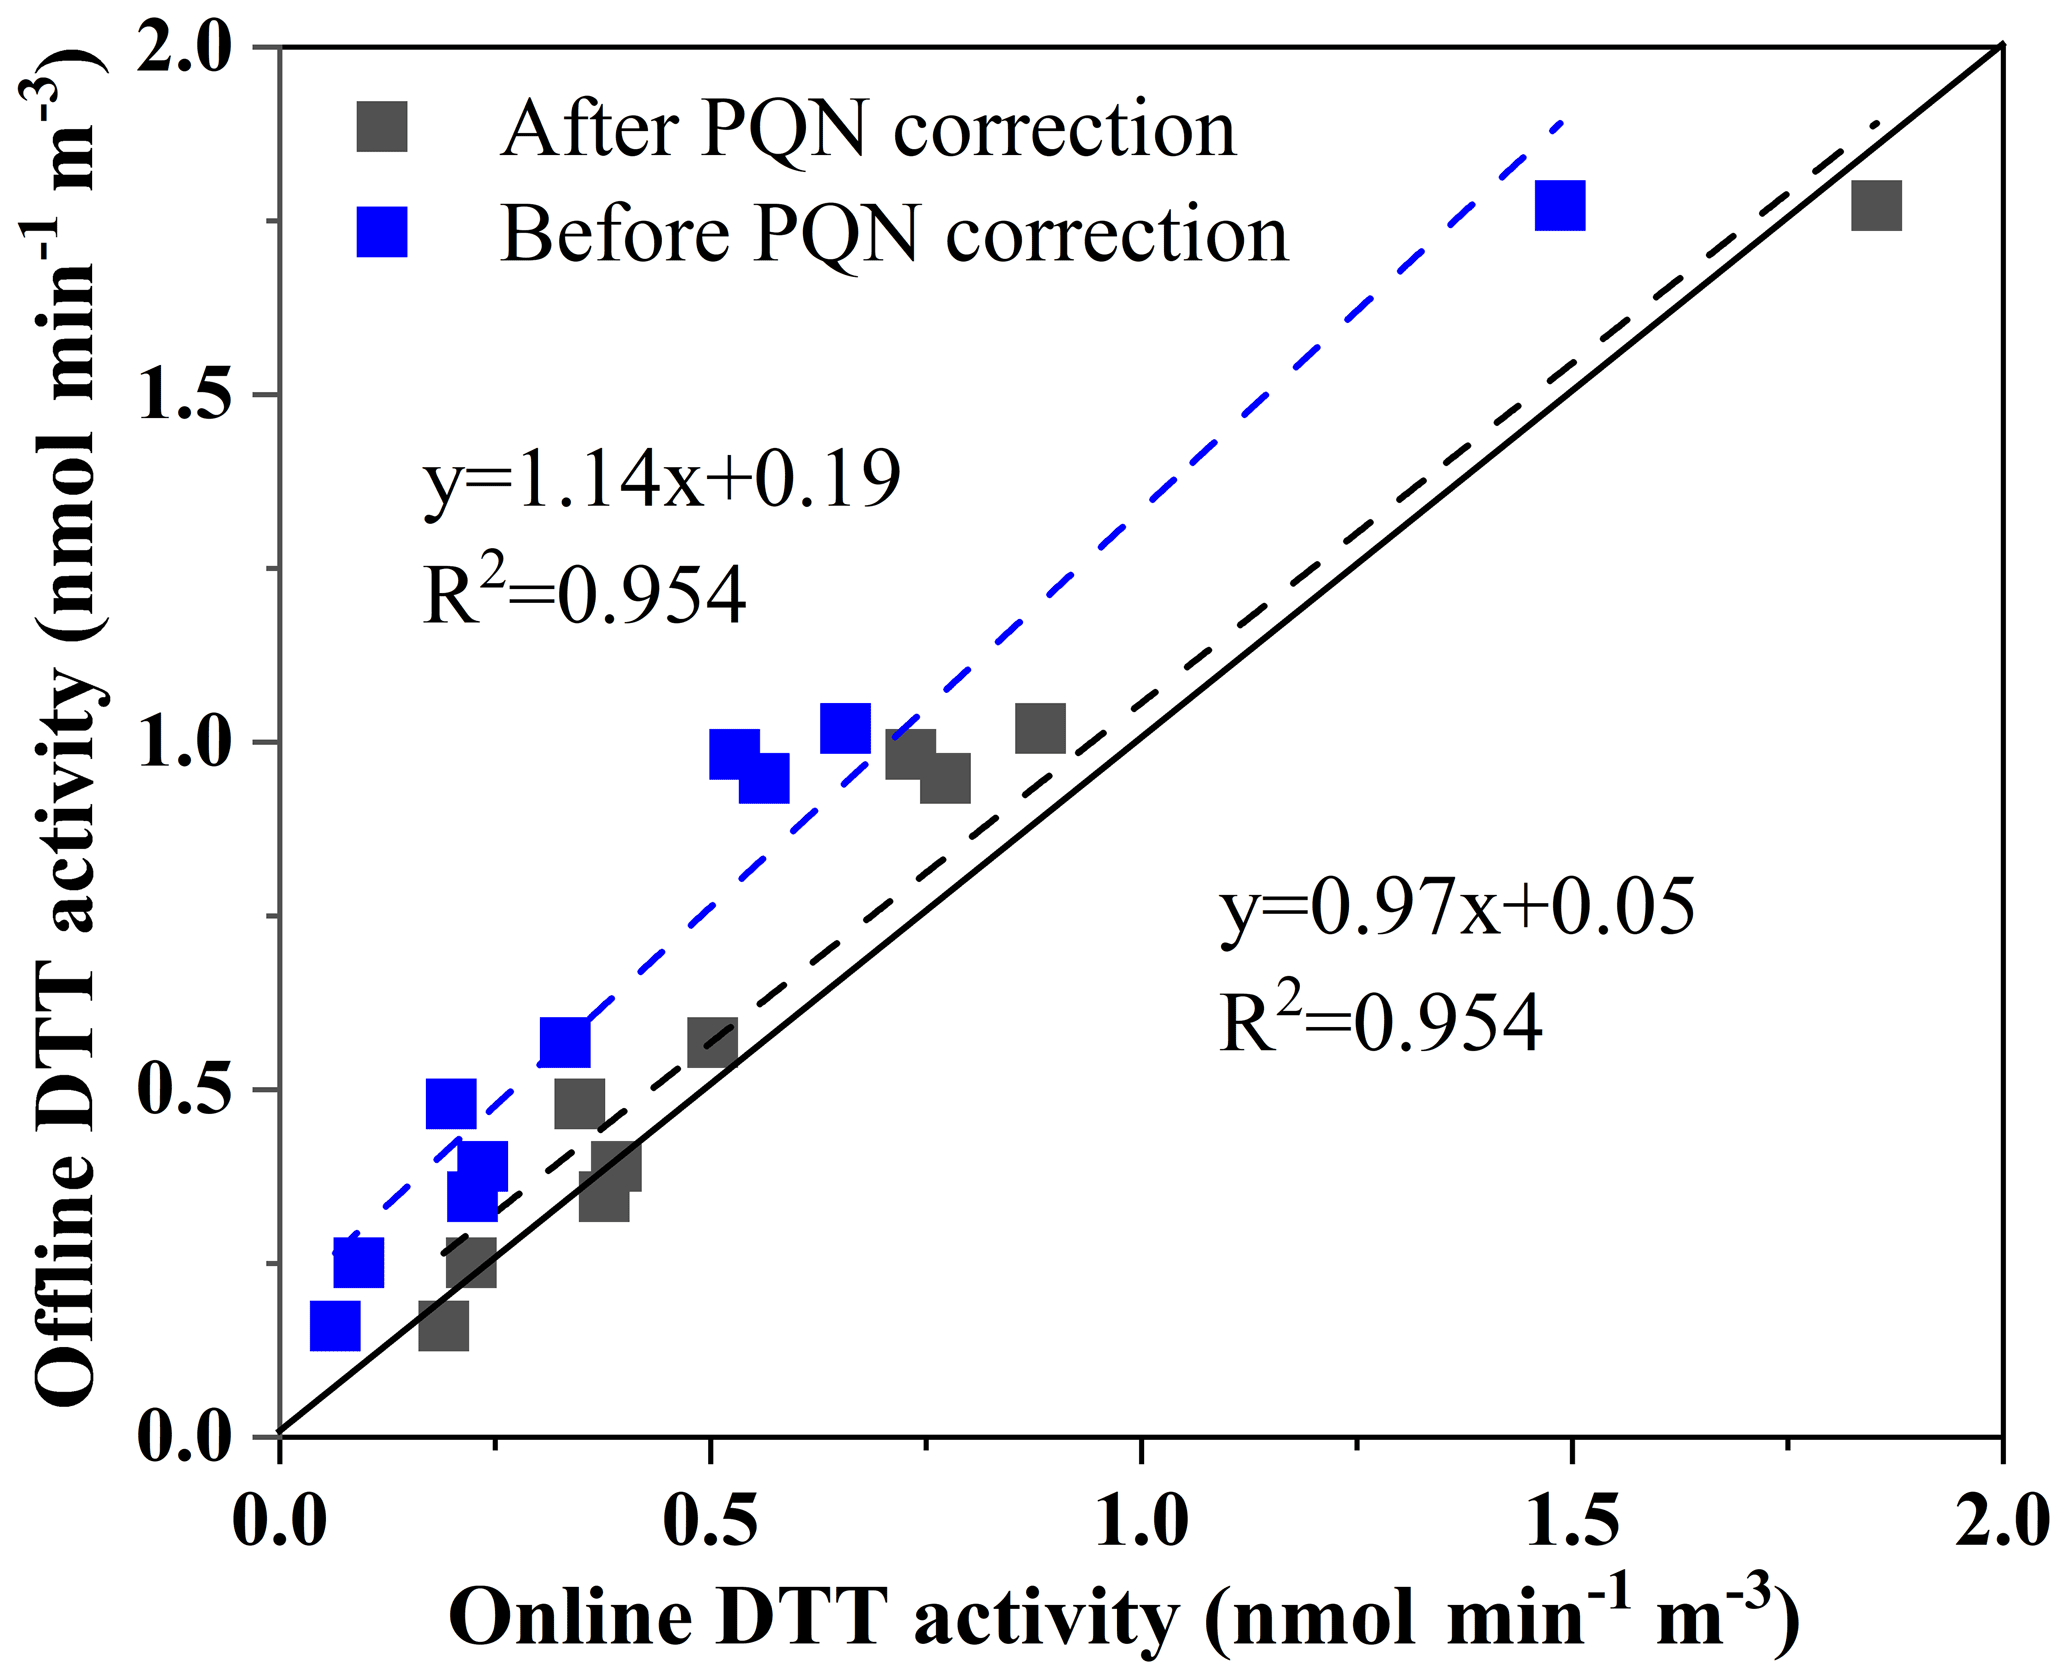
Figure 6Comparison of the automated system with manual operation using ambient aerosol extracts (PM2.5 samples collected from Xuzhou, and regression analysis is done by orthogonal regression; the line is 1:1).
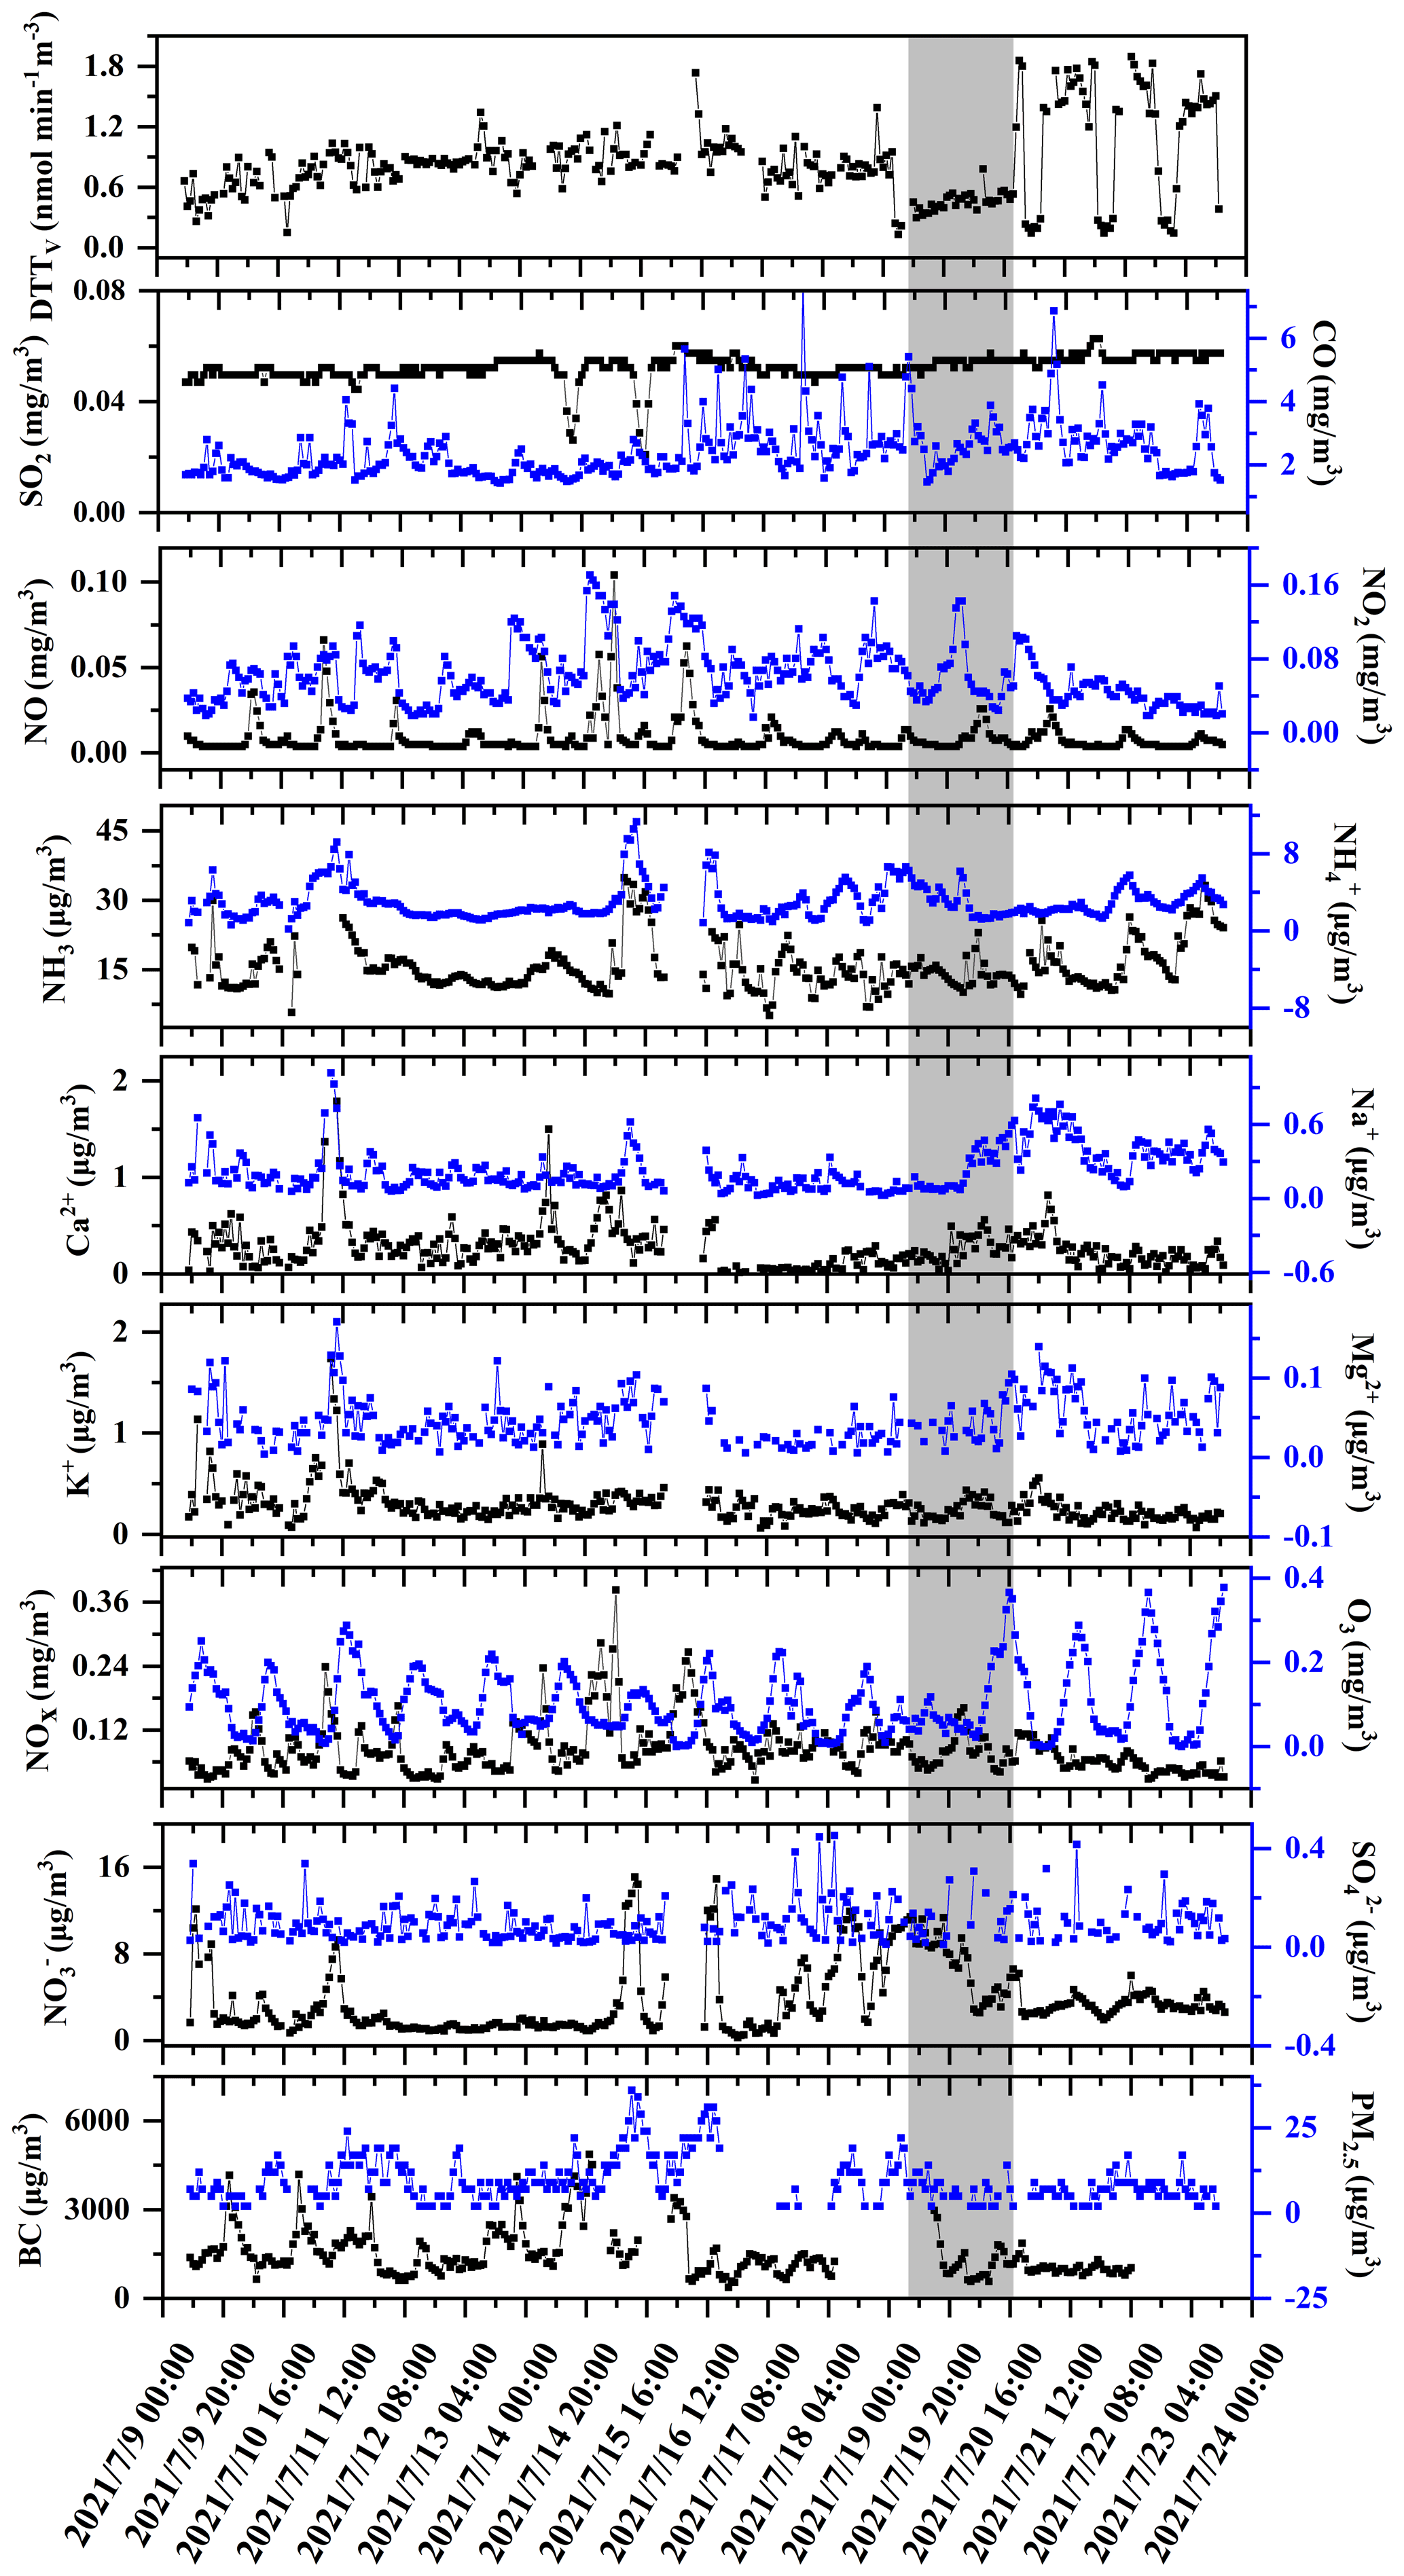
Figure 7Time series of the DTT activity, PM2.5 water-soluble components (, , , Na+, Ca2+, K+), and polluting gases (SO2, CO, O3, NH3) (the shaded part is rainy weather).
3.3 The correlation between PM2.5, polluting gases, and ROS activity
We further study the daily changes in DTTV and correlation with various emission sources on-site. As shown in Fig. 7, we measured the water-soluble ionic components of PM2.5 (, , , Na+, Ca2+, K+), BC, and pollution gas (SO2, CO, O3, NH3) content changes. The average concentration of PM2.5 during the sampling period is 9.97±6.53 ug m−3, the average concentration of PM2.5 before rain is 11.13±7.21 ug m−3, and the average concentration of PM2.5 after rain is 7.80±4.18 ug m−3. The concentration of PM2.5 shows a significant drop. In addition, as shown in Table 1, there are differences in the correlation between PM2.5 and DTTV before and after rain. Therefore, we suspect that the source of DTTV is different before and after the rain. BC and the polluting gases SO2, NOx, NO2, CO, Ca2+, K+, and Mg2+ are often used as tracers of biomass burning, coal combustion, and dust storms. Compared with the early winter in the northern suburbs of Nanjing (Zhang et al., 2020), the levels of these substances decreased during the sampling period. It is similar to Liu et al. (2019) and Zhang et al. (2020), who concluded that biomass burning, coal combustion, and dust storms were not major sources of pollution in Nanjing during the summer (Guo et al., 2019; Liu et al., 2019; Zhang et al., 2020). In addition, there is no strong correlation between DTTV and SO2, NOx, NO2, and CO before and after the rain. Therefore, it can be judged that neither biomass burning, coal combustion, nor dust is the main source affecting DTTV. In contrast, we found that there is a significant difference between day and night in O3 after rain, which is similar to the change in DTTV, and after rain, DTTV and O3 show a strong correlation (r=0.624). After it rains, the O3 content in the air environment increases. Under the sun's ultraviolet rays, O3 is photodegraded to form active oxygen components such as OH radicals (Ehhalt and Rohrer, 2000; Rohrer and Berresheim, 2006).
Table 1The correlation coefficient (R) between the concentration of water-soluble chemical substances in environmental PM2.5 (µg m−3) and the volume-normalized substance concentration (DTTV) before rain, during rain, and after rain.
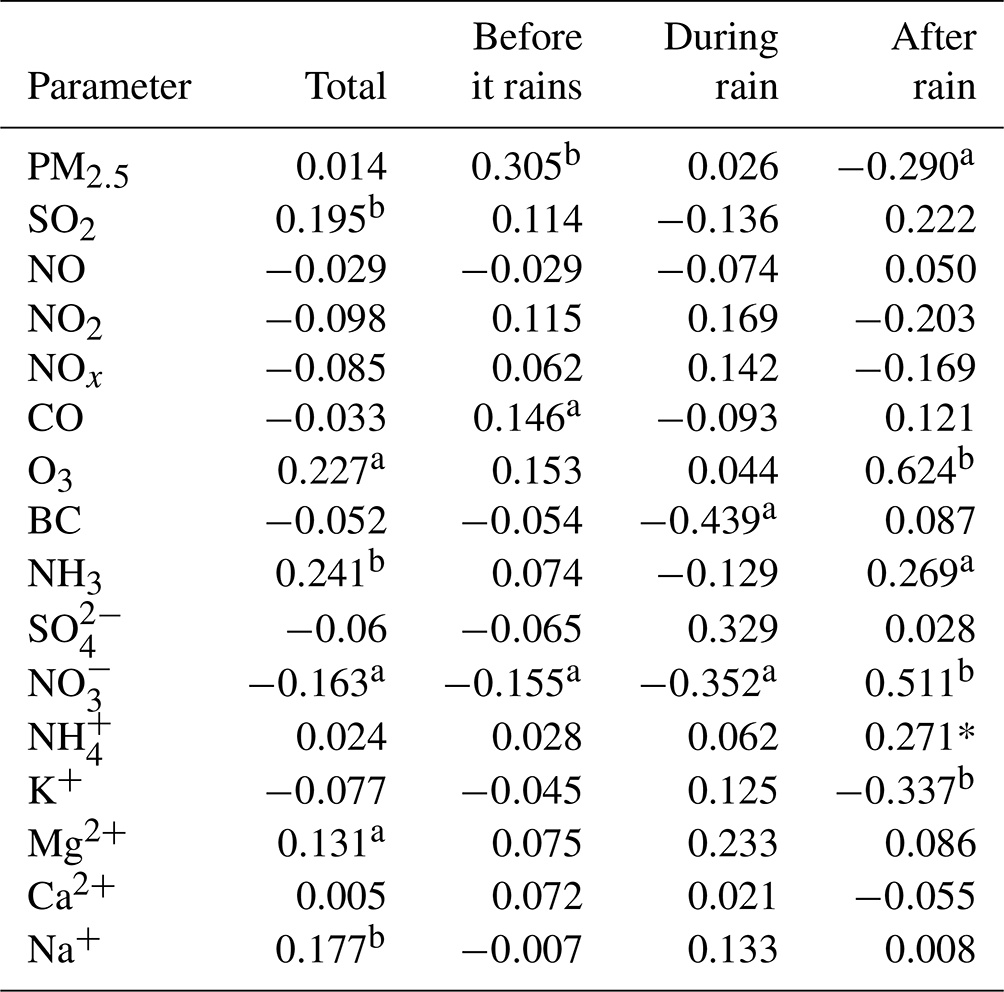
PM2.5, particulate matter with an aerodynamic diameter <2.5 µm; aP<0.05, bP<0.01.
To further confirm the influence of light on DTTV, the day and night correlation analysis of substances related to photo-oxidation (, , ) and DTTV is carried out. As shown in Table S2, we find that , , , and DTTV are significantly correlated during the day (r=0.434, r=0.461, r=0.263, P<0.01). As far as we know, there is no evidence in the literature that water-soluble inorganic ions (, , ) have redox activity in an aerobic environment (Calas et al., 2018; Stevanovic et al., 2017). However, their correlation with DTTV may be due to collinearity with redox-active organic compounds rather than actual contribution to the oxidation potential of particles. We speculate that the high correlation may be related to the photochemical reactions that occur during the day.
This study proposes and characterizes an improved online active oxygen analyzer. Compared with previous research, there are several main improvements (Fang et al., 2015; Puthussery et al., 2018). The optimization analysis is as follows. (1) The experimental environment is processed to isolate the air and avoid light. (2) The sampling method has changed. We use the MARGA online ion analyzer, which is more mature and stable. Compared with before optimization, the standard deviation of the blank was significantly smaller. Thus, the detection limit of the instrument (0.024 nmol min−1) becomes smaller and more stable. The DTT consumption rate is reduced by 44 %, which eliminates the influence of outside air and light in the experiment. And the consistency between online and offline is improved (slope = 0.97, R2=0.95), so the accuracy of the system is higher.
By changing the DTTV content hour by hour during the sampling period, we found that the DTT activity during the day is higher than that at night, and it is especially obvious after rain, which is mainly related to the increase in UV radiation during the day after rain. In addition, we analyzed the correlation between water-soluble ions (, , , Na+, Ca2+, K+), BC, pollutant gases, SO2, CO, O3, NO, NOx, NH3, and DTTV, and we found that the main sources of influence of OP in the Nanjing environment in summer are daytime secondary photochemical conversion and ultraviolet radiation. In the future, we hope to add more experimental modules to the back end based on the MARGA sample collection device to realize the diversification of detection compositions. In addition, the system can be combined with other substance detection instruments. The daily contribution of various emission sources to the risk associated with OP exposure can be inferred from other species.
Data used in this paper can be provided upon request by email to Yanlin Zhang (dryanlinzhang@outlook.com).
The supplement related to this article is available online at: https://doi.org/10.5194/amt-15-2623-2022-supplement.
JW designed the instrument, led the sampling campaign, performed the experiments, and wrote the paper. CY participated in experimental design and guided the experimental process. CZ chose the building address and initially built the instrument. FC helped in the filter collection and in conducting the DTT activity experiments. YZ conceived the idea, organized the paper, and supervised the project.
The contact author has declared that neither they nor their co-authors have any competing interests.
Publisher's note: Copernicus Publications remains neutral with regard to jurisdictional claims in published maps and institutional affiliations.
The authors are grateful for funding support from the National Nature Science Foundation of China (no. 41977305), the Natural Science Foundation of Jiangsu Province (no. BK20180040), and the Jiangsu Innovation & Entrepreneurship Team.
This research has been supported by the National Natural Science Foundation of China (grant no. 41977305) and the Natural Science Foundation of Jiangsu Province (grant no. BK20180040).
This paper was edited by Mingjin Tang and reviewed by four anonymous referees.
Ahmad, M., Yu, Q., Chen, J., Cheng, S., Qin, W., and Zhang, Y.: Chemical characteristics, oxidative potential, and sources of PM (2.5) in wintertime in Lahore and Peshawar, Pakistan, J. Environ. Sci. (China), 102, 148–158, https://doi.org/10.1016/j.jes.2020.09.014, 2021.
Akhtar, U. S., McWhinney, R. D., Rastogi, N., Abbatt, J. P., Evans, G. J., and Scott, J. A.: Cytotoxic and proinflammatory effects of ambient and source-related particulate matter (PM) in relation to the production of reactive oxygen species (ROS) and cytokine adsorption by particles, Inhal. Toxicol., 22 Suppl 2, 37–47, https://doi.org/10.3109/08958378.2010.518377, 2010.
Ayres, J. G., Borm, P., Cassee, F. R., Castranova, V., Donaldson, K., Ghio, A., Harrison, R. M., Hider, R., Kelly, F., Kooter, I. M., Marano, F., Maynard, R. L., Mudway, I., Nel, A., Sioutas, C., Smith, S., Baeza-Squiban, A., Cho, A., Duggan, S., and Froines, J.: Evaluating the toxicity of airborne particulate matter and nanoparticles by measuring oxidative stress potential – a workshop report and consensus statement, Inhal. Toxicol., 20, 75–99, https://doi.org/10.1080/08958370701665517, 2008.
Bates, J. T., Fang, T., Verma, V., Zeng, L., Weber, R. J., Tolbert, P. E., Abrams, J. Y., Sarnat, S. E., Klein, M., Mulholland, J. A., and Russell, A. G.: Review of Acellular Assays of Ambient Particulate Matter Oxidative Potential: Methods and Relationships with Composition, Sources, and Health Effects, Environ. Sci. Technol., 53, 4003–4019, https://doi.org/10.1021/acs.est.8b03430, 2019.
Borm, P. J. A., Kelly, F., Künzli, N., Schins, R. P. F., and Donaldson, K.: Oxidant generation by particulate matter: from biologically effective dose to a promising, novel metric, Occup. Environ. Med., 64, 73–74, https://doi.org/10.1136/oem.2006.029090, 2007.
Calas, A., Uzu, G., Kelly, F. J., Houdier, S., Martins, J. M. F., Thomas, F., Molton, F., Charron, A., Dunster, C., Oliete, A., Jacob, V., Besombes, J.-L., Chevrier, F., and Jaffrezo, J.-L.: Comparison between five acellular oxidative potential measurement assays performed with detailed chemistry on PM10 samples from the city of Chamonix (France), Atmos. Chem. Phys., 18, 7863–7875, https://doi.org/10.5194/acp-18-7863-2018, 2018.
Charrier, J. G. and Anastasio, C.: Impacts of Antioxidants on Hydroxyl Radical Production from Individual and Mixed Transition Metals in a Surrogate Lung Fluid, Atmos. Environ. (Oxford, England: 1994), 45, 7555–7562, https://doi.org/10.1016/j.atmosenv.2010.12.021, 2011.
Charrier, J. G. and Anastasio, C.: Rates of Hydroxyl Radical Production from Transition Metals and Quinones in a Surrogate Lung Fluid, Environ. Sci. Technol., 49, 9317–9325, https://doi.org/10.1021/acs.est.5b01606, 2015.
Charrier, J. G., McFall, A. S., Vu, K. K. T., Baroi, J., Olea, C., Hasson, A., and Anastasio, C.: A bias in the “mass-normalized” DTT response – An effect of non-linear concentration-response curves for copper and manganese, Atmos. Environ., 144, 325–334, https://doi.org/10.1016/j.atmosenv.2016.08.071, 2016.
Chen, X., Zhong, Z., Xu, Z., Chen, L., and Wang, Y.: 2',7'-Dichlorodihydrofluorescein as a fluorescent probe for reactive oxygen species measurement: Forty years of application and controversy, Free Radic Res., 44, 587–604, https://doi.org/10.3109/10715761003709802, 2010.
Chen, X., Walker, J. T., and Geron, C.: Chromatography related performance of the Monitor for AeRosols and GAses in ambient air (MARGA): laboratory and field-based evaluation, Atmos. Meas. Tech., 10, 3893–3908, https://doi.org/10.5194/amt-10-3893-2017, 2017.
Cho, A. K., Sioutas, C., Miguel, A. H., Kumagai, Y., Schmitz, D. A., Singh, M., Eiguren-Fernandez, A., and Froines, J. R.: Redox activity of airborne particulate matter at different sites in the Los Angeles Basin, Environ. Res., 99, 40–47, https://doi.org/10.1016/j.envres.2005.01.003, 2005.
Delfino, R. J., Sioutas, C., and Malik, S.: Potential role of ultrafine particles in associations between airborne particle mass and cardiovascular health, Environ. Health Perspect., 113, 934–946, https://doi.org/10.1289/ehp.7938, 2005.
Delfino, R. J., Staimer, N., Tjoa, T., Gillen, D. L., Schauer, J. J., and Shafer, M. M.: Airway inflammation and oxidative potential of air pollutant particles in a pediatric asthma panel, J. Expo Sci. Environ. Epidemiol., 23, 466–473, https://doi.org/10.1038/jes.2013.25, 2013.
Dou, J., Lin, P., Kuang, B.-Y., and Yu, J.: Reactive Oxygen Species Production Mediated by Humic-like Substances in Atmospheric Aerosols: Enhancement Effects by Pyridine, Imidazole, and Their Derivatives, Environ. Sci. Technol., 49, 6457–6465, https://doi.org/10.1021/es5059378, 2015.
Ehhalt, D. H. and Rohrer, F.: Dependence of the OH concentration on solar UV, J. Geophys. Res.-Atmos., 105, 3565–3571, https://doi.org/10.1029/1999jd901070, 2000.
Eiguren-Fernandez, A., Kreisberg, N., and Hering, S.: An online monitor of the oxidative capacity of aerosols (o-MOCA), Atmos. Meas. Tech., 10, 633–644, https://doi.org/10.5194/amt-10-633-2017, 2017.
Fang, T., Verma, V., Guo, H., King, L. E., Edgerton, E. S., and Weber, R. J.: A semi-automated system for quantifying the oxidative potential of ambient particles in aqueous extracts using the dithiothreitol (DTT) assay: results from the Southeastern Center for Air Pollution and Epidemiology (SCAPE), Atmos. Meas. Tech., 8, 471–482, https://doi.org/10.5194/amt-8-471-2015, 2015.
Fang, T., Verma, V., Bates, J. T., Abrams, J., Klein, M., Strickland, M. J., Sarnat, S. E., Chang, H. H., Mulholland, J. A., Tolbert, P. E., Russell, A. G., and Weber, R. J.: Oxidative potential of ambient water-soluble PM2.5 in the southeastern United States: contrasts in sources and health associations between ascorbic acid (AA) and dithiothreitol (DTT) assays, Atmos. Chem. Phys., 16, 3865–3879, https://doi.org/10.5194/acp-16-3865-2016, 2016.
Fang, T., Guo, H., Zeng, L., Verma, V., Nenes, A., and Weber, R. J.: Highly Acidic Ambient Particles, Soluble Metals, and Oxidative Potential: A Link between Sulfate and Aerosol Toxicity, Environ. Sci. Technol., 51, 2611–2620, https://doi.org/10.1021/acs.est.6b06151, 2017.
Ghio, A. J., Carraway, M. S., and Madden, M. C.: Composition of air pollution particles and oxidative stress in cells, tissues, and living systems, J. Toxicol. Environ. Health. Part B, Critical Reviews, 15, 1–21, https://doi.org/10.1080/10937404.2012.632359, 2012.
Guo, Z., Guo, Q., Chen, S., Zhu, B., Zhang, Y., Yu, J., and Guo, Z.: Study on pollution behavior and sulfate formation during the typical haze event in Nanjing with water soluble inorganic ions and sulfur isotopes, Atmos. Res., 217, 198–207, https://doi.org/10.1016/j.atmosres.2018.11.009, 2019.
Hedayat, F., Stevanovic, S., Miljevic, B., Bottle, S., and Ristovski, Z.: Review – Evaluating the molecular assays for measuring the oxidative potential of particulate matter, Chem. Ind. Chem. Eengq., 21, 31–31, https://doi.org/10.2298/CICEQ140228031H, 2014.
Hellack, B., Quass, U., Nickel, C., Wick, G., Schins, R. P. F., and Kuhlbusch, T. A. J.: Oxidative potential of particulate matter at a German motorway, Environ. Sci. Process. Impacts, 17, 868–876, https://doi.org/10.1039/c4em00605d, 2015.
Hemmilä, M., Hellén, H., Virkkula, A., Makkonen, U., Praplan, A. P., Kontkanen, J., Ahonen, L., Kulmala, M., and Hakola, H.: Amines in boreal forest air at SMEAR II station in Finland, Atmos. Chem. Phys., 18, 6367–6380, https://doi.org/10.5194/acp-18-6367-2018, 2018.
Huang, W., Zhang, Y., Zhang, Y., Zeng, L., Dong, H., Huo, P., Fang, D., and Schauer, J. J.: Development of an automated sampling-analysis system for simultaneous measurement of reactive oxygen species (ROS) in gas and particle phases: GAC-ROS, Atmos. Environ., 134, 18–26, https://doi.org/10.1016/j.atmosenv.2016.03.038, 2016.
Janssen, N. A., Strak, M., Yang, A., Hellack, B., Kelly, F. J., Kuhlbusch, T. A., Harrison, R. M., Brunekreef, B., Cassee, F. R., Steenhof, M., and Hoek, G.: Associations between three specific a-cellular measures of the oxidative potential of particulate matter and markers of acute airway and nasal inflammation in healthy volunteers, Occup. Environ. Med., 72, 49–56, https://doi.org/10.1136/oemed-2014-102303, 2015.
Li, Q., Wyatt, A., and Kamens, R. M.: Oxidant generation and toxicity enhancement of aged-diesel exhaust, Atmos. Environ., 43, 1037–1042, 10.1016/j.atmosenv.2008.11.018, 2009.
Li, Y., Zhu, T., Zhao, J., and Xu, B.: Interactive enhancements of ascorbic acid and iron in hydroxyl radical generation in quinone redox cycling, Environ. Sci. Technol., 46, 10302–10309, https://doi.org/10.1021/es301834r, 2012.
Lin, M. and Yu, J. Z.: Dithiothreitol (DTT) concentration effect and its implications on the applicability of DTT assay to evaluate the oxidative potential of atmospheric aerosol samples, Environ. Pollut., 251, 938–944, https://doi.org/10.1016/j.envpol.2019.05.074, 2019.
Liu, Q., Baumgartner, J., Zhang, Y., Liu, Y., Sun, Y., and Zhang, M.: Oxidative potential and inflammatory impacts of source apportioned ambient air pollution in Beijing, Environ. Sci. Technol., 48, 12920–12929, https://doi.org/10.1021/es5029876, 2014.
Liu, X., Zhang, Y.-L., Peng, Y., Xu, L., Zhu, C., Cao, F., Zhai, X., Haque, M. M., Yang, C., Chang, Y., Huang, T., Xu, Z., Bao, M., Zhang, W., Fan, M., and Lee, X.: Chemical and optical properties of carbonaceous aerosols in Nanjing, eastern China: regionally transported biomass burning contribution, Atmos. Chem. Phys., 19, 11213–11233, https://doi.org/10.5194/acp-19-11213-2019, 2019.
Lodovici, M. and Bigagli, E.: Oxidative stress and air pollution exposure, J. Toxicol., 2011, 487074–487083, https://doi.org/10.1155/2011/487074, 2011.
Pal, A. K., Bello, D., Budhlall, B., Rogers, E., and Milton, D. K.: Screening for Oxidative Stress Elicited by Engineered Nanomaterials: Evaluation of Acellular DCFH Assay, Dose Response, 10, 308–330, https://doi.org/10.2203/dose-response.10-036.Pal, 2012.
Perrone, M. G., Zhou, J., Malandrino, M., Sangiorgi, G., Rizzi, C., Ferrero, L., Dommen, J., and Bolzacchini, E.: PM chemical composition and oxidative potential of the soluble fraction of particles at two sites in the urban area of Milan, Northern Italy, Atmos. Environ., 128, 104–113, https://doi.org/10.1016/j.atmosenv.2015.12.040, 2016.
Pöschl, U. and Shiraiwa, M.: Multiphase chemistry at the atmosphere-biosphere interface influencing climate and public health in the anthropocene, Chem. Rev., 115, 4440–4475, https://doi.org/10.1021/cr500487s, 2015.
Puthussery, J. V., Zhang, C., and Verma, V.: Development and field testing of an online instrument for measuring the real-time oxidative potential of ambient particulate matter based on dithiothreitol assay, Atmos. Meas. Tech., 11, 5767–5780, https://doi.org/10.5194/amt-11-5767-2018, 2018.
Rohrer, F. and Berresheim, H.: Strong correlation between levels of tropospheric hydroxyl radicals and solar ultraviolet radiation, Nature, 442, 184–187, https://doi.org/10.1038/nature04924, 2006.
Rumsey, I. C., Cowen, K. A., Walker, J. T., Kelly, T. J., Hanft, E. A., Mishoe, K., Rogers, C., Proost, R., Beachley, G. M., Lear, G., Frelink, T., and Otjes, R. P.: An assessment of the performance of the Monitor for AeRosols and GAses in ambient air (MARGA): a semi-continuous method for https://doi.org/10.5194/acp-14-5639-2014, 2014.
Sameenoi, Y., Koehler, K., Shapiro, J., Boonsong, K., Sun, Y., Collett, J., Jr., Volckens, J., and Henry, C. S.: Microfluidic electrochemical sensor for on-line monitoring of aerosol oxidative activity, J. Am. Chem. Soc., 134, 10562–10568, https://doi.org/10.1021/ja3031104, 2012.
Stevanovic, S., Vaughan, A., Hedayat, F., Salimi, F., Rahman, M. M., Zare, A., Brown, R. A., Brown, R. J., Wang, H., Zhang, Z., Wang, X., Bottle, S. E., Yang, I. A., and Ristovski, Z. D.: Oxidative potential of gas phase combustion emissions – An underestimated and potentially harmful component of air pollution from combustion processes, Atmos. Environ., 158, 227–235, https://doi.org/10.1016/j.atmosenv.2017.03.041, 2017.
Stieger, B., Spindler, G., van Pinxteren, D., Grúner, A., Wallasch, M., and Herrmann, H.: Development of an online-coupled MARGA upgrade for the 2 h interval quantification of low-molecular-weight organic acids in the gas and particle phases, Atmos. Meas. Tech., 12, 281–298, https://doi.org/10.5194/amt-12-281-2019, 2019.
Velali, E., Papachristou, E., Pantazaki, A., Choli-Papadopoulou, T., Planou, S., Kouras, A., Manoli, E., Besis, A., Voutsa, D., and Samara, C.: Redox activity and in vitro bioactivity of the water-soluble fraction of urban particulate matter in relation to particle size and chemical composition, Environ. Pollut., 208, 774–786, https://doi.org/10.1016/j.envpol.2015.10.058, 2016.
Visentin, M., Pagnoni, A., Sarti, E., and Pietrogrande, M. C.: Urban PM2.5 oxidative potential: Importance of chemical species and comparison of two spectrophotometric cell-free assays, Environ. Pollut., 219, 72–79, https://doi.org/10.1016/j.envpol.2016.09.047, 2016.
Vreeland, H., Weber, R., Bergin, M., Greenwald, R., Golan, R., Russell, A. G., Verma, V., and Sarnat, J. A.: Oxidative potential of PM2.5 during Atlanta rush hour: Measurements of in-vehicle dithiothreitol (DTT) activity, Atmos. Environ., 165, 169–178, https://doi.org/10.1016/j.atmosenv.2017.06.044, 2017.
Wang, J., Lin, X., Lu, L., Wu, Y., Zhang, H., Lv, Q., Liu, W., Zhang, Y., and Zhuang, S.: Temporal variation of oxidative potential of water soluble components of ambient PM2.5 measured by dithiothreitol (DTT) assay, Sci. Total Environ., 649, 969–978, https://doi.org/10.1016/j.scitotenv.2018.08.375, 2019.
Wragg, F. P. H., Fuller, S. J., Freshwater, R., Green, D. C., Kelly, F. J., and Kalberer, M.: An automated online instrument to quantify aerosol-bound reactive oxygen species (ROS) for ambient measurement and health-relevant aerosol studies, Atmos. Meas. Tech., 9, 4891–4900, https://doi.org/10.5194/amt-9-4891-2016, 2016.
Xiong, Q., Yu, H., Wang, R., Wei, J., and Verma, V.: Rethinking Dithiothreitol-Based Particulate Matter Oxidative Potential: Measuring Dithiothreitol Consumption versus Reactive Oxygen Species Generation, Environ. Sci. Technol., 51, 6507–6514, https://doi.org/10.1021/acs.est.7b01272, 2017.
Yang, A., Jedynska, A., Hellack, B., Kooter, I., Hoek, G., Brunekreef, B., Kuhlbusch, T. A. J., Cassee, F. R., and Janssen, N. A. H.: Measurement of the oxidative potential of PM2.5 and its constituents: The effect of extraction solvent and filter type, Atmos. Environ., 83, 35–42, https://doi.org/10.1016/j.atmosenv.2013.10.049, 2014.
Yu, S., Liu, W., Xu, Y., Yi, K., Zhou, M., Tao, S., and Liu, W.: Characteristics and oxidative potential of atmospheric PM2.5 in Beijing: Source apportionment and seasonal variation, Sci. Total Environ., 650, 277–287, https://doi.org/10.1016/j.scitotenv.2018.09.021, 2019.
Zhang, C., Yang, C., Liu, X., Cao, F., and Zhang, Y.-l.: Insight into the photochemistry of atmospheric oxalate through hourly measurements in the northern suburbs of Nanjing, China, Sci. Total Environ., 719, 137416, https://doi.org/10.1016/j.scitotenv.2020.137416, 2020.