the Creative Commons Attribution 4.0 License.
the Creative Commons Attribution 4.0 License.
 | 05 May 2022
Air pollution monitoring: development of ammonia (NH3) dynamic reference gas mixtures at nanomoles per mole levels to improve the lack of traceability of measurements
Tatiana Macé
Maitane Iturrate-Garcia
Céline Pascale
Bernhard Niederhauser
Sophie Vaslin-Reimann
Christophe Sutour
The measurement of ammonia (NH3) in ambient air is a sensitive and priority topic due to its impact on ecosystems. NH3 emissions have continuously increased over the last century in Europe because of intensive livestock practices and the enhanced use of nitrogen-based fertilizers. European air quality monitoring networks monitor atmospheric NH3 amount-of-substance fractions. However, the lack of stable reference gas mixtures (RGMs) of atmospheric amount-of-substance fractions of ammonia to calibrate NH3 analyzers is a common issue of the networks, which results in data that are not accurate, traceable, or, thus, geographically comparable. In order to cover this lack, LNE (Laboratoire National de Métrologie et d'Essais) developed, in close collaboration with the company 2M PROCESS, a gas reference generator to dynamically generate NH3 RGMs in air. The method is based on gas permeation and a further dynamic dilution to obtain an amount-of-substance fractions ranging between 1 and 400 nmol mol−1 (also well known as ppb or parts per billion; 1 ppb (NH3) to ≈ 0.7 µg m−3) to cover the amount-of-substance fractions of ammonia measured in ambient air (emissions) and the operating range of the NH3 analyzers used by the monitoring networks. The calibration of the elements of the generator against the LNE primary standards ensures the traceability of the RGMs to the international system of units. Furthermore, the highly accurate flow and oven temperature measurements of the reference generator, together with the associated calibration procedure defined by LNE, guarantee relative expanded uncertainties of the calibration of the NH3 analyzers that are lower than 2 % (coverage factor = 2). This result is very satisfactory, considering the low NH3 amount-of-substance fraction levels (1 to 400 nmol mol−1) and the phenomena of adsorption and desorption, especially in the presence of traces of water on contact surfaces. A bilateral comparison was organized between METAS (Swiss Federal Institute of Metrology) and LNE, which consisted of the calibration of a Picarro G2103 gas analyzer by both national metrology institutes (NMIs). The results highlighted the good agreement between the NH3 reference generators developed by the two institutes and allowed the validation of both LNE's reference generator and calibration procedure. Since the end of 2020, LNE has calibrated several NH3 analyzers from the French air quality monitoring networks (Associations Agréées de Surveillance de la Qualité de l'Air – AASQA) using the newly developed SI-traceable RGMs. The enhanced number of calibrations provided may increase the comparability, accuracy, and traceability of the NH3 measurements carried out on French territory.
- Article
(1764 KB) - Full-text XML
- BibTeX
- EndNote


Measuring ammonia (NH3) in ambient air is a sensitive and priority topic because of its negative effects on ecosystems, even at low amount-of-substance fractions (i.e., atmospheric level; < 100 nmol mol−1). Ammonia is the main precursor of atmospheric acid neutralization and, therefore, affects the long-range transport of sulfur dioxide (SO2) and nitrogen oxide(s) (NOx). Moreover, atmospheric NH3 contributes to the formation and stabilization of suspended particles (PM10, PM2.5, and aerosols; Holmes, 2007), which have adverse effects on human health, such as premature deaths. In 2016, estimations suggested that 4.2 million premature deaths worldwide were caused by suspended particles (WHO, 2018). In addition, the deposition of ammonia on particle-borne molecules contributes to the eutrophication and acidification of soils and fresh water (Schöpp et al., 2003; Pinder et al., 2008) and, thus, to the degradation of soil and water quality. These phenomena therefore have negative effects on biodiversity and ecosystems.
The main sources of atmospheric NH3 are anthropogenic, such as fossil fuel combustion, power plants, vehicular exhaust, and agricultural activities (Behera et al., 2013; Wu et al., 2020). The latter accounts for about 60 % of the total NH3 global emissions (Clarisse et al., 2009), according to inventories and chemical transport models, such as GEOS-Chem, which allow us to select different grid sizes (e.g., 2∘ × 2.5∘; Clarisse et al., 2009; Paulot et al., 2014). Organic emissions from livestock and the application of organic, mineral, and organomineral fertilizers on crops are the main agricultural sources of NH3. In Europe, the European Union (EU) agricultural sector accounts for 93 % of European NH3 emissions (EEA, 2020). However, recent studies based on isotopic nitrogen suggest that the contribution of nonagricultural sources to NH3 emissions is greater than the agricultural ones in certain urban regions (Feng et al., 2022; Gu et al., 2022). Despite the management strategies adopted by the EU, then NH3 emissions have been increasing continuously since 1990 (Warner et al., 2017; Behera et al., 2013; Van Damme et al., 2021), mainly due to the development of intensive agricultural practices and the associated use of nitrogen-based fertilizers (Aksoyoglu et al., 2020).
Air pollution spreads across national borders and over long distances. This is why ammonia was included in the 1999 Gothenburg Protocol, revised in 2012 (UNECE, 2012), which is part of the Convention on Long-Range Transboundary Air Pollution (United Nations, 1979). The protocol was established with the aim of reducing acidification, eutrophication, and ozone concentrations by setting emission ceilings to be met by 2010. Following the revision of the Gothenburg Protocol, the Directive (EU) 2016/2284 (European Commission, 2016) defines national emission ceilings for each member state, in particular for NH3. As NH3 is recognized as a precursor of secondary inorganic aerosols, controlling its emissions is important for reducing PM2.5 and PM10 concentrations (Holmes, 2007; Clappier et al., 2021). Bessagnet et al. (2014), who used three different chemistry transport models, showed an underestimation of the formation of ammonium particles (e.g., ammonium nitrate or sulfate) and concluded that NH3 had a much greater role than the initial estimates. Contrary to the emission ceilings, no limit or threshold value is defined for NH3 in ambient air in the European directives. With regard to the protection of ecosystems, particularly of vegetation, NH3 concentration critical levels (CLEs) – based on measurements and observations – were set by the International Cooperative Programme (ICP) Vegetation of the United Nations Economic Commission for Europe (UNECE) in 1988. The updated NH3 CLE for the protection of lichens is 1 and 3 µg m−3 for higher-order plants (annual means under real conditions). A monthly critical level of 23 µg m−3 was also provisionally adopted to take into account possible high peaks in emissions during periods of manure application (e.g., in spring; Cape et al., 2009). Despite the importance of measuring ammonia for monitoring ambient air quality, neither the Directive (EU) 2016/2284 nor the Ambient Air Quality Directive 2008/50/EC (European Commission, 2008) provides recommendations for reliable measurements. In particular, recommendations on method selection, instrument calibration (procedures, frequencies, reference gas mixtures (RGMs) to be used, etc.), maximum allowed expanded uncertainty, quality assurance, and quality control procedures (QA/QC), as well as guidelines on infrastructure to ensure the metrological traceability of measurements, are lacking.
Available NH3 measurement techniques are very diverse and include direct and indirect methods, both with and without sample preconcentration steps. Direct methods of making real-time measurements are based on spectroscopic techniques, such as cavity ring-down spectroscopy (CRDS; Martin et al., 2016). Examples of indirect methods are active sampling using denuders or online gas–liquid interactions systems (e.g., MARGA or AIRMONIA; von Bobrutzki et al., 2010; Nair and Yu, 2020) and passive samplers (Braban et al., 2018; EN, 2020) that are exposed to ambient air for a certain period of time. During this period, NH3 is collected on a support impregnated with a reagent (acid–base reaction), which is then analyzed after extraction by ion chromatography, colorimetry, chemiluminescence, or flow injection analysis among others (Tang et al., 2001; Shah et al., 2006; Cao et al., 2009; Puchalski et al., 2011). The selection of an appropriate method generally depends on the concentration levels to be measured in ambient air, the desired spatial and temporal representativeness, and the restrictions to be taken into account (e.g., installation in the field, investment, and operating costs). Since NH3 is not regulated in ambient air, these methods are often poorly characterized, and they do not allow for reliable and comparable measurements that take effective quality assurance and quality control procedures (QC/QA; calibration, traceability, maximum allowed expanded uncertainty, etc.) into account, even if some methods are based on established standards (e.g., passive sampling; EN, 2020). For example, direct methods based on spectroscopic techniques are characterized by metrological performances that vary significantly among themselves, especially in terms of accuracy and resolution. In addition, the sampling systems and the control of relative humidity – key points in ammonia measurements – are not adequate. Furthermore, the lack of the traceability of the measurements to the International System of Units (SI traceability) performed with these instruments is highlighted, as stable RGMs in gas cylinders at low amount-of-substance fractions (< 500 nmol mol−1) are not commercially available. Reasons for that are the reactivity of ammonia with the inner walls of the cylinder and the phenomena of adsorption and desorption, especially in the presence of water traces (Martin et al., 2016). This lack of SI traceability therefore may affect the quality and credibility of the NH3 amount-of-substance fraction measured in ambient air by national air quality monitoring networks in Europe and the spatiotemporal comparability of data across countries.
In this paper, we describe a developed NH3 reference generator, based on permeation and further dynamic dilution, which can generate NH3 RGMs at low amount-of-substance fractions between 1 and 400 nmol mol−1 to cover the NH3 amount-of-substance fractions measured in ambient air (emissions) and the operating range of the NH3 analyzers used by the monitoring networks. Moreover, we present the setup of a calibration method for NH3 analyzers and the validation of the calibration method through a comparison with METAS (Swiss National Metrology Institute). This new reference generator will contribute to fulfill the lack of traceability, thus improving the accuracy and comparability of NH3 datasets.
The European MetNH3 project (2014–2017), within the framework of the European Metrology Research Programme (EMRP) of the European Association of National Metrology Institutes (EURAMET), assessed metrology issues for NH3 in ambient air. The project aimed to improve the comparability and reliability of NH3 measurements in ambient air by developing metrological standards, including both reference gas mixtures and standard analytical methods. The target of this development was to provide traceable NH3 amount-of-substance fractions in the environmentally relevant range of 0–500 nmol mol−1 (Pogány et al., 2016). Within the project, two solutions were investigated to generate NH3 amount-of-substance fractions from 1 to 400 nmol mol−1. One solution was based on the production of gravimetric RGMs in gas cylinders at a amount-of-substance fraction of 10 µmol mol−1, followed by a dynamic dilution using mass flow controllers. The other one was based on gas permeation with a double dynamic dilution stage (METAS, 2017).
The gravimetric method for preparing RGMs consists of introducing the pure constituent compounds of the RGMs into a cylinder under vacuum conditions and then determining the quantities of each constituent by weight differences (ISO, 2015). Thus, this method is traceable to the international system by kilograms and allows for the assessment of uncertainties of amount-of-substance fractions. The problem linked to this method is to obtain stable gas mixtures over time. Indeed, NH3 is a compound that is very easily adsorbed on the internal walls of the cylinder, as shown in the study carried out during the MetNH3 project on different materials (Pogány et al., 2016). This study shows that Teflon perfluoroalkoxy (Teflon PFA) or SilcoNert® 2000 materials lead to the lowest NH3 adsorption. As part of the same project, the Dutch National Metrology Institute (VSL) carried out a stability study on NH3 gas mixtures at 10 µmol mol−1 in cylinders treated by different processes. The obtained results showed that the stability of the amount-of-substance fraction of the gravimetrically prepared gas mixtures at 10 µmol mol−1 of NH3 was not completely satisfactory, especially since it was subsequently necessary to dilute this gas mixture dynamically to obtain the desired low amount-of-substance fractions (nmol mol−1). The principle of the gas permeation technique (ISO, 2002) is based on the permeation of a pure chemical compound through a semi-permeable membrane. This technique is particularly used for the generation of dynamic RGMs of gaseous compounds that are reactive or not very stable over time (e.g., sulfur dioxide (SO2) and nitrogen dioxide (NO2)). During the MetNH3 project, METAS selected the permeation technique to generate NH3 RGMs. The developed portable device was based on the implementation of a permeation tube in a temperature-regulated oven and on mass flow controllers allowing the dynamic dilution of the pure NH3 from the permeation tube to the desired amount-of-substance fractions. All parts in contact with NH3 were inert due to a SilcoNert® 2000 coating to avoid adsorption effects (Vaittinen et al., 2018). The results obtained by METAS during the study showed a good stability (standard deviation lower than 1.5 %) in the generation of NH3 with short response time (lower than 60 min), even at very low amount-of-substance fractions.
The project results showed that it is therefore possible to generate low amount-of-substance fractions of NH3 by limiting the adsorption of this compound with coatings such as SilcoNert® 2000. The use of gas permeation provides an NH3 amount-of-substance fraction range compatible with measurements in ambient air with relative uncertainties of less than 3 %. The French NMI (national metrology institute) LNE (Laboratoire National de Métrologie et d'Essais) has therefore chosen this technique for developing the NH3 reference generator, which is used for calibrating analyzers over their analytical range. This technique has been used by LNE for many years for molecules, such as SO2 and NO2, or even more recently for traces of water vapor which are not stable in gas cylinders at these low amount-of-substance fractions.
3.1 Principle of the permeation method
Permeation tubes consist of a polymeric membrane (usually polytetrafluoroethylene (PTFE) or a copolymer of tetrafluoroethylene and hexafluoropropylene – FEP) through which a small amount of pure analyte (NH3) will permeate (Lucero, 1971). The most common type is a small, sealed tubular device which contains the analyte (e.g., NH3) in liquid form. A very small but stable flow (hundreds of ng min−1) of ammonia in the gaseous phase is emitted through the permeable membrane when the temperature is constant. This emission or permeation rate depends on the physical characteristics of the permeable membrane, on the permeability of the analyte through the membrane, on the temperature of the permeation tube, and on the partial pressure across the membrane. The permeation rate of the tube is determined by measuring its mass loss over time using a microbalance with a resolution of 1 µg and applying the Borda weighing method (Gläser and Borys, 2009) under temperature-controlled conditions, using a temperature sensor with a resolution of 0.01 ∘C and a standard deviation of 0.05 ∘C to guarantee the traceability to the SI. The tube placed in a temperature- and flow-controlled stream of inert dilution gas (see Fig. 1) allows the generation of an ammonia gas mixture, which is stable in terms of the amount-of-substance fraction at trace levels (nmol mol−1).

Figure 1Principle of the permeation technique. (a) Example of a permeation tube placed in a chamber, where temperature (T), pressure (P), and dilution gas flow are regulated. (b) The permeation tube is filled with the selected pure compound in liquid form (blue). The compound (e.g., NH3) permeates through the membrane (blue wavy lines) at specific permeation rates (qm), which are mainly temperature dependent. Gray arrows represent the dilution input flow (qv) of the gas (e.g., nitrogen or synthetic air) used to generate reference gas mixtures at different amount-of-substance fractions depending on the flow. The bicolor arrows represents the input flow (qv) of the generated reference gas mixture (RGM) at a specific amount-of-substance fraction (χ).
3.2 Description of the NH3 reference generator
LNE drew up specifications for the development of an NH3 reference generator based in particular on the EN ISO 6145-10 standard (ISO, 2002). The reference generator was implemented by the French company 2M PROCESS at the specific request of LNE, based on a very close collaboration involving metrological, technical, and software development skills. This generator consists of a thermostatically controlled oven (Dynacalibrator model 150; VICI Metronics, Inc., WA, USA) that houses the NH3 permeation tube, four mass flow controllers (MFCs; EL-FLOW Prestige; Bronkhorst, the Netherlands), one back pressure regulator (EL-PRESS; Bronkhorst, Netherlands), and a touch-sensitive graphic interface for the automatic control of all the elements (see Fig. 2). The temperature is only a control value but not an entry parameter for the determination of the permeation rate. After the weighing of the tube, it is replaced in the oven exactly at the same position; in this way, the influence of the temperature gradient does not have to be taken into account.
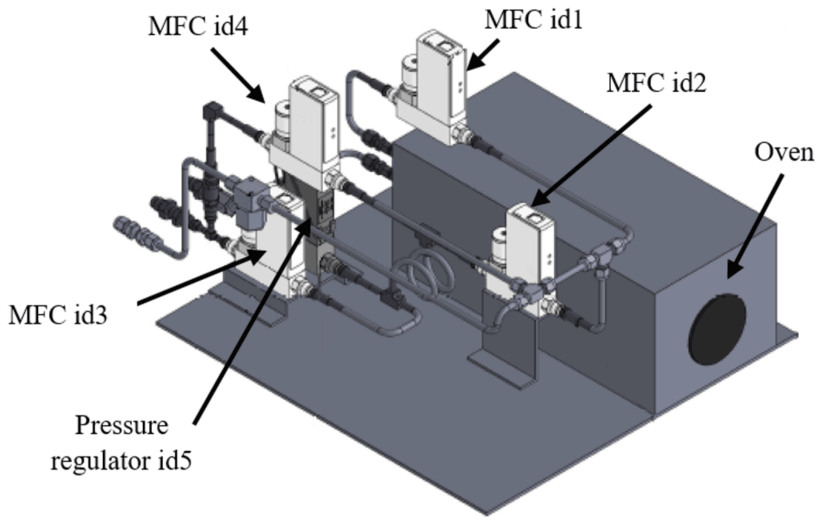
Figure 2Scheme of the reference generator implemented by the company 2M PROCESS under LNE's specifications (height of 43 cm; length of 52 cm; width of 60 cm). Labels correspond to the main elements of the reference generator, including the oven, pressure regulator, and mass flow controllers (MFCs).
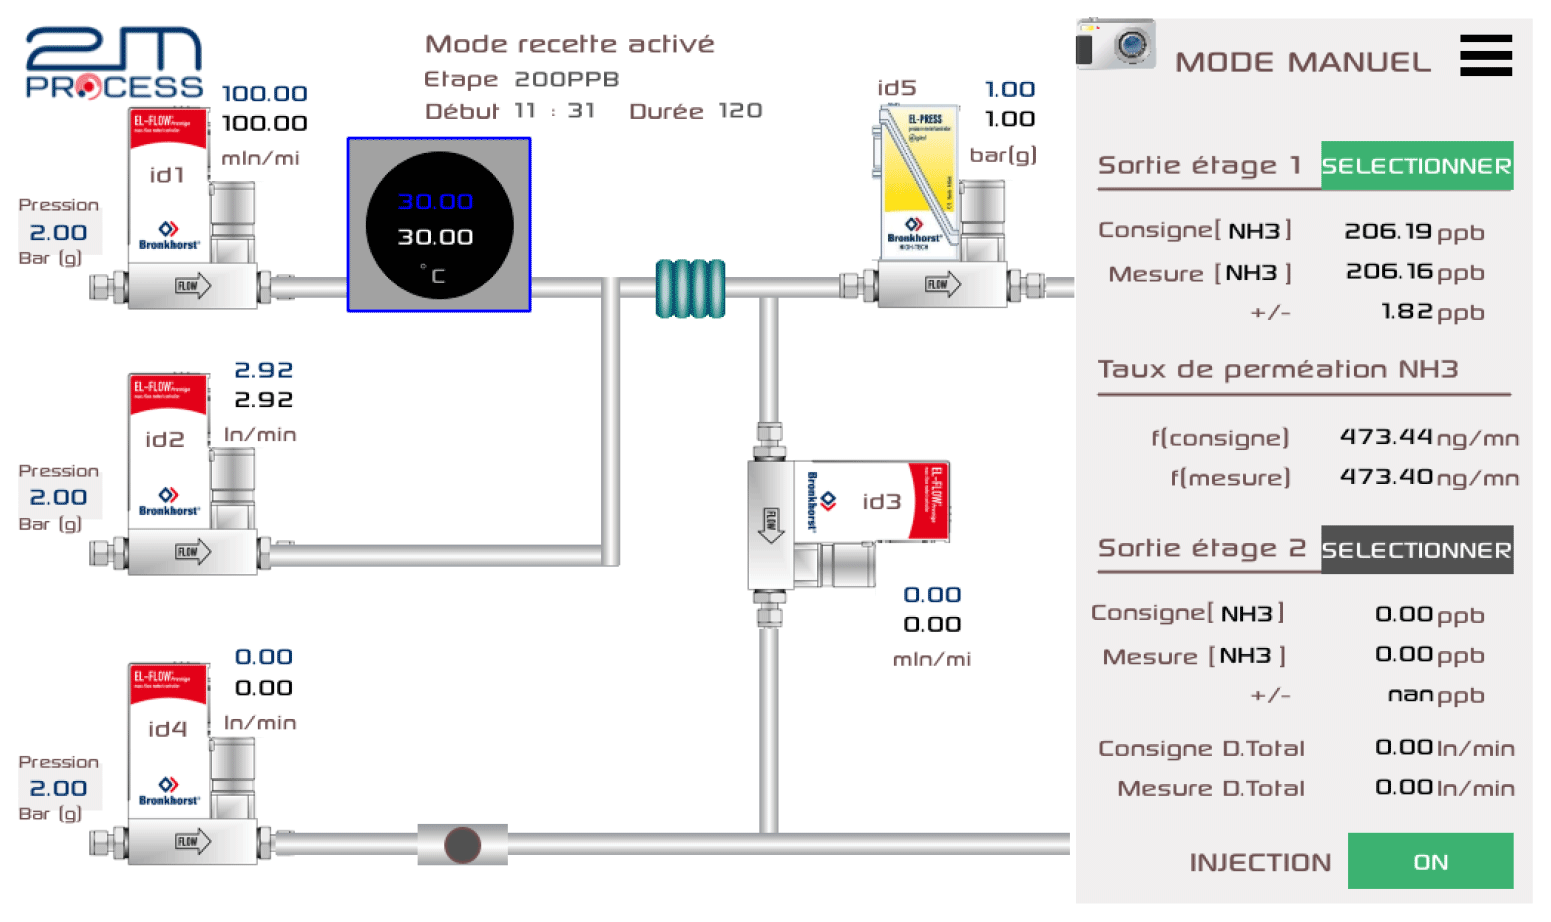
Figure 3Schematic diagram of the reference generator. The mass flow controllers (MFCs) used to regulate the carrier and dilution gas are indicated as id1–id4. The label id5 represents the pressure controller, and the blue square is the oven where the permeation tube is placed. On the right side of the figure, an example of the set and reading values provided by the software is shown (the graphical user interface is in French).
All parts (tubing, oven, and MFCs) in contact with NH3 are coated with SilcoNert® 2000 in order to limit the adsorption of NH3 on the walls as much as possible. The ammonia permeation tube (99.98 % purity; Fine Metrology S.r.l.s., Italy) is placed inside the temperature-controlled oven at 30.00 ∘C ± 0.01 ∘C, which is flushed with purified dry air (online gatekeeper, CE2500KF04R; Entegris, USA) at 100 mL min−1 (id1). The first dilution stage consists of two MFCs (id1 and id2), with a measurement range of, respectively, 120 mL min−1 and 10 L min−1, allowing for the generation of amount-of-substance fractions from 400 to 60 nmol mol−1 (also depending on the permeation rate of the tube) with a back pressure regulator (100 kPa relative; id5) to regulate the gas pressure in the permeation oven. The second dilution stage is composed of two MFCs (id3 and id4) with a measurement range of, respectively, 120 mL min−1 and 10 L min−1, leading to amount-of-substance fractions between 50 and 1 nmol mol−1. All MFCs are calibrated against very accurate flowmeters (molbloc/molbox™; Fluke Calibration, WA, USA) previously calibrated by the dynamic gravimetric method at LNE. An integrated software (graphical interface), which allows the automatic control of MFCs, calculates the amount-of-substance fraction of the gas generated and its associated uncertainty. Figure 3 shows the different elements of the reference generator and their functions during the generation of NH3 at the first and second stages.
The ammonia amount-of-substance fraction generated by the reference generator, in nanomoles per mole, can be estimated according to Eq. (1) as follows:
Here, qm is the permeation rate of the tube in nanograms per minute (ng min−1), M is the molar mass of ammonia in grams per mol (g mol−1), qv is the total air flow in liters per minute (L min−1), and Vn is the normal molar volume of the dilution gas in liters per mole (L mol−1) (273.15 K and 101.3 kPa).
The nominal permeation rate (provided by Fine Metrology S.r.l.s.) of the ammonia tube was (462 ng min−1 ± 5 %) at 30 ∘C. The tube was weighed monthly to account for the effects of temperature variation and temporal stability on the determination of the amount of pure NH3 emitted (i.e., permeation rate).
4.1 Determination of the permeation rate
The rate of permeation (in ng min−1) of the tube used in this study between day i and day j was calculated according to Eq. (2), as follows:
where is purity of the liquid NH3 in the permeation tube, Δm is the mass loss of the tube between day i and day j (in grams), Δt is the period of time for the mass loss Δm between day i and day j (in minutes), CT is the correction accounting for the stability of the temperature in the oven (in ng min−1), CR is the correction associated to the reproducibility of the weighing procedure (in ng min−1), and is the stability of the permeation rate over time (in ng min−1).
4.2 Contributors to the uncertainty of the permeation rate
4.2.1 NH3 purity ()
The pure compound in liquid form contained in the permeation tube was supplied by the company Sigma-Aldrich. The certificate of analysis provided by the manufacturer stated that there is a level of purity greater than 99.98 %, where water vapor is the major impurity. The purity was considered to be equal to 0.9999, with a standard uncertainty calculated according Eq. (3), as follows (uniform law):
4.2.2 Mass loss of the tube (Δm)
The calculation of the standard uncertainty of the tube mass loss between day i and day j took into account the following uncertainty sources: mass standards, balance resolution and accuracy, weighing repeatability, air density, and volume of the tube.
4.2.3 Period of time for the mass loss (Δt)
The standard uncertainty of the period during which the mass loss was determined was calculated by applying a uniform law given by Eq. (4), as follows:
4.2.4 Stability of temperature (CT)
The stability of the oven temperature is equal to 0.05 ∘C. Since the influence of temperature on the permeation rate of the tube is of the order of 8 % per degree, when considering a uniform law (Eq. 5), the standard uncertainty was the following:
4.2.5 Reproducibility of the weighing procedure (CR)
The reproducibility of the tube weighing process was estimated by periodically weighing a permeation tube with a stable permeation rate during 3 months. The reproducibility correction was considered to be zero, and the associated uncertainty was evaluated as being equal to 0.2 % of the permeation rate. The reproducibility standard uncertainty was calculated according to Eq. (6), as follows:
4.2.6 Evolution of the permeation rate over time
The permeation tube was placed in the oven of the reference generator at a temperature of 30.00 ∘C ± 0.05 ∘C. It was weighed regularly to calculate its permeation rate over a period of 2 years.
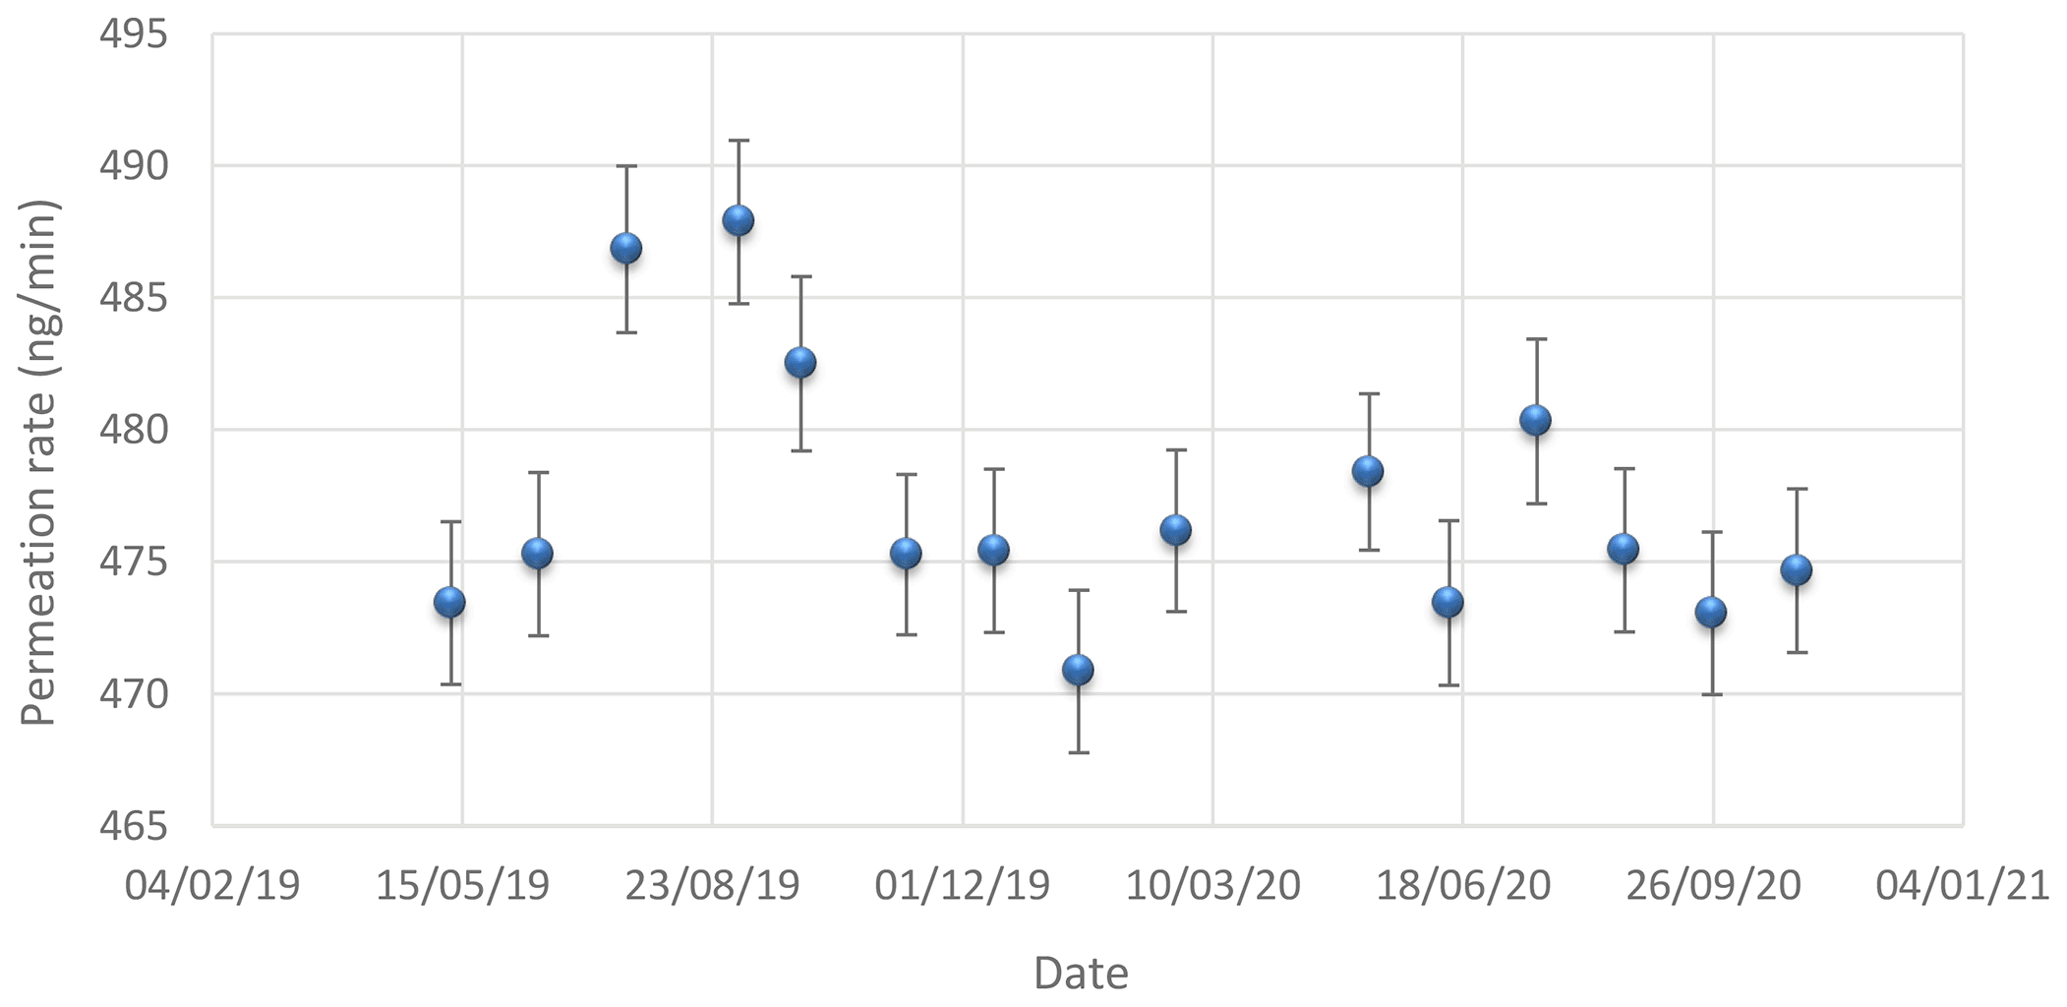
Figure 4Evolution of the permeation rate of the tube over time. The points represent the different values of the permeation rate measured over time. The error bars correspond to the expanded uncertainty (k = 2) on the determination of the tube permeation rate.
The results obtained over 2 years showed that the permeation rate of the NH3 tube was stable over time, with the exception of the first few months, which is quite usual when putting a new permeation tube into an oven (tube maturation). Figure 4 illustrates the change in the permeation rate of the tube over time. The error bars correspond to the expanded uncertainty (k = 2) on the determination of the permeation rate of the tube.
The stability over time of the permeation rate was considered as being equal to zero. Its standard uncertainty , in nanograms per minute (ng min−1), was calculated by considering the maximum deviation found between the last three determinations of the tube permeation rate (Eq. 7), as follows:
4.3 Uncertainty budget of the NH3 permeation rate
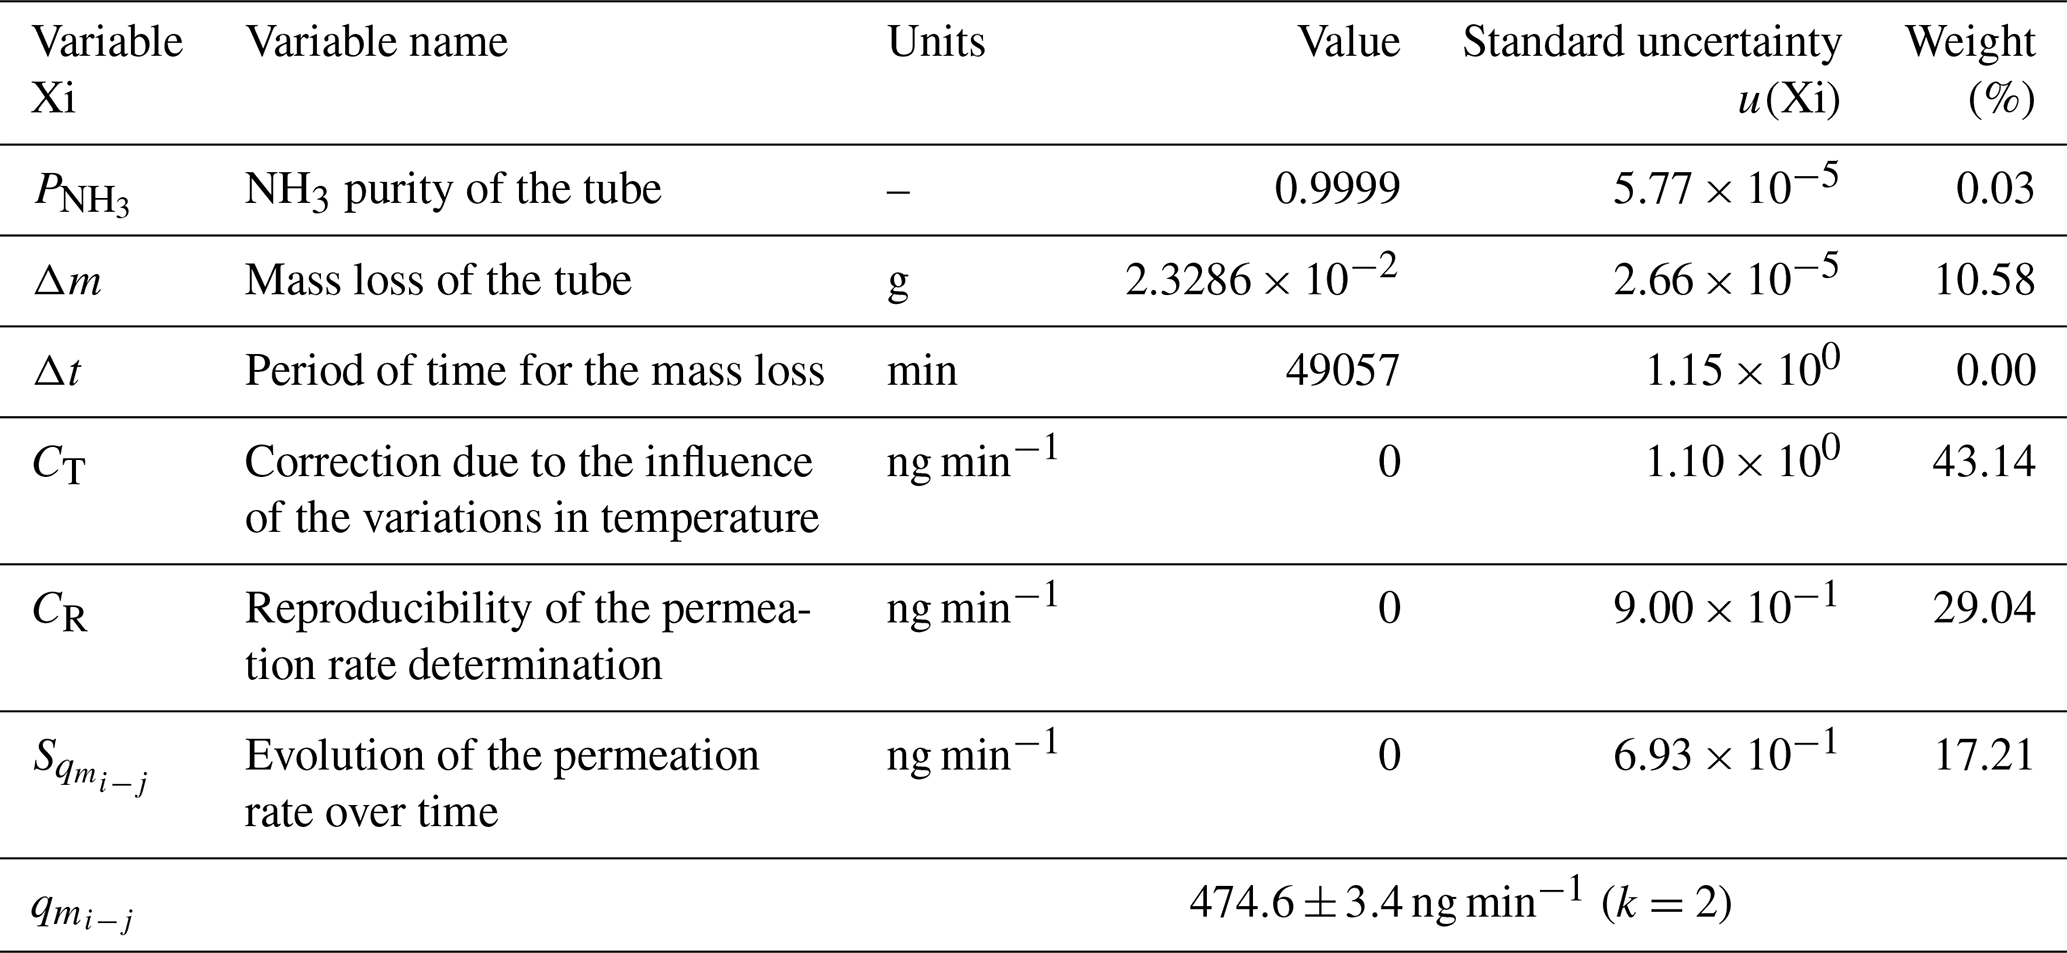
The uncertainty budget of the NH3 permeation rate was calculated using the standard uncertainties determined previously and by applying the law of propagation of uncertainties expressed in the Guide to the Expression of Uncertainty in Measurement (GUM; JCGM, 2008) on the Eq. (2). One example is summarized in Table 1.
Table 1The uncertainty budget of one of the permeation rates used in this study. The contribution, in percent, of each variable to the overall uncertainty is indicated in the weight column. The last row shows the permeation rate value and its expanded uncertainty. k is the coverage factor of the uncertainty.
5.1 Determination of the amount-of-substance fraction of the generated RGMs
The developed reference generator has two dilution stages, where the first one is for the highest amount-of-substance fractions (400 to 60 nmol mol−1) and the second one is for the lowest amount-of-substance fractions (50 to 1 nmol mol−1). The NH3 amount-of-substance fractions in the RMGs generated by the reference generator can be estimated applying Eqs. (8) and (9).
-
After the first stage of generation, the following applies:
-
After the second stage of generation, the following applies:
where xref1 is the NH3 amount-of-substance fraction in the RGMs after the first stage of generation (nmol mol−1), xref2 is the NH3 amount-of-substance fraction in the RGMs after the second stage of generation (nmol mol−1), is the calculated permeation rate (g min−1), M is the NH3 molar mass (g mol−1), is the air flow flushing the permeation tube (L min−1), is the first stage dilution of air flow (L min−1), is the flow rate of the NH3 reference gas mixture from the first stage (L min−1), is the second stage dilution of air flow (L min−1), Vn is the normal molar volume of the dilution gas (L mol−1), and Imp is the specification of the residual amount-of-substance fraction after the filter given by the supplier (mol mol−1).
5.2 Determination of the standard uncertainties of the amount-of-substance fractions of the generated RGMs
The variance in the NH3 amount-of-substance fraction in the generated RGMs was determined using the law of propagation of uncertainty expressed in the Guide to the Expression of Uncertainty in Measurement (GUM; JCGM, 2008). The standard uncertainties of the NH3 amount-of-substance fractions of the generated RGMs were as follows:
-
The standard uncertainty of the permeation rate , which was calculated as described in Sect. 4.3.
-
The standard uncertainty of the NH3 molar mass (u(M)), which was determined with data from the IUPAC document (IUPAC, 2013).
-
The standard uncertainties of the flow rates (, , , and ), which were determined using the results obtained during the calibration of the MFCs at LNE. These standard uncertainties take into account the uncertainty of the linearity (u(linearity), which was estimated according to a model, WLS RegPoly, developed by LNE (Yardin, 2013), the uncertainty related to the calibration (u(calibration)), and the uncertainty related to the durability of the calibration (u(durability)) as shown in Eq. (10), as follows:
-
The standard uncertainty of the normal molar volume (u(Vn)), which is given in the CODATA document (Mohr et al., 2016).
-
The standard uncertainty (u(Imp)) of the residual NH3 amount-of-substance fraction in the dilution air (ALPHAGAZ 2 from Air Liquide) that was purified by means of an Entegris filter (CE2500KF04R). According to the specifications of the Entegris filter (CE2500KF04R), the residual NH3 amount-of-substance fraction was less than 10 pmol mol−1. The NH3 residual amount-of-substance fraction was considered to be equal to 0.005 nmol mol−1, with a standard uncertainty estimated following Eq. (11) (uniform law):
5.3 Summary of the uncertainty budget of the amount-of-substance fractions of the generated reference gas mixtures
The uncertainty budget of the NH3 amount-of-substance fractions generated by the reference generator was calculated from the standard uncertainties determined previously and by applying the law of the propagation of uncertainties. The two examples at the extreme points of the generation range of the reference generator are summarized in Tables 2 and 3.
Table 2The uncertainty budget of the amount-of-substance fraction of one of the ammonia RGMs generated after the first dilution stage. The contribution, in percent, of each variable to the overall uncertainty is indicated in the weight column. The last row shows the amount-of-substance fraction value and its expanded uncertainty. k is the coverage factor of the uncertainty.
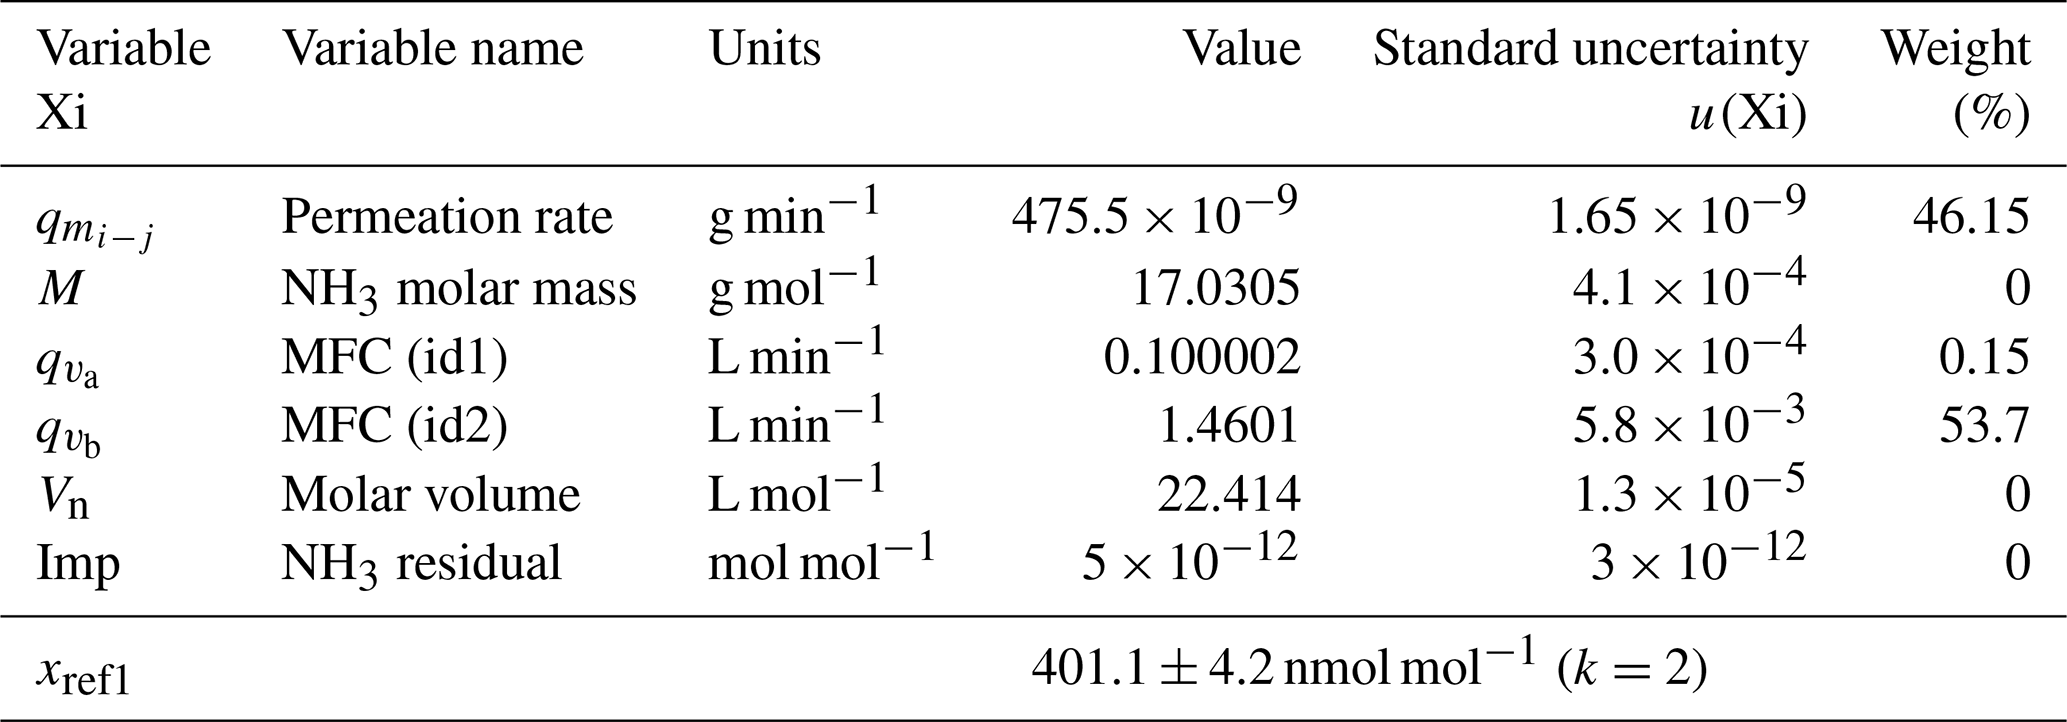
Table 3The uncertainty budget of the amount-of-substance fraction of one of the ammonia RGMs generated after the second dilution stage. The contribution, in percent, of each variable to the overall uncertainty is indicated in the weight column. The last row shows the amount-of-substance fraction value and its expanded uncertainty. k is the coverage factor of the uncertainty.
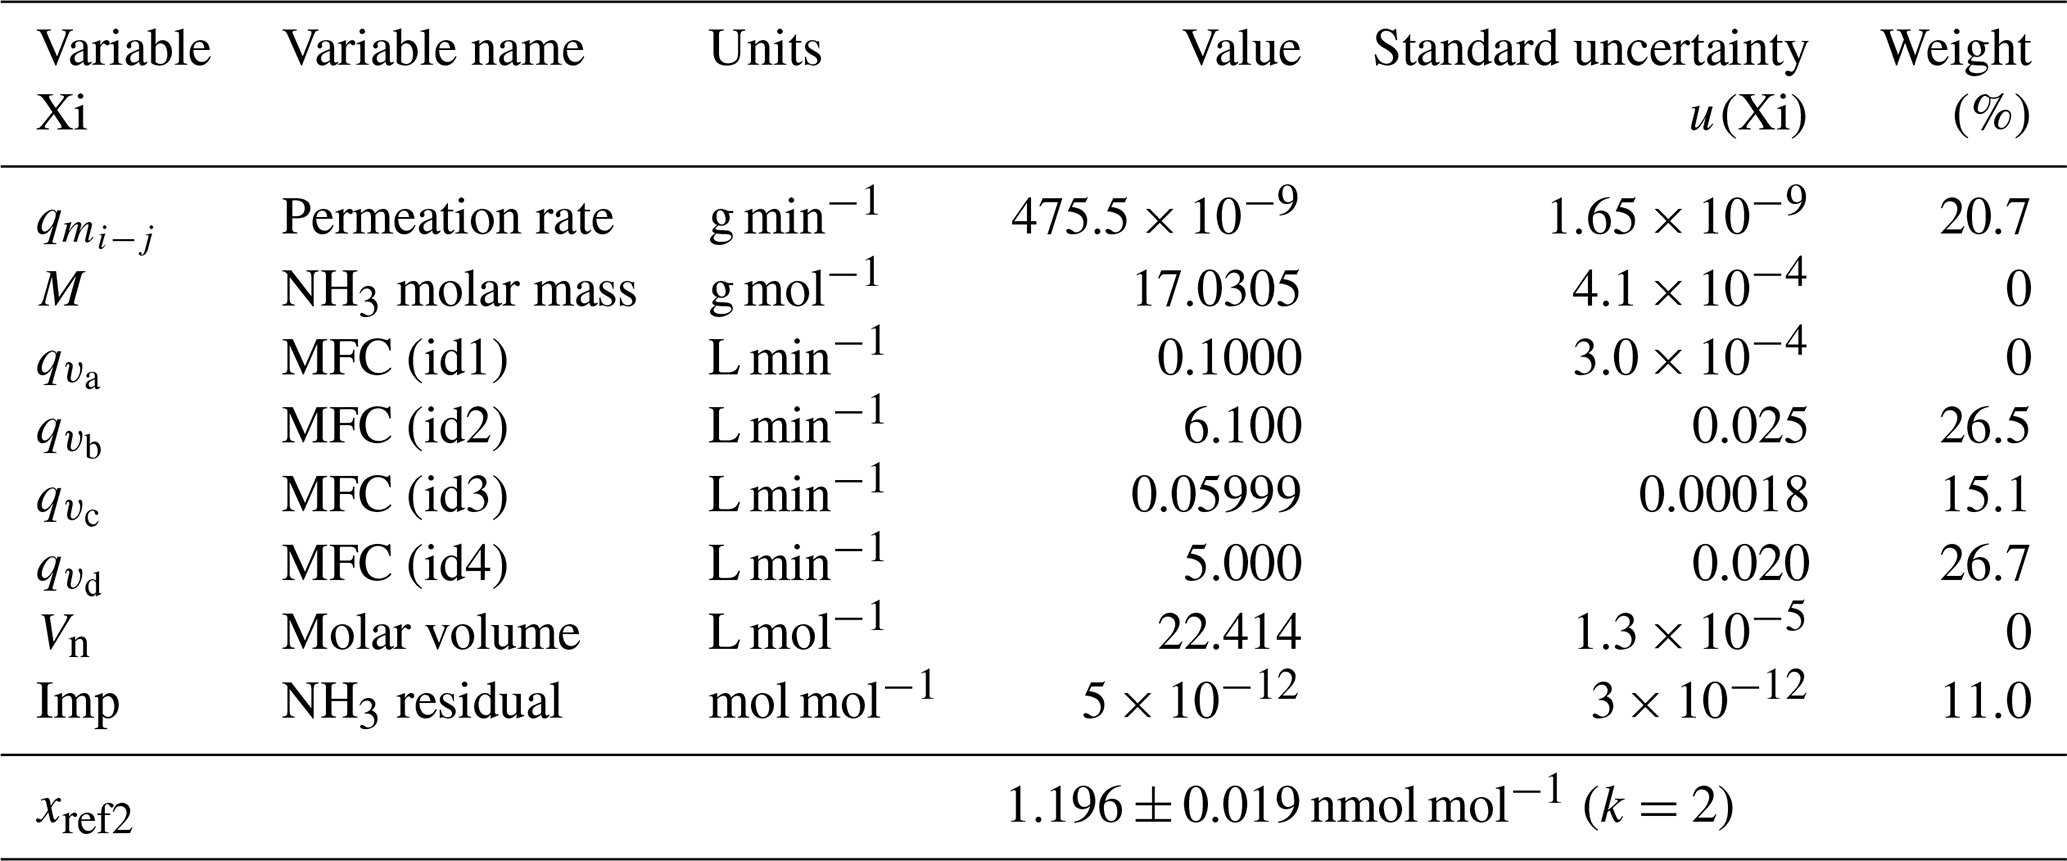
These results highlighted that the main source of uncertainty of the NH3 reference amount-of-substance fractions generated after the single dilution (first stage is from 400 to 60 nmol mol−1) was linked to the calculation of the permeation rate of the tube and to the measurement of the dilution air flow rate (MFC – id2). After the second dilution step (< 60 nmol mol−1), the weight of the uncertainties was more evenly distributed among the uncertainty of the permeation rate, the flow rates (MFCs – id2, id3, and id4), and the residual NH3 impurities in the dilution air. The expanded relative uncertainties of the generated amount-of-substance fractions were between 1 and 2 % over the whole range.
We determined the repeatability, reproducibility, and uncertainty budget of the calibration procedure in order to characterize it. For that purpose, the reference generator was permanently switched on during the characterization, and the NH3 permeation tube was continuously flushed by a synthetic air flow at 100 mL min−1. NH3 amount-of-substance fractions between 0 and 400 nmol mol−1 were generated during 2 h for each amount-of-substance fraction level using the reference generator. The average of the generated amount-of-substance fractions and the average of the readings of the analyzer to be calibrated were calculated over the last 30 min, along with their standard deviations.
6.1 Determination of the repeatability of the calibration method
To evaluate the repeatability of the calibration method – following the procedure indicated in the air quality standards as, for example, in EN 14211 (EN, 2012) – at different amount-of-substance fractions, nine levels were generated in the range between 1 and 400 nmol mol−1. The software of the developed reference generator calculated, every 10 s, the amount-of-substance fraction of NH3 generated according to the set parameters (permeation rate, molar mass, purity, etc.), the measured flow rates (MFCs), and oven temperature (taking into account temperature variations). Table 4 shows the standard deviations calculated over the last 30 min of generation for the amount-of-substance fractions ranging between 1 and 400 nmol mol−1.
Table 4Repeatability of amount-of-substance fractions generated by the ammonia reference generator. The average and the absolute and relative standard deviations of the amount-of-substance fractions generated during the last 30 min are included.
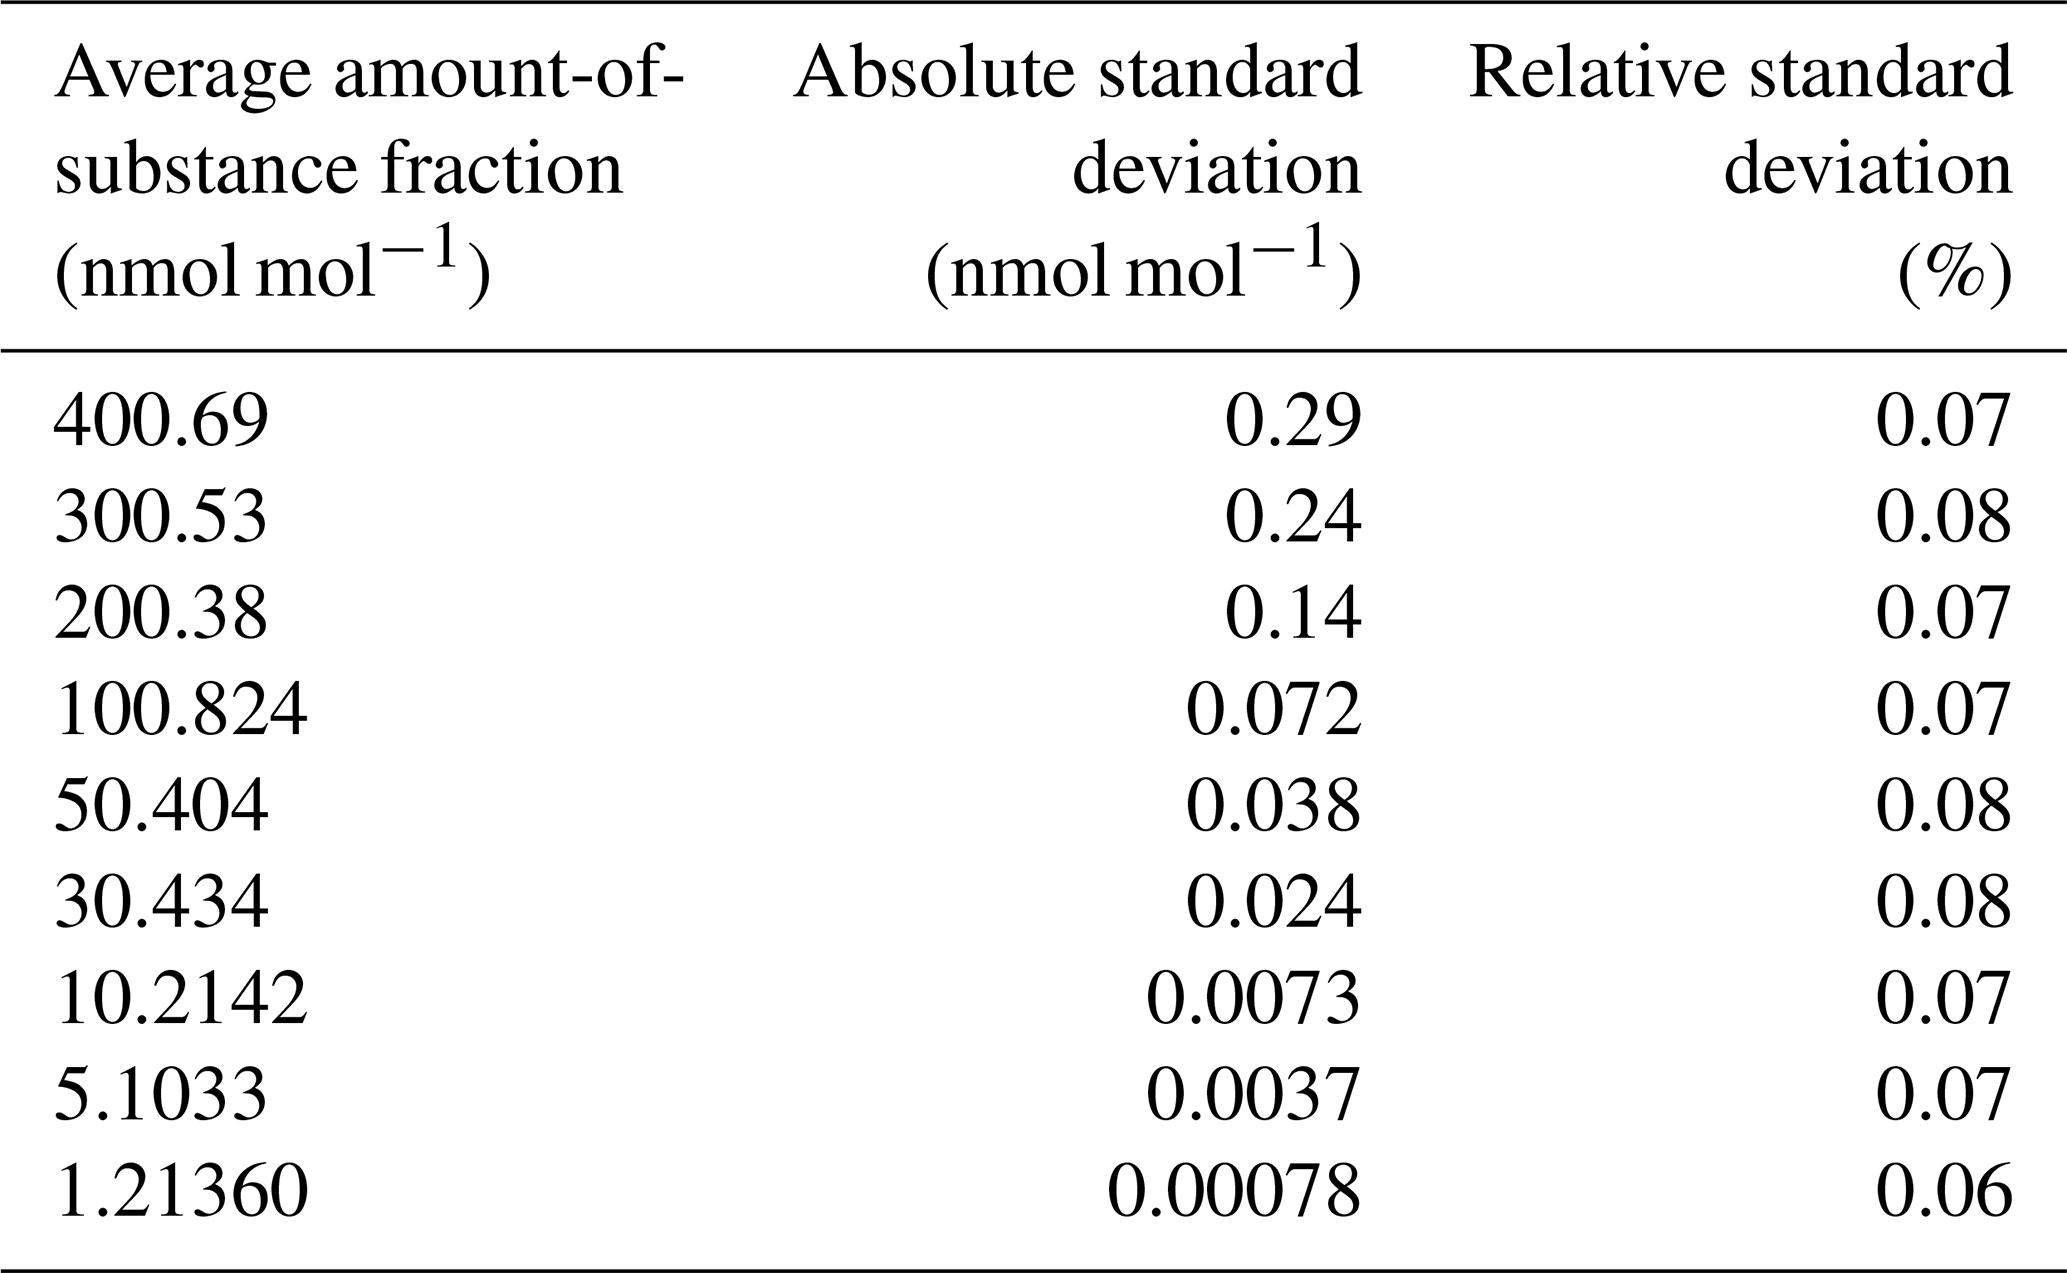
The relative standard deviation of the generated amount-of-substance fractions at all generation levels was less than 0.1 %, indicating a very good stability of the flow rates and a good temperature control. A standard uncertainty of the repeatability equal to 0.1 % (i.e., ) was retained and combined with the uncertainty calculated for the reference generator (see Sect. 5.3).
6.2 Determination of the reproducibility of the calibration method
LNE used the METAS ammonia analyzer, based on cavity ring-down spectroscopy (G2103, Picarro Inc., CA, USA), for a bilateral comparison. This device is specifically manufactured for the measurement of NH3. Moreover, the analyzer was upgraded in 2019, when the cavity and the sampling handling were replaced by SilcoNert® 2000 coated elements, thus limiting the adsorption. The analyzer required an inlet flow rate of 1.8 L min−1, which was provided by an external diaphragm vacuum pump (N920AP.29.18; KNF Neuberger Inc., NJ, USA) and was calibrated without a particle filter. The tests were performed using Air ALPHAGAZ 2 (Air Liquide) purified with an Entegris filter and in. (6.35 mm) coated (SilcoNert® 2000) stainless steel tubing. In order to quantify the reproducibility standard deviation on the calibration of an NH3 analyzer, the calibration of the Picarro G2103 analyzer was performed four times, on different days, between 20 and 125 nmol mol−1 (the amount-of-substance fractions are limited by the sampling flow rate of the analyzer). The calibration function was determined for each of the calibrations using the RegPoly software developed at LNE. This software allowed the integration of the uncertainties of the x and the y axes. The procedure was the same as when determining repeatability in that there was generation during 2 h and the calculation of the amount-of-substance fraction average and the associated standard deviations over the last 30 min. Tables 5 and 6 summarize the results obtained.
Table 5Tests were performed to determine reproducibility of the calibration of an ammonia analyzer using the reference generator from LNE and the Picarro NH3 analyzer from METAS. The coverage factor (k) is indicated for the combined uncertainty of the permeation. The calibration function is also included, where y are the readings, x are the average NH3 amount-of-substance fractions generated, b is the slope, and b0 the intercept.

∗ This value corresponds to the specification of the residual amount-of-substance fraction of the Entegris filter.
Table 6The reproducibility of the determination of the calibration function of an ammonia analyzer.
The reproducibility of the determination of the calibration function was around 0.05 % (Table 6). A reproducibility uncertainty increased to 0.1 % (i.e., ) was considered in the uncertainty budget.
6.3 Uncertainty budget of the calibrated amount-of-substance fractions
The expanded uncertainty (k = 2) of the calibrated NH3 amount-of-substance fractions () in nanomoles per mole (nmol mol−1) was calculated using Eq. (12) as follows:
where u2(xref) is the variance of the NH3 amount-of-substance fraction calculated by the software of the reference generator (in nmol mol−1), u2(r) is the repeatability variance of the calibration method in nanomoles per mole (nmol mol−1), u2(repro) is the reproducibility variance of the calibration method in nanomoles per mole (nmol mol−1).
Table 7 shows the final uncertainties obtained over the range of amount-of-substance fractions generated by the reference generator.
Table 7The uncertainty budget of the NH3 amount-of-substance fractions used as calibration values. The coverage factor (k) is indicated for the absolute and the relative expanded uncertainties.
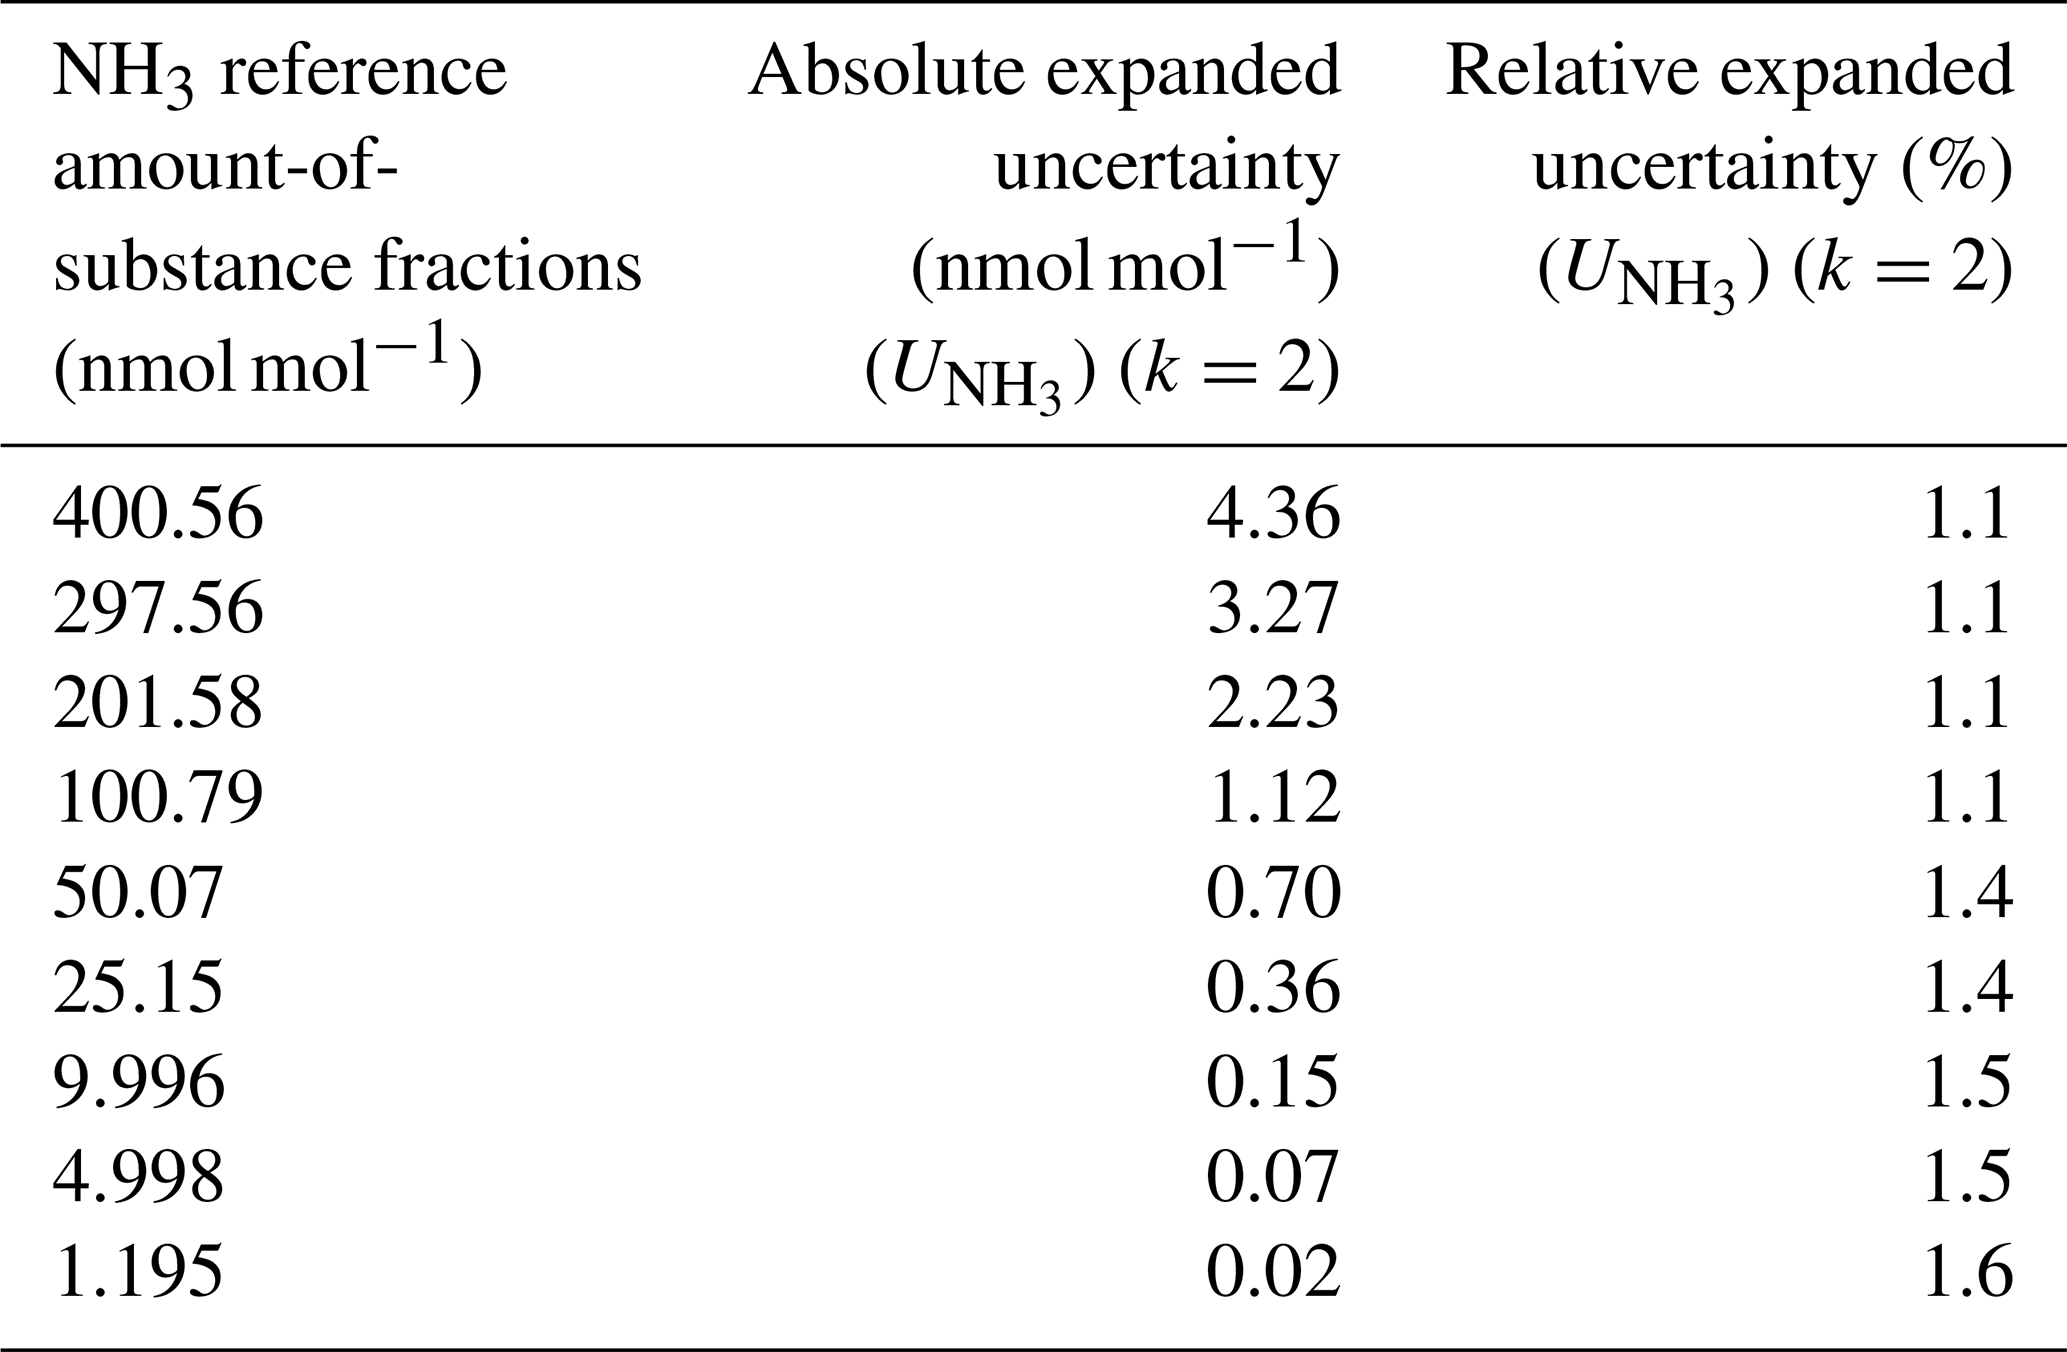
The uncertainty budget of the NH3 reference amount-of-substance fractions highlighted that, over an amount-of-substance fraction ranging between 1 and 400 nmol mol−1, the relative expanded uncertainties were between 1.1 % and 1.6 %. This uncertainty may vary slightly over time, depending mainly on the uncertainties of the permeation rate of the NH3 tube and the MFC calibrations. Nevertheless, taking into account the experience acquired at LNE on the weighing of permeation tubes and on the calibration of MFCs, the relative expanded uncertainties would remain less than 2 % (k = 2) over the whole range studied. It should be noted that, for the amount-of-substance fractions obtained after the first dilution stage, the associated uncertainty was mainly linked to the uncertainty of the permeation rate and the dilution air flow rate. For the amount-of-substance fractions generated after the second dilution stage, the main uncertainties were those of the NH3 tube permeation rate, the two dilution air flow rates (id3 and id4), and the flow rate taken from the first stage (id2). The uncertainty of the amount-of-substance fraction of the NH3 impurities present in the dilution gas could represent up to 10 % of the final uncertainty for very low amount-of-substance fractions.
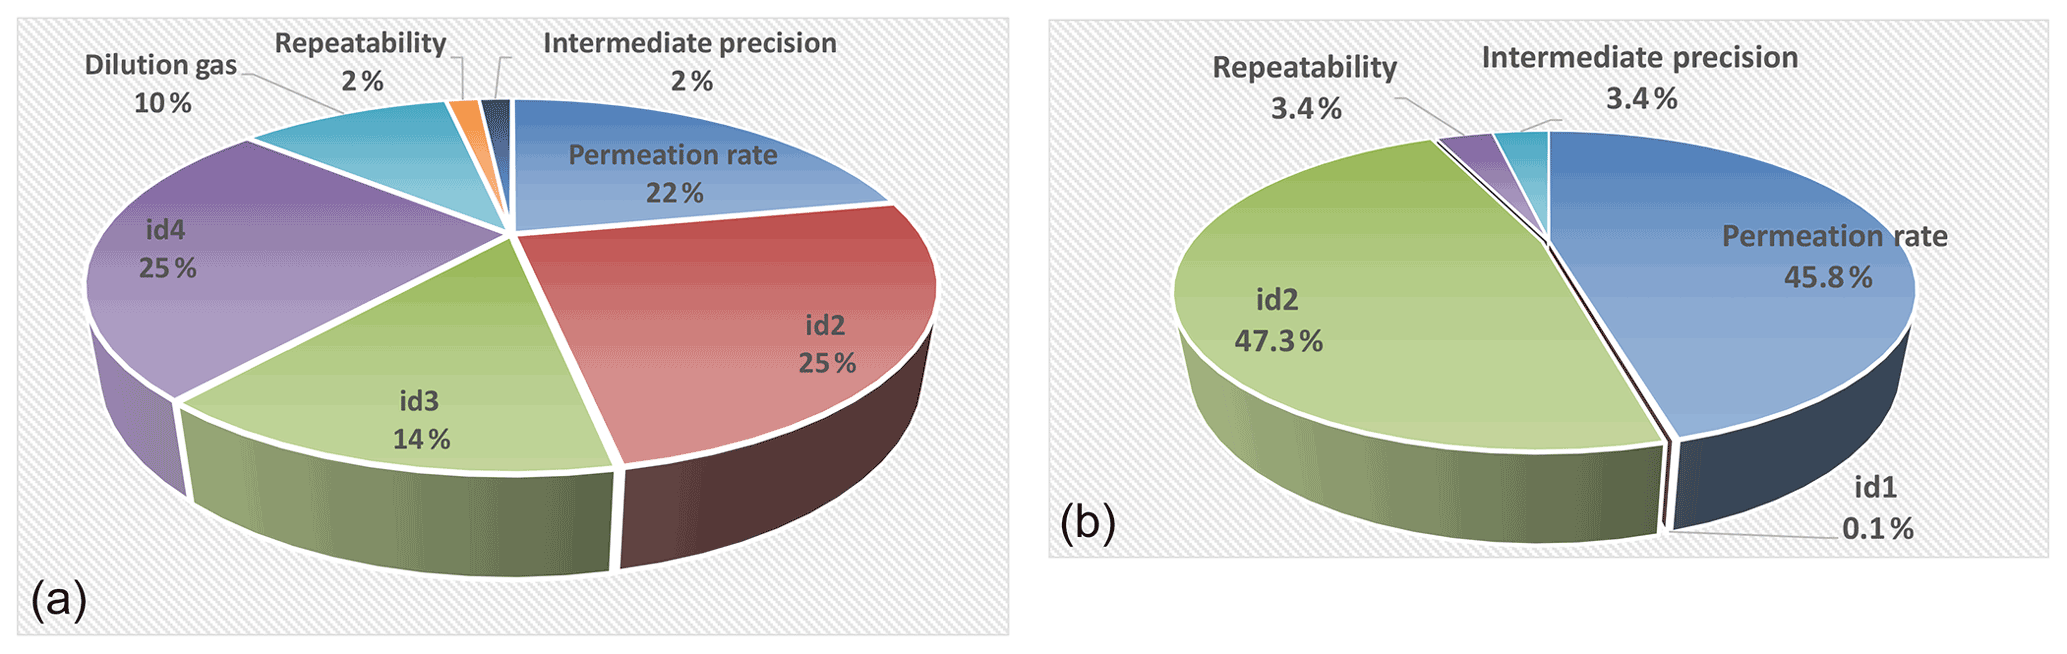
Figure 5The distribution of the different uncertainty sources for NH3-calibrated amount-of-substance fractions from 1 nmol mol−1 (second stage of dilution; a) and 400 nmol mol−1 (first stage of dilution; b). The sources indicated as id1–id4 correspond to the mass flow controllers of the generator.
Figure 5 shows, schematically, the distribution of the different uncertainty sources for NH3-calibrated amount-of-substance fractions from 1 nmol mol−1 (second stage) and 400 nmol mol−1 (first stage).
A bilateral comparison with METAS was organized in order to verify the accuracy of the calibration method developed at LNE. In March 2020, METAS calibrated their Picarro G2103 gas analyzer using an NH3 permeation tube (99.98 % purity; Fine Metrology S.r.l.s., Italy) to use it as a transfer standard at LNE. The permeation rate of the tube was determined at METAS using a coated (SilcoNert® 2000) magnetic suspension balance (MSB; Rubotherm GmbH, Germany) under regulated temperature and pressure conditions. The permeation rate value was 206.6 ng min−1 with an expanded uncertainty (U) of 3.1 ng min−1 (k = 2) at (37.96 ± 0.01) ∘C. METAS calibrated their instrument on 2 March 2020. For that purpose, METAS used the dilution system of their MSB, to generate reference gas mixtures of NH3 in synthetic air (99.9996 % purity; PanGas AG, Switzerland). In total, three calibration points were generated at amount-of-substance fractions between 35 and 150 nmol mol−1. Measurements of synthetic air were used as zero calibration point. Each calibration point was generated during 90 min; only the average value of the last 30 min of the generation and the reading were considered (Table 8). The tubing used during the generation was in. (6.35 mm) (SilcoNert® 2000) stainless steel.
Table 8The results of the Picarro G2103 analyzer calibration performed by METAS. The generated amount-of-substance fractions and reading values are the average of the last 30 min of the generation and reading, respectively. The coverage factor (k) of the expanded uncertainty of the generation is indicated.

The analyzer's calibration function estimated using the RegPoly software developed by LNE followed Eq. (13):
where y is the reading of the analyzer, and x is the reference amount-of-substance fraction.
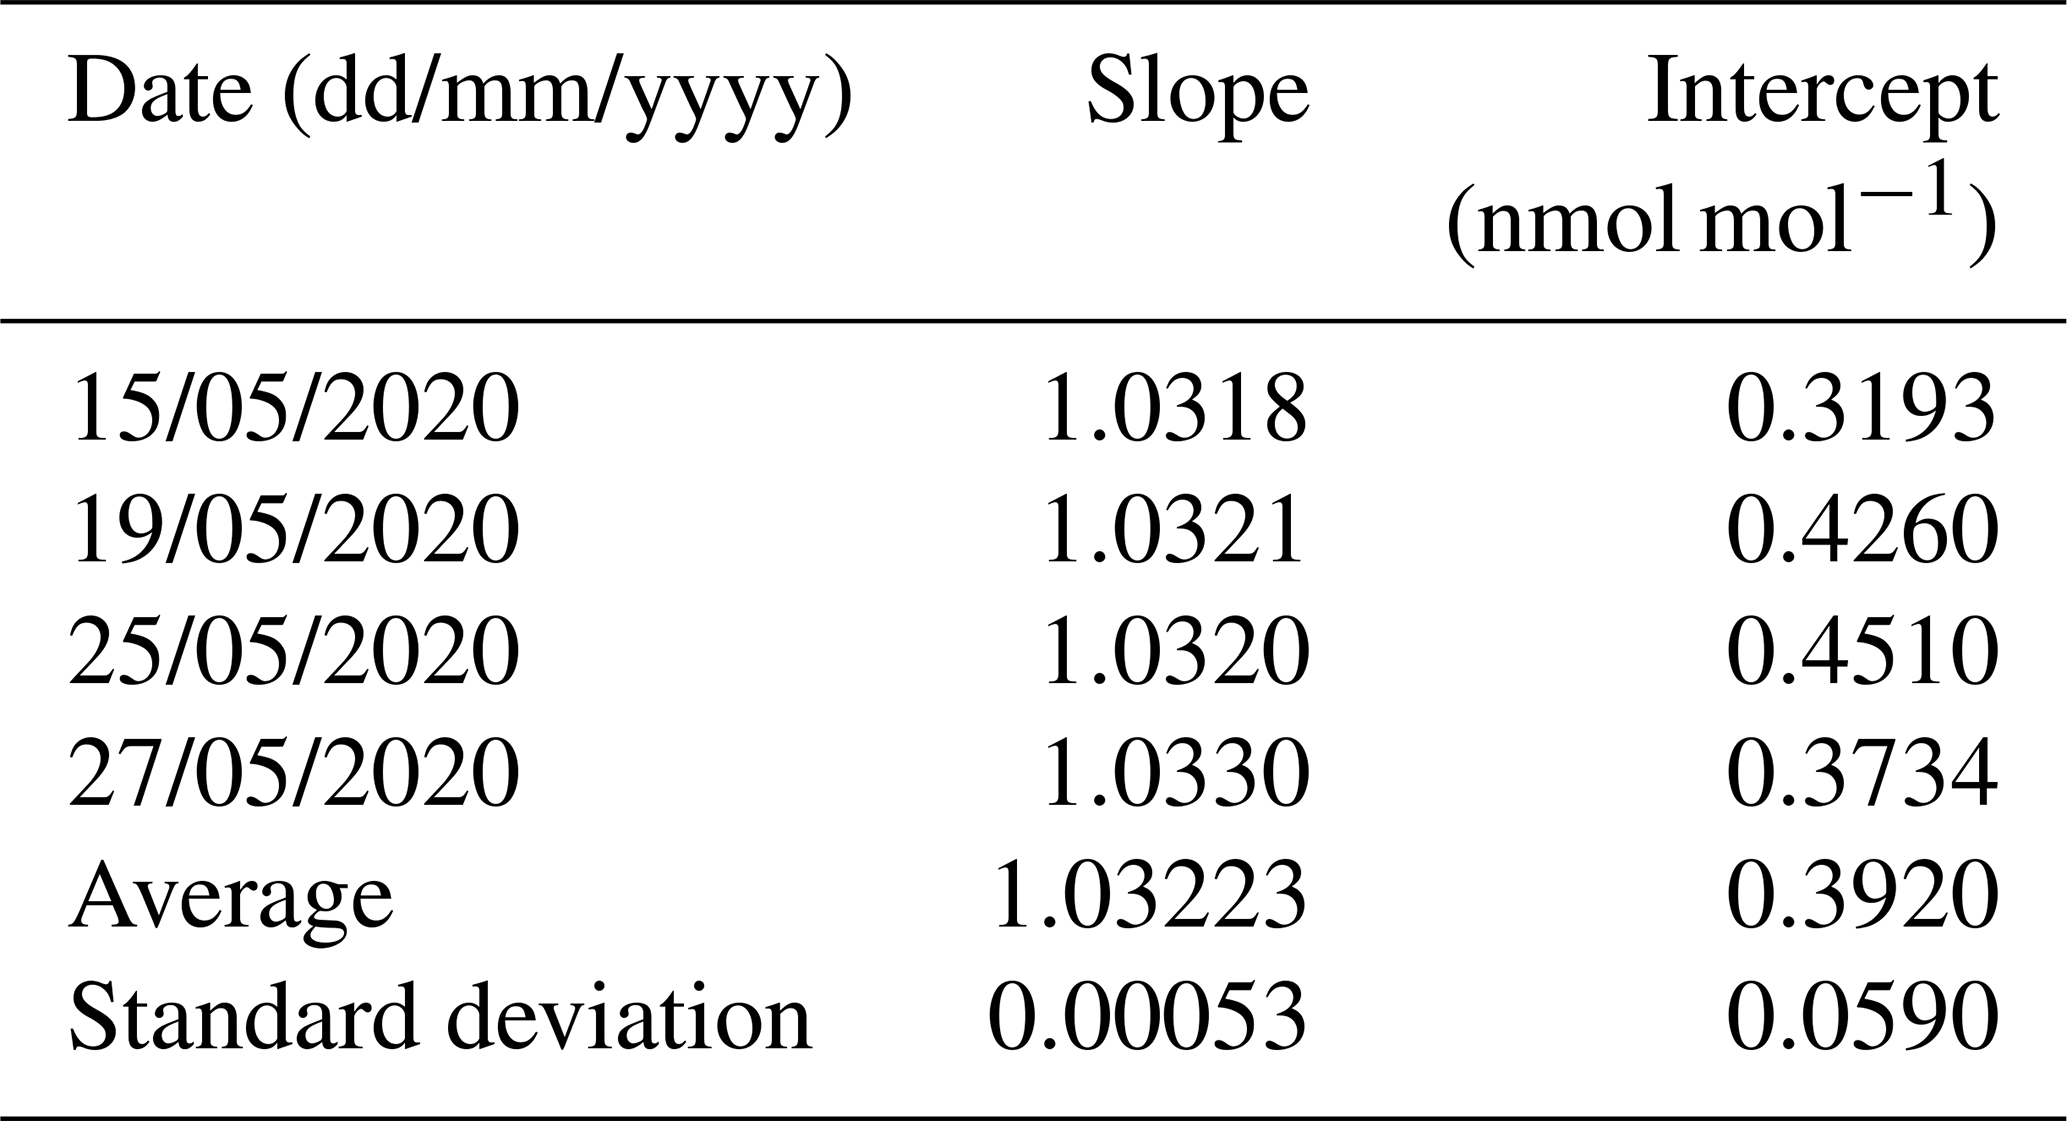
METAS' analyzer was then calibrated four times by LNE at the end of May 2020, according to the developed method. The linear regression of each calibration was calculated from RegPoly software. The uncertainties of x and y were taken into account. The average and standard deviation of the four slopes (b) were calculated in order to estimate the expanded uncertainty (U) of the determination of the slope (Eq. 14).
where k is the coverage factor (k = 2), u(b) is the uncertainty of the determination of b (RegPoly), and SD is the standard deviation of the four determinations of b (LNE).
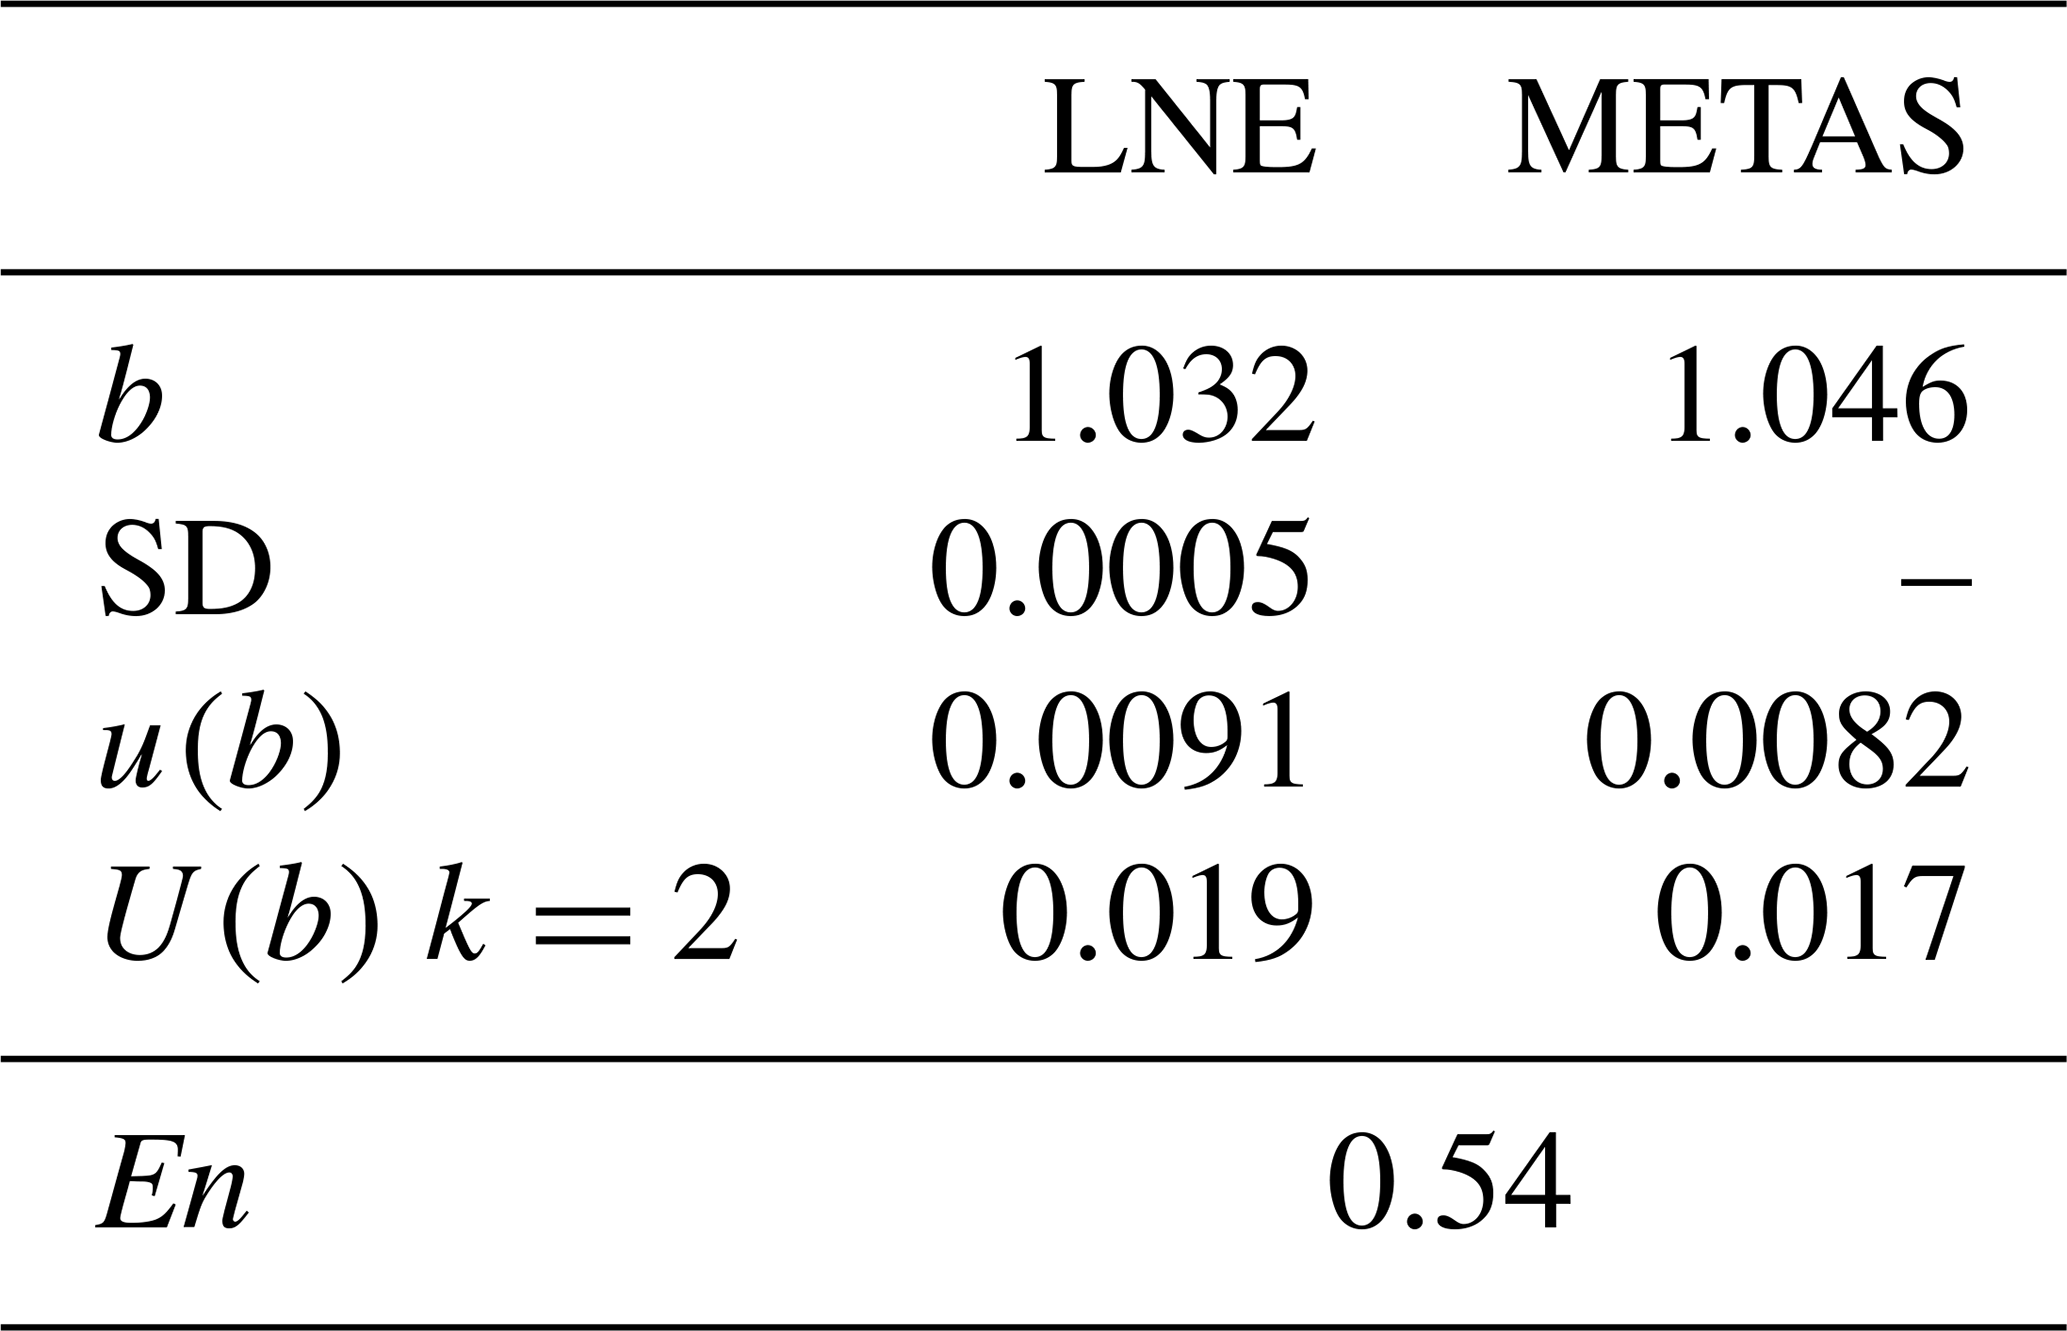
The normalized deviation (En) between the slopes of the regression lines, as determined by METAS and by LNE, was equal to 0.54 (Table 9). This value, lower than 1, demonstrated the good agreement between the NH3 reference generators developed by METAS and by LNE. This comparison validated the LNE reference generator and the analyzer's calibration method.
Table 9The result comparison between LNE and METAS. b is the slope of the calibration functions (no units). SD is the standard deviation of the calibration slopes obtained by LNE between 15–27 May 2020 (no units). u(b) is the standard uncertainty of the slope determination (no units). U(b) is the expanded uncertainty of the slope determination, and k is its coverage factor (no units). En is the normalized deviation between LNE and METAS slopes (no units).
Ambient air quality monitoring in France is entrusted to 18 air quality monitoring networks (AASQA – Associations Agréées de Surveillance de la Qualité de l'Air) which perform ammonia concentration measurements in ambient air with different types of measurement techniques, including automatic analyzers. To ensure the reliability of the NH3 measurements performed by these analyzers, LNE developed a metrological calibration procedure. The calibration procedure consists of generating dynamic RGMs at different ammonia amount-of-substance fractions (at least five levels in synthetic air) on the measurement range defined by the AASQA (between 1 and 400 nmol mol−1) and using the reference generator. These RGMs are then injected into NH3 analyzers, and for each level, the reference amount-of-substance fraction and the reading are compared. An example of NH3 analyzer calibration performed for monitoring networks is shown in Fig. 6, for the NH3 analyzer (number 2244-AHDS2115; G2103, Picarro Inc., CA, USA), over an amount-of-substance fraction ranging from 1 to 300 nmol mol−1. The standard deviations over the last 30 min were calculated and are given in Fig. 6.
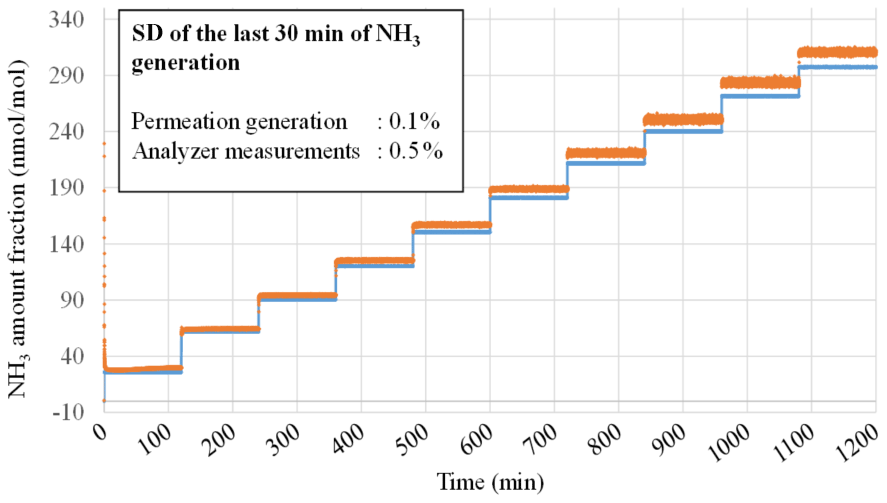
Figure 6Stability of the ammonia reference amount-of-substance fractions (blue line) and of the analyzer readings (orange color) over the range from 1 to 300 nmol mol−1. The relative standard deviation of the analyzer readings is lower than 0.5 % for all the generated amount-of-substance fraction levels.
These results demonstrate a very high stability of the ammonia reference amount-of-substance fraction calculated from the measurement of the various parameters of the reference generator (MFCs flow rates and oven temperature). It can be noted that the MFC regulation is very fast, as suggested by the immediate response time, when changing the set point. Furthermore, the results show a high stability of the flow rates over time because no drift in the calculated amount-of-substance fraction is observed, and its standard deviation is less than 0.1 % for the whole range. This highlights the good quality of the MFCs and oven temperature control. An analysis of the NH3 amount-of-substance fractions read by the analyzer shows a low standard deviation of the measurements (0.5 %).
Table 10Calibration results (slope, intercept, and correlation coefficient) determined by LNE for seven NH3 analyzers used by four French networks at monitoring stations.
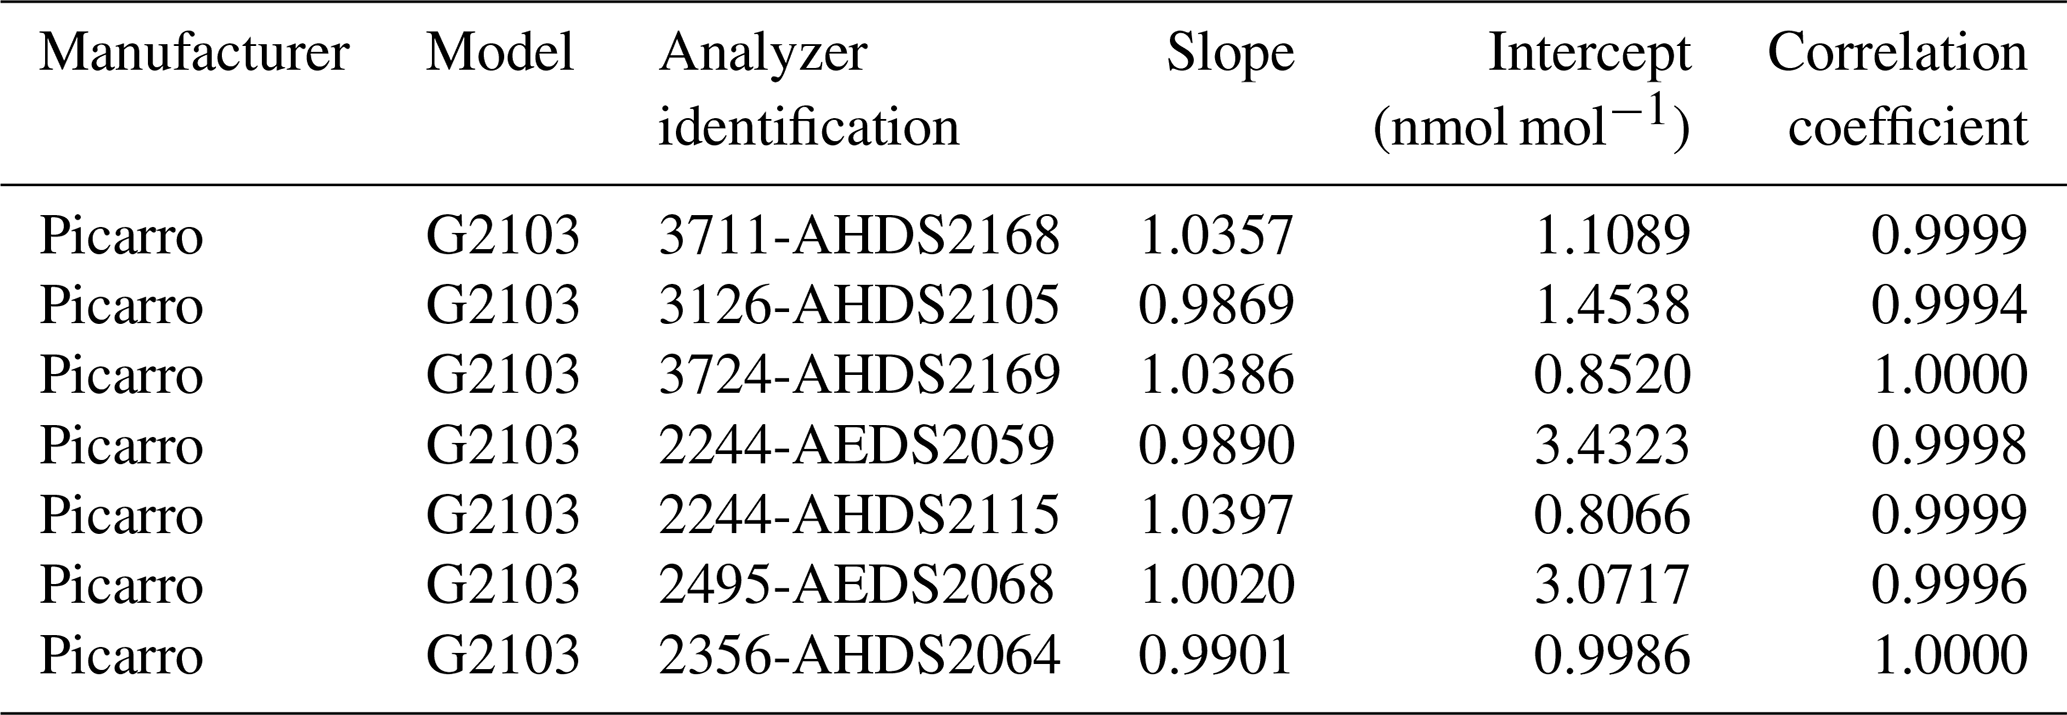
Figure 7 shows the calibration line between the averages of the reference amount-of-substance fractions and the readings of the NH3 analyzer (number 2244-AHDS2115; G2103, Picarro Inc., CA, USA). This calibration line is representative of those obtained during the calibration of all analyzers tested since the end of 2020.
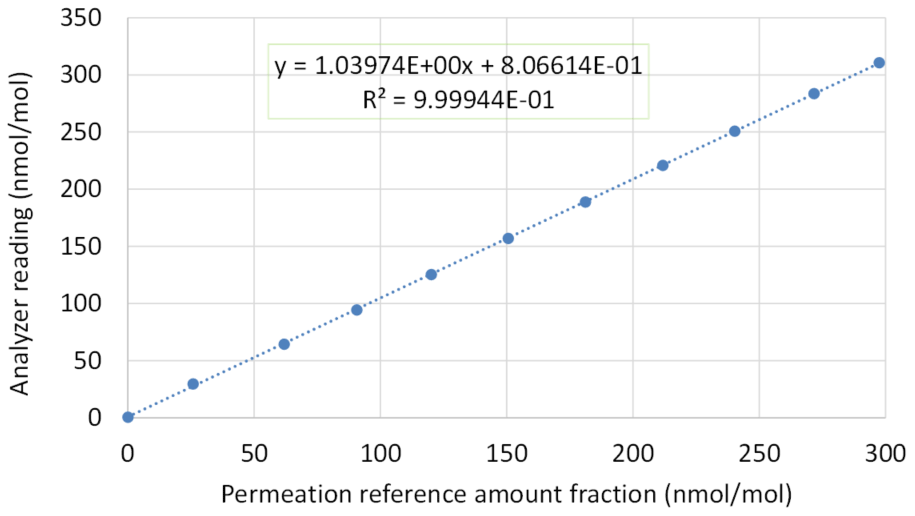
Figure 7A typical calibration line obtained for an NH3 analyzer (dotted line). Large blue dots indicate the analyzer response for each generated NH3 reference (in both cases, the average of the last 30 min of the reading and generation). The error bars corresponding to the standard deviation of the analyzer reading (y axis) and of the generated references (x axis) are hidden by the large blue dots.
By the end of 2020, LNE calibrated seven NH3 analyzers set up by four French networks at monitoring stations. The calibration results determined by LNE for each analyzer are given in Table 10.
The results summarized in Table 10 show that the calibrations can be very different from one NH3 analyzer to another of the same manufacturer and the same model up to an accuracy error of 4 %. The calibration process is therefore unavoidable to ensure the reliability of NH3 measurements performed in ambient air by the monitoring networks to ensure their spatiotemporal comparability. These calibration tests also demonstrated the good linearity of all NH3 analyzers with correlation coefficients between 0.9994 and 1.000.
This study led to the development of a reference generator for ammonia in air based on the dynamic generation method by gas permeation over a range of amount-of-substance fractions from 1 to 400 nmol mol−1, in close collaboration with the company 2M PROCESS, according to the specifications established by LNE. The reference generator integrates a real-time calculation of the ammonia-generated amount-of-substance fractions (1 to 400 nmol mol−1) and its associated expanded uncertainties and allows the calibration of NH3 analyzers in an automatic way. All parameters and measurements carried out are stored in a downloadable file so that they can be easily processed in Excel files. The characterization of this reference generator led to relative expanded uncertainties of the ammonia reference amount-of-substance fractions in the reference gas mixtures lower than 2 % (k = 2). This result is very satisfactory, considering the very low levels of the amount-of-substance fractions of interest and the potential ammonia adsorption/desorption on the contact surfaces.
The bilateral comparison organized by LNE and METAS used a Picarro G2103 gas analyzer as transfer standard, based on a robust spectroscopic method, and set up in a lot of AASQA monitoring stations. Both institutes generated reference gas mixtures dynamically by two different reference generators and used the abovementioned Picarro as comparator. The normalized deviation between the slopes of the regression lines determined by METAS and by LNE was equal to 0.5, which highlights the good agreement between the dynamic NH3 reference generators developed by METAS and by LNE. This comparison allowed the validation of LNE's reference generator and the analyzer calibration method developed.
Furthermore, the tests carried out during this study showed the importance of the internal surface treatment of calibrated analyzers in order to strongly limit ammonia adsorption.
The application of these findings, together with the use of the newly developed NH3 SI-traceable RGMs by the French air quality monitoring stations within AASQA, may promote the accuracy, comparability, and traceability of NH3 measurements carried out in France.
Research data can be made available after a review of the request.
TM and CS conceived the idea, methods, and experimental design of the study. MIG calibrated the model, calculated the uncertainty, and provided the analyzer for the validation. CS designed the reference generator, carried out the experiments, analyzed the data, and calculated the uncertainties of the measurements. TM led the writing of the paper. CS, SVR, MIG, CP, and BN contributed critically to the drafts. All authors gave their final approval for publication.
The contact author has declared that neither they nor their co-authors have any competing interests.
Publisher’s note: Copernicus Publications remains neutral with regard to jurisdictional claims in published maps and institutional affiliations.
We thank Steve Belliride, from Sensor, and Marc Monnet, director of 2M PROCESS company, for their strong involvement in this study. Owing to the company's experience and their skill in the field of measuring instruments used for gas analysis, the ammonia reference gas generator was developed with accurate metrological performances in a short time. The research leading to these results was performed within the French Central Laboratory for Monitoring Air Quality (LCSQA) program.
This research has been supported by the French Ministry of Environment (MTE; grant nos. 2201125723, 2201192949, and 2201243758).
This paper was edited by Mingjin Tang and reviewed by two anonymous referees.
Aksoyoglu, S., Jiang, J., Ciarelli, G., Baltensperger, U., and Prévôt, A. S. H.: Role of ammonia in European air quality with changing land and ship emissions between 1990 and 2030, Atmos. Chem. Phys., 20, 15665–15680, https://doi.org/10.5194/acp-20-15665-2020, 2020.
Behera, S. N., Sharma, M., Aneja, V. P., and Balasubramanian, R.: Ammonia in the atmosphere: a review on emission sources, atmospheric chemistry and deposition on terrestrial bodies, Environ. Sci. Pollut. Res., 20, 8092–8131, https://doi.org/10.1007/s11356-013-2051-9, 2013.
Bessagnet, B., Beauchamp, M., Guerreiro, C., de Leeuw, F., Tsyro, S., Colette, A., Meleux, F., Rouïl, Ruyssenaars, P., Suter, F., Velders, G. J. M., Foltescu, V. L., and van Aardenne, J.: Can further mitigation of ammonia emissions reduce exceedances of particulate matter air quality standards?, Environ. Sci. Pol., 44, 149–163, 2014.
Braban, C. F., de Bree, F., Crunaire, S., Fröhlich, M., Fromage-Mariette, A., Goelen, E., Hafkenscheid, T., Hangartner, M., van Hoek, C., Martin, N. A., Michen, B., Noordijk, E., Stoll, J. M., Twigg, M. M., Tang, Y. S., Cowan, N., and Poskitt, J.: Literature review on the performance of diffusive samplers for the measurement of ammonia in ambient air and emissions to air, Centre for Ecology & Hydrology, https://core.ac.uk/download/196583303.pdf (last access: 2 January 2022), 2018.
Cape, J. N., van der Eerden, L., Fangmeier, A., Ayres, J., Bareham, S., Bobbink, R., Branquinho, C., Crittenden, P., Cruz, C., Dias, T., Leith, I., Martins-Loucao, M. A., Ptcairn,C., Sheepard, L., Spranger, T., Sutton, M., van Dijk, N., and Wolseley, P.: Critical Levels for Ammonia, in Atmospheric Ammonia – Detecting Emission Changes and Environmental Impacts, edited by: Sutton, M. A., Reis, S., and Baker, S. M. H., 375–382, https://doi.org/10.1007/978-1-4020-9121-6_22, 2009.
Cao, J.-J., Zhang, T., Chow, J. C., Watson, J. G., Wu, F., and Li, H.: Characterization of Atmospheric Ammonia over Xi'an, China, Aerosol Air Qual. Res., 9, 277–289, https://doi.org/10.4209/aaqr.2008.10.0043, 2009.
Clappier, A., Thunis, P., Beekmann, M., Putaud, J. P., and de Meij, A.: Impact of SOx, NOx and NH3 emission reductions on PM2.5 concentrations across Europe: Hints for future measure development, Environ. Int., 156, 106699, https://doi.org/10.1016/j.envint.2021.106699, 2021.
Clarisse, L., Clerbaux, C., Dentener, F., Hurtmans, D., and Coheur, P.-F.: Global ammonia distribution derived from infrared satellite observations, Nat. Geosci., 2, 479–483, https://doi.org/10.1038/ngeo551, 2009.
EEA: European Union emission inventory report 1990–2018 under the UNECE Convention on Long-range Transboundary Air Pollution (LRTAP), European Environment Agency, https://doi.org/10.2800/233574, 2020.
EMRP MetNH3 project: Metrology for Ammonia in Ambient Air, http://www.metnh3.eu (last access: 12 December 2021), 2014–2017.
EN: EN 14211 – Ambient air – Standard method for the measurement of the concentration of nitrogen dioxide and nitrogen monoxide by chemiluminescence, CEN (European Committee of Standardization), 2012.
EN: EN 17346 – Ambient air – Standard method for the determination of the concentration of ammonia using diffusive samplers, CEN (European Committee of Standardization), 2020.
European Commission: Directive 2008/50/EC of the European Parliament and of the Council of 21 May 2008 on ambient air quality and cleaner air for Europe, European Commission, http://eur-lex.europa.eu/legal-content/EN/TXT/PDF/?uri=CELEX:32008L0050&from=en (last access: 26 September 2021), 2008.
European Commission: Directive 2016/2284 of the European Parliament and of the Council of 14 December 2016 on the reduction of national emissions of certain atmospheric pollutants, European Commission, http://eur-lex.europa.eu/legal-content/EN/TXT/PDF/?uri=CELEX:32016L2284&from=EN (last access: 26 September 2021), 2016.
Feng, S., Xu, W., Cheng, M., Ma, Y., Wu, L., Kang, J., Wang, K., Tan, A., Collett, J. L., Fang, Y., Goulding, K., Liu, X., and Zhang, F.: Overlooked nonagricultural and wintertime agricultural NH3 emissions in Quzhou county, North China Plain: Evidence from 15N-Stable Isotopes, Environ. Sci. Technol. Lett., 9, 127–133, https://doi.org/10.1021/acs.estlett.1c00935, 2022.
Gläser, M. and Borys, M.: Precision mass measurements, Rep. Prog. Phys. 72, 126101, https://doi.org/10.1088/0034-4885/72/12/126101, 2009.
Gu, M., Pan, Y., Walters, W. W., Sun, Q., Song, L., Wang, Y., Xue, Y., and Fang, Y.: Vehicular Emissions Enhanced Ammonia Concentrations in Winter Mornings: Insights from Diurnal Nitrogen Isotopic Signatures, Environ. Sci. Technol., 56, 1578–1585, https://doi.org/10.1021/acs.est.1c05884, 2022.
Holmes, N.: A review of particle formation events and growth in the atmosphere in the various environments and discussion of mechanistic implications, Atmos. Environ., 41, 2183–2201, https://doi.org/10.1016/j.atmosenv.2006.10.058, 2007.
ISO: EN ISO 6145-10 – Gas analysis – Preparation of calibration gas mixtures using dynamic volumetric methods – Part 10: Permeation method, ISO (International Committee of Standardization), 2002.
ISO: EN ISO 6142-1 – Gas analysis – Preparation of calibration gas mixtures – Part 1: Gravimetric method for Class I mixtures, ISO (International Committee of Standardization), 2015.
IUPAC: Atomic weights of the elements 2011 (IUPAC Technical Report), Pure Appl. Chem., 85, 1047–1078, 2013.
JCGM: JCGM 100:2008(F): Evaluation of measurement data – Guide to the expression of uncertainty in measurement, JCGM, https://www.bipm.org/documents/20126/2071204/JCGM_100_2008_E.pdf/cb0ef43f-baa5-11cf-3f85-4dcd86f77bd6 (last access: 16 December 2021), 2008.
Lucero, D. P.: Performance characteristics of permeation tubes, Anal. Chem., 43, 1744–1749, https://doi.org/10.1021/ac60307a005, 1971.
Martin, N. A., Ferracci, V., Cassidy, N., and Hoffnagle, J. A.: The application of a cavity ring-down spectrometer to measurements of ambient ammonia using traceable primary standard gas mixtures, Appl. Phys. B-Lasers O., 122, p. 219, https://doi.org/10.1007/s00340-016-6486-9, 2016.
METAS: ENV55 Final Publishable JRP Report, METAS, https://www.euramet.org/research-innovation/search-research-projects/details/project/metrology-for-ammonia-in-ambient-air/ (last access: 21 September 2021), 2017.
Mohr, P. J., Newell, D. B., and Taylor, B. N.: CODATA Recommended Values of the Fundamental Physical Constants: 2014, J. Phys. Chem. Ref. Data, 45, 043102, https://doi.org/10.1063/1.4954402, 2016.
Nair, A. A. and Yu, F.: Quantification of atmospheric ammonia concentrations: a review of its measurement and modelling, Atmosphere, 11, 1092, https://doi.org/10.3390/atmos11101092, 2020.
Paulot, F., Jacob, D. J., Pinder, R. W., Bash, J. O., Travis, K., and Henze, D. K.: Ammonia emissions in the United States, European Union, and China derived by high-resolution inversion of ammonium wet deposition data: Interpretation with a new agricultural emissions inventory (MASAGE_NH3), J. Geophys. Res.-Atmos., 119, 4343–4364, https://doi.org/10.1002/2013JD021130, 2014.
Pinder, R. W., Gilliland, A. B., and Dennis, R. L.: Environmental impact of atmospheric NH3 emissions under present and future conditions in the eastern United States, Geophys. Res. Lett., 35, L12808,https://doi.org/10.1029/2008GL033732, 2008.
Pogány, A., Balslev-Harder, D., Braban, C. F., Cassidy, N., Ebert, V., Ferracci, V., Hieta, T., Leuenberger, D., Martin, N. A., Pascale, C., Peltola, J., Persijn, S., Tiebe, C., Twigg, M. M., Vaittinen, O., van Wijk, J., Wirtz, K., and Niederhauser, B.: A metrological approach to improve accuracy and reliability of ammonia measurements in ambient air, Meas. Sci. Technol., 27, 115012, https://doi.org/10.1088/0957-0233/27/11/115012, 2016.
Puchalski, M. A., Sather, M. E., Walker, J. T., Lehman, C. M. B., Gay, D. A., Mathew, J., and Robarge, W. P.: Passive ammonia monitoring in the Unites States: comparing three different sampling devices, J. Environ. Monit., 13, 3156, https://doi.org/10.1039/c1em10553a, 2011.
Schöpp, W., Posch, M., Mylona, S., and Johansson, M.: Long-term development of acid deposition (1880–2030) in sensitive freshwater regions in Europe, Hydrol. Earth Syst. Sci., 7, 436–446, https://doi.org/10.5194/hess-7-436-2003, 2003.
Shah, S. B., Westerman, P. W., and Arogo, J.: Measuring ammonia concentrations and emissions from agricultural land and liquid surfaces: a review, J. Air Waste Manage. Assoc., 56, 945–960, https://doi.org/10.1080/10473289.2006.10464512, 2012.
Tang, Y., Cape, J. N., and Sutton, M. A.: Development and types of passive samplers for monitoring atmospheric NO2 and NH3 concentrations, Sci. World J., 1, 513–529, 2001.
UNECE: Decision 2012/12 guidance for adjustments under the Gothenburg protocol to emission reduction commitments or to inventories for the purposes of comparing total national emissions with them, UNECE, http://www.unece.org/env/lrtap/executivebody/eb_decision.html (last access: 14 February 2021), 2012.
United Nations: Protocol to the 1979 Convention on Long-range Transboundary Air Pollution to Abate Acidification, Eutrophication and Ground-Level Ozone, United Nations, https://treaties.un.org/Pages/ViewDetails.aspx?src=TREATY&mtdsg_no=XXVII-1-h&chapter=27&clang=_en, (last access: 14 February 2021), 1979.
Vaittinen, O., Metsälä, M., Halonen, L., Persijn, S., Leuenberger, D., and Niederhauser, B.: Effect of moisture on the adsorption of ammonia, Appl. Phys. B, 124, 189, https://doi.org/10.1007/s00340-018-7054-2, 2018.
Van Damme, M., Clarisse, L., Franco, B., Sutton, M. A., Erisman, J. W., Kruit, R. W., van Zanten, M., Whitburn, S., Hadji-Lazaro, J., Hurtmans, D., Clerbaux, C., and Coheur, P.-F.: Global, regional and national trends of atmospheric ammonia derived from a decadal (2008–2018) satellite record, Environ. Res. Lett., 16, 055017, https://doi.org/10.1088/1748-9326/abd5e0, 2021.
von Bobrutzki, K., Braban, C. F., Famulari, D., Jones, S. K., Blackall, T., Smith, T. E. L., Blom, M., Coe, H., Gallagher, M., Ghalaieny, M., McGillen, M. R., Percival, C. J., Whitehead, J. D., Ellis, R., Murphy, J., Mohacsi, A., Pogany, A., Junninen, H., Rantanen, S., Sutton, M. A., and Nemitz, E.: Field inter-comparison of eleven atmospheric ammonia measurement techniques, Atmos. Meas. Tech., 3, 91–112, https://doi.org/10.5194/amt-3-91-2010, 2010.
Warner, J. X., Dickerson, R. R., Wei, Z., Strow, L. L., Wang, Y., and Liang, Q.: Increased atmospheric ammonia over the world's major agricultural areas detected from space, Geophys. Res. Lett., 44, 2875–2884, https://doi.org/10.1002/2016GL072305, 2017.
WHO: Key facts on Ambient (outdoor) air pollution, https://www.who.int/news-room/fact-sheets/detail/ambient-(outdoor)-air-quality-and-health (last access: 14 February 2021), 2018.
Wu, C., Wang, G., Li, J., Li, J., Cao, C., Ge, S., Xie, Y., Chen, J., Liu, S., Du, W., Zhao, Z., and Cao, F.: Non-agricultural sources dominate the atmospheric NH3 in Xi'an, a megacity in the semi-arid region of China, Sci. Total Environ., 722, 137756, https://doi.org/10.1016/j.scitotenv.2020.137756, 2020.
Yardin, C.: REGPOLY, Un logiciel pour estimer la fonction d'étalonnage et calculer un résultat de mesure à partir d'une indication, 16ème Congrès international de métrologie, 7–10 October 2013, Paris, France, https://www.lne.fr/fr/logiciels/lne-regpoly (last access: 22 September 2021), 2013.
- Abstract
- Introduction
- Technical choices for the development of the NH3 reference generator
- Development of the NH3 reference generator
- Calculation of the permeation rate of the ammonia tube and the associated uncertainty
- Calculation of the NH3 amount-of-substance fraction in the generated RGMs and the associated uncertainty
- Characterization of the calibration method of NH3 analyzers
- Validation of the calibration method by a bilateral comparison with METAS
- Implementation of the metrological procedure for the calibration of an NH3 analyzer
- Conclusion
- Data availability
- Author contributions
- Competing interests
- Disclaimer
- Acknowledgements
- Financial support
- Review statement
- References