the Creative Commons Attribution 4.0 License.
the Creative Commons Attribution 4.0 License.
 | 06 May 2022
High-resolution typhoon precipitation integrations using satellite infrared observations and multisource data
You Zhao
Chao Liu
Di Di
Ziqiang Ma
Shihao Tang
Typhoon-related precipitation over land can result in severe disasters such as floods and landslides, and satellites are a valuable tool for estimating surface precipitation with high spatial-temporal resolutions. Accordingly, this study develops a surface precipitation integration framework to combine high-resolution observations from the radiometers of two geostationary satellites, Fengyun-4A (F4) and Himawari-8 (H8), with high-density rain-gauge observations or IMERG data and atmospheric reanalysis data based on a random forest (RF) algorithm. The RF algorithm integrates cloud and atmospheric features from radiometric observations and reanalysis information, and the intensity and spatial distribution of precipitation can be revealed by high-density rain-gauge or IMERG data. We take three typhoons that made landfall in South China during 2018 as examples. The F4-based and H8-based results using rain-gauge data as the predictand both show excellent results, yielding correlation coefficients (R) of ∼ 0.75 and probabilities of detection (POD) of ∼ 0.95. In contrast, when IMERG data are used as the predictand, the corresponding R and POD drop to ∼ 0.5 and 0.93, respectively, due to the uncertainties related to IMERG retrievals. By carefully choosing the predictor, our RF algorithm successfully integrates the information from satellite observations, surface measurements and atmospheric reanalyses, resulting in precipitation estimates that are highly consistent with actual ground observations. Consequently, our proposed integration framework can reconstruct hourly surface precipitation estimates at high spatial-temporal resolutions for historical typhoon studies.
- Article
(8837 KB) - Full-text XML
- BibTeX
- EndNote


Typhoons, also referred to as tropical cyclones, are high-impact atmospheric phenomena that cause some of the most significant socioeconomic damage due to their intense winds, immense storm surges and flood-inducing rainfall (Negri et al., 2005; Rappaport, 2014; Wang et al., 2019). Over 80 typhoons occur every year globally, and approximately one-third of these originate in the Northwest Pacific (NWPAC) (Chan, 2005). With global warming, the intensity of typhoons making landfall tends to increase, which leads to increasingly severe damage in coastal areas of NWPAC (Webster et al., 2005; Emanuel, 2013; Kang and Elsner, 2016; Ho et al., 2004). Unfortunately, because of its high spatial-temporal variability and complex physical processes, precipitation still accounts for one of the largest uncertainties in the forecasting of tropical cyclones (Su et al., 2012; Tu and Chou, 2013), and its high-quality observations of precipitation are also limited. Nevertheless, precipitation observations with a high spatial-temporal resolution during typhoon periods play an important role in research on not only the precipitation characteristics of tropical cyclones but also the prevention and mitigation of typhoon disasters.
Ground rain-gauges, weather radars and satellites are commonly used to acquire precipitation measurements (Villarini et al., 2008), and they all exhibit their unique advantages and disadvantages. Ground-based rain-gauges are direct and accurate for measuring local surface precipitation but are limited by station locations and coverages, especially in oceanic, mountainous and polar regions (Gires et al., 2012; Ochoa‐Rodriguez et al., 2019; Looper and Vieux, 2012). In contrast, microwave radars can survey larger areas and can better capture the spatial variability of rainfall fields; however, the accuracy of radar-based measurements is strongly influenced by electromagnetic attenuation and the uncertainty in the relationship between the radar reflectivity factor and precipitation, particularly under extreme rainfall conditions (Marra and Morin, 2015; Bárdossy and Pegram, 2017).
Satellite-based quantitative precipitation estimation (QPE) can be implemented on a large scale with a high spatial-temporal resolution, offering large scale capability with high spatial-temporal resolutions (Tang et al., 2016; Wang et al., 2018; Jozaghi et al., 2019), but quantitatively inferring the amount of surface precipitation from space is still a serious challenge, especially during typhoon periods. Nevertheless, with the continuous improvement of meteorological satellites, satellite-based QPE technologies have undergone considerable development (Boushaki et al., 2009; Kühnlein et al., 2014; Nguyen et al., 2018; Ehsan Bhuiyan et al., 2019). Accordingly, various models have been developed to generate satellite-based QPE products by relying on the relationships between passive infrared and/or microwave observations and precipitation; typical products include the Tropical Rainfall Measuring Mission Multi-Satellite Precipitation Analysis (TRMM TMA) (Huffman et al., 2007; Liu, 2016), Integrated Multisatellite Retrievals for the Global Precipitation Measurement (GPM) Mission (IMERG) (Gebregiorgis et al., 2018; Wang et al., 2017), Climate Prediction Center morphing technique (CMORPH) (Joyce et al., 2004) and Global Satellite Mapping of Precipitation (GsMaP) (Aonashi et al., 2009; Ushio et al., 2009).
In addition, machine learning (ML) methods have been widely used to establish the relationship between precipitation and satellite passive spectral observations as well (Albawi et al., 2017; Sehad et al., 2017; Min et al., 2018; Ahmed et al., 2020; Li et al., 2021; Wang et al., 2021; Zhang et al., 2021; Chen et al., 2022). For instance, Min et al. (2018) used a random forest (RF) algorithm to establish the relationship between spectral imager observations and numerical weather prediction results, and quite reasonable rainfall area and intensity can be obtained (Min et al., 2018). Wang et al. (2021) used a convolutional neural network (CNN) to establish a high-quality precipitation dataset based on the Chinese FengYun geostationary satellite (Wang et al., 2021). However, most of these studies were intended to develop a general model for all kinds of precipitation across the globe or over large regions, and the variable responses of precipitation to different cloud properties and atmospheric conditions may limit their accuracy.
Furthermore, typhoons result in not only heavy and widespread precipitation but also thick clouds that significantly influence or even block satellite observations of surface processes. Thus, considering the complex and uncertain relationship between precipitation and clouds, the QPE product particularly designed for typhoon precipitation remains limited, leaving a gap in the availability of accurate and high-resolution estimates of surface precipitation. Meanwhile, FengYun-4A (F4) and Himawari-8 (H8) are new-generation geosynchronous equatorial orbit (GEO) satellites launched by the Chinese and Japanese meteorological agencies, respectively (Min et al., 2017; Bessho et al., 2016). These two satellites cover a similar observational region of the NWPAC and a large portion of East Asia, and their high temporal and spatial resolutions are favorable for the continuously monitoring of NWPAC typhoons (Ma et al., 2021; Honda et al., 2018). Thus, in this study, we employ a ML technique to integrate F4/H8 radiometer observations with multisource datasets to develop better surface precipitation integration algorithms, particularly for typhoon precipitation. More importantly, we investigate multisource (ground-based, satellite and reanalysis) data for the improvement of surface precipitation integration performance.
2.1 Data
In this work, to better estimate surface precipitation during the typhoon period, we aimed to take advantage of multisource data for different atmospheric variables while also including only popular and publicly available data for the generality of the method. Thus, in addition to the F4/H8 radiometer measurements, we would consider ground-based observations, atmospheric reanalysis and existing satellite-based surface precipitation estimations.
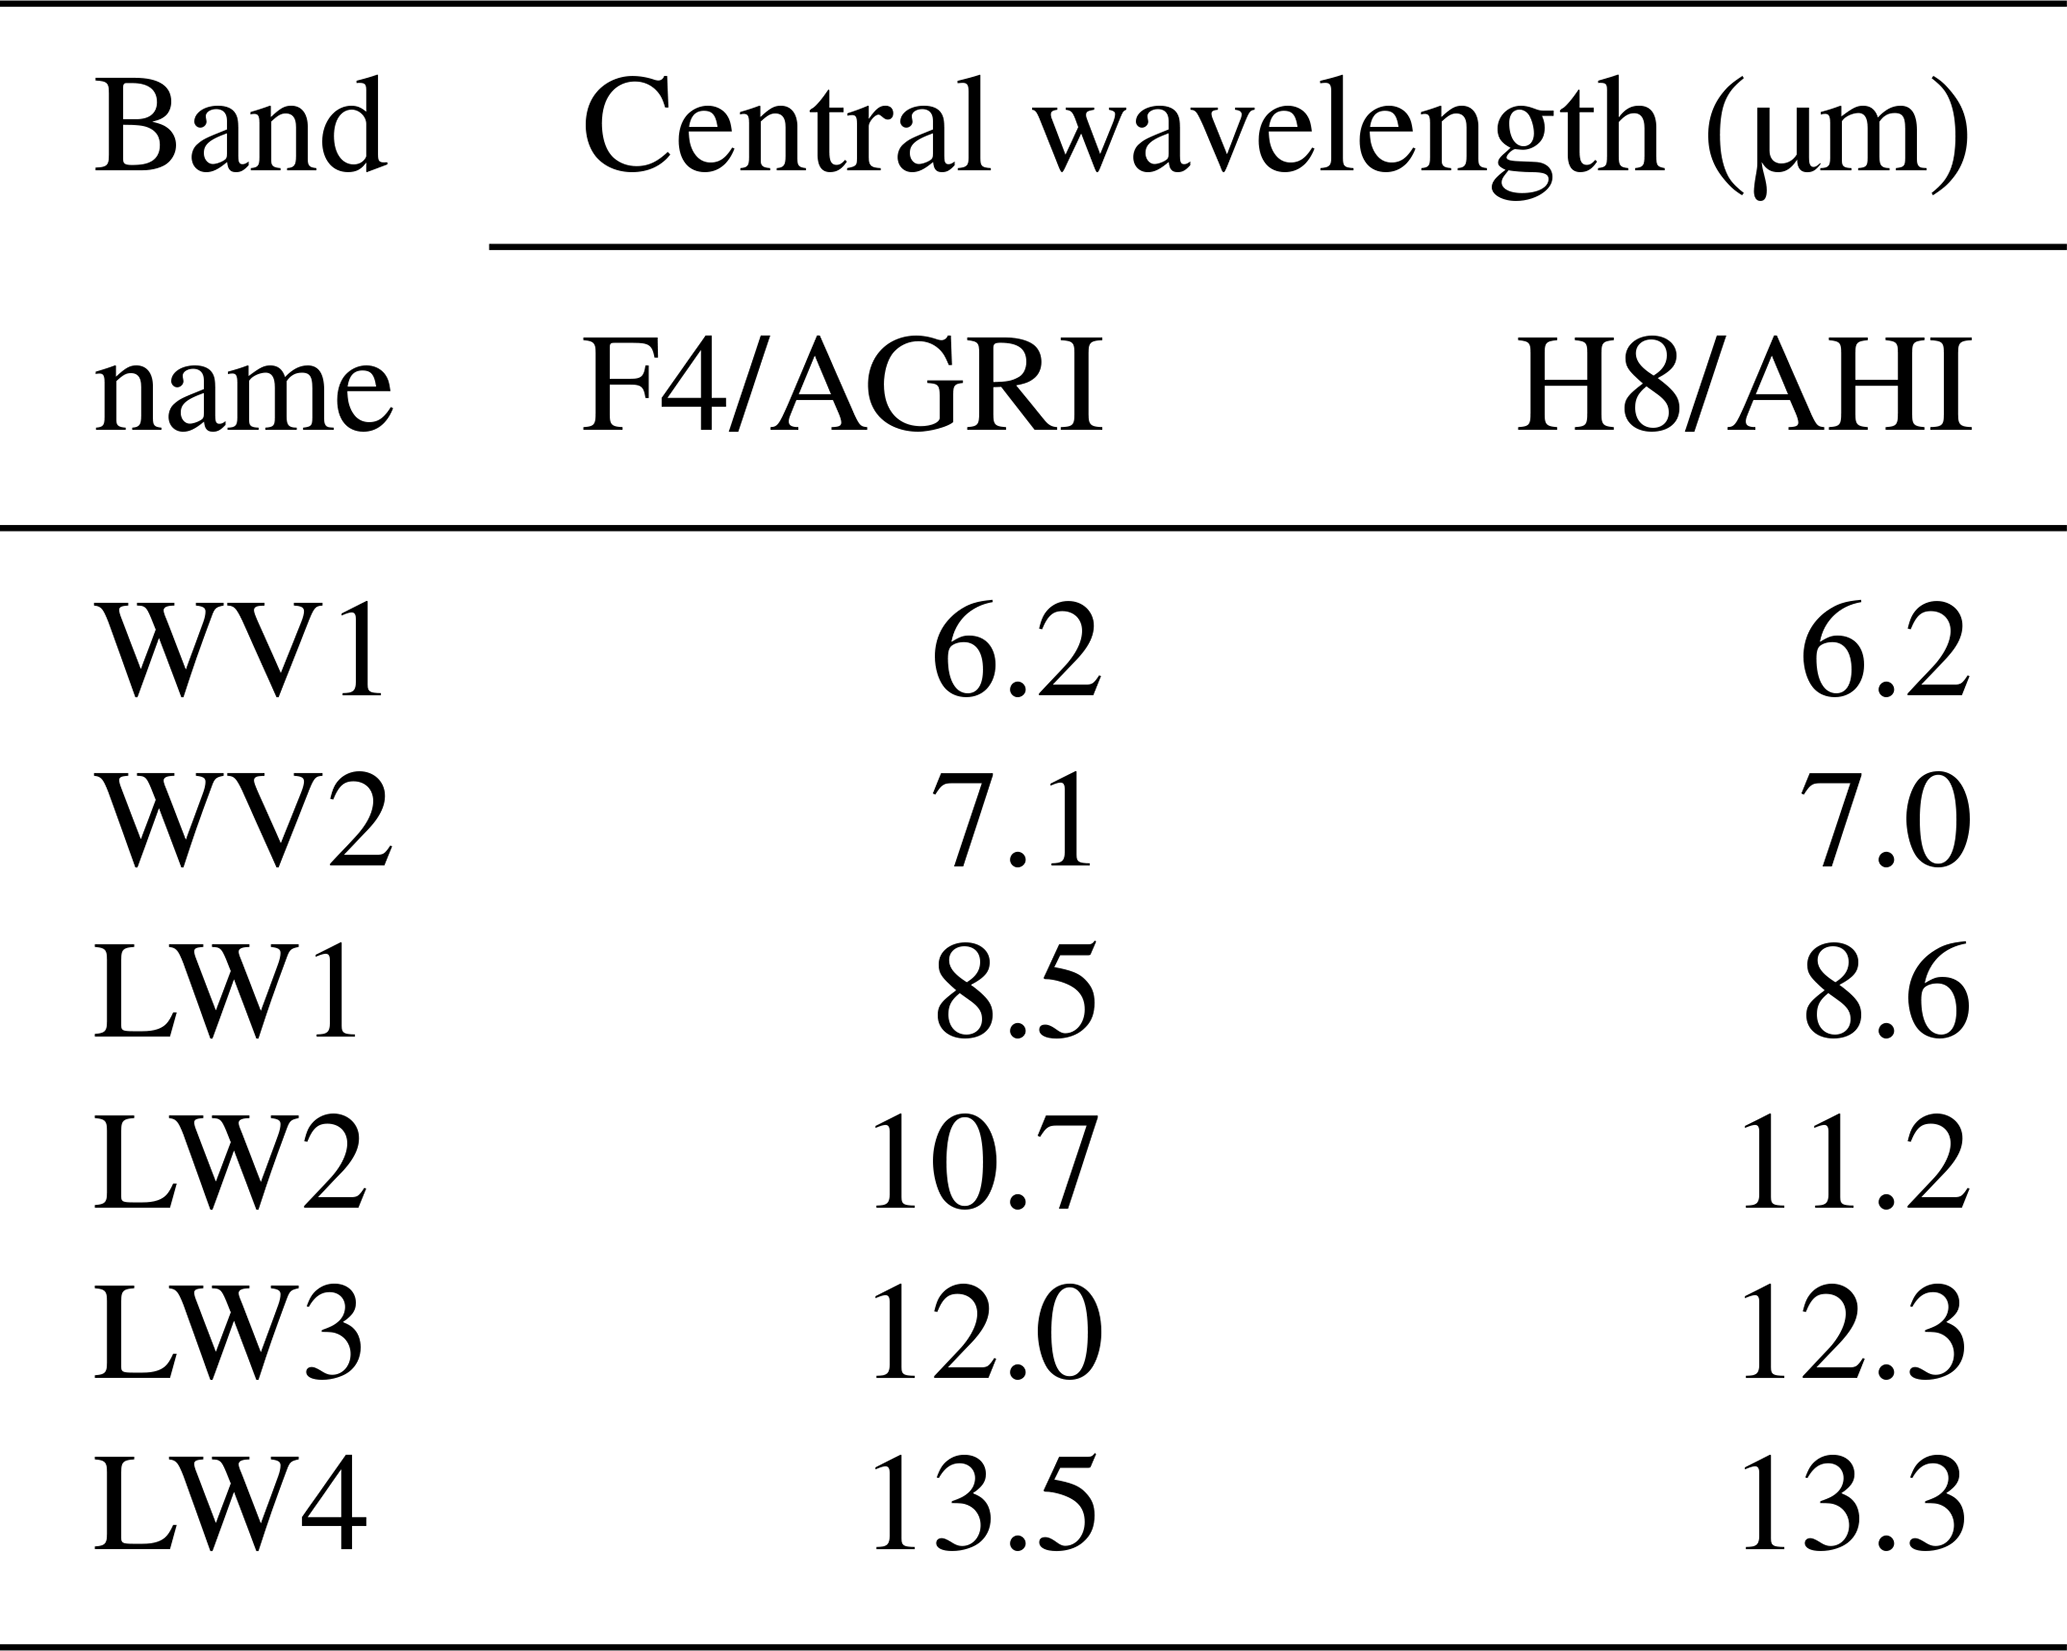
F4 and H8 can observe most of the NWPAC and East Asia; within this region, South China is frequently affected by the landfall of typhoons, resulting in serious disasters and casualties. The spectral radiometer onboard F4, namely, the Advanced Geosynchronous Radiation Imager (AGRI), has six visible and near-infrared channels and eight thermal infrared channels. The Advanced Himawari Imager (AHI) onboard H8 has a similar channel design but is equipped with two additional thermal infrared channels. To develop an integration algorithm capable of utilizing both daytime and nighttime measurements, we consider only the AGRI and AHI infrared channel radiances and their combinations. Specifically, to facilitate a fair comparison between the F4/AGRI- and H8/AHI-based algorithms, only the channels that are similarly equipped on both instruments are used, including the two water vapor channels (WV1 and WV2) and four longwave infrared channels (LW1–LW4). The central wavelengths of each channel considered in our integration algorithm are shown in Table 1, and it becomes interesting whether such small differences on the channel characteristics as well as those on channel spectral response functions and geolocation would influence the surface precipitation estimation.
Table 1Channel information for F4/AGRI and H8/AHI considered in our integration algorithms.
Passive spectral observations can provide the spatial distributions of clouds and cloud top properties, whereas surface precipitation is highly related to the atmospheric conditions. Thus, our algorithm also adopts atmospheric variables such as the column water vapor content, cloud water content, atmospheric profiles and so on. These variables are obtained from the latest atmospheric reanalysis product developed by the European Center for Medium-Range Weather Forecasts (ECMWF), i.e., the state-of-the-art Fifth-Generation ECMWF Reanalysis (ERA5) (Hersbach et al., 2020). To infer the general atmospheric conditions within the integration region, we consider nine variables from ERA5 related to typhoon precipitation (Min et al., 2018). For example, the convective available potential energy (CAPE) is an indicator of the instability (or stability) of the atmosphere and can be used to assess the potential for the development of convection, which can lead to heavy rainfall, thunderstorms and other severe weather. The K-index, calculated from the temperature and dew point temperature in the lower part of the atmosphere, is a measure of the potential for a thunderstorm to develop. The total column rain water (TCRW) is the total amount of water in droplets of raindrop size (which can fall to the surface as precipitation) in a column extending from the surface to the top of the atmosphere. Total precipitation (TP) is the accumulated liquid and frozen water (comprising both rain and snow) that falls to the earth's surface. The total column liquid water (TCLW) is the total amount of supercooled water in a column extending from the surface of the earth to the top of the atmosphere. Furthermore, four basic atmospheric variables are considered, namely, the relative humidity at 850 hPa (R850) and 950 hPa (R950) and the temperature at 850 hPa (T850) and 950 hPa (T950), which describe the humidity and temperature states in the lower atmosphere.
2.2 Study area
Accurate precipitation observations are needed as the references to train ML-based models, and are thus essential for high-quality integration. Two kinds of data are considered: high-density ground rain-gauge data and IMERG estimates. Offering some of the most reliable and fundamental precipitation observations, rain-gauge data are obtained from the National Meteorological Information Center of the China Meteorological Administration (CMA). Due to the high frequency of rainfall and the dense distribution of urban areas in South China, a large number of automatic rain-gauge stations are distributed throughout this region, reaching a total of 5024 stations within the area of the study region (79 × 104 km2); the distribution of these stations is shown in Fig. 1. However, such a high density of ground-based observations may not always be feasible, so another type of data that is more commonly used in ML-based precipitation estimation is also considered, i.e., the IMERG final run-calibrated precipitation data. IMERG provides gridded precipitation estimation from both passive microwave sensors on various satellites in the GPM constellation and infrared-based observations from GEO satellites (Liu, 2016; Tang et al., 2016) and is, therefore, one of the most reliable precipitation datasets available. IMERG has a half-hourly temporal interval with a maximum rain rate of 50 mm h−1 and covers the earth's surface between the latitudes of 60∘ S and 60∘ N (Min et al., 2018).
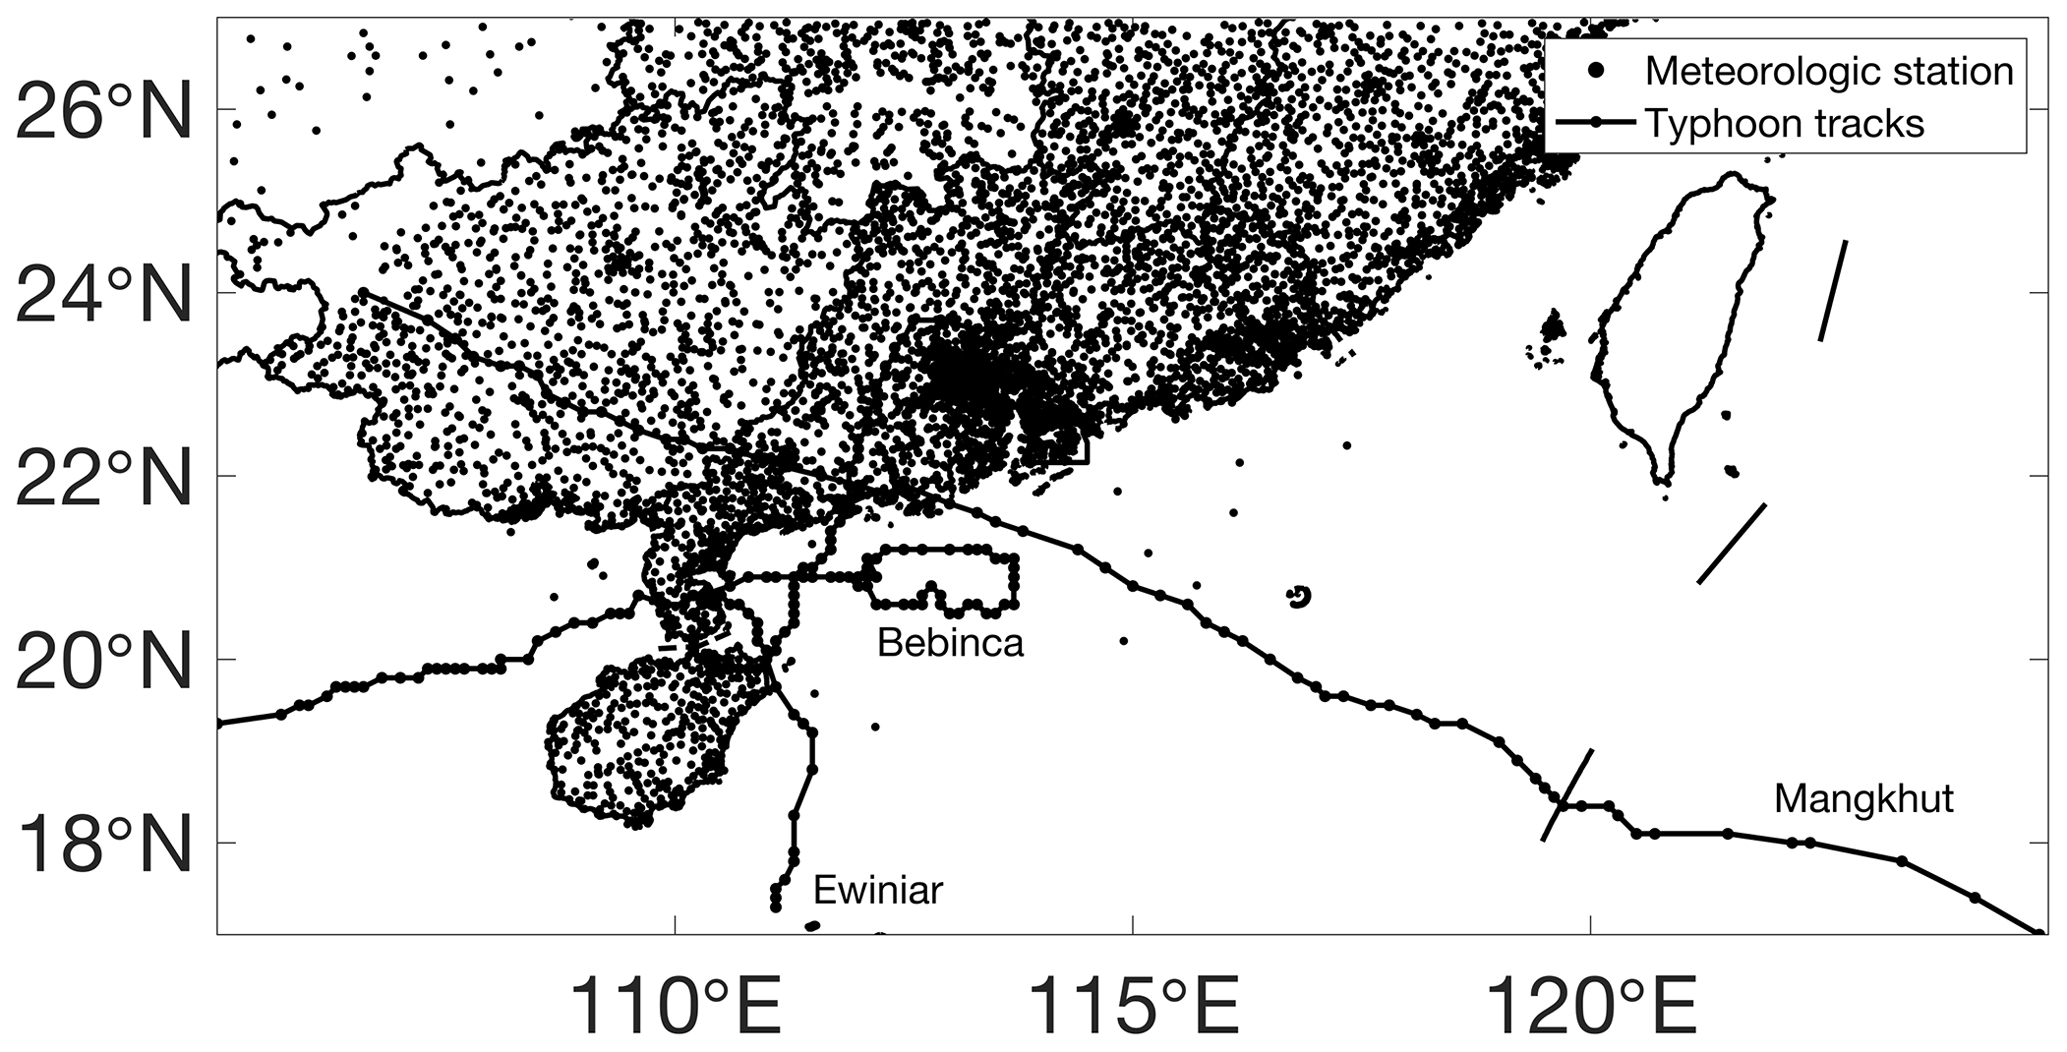
Figure 1Distribution of high-density ground rain-gauge stations over the study area.
Table 2Information on the three examples of typhoon events that made landfall in South China in 2018.
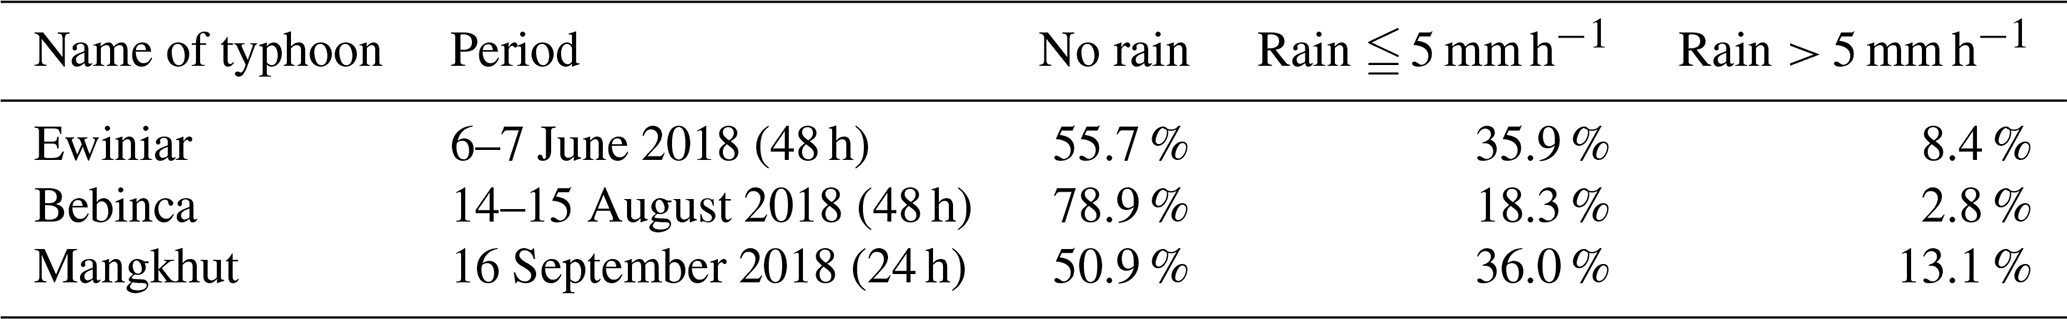
This study investigates three typhoon events that made landfall in South China in 2018. Information on these three typhoon events is provided in Table 2, and the paths of the three typhoons are illustrated in Fig. 1. We consider the area within the latitudes 15–27∘ N and the longitudes 105–125∘ E, including a large part of South China (15–27∘ N; 105–122.5∘ E) and the NWPAC, which are completely covered by the observation areas of F4 and H8. We consider the whole evolution of each of the three typhoons from landfall to dissipation, and the model performance over a total of ∼ 120 h is considered using approximately 600 000 hourly precipitation observations from the ground rain-gauge stations.
3.1 Establishment of a surface precipitation integration algorithm
The RF algorithm is an ML method widely used in the inversion of meteorological elements and has been proven to perform well in applications such as the estimation of precipitation, detection of clouds, and inversion of PM2.5 concentrations (Baez-Villanueva et al., 2020; Tan et al., 2021; Liu et al., 2021; Guo et al., 2021). Thus, this study used this simple but promising RF algorithm to establish the nonlinear relationships among surface precipitation, satellite observations and atmospheric characteristics.
Table 3Differences among the four precipitation integration models used in this paper.
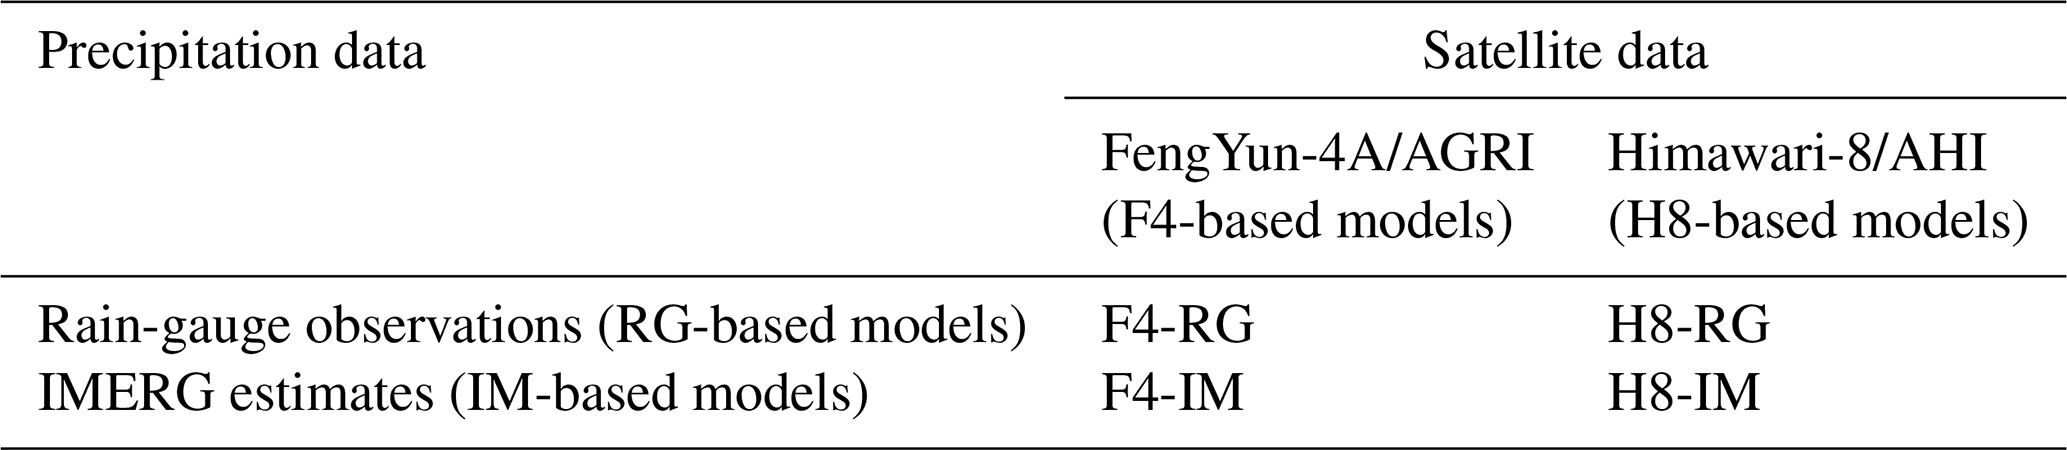
In the framework of RF algorithms, two types of data are utilized for the integration model: the predictor and the predictand. To study the influences of different satellite observations (F4/AGRI vs. H8/AHI) as the predictor and different precipitation data (rain-gauges vs. IMERG) as the predictand on the surface precipitation integration algorithm, we established four independent surface precipitation integration models. These models are referred to hereinafter as F4-based and H8-based models according to the satellite data used in the predictor; similarly, the models using rain-gauge observations and IMERG data as the predictand are referred to as RG-based and IM-based models, respectively. Thus, a total of four models, i.e., F4-RG, F4-IM, H8-RG and H8-IM, are developed. Table 3 differentiates these four models. It is worth noting that the only difference between the RG-based models and the IM-based models is the predictand used in the models, as will be described in more detail in the following.
Table 4Data and variables considered in this study for precipitation integration.
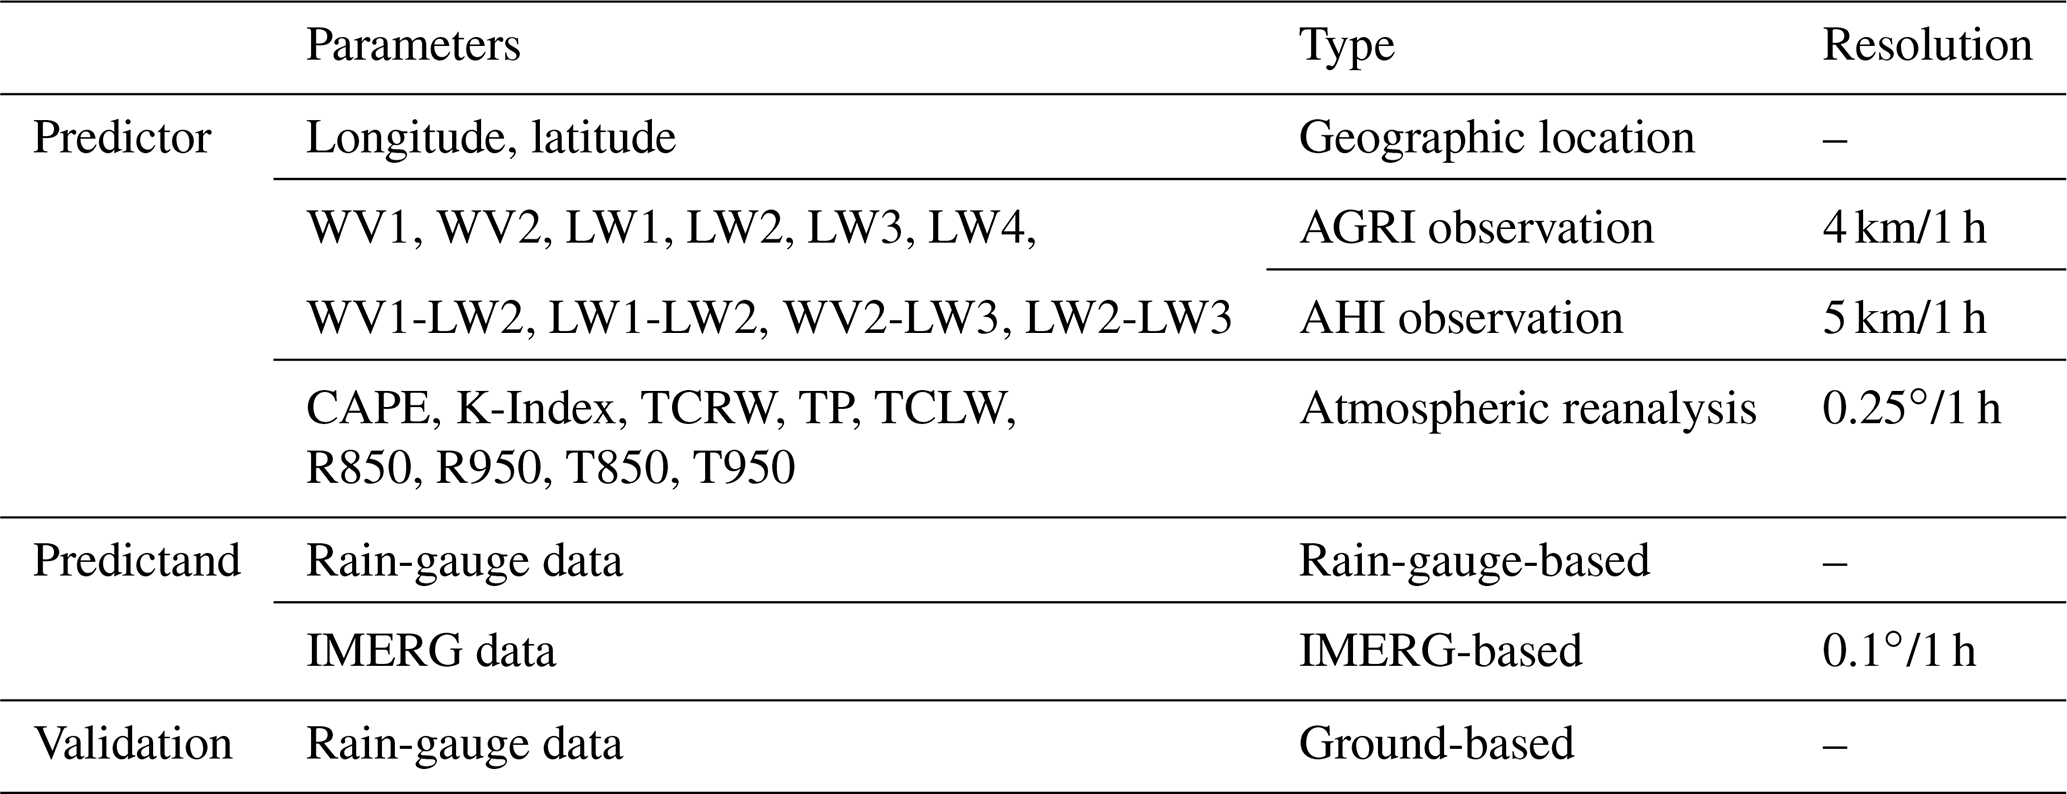
The predictors for the surface precipitation integration algorithm include the geographic location, radiometer observations and atmospheric reanalysis data. By testing the performance of the RF-based models with different combinations of variables, our final models consider a total of 21 variables, as listed in Table 4. The rain-gauge observations and IMERG estimates are used to provide the corresponding surface precipitation as the model predictand. It should be noted that only F4/AGRI observations are used in F4-RG and F4-IM, and only H8/AHI observations are used in H8-RG and H8-IM. Considering the uncertainties related to IMERG precipitation estimates, we use ground rain-gauge data to validate all four models.
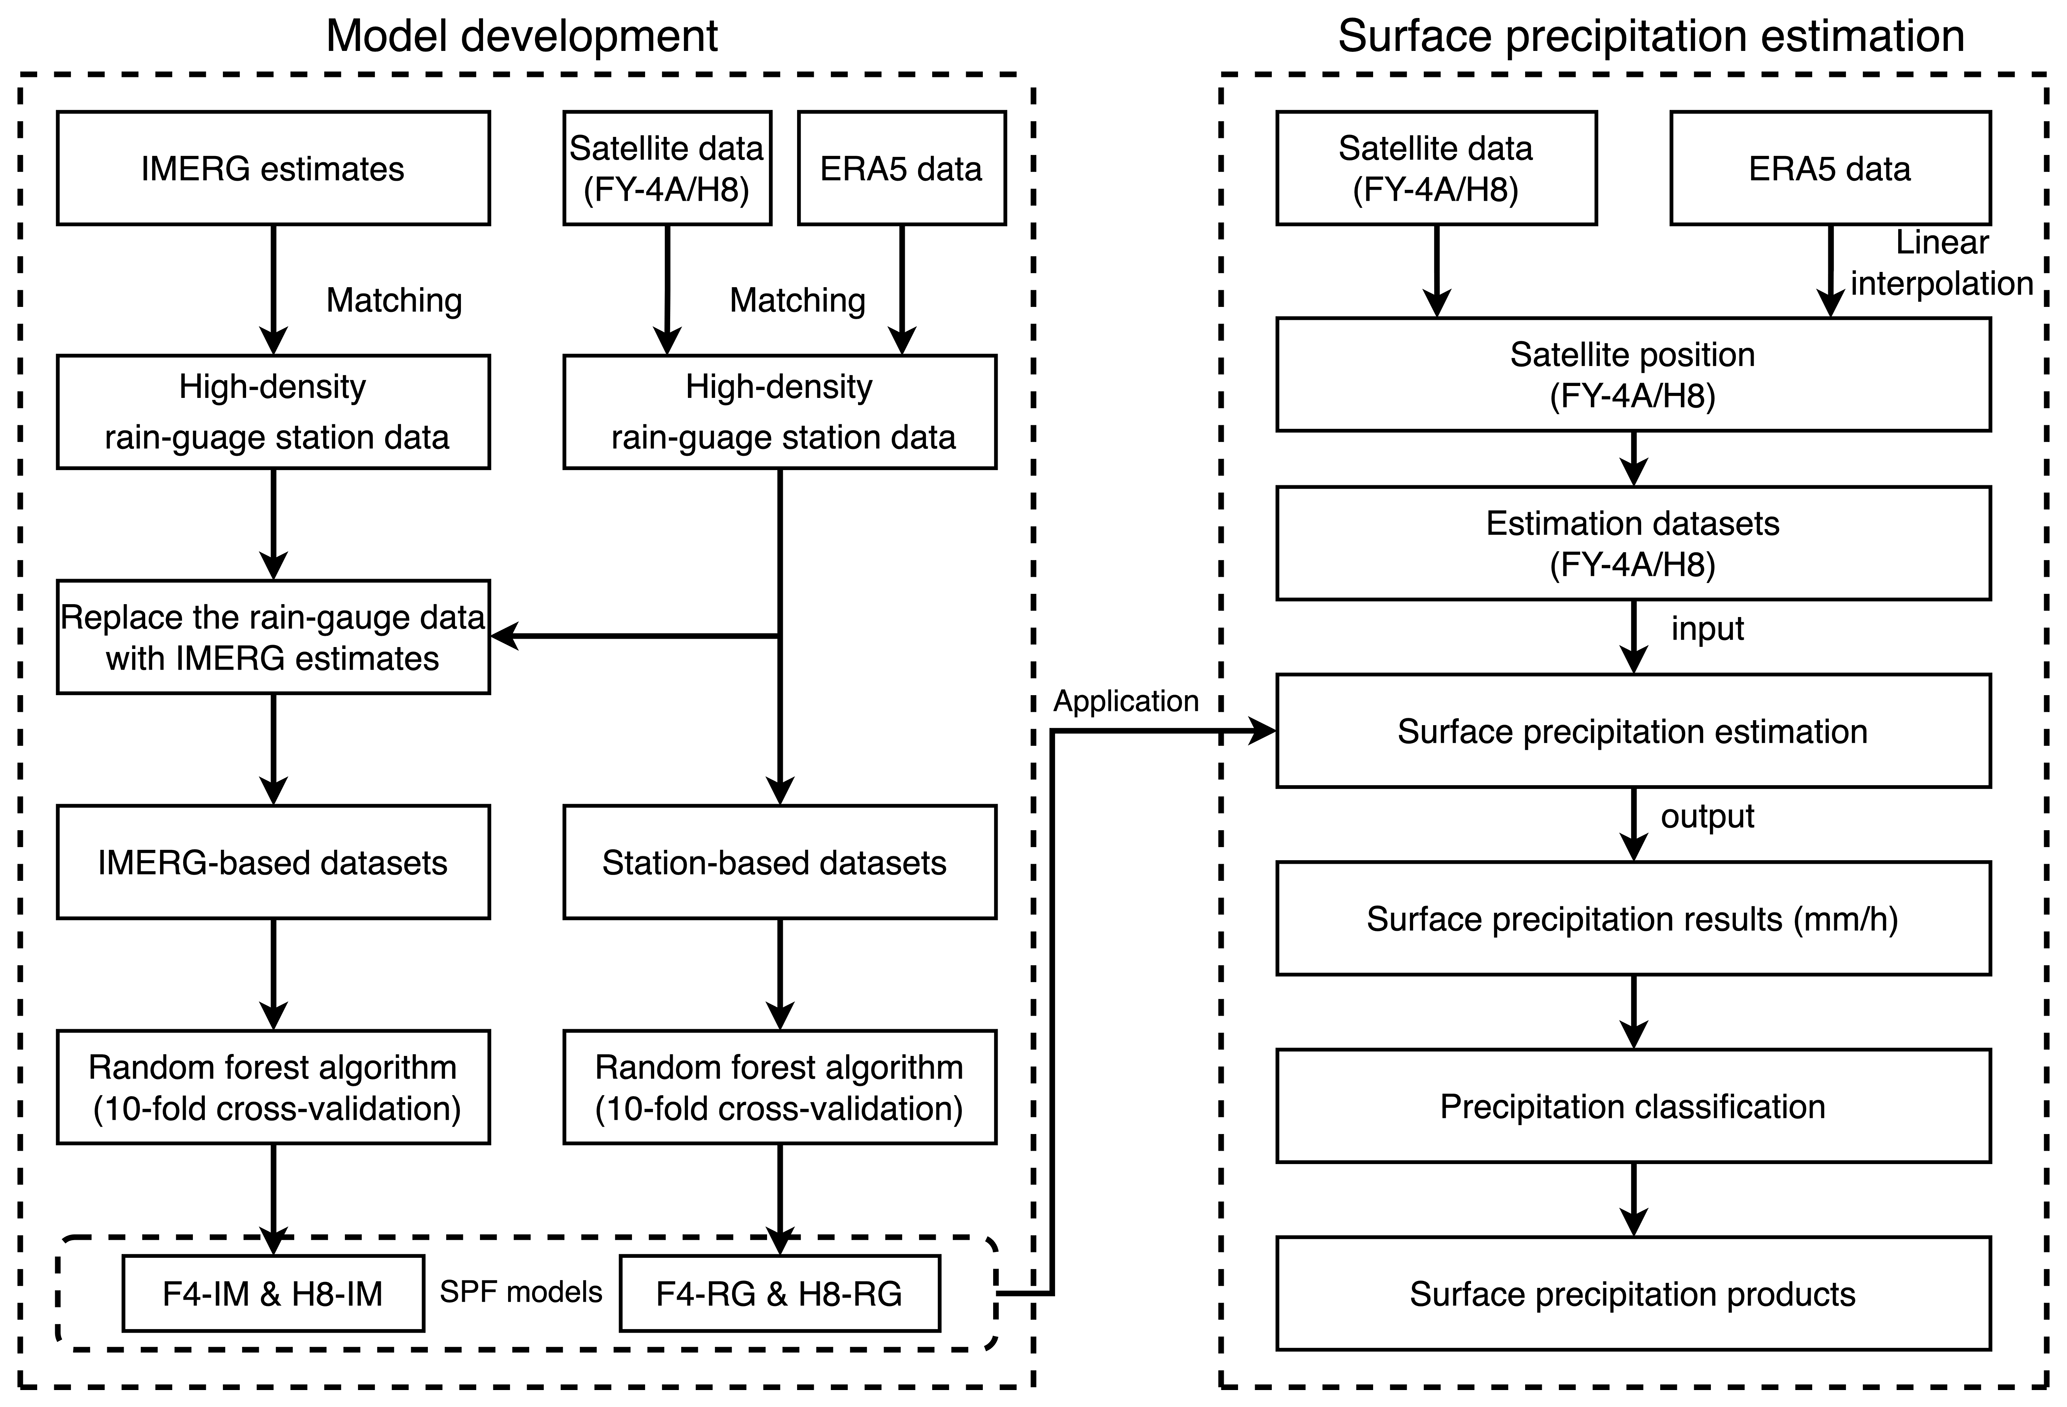
Figure 2 illustrates the general flowchart of our surface precipitation integration algorithm, including the model development and surface precipitation estimation. During the model development, both ERA5 data and satellite data are collocated with high-density ground rain-gauge data to obtain RG-based training datasets. During the collocation processes, the satellite data have a high spatial resolution (4 km for F4/AGRI and 5 km for H8/AHI), and the average radiances values of the nine satellite pixels (3 × 3 pixels) closest to each ground station are collocated to represent the satellite data corresponding to that station. In contrast, ERA5 has a much lower spatial resolution (0.25∘), so the atmospheric variables from the single ERA5 grid point closest to each ground station are used. In other words, all the aforementioned data are collocated with the ground rain-gauge stations, and the resulting datasets are used for further training and model development. For a fair comparison, the IMERG precipitation estimates are also collocated with the rain-gauge observations, resulting in a dataset with the same spatial-temporal sampling interval as that of the RG-based models for model training. Thus, the F4-IM/H8-IM and F4-RG/H8-RG models have completely the same predictor dataset and differ only with regard to the predictand; i.e., rain-gauge observations are replaced with the corresponding IMERG estimates for F4-IM/H8-IM. With the training datasets obtained above, the RF algorithm is used for the training phase, and the four surface precipitation integration models (F4-IM, H8-IM, F4-RG and H8-RG) are developed.
The right part of Fig. 2 depicts the procedure for the pixel-level component of our surface precipitation integration algorithm. At this stage, linear interpolation is employed to obtain the ERA5 atmospheric variables at each F4/H8 grid point. Then, the surface precipitation integration results from the direct RF-based integration models are classified into two sets: pixels with precipitation and those without precipitation. Considering that the minimum precipitation resolution of a rain-gauge is 0.1 mm h−1, pixels with a fused rainfall rate below 0.1 mm h−1 are defined as those without precipitation, while the integration results are retained for pixels with an estimated rainfall rate greater than 0.1 mm h−1. This threshold of 0.1 mm h−1 ensures a high probability of distinguishing precipitation from nonprecipitation.
To objectively evaluate the performance of our surface precipitation integration models, we consider the rain-gauge observations to be the “ground truth” and perform 10-fold cross validation (10-cv) to ensure the independence between the training and testing datasets. In other words, the original training dataset is evenly divided into 10 parts, one of which is taken as the testing dataset each time (without repetition), while the remaining nine are taken as the training dataset; this process is repeated 10 times. We adopt four popular parameters to quantify the model performance: two categorical parameters (the probability of detection (POD) and false alarm ratio (FAR)) and two statistical parameters (the correlation coefficient (R) and root mean square error (RMSE)) between our results and the truth (Ebert et al., 2007; Mecikalski et al., 2008). POD and FAR both range from 0 to 1, where larger POD and lower FAR values correspond to the better identification of precipitation events.
Two important RF parameters must be considered: the number of trees to grow (Ntree) and the number of variables randomly sampled as candidates at each split (Mfeature). Figure 3 quantifies the relationship between parameters Ntree and max_features with the correlation coefficient (R), which is a measure of how well the RF models perform in the testing datasets created by 10-cv. Based on the results, the value of R increases with the increases in Ntree and Mfeature, and tends to be stable when Ntree is greater than 500 and Mfeature is greater than 10. To ensure that the four models are comparable, the RF parameters are fixed to be the same. Considering the accuracy, computational efficiency and comparability of the models, the number of trees to grow (Ntree=1000) and the number of variables randomly sampled as candidates at each split (Mfeature=10) are both fixed for the four models.
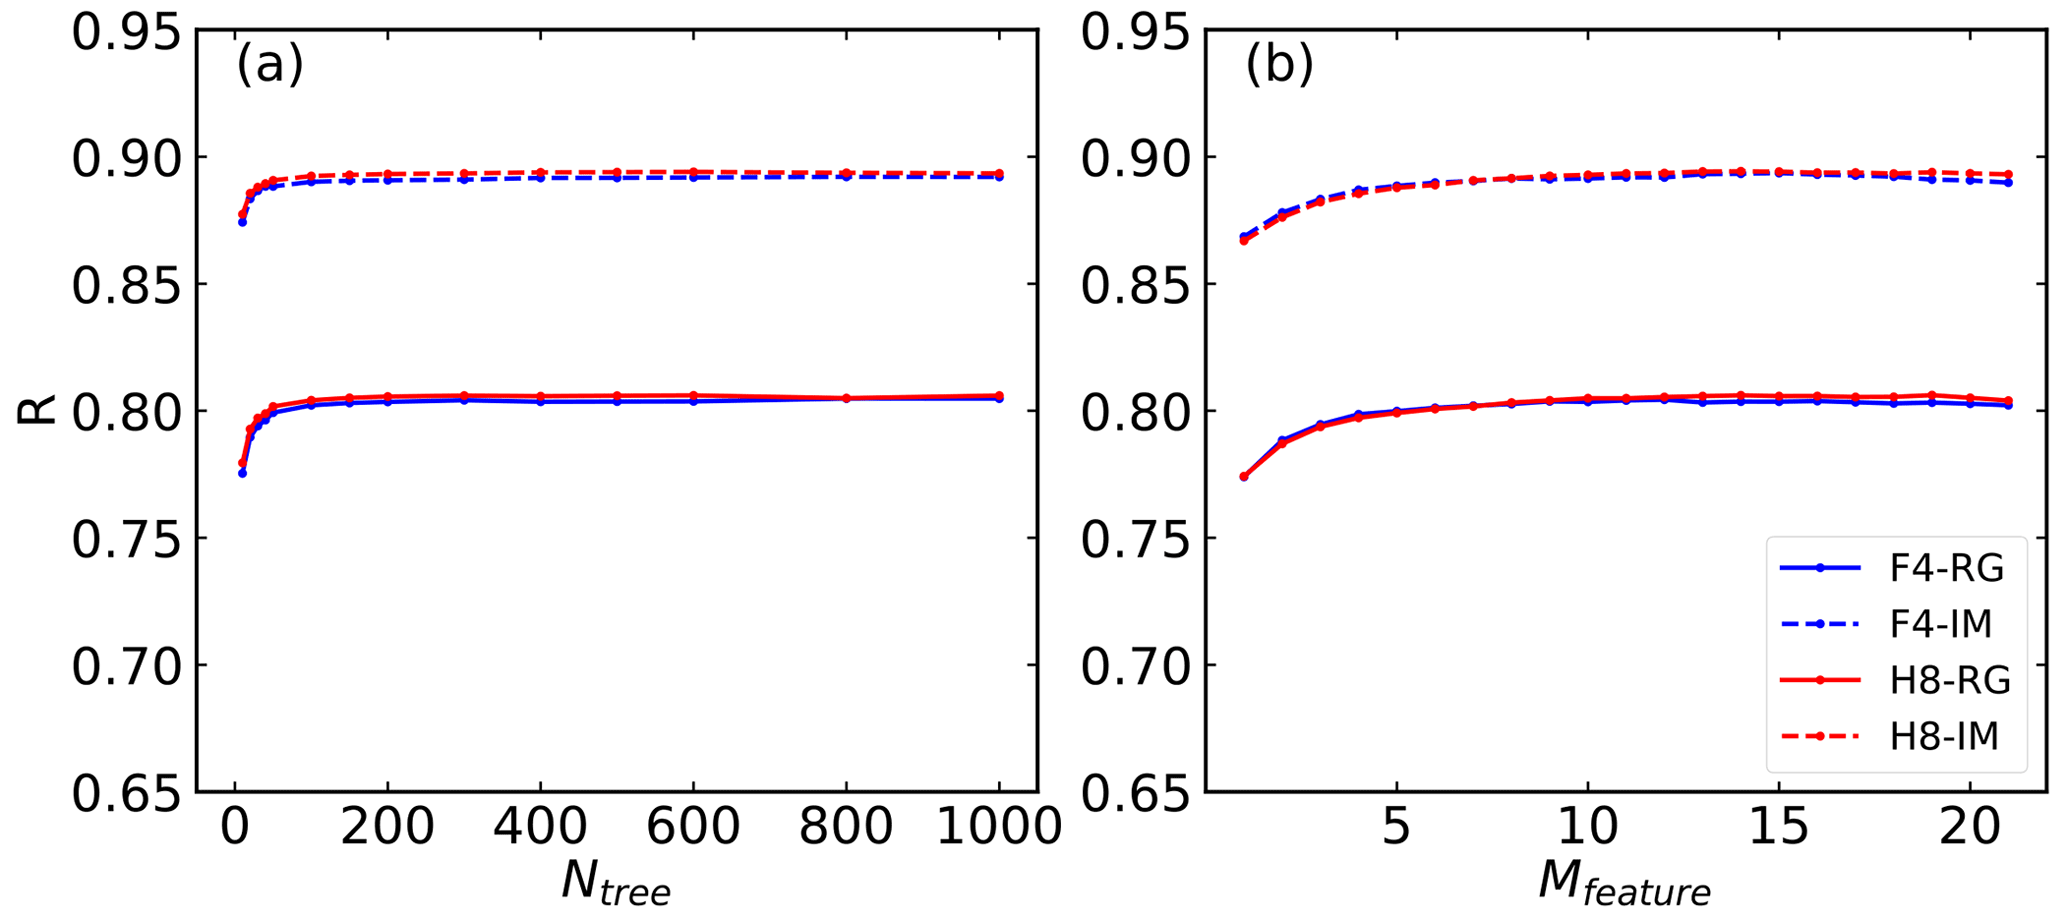
Figure 3Dependence of the correlation coefficient (R) on the parameters Ntree (a) and Mfeature (b).
3.2 Testing and evaluation of the RF-based integration algorithm
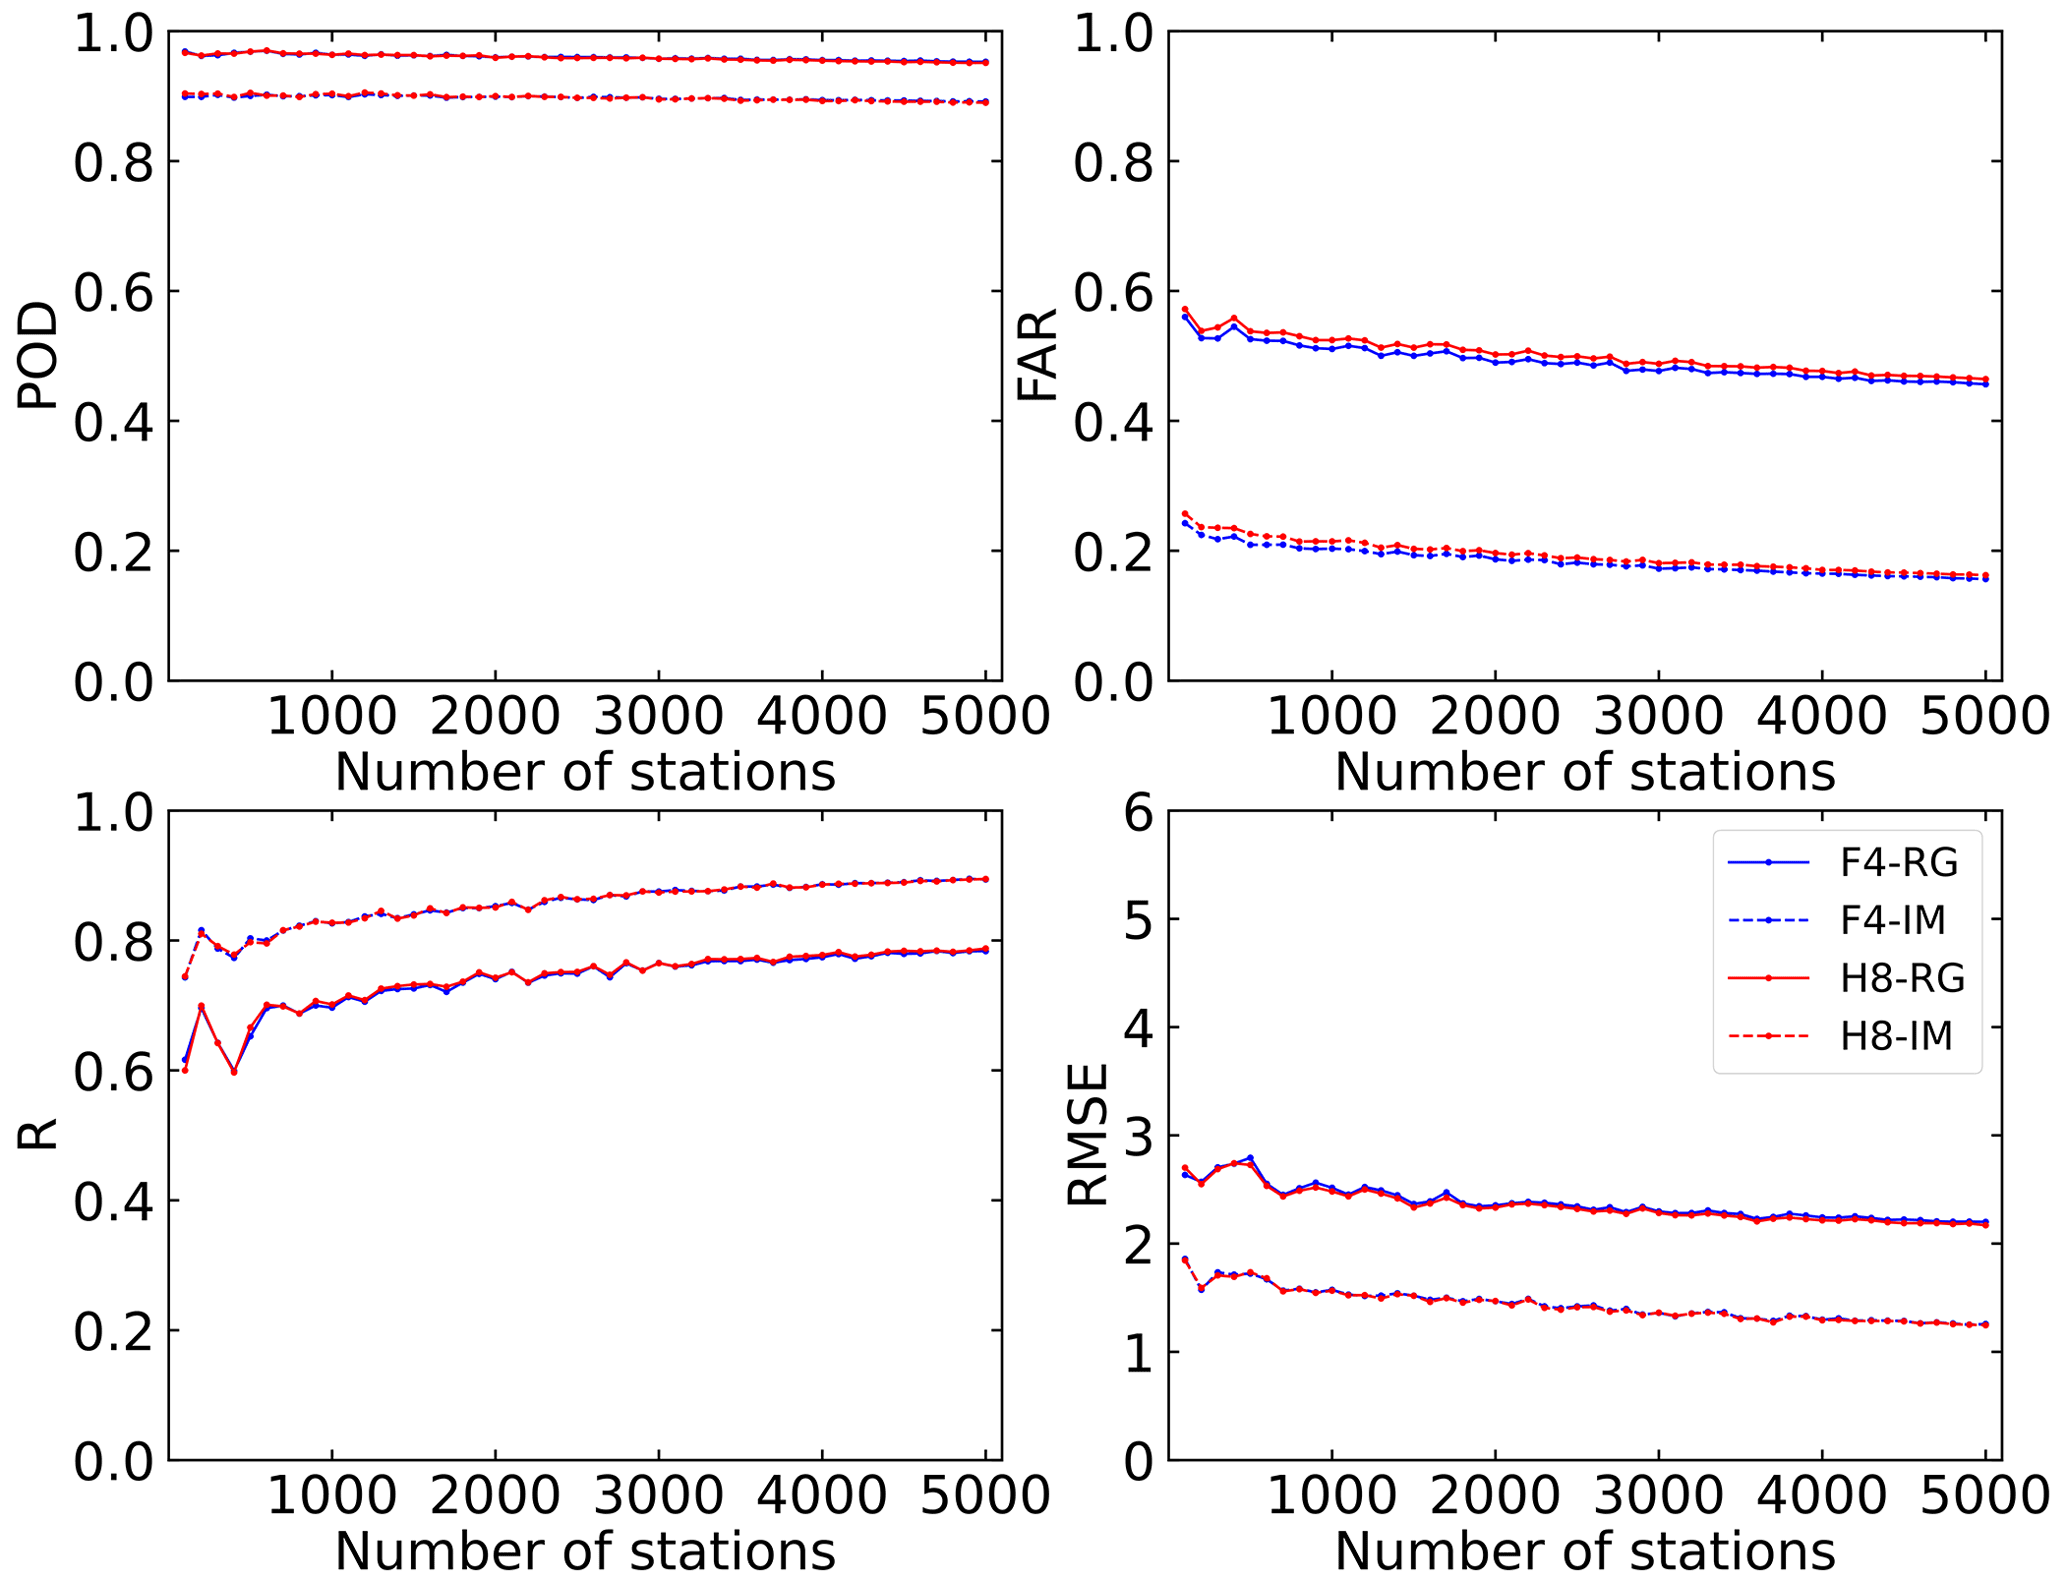
Considering the distribution of precipitation throughout the year and the amount of damage caused by precipitation, the distribution of CMA ground rain-gauge stations is clearly uneven, with many more stations situated in eastern China than in western China. Because we employ ground rain-gauge observations for the integration, the coverage of rain-gauge observations is crucial for representing the spatial distribution of precipitation. To explore the impact of station density on the integration of typhoon precipitation, we select data from different numbers of stations (increasing from 100 to 5000 with an interval of 100) to build training datasets of different sizes. Figure 4 shows the influence of the number of stations considered on the model training results. The solid lines represent the RG-based model results, while the dashed lines represent the IM-based model results; the blue and red colors denote the F4-based and H8-based results, respectively. The evaluation parameters of all four models exhibit similar trends with an increasing number of stations; i.e., the integration results become more accurate due to both additional input data and a better representation on precipitation spatial distribution. The POD values of the four models are all close to 1, and vary only slightly with the number of stations, while the FAR values of the four models decreases with an increase in the number of stations. In contrast, the two statistical metrics (R and RMSE) fluctuate greatly when there are fewer than ∼ 1000 stations, i.e., 1.26 × 10⁻³ station km−2; when observations from more than 1000 stations are considered, the R (RMSE) gradually increases (decreases) with an increasing number of stations. In general, in the estimation of typhoon precipitation, when the number of stations covering the region exceeds 1000, rain-gauge observations can generally reflect the spatial distribution of precipitation and can thus be used for surface precipitation integration. Of course, an increase in the number of stations does improve the integration performance, but only to a limited degree. Nevertheless, to ensure optimal model performance, this paper selects the data from all available stations.
The scatter plots in Fig. 5 quantitatively compare the hourly precipitation estimated by our surface precipitation integration models with the 10-cv testing datasets, indicating only the generalization ability of the model. The two IM-based models (F4-IM and H8-IM) outperform the RG-based models (F4-RG and H8-RG) in the testing datasets according to the values of the POD (0.98 vs. 0.95, 0.97 vs. 0.95), FAR (0.25 vs. 0.46, 0.25 vs. 0.46), R (0.89 vs. 0.79, 0.89 vs. 0.79) and RMSE (1.25 mm h−1 vs. 2.19 mm h−1, 1.25 mm h−1 vs. 2.17 mm h−1). This may be due to using the satellite-based precipitation data of IMERG, as the predictand may demonstrate better spatial consistency with the satellite observations than using the rain-gauge observations. In contrast, due to the similar satellite channels used as the predictors, the results based on different satellites are very similar in both the RG-based and the IM-based models. Noted that the “better performance” here only illustrates the better correlations between the predictors and predictands, but is not a high accuracy of the final model estimations, which also depend on the accuracy of the predictands compared to the truth (see Sect. 4).
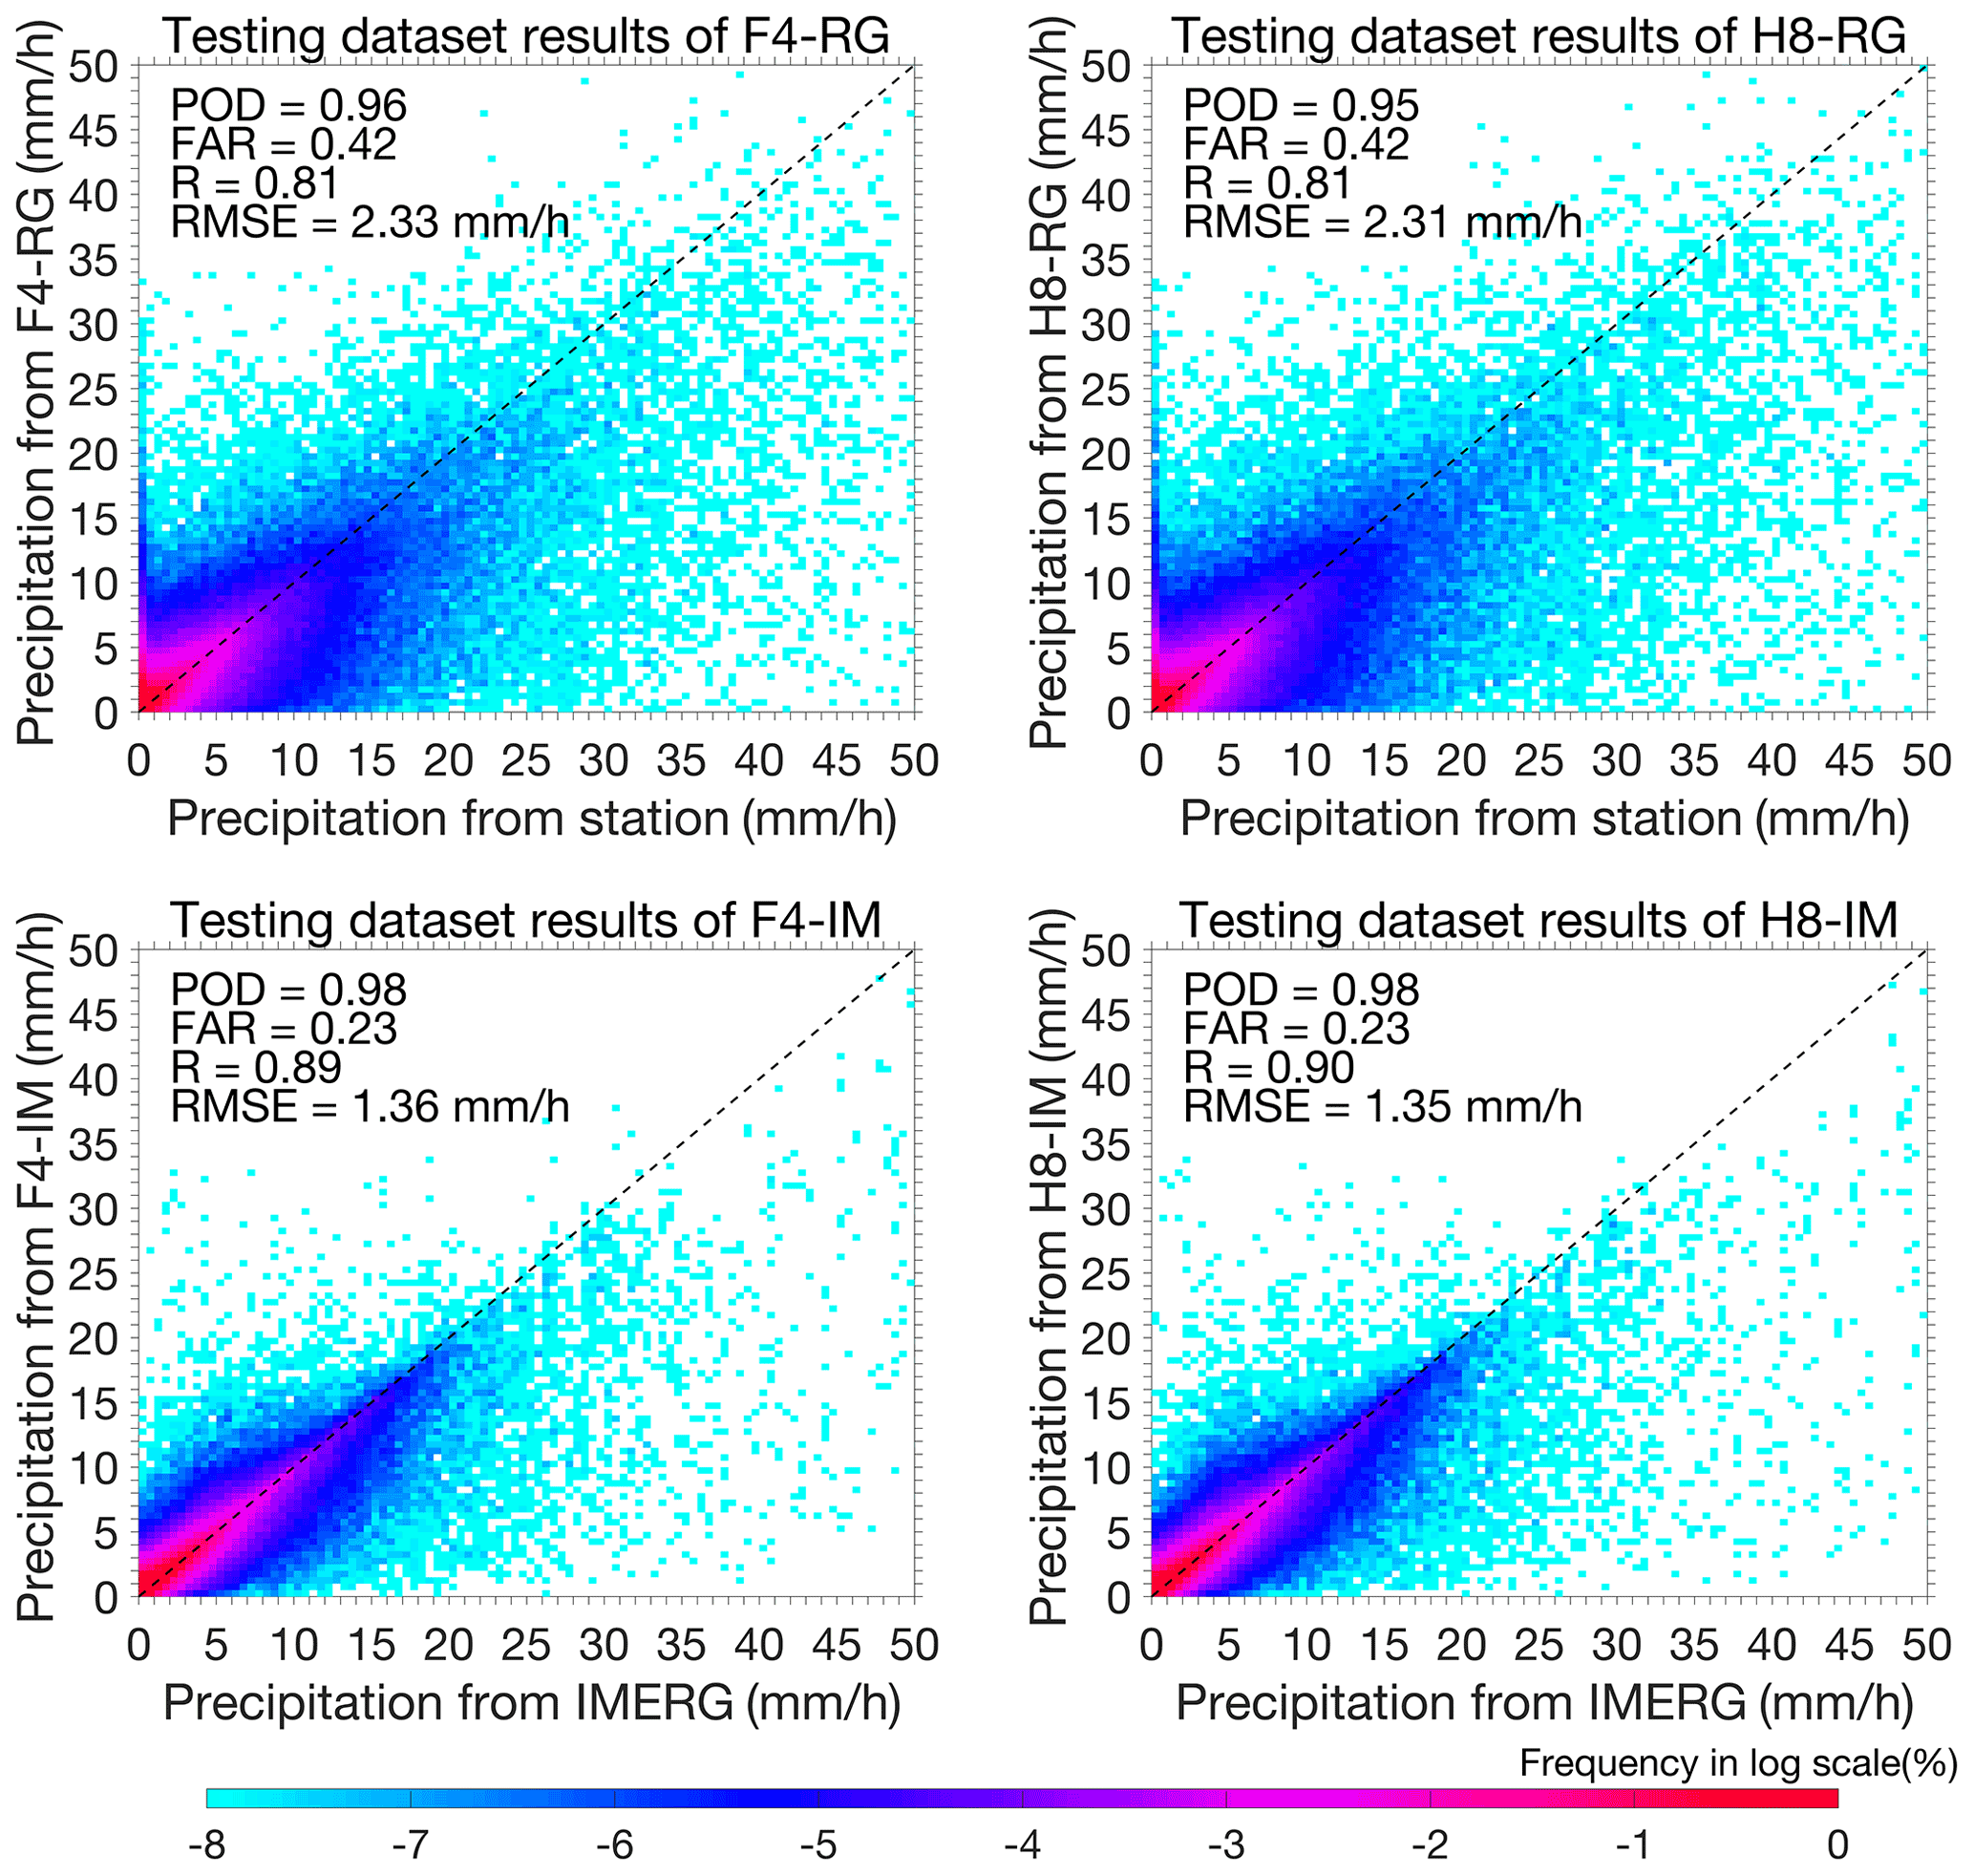
Figure 5Scatter plots of the hourly precipitation among the different surface precipitation integration models (F4-RG, H8-RG, F4-IM and H8-IM) and rain-gauge observations over the testing datasets created by the 10-cv method with the RF algorithm. The dotted black line in all panels represents the 1 : 1 line.
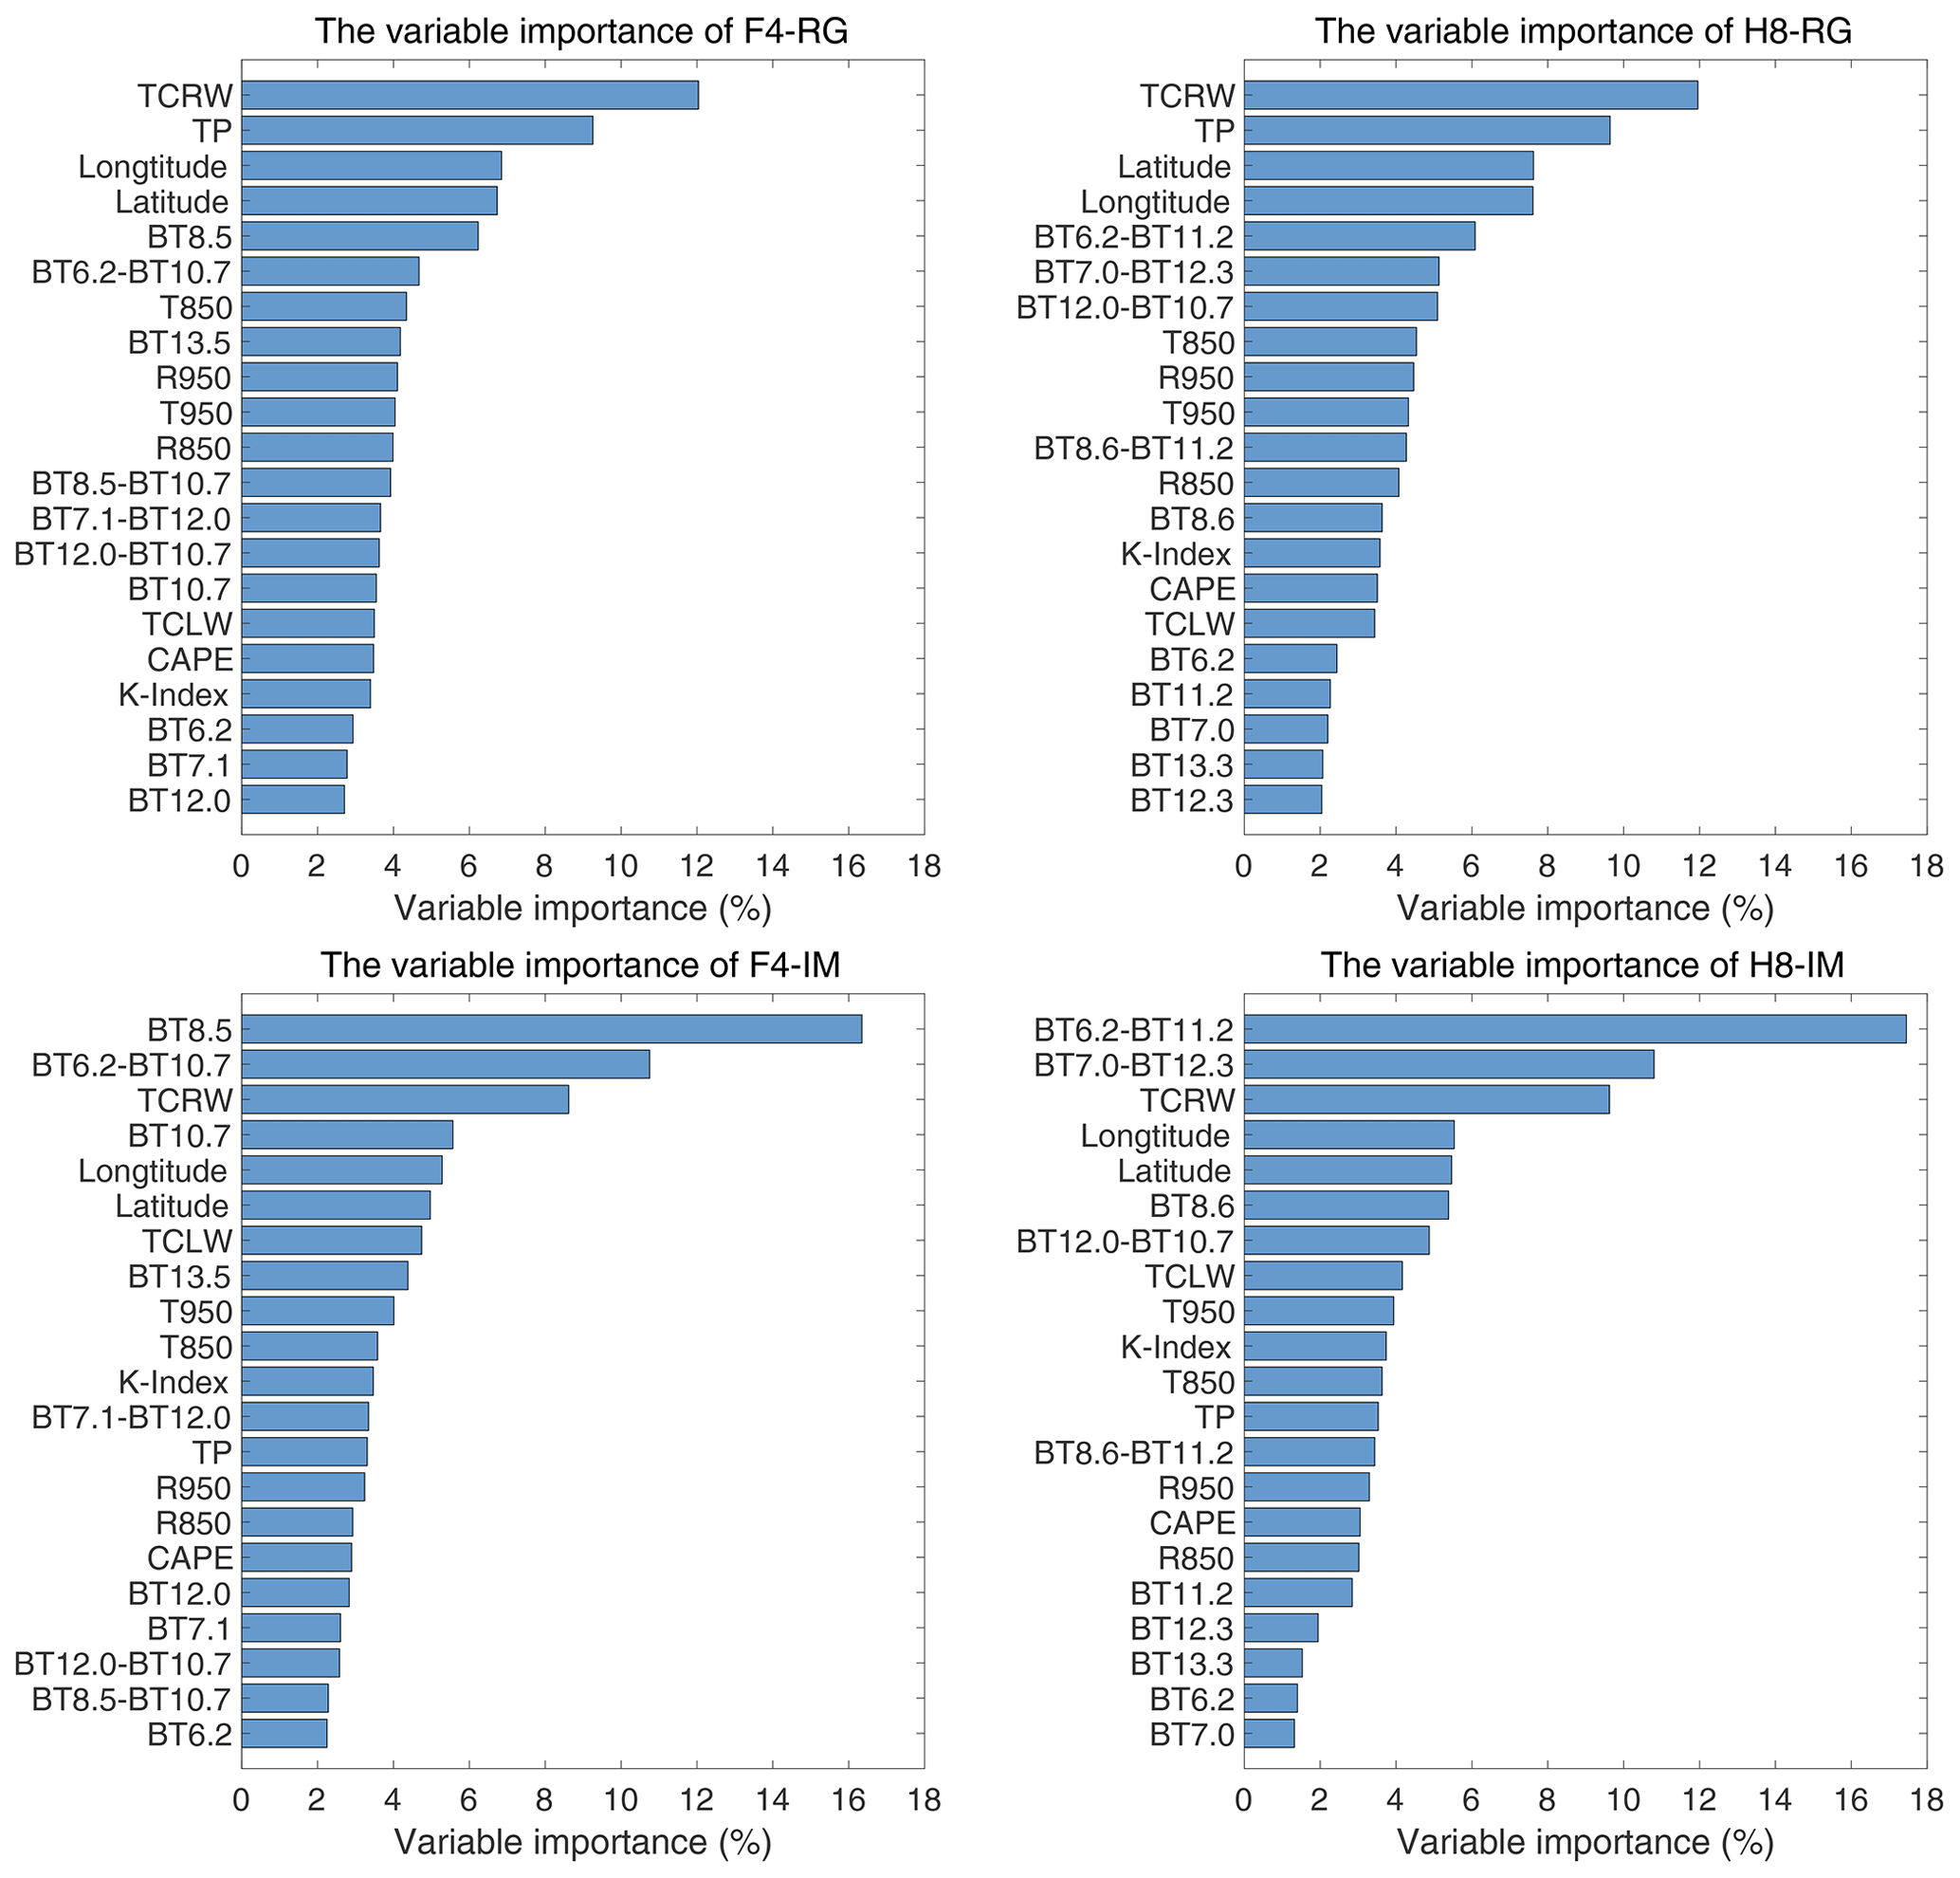
Figure 6Importance of each variable in the RF algorithm when estimating surface precipitation.
To better understand the performance of the surface precipitation integration models, Fig. 6 shows the importance of all the predictors considered in all four models. The importance of each variable is given in the form of the mean decrease in accuracy (%IncMSE), which can represent the relative contribution of each variable, and the sum of the importance of all variables is 100 %. For F4-RG and H8-RG, the most important input variables are TCRW and TP, which represent the potential precipitable water in the atmosphere and the sum of large-scale precipitation and convective precipitation given by the atmospheric reanalysis. Geographical location data are also highly important, perhaps because the obvious spatial patterns of typhoon precipitation can be captured by RF-based training. The most important radiometer observations are certain brightness temperatures (BTs), such as BT12.0-BT10.7 for F4-RG and BT6.25-BT10.7 for H8-RG, both of which are related to the state of water vapor in the atmosphere. It is interesting that the most important variables in F4-IM/H8-IM differ significantly from those in F4-RG/H8-RG. Since the IMERG data comprise satellite-based precipitation estimates (Min et al., 2018), strong consistency is noted between the IMERG data and satellite observations, which is also reflected in the importance of variables. For F4-IM and H8-IM, the importance of variables such as BT8.5, BT6.2-BT10.7, BT6.2-BT11.2 and BT7.0-BT12.3 is significantly high, while the importance of atmospheric reanalysis data and geographic data is relatively low; hence, the precipitation predicted by the F4-IM and H8-IM models is more dependent on the satellite observations. Meanwhile, the higher rankings of reanalysis-based variables in the RG-based models indicate their reasonable performance for distributing accurate atmospheric states (i.e., surface precipitation from rain gauges).
To evaluate the surface precipitation integration results, Fig. 7 shows the ground rain-gauge observations and the results from the four integration models at three instants (from top to bottom) during Typhoon Mangkhut, which made landfall at 09:00 UTC on 16 September 2018. Three typical cases are illustrated at three distinct instants: before the typhoon made landfall (01:00 UTC on 16 September 2018), after the typhoon made landfall (12:00 UTC on 16 September 2018) and as the typhoon started to dissipate (23:00 UTC on 17 September 2018). Before the typhoon made landfall, the number of stations with precipitation on land was small, and heavy precipitations (e.g., stations with rain rates greater than 20 mm h−1) was concentrated mainly over the coastline. After the typhoon made landfall, the precipitation area increased significantly, and both the extent of heavy precipitation area and the rain rates increased, with over 29 stations with recording rain rates exceeding 30 mm h−1. Before the typhoon started to dissipate, the center of heavy rainfall disappeared, although there were still large regions of weak precipitation. At all instant steps, the four models consistently yield reasonable typhoon precipitation intensities and spatial distributions, especially the F4-RG and H8-RG, whereas F4-IM and H8-IM slightly overestimate the precipitation extent and cannot accurately represent the heavy precipitation centers. Figure 7 demonstrates that F4-RG and H8-RG predict similar spatial distributions, which is because the two models use similar predictors to predict the same predictand; the similar spatial distribution between F4-IM and H8-IM is also due to this reason. In addition, because the two RG-based models use rain-gauge data as the predictand during model development while the two IM-based models use IMERG data, the precipitation predicted by the RG-based models is closer to the rain-gauge precipitation, whereas that predicted by the IM-based models is closer to the IMERG precipitation, which further indicates that rain-gauge data are more suitable for the predictand than IMERG data when using ML to predict surface precipitation.
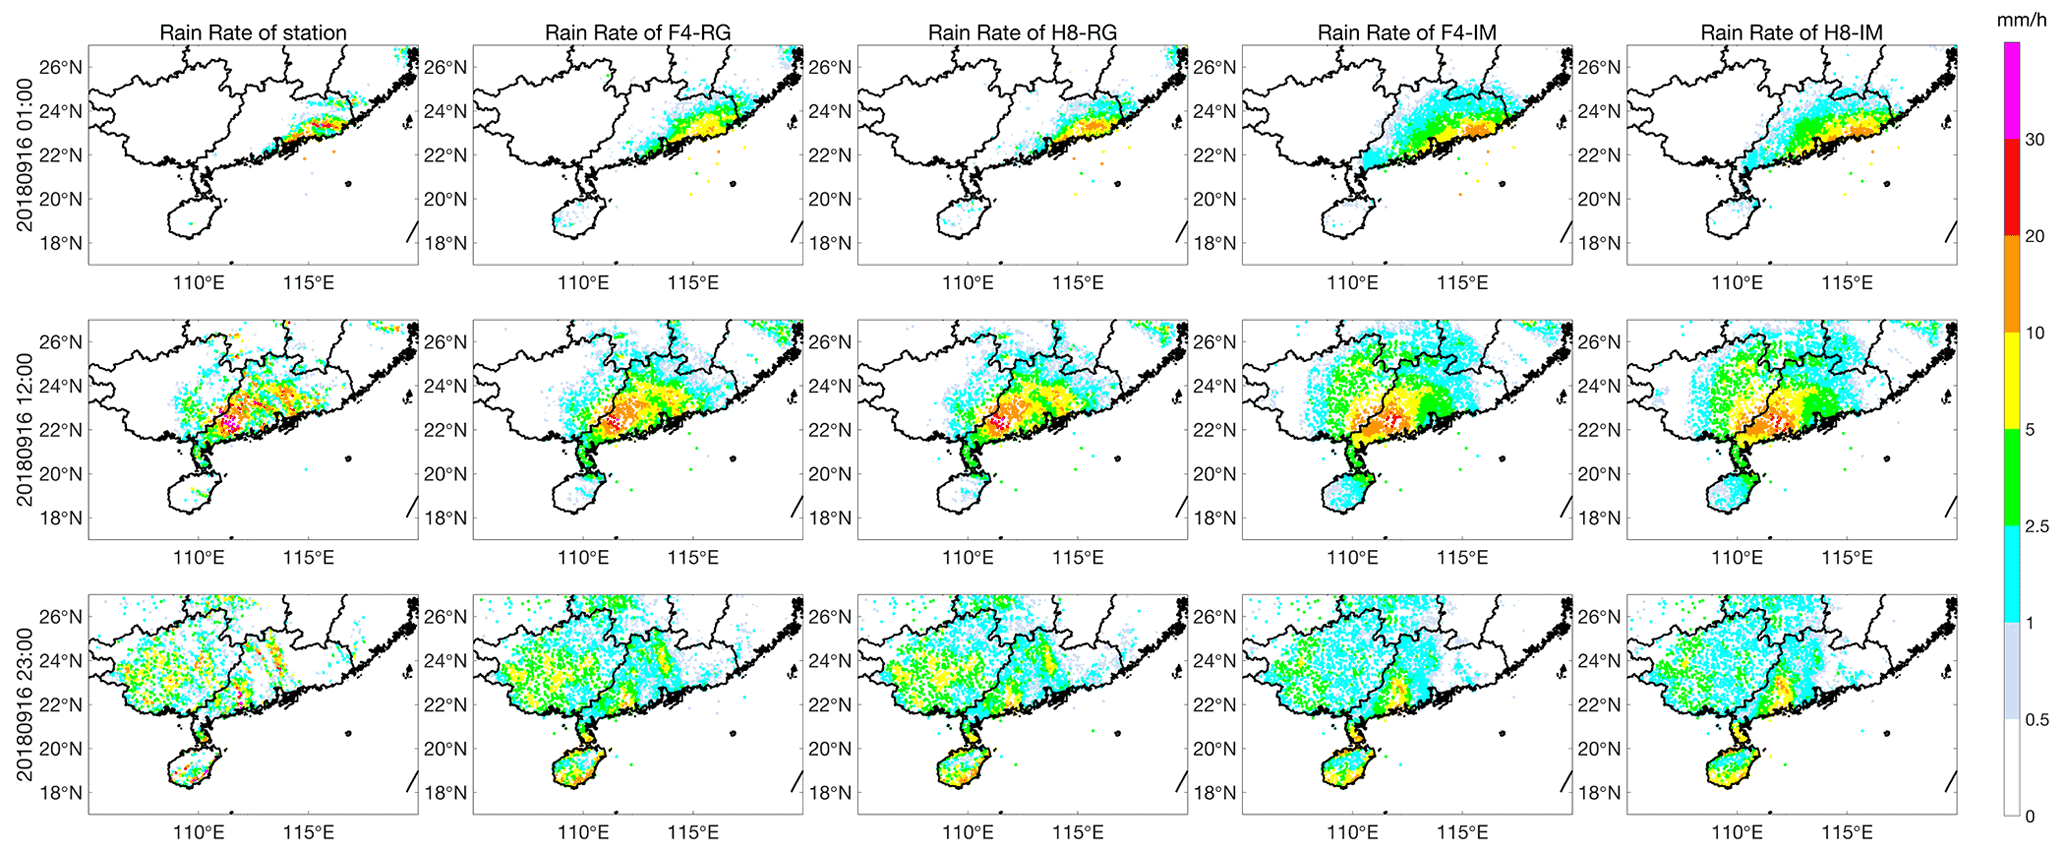
Figure 7Comparison of the hourly precipitation from the ground rain-gauge observations with the F4-RG, H8-RG, F4-IM and H8-IM estimates at instants steps (01:00 UTC on 16 September 2018, 12:00 UTC on 16 September 2018, and 23:00 UTC on 17 September 2018).
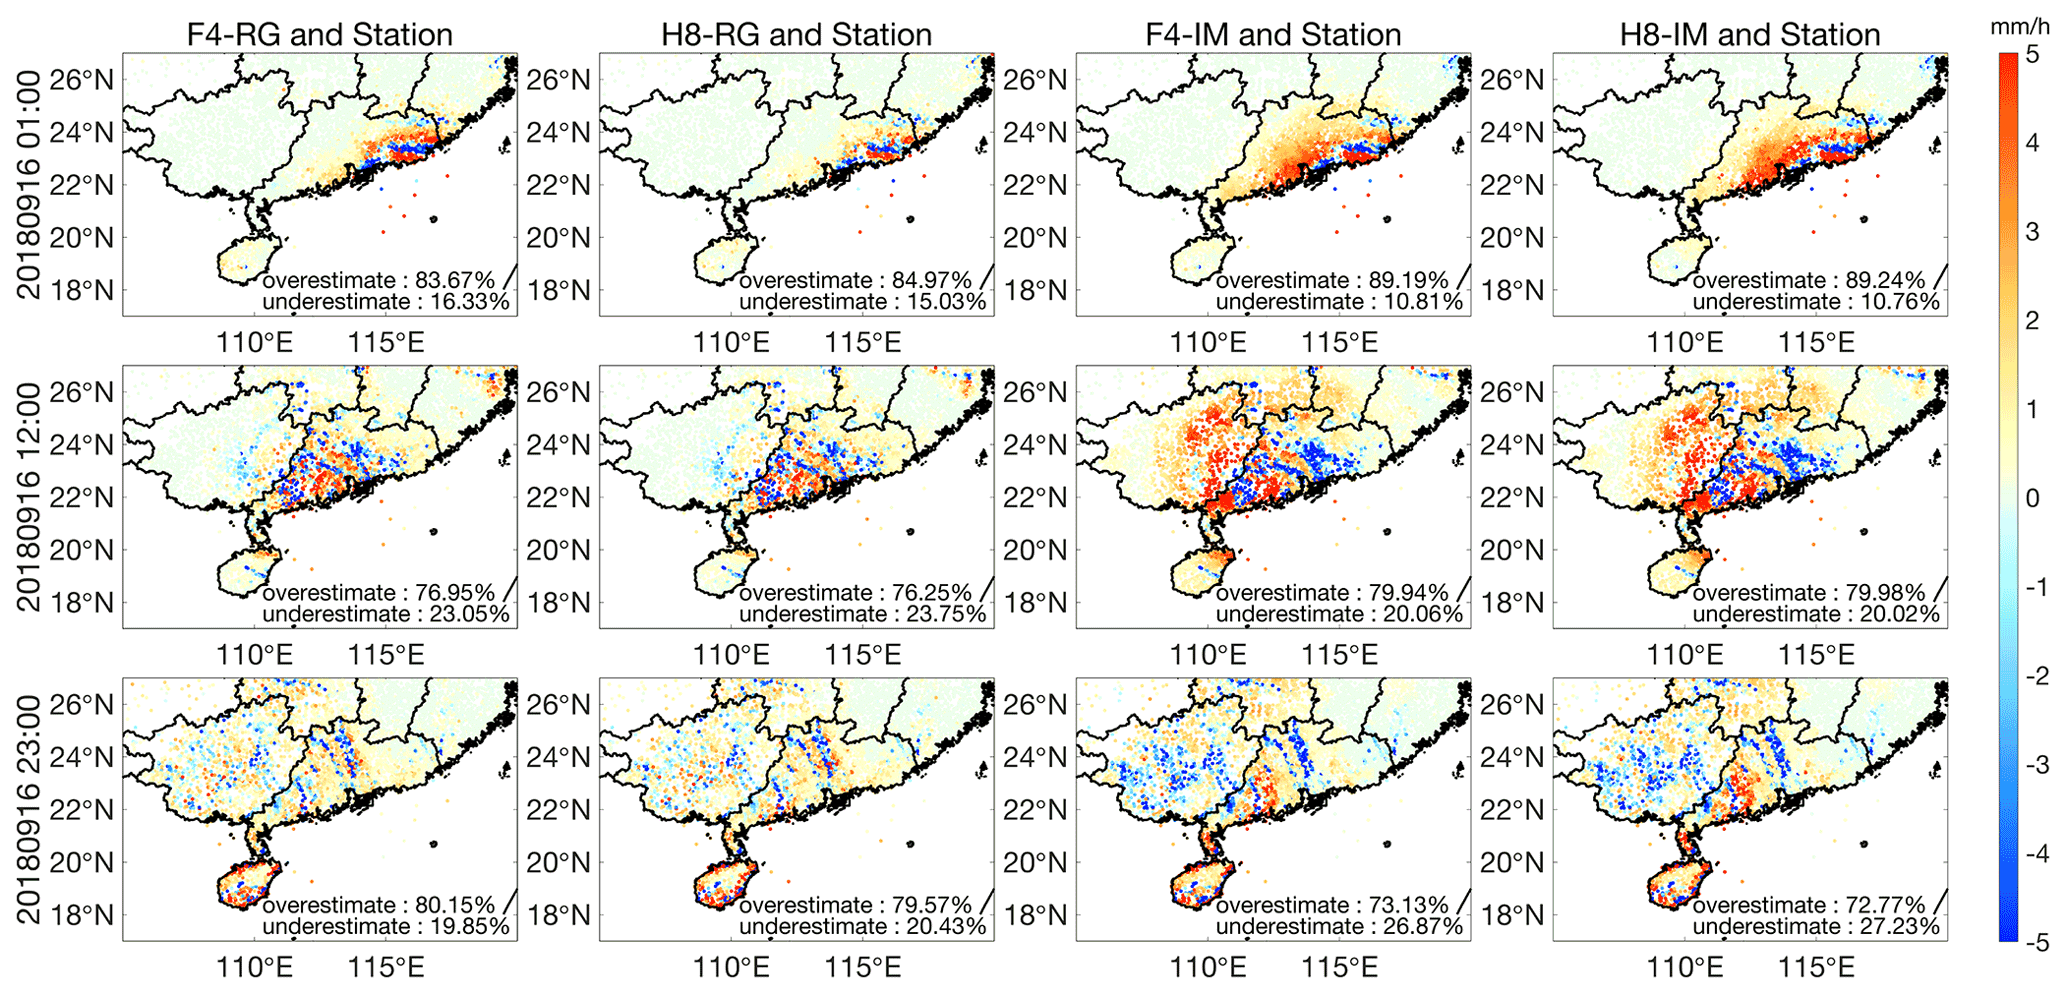
Figure 8Differences in hourly precipitation between F4-RG, H8-RG, F4-IM and H8-IM and the ground rain-gauge observations at instants steps (01:00 UTC on 16 September 2018, 12:00 UTC on 16 September 2018, and 23:00 UTC on 17 September 2018).
To help us quantitatively understand the above-mentioned comparison, Fig. 8 illustrates the differences in hourly precipitation between our integration results and the ground rain-gauge observations at the same instants steps in Fig. 7. Warm colors indicate stations at which the surface precipitation integration results are overestimated (larger than the rain-gauge observations), while cold colors indicate those at which the surface precipitation integration results are underestimated. The differences between the F4-RG/H8-RG results and rain-gauge observations are mostly within 2 mm h−1, significantly smaller than the differences between the F4-IM/H8-IM results and rain-gauge observations. However, all four models tend to underestimate the precipitation intensity in the area of heavy precipitation and overestimate the precipitation at the rain-gauge stations with relatively weak precipitation (rain rates below 5 mm h−1). Ultimately, more than 70 % of the surface precipitation is overestimated because many more stations experienced weak precipitation than heavy precipitation within the study region.
Table 5 summarizes the percentages of the precipitation that were overestimated by the four integration models at the three typhoon instants. The percentages in this table denote ratios of our integration results larger than the true values (i.e., rain-gauge observations) to the total amount of data at the particular rainfall rate. As our precipitation differences are strongly consistent with the rainfall rates, we divide the results into two groups: one group for stations with rainfall rates less than 5 mm h−1 and the other group for those with rainfall rates greater than 5 mm h−1. For rain-gauge precipitation rates less than 5 mm h−1, more than ∼ 85 % of these data are overestimated. However, for rainfall rates greater than 5 mm h−1, only approximately 20 % of our results are larger than the true values, which means that the rate of underestimation is approximately 80 %.
Table 5Surface precipitation overestimation percentages for the four models during the three typhoons.
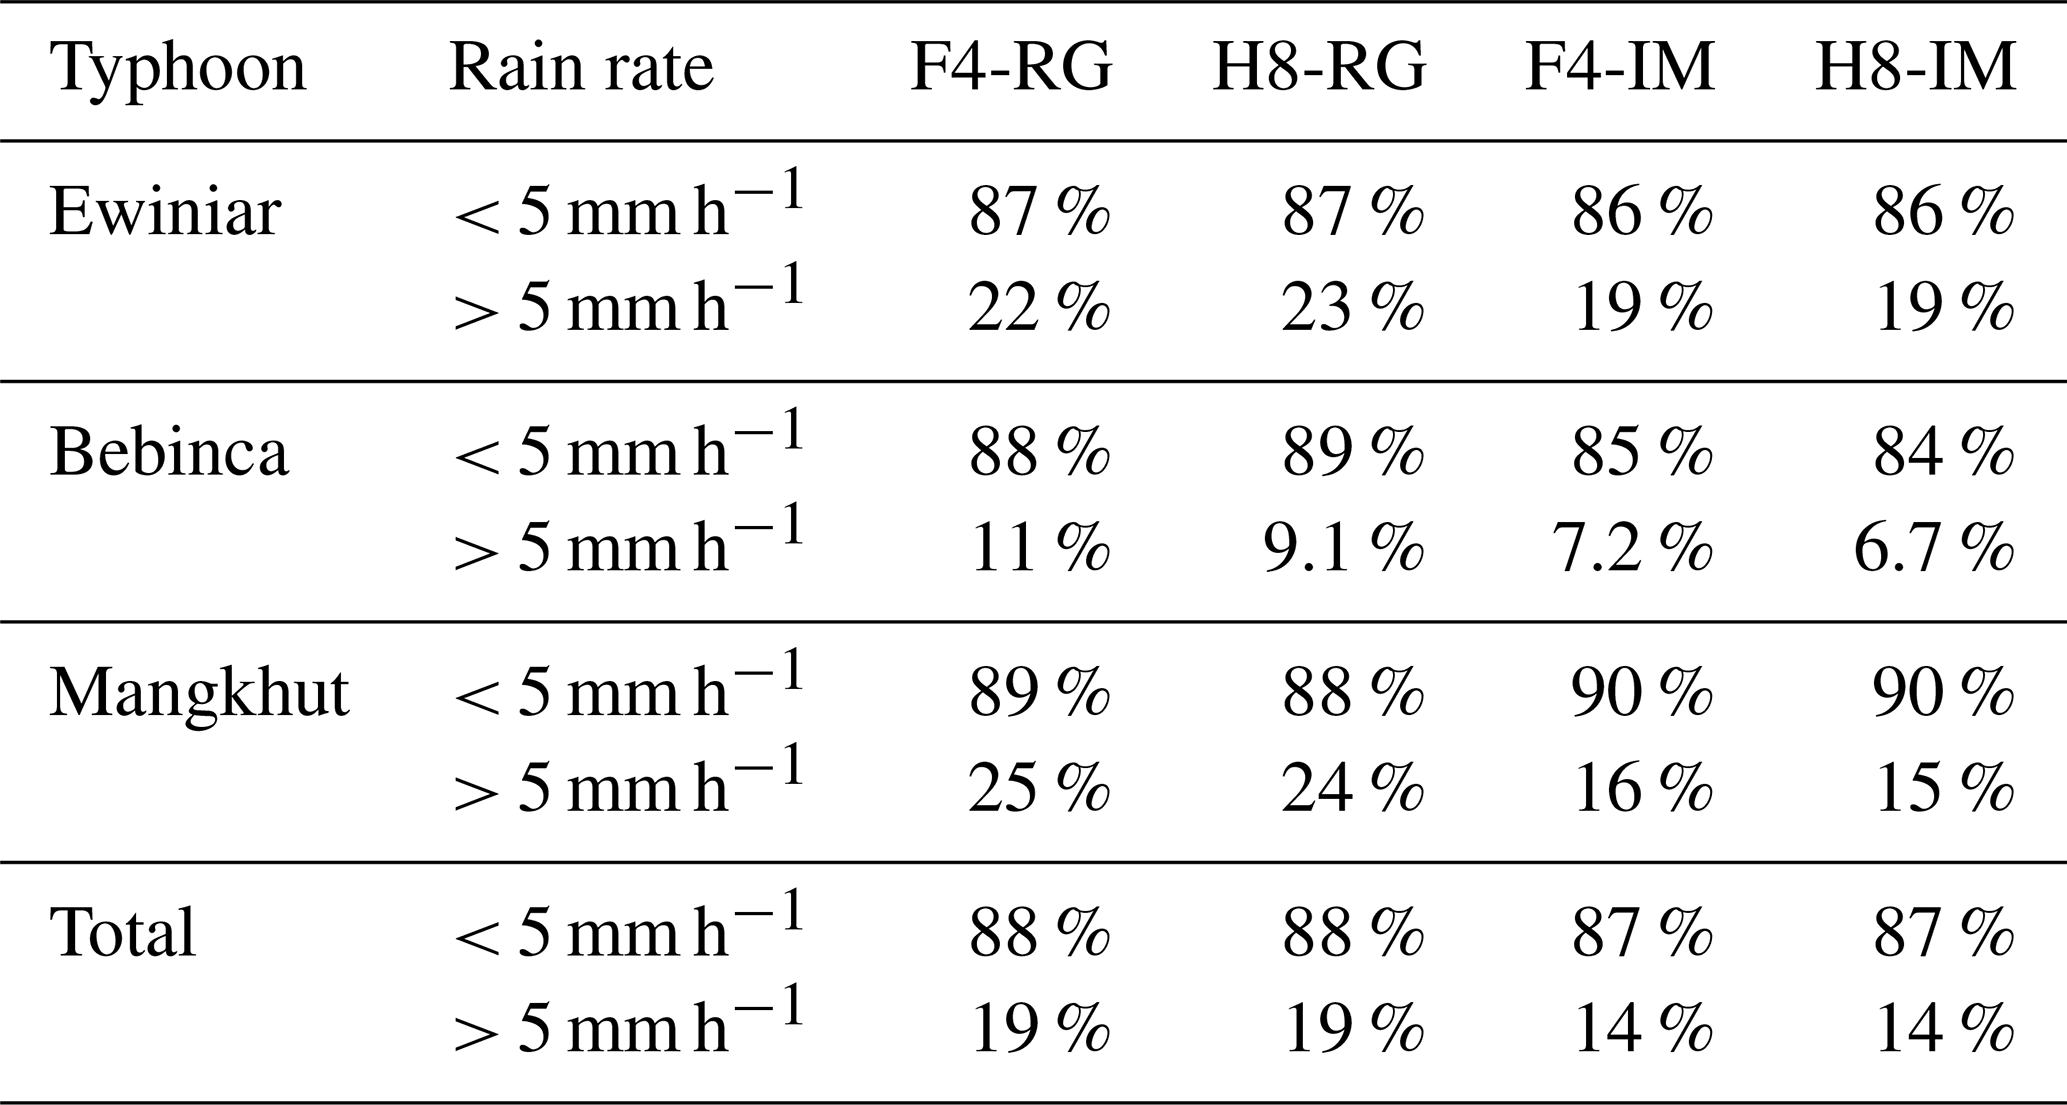

Figure 9Comparison of daily precipitation among F4-RG, H8-RG, F4-IM and H8-IM on 16 September 2018.
Figure 9 compares the daily precipitation of our four models during Typhoon Mangkhut on 16 September 2018. The daily precipitation results of the RG-based models (F4-RG and H8-RG, top panels) exhibit close agreement, and similar consistency is noticed between the F4-IM and H8-IM results (bottom panels). However, the RG-based model results differ substantially from the IM-based model results. The daily precipitation distributions of F4-RG and H8-RG indicate that during Typhoon Mangkhut, the precipitation over land was concentrated mainly in Guangdong Province, and the daily precipitation in some areas surpassed 200 mm d−1. In contrast, F4-IM and H8-IM overestimate most of the daily precipitation on land but significantly underestimate the daily precipitation over 200 mm d−1. It is worth noting that our models can yield the precipitation distribution over the ocean as well, but the performance could hardly be evaluated with any objectivity due to the lack of ground-based observations at sea.
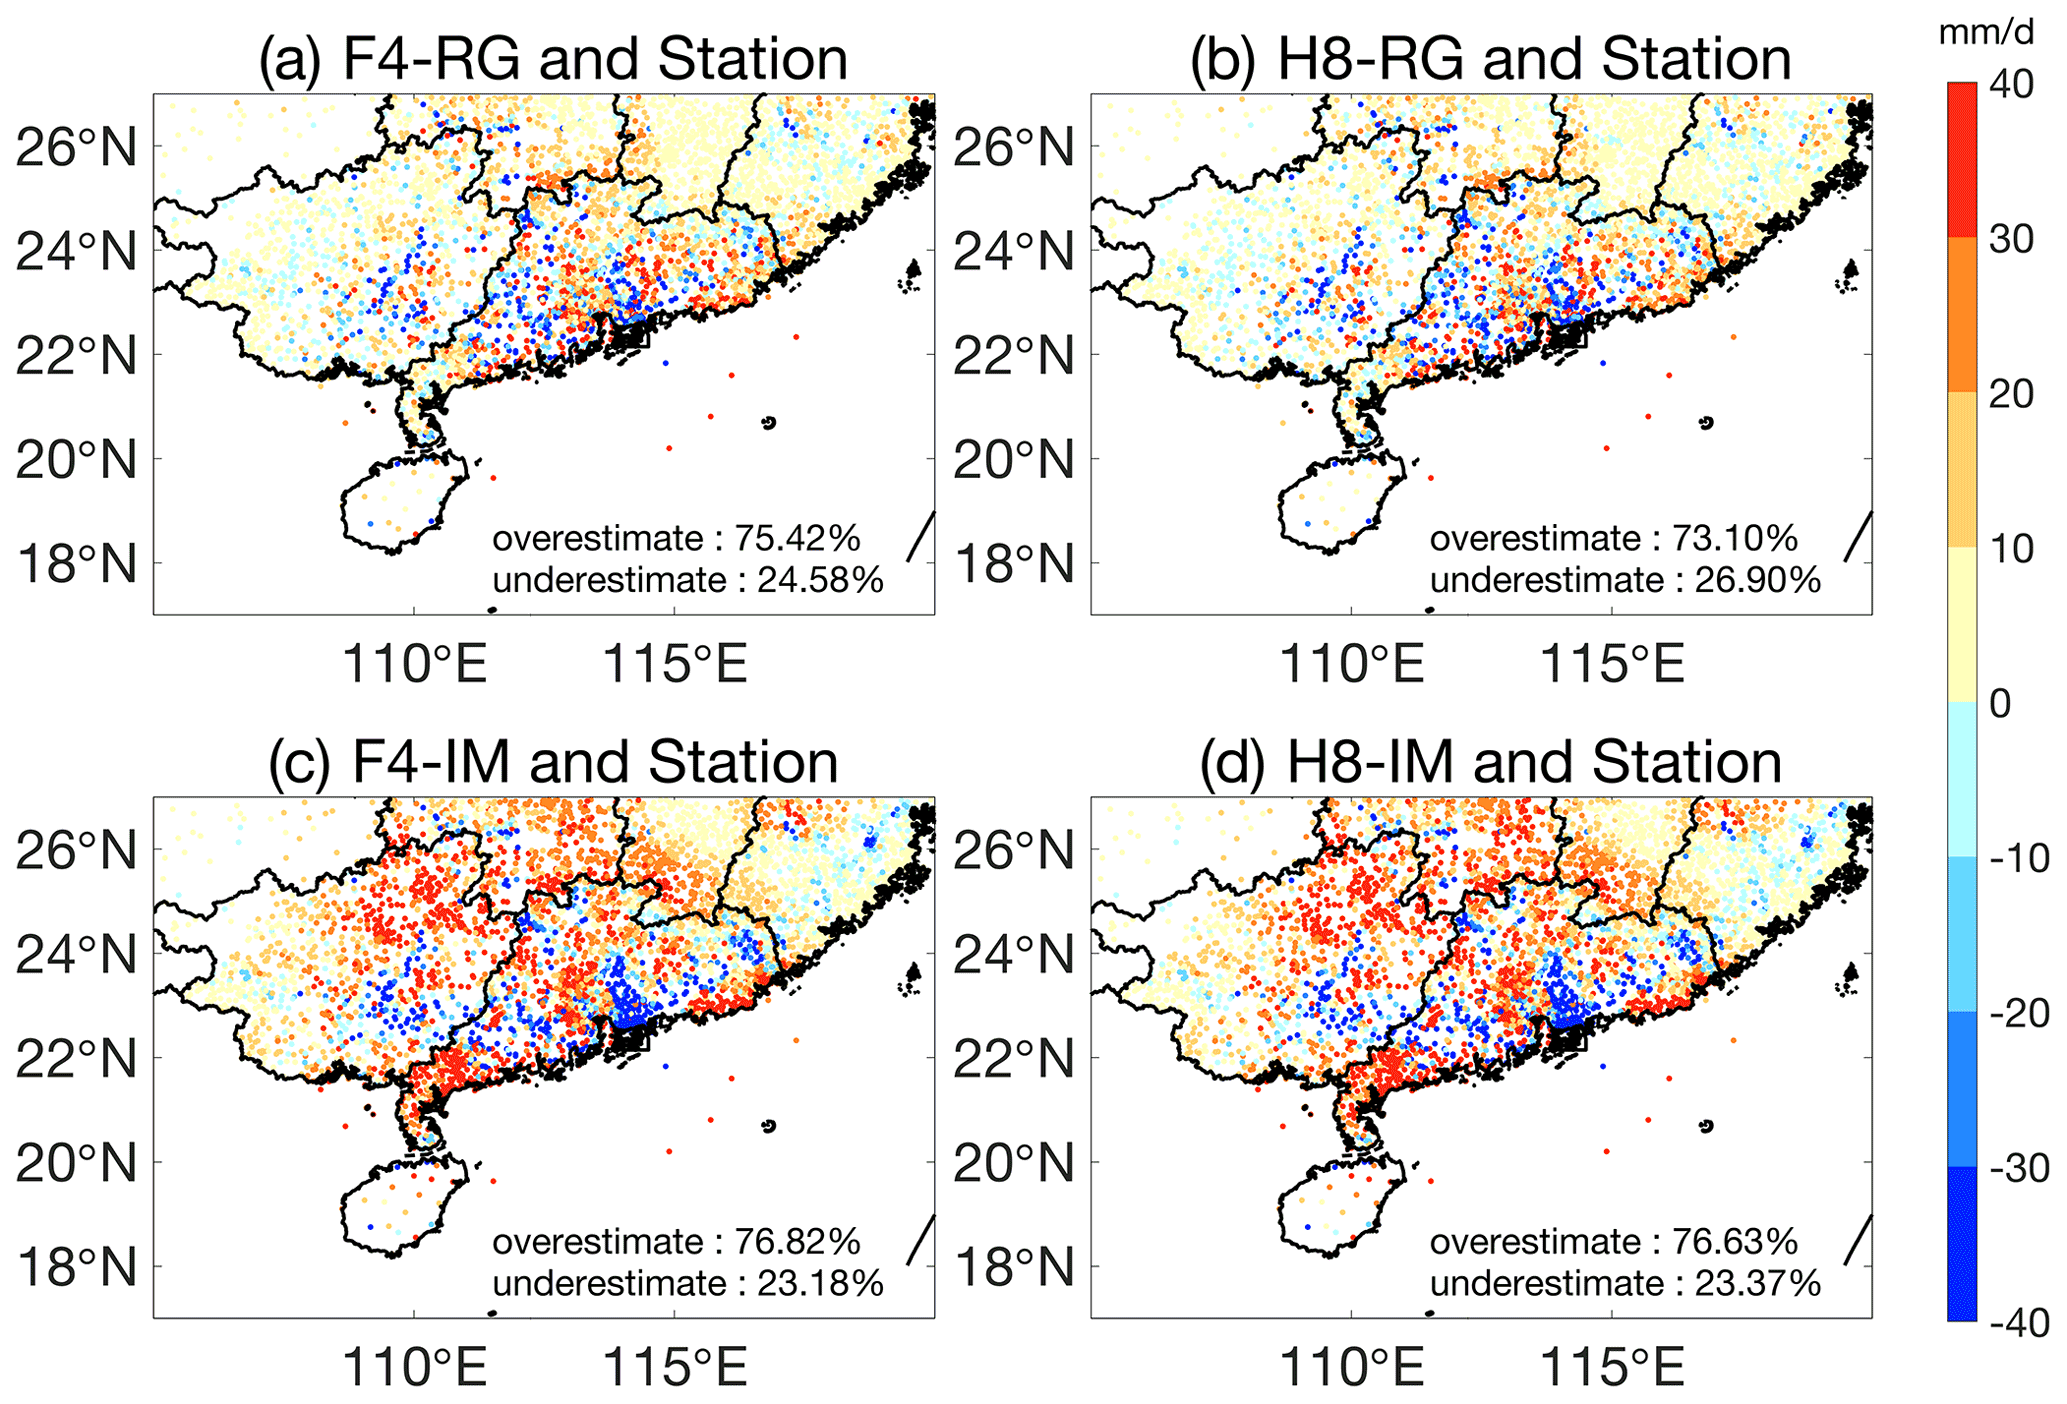
Figure 10Differences in daily precipitation between F4-RG, H8-RG, F4-IM and H8-IM and the ground rain-gauge observations on 16 September 2018.
The spatial distributions of the above biases in our daily surface precipitation integration results are shown in Fig. 10. In general, both the RG-based models and the IM-based models share considerable similarities in their spatial distribution of bias. For the two RG-based models, the average errors at most stations are between −20 and 20 mm d−1, while the errors in the two IM-based models are significantly larger. Moreover, ∼ 75 % of the stations in all four models overestimate the rain rate, which is consistent with the aforementioned analysis of the hourly results.
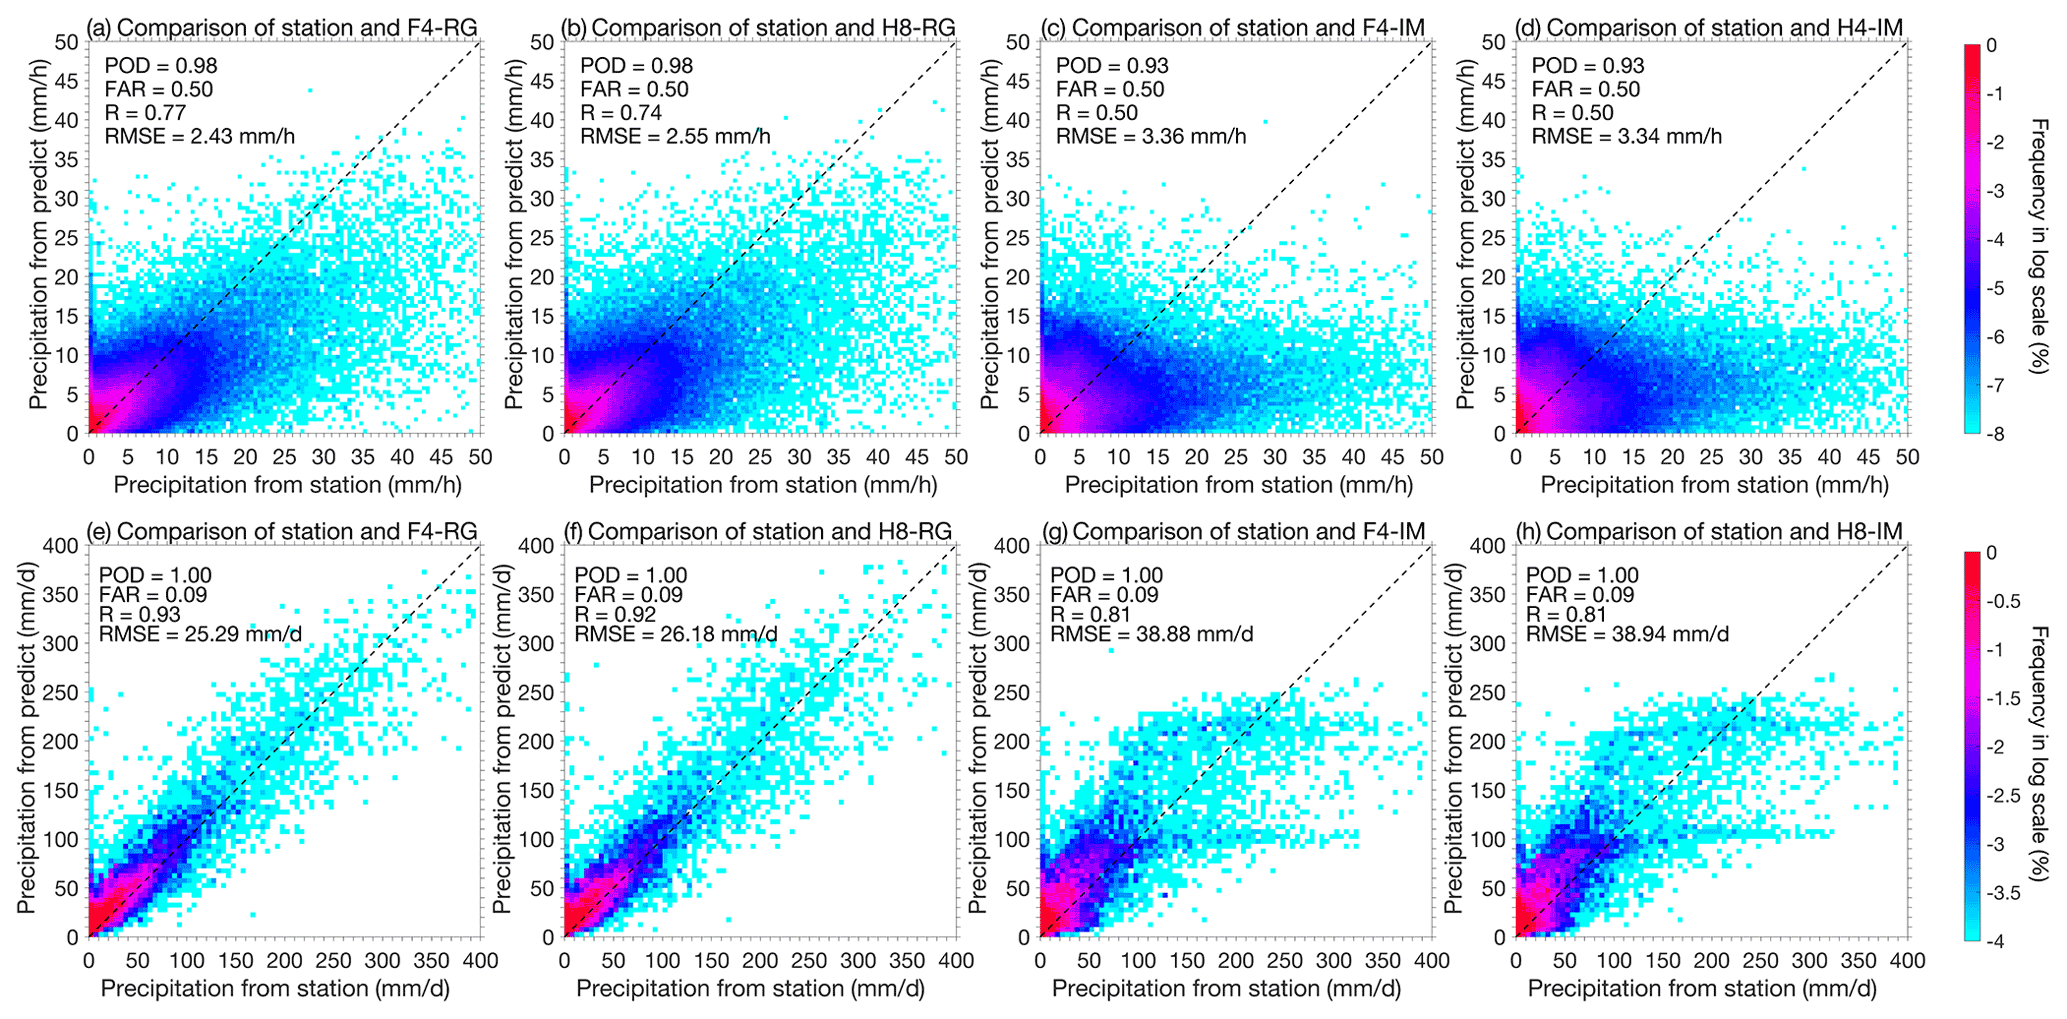
Figure 11Probability density distributions of the hourly (a–d) and daily (e–h) precipitation of F4-RG, H8-RG, F4-IM and H8-IM during three typhoon events. The dotted black line in all panels represents the 1 : 1 line.
For further sample validation, Fig. 11 shows the surface precipitation integration results from our integration models against the ground rain-gauge observations at both hourly (top panels) and daily (bottom panels) scales for all three instants during Typhoon Mangkhut, with the color bars indicating the occurrence frequency on a logarithmic scale at intervals of 0.5 mm h−1 at the hourly scale and 5 mm d−1 at the daily scale. In general, not only at the hourly scale but also at the daily scale, the surface precipitation integration results from the RG-based models show better consistency with the rain-gauge observations than do those from the IM-based models.
For us to better explore the performance of the four surface precipitation integration models over time, Fig. 12 illustrates time series plots of the four evaluation metrics at the hourly scale during the three typhoon events in 2018. The solid and dotted lines represent the RG-based and IM-based models, respectively, and the blue and red lines represent the F4-based and H8-based models. Generally, the RG-based models (F4-RG and H8-RG) perform significantly better than the IM-based models (F4-IM and H8-IM) with relatively better classification metrics (i.e., without apparent fluctuations) and with better statistical metrics. Because the RG-based models use ground rain-gauge observations as the predictor, while the IM-based models use IMERG estimates based on satellite observations as the predictor, the surface precipitation integration results differ greatly between the RG- and IM-based models. In addition, because of the similar satellite observation channels adopted for the model development, the F4- based and H8-based models yield very similar surface precipitation integration results.
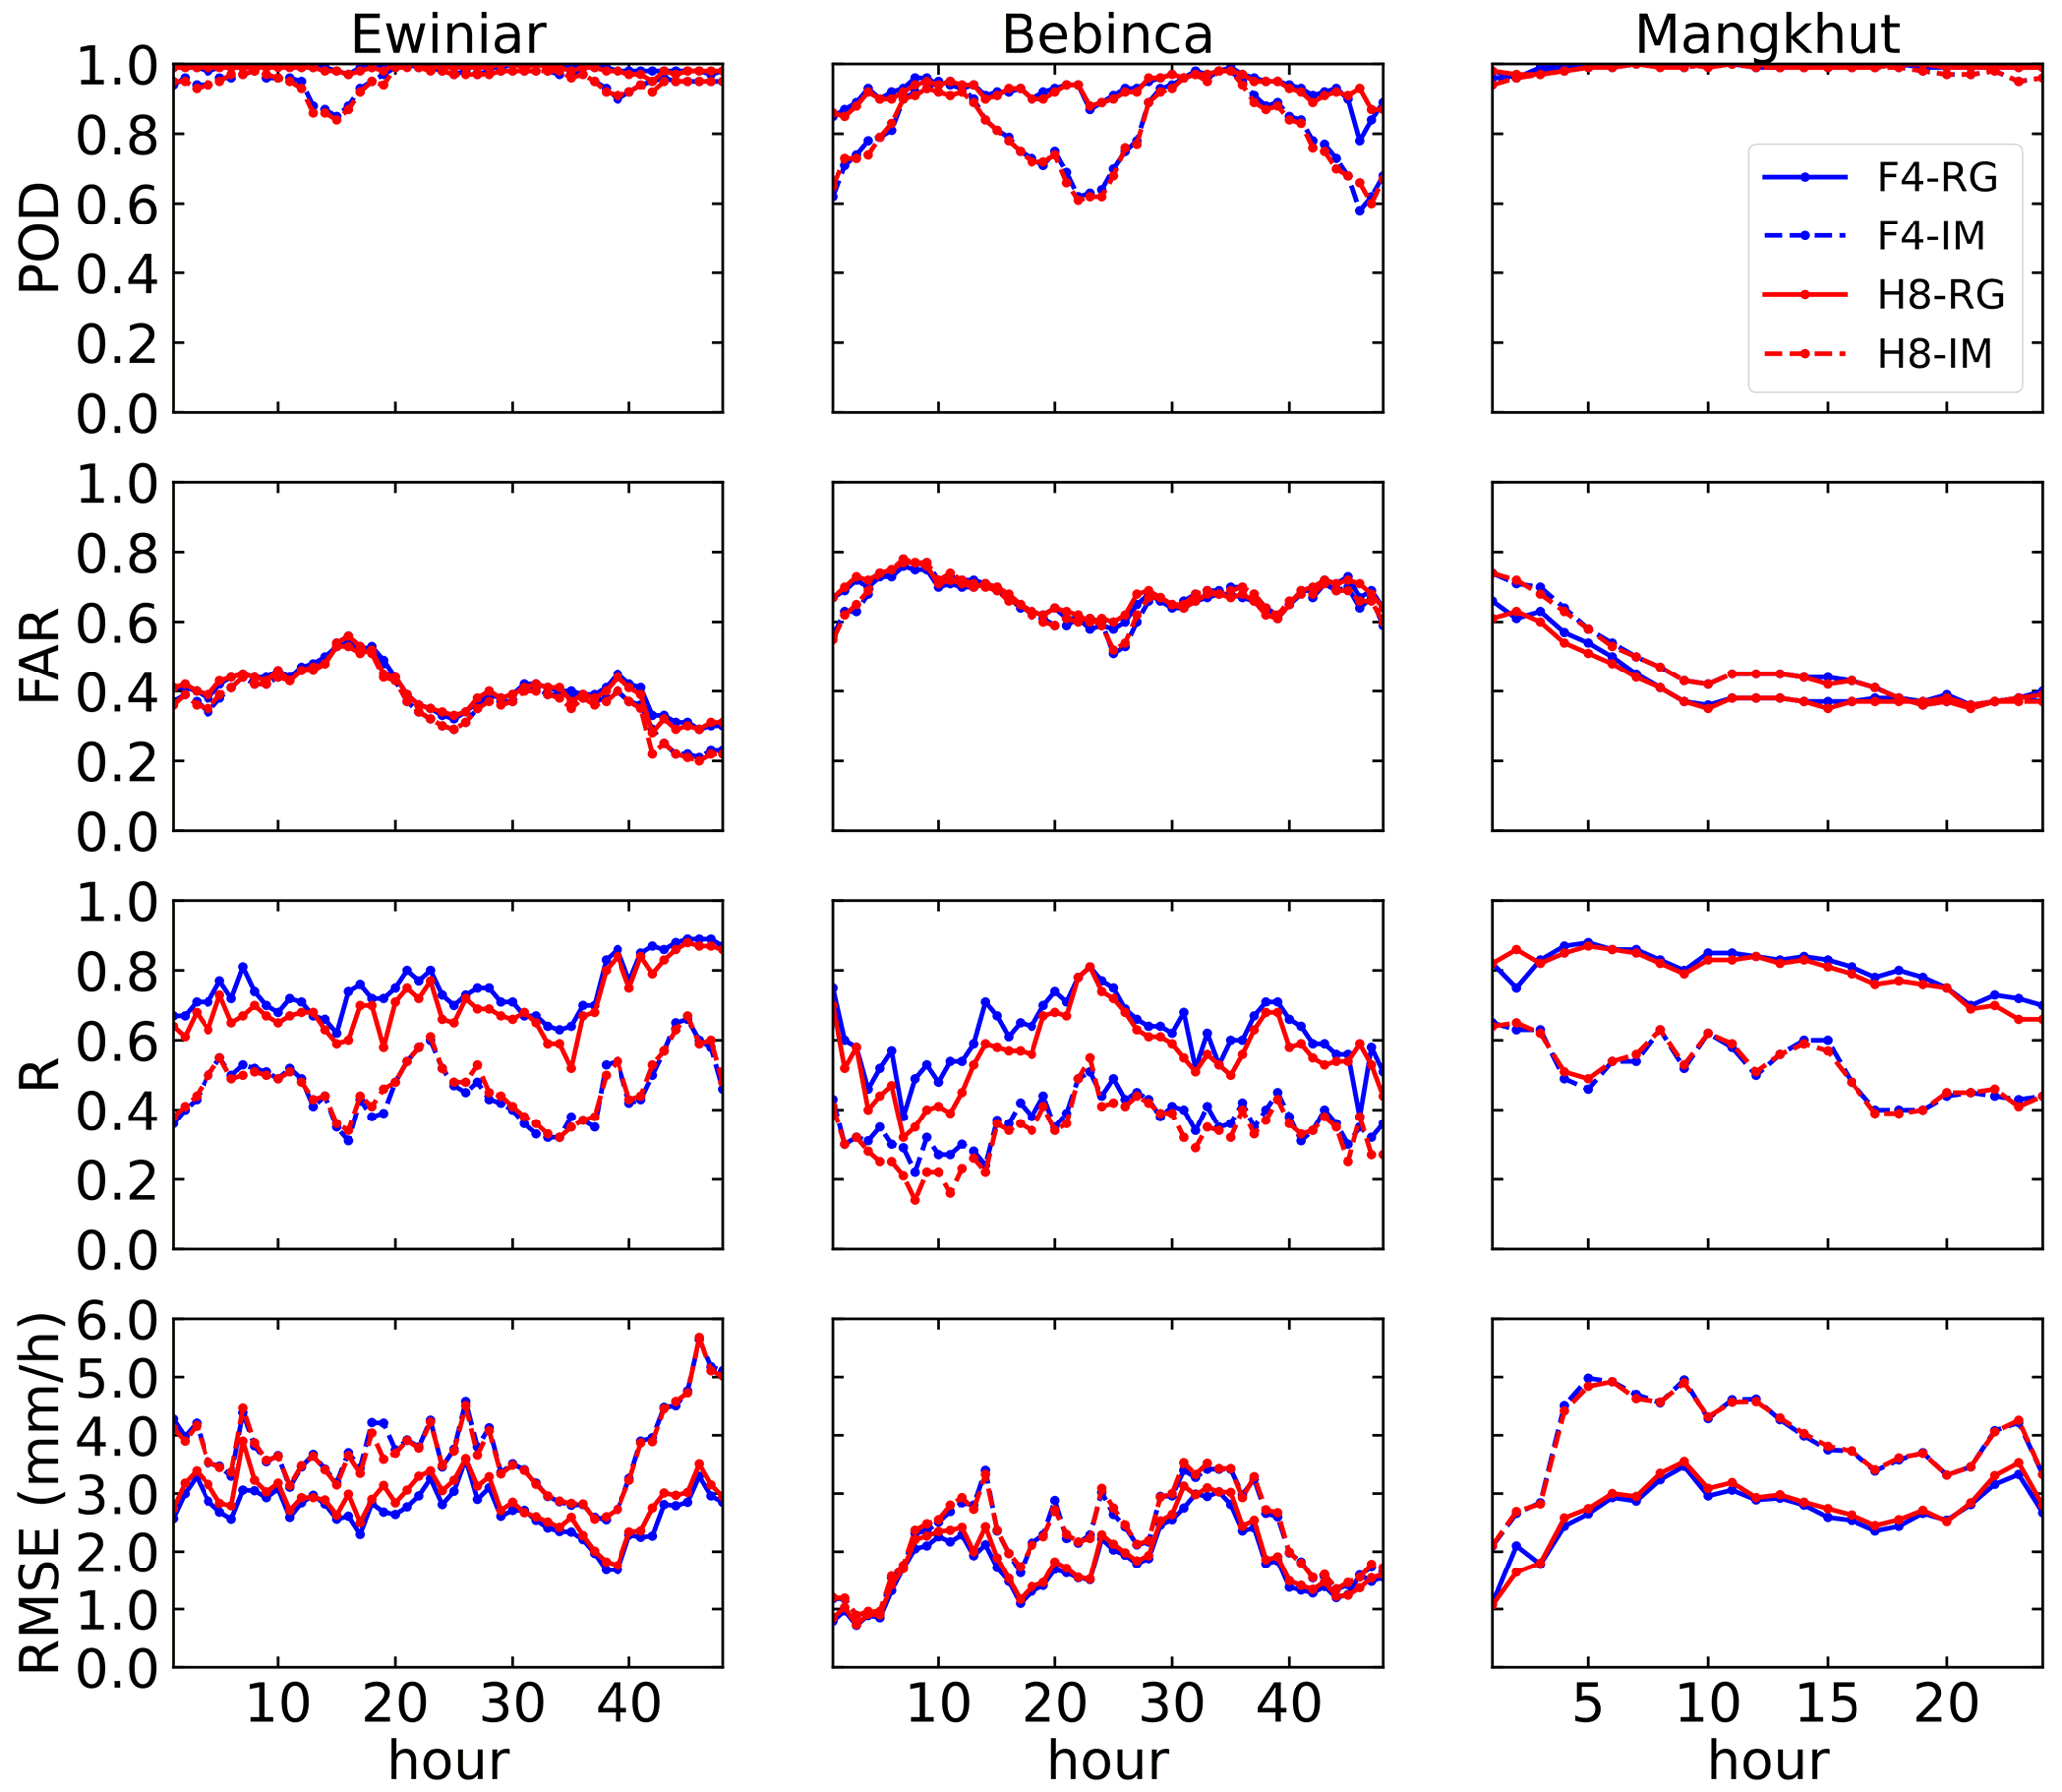
Figure 12Time series plots of the POD, FAR, R and RMSE (mm h−1) from F4-RG, H8-RG, F4-IM and H8-IM throughout the evolution of the three typhoon events.
Note that all surface precipitation integration models performed better during Ewiniar and Mangkhut than during Bebinca, with the former two having higher POD and R values and lower FAR values; this is attributed to the uneven distribution of surface precipitation. As shown in Table 1, there was either light precipitation or no precipitation over most of the land area during Bebinca, accounting for 78 % and 18 %, respectively. Therefore, the surface precipitation integration results of all models are relatively poor for the precipitation process during Bebinca.
This paper proposes an RF-based surface precipitation integration framework for typhoons making landfall that combines geostationary spectral radiometer observations, atmospheric reanalysis data, high-density rain-gauge observations and IMERG estimates. To develop the model, we consider either F4 or H8 observations as the predictor and either rain-gauge observations or IMERG estimates as the predictand, and the performances of four models, i.e., F4-RG, H8-RG, F4-IM, and H8-IM, are systematically evaluated. All four models are capable of capturing precipitation events caused by typhoons making landfall. Regardless of whether hourly precipitation or daily precipitation is used, POD is greater than 0.9, and FAR is approximately 0.5; additionally, the RG-based models (F4-RG and H8-RG) can estimate surface precipitation well. For hourly precipitation, the R values between F4-RG and H8-RG and the ground rain-gauge observations are greater than 0.7, and the RMSE is approximately 2.5 mm h−1. For daily precipitation, the R values between F4-RG and H8-RG and the ground rain-gauge observations are approximately 0.9, and the RMSE is approximately 25 mm d−1. In contrast, while the two IM-based models achieve good success in model development, when the surface precipitation integration results of the two models are compared with the ground rain-gauge observations, the comparison results are obviously worse than those of the RG-based models, which indicates that the ground rain-gauge data are more suitable than IMERG data as ground truth for the development of the typhoon surface precipitation integration algorithm. Nevertheless, despite the excellent performance of our typhoon-only models, the surface precipitation estimates could be further improved by developing and using different models for different precipitation types.
Note that the input variables of the surface precipitation integration models include satellite observations, geographic locations and channel combinations. The key point to establishing surface precipitation integration models is how to accurately discern the nonlinear relationship between the model input variables and precipitation. According to the importance of the variables shown by the RF algorithm used in the model development, TCRW, TP and geographic location rank much higher in importance, which is useful for confirming the accuracy of the surface precipitation integration results for typhoons. Furthermore, considering the complexity and variability of typhoon precipitating cloud systems, the vertical factors of clouds derived by passive microwave sensors (e.g., cloud water vapor profiles, cloud thickness) and the environmental conditions (e.g., wind shear, relative humidity) from a global forecast system should be introduced into the RF model to improve QPE accuracy in the future.
The model in this paper is based on the random forest data package in the Python language, and our implementation and analysis code are available upon request from the corresponding author (chao_liu@nuist.edu.cn).
Fengyun-4A/AGRI data (http://satellite.nsmc.org.cn/PortalSite/Data/Satellite.aspx, last access: 20 November 2021; FENGYUN Satellite Data Center, 2021) and Himawari-8/AHI data (https://www.eorc.jaxa.jp/ptree/index.html, last access: 20 June 2021; Meteorological Satellite Center, 2021) were used to establish the surface precipitation integration models. IMERG data (https://gpm.nasa.gov/data/directory, last access: 20 June 2021; NASA, 2021) were used as predictands of the surface precipitation integration algorithm. The data of high-density automatic stations are not available to the public. Please direct any inquiries regarding the data to the corresponding author (chao_liu@nuist.edu.cn). ERA5 reanalysis data used to establish the surface precipitation integration models are from the Copernicus Climate Change Service (https://cds.climate.copernicus.eu/cdsapp#!/dataset/reanalysis-era5-single-levels?tab=overview, last access: 20 November 2021; Copernicus Climate Change Service, 2021).
CL was responsible for conceptualization, supervision and funding acquisition. YZ developed the software and prepared the original draft. YZ and CL developed the methodology and carried out formal analysis. YZ and DD were responsible for data curation and validation. CL, DD, ZM and ST reviewed and edited the article.
The contact author has declared that neither they nor their co-authors have any competing interests.
Publisher’s note: Copernicus Publications remains neutral with regard to jurisdictional claims in published maps and institutional affiliations.
We would like to express our gratitude to the CMA National Satellite Meteorological Center (NSMC), the Japan Aerospace Exploration Agency (JAXA) and the National Aeronautics and Space Administration (NASA) for providing the AGRI, AHI and IMERG products. We also thank CMA for providing the surface precipitation observations. We acknowledge the High Performance Computing Center of Nanjing University of Information Science & Technology for their support of this work.
This research has been supported by the National Natural Science Foundation of China (grant nos. 42122038 and 41975025).
This paper was edited by Simone Lolli and reviewed by two anonymous referees.
Ahmed, K., Sachindra, D. A., Shahid, S., Iqbal, Z., Nawaz, N., and Khan, N.: Multi-model ensemble predictions of precipitation and temperature using machine learning algorithms, Atmos. Res., 236, 104806, https://doi.org/10.1016/j.atmosres.2019.104806, 2020.
Albawi, S., Mohammed, T. A., and Al-Zawi, S.: Understanding of a convolutional neural network, 2017 International Conference on Engineering and Technology (ICET), 21–23 August 2017, Antalya, Turkey, IEEE, https://doi.org/10.1109/ICEngTechnol.2017.8308186, 2017.
Aonashi, K., Awaka, J., Hirose, M., Kozu, T., Kubota, T., Liu, G., and Takayabu, Y. N.: GSMaP passive microwave precipitation retrieval algorithm: Algorithm description and validation, J. Meteorol. Soc. Jpn. Ser. II, 87, 119–136, https://doi.org/10.2151/jmsj.87A.119, 2009.
Baez-Villanueva, O. M., Zambrano-Bigiarini, M., Beck, H. E., McNamara, I., Ribbe, L., Nauditt, A., and Thinh, N. X.: RF-MEP: A novel Random Forest method for merging gridded precipitation products and ground-based measurements, Remote Sens. Environ., 239, 111606, https://doi.org/10.1016/j.rse.2019.111606, 2020.
Bárdossy, A. and Pegram, G.: Combination of radar and daily precipitation data to estimate meaningful sub-daily point precipitation extremes, J. Hydrol., 544, 397–406, https://doi.org/10.1016/j.jhydrol.2016.11.039, 2017.
Bessho, K., Date, K., Hayashi, M., Ikeda, A., Imai, T., Inoue, H., and Yoshida, R.: An introduction to Himawari-8/9 – Japan's new-generation geostationary meteorological satellites, J. Meteorol. Soc. Jpn. Ser. II, 94, 151–183, https://doi.org/10.2151/jmsj.2016-009, 2016.
Boushaki, F. I., Hsu, K. L., Sorooshian, S., Park, G. H., Mahani, S., and Shi, W.: Bias adjustment of satellite precipitation estimation using ground-based measurement: A case study evaluation over the southwestern United States, J. Hydrometeorol., 10, 1231–1242, https://doi.org/10.1175/2009JHM1099.1, 2009.
Chan, J. C.: Interannual and interdecadal variations of tropical cyclone activity over the western North Pacific, Meteorol. Atmos. Phys., 89, 143–152, https://doi.org/10.1007/s00703-005-0126-y, 2005.
Chen, S., Yang, Y., Deng, F., Zhang, Y., Liu, D., Liu, C., and Gao, Z.: A high-resolution monitoring approach of canopy urban heat island using a random forest model and multi-platform observations, Atmos. Meas. Tech., 15, 735–756, https://doi.org/10.5194/amt-15-735-2022, 2022.
Copernicus Climate Change Service: ERA5 hourly data on single levels from 1979 to present, Copernicus Climate Change Service [data set], https://cds.climate.copernicus.eu/cdsapp#!/dataset/reanalysis-era5-single-levels?tab=overview, last access: 20 November 2021.
Ebert, E. E., Janowiak, J. E., and Kidd, C.: Comparison of near-real-time precipitation estimates from satellite observations and numerical models, B. Am. Meteorol. Soc., 88, 47–64, https://doi.org/10.1175/BAMS-88-1-47, 2007.
Ehsan Bhuiyan, M. A., Nikolopoulos, E. I., and Anagnostou, E. N.: Machine learning-based blending of satellite and reanalysis precipitation datasets: A multiregional tropical complex terrain evaluation, J. Hydrometeorol., 20, 2147–2161, https://doi.org/10.1175/JHM-D-19-0073.1, 2019.
Emanuel, K. A.: Downscaling CMIP5 climate models shows increased tropical cyclone activity over the 21st century, P. Natl. Acad. Sci. USA, 110, 12219–12224, https://doi.org/10.1073/pnas.1301293110, 2013.
FENGYUN Satellite Data Center: AGRI L1 Full Disk, 4KM, FENGYUN Satellite Data Center, National Satellite Meteorological Center of China Meteorological Administration [data set], http://satellite.nsmc.org.cn/PortalSite/Data/Satellite.aspx, last access: 20 November 2021.
Gebregiorgis, A. S., Kirstetter, P. E., Hong, Y. E., Gourley, J. J., Huffman, G. J., Petersen, W. A., Xue, X., and Schwaller, M. R.: To what extent is the day 1 GPM IMERG satellite precipitation estimate improved as compared to TRMM TMPA‐RT?, J. Geophys. Res.-Atmos., 123, 1694–1707, https://doi.org/10.1002/2017JD027606, 2018.
Gires, A., Onof, C., Maksimovic, C., Schertzer, D., Tchiguirinskaia, I., and Simoes, N.: Quantifying the impact of small scale unmeasured rainfall variability on urban runoff through multifractal downscaling: A case study, J. Hydrol., 442, 117–128, https://doi.org/10.1016/j.jhydrol.2012.04.005, 2012.
Guo, B., Zhang, D., Pei, L., Su, Y., Wang, X., Bian, Y., and Guo, L.: Estimating PM2.5 concentrations via random forest method using satellite, auxiliary, and ground-level station dataset at multiple temporal scales across China in 2017, Sci. Total Environ., 778, 146288, https://doi.org/10.1016/j.scitotenv.2021.146288, 2021.
Hersbach, H., Bell, B., Berrisford, P., Hirahara, S., Horányi, A., Muñoz-Sabater, J., and Thépaut, J. N.: The ERA5 global reanalysis, Q. J. Roy. Meteor. Soc., 146, 1999–2049, https://doi.org/10.1002/qj.3803, 2020.
Ho, C. H., Baik, J. J., Kim, J. H., Gong, D. Y., and Sui, C. H.: Interdecadal changes in summertime typhoon tracks, J. Climate, 17, 1767–1776, https://doi.org/10.1175/1520-0442(2004)017<1767:ICISTT>2.0.CO;2, 2004.
Honda, T., Miyoshi, T., Lien, G. Y., Nishizawa, S., Yoshida, R., Adachi, S. A., and Bessho, K.: Assimilating all-sky Himawari-8 satellite infrared radiances: A case of Typhoon Soudelor (2015), Mon. Weather Rev., 146, 213–229, https://doi.org/10.1175/MWR-D-16-0357.1, 2018.
Huffman, G. J., Bolvin, D. T., Nelkin, E. J., Wolff, D. B., Adler, R. F., Gu, G., and Stocker, E. F.: The TRMM Multisatellite Precipitation Analysis (TMPA): Quasi-global, multiyear, combined-sensor precipitation estimates at fine scales, J. Hydrometeorol., 8, 38–55, https://doi.org/10.1175/JHM560.1, 2007.
Joyce, R. J., Janowiak, J. E., Arkin, P. A., and Xie, P.: CMORPH: A method that produces global precipitation estimates from passive microwave and infrared data at high spatial and temporal resolution, J. Hydrometeorol., 5, 487–503, https://doi.org/10.1175/1525-7541(2004)005<0487:CAMTPG>2.0.CO;2, 2004.
Jozaghi, A., Nabatian, M., Noh, S., Seo, D. J., Tang, L., and Zhang, J.: Improving multisensor precipitation estimation via adaptive conditional bias–penalized merging of rain gauge data and remotely sensed quantitative precipitation estimates, J. Hydrometeorol., 20, 2347–2365, https://doi.org/10.1175/JHM-D-19-0129.1, 2019.
Kang, N. Y. and Elsner, J. B.: Climate mechanism for stronger typhoons in a warmer world, J. Climate, 29, 1051–1057, https://doi.org/10.1175/JCLI-D-15-0585.1, 2016.
Kühnlein, M., Appelhans, T., Thies, B., and Nauß, T.: Precipitation estimates from MSG SEVIRI daytime, nighttime, and twilight data with random forests, J. Appl. Meteorol. Clim., 53, 2457–2480, https://doi.org/10.1175/JAMC-D-14-0082.1, 2014.
Li, X., Yang, Y., Mi, J., Bi, X., Zhao, Y., Huang, Z., Liu, C., Zong, L., and Li, W.: Leveraging machine learning for quantitative precipitation estimation from Fengyun-4 geostationary observations and ground meteorological measurements, Atmos. Meas. Tech., 14, 7007–7023, https://doi.org/10.5194/amt-14-7007-2021, 2021.
Liu, C., Yang, S., Di, D., Yang, Y., Zhou, C., Hu, X., and Sohn, B. J.: A Machine Learning-based Cloud Detection Algorithm for the Himawari-8 Spectral Image, Adv. Atmos. Sci., 1–14, https://doi.org/10.1007/s00376-021-0366-x, 2021.
Liu, Z.: Comparison of integrated multisatellite retrievals for GPM (IMERG) and TRMM multisatellite precipitation analysis (TMPA) monthly precipitation products: initial results, J. Hydrometeorol., 17, 777–790, https://doi.org/10.1175/JHM-D-15-0068.1, 2016.
Looper, J. P. and Vieux, B. E.: An assessment of distributed flash flood forecasting accuracy using radar and rain gauge input for a physics-based distributed hydrologic model, J. Hydrol., 412, 114–132, https://doi.org/10.1016/j.jhydrol.2011.05.046, 2012.
Ma, Z., Li, J., Han, W., Li, Z., Zeng, Q., Menzel, W. P., and Liu, C. Y.: Four-Dimensional Wind Fields From Geostationary Hyperspectral Infrared Sounder Radiance Measurements With High Temporal Resolution, Geophys. Res. Lett., 48, e2021GL093794, https://doi.org/10.1029/2021GL093794, 2021.
Marra, F. and Morin, E.: Use of radar QPE for the derivation of Intensity–Duration–Frequency curves in a range of climatic regimes, J. Hydrol., 531, 427–440, https://doi.org/10.1016/j.jhydrol.2015.08.064, 2015.
Mecikalski, J. R., Bedka, K. M., Paech, S. J., and Litten, L. A.: A statistical evaluation of GOES cloud-top properties for nowcasting convective initiation, Mon. Weather Rev., 136, 4899–4914, https://doi.org/10.1175/2008MWR2352.1, 2008.
Meteorological Satellite Center: AHI L1 Full Disk, 5KM, Japan Meteorological Agency (JMA) [data set], https://www.eorc.jaxa.jp/ptree/index.html, last access: 20 June 2021.
Min, M., Wu, C., Li, C., Liu, H., Xu, N., Wu, X., and Dong, L.: Developing the science product algorithm testbed for Chinese next-generation geostationary meteorological satellites: Fengyun-4 series, J. Meteorol. Res., 31, 708–719, https://doi.org/10.1007/s13351-017-6161-z, 2017.
Min, M., Bai, C., Guo, J., Sun, F., Liu, C., Wang, F., and Li, J.: Estimating summertime precipitation from Himawari-8 and global forecast system based on machine learning, IEEE T. Geosci. Remote, 57, 2557–2570, 2018.
National Aeronautics and Space Administration (NASA): IMERG Final run data, National Aeronautics and Space Administration [data set], https://gpm.nasa.gov/data/directory, last access: 20 June 2021.
Negri, A. J., Burkardt, N., Golden, J. H., Halverson, J. B., Huffman, G. J., Larsen, M. C., and Wieczorek, G. F.: The hurricane–flood–landslide continuum, B. Am. Meteorol. Soc., 86, 1241–1247, https://www.jstor.org/stable/26221353 (last access: 13 May 2021), 2005.
Nguyen, P., Ombadi, M., Sorooshian, S., Hsu, K., AghaKouchak, A., Braithwaite, D., Ashouri, H., and Thorstensen, A. R.: The PERSIANN family of global satellite precipitation data: a review and evaluation of products, Hydrol. Earth Syst. Sci., 22, 5801–5816, https://doi.org/10.5194/hess-22-5801-2018, 2018.
Ochoa-Rodriguez, S., Wang, L. P., Willems, P., and Onof, C.: A review of radar-rain gauge data merging methods and their potential for urban hydrological applications, Water Resour. Res., 55, 6356–6391, https://doi.org/10.1029/2018WR023332, 2019.
Rappaport, E. N.: Fatalities in the United States from Atlantic tropical cyclones: New data and interpretation, B. Am. Meteorol. Soc., 95, 341–346, https://doi.org/10.1175/BAMS-D-12-00074.1, 2014.
Sehad, M., Lazri, M., and Ameur, S.: Novel SVM-based technique to improve rainfall estimation over the Mediterranean region (north of Algeria) using the multispectral MSG SEVIRI imagery, Adv. Space Res., 59, 1381–1394, https://doi.org/10.1016/j.asr.2016.11.042, 2017.
Su, S. H., Kuo, H. C., Hsu, L. H., and Yang, Y. T.: Temporal and spatial characteristics of typhoon extreme rainfall in Taiwan, J. Meteorol. Soc. Jpn. Ser. II, 90, 721–736, https://doi.org/10.2151/jmsj.2012-510, 2012.
Tan, Z., Liu, C., Ma, S., Wang, X., Shang, J., Wang, J., and Yan, W.: Detecting Multilayer Clouds From the Geostationary Advanced Himawari Imager Using Machine Learning Techniques, IEEE T. Geosci. Remote, 60, 1–12, https://doi.org/10.1109/TGRS.2021.3087714, 2021.
Tang, G., Ma, Y., Long, D., Zhong, L., and Hong, Y.: Evaluation of GPM Day-1 IMERG and TMPA Version-7 legacy products over Mainland China at multiple spatiotemporal scales, J. Hydrol., 533, 152–167, https://doi.org/10.1016/j.jhydrol.2015.12.008, 2016.
Tu, J. Y. and Chou, C.: Changes in precipitation frequency and intensity in the vicinity of Taiwan: typhoon versus non-typhoon events, Environ. Res. Lett., 8, 014023, https://doi.org/10.1088/1748-9326/8/1/014023, 2013.
Ushio, T., Sasashige, K., Kubota, T., Shige, S., Okamoto, K. I., Aonashi, K., and Kawasaki, Z. I.: A Kalman filter approach to the Global Satellite Mapping of Precipitation (GSMaP) from combined passive microwave and infrared radiometric data, J. Meteorol. Soc. Jpn. Ser. II, 87, 137–151, https://doi.org/10.2151/jmsj.87A.137, 2009.
Villarini, G., Mandapaka, P. V., Krajewski, W. F., and Moore, R. J.: Rainfall and sampling uncertainties: A rain gauge perspective, J. Geophys. Res.-Atmos., 113, D11102, https://doi.org/10.1029/2007JD009214, 2008.blackboxPlease provide page range or article number with DOI.
Wang, C., Tang, G., Han, Z., Guo, X., and Hong, Y.: Global intercomparison and regional evaluation of GPM IMERG Version-03, Version-04 and its latest Version-05 precipitation products: Similarity, difference and improvements, J. Hydrol., 564, 342–356, https://doi.org/10.1016/j.jhydrol.2018.06.064, 2018.
Wang, C., Tang, G., Xiong, W., Ma, Z., and Zhu, S.: Infrared Precipitation Estimation using Convolutional neural network for FengYun satellites, J. Hydrol., 603, 127113, https://doi.org/10.1016/j.jhydrol.2021.127113, 2021.
Wang, H., Xu, M., Onyejuruwa, A., Wang, Y., Wen, S., Gao, A. E., and Li, Y.: Tropical cyclone damages in Mainland China over 2005–2016: Losses analysis and implications, Environ. Dev. Sustain., 21, 3077–3092, https://doi.org/10.1007/s10668-019-00481-7, 2019.
Wang, R., Chen, J., and Wang, X.: Comparison of IMERG Level-3 and TMPA 3B42V7 in estimating typhoon-related heavy rain, Water, 9, 276, https://doi.org/10.3390/w9040276, 2017.
Webster, P. J., Holland, G. J., Curry, J. A., and Chang, H. R.: Changes in tropical cyclone number, duration, and intensity in a warming environment, Science, 309, 1844–1846, https://doi.org/10.1126/science.1116448, 2005.
Zhang, L., Li, X., Zheng, D., Zhang, K., Ma, Q., Zhao, Y., and Ge, Y.: Merging multiple satellite-based precipitation products and gauge observations using a novel double machine learning approach, J. Hydrol., 594, 125969, https://doi.org/10.1016/j.jhydrol.2021.125969, 2021.
- Abstract
- Introduction
- Data and study area
- RF-based typhoon precipitation integration frameworks
- Typhoon precipitation integration performance
- Summary
- Code availability
- Data availability
- Author contributions
- Competing interests
- Disclaimer
- Acknowledgements
- Financial support
- Review statement
- References