the Creative Commons Attribution 4.0 License.
the Creative Commons Attribution 4.0 License.
 | 09 May 2022
Fragment ion–functional group relationships in organic aerosols using aerosol mass spectrometry and mid-infrared spectroscopy
Amir Yazdani
Nikunj Dudani
Satoshi Takahama
Amelie Bertrand
André S. H. Prévôt
Ann M. Dillner
Aerosol mass spectrometry (AMS) and mid-infrared spectroscopy (MIR) are two analytical methods for characterizing the chemical composition of organic matter (OM). While AMS provides high-temporal-resolution bulk measurements, the extensive fragmentation during the electron ionization makes the characterization of OM components limited. The analysis of aerosols collected on polytetrafluoroethylene (PTFE) filters using MIR, on the other hand, provides functional group information with reduced sample alteration but results in a relatively low temporal resolution. In this work, we compared and combined MIR and AMS measurements for several environmental chamber experiments of combustion-related aerosols to achieve a better understanding of the AMS spectra and the OM chemical evolution with aging. Fresh emissions of wood and coal burning were injected into an environmental simulation chamber and aged with hydroxyl and nitrate radicals. A high-resolution time-of-flight AMS measured the bulk chemical composition of fine OM. Fine aerosols were also sampled on PTFE filters before and after aging for the offline MIR analysis. After comparing AMS and MIR bulk measurements, we used multivariate statistics to identify the functional groups associated the most with the AMS OM for different aerosol sources and oxidants. We also identified the key fragment ions resulting from molecules containing each functional group for the complex OM generated from biomass and fossil fuel combustion. Finally, we developed a statistical model that enables the estimation of the high-time-resolution functional group composition of OM using collocated AMS and MIR measurements. AMS spectra can be used to interpolate the functional group measurements by MIR using this approach. The latter allows us to better understand the evolution of OM during the aging process.
- Article
(3204 KB) - Full-text XML
- Companion paper
-
Supplement
(1275 KB) - BibTeX
- EndNote


Particulate matter (PM) impacts visibility, climate, and human health (Hallquist et al., 2009). Organic matter (OM), which accounts for an important fraction of total fine atmospheric PM mass, has profound effects on aerosol-related phenomena (Turpin and Lim, 2001; Russell, 2003; Shiraiwa et al., 2017). Characterizing the organic fraction is necessary to reduce the uncertainties associated with the impact of PM and can in turn affect the policies related to climate change and air quality management (Zhang et al., 2011; Turpin and Lim, 2001). Nonetheless, the chemical composition of OM and its formation mechanisms have not yet been fully understood due to their complexity.
Different analytical and computational techniques exist for the determination of the chemical composition of OM and especially secondary organic aerosols (SOAs). Modeling all important SOA-related reactions and species is not feasible for three-dimensional models (Jathar et al., 2015), and simple models do not always reproduce the measured concentrations of OM (Volkamer et al., 2006; Theodoritsi et al., 2021). Among the analytical techniques, aerosol mass spectrometry (AMS) and mid-infrared (MIR) spectroscopy are able to provide bulk chemical information for most of the OM mass (Hallquist et al., 2009).
AMS provides information about the chemical composition of OM and its temporal variations in terms of ensemble mass spectra acquired over short time intervals (Zhang et al., 2011). Aerodyne Research aerosol mass spectrometer (used in this work and referred to as “AMS”) is the most widely used thermal-desorption-based mass spectrometer in aerosol research. AMS is capable of quantifying non-refractory species (e.g., sulfate, nitrate, ammonium, chloride, and OM) by thermal vaporization (typically at 600 ∘C) and electron ionization (EI; typically at 70 eV) (Canagaratna et al., 2007). In spite of the valuable information that AMS provides, the AMS OM fragment ions are not molecule-specific, and AMS spectra are difficult to interpret due to the extensive fragmentation of molecules with the high-energy electron ionization and flash vaporization. This limits the level of molecular details that can be extracted from the AMS mass spectra (Canagaratna et al., 2007; Kumar et al., 2018; Faber et al., 2017; Chhabra et al., 2011). OM components can also undergo oxidation, dehydration, and/or decarboxylation reactions inside the AMS ionization chamber (Canagaratna et al., 2015). In addition, uncertainties regarding the relative ionization efficiency (Xu et al., 2018), fragmentation tables (Aiken et al., 2008), the gas-phase interference (Canagaratna et al., 2015), and the collection efficiency (Frossard et al., 2014) have been reported. There are soft ionization methods such as electrospray ionization (ESI) and chemical ionization (CI) that minimize the analyte fragmentation at the expense of the variable ionization efficiency and the signal-to-noise ratio (Lopez-Hilfiker et al., 2019; Nozière et al., 2015; Iyer et al., 2016; Zahardis et al., 2011).
MIR spectroscopy, which is commonly performed off-line on polytetrafluoroethylene (PTFE) filters (Maria et al., 2002; Takahama et al., 2013; Ruthenburg et al., 2014), is used as a complementary method to AMS in this work. This non-destructive method gives direct functional group information, provides measurements consistent with commonly used instruments in monitoring networks (Boris et al., 2019), and is capable of differentiating between the composition of different oxidized OMs. For example, Liu et al. (2012) observed very similar AMS mass spectra for several SOA samples, while the complementary MIR spectra indicated clear chemical differences for these aerosols. In addition to functional group quantification, MIR spectroscopy has been recently used to quantify biomass burning markers in the atmospheric aerosols (levoglucosan and lignin-like compounds; Yazdani et al., 2021b). However, MIR spectroscopy on filters has low temporal resolution compared to online instruments such as AMS (Faber et al., 2017; Yazdani et al., 2021b). Moreover, the volatilization of volatile organic compounds from PTFE filters during or after the sampling period can affect the OM mass and composition (Subramanian et al., 2004). Uncertainties regarding the variable absorptivities of different organic molecules (Hastings et al., 1952), peak overlaps (Pavia et al., 2008), light scattering by the filter membrane, and the PTFE interference (Takahama et al., 2013) have also been reported for this technique.
Past studies compared AMS and MIR OM, O:C, and positive matrix factorization (PMF) factors in field campaigns (Gilardoni et al., 2009; Russell et al., 2009b; Frossard et al., 2011; Liu et al., 2011; Corrigan et al., 2013; Frossard et al., 2014) and reported reasonable agreement between the instruments despite the aforementioned uncertainties. Two controlled laboratory studies tried to understand the relationship between fragment ions and functional groups (Faber et al., 2017; Russell et al., 2009a) using univariate correlations. In this work, we compare and combine AMS and MIR measurements for the OM of moderate to high complexity from biomass burning and coal combustion emissions, two major sources of atmospheric OM, in an environmental simulation chamber. We apply additional uni- and multivariate techniques to further interpret the relationships between more than 300 AMS fragment ions and 4 MIR functional groups, as well as to provide a method to predict the high-time-resolution evolution of functional groups using only AMS spectra.
In the following sections, the experimental setup (Sect. 2.1) and online and off-line measurement techniques (Sect. 2.2 and 2.3) are described. Thereafter, statistical methods used for combining AMS and MIR measurements are explained (Sect. 2.4–2.6). The experimental setup, procedure, and data used in this work are the same as those reported by Yazdani et al. (2021b).
2.1 Laboratory experimental setup and procedure
Briefly, we conducted four wood burning (WB) experiments with beech wood logs and five coal combustion (CC) experiments with bituminous coal using ordinary modern stoves (Bruns et al., 2015). The emissions were diluted and then injected into a 6 m3 Teflon bag environmental chamber at the Paul Scherrer Institute (PSI) in Villigen, Switzerland. The emissions were held in the chamber for 30 min after injection to improve mixing. Thereafter, primary emissions were chemically aged using the hydroxyl or nitrate radical in order to simulate daytime and nighttime aging mechanisms, respectively. For the diurnal aging simulations, the OH radical was produced by the photolysis of HONO, and the OH exposures reached (2–3) ×107 molec. cm−3 h (measured using butanol-d9; Barmet et al., 2012) corresponding to 20–30 h of aging in the atmosphere. For the nocturnal aging experiments, the NO3 radical was produced by a single injection of O3 and NO2 in the chamber. The nitrate radical concentration was estimated to be (1.5–2.5) ×107 molec. cm−3 for the first hour of the aging process based on the phenol concentration decay in the gas phase. There are in total four experiment categories (two different fuels and oxidants indicated by WB_OH, WB_NO3, CC_OH, and CC_NO3) with one to three similar experiments in each category.
2.2 Online AMS PM measurements
Non-refractory particle composition was measured with a high-resolution time-of-flight (HR-TOF) AMS operating in V mode (mass resolution for 200; DeCarlo et al., 2006) with a 2.5 µm inlet aerodynamic. The raw signal was postprocessed in Igor Pro 6.3 (Wave Metrics) using SQUIRREL 1.57 and PIKA 1.15Z routines. Elemental ratios were estimated following the approach of Canagaratna et al. (2015) (Fig. S1 in the Supplement). The AMS OM concentrations reported in this work are not corrected for the chamber wall losses, and the measured nitrate is assumed to be inorganic for ease of comparison with MIR.
2.3 Offline MIR measurements
Two 47 mm Teflon filters (Pall corporation) were used for each experiment to sample the primary PM after its injection into the chamber and the aged PM after approximately 3 to 4 h of aging. The filter holder was placed downstream of a sharp-cut-off cyclone and a silica gel denuder, and the flow rate through the filter was maintained at 8 L min−1. We used a similar naming convention for the filters to that of Yazdani et al. (2021b). Filters were immediately stored in filter petri dishes at 253 K after sampling and before MIR analysis to minimize volatilization and chemical reactions. The PTFE filters were analyzed using a Bruker Vertex 80 Fourier transform infrared (FT-IR) instrument equipped with an α deuterated lanthanum alanine doped triglycine sulfate (DLaTGS) detector at a resolution of 4 cm−1. The spectra were averaged over 64 scans.
MIR spectral postprocessing
The MIR spectra were baseline-corrected to eliminate the contribution of light scattering by filter membrane and particles, as well as absorption by graphitic carbon (Parks et al., 2021). We used smoothing splines described by Kuzmiakova et al. (2016). After baseline correction, blank subtraction was performed to minimize the interference of PTFE C−F bands (Yazdani et al., 2021b). The multiple peak-fitting algorithm described by Takahama et al. (2013) was applied to obtain functional group abundances of alcohol (aCOH), carboxylic acid (COOH), alkane (aCH), and non-acid carbonyl (naCO) (Fig. S1). After obtaining functional group abundances, the O:C, H:C, and OM:OC ratios (Fig. S1) were calculated assuming half of a C atom for aCH and aCOH bonds (Maria et al., 2002; Russell, 2003; Reggente et al., 2019b).
2.4 Identifying influential MIR absorbances for AMS OM
The AMS OM estimates and the MIR spectra are combined statistically to identify the functional groups that are the best predictors of AMS OM mass concentration. This method is not affected by uncertainties either in MIR peak fitting or absorption coefficients and can be applied even when absorption coefficient data are not available for all functional groups. It also helps us decide which functional groups are needed to be included in the MIR peak fitting. The averaged AMS OM concentrations over the filter sampling periods were regressed against the corresponding MIR spectra using partial least squares regression (PLSR). Thereafter, the influential absorbances in the MIR spectra for the organic OM concentration were determined based on the variable importance in projection (VIP) scores method (Fig. S2). This procedure was applied separately for the primary and aged aerosols of each source to highlight the compositional differences. When regressing AMS OM concentrations against MIR absorbances, we seek a solution of the following linear equation for coefficients a:
where X(n×p) is the MIR spectra matrix with n samples and p independent variables (wavenumbers), y(n×1) is the vector of the response variable, the AMS OM concentration, and e is the vector of residuals. In this work, the univariate partial least squares regression (Wold et al., 1983) is used. The univariate PLSR projects X onto P(p×h) (h is the number of latent variables) basis with orthogonal scores T(n×h) while maximizing the covariance between scores and the response variable, y. In Eq. (3), b and f indicate the regression coefficients and the vector of residuals, respectively.
A repeated 10-fold cross validation was applied to find the optimal number of latent variables (LVs) for the PLSR model. Examining loadings and coefficients directly can be informative about the important absorbances. For instance, the first weight vector, w1, can be a good estimate of important bands, but it is limited to the cases in which the signal is not dominated by other factors rather than the analyte, such as inorganics, and filter absorption (Haaland and Thomas, 1988). In this work, we used a more general method, VIP scores (Wold et al., 1993), to identify the important absorption bands. This metric is a root mean square of loading weights of all h latent variables used in the model weighted by their fraction of the captured response (Chong and Jun, 2005; Takahama et al., 2016). The VIP score of the jth wavenumber is calculated by considering all h latent variables in the model as shown in Eq. (4). Since the average of squared VIP scores is equal to one, generally, the wavenumbers with a VIP score greater than one are considered influential due to higher-than-average contribution to estimating the response variable. The influential functional groups are those associated the most with the AMS OM or are the functional groups that are the best predictors of AMS OM. In Eq. (4), tk and wk represent the kth columns of T, score matrix, and W(p×h), weight matrix, respectively. The relationship between T and W is described by Eq. (5) (Helland, 1988).
where .
2.5 Identifying functional group–ion fragment relationships
Covariance and correlation coefficients were used to understand the connection between fragment ions (up to 202 for which the signal-to-noise ratio is still significant) and functional groups (Fig. S3a). We used normalized functional group abundances by the MIR total OM and normalized fragment ion concentrations by the AMS total OM (averaged over filter sampling periods) and calculated covariances and correlations between 4 functional groups and more than 300 fragment ions. The major difference between the fragment–FG (functional group) correlation and covariance is that the former is more informative about the fragments with low concentrations, while the latter highlights the fragments with higher concentrations. Data normalization was performed to avoid correlations introduced by the changes in the total OM mass concentration (e.g., due to SOA condensation) as oxygenated fragments are highly correlated before normalization (Fig. S5). Negative correlations (anti-correlations) and covariances were omitted as they do not show the production of fragments from molecules containing the functional group of interest. For example, often the aCH relative abundance decreases with aging as the relative concentrations of oxygenated functional groups such as COOH and oxygenated fragment ions such as increase, leading to a significant anti-correlation between the aCH functional group and the fragment. Russell et al. (2009a) and Faber et al. (2017) have already applied the univariate fragment–FG (correlation) analysis for different sources using unit-mass-resolution and HR AMS data, respectively. However, their analysis has been limited to only a few small fragment ions.
Univariate methods can be difficult to interpret when ion fragments are associated with multiple functional groups. In addition to the univariate methods, the VIP scores method was used to highlight the influential spectral regions and functional groups for major fragment ions with high concentrations (, CHO+, C2H3O+, ) and for two biomass-burning-related fragment ions ( for levoglucosan and for lignin). This multivariate approach is similar to identifying the influential MIR spectral regions for the AMS OM as discussed in Sect. 2.4 except that the concentrations of individual fragment ions are regressed against the MIR spectra (Fig. S3b).

Figure 1Statistical relations and strategy for comparison of MIR and AMS measurements. The correlation and covariance analyses are performed between AMS mass fragments and MIR functional group abundances from peak fitting. PLSR is performed using the AMS total OM or individual fragment concentrations as the independent variable and the MIR absorbance spectra as the dependent variables.
2.6 Interpolating functional group abundances using AMS mass spectra
Functional group abundances for all filters (normalized by the MIR total OM mass concentration), which were calculated from peak fitting, were regressed against the AMS spectra (normalized by the AMS total OM mass concentration and averaged over the filter sampling periods) using PLSR. A repeated 10-fold cross validation was applied to indicate the optimal number of latent variables. These models were then used to interpolate (high-time-resolution) functional group compositions using the AMS spectra and to investigate the evolution OM during the course of oxidation when only AMS measurements existed (Fig. S4). The contribution of oxygenated functional groups to the bulk O:C ratio was calculated from their high-time-resolution abundances (, where ).
In the following subsections, bulk OM parameters from AMS and MIR are combined and compared in Sect. 3.1. Thereafter, fragment ion–FG relationships are investigated in Sect. 3.2. Finally, PLSR models are developed to predict functional group composition of OM using the AMS mass spectra (Sect. 3.3). Our approach for combining and comparing the AMS and MIR measurements is demonstrated in the diagram of Fig. 1.
3.1 Combination and comparison of OM measurements
Influential spectral regions of the MIR spectra and their corresponding functional groups are determined for the AMS OM using VIP scores (Sect. 3.1.1). Thereafter, the OM mass concentration and OM:OC, O:C, and H:C ratios calculated using peak fitting to MIR spectra are compared to the average values from AMS for the primary and aged aerosols (Sect. 3.1.2, 3.1.3, and 3.1.4).
3.1.1 Influential group frequencies for total AMS OM
As can be seen from Fig. 2, carbonyl CO, and aCOH have the highest VIP scores (greater than one) for primary wood burning aerosols, highlighting their importance in the primary wood burning OM. The high VIP scores of aCOH is consistent with the fact that it is a major part of wood constituents. Although ν(CH2) and ν(CH3) (stretching vibrational modes) at 2800–3000 cm−1 do not have high VIP scores for primary wood burning aerosols, the VIP scores for δ(CH2) at 1470 cm−1 (bending vibrations) are high, suggesting the importance of aCH. The peak around 1600 cm−1 which has a greater-than-one VIP score for primary wood burning is the result of several overlapping peaks attributed to the organonitrates, aromatic ring ν(C=C), amine δ(N−H), amide δ(N−H), and carboxylate ν(C=O) (Pavia et al., 2008). These overlapping absorbances make peak assignment in this region uncertain and complex. This peak is accompanied by the lignin-related ν(C=C) vibrations at 1515 cm−1 (Yazdani et al., 2021b), suggesting the abundance of lignin-like products in primary wood burning OM as also proposed by Bertrand et al. (2018). For the aged wood burning aerosols, VIP scores are the highest for the broad carboxylic ν(OH) absorbances at 2400–3400 cm−1 and the carbonyl ν(CO) (acid carbonyl) at 1700 cm−1, suggesting carboxylic acids to be important contributors to the OM mass after SOA formation (Yazdani et al., 2021b). The aCOH group does not have high VIP scores for the aged wood burning aerosol (Yazdani et al., 2021b).
For the primary coal combustion aerosols, ν(CH2) has the highest VIP scores, suggesting the abundance of hydrocarbons likely from volatile compounds of coal. The aromatic ring ν(C=C) peak at 1600 cm−1, however, has relatively lower VIP scores, implying that the aromatic rings do not constitute the majority of primary coal combustion OM. For the aged coal combustion aerosols, which are mostly composed of SOA, the VIP scores of ν(CH2) are considerably lower. By contrast, carbonyl ν(CO) and aCOH bands (observed on the shoulder of ν(N−H) peaks) have the highest VIP scores, suggesting that the SOA is mostly composed of carbonyls and alcohols. The out-of plane aromatic CH band, γ(CH), at 750 cm−1 does not have high VIP scores, suggesting that aromatic CH (rCH) is not a major constituent of the aged aerosols. The RONO2 absorption region at 1630 cm−1 does not have high VIP scores because the AMS OM concentrations used in this study do not consider the majority organonitrate mass as both and NO+ are attributed to inorganic nitrate.
In general, functional groups associated the most with the AMS are the same ones targeted in past studies of atmospheric aerosols (e.g., Ruthenburg et al., 2014; Russell et al., 2009b) and are consistent with our knowledge of POAs and SOAs related to combustion sources (e.g, Bertrand et al., 2017, 2018; Li et al., 2020; Yazdani et al., 2021b). In addition, they provide insight into the chemical difference between the unburned fuel and the POA and SOA.

Figure 2VIP scores of the MIR absorbances regressed against the AMS OM concentration (averaged over the filter sampling periods) for primary wood burning, WB_P (a), aged wood burning, WB_A (b), primary coal combustion, CC_P (c), and aged coal combustion aerosols, CC_A (d). Blue and red regions correspond to wavenumbers with positive and negative regression coefficients in the PLSR models, respectively. Solid curves show the average spectrum (± 1 standard deviation shown by the shaded bands) for each category. Important functional groups are indicated for each category. The PTFE interference regions are masked by gray rectangles.
3.1.2 AMS and MIR OM mass concentrations
It was shown in the last section that four functional groups, aCH, COOH, aCOH, and non-acid carbonyl (naCO) are the most influential functional groups regarding OM mass. The abundances of the mentioned functional groups were estimated using peak fitting to the MIR spectra. The aromatic C=C group (rC=C) was not quantified due to the interference with other functional groups and the lack of absorption coefficient data. The peak-fitting results show that the OM concentration estimates from AMS and MIR are highly correlated (Fig. 3a, R2=0.92). The slope of the MIR OM concentration versus that of AMS (not corrected for collection efficiency) is 1.3. This slope is within the previously reported range (Gilardoni et al., 2009; Russell et al., 2009a, b; Liu et al., 2011) considering the collection efficiency of AMS (Yazdani et al., 2021b; Kumar et al., 2018; Canagaratna et al., 2007), and the aerosol volatilization artifacts from PTFE filters (Ruggeri, 2017; Subramanian et al., 2004). Yazdani et al. (2021b) reported the AMS collection efficiency to range between 0.7 and 1.1 for the same experiments. The OM concentrations estimated by both methods indicate the significant enhancement with aging even without particle and vapor wall loss consideration (on average 2.4 and 2.7 times by AMS and MIR, respectively). The enhancement ratios are in the range of values that were previously reported for SOA formation from logwood stoves (Bertrand et al., 2017; Tiitta et al., 2016; Grieshop et al., 2009; Heringa et al., 2011; Hennigan et al., 2010). Using different absorption coefficient values for MIR functional groups (discussed by Reggente et al., 2019a) has little effect on the correlation coefficient.
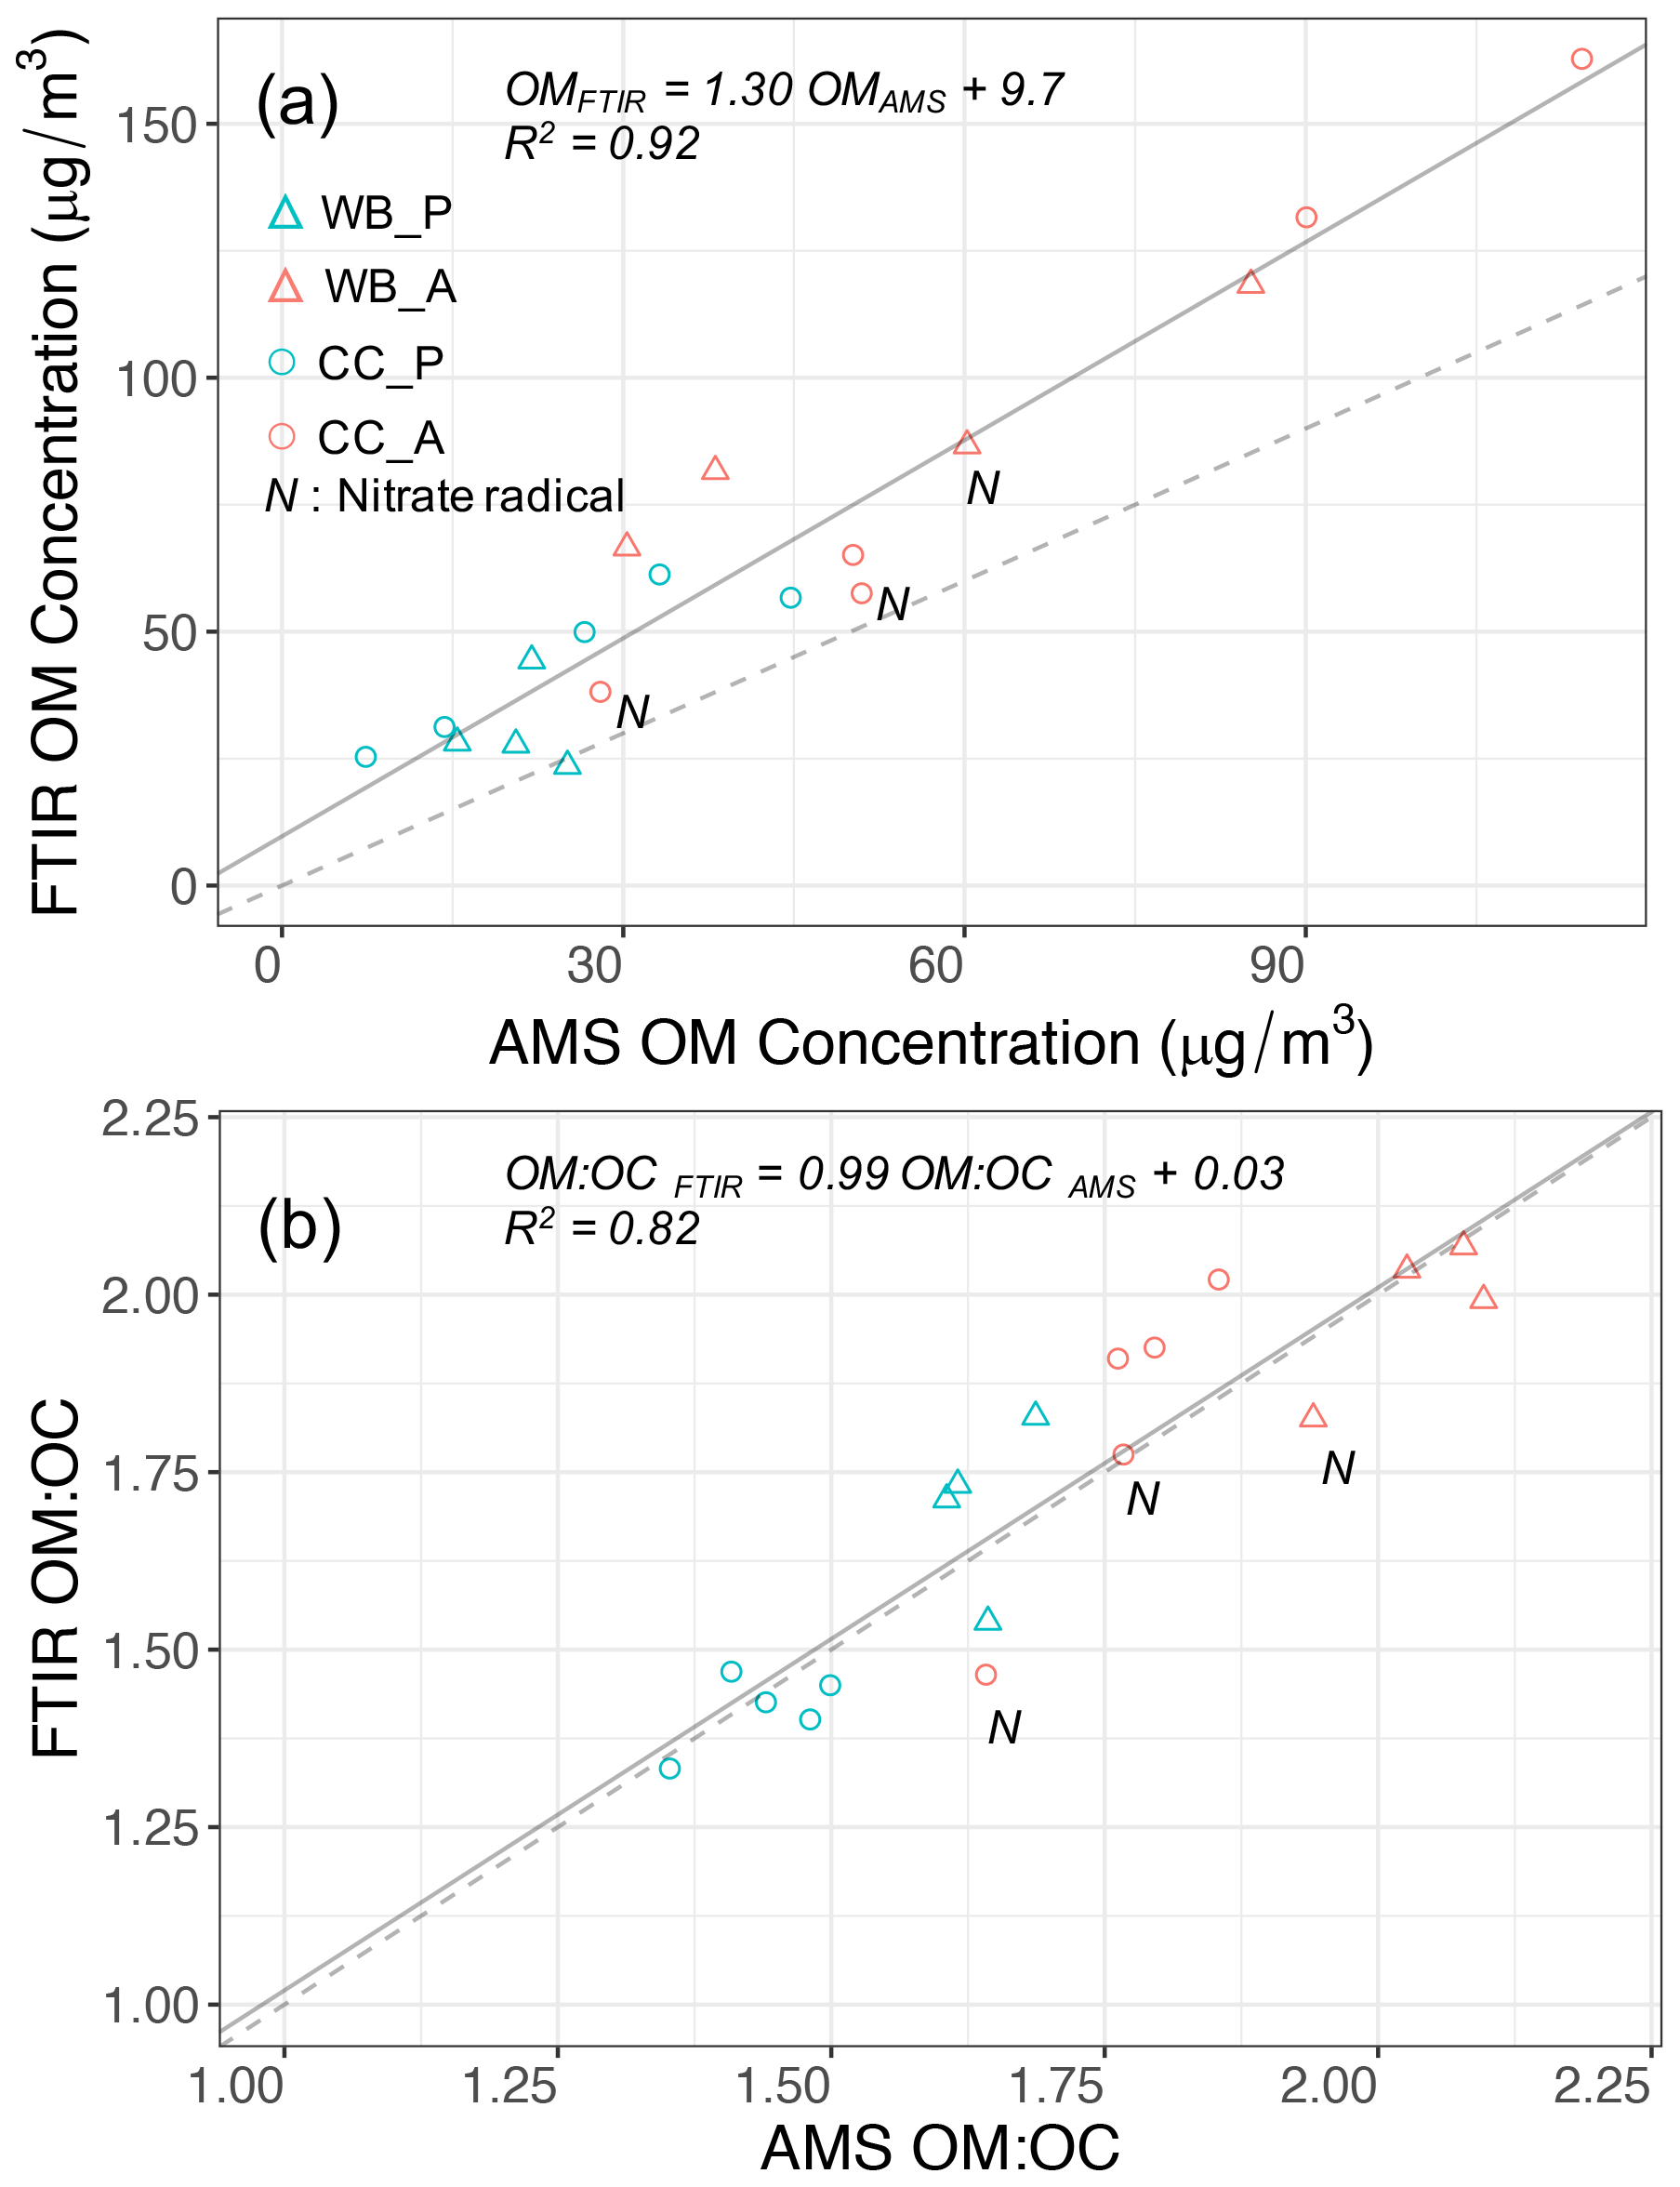
Figure 3Scatter plot comparing OM concentration (a) and OM:OC (b) estimates by AMS and MIR for primary (P) and aged (A) aerosols of wood burning (WB) and coal combustion (CC). The fitted and 1:1 lines are solid and dashed, respectively.
3.1.3 AMS and MIR OM:OC ratios
The OM:OC ratios calculated from the AMS mass spectra were averaged over the filter sampling periods and compared to those measured from peak fitting to MIR spectra. The OM:OC estimates of these two methods agree very well (R2=0.82 and slope =0.99; Fig. 3b) with an average difference of less than 0.15 (Yazdani et al., 2021b). The correlation coefficient of OM:OC ratios is also found to be insensitive to the choice of absorption coefficients reported by Reggente et al. (2019a) for MIR spectroscopy. The fact that both methods capture similar OM:OC and mass concentration trends suggests that a similar fraction of OM is monitored by both, and the uncertainties associated with each method are less than variations due to fuel sources and aging processes. The primary coal combustion aerosols are estimated to have the lowest OM:OC ratios (1.35–1.5), justified by their strong hydrocarbon (aCH) signatures (Fig. 2c). The primary wood burning samples have slightly higher OM:OC ratios (1.6–1.7 from AMS) primarily due to a relatively higher concentration of aCOH (Fig. 2a). Both instruments estimate that the aged aerosols of the two sources, regardless of the aging method, have higher OM:OC than the primary ones (Fig. 3b). The aged wood burning aerosols have the highest OM:OC, ranging from 1.9 to 2.1 (from AMS), with high concentrations of COOH. The aged coal combustion aerosols have lower average OM:OC ratios compared to the aged wood burning aerosols, ranging from 1.6 to 1.8. For both emission sources, AMS and MIR show that aerosols aged with the hydroxyl radical have higher OM:OC ratios than those aged with the nitrate radical (Fig. 3b). Attributing the total AMS nitrate to organics to estimate an upper bound for OM:OC, makes this difference less prominent.
3.1.4 AMS and MIR van Krevelen trajectories
The slope of the aging trajectory in the van Krevelen diagram is informative about the changes in the functionality of OM (Heald et al., 2010; Ziemann and Atkinson, 2012; Chhabra et al., 2011). In the wood burning experiments, AMS oxidation trajectories vary between a straight line and a convex (L-shaped) curve (Fig. 4). In the first wood burning experiment with the hydroxyl radical (WB_OH_1), the AMS aging trajectory is almost a straight line, implying a monotonic change in functional groups during the course of aging (Fig. 4a). In the second experiment (WB_OH_2; similar to the WB_OH_1 experiment) the trajectory is convex with a reduced slope toward the end of aging, implying an increase in the abundance of functional groups that result in a low trajectory slope, e.g., acids (Fig. 4b). This is supported by the high concentration of the COOH group observed in the MIR spectra of the corresponding aged aerosols (Yazdani et al., 2021b) and will be investigated further in Sect. 3.3. The wood burning experiment with the nitrate radical (WB_NO3_1) has a slope close to zero with a lower final O:C probably due to the exclusion of organonitrates and the different SOA formation reactions of the nitrate radical. The relatively small decrease in H:C with aging is supported by the prominent aCH absorptions in the MIR spectra of wood burning aerosols that are aged with the nitrate radical (Yazdani et al., 2021b). The modest decrease in H:C with aging is observed to be a characteristic of aging with the nitrate radical regardless of the emission source (Fig. 4d, h, and i), suggesting a more effective H atom abstraction by OH.
The starting points of the wood burning oxidation trajectories (from AMS) have H:C ratios in the range of 1.6–1.8 and O:C ratios in the range of 0.3–0.4. The ending points have H:C ratios in the range of 1.4–1.6 and O:C ratios in the range of 0.6–0.7. The observed values are close to that of OM measured by Chhabra et al. (2011), the OM emissions of logwood combustions by Tiitta et al. (2016), and ambient OM reported by Heald et al. (2010). The average O:C and H:C trends calculated from MIR spectroscopy are generally consistent with that of AMS, showing a decline in H:C ratio and increase in O:C ratio. However, there is an offset in the absolute values; in general, H:C is estimated to be approximately 0.2 higher by MIR spectroscopy both for the primary and aged wood burning aerosols. The positive H:C offset for the wood burning aerosols might be due to the uncharacterized carbon from aromatic rings of lignin pyrolysis products, leading to an overestimation of H:C.
For the coal combustion experiments, AMS oxidation trajectories usually start at H:C ratios around 1.7–1.9 (higher than that of wood burning) and O:C ratios around 0.20–0.25 and end usually at H:C and O:C ratios around 1.5–1.7 and 0.35–0.55, respectively. The high H:C ratios before aging are consistent with the high ratio of aliphatic CH to aromatic carbon observed in MIR spectra. In most of the experiments, a positive curvature in trajectory is observed (Fig. 4e–i), implying a change in the type of functional groups produced during the course of aging. The average slopes are close to −1 (from AMS) in the majority of experiments and are slightly higher than those of the wood burning experiments. The average oxidation slopes that are estimated from MIR spectroscopy are also higher for the coal combustion experiments compared to wood burning. This observation is supported by the formation of SOAs with higher non-acid carbonyl abundances for coal combustion (Yazdani et al., 2021b), resulting in higher trajectory slopes. MIR generally estimates higher O:C (by 0.05–0.1) and lower H:C ratios (by approximately 0.2) for the aged coal combustion aerosols compared to AMS.
The discrepancies between the measurements of the two instruments might stem from the low OM mass collected on the filters, which increases the baseline correction and peak-fitting uncertainties in MIR analysis. The existence of functional groups that are not considered in the peak-fitting algorithm (e.g., ethers, polycyclic aromatic hydrocarbons, rC=C, and rCH) and the assumption about the fractional carbon associated with each functional group might also play a role. Sampling biases of semi-volatile compounds on PTFE filters (Subramanian et al., 2004) and the uncertainties in AMS elemental ratio calibrations (Canagaratna et al., 2015; Aiken et al., 2008) can also affect the results.

Figure 4Comparison of AMS van Krevelen (H:C vs. O:C) aging trajectories (color circles) for wood burning (WB) and coal combustion (CC) experiments with MIR estimates for aerosols collected on PTFE filters before and after aging (red stars). Black circles in AMS trajectories correspond to the filter sampling periods for the primary and aged aerosols. The filter names are the same as Yazdani et al. (2021b). P: primary, A: aged. There are one to three similar experiments in each category (WB_OH, WB_NO3, CC_OH, and CC_NO3).
3.2 AMS fragment ion–MIR functional group relationships
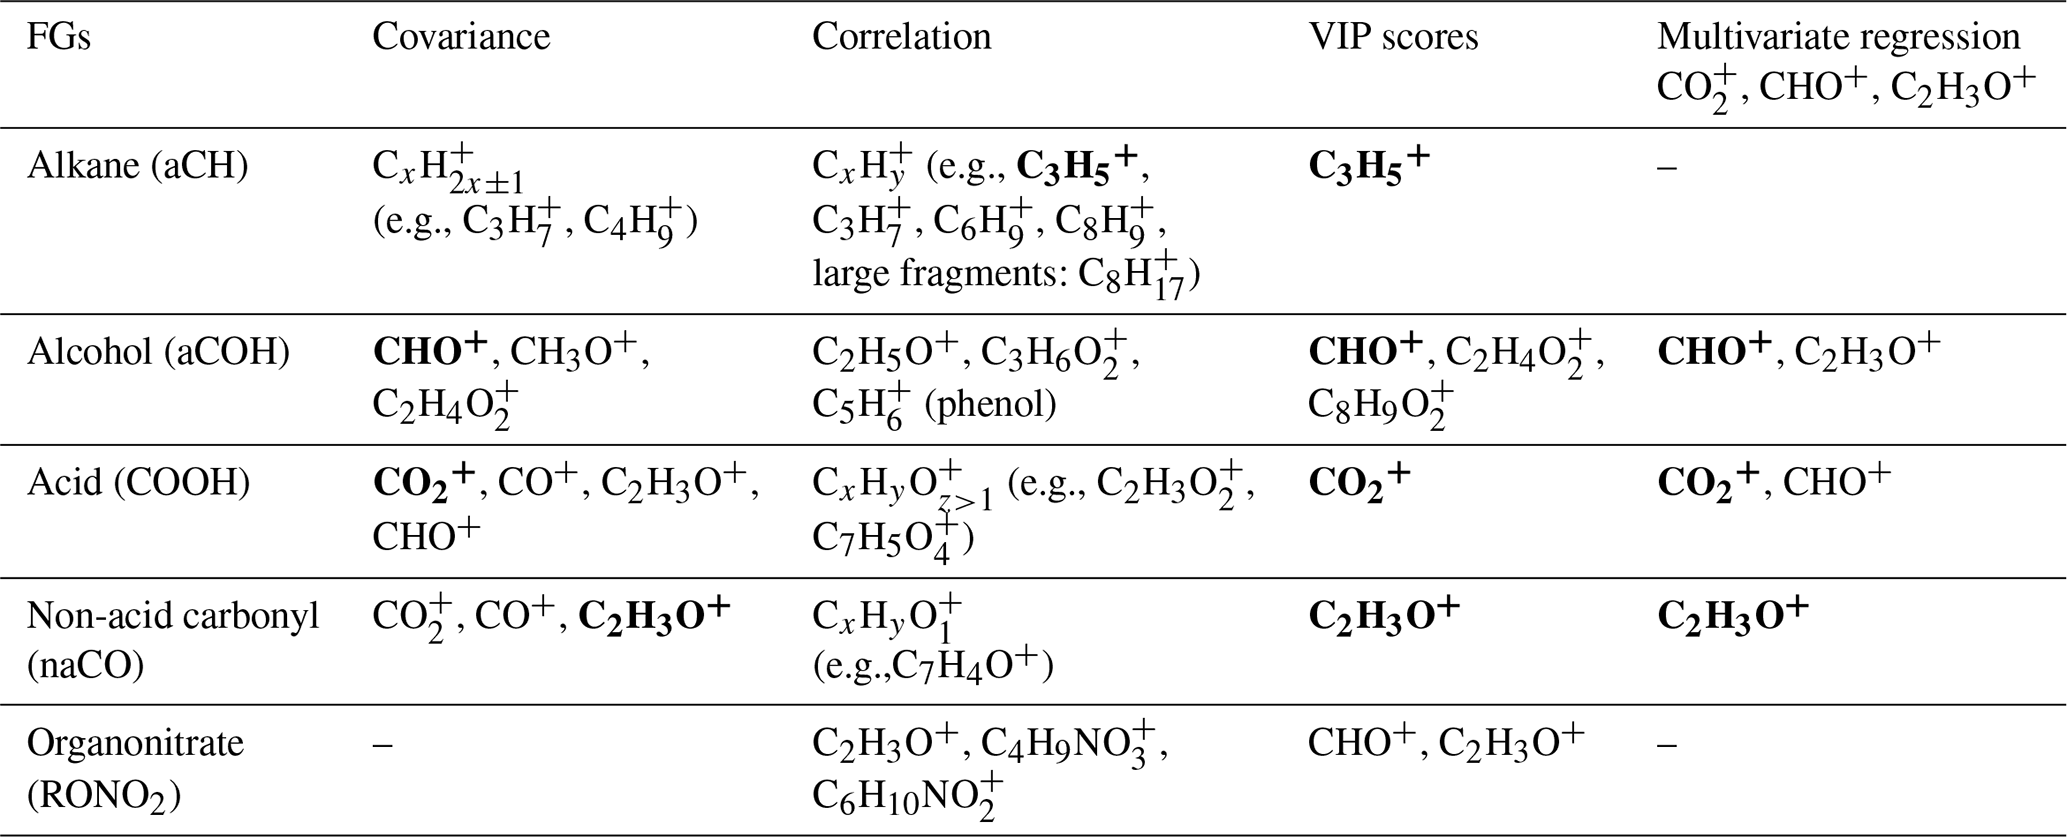
In Sect. 3.2.1 and 3.2.2, the connection between the AMS fragment ions and MIR functional groups is investigated using different statistical methods (covariance, correlation, and VIP scores). The combined summary of these analyses is shown in Table 1.
Table 1Summary of important fragment ions for each functional group based on the analysis method. Important fragments are shown in bold.
3.2.1 Correlation and covariance analyses (univariate)
The aCH group has high covariance with CxH2x−1 and CxH2x+1 fragments (, , , , and ; Fig. 5). The highest correlations are between the aCH group and , , , and (Fig. 6). The relationship of larger fragments such as and with aCH is more prominent in the correlation analysis. These fragments are especially abundant in the primary coal combustion aerosols, suggesting these aerosols are composed of longer-chain hydrocarbons relative to wood burning aerosols that even after fragmentation produce relatively large fragments. This observation is also supported by the MIR spectra of these samples, which possess sharp CH2 and weak CH3 peaks (Yazdani et al., 2021a, b). Faber et al. (2017) have previously shown the relation between and aCH. The 57 signal in the unit-mass-resolution mass spectra (includes ) has been proposed to be a tracer of unburned fuel emissions (Schneider et al., 2006). However, its correlation coefficient with aCH has been shown to be quite variable and sometimes negative (Russell et al., 2009a). This discrepancy partly stems from the contribution of C3H5O+ to 57 (Faber et al., 2017) and partly from the fact that molecules with different chain-lengths, degrees of branching, and heteroatoms produce different and source-dependent fragmentation patterns for . In addition, the existence of several highly correlated ion fragments with aCH in this study suggests the superiority of a multi-variate approach to obtain information about the aCH group.
The COOH group has the highest covariance with , CO+, C2H3O+, and CHO+ (CO+ is estimated from ). The highest correlations are with and several larger fragments with multiple oxygen atoms such as , which are abundant in the aged wood burning aerosols. The high covariance with the fragment is supported by the fact that is produced from the fragmentation of mono- and dicarboxylic acids (Duplissy et al., 2011; Zhang et al., 2005). The larger fragments with multiple oxygen atoms () are also indicative of the COOH functional group as also reported by Lambe et al. (2012) and might be source-specific. For example, is only detected in the wood burning aerosols and can be a potential wood burning SOA marker. Sun et al. (2010) reported observed the fragment in the AMS spectra of syringol SOA. In the wood burning aerosols, the COOH group is correlated significantly (r∼0.96) with , the fragment known to be produced from the α cleavage of carboxylic acids (Pavia et al., 2008). The fragment is also known to be produced from acids having γ hydrogen through McLafferty rearrangement (Pavia et al., 2008), and its concentration increases with the extensive aging for the wood burning and coal combustion aerosols (Yazdani et al., 2021b). However, the significant contribution of levoglucosan to in wood burning aerosols makes the investigation of the COOH– relation difficult. With the help of MIR, which does not suffer from the same interference, samples with negligible levoglucosan concentrations were separated. For these samples, a fairly strong correlation (r∼0.82) between COOH and was observed.
The aCOH group covaries the most with CHO+, CH3O+, C3H5O+, C2H3O+, and . The CHO+ fragment has been often interpreted as the tracer of esters, polyols, and compounds with polyfunctional groups without the carboxylic COOH (Canagaratna et al., 2015). This fragment is also known to be produced by aldehydes, but the aldehyde C−H band is not observed in the MIR spectra of the samples under study. Faber et al. (2017) also showed that the signal ratio of C2H3O+ to is linearly correlated with the molar ratio of aCOH to aCH. The connection of C2H3O+ with alcohols, however, should be treated with caution as carbonyls can also produce the same mass fragment. The fragment appears to be important for aCOH and has been previously shown to be related to anhydrous sugars in the biomass burning smoke (Schneider et al., 2006). The CH3O+ fragment is produced from the α cleavage of alcohols (Pavia et al., 2008). The highest correlations in this work are between the aCOH group and C2H5O+ and fragments and some other fragments such as . The C2H5O+ fragment is also known to be produced from the α cleavage of alcohols (Pavia et al., 2008). The fragment, correlated to a lower extent with aCOH, can be produced by phenol after loosing CO (Pavia et al., 2008), which is also abundant in wood burning emissions (Bruns et al., 2017).
The non-acid carbonyl group (naCO) covaries the most with CO+, C2H3O+, and . Contrary to COOH, CHO+ appears to have a low covariance with naCO. The C2H3O+ fragment is known to be produced by aliphatic ketones and aldehydes (Pavia et al., 2008; Eadon et al., 1971). As discussed by Yazdani et al. (2021b), the naCO in the coal combustion samples are believed to be mostly ketone based on their C=O frequency. The naCO group is highly correlated with some fragments (e.g., , ) and some single-oxygen fragments (e.g, C5HO+, C7H4O+, and C7H5O+). The C7H5O+ fragment is known to be produced by aromatic ketones (Pavia et al., 2008) and has been attributed to carbonyls (Lambe et al., 2012). The ratio is relatively higher in samples aged with the nitrate radical or samples that have considerable amounts of the naCO group (Fig. S5), suggesting that C2H3O+ is produced mainly by molecules possessing naCO or SOA species formed with the nitrate radical.
There are mid-infrared signatures attributed to levoglucosan and lignin-like compounds that are prominent in the primary wood burning aerosols and diminish with aging. The correlation analysis for these signatures with the AMS ion fragments (Fig. S6) suggest that the C8H9O+ fragment is related to lignin-like compounds. In fact, one might attribute the 121 fragment to two peaks and C8H9O+ for hydroxyphenyl (H) lignin and for guaiacyl (G) lignin (Li et al., 2012; Tolbert and Ragauskas, 2017). The and fragments have high correlations with MIR levoglucosan signatures. The fragment at 102 (Fig. S6) has the highest correlation with the levoglucosan concentration measured from the MIR spectra. This fragment might be used alternatively in case the interference of other compounds (e.g., acids) for the smaller fragments related to levoglucosan is substantial.
The MIR peak attributed to RONO2 has high correlation coefficients with C2H3O+ and several other oxygenated fragments such as C4H7O+. Nitrogenated fragments containing the nitrate and nitro groups such as and also appear to have moderate correlation coefficients (approximately 0.6) with the RONO2 peak in the MIR spectrum (Fig. S7). The quantification of nitrogenated fragments is, however, known to be complicated in the V mode.
To summarize, the high correlation coefficients of several fragments with each functional group suggest that functional group information is retained to a good degree in the AMS spectra. We also found that multiple functional groups are correlated with each of the major oxygenated fragments, (CO+, C2H3O+, , and CHO+). As a result, a multivariate approach should be taken to infer functional group abundances from the AMS spectra.
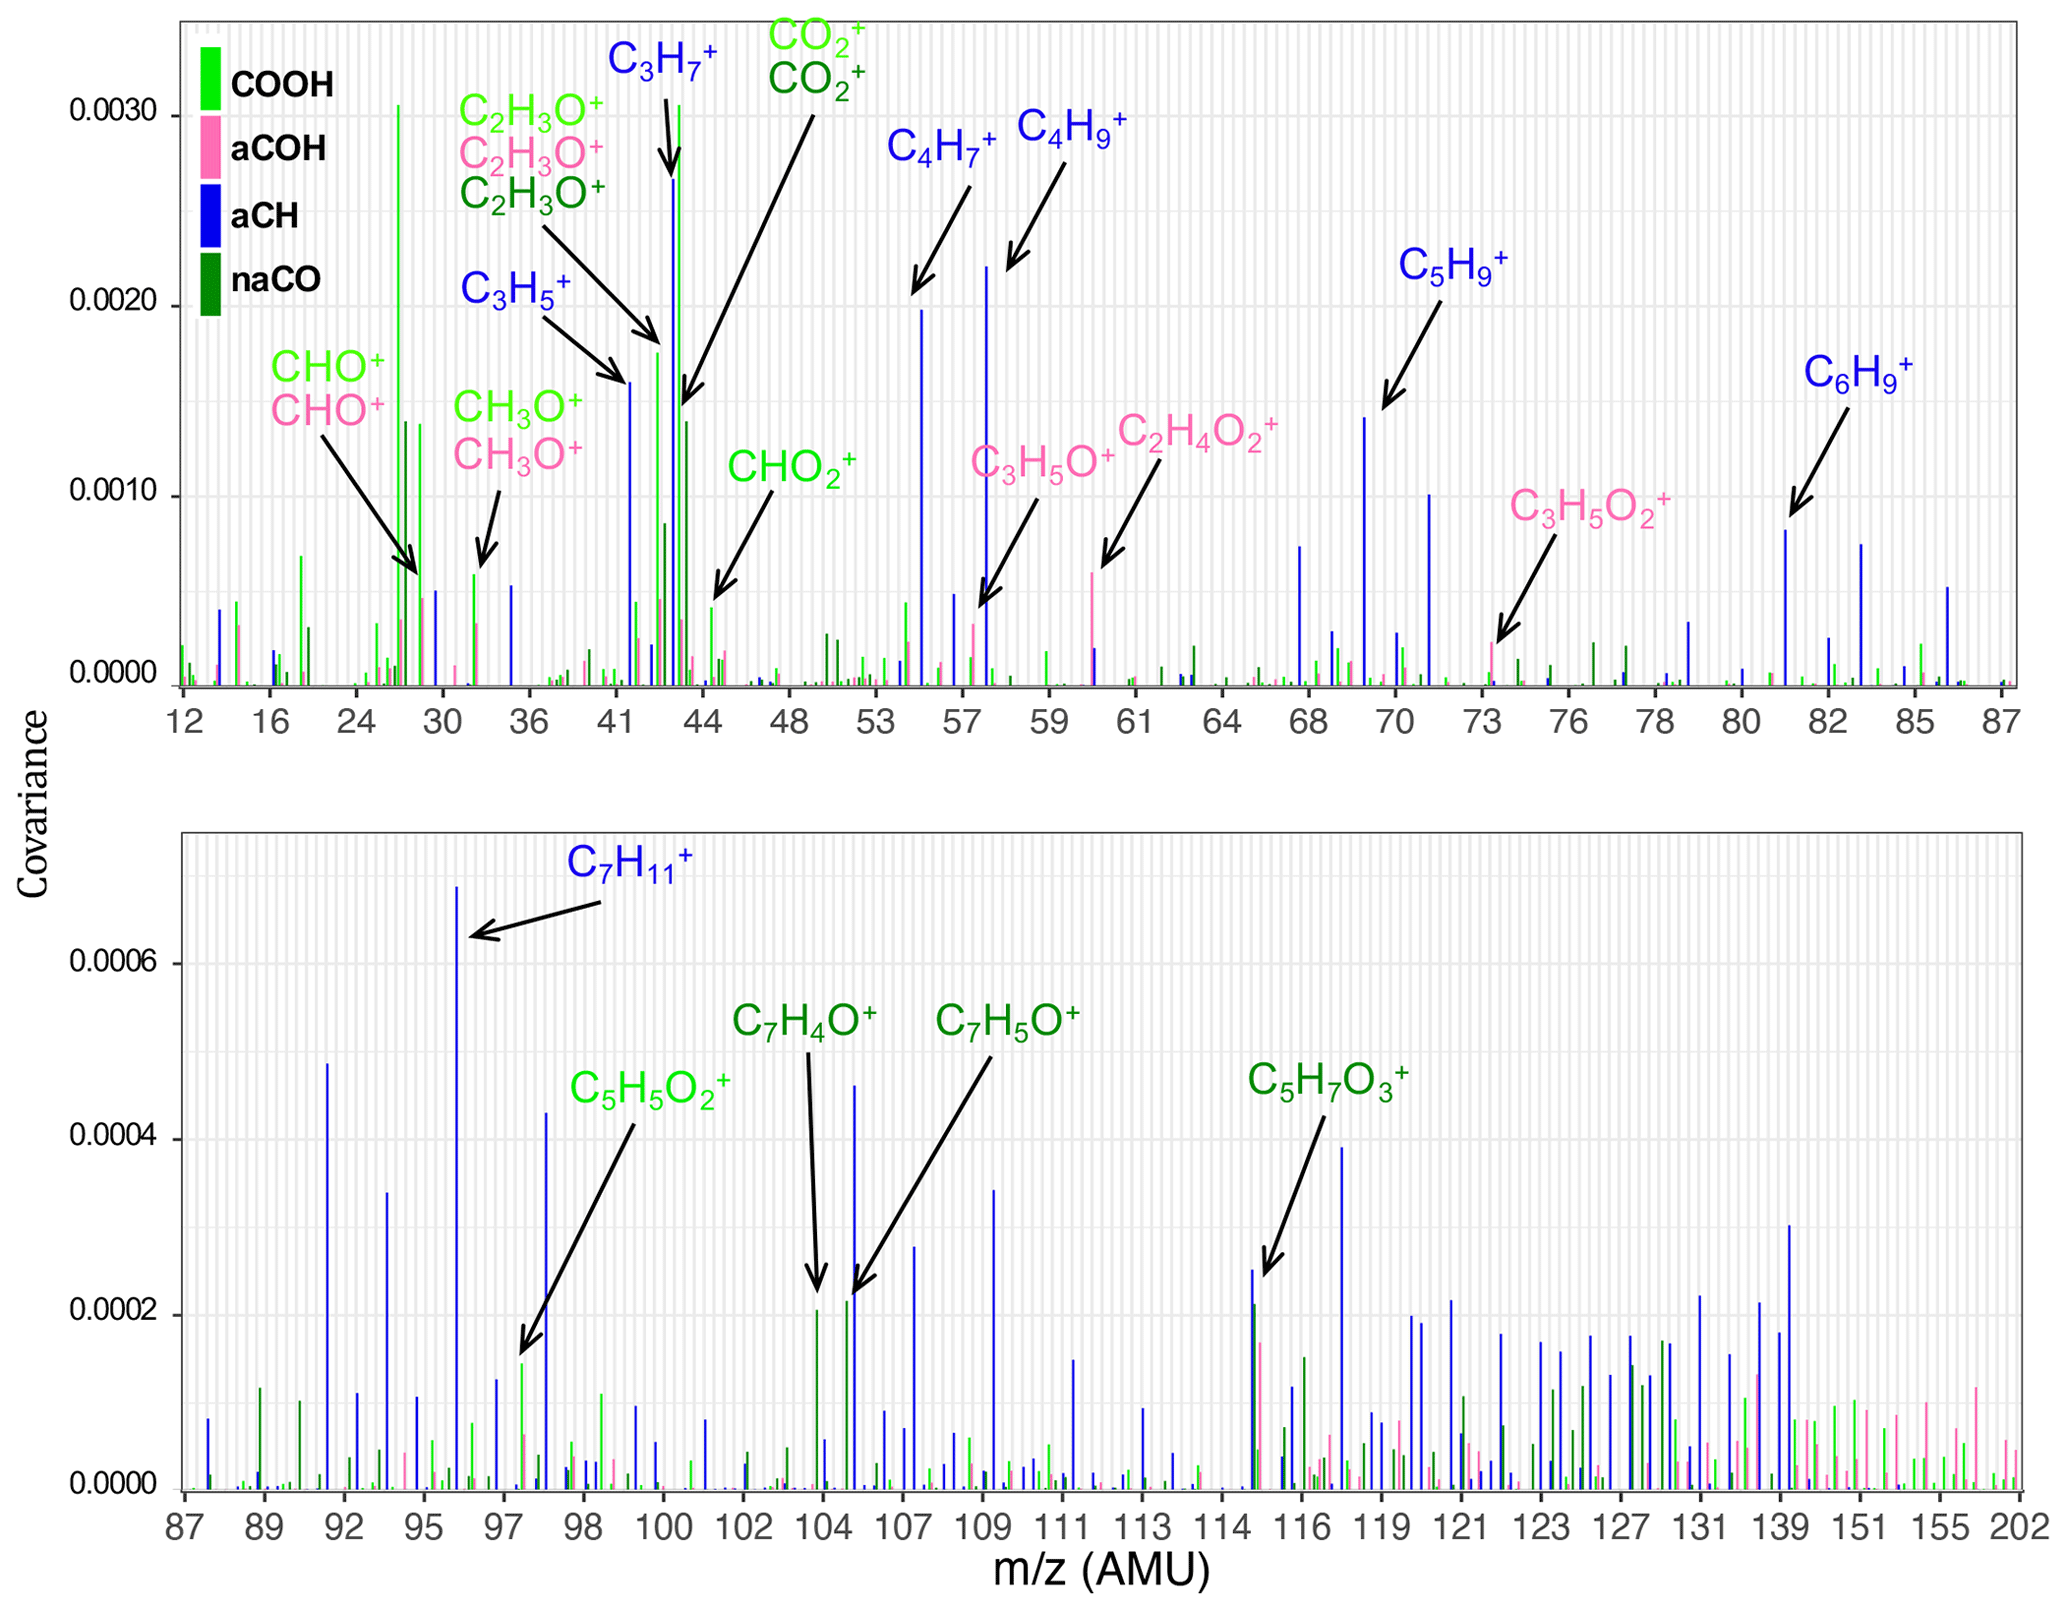
Figure 5Bar plots showing positive covariances of normalized AMS fragment ion concentrations and normalized functional group abundances.
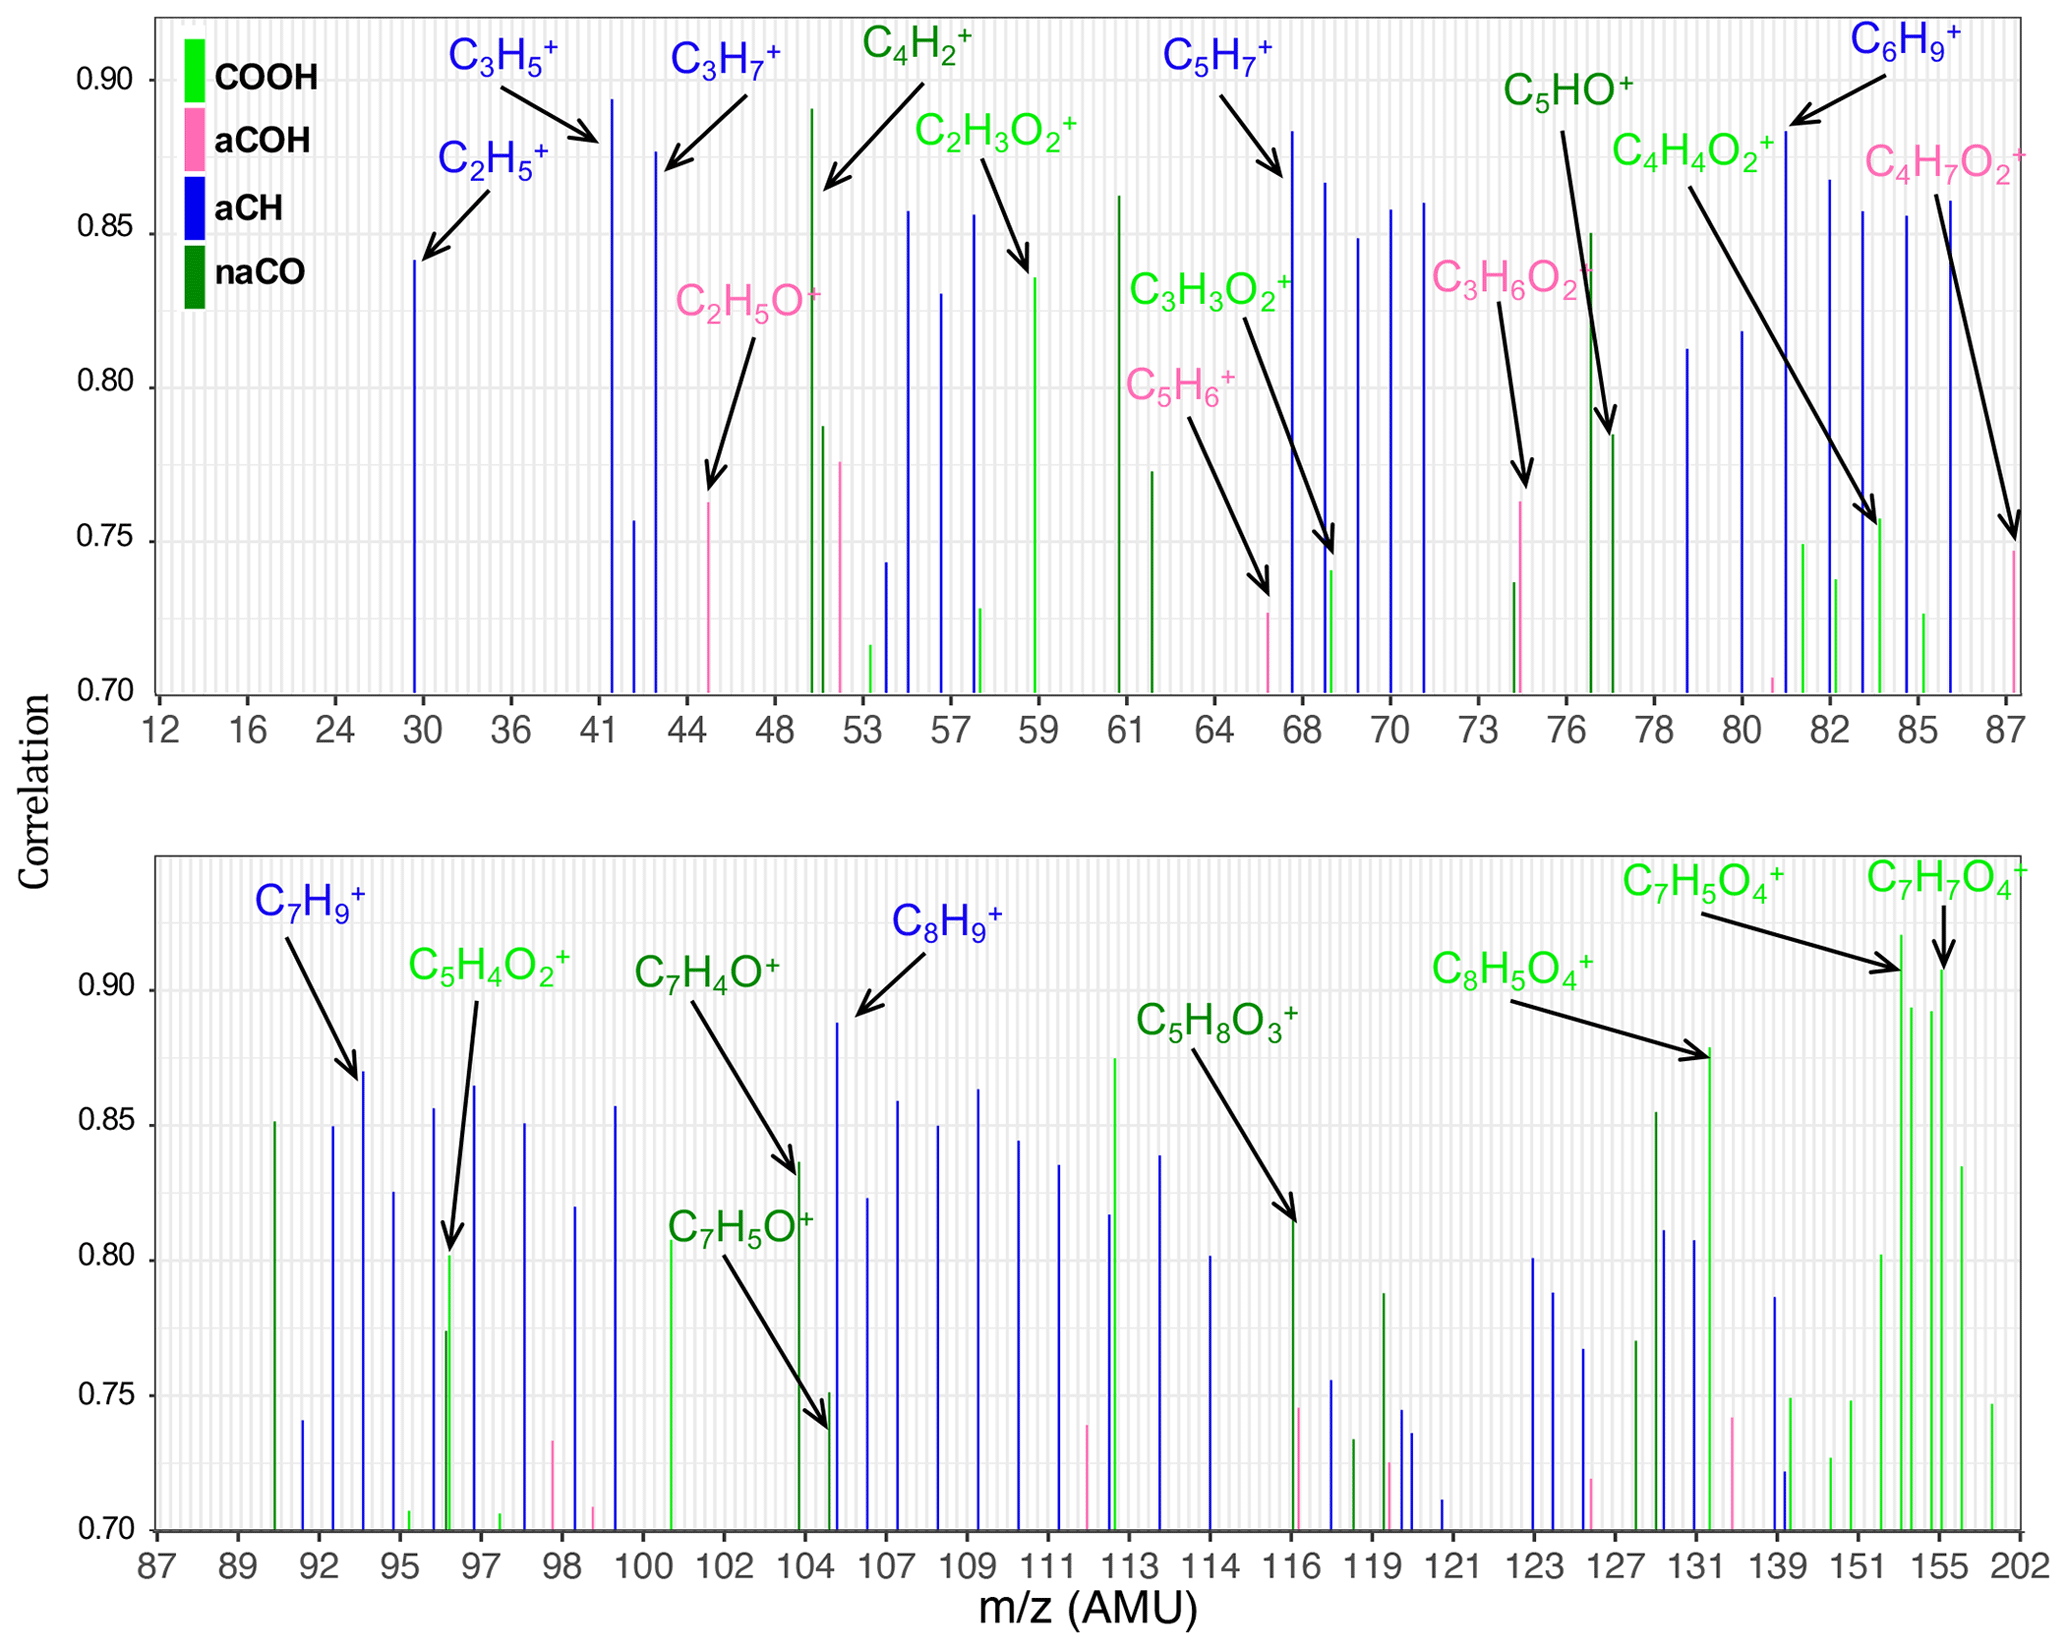
Figure 6Bar plots showing the Pearson correlation coefficients of normalized individual fragment ion concentrations and normalized functional group abundances. Only values >0.7 are shown.
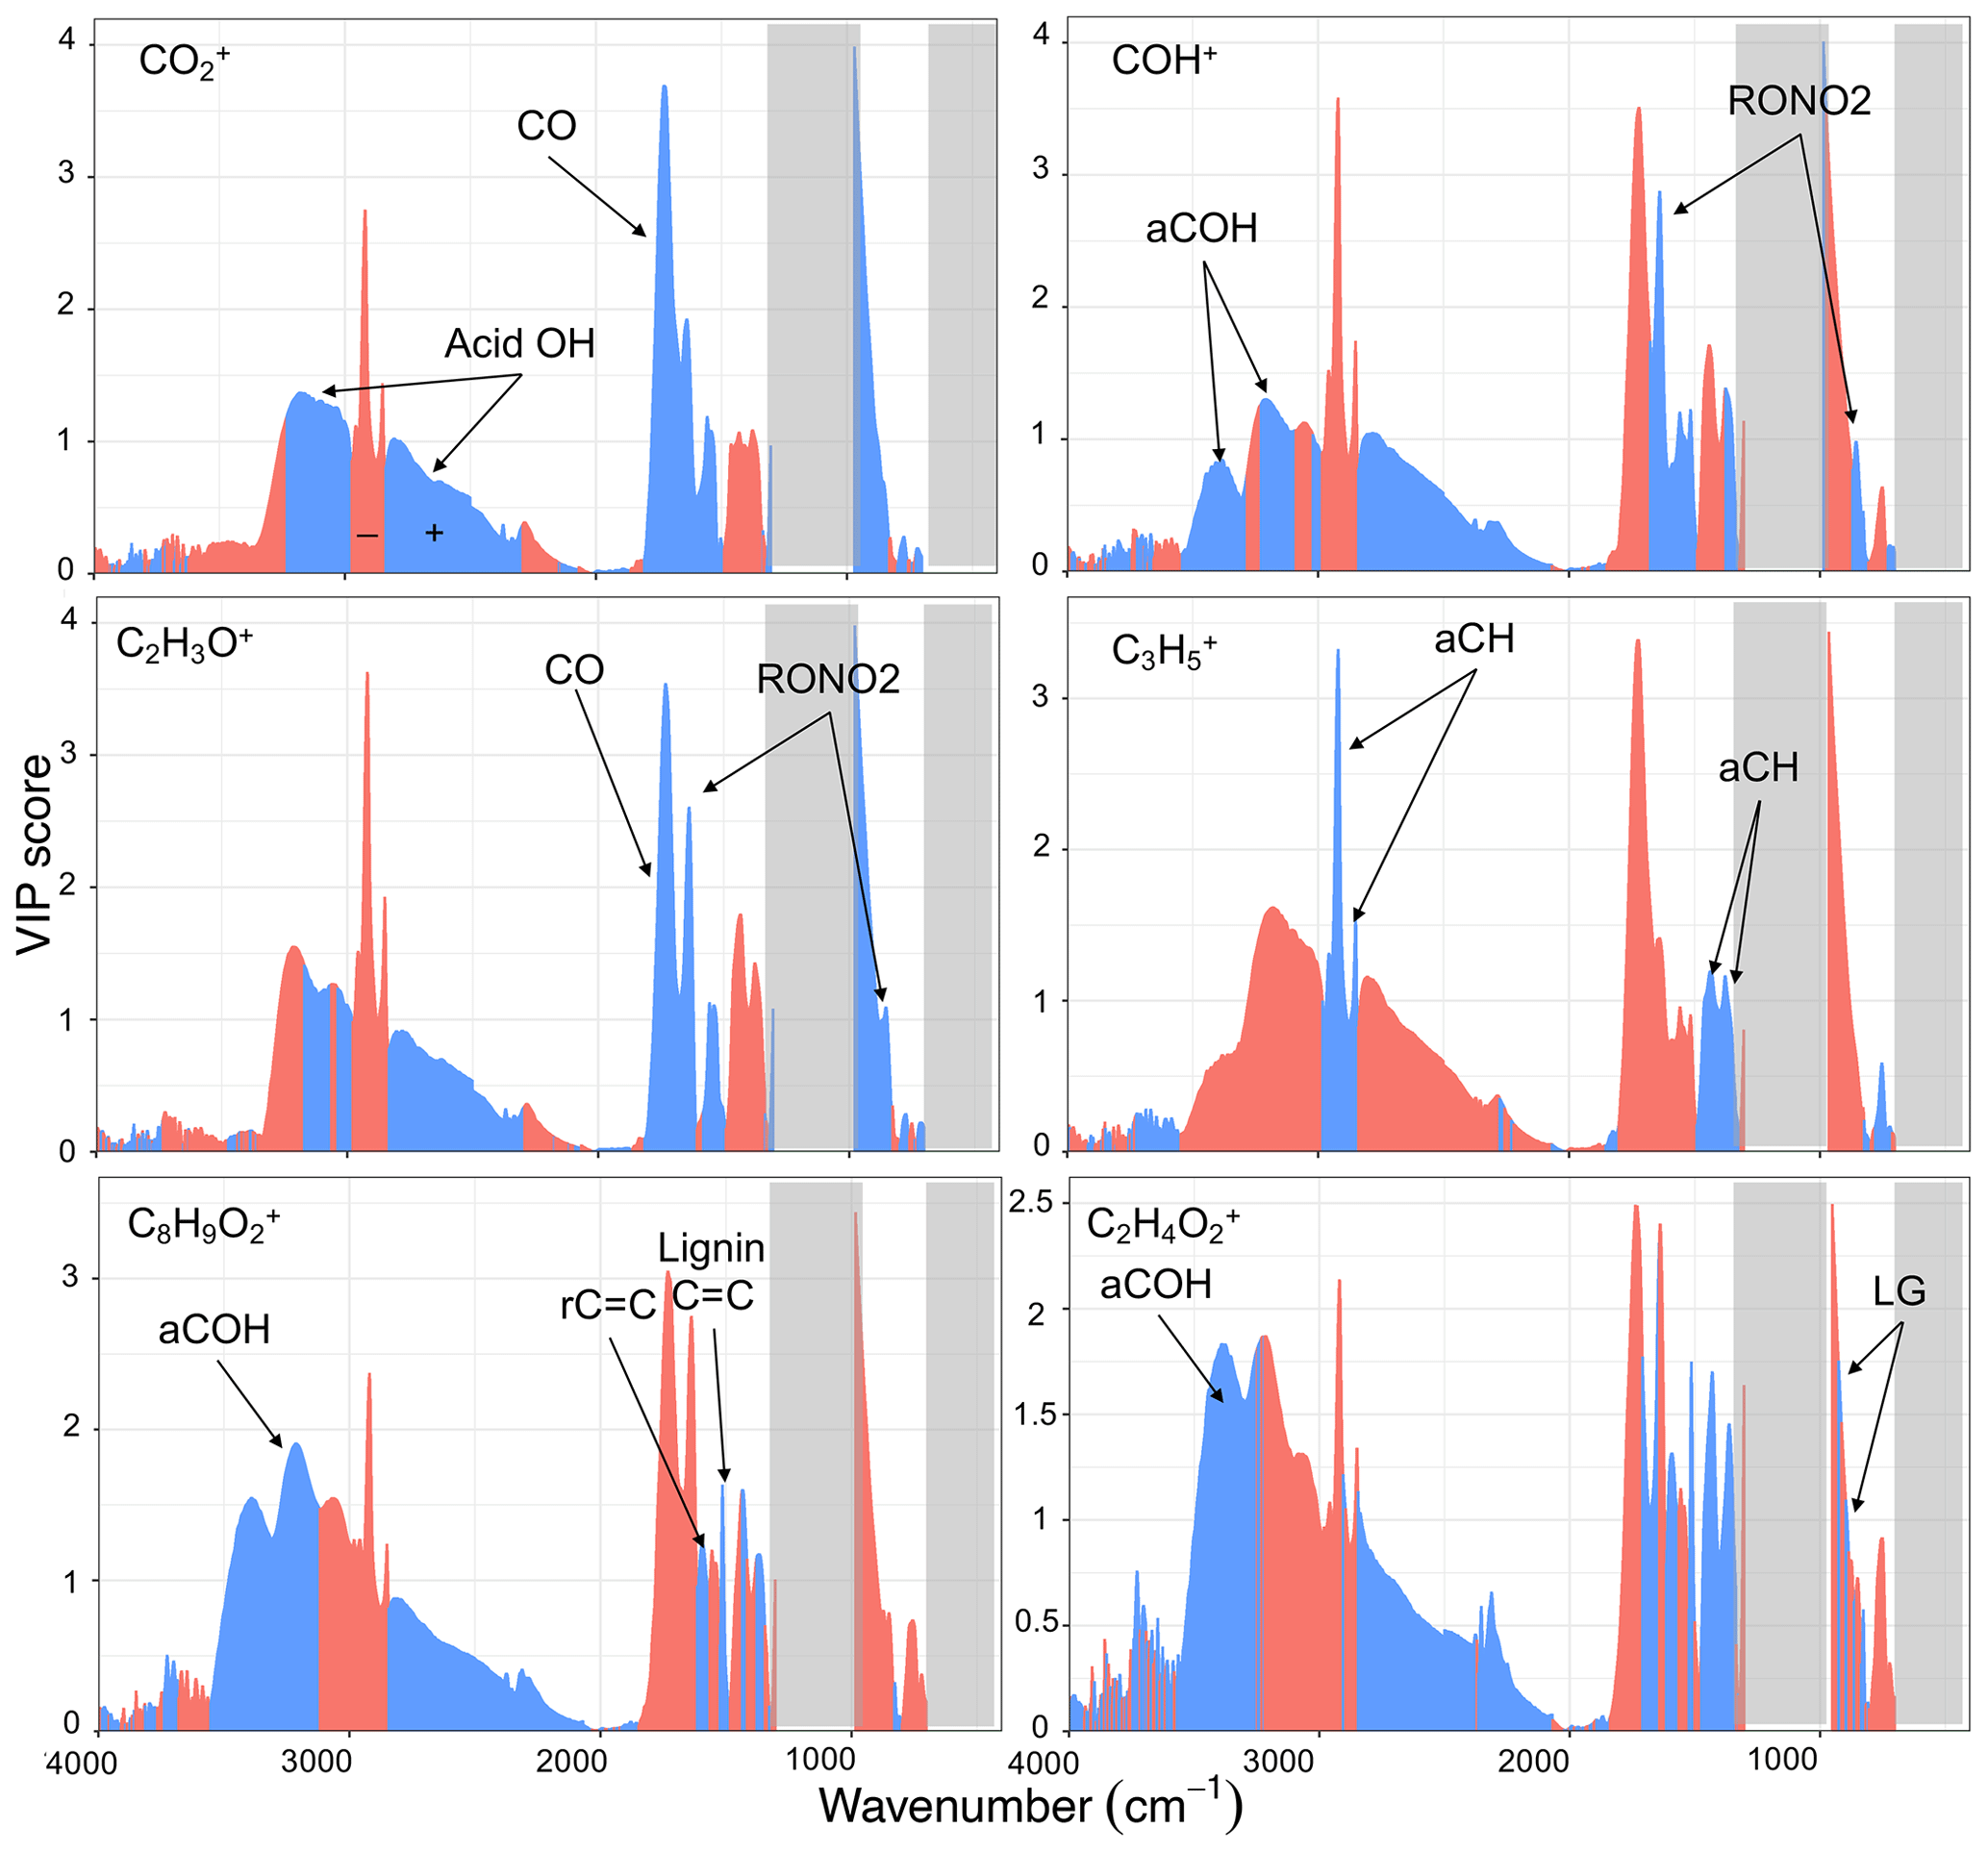
Figure 7VIP scores of MIR absorbances regressed against AMS fragment ion concentrations (averaged over the filter sampling periods). Blue and red scores correspond to wavenumbers with positive and negative regression coefficients in the PLSR models, respectively. Important functional groups for each mass fragment are indicated, and PTFE absorption regions are masked by gray rectangles.
3.2.2 VIP scores (multivariate)
As can be seen from Fig. 7, the fragment has the highest VIP scores for the carbonyl ν(CO) and broad acid ν(OH) peaks from 2400 to 3400 cm−1. This is consistent with previous studies (e.g., Zhang et al., 2005) and our univariate analyses (Sect. 3.2.1). On the other hand, the ν(CH) region (2800 to 3000 cm−1), interfering with the broad acid OH stretching band, has high VIP scores with negative regression coefficient, showing that aCH relative concentration is anti-correlated with . Although some interference for the fragment is expected from gas-phase CO2 in the AMS spectra, our results show that this interference is eliminated effectively.
The COH+ has the highest VIP scores for the RONO2 peaks and the broad alcohol ν(OH) at 3400 cm−1. These results suggest that alcohols and the SOA species produced during the aging with the nitrate radical (that can also be alcohols) are mostly responsible for producing this mass fragment. Although the interference form the gas-phase 15N14N can be significant for CHO+, our results show that CHO+ appears to be meaningfully indicative of alcohols after the subtraction of the gas-phase interference.
The C2H3O+ fragment has the highest VIP scores for the carbonyl CO (likely from non-acid carbonyl) and the RONO2 peaks and also to a lesser extent for the broad acid ν(OH) peak. This observation suggests that C2H3O+ is mainly produced by fragmentation of carbonyls and SOA species formed by aging with the nitrate radical and to a lesser extent carboxylic acids.
The fragment was chosen for the VIP score analysis due to having high concentrations for both coal combustion and wood burning aerosols. This fragment has the highest VIP scores with positive regression coefficients for the ν(CH) (2800–3000 cm−1) and δ(CH) (1300–1500 cm−1) peaks, showing that this fragment is directly related to aCH for both sources. This result has been expected but also highlights the fact that fragments should be chosen wisely based on the aerosol source to provide useful information about the aCH group. For example, in this study, the fragment appears to be more correlated with the aCH group than the commonly used fragments, .
Regarding the biomass burning markers, the fragment, which is proposed to be produced by the fragmentation of lignin molecules (Li et al., 2012; Tolbert and Ragauskas, 2017), has the highest VIP scores with positive coefficients in the aromatic ν(C=C) (1515 and 1600 cm−1) and aCOH regions. This observation suggests the connection of this fragment with aromatic compounds that have lignin-like substitutions that generate the sharp peak at 1515 cm−1 and aCOH groups. The fragment, which is proposed to be produced predominantly by the fragmentation of levoglucosan molecules, has the highest VIP scores with positive coefficients in the aCOH region (3400 cm−1), suggesting the abundance of aCOH in molecules producing this fragment. In addition, high VIP scores with positive regression coefficients are observed in the 850–1000 cm−1 region. This region was previously proposed to contain levoglucosan fingerprint absorbances (Yazdani et al., 2021b).
We also performed a simple multivariate linear regression between the oxygenated functional groups (aCOH, naCO, and COOH) and major fragments (, CHO+, and C2H3O+; Fig. S8) for the experiments in which the hydroxyl radical was used. As shown in Fig. S8, regressing against COOH, aCOH, and naCO results in the highest regression coefficient for the COOH group. In a similar regression for CHO+, the relative contribution of aCOH increases (Fig. S8). However, a high regression coefficient for COOH is still observed. The regression for C2H3O+ highlights a relatively greater contribution of naCO (Fig. S8). However, as for CHO+, a high regression coefficient for COOH is also observed. As summarized in Table 1, different statistical methods suggest that the major fragments are usually produced more by a certain oxygenated functional group, while interference from other functional groups might also be significant. This motivates the use of multivariate methods for predicting functional group abundances using fragment ion concentrations in the following section.
3.3 MIR functional group interpolation using AMS mass spectra
We showed in previous sections that AMS and MIR measurements are consistent. We also found that functional group information is maintained in the AMS mass spectra, which motivated the use of multivariate methods to access this information. For this purpose, normalized AMS spectra were regressed against normalized functional group compositions from MIR peak fitting. The fit quality of the developed models is reasonable (Figs. S9 and S10) with their R2 ranging from 0.71 to 0.94. These models use mass fragments to predict the functional group compositions that were found to be important in previous sections. We used the developed PLSR models to interpolate the functional group composition of wood burning and coal combustion OM between the filter sampling periods (primary and aged) using the AMS spectra (Fig. 8). These models are especially helpful as AMS has a considerably better time resolution and can be used to investigate the detailed functional group evolution of OM during the course of aging.
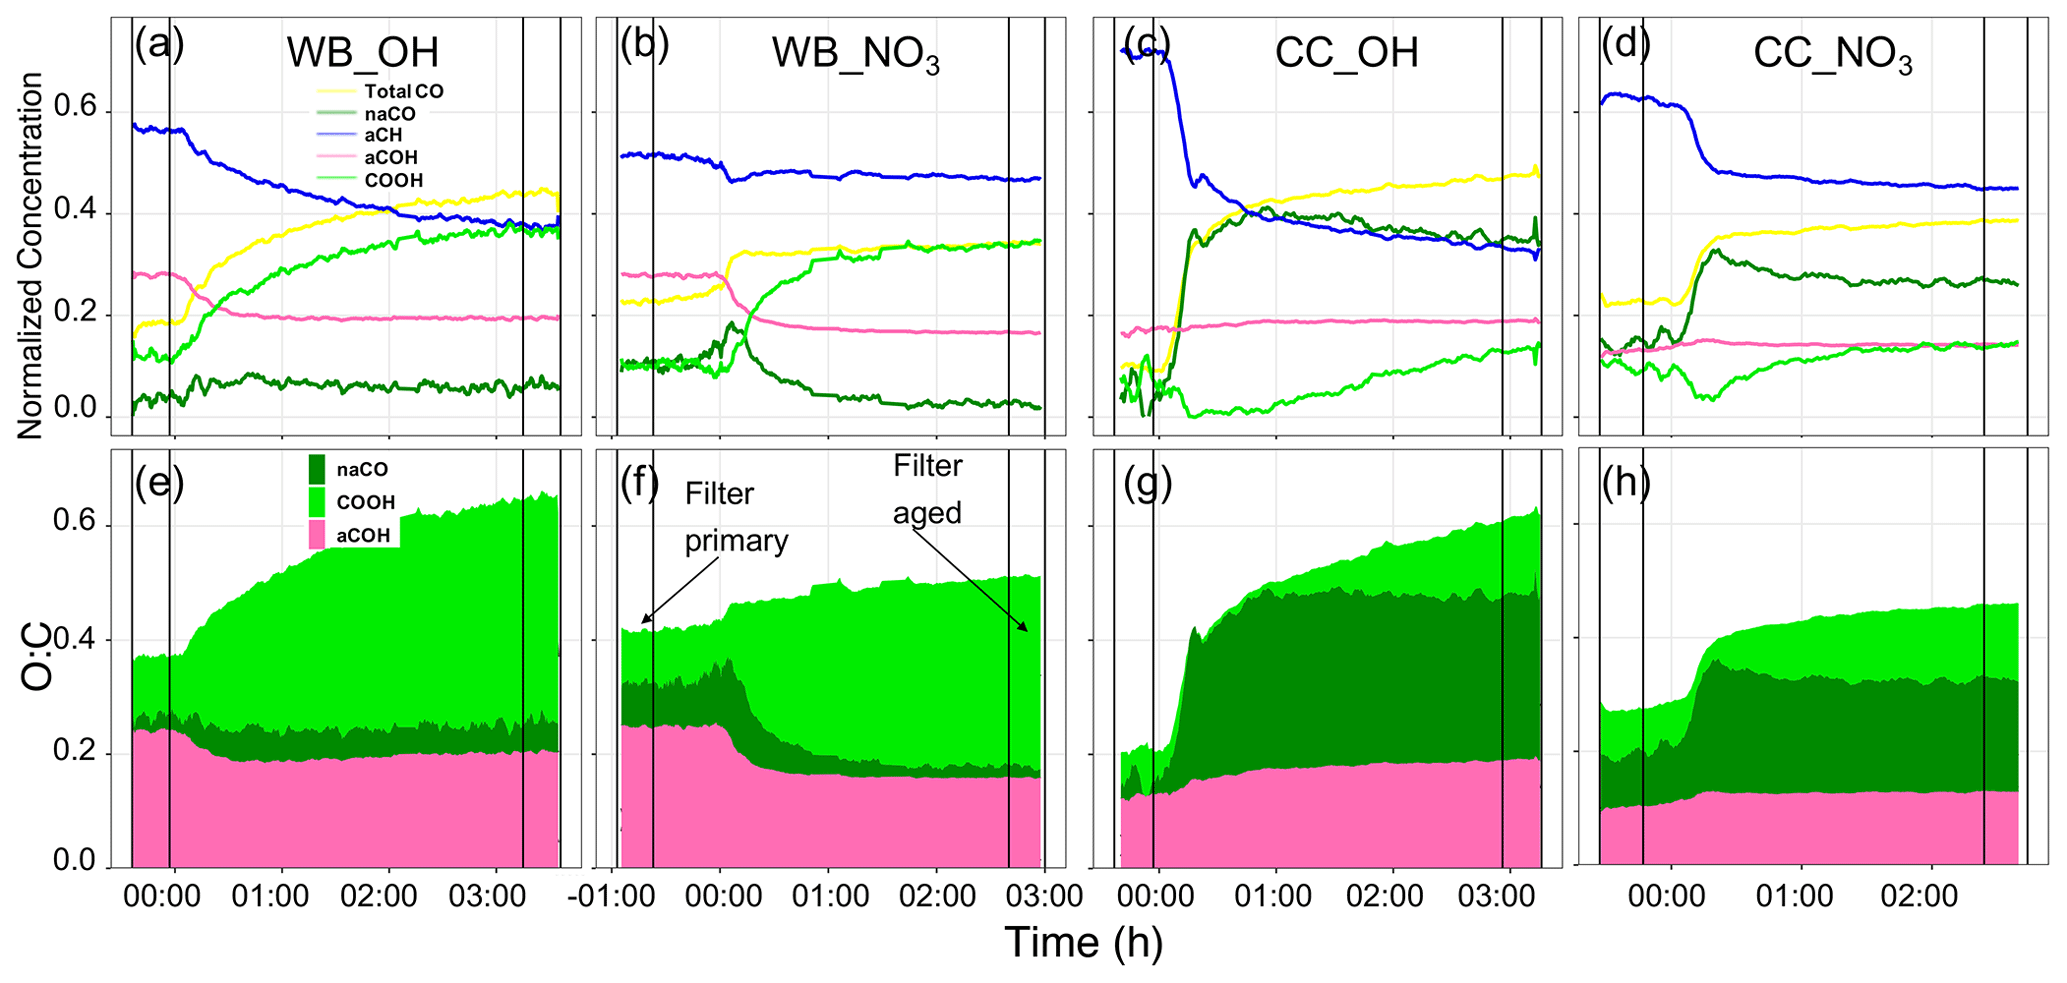
Figure 8Time series of normalized concentration of functional groups interpolated using AMS mass spectra (a–d) and time series of O:C ratios calculated from the interpolated functional groups (e–h). An example for each source (CC and WB) and oxidant (OH and NO3) has been shown. The time zero indicates the start of aging (UV lights turned on or oxidant injected). The horizontal lines indicate the periods of filter sampling.
The interpolated functional group compositions (Figs. 8, S11, and S12) show different functional group compositions and trends during the course of oxidation for wood burning and coal combustion aerosols. This is predominantly seen in the fraction of oxygenated functional groups that emerge with aging. For the wood burning experiments, the aCH relative abundance falls steeply as aging with the hydroxyl radical starts (Fig. 8a). This is also observed for aCOH. On the other hand the COOH relative abundance increases significantly as soon as the aging starts and levels off after 2 h of aging. The relative abundance of naCO, however, does not change significantly compared to other functional groups for the wood burning experiment (Fig. 8a). There are slight differences between different experiments of wood burning aging with the hydroxyl radical (also observed in their van Krevelen trajectory in Fig. 4a–c). For instance, the relatively linear trajectory of the WB_OH_1 experiment (Fig. 8a) is concurrent with monotonic functional group composition change (Fig. S11a). On the other hand, the curved van Krevelen trajectories of WB_OH_2 and WB_OH_3 (Fig. S12b–c) correspond to the consumption of naCO produced after the start of aging and the gradual increase in the COOH relative abundance (Fig. S12b–c). The different SOA species formed by oxidation with hydroxyl and nitrate radicals is also reflected in the evolution of OM functional group composition. When aging with the nitrate radical, the decrease in the relative abundance of aCH is much less prominent after the start of aging compared to aging with the hydroxyl radical (Fig. 8b), although the OM mass enhancement is comparable between the two (Fig. S11a–d). This observation suggests the formation of different SOA species with a higher relative abundance of aCH when the nitrate radical is used. This is also supported by the horizontal trajectory in the van Krevelen diagram (no decrease in H:C) (Fig. 4d). No clear difference in the composition of oxygenated functional groups (except organonitrate) is observed between aging with the hydroxyl and nitrate radicals. However, when the nitrate radical is used, the O:C ratio increases to lower levels and reaches a plateau faster (Fig. 8e–f; also true for the coal combustion OM). This observation is consistent with the fact that the nitrate radical is produced with a single injection of ozone, but the hydroxyl radical is generated continuously throughout the aging. It is observed that most prominent changes in the functional group composition for both oxidants occur in the first hour of aging when the OM mass changes the most (Fig. S11), and only small changes are observed toward the end of aging. Looking at the absolute abundances of functional groups, we observe that the mass concentrations of all functional groups including aCH and aCOH increase during the course of aging (Fig. S11), and it is the different rates of increase that change their relative abundance, as shown in Fig. 8.
For the coal combustion experiments a different composition of functional groups emerges after the start of aging that also evolves differently as aging continues. Like for the wood burning experiments, the aCH relative abundance decreases drastically with aging (Fig. 8c), while its absolute concentration increases only slightly with aging (Fig. S11). The decrease in the aCH relative abundance is, however, less prominent when the nitrate radical is used (Fig. 8d) as also supported by the lower decrease in the H:C shown in the van Krevelen plots (Fig. 4h–i). Unlike the wood burning experiments, the relative abundance of the aCOH group increases slightly with aging (Fig. 8c–d). The relative abundances of naCO and COOH show more complex behaviors. The relative abundance of naCO increases sharply, and naCO becomes the major functional group with the start of aging for both oxidant but decreases slightly after continued aging (Fig. 8c–d). The relative abundance of COOH decreases initially (Fig. 8c); however, after about 1 h into the aging process (earlier with the nitrate radical), when there is no more significant OM enhancement, the COOH relative abundance starts to increase gradually. This observation is consistent with the ripening phenomenon (Wang et al., 2018) in which the composition of the SOA keeps changing and becomes more oxidized, while the change in the OM mass is minimal. This phenomenon is also observed in the L-shaped oxidation trajectories of coal combustion OM in the van Krevelen plot of Fig. 4e–i for both oxidants.
To summarize, the interpolated functional group compositions are supported by the van Krevelen trajectories but provide insights into the oxidation pathways that cannot be independently obtained from the van Krevelen plots (e.g., several combinations of functional groups can produce similar slopes). For two coal combustion experiments, negative concentrations of COOH are predicted (Fig. S12e–f). These unphysical values are believed to be the result of uncertainties in PLSR models and quantification uncertainties for the COOH group from the MIR peak fitting. The predicted trends, however, are still informative.
We combined statistically collocated AMS and MIR measurements in an environmental simulation chamber and found that AMS OM is associated the most with aCH, aCOH, COOH, and non-acid carbonyl (naCO) functional groups for aerosols generated from the combustion of wood and coal. The OM mass, OM:OC, H:C, and O:C estimated from the abundances of the mentioned functional groups were in good agreement with those from AMS measurements and showed clear variations across fuel types and oxidants. These functional groups are those that were used in previous studies of atmospheric aerosols using MIR (e.g., Maria et al., 2003; Russell et al., 2009b; Reggente et al., 2019a).
Previous studies of functional group–ion fragment relationships were limited to small fragments and did not consider marker signatures in the mid-infrared spectra (Russell et al., 2009a; Faber et al., 2017). We performed a univariate (correlation and covariance) analysis on the four mentioned functional groups and more than 300 fragment ions up to 212 in the AMS spectra and found several small (low ) and large () AMS fragment ions to be informative about the functional group composition of POA and SOA from the combustion sources. For example, , which was only detected in wood burning SOA and was highly correlated with the COOH functional group, might be used as a potential marker of biomass burning SOA in the atmosphere. The peaks in the FT-IR spectra that were believed to be associated with biomass burning markers (levoglucosan and lignin-like compounds) were also found to be highly correlated with the fragments related to these markers.
Our multivariate (VIP scores) analysis indicated that when OMs with different proportions of oxygenated functional groups (i.e., COOH, aCOH, and naCO) are fragmented in the AMS, they produce different proportions of the major oxygenated fragments (i.e., , CHO+, and C2H3O+). For examples, C2H3O+ was found to be associated the most with non-acid carbonyl and SOA species formed with nitrate radical. However, each of these small oxygenated fragments does not represent only a single functional group, and contributions from other functional groups are expected.
Finally, we developed a method to extract the high-time-resolution functional group information from the AMS spectra to better understand the evolution of the OM composition during the course of aging. The results of this method provide insights into the oxidation pathways that cannot be independently obtained from the van Krevelen plot. The results of this method, which can be easily implemented in other environmental chamber studies, suggest the formation of moderately oxygenated functional groups (e.g., non-acid carbonyl) soon after the start of aging and the transformation of moderately oxygenated functional groups to more oxygenated functional groups (e.g., acid) with continued aging.
The dataset and codes for this study are available at https://doi.org/10.5281/zenodo.4882967 (Yazdani et al., 2021c) and https://doi.org/10.5281/zenodo.5872710 (Yazdani et al., 2022).
The supplement related to this article is available online at: https://doi.org/10.5194/amt-15-2857-2022-supplement.
IEH, ST, and AY conceived of the project and manuscript. AB and IEH performed the chamber experiments. AB provided AMS spectra. ND prepared and assembled the filter sampling setup and took their FT-IR spectra. AMD provided atomized compounds and ambient sample spectra. AY wrote the code for data analysis and postprocessing, performed the data analysis, and wrote the manuscript. ST edited the manuscript and provided regular feedback on the analysis. IEH, ASHP, AB, AMD, and ND provided input on the analysis and further editing of the manuscript. ST and IEH provided overall supervision of the project.
The contact author has declared that neither they nor their co-authors have any competing interests.
Publisher’s note: Copernicus Publications remains neutral with regard to jurisdictional claims in published maps and institutional affiliations.
The authors acknowledge funding from the Swiss National Science Foundation and the IMPROVE program (National Park Service).
This research has been supported by the Schweizerischer Nationalfonds zur Förderung der Wissenschaftlichen Forschung (grant nos. 200021_172923 and 200021_169787) and the National Park Service (grant no. P11AC91045).
This paper was edited by Johannes Schneider and reviewed by two anonymous referees.
Aiken, A. C., DeCarlo, P. F., Kroll, J. H., Worsnop, D. R., Huffman, J. A., Docherty, K. S., Ulbrich, I. M., Mohr, C., Kimmel, J. R., Sueper, D., Sun, Y., Zhang, Q., Trimborn, A., Northway, M., Ziemann, P. J., Canagaratna, M. R., Onasch, T. B., Alfarra, M. R., Prevot, A. S. H., Dommen, J., Duplissy, J., Metzger, A., Baltensperger, U., and Jimenez, J. L.: and Ratios of Primary, Secondary, and Ambient Organic Aerosols with High-Resolution Time-of-Flight Aerosol Mass Spectrometry, Environ. Sci. Technol., 42, 4478–4485, https://doi.org/10.1021/es703009q, 2008. a, b
Barmet, P., Dommen, J., DeCarlo, P. F., Tritscher, T., Praplan, A. P., Platt, S. M., Prévôt, A. S. H., Donahue, N. M., and Baltensperger, U.: OH clock determination by proton transfer reaction mass spectrometry at an environmental chamber, Atmos. Meas. Tech., 5, 647–656, https://doi.org/10.5194/amt-5-647-2012, 2012. a
Bertrand, A., Stefenelli, G., Bruns, E. A., Pieber, S. M., Temime-Roussel, B., Slowik, J. G., Prévôt, A. S. H., Wortham, H., El Haddad, I., and Marchand, N.: Primary Emissions and Secondary Aerosol Production Potential from Woodstoves for Residential Heating: Influence of the Stove Technology and Combustion Efficiency, Atmos. Environ., 169, 65–79, https://doi.org/10.1016/j.atmosenv.2017.09.005, 2017. a, b
Bertrand, A., Stefenelli, G., Jen, C. N., Pieber, S. M., Bruns, E. A., Ni, H., Temime-Roussel, B., Slowik, J. G., Goldstein, A. H., El Haddad, I., Baltensperger, U., Prévôt, A. S. H., Wortham, H., and Marchand, N.: Evolution of the chemical fingerprint of biomass burning organic aerosol during aging, Atmos. Chem. Phys., 18, 7607–7624, https://doi.org/10.5194/acp-18-7607-2018, 2018. a, b
Boris, A. J., Takahama, S., Weakley, A. T., Debus, B. M., Fredrickson, C. D., Esparza-Sanchez, M., Burki, C., Reggente, M., Shaw, S. L., Edgerton, E. S., and Dillner, A. M.: Quantifying organic matter and functional groups in particulate matter filter samples from the southeastern United States – Part 1: Methods, Atmos. Meas. Tech., 12, 5391–5415, https://doi.org/10.5194/amt-12-5391-2019, 2019. a
Bruns, E. A., Krapf, M., Orasche, J., Huang, Y., Zimmermann, R., Drinovec, L., Močnik, G., El-Haddad, I., Slowik, J. G., Dommen, J., Baltensperger, U., and Prévôt, A. S. H.: Characterization of primary and secondary wood combustion products generated under different burner loads, Atmos. Chem. Phys., 15, 2825–2841, https://doi.org/10.5194/acp-15-2825-2015, 2015. a
Bruns, E. A., Slowik, J. G., El Haddad, I., Kilic, D., Klein, F., Dommen, J., Temime-Roussel, B., Marchand, N., Baltensperger, U., and Prévôt, A. S. H.: Characterization of gas-phase organics using proton transfer reaction time-of-flight mass spectrometry: fresh and aged residential wood combustion emissions, Atmos. Chem. Phys., 17, 705–720, https://doi.org/10.5194/acp-17-705-2017, 2017. a
Canagaratna, M. R., Jayne, J. T., Jimenez, J. L., Allan, J. D., Alfarra, M. R., Zhang, Q., Onasch, T. B., Drewnick, F., Coe, H., Middlebrook, A., Delia, A., Williams, L. R., Trimborn, A. M., Northway, M. J., DeCarlo, P. F., Kolb, C. E., Davidovits, P., and Worsnop, D. R.: Chemical and Microphysical Characterization of Ambient Aerosols with the Aerodyne Aerosol Mass Spectrometer, Mass Spectrom. Rev., 26, 185–222, https://doi.org/10.1002/mas.20115, 2007. a, b, c
Canagaratna, M. R., Jimenez, J. L., Kroll, J. H., Chen, Q., Kessler, S. H., Massoli, P., Hildebrandt Ruiz, L., Fortner, E., Williams, L. R., Wilson, K. R., Surratt, J. D., Donahue, N. M., Jayne, J. T., and Worsnop, D. R.: Elemental ratio measurements of organic compounds using aerosol mass spectrometry: characterization, improved calibration, and implications, Atmos. Chem. Phys., 15, 253–272, https://doi.org/10.5194/acp-15-253-2015, 2015. a, b, c, d, e
Chhabra, P. S., Ng, N. L., Canagaratna, M. R., Corrigan, A. L., Russell, L. M., Worsnop, D. R., Flagan, R. C., and Seinfeld, J. H.: Elemental composition and oxidation of chamber organic aerosol, Atmos. Chem. Phys., 11, 8827–8845, https://doi.org/10.5194/acp-11-8827-2011, 2011. a, b, c
Chong, I.-G. and Jun, C.-H.: Performance of Some Variable Selection Methods When Multicollinearity Is Present, Chemometr. Intell. Lab., 78, 103–112, https://doi.org/10.1016/j.chemolab.2004.12.011, 2005. a
Corrigan, A. L., Russell, L. M., Takahama, S., Äijälä, M., Ehn, M., Junninen, H., Rinne, J., Petäjä, T., Kulmala, M., Vogel, A. L., Hoffmann, T., Ebben, C. J., Geiger, F. M., Chhabra, P., Seinfeld, J. H., Worsnop, D. R., Song, W., Auld, J., and Williams, J.: Biogenic and biomass burning organic aerosol in a boreal forest at Hyytiälä, Finland, during HUMPPA-COPEC 2010, Atmos. Chem. Phys., 13, 12233–12256, https://doi.org/10.5194/acp-13-12233-2013, 2013. a
DeCarlo, P. F., Kimmel, J. R., Trimborn, A., Northway, M. J., Jayne, J. T., Aiken, A. C., Gonin, M., Fuhrer, K., Horvath, T., Docherty, K. S., Worsnop, D. R., and Jimenez, J. L.: Field-Deployable, High-Resolution, Time-of-Flight Aerosol Mass Spectrometer, Anal. Chem., 78, 8281–8289, https://doi.org/10.1021/ac061249n, 2006. a
Duplissy, J., DeCarlo, P. F., Dommen, J., Alfarra, M. R., Metzger, A., Barmpadimos, I., Prevot, A. S. H., Weingartner, E., Tritscher, T., Gysel, M., Aiken, A. C., Jimenez, J. L., Canagaratna, M. R., Worsnop, D. R., Collins, D. R., Tomlinson, J., and Baltensperger, U.: Relating hygroscopicity and composition of organic aerosol particulate matter, Atmos. Chem. Phys., 11, 1155–1165, https://doi.org/10.5194/acp-11-1155-2011, 2011. a
Eadon, G., Djerassi, C., Beynon, J. H., and Caprioli, R. M.: The Fragmentation of Aliphatic Ketones in the Mass Spectrometer: A Detailed Study of Nonan-4-One Using Ion Kinetic Energy Spectroscopy, Int. J. Mass Spectrom., 5, 917–933, https://doi.org/10.1002/oms.1210050803, 1971. a
Faber, P., Drewnick, F., Bierl, R., and Borrmann, S.: Complementary Online Aerosol Mass Spectrometry and Offline FT-IR Spectroscopy Measurements: Prospects and Challenges for the Analysis of Anthropogenic Aerosol Particle Emissions, Atmos. Environ., 166, 92–98, https://doi.org/10.1016/j.atmosenv.2017.07.014, 2017. a, b, c, d, e, f, g, h
Frossard, A. A., Shaw, P. M., Russell, L. M., Kroll, J. H., Canagaratna, M. R., Worsnop, D. R., Quinn, P. K., and Bates, T. S.: Springtime Arctic Haze Contributions of Submicron Organic Particles from European and Asian Combustion Sources, J. Geophys. Res., 116, D05205, https://doi.org/10.1029/2010JD015178, 2011. a
Frossard, A. A., Russell, L. M., Massoli, P., Bates, T. S., and Quinn, P. K.: Side-by-Side Comparison of Four Techniques Explains the Apparent Differences in the Organic Composition of Generated and Ambient Marine Aerosol Particles, Aerosol Sci. Tech., 48, v–x, https://doi.org/10.1080/02786826.2013.879979, 2014. a, b
Gilardoni, S., Liu, S., Takahama, S., Russell, L. M., Allan, J. D., Steinbrecher, R., Jimenez, J. L., De Carlo, P. F., Dunlea, E. J., and Baumgardner, D.: Characterization of organic ambient aerosol during MIRAGE 2006 on three platforms, Atmos. Chem. Phys., 9, 5417–5432, https://doi.org/10.5194/acp-9-5417-2009, 2009. a, b
Grieshop, A. P., Donahue, N. M., and Robinson, A. L.: Laboratory investigation of photochemical oxidation of organic aerosol from wood fires 2: analysis of aerosol mass spectrometer data, Atmos. Chem. Phys., 9, 2227–2240, https://doi.org/10.5194/acp-9-2227-2009, 2009. a
Haaland, D. M. and Thomas, E. V.: Partial Least-Squares Methods for Spectral Analyses. 1. Relation to Other Quantitative Calibration Methods and the Extraction of Qualitative Information, Anal. Chem., 60, 1193–1202, https://doi.org/10.1021/ac00162a020, 1988. a
Hallquist, M., Wenger, J. C., Baltensperger, U., Rudich, Y., Simpson, D., Claeys, M., Dommen, J., Donahue, N. M., George, C., Goldstein, A. H., Hamilton, J. F., Herrmann, H., Hoffmann, T., Iinuma, Y., Jang, M., Jenkin, M. E., Jimenez, J. L., Kiendler-Scharr, A., Maenhaut, W., McFiggans, G., Mentel, Th. F., Monod, A., Prévôt, A. S. H., Seinfeld, J. H., Surratt, J. D., Szmigielski, R., and Wildt, J.: The formation, properties and impact of secondary organic aerosol: current and emerging issues, Atmos. Chem. Phys., 9, 5155–5236, https://doi.org/10.5194/acp-9-5155-2009, 2009. a, b
Hastings, S. H., Watson, A. T., Williams, R. B., and Anderson, J. A.: Determination of Hydrocarbon Functional Groups by Infrared Spectroscopy, Anal. Chem., 24, 612–618, https://doi.org/10.1021/ac60064a002, 1952. a
Heald, C. L., Kroll, J. H., Jimenez, J. L., Docherty, K. S., DeCarlo, P. F., Aiken, A. C., Chen, Q., Martin, S. T., Farmer, D. K., and Artaxo, P.: A Simplified Description of the Evolution of Organic Aerosol Composition in the Atmosphere, Geophys. Res. Lett., 37, L08803, https://doi.org/10.1029/2010GL042737, 2010. a, b
Helland, I. S.: On the Structure of Partial Least Squares Regression, Commun. Stat.-Simulat. C., 17, 581–607, https://doi.org/10.1080/03610918808812681, 1988. a
Hennigan, C. J., Sullivan, A. P., Collett, J. L., and Robinson, A. L.: Levoglucosan Stability in Biomass Burning Particles Exposed to Hydroxyl Radicals, Geophys. Res. Lett., 37, L09806, https://doi.org/10.1029/2010GL043088, 2010. a
Heringa, M. F., DeCarlo, P. F., Chirico, R., Tritscher, T., Dommen, J., Weingartner, E., Richter, R., Wehrle, G., Prévôt, A. S. H., and Baltensperger, U.: Investigations of primary and secondary particulate matter of different wood combustion appliances with a high-resolution time-of-flight aerosol mass spectrometer, Atmos. Chem. Phys., 11, 5945–5957, https://doi.org/10.5194/acp-11-5945-2011, 2011. a
Iyer, S., Lopez-Hilfiker, F., Lee, B. H., Thornton, J. A., and Kurtén, T.: Modeling the Detection of Organic and Inorganic Compounds Using Iodide-Based Chemical Ionization, J. Phys. Chem. A, 120, 576–587, https://doi.org/10.1021/acs.jpca.5b09837, 2016. a
Jathar, S. H., Cappa, C. D., Wexler, A. S., Seinfeld, J. H., and Kleeman, M. J.: Multi-generational oxidation model to simulate secondary organic aerosol in a 3-D air quality model, Geosci. Model Dev., 8, 2553–2567, https://doi.org/10.5194/gmd-8-2553-2015, 2015. a
Kumar, N. K., Corbin, J. C., Bruns, E. A., Massabó, D., Slowik, J. G., Drinovec, L., Močnik, G., Prati, P., Vlachou, A., Baltensperger, U., Gysel, M., El-Haddad, I., and Prévôt, A. S. H.: Production of particulate brown carbon during atmospheric aging of residential wood-burning emissions, Atmos. Chem. Phys., 18, 17843–17861, https://doi.org/10.5194/acp-18-17843-2018, 2018. a, b
Kuzmiakova, A., Dillner, A. M., and Takahama, S.: An automated baseline correction protocol for infrared spectra of atmospheric aerosols collected on polytetrafluoroethylene (Teflon) filters, Atmos. Meas. Tech., 9, 2615–2631, https://doi.org/10.5194/amt-9-2615-2016, 2016. a
Lambe, A. T., Onasch, T. B., Croasdale, D. R., Wright, J. P., Martin, A. T., Franklin, J. P., Massoli, P., Kroll, J. H., Canagaratna, M. R., Brune, W. H., Worsnop, D. R., and Davidovits, P.: Transitions from Functionalization to Fragmentation Reactions of Laboratory Secondary Organic Aerosol (SOA) Generated from the OH Oxidation of Alkane Precursors, Environ. Sci. Technol., 46, 5430–5437, https://doi.org/10.1021/es300274t, 2012. a, b
Li, J., Li, J., Wang, G., Zhang, T., Dai, W., Ho, K. F., Wang, Q., Shao, Y., Wu, C., and Li, L.: Molecular Characteristics of Organic Compositions in Fresh and Aged Biomass Burning Aerosols, Sci. Total Environ., 741, 140247, https://doi.org/10.1016/j.scitotenv.2020.140247, 2020. a
Li, Y. J., Yeung, J. W. T., Leung, T. P. I., Lau, A. P. S., and Chan, C. K.: Characterization of Organic Particles from Incense Burning Using an Aerodyne High-Resolution Time-of-Flight Aerosol Mass Spectrometer, Aerosol Sci. Tech., 46, 654–665, https://doi.org/10.1080/02786826.2011.653017, 2012. a, b
Liu, S., Day, D. A., Shields, J. E., and Russell, L. M.: Ozone-driven daytime formation of secondary organic aerosol containing carboxylic acid groups and alkane groups, Atmos. Chem. Phys., 11, 8321–8341, https://doi.org/10.5194/acp-11-8321-2011, 2011. a, b
Liu, S., Ahlm, L., Day, D. A., Russell, L. M., Zhao, Y., Gentner, D. R., Weber, R. J., Goldstein, A. H., Jaoui, M., Offenberg, J. H., Kleindienst, T. E., Rubitschun, C., Surratt, J. D., Sheesley, R. J., and Scheller, S.: Secondary Organic Aerosol Formation from Fossil Fuel Sources Contribute Majority of Summertime Organic Mass at Bakersfield, J. Geophys. Res., 117, D00V26, https://doi.org/10.1029/2012JD018170, 2012. a
Lopez-Hilfiker, F. D., Pospisilova, V., Huang, W., Kalberer, M., Mohr, C., Stefenelli, G., Thornton, J. A., Baltensperger, U., Prevot, A. S. H., and Slowik, J. G.: An extractive electrospray ionization time-of-flight mass spectrometer (EESI-TOF) for online measurement of atmospheric aerosol particles, Atmos. Meas. Tech., 12, 4867–4886, https://doi.org/10.5194/amt-12-4867-2019, 2019. a
Maria, S. F., Russell, L. M., Turpin, B. J., and Porcja, R. J.: FTIR Measurements of Functional Groups and Organic Mass in Aerosol Samples over the Caribbean, Atmos. Environ., 36, 5185–5196, https://doi.org/10.1016/S1352-2310(02)00654-4, 2002. a, b
Maria, S. F., Russell, L. M., Turpin, B. J., Porcja, R. J., Campos, T. L., Weber, R. J., and Huebert, B. J.: Source Signatures of Carbon Monoxide and Organic Functional Groups in Asian Pacific Regional Aerosol Characterization Experiment (ACE-Asia) Submicron Aerosol Types, J. Geophys. Res., 108, 8637, https://doi.org/10.1029/2003JD003703, 2003. a
Nozière, B., Kalberer, M., Claeys, M., Allan, J., D'Anna, B., Decesari, S., Finessi, E., Glasius, M., Grgić, I., Hamilton, J. F., Hoffmann, T., Iinuma, Y., Jaoui, M., Kahnt, A., Kampf, C. J., Kourtchev, I., Maenhaut, W., Marsden, N., Saarikoski, S., Schnelle-Kreis, J., Surratt, J. D., Szidat, S., Szmigielski, R., and Wisthaler, A.: The Molecular Identification of Organic Compounds in the Atmosphere: State of the Art and Challenges, Chem. Rev., 115, 3919–3983, https://doi.org/10.1021/cr5003485, 2015. a
Parks, D. A., Griffiths, P. R., Weakley, A. T., and Miller, A. L.: Quantifying Elemental and Organic Carbon in Diesel Particulate Matter by Mid-Infrared Spectrometry, Aerosol Sci. Tech., 55, 1014–1027, https://doi.org/10.1080/02786826.2021.1917764, 2021. a
Pavia, D. L., Lampman, G. M., Kriz, G. S., and Vyvyan, J. A.: Introduction to Spectroscopy, 4th edn., Brooks Cole, Belmont, CA, 2008. a, b, c, d, e, f, g, h, i
Reggente, M., Dillner, A. M., and Takahama, S.: Analysis of functional groups in atmospheric aerosols by infrared spectroscopy: systematic intercomparison of calibration methods for US measurement network samples, Atmos. Meas. Tech., 12, 2287–2312, https://doi.org/10.5194/amt-12-2287-2019, 2019a. a, b, c
Reggente, M., Höhn, R., and Takahama, S.: An open platform for Aerosol InfraRed Spectroscopy analysis – AIRSpec, Atmos. Meas. Tech., 12, 2313–2329, https://doi.org/10.5194/amt-12-2313-2019, 2019b. a
Ruggeri, G.: On the Functional Group Composition of Organic Aerosol, PhD thesis, Ecole Polytechnique Federale de Lausanne (EPFL), Lausanne, https://doi.org/10.5075/epfl-thesis-7578, 2017. a
Russell, L. M.: Aerosol Organic-Mass-to-Organic-Carbon Ratio Measurements, Environ. Sci. Technol., 37, 2982–2987, https://doi.org/10.1021/es026123w, 2003. a, b
Russell, L. M., Bahadur, R., Hawkins, L. N., Allan, J., Baumgardner, D., Quinn, P. K., and Bates, T. S.: Organic Aerosol Characterization by Complementary Measurements of Chemical Bonds and Molecular Fragments, Atmos. Environ., 43, 6100–6105, https://doi.org/10.1016/j.atmosenv.2009.09.036, 2009a. a, b, c, d, e
Russell, L. M., Takahama, S., Liu, S., Hawkins, L. N., Covert, D. S., Quinn, P. K., and Bates, T. S.: Oxygenated Fraction and Mass of Organic Aerosol from Direct Emission and Atmospheric Processing Measured on the R/V Ronald Brown during TEXAQS/GoMACCS 2006, J. Geophys. Res., 114, D00F05, https://doi.org/10.1029/2008JD011275, 2009b. a, b, c, d
Ruthenburg, T. C., Perlin, P. C., Liu, V., McDade, C. E., and Dillner, A. M.: Determination of Organic Matter and Organic Matter to Organic Carbon Ratios by Infrared Spectroscopy with Application to Selected Sites in the IMPROVE Network, Atmos. Environ., 86, 47–57, https://doi.org/10.1016/j.atmosenv.2013.12.034, 2014. a, b
Schneider, J., Weimer, S., Drewnick, F., Borrmann, S., Helas, G., Gwaze, P., Schmid, O., Andreae, M. O., and Kirchner, U.: Mass Spectrometric Analysis and Aerodynamic Properties of Various Types of Combustion-Related Aerosol Particles, Int. J. Mass Spectrom., 258, 37–49, https://doi.org/10.1016/j.ijms.2006.07.008, 2006. a, b
Shiraiwa, M., Ueda, K., Pozzer, A., Lammel, G., Kampf, C. J., Fushimi, A., Enami, S., Arangio, A. M., Fröhlich-Nowoisky, J., Fujitani, Y., Furuyama, A., Lakey, P. S. J., Lelieveld, J., Lucas, K., Morino, Y., Pöschl, U., Takahama, S., Takami, A., Tong, H., Weber, B., Yoshino, A., and Sato, K.: Aerosol Health Effects from Molecular to Global Scales, Environ. Sci. Technol., 51, 13545–13567, https://doi.org/10.1021/acs.est.7b04417, 2017. a
Subramanian, R., Khlystov, A. Y., Cabada, J. C., and Robinson, A. L.: Positive and Negative Artifacts in Particulate Organic Carbon Measurements with Denuded and Undenuded Sampler Configurations Special Issue of Aerosol Science and Technology on Findings from the Fine Particulate Matter Supersites Program, Aerosol Sci. Tech., 38, 27–48, https://doi.org/10.1080/02786820390229354, 2004. a, b, c
Sun, Y. L., Zhang, Q., Anastasio, C., and Sun, J.: Insights into secondary organic aerosol formed via aqueous-phase reactions of phenolic compounds based on high resolution mass spectrometry, Atmos. Chem. Phys., 10, 4809–4822, https://doi.org/10.5194/acp-10-4809-2010, 2010. a
Takahama, S., Johnson, A., and Russell, L. M.: Quantification of Carboxylic and Carbonyl Functional Groups in Organic Aerosol Infrared Absorbance Spectra, Aerosol Sci. Tech., 47, 310–325, https://doi.org/10.1080/02786826.2012.752065, 2013. a, b, c
Takahama, S., Ruggeri, G., and Dillner, A. M.: Analysis of functional groups in atmospheric aerosols by infrared spectroscopy: sparse methods for statistical selection of relevant absorption bands, Atmos. Meas. Tech., 9, 3429–3454, https://doi.org/10.5194/amt-9-3429-2016, 2016. a
Theodoritsi, G. N., Ciarelli, G., and Pandis, S. N.: Simulation of the evolution of biomass burning organic aerosol with different volatility basis set schemes in PMCAMx-SRv1.0, Geosci. Model Dev., 14, 2041–2055, https://doi.org/10.5194/gmd-14-2041-2021, 2021. a
Tiitta, P., Leskinen, A., Hao, L., Yli-Pirilä, P., Kortelainen, M., Grigonyte, J., Tissari, J., Lamberg, H., Hartikainen, A., Kuuspalo, K., Kortelainen, A.-M., Virtanen, A., Lehtinen, K. E. J., Komppula, M., Pieber, S., Prévôt, A. S. H., Onasch, T. B., Worsnop, D. R., Czech, H., Zimmermann, R., Jokiniemi, J., and Sippula, O.: Transformation of logwood combustion emissions in a smog chamber: formation of secondary organic aerosol and changes in the primary organic aerosol upon daytime and nighttime aging, Atmos. Chem. Phys., 16, 13251–13269, https://doi.org/10.5194/acp-16-13251-2016, 2016. a, b
Tolbert, A. and Ragauskas, A. J.: Advances in Understanding the Surface Chemistry of Lignocellulosic Biomass via Time-of-Flight Secondary Ion Mass Spectrometry, Energy Sci. Eng., 5, 5–20, https://doi.org/10.1002/ese3.144, 2017. a, b
Turpin, B. J. and Lim, H.-J.: Species Contributions to PM2.5 Mass Concentrations: Revisiting Common Assumptions for Estimating Organic Mass, Aerosol Sci. Tech., 35, 602–610, https://doi.org/10.1080/02786820119445, 2001. a, b
Volkamer, R., Jimenez, J. L., Martini, F. S., Dzepina, K., Zhang, Q., Salcedo, D., Molina, L. T., Worsnop, D. R., and Molina, M. J.: Secondary Organic Aerosol Formation from Anthropogenic Air Pollution: Rapid and Higher than Expected, Geophys. Res. Lett., 33, L17811, https://doi.org/10.1029/2006GL026899, 2006. a
Wang, N., Kostenidou, E., Donahue, N. M., and Pandis, S. N.: Multi-generation chemical aging of α-pinene ozonolysis products by reactions with OH, Atmos. Chem. Phys., 18, 3589–3601, https://doi.org/10.5194/acp-18-3589-2018, 2018. a
Wold, S., Martens, H., and Wold, H.: The Multivariate Calibration Problem in Chemistry Solved by the PLS Method, in: Matrix Pencils, edited by: Kågström, B. and Ruhe, A., Lect. Notes Math., Springer Berlin Heidelberg, 286–293, 1983. a
Wold, S., Johansson, E., and Cocchi, M.: 3D QSAR in Drug Design: Theory, Methods and Applications, ESCOM, Leiden, Holland, 523–550, 1993. a
Xu, W., Lambe, A., Silva, P., Hu, W., Onasch, T., Williams, L., Croteau, P., Zhang, X., Renbaum-Wolff, L., Fortner, E., Jimenez, J. L., Jayne, J., Worsnop, D., and Canagaratna, M.: Laboratory Evaluation of Species-Dependent Relative Ionization Efficiencies in the Aerodyne Aerosol Mass Spectrometer, Aerosol Sci. Tech., 52, 626–641, https://doi.org/10.1080/02786826.2018.1439570, 2018. a
Yazdani, A., Dillner, A. M., and Takahama, S.: Estimating mean molecular weight, carbon number, and with mid-infrared spectroscopy in organic particulate matter samples from a monitoring network, Atmos. Meas. Tech., 14, 4805–4827, https://doi.org/10.5194/amt-14-4805-2021, 2021a. a
Yazdani, A., Dudani, N., Takahama, S., Bertrand, A., Prévôt, A. S. H., El Haddad, I., and Dillner, A. M.: Characterization of primary and aged wood burning and coal combustion organic aerosols in an environmental chamber and its implications for atmospheric aerosols, Atmos. Chem. Phys., 21, 10273–10293, https://doi.org/10.5194/acp-21-10273-2021, 2021b. a, b, c, d, e, f, g, h, i, j, k, l, m, n, o, p, q, r, s, t
Yazdani, A., Dudani, N., Takahama, S., Bertrand, A., Prévôt, A. S. H., El Haddad, I., and Dillner, A. M.: AMS and FTIR spectra of primary and aged fine PM from wood burning and coal combustion, Zenodo [data set], https://doi.org/10.5281/zenodo.4882967, 2021c. a
Yazdani, A., Dudani, N., Takahama, S., Bertrand, A., Prévôt, A. S. H., El Haddad, I., and Dillner, A. M.: AMS and FTIR measurements and the corresponding codes for their statistical combination, Zenodo [data set], https://doi.org/10.5281/zenodo.5872710, 2022. a
Zahardis, J., Geddes, S., and Petrucci, G. A.: Improved Understanding of Atmospheric Organic Aerosols via Innovations in Soft Ionization Aerosol Mass Spectrometry, Anal. Chem., 83, 2409–2415, https://doi.org/10.1021/ac102737k, 2011. a
Zhang, Q., Worsnop, D. R., Canagaratna, M. R., and Jimenez, J. L.: Hydrocarbon-like and oxygenated organic aerosols in Pittsburgh: insights into sources and processes of organic aerosols, Atmos. Chem. Phys., 5, 3289–3311, https://doi.org/10.5194/acp-5-3289-2005, 2005. a, b
Zhang, Q., Jimenez, J. L., Canagaratna, M. R., Ulbrich, I. M., Ng, N. L., Worsnop, D. R., and Sun, Y.: Understanding Atmospheric Organic Aerosols via Factor Analysis of Aerosol Mass Spectrometry: A Review, Anal. Bioanal. Chem., 401, 3045–3067, https://doi.org/10.1007/s00216-011-5355-y, 2011. a, b
Ziemann, P. J. and Atkinson, R.: Kinetics, Products, and Mechanisms of Secondary Organic Aerosol Formation, Chem. Soc. Rev., 41, 6582–6605, https://doi.org/10.1039/C2CS35122F, 2012. a