the Creative Commons Attribution 4.0 License.
the Creative Commons Attribution 4.0 License.
 | 12 May 2022
Combined UV and IR ozone profile retrieval from TROPOMI and CrIS measurements
Nora Mettig
Mark Weber
Alexei Rozanov
John P. Burrows
Pepijn Veefkind
Anne M. Thompson
Ryan M. Stauffer
Thierry Leblanc
Gerard Ancellet
Michael J. Newchurch
Shi Kuang
Rigel Kivi
Matthew B. Tully
Roeland Van Malderen
Ankie Piters
Bogumil Kois
René Stübi
Pavla Skrivankova
Vertical ozone profiles from combined spectral measurements in the ultraviolet and infrared spectral range were retrieved by using data from the TROPOspheric Monitoring Instrument on the Sentinel-5 Precursor (TROPOMI/S5P) and the Cross-track Infrared Sounder on the Suomi National Polar-orbiting Partnership (CrIS/Suomi-NPP), which are flying in loose formation 3 min apart in the same orbit. A previous study of ozone profiles retrieved exclusively from TROPOMI UV spectra showed that the vertical resolution in the troposphere is clearly limited (Mettig et al., 2021). The vertical resolution and the vertical extent of the ozone profiles is improved by combining both wavelength ranges compared to retrievals limited to UV or IR spectral data only. The combined retrieval particularly improves the accuracy of the retrieved tropospheric ozone and to a lesser degree stratospheric ozone up to 30 km. An increase in the degrees of freedom (DOF) by 1 DOF was found in the UV + IR retrieval compared to the UV-only retrieval. Compared to previous publications, which investigated combinations of UV and IR observations from the Ozone Monitoring Instrument and Tropospheric Emission Spectrometer (OMI and TES) and Global Ozone Monitoring Experiment version 2 and Infrared Atmospheric Sounding Interferometer (GOME-2 and IASI) pairs, the degree of freedom is lower, which is attributed to the reduced spectral resolution of CrIS compared to TES or IASI. Tropospheric lidar and ozonesondes were used to validate the ozone profiles and tropospheric ozone content (TOC). In their comparison with tropospheric lidars, both ozone profiles and TOCs show smaller biases for the retrieved data from the combined UV + IR observation than from the UV observations alone. For the ozone profiles below 10 km, the mean differences are around ±10 % and the mean TOC varies around ±3 DU. We show that TOCs from the combined retrieval agree better with ozonesonde results at northern latitudes than the UV-only and IR-only retrievals and also have lower scatter. In the tropics, the IR-only retrieval shows the best agrement with TOCs derived from ozonesondes. While in general the TOCs show good agreement with ozonesonde data, the profiles have a positive bias of around 30 % between 10 and 15 km. The reason is probably a positive stratospheric bias from the IR retrieval. The comparison of the UV + IR and UV ozone profiles up to 30 km with the Microwave Limb Sounder (MLS) demonstrates the improvement of the UV + IR profile in the stratosphere above 18 km. In comparison to the UV-only approach the retrieval shows improvements of up to 10 % depending on latitude but can also show worse results in some regions and latitudes.
- Article
(7977 KB) - Full-text XML
-
Supplement
(4488 KB) - BibTeX
- EndNote


The accurate observation of the vertical distribution of ozone is essential to assess the recovery of the stratospheric ozone layer following the measures taken to phase out ozone-depleting substances (ODSs) by the Montreal Protocol in 1987 and its amendments (World Meteorological Organization, 2018). In order to assess the role of tropospheric ozone for air quality (Lefohn et al., 2018) and climate change (IPCC, 2021), accurate measurements of tropospheric ozone are required as well. While sparse in situ measurements, such as ozonesondes and ground-based lidar ozone profiles, have a higher accuracy and vertical resolution, passive remote sensing instruments observing in nadir provide near-global coverage. However, the vertical resolution of the ozone profiles from nadir satellite measurements is coarser by a factor of 3 in the stratosphere (e.g. 2–3 km for the Microwave Limb Sounder (MLS) compared to 6–10 km for the TROPOspheric Monitoring Instrument (TROPOMI)). Ozone profile retrievals using different satellite measurement techniques (solar/lunar/stellar occultation, limb, and nadir) in different spectral wavelength ranges, e.g. ultraviolet (UV), infrared (IR), and microwave, have been developed and evolved over the past decades. Rayleigh scattering and the ozone absorption in its Hartley (200–310 nm) and Huggins (310–350 nm) bands result in the penetration of UV radiation being strongly wavelength dependent. As first pointed out by Singer and Wentworth (1957), this provides an opportunity to determine vertical profiles of ozone, when observing the UV upwelling radiance from satellite platforms.
Starting with the Global Ozone Monitoring Experiment (GOME) instrument, vertical ozone profiles from the troposphere up to the higher stratosphere were retrieved using highly resolved continuous spectra in the UV (Hoogen et al., 1999; Hasekamp and Landgraf, 2001). One focus has been on improving tropospheric ozone, with Liu et al. (2005) highlighting the importance of extensive spectral corrections needed before a retrieval is possible. Ozone profiles were also retrieved from the GOME-2 successor instrument aboard the series of MetOp platforms (Miles et al., 2015) and used to generate contiguous time series from multiple instruments (van Peet et al., 2014). Long-term analysis of ozone profiles is also possible with the Ozone Monitoring Instrument (OMI) instrument (Huang et al., 2017), which was launched on Aura in 2004 and is still working today. After an extensive recalibration, it is possible to determine profiles in the stratosphere and tropospheric ozone with an accuracy of up to 10 % (Liu et al., 2010b, a). Through validation with ozone sensors and lidar measurements, similar results were also obtained for the UV measurements from TROPOMI on the Sentinel-5 Precursor (S5P) (Mettig et al., 2021).
While the major challenge for the profiles from UV measurements is the low vertical resolution in the altitude range below 20 km, ozone profiles from IR measurements provide more information about the troposphere but typically do not retrieve ozone above about 30 km (Bowman et al., 2002). IR ozone profile retrievals use the atmospheric emission in the thermal infrared (TIR) spectral range within the 9.6 µm ozone absorption band. Vertical ozone profiles and tropospheric ozone were derived from the Tropospheric Emission Spectrometer (TES) on Aura (Bowman et al., 2006; Worden, 2004) and from the Infrared Atmospheric Sounding Interferometer (IASI) on MetOp-A,-B, and -C (Eremenko et al., 2008; Boynard et al., 2009). Together with the Advanced Technology Microwave Sounder (ATMS), the Cross-track Infrared Sounder (CrIS) on Suomi National Polar-orbiting Partnership (Suomi-NPP) provides temperature and many trace gas profiles. For the ozone profile retrieval, an overall accuracy of 10 % and a precision of 20 % up to 35 km are possible using CrIS IR measurements (Nalli et al., 2018). However, CrIS's vertical resolution is limited and only 1.9 degrees of freedom (DOF), corresponding to the information content of two atmospheric layers can be achieved (Smith and Barnet, 2019, 2020).
Combining UV and IR spectral measurements from different instruments improves the information content of ozone profile retrievals providing a high vertical resolution in the stratosphere up to 55 km determined by the UV region and a high vertical resolution in the troposphere from using the IR range. The two spectral ranges complement each other particularly well. In the UV spectral range, the profile information is derived from the different penetration depths of the short-wave radiation, which works very well at altitudes above the ozone maximum but worse in the levels near the ground. In the IR range, thermal radiation is emitted by the atmosphere and surface and weakens with the decreasing air density in the upper atmosphere. The concept of using combined UV and TIR observations to improve the retrieval of vertical profiles of ozone was first discussed in the geostationary tropospheric pollution explorer (GeoTROPE) mission concept (Burrows et al., 2004). The improvement in tropospheric ozone was shown for several combinations of instruments: simulated OMI and TES measurements (Landgraf and Hasekamp, 2007), real OMI and TES measurements (H. M. Worden et al., 2007; Fu et al., 2013), GOME-2 and IASI (Cuesta et al., 2013, 2018; Costantino et al., 2017), and OMI together with AIRS (Fu et al., 2018). From validation with ozonesondes in the studies with OMI + TES and GOME-2 + IASI, it was found that the relative mean bias and the root mean square (rms) of the combined ozone profile retrieval are reduced in comparison to the UV-only retrieval. For GOME-2 + IASI, an increase of total DOF from 3.3 DOF (for both, UV and IR) to 5 DOF (UV and IR combined) was found, of which 1.6 DOF are in the troposphere (<12 km) (Cuesta et al., 2013). Using OMI and TES, 6.8 DOF were achieved for the entire atmosphere (UV: 5.5 DOF, IR: 4.3 DOF) with around 2 DOF below 20 km (UV: 1 DOF, IR: 1.7 DOF).
Here, we present ozone profiles retrieved from combined TROPOMI UV and CrIS IR measurements. For both instruments individually, ozone profiles have been successfully retrieved (Mettig et al., 2021; Barnet, 2019a) but their measurements have not been combined so far. We show and discuss the capabilities and limits of the combined retrieval, present some diagnostics, and validate the results by comparisons with ozonesondes and lidars. The main difference from earlier combined UV+IR retrievals is the lower spectral resolution of the IR part (CrIS). The infrared spectrometers TES and IASI have a better spectral resolution: TES 0.1 cm−1 and IASI 0.25 cm−1 compared to 0.625 cm−1 for CrIS. The question to be answered is whether and to what extent an improvement of the vertical ozone profile retrieval can be achieved in combination with CrIS.
2.1 TROPOMI
TROPOMI (TROPOspheric Monitoring Instrument) is a nadir-viewing ultraviolet and visual spectrometer aboard the S5P satellite. It was launched in October 2017 as part of the Copernicus Programme and was supposed to close the gap between the past Envisat (until 2012), the current OMI and Aura, and the future Sentinel-5 spacecraft (launch planned in 2023). S5P moves in a Sun-synchronous orbit with an equatorial crossing time of 13:30 LT. The instrument provides measurements in the UV (270–330 nm), VIS (320–500 nm), NIR (675–775 nm), and SWIR (2305–2385 nm) spectral channels (Veefkind et al., 2012). For the ozone profile retrieval, only the UV1 (270–300 nm) and UV2 (300–330 nm) radiance channels are used. Both channels have a spectral resolution of 0.5 nm and a sampling of 0.065 nm. The spatial resolution depends on the channel and on the position in the swath. At the nadir-viewing points it is 28.8 × 5.6 km2 (cross track × along track) in UV1 and 3.6 × 5.6 km2 in UV2. The smaller TROPOMI pixels are binned together to match the coarser spatial resolution of CrIS. Using the cloud-cleared radiance L2 product from CrIS, the spatial resolution ends up being 42 × 42 km2.
TROPOMI, like other instruments of this type, shows drift and degradation effects in the UV channels and needs an extensive pre- and post-launch calibration (Ludewig et al., 2020). For this study, we use the Level 1B version 2 data. In our UV-only retrieval, additional calibration steps as part of the profile retrieval are needed (Mettig et al., 2021). The version 2 data set is limited to 12 weeks distributed over the period from July 2018 to October 2019, and all evaluations in this study are based on data from this period. Especially in the lower UV range, the measured intensities have rather low signal-to-noise ratios (SNRs). In addition to the quality parameters provided by the data sets, we only use UV1 pixels with a mean SNR greater than 20 and UV2 pixels with a mean SNR greater than 50.
2.2 CrIS
CrIS aboard Suomi-NPP is a Fourier-transform spectrometer which provides soundings in the thermal IR spectral range. Suomi-NPP moves in the same orbit as S5P in a loose formation with TROPOMI. The time difference between the measurements from both instruments above the same location is around 3 min. CrIS covers three wavelength ranges with 2211 spectral points in the long-wave, middle-wave, and short-wave infrared: LWIR (9.14–15.38 µm), MWIR (5.71–8.26 µm), and SWIR (3.92–4.64 µm) (Han et al., 2013; Strow et al., 2013; Tobin et al., 2013). The spectral resolution is 0.625 cm−1, which is coarser than that from instruments like TES or IASI. But in comparison to IASI, CrIS has lower noise. For this study, we use a spectral window in LWIR between 9.35 and 9.9 µm from the level 2 CLIMCAPS (Community Long-term Infrared Microwave Coupled Product System) full spectral resolution cloud-cleared radiance V2 data product (Barnet, 2019b). The ozone profile used in the validation part of this work and the surface temperature are taken from the level 2 CLIMCAPS atmosphere cloud and surface geophysical state V2 data product (Barnet, 2019a). Using the cloud-cleared radiances allows us to avoid cloud handling in the retrieval process and including cloudy pixels provides more collocated pixels for TROPOMI. CrIS has a field of view consisting of 3×3 circular pixels of 14 km diameter each (nadir spatial resolution). In conjunction with the cloud-clearing algorithm and due to the subsequent L2 processing, the nine field-of-view pixels are combined, resulting in an effective spatial resolution of 42 × 42 km2.
2.3 Validation data: MLS, ozonesondes, and lidars
The MLS on the NASA's Aura satellite launched in July 2004 provides thermal emission measurements from broad spectral bands near 118, 190, 240, 640, and 2500 GHz by seven microwave receivers. Aura moves in a Sun-synchronous orbit with an equatorial crossing time of 13:45 LT. The spatial sampling of MLS is ∼6 km across track and ∼200 km along track. For collocations with TROPOMI and CrIS, the maximum distance between both is chosen to be 2 h and 100 km. Vertical ozone profiles derived from MLS observations were characterised and validated extensively (Froidevaux et al., 2008; Livesey et al., 2008) and their temporal stability proven (Nair et al., 2012). In the L2 product version 5.0 used here, the altitude range is from 12 to 80 km with a vertical resolution varying between 2.5–3.5 km (Livesey et al., 2020). In the MLS user guide (Livesey et al., 2020), the precision is estimated to be 4 %–7 % with an accuracy of 5 %–10 % above 18.5 km. From the lower stratosphere downward to the troposphere, the precision of the individual profiles decreases up to 5 %–100 % (depending on the latitude) with an accuracy of 7 %–10 %.
To validate the ozone profiles in the lower stratosphere and in the troposphere, in situ ozonesonde measurements and ground-based ozone lidar data are used. The ozonesondes are provided by the World Ozone and Ultraviolet Radiation Data Center (WOUDC) (WOUDC Ozonesonde Monitoring Community et al., 2022) and the Southern Hemisphere Additional Ozonesondes (SHADOZ) (Witte et al., 2017, 2018; Thompson et al., 2017; Sterling et al., 2018). Those measurements have a high vertical resolution of 100–150 m and are well validated. The precision is on the order of 5 %, and the accuracy 5 %–10 % (Deshler et al., 2008; Johnson, 2002; Smit et al., 2007). Around the tropopause layer in the tropics, the uncertainties peak and reach about 15 %–20 % (Witte et al., 2018). During the time when TROPOMI data are available, 242 collocated ozonesonde measurements from 30 different sites were found. The collocation criteria are a maximum distance of 100 km and a maximum time difference of 24 h. The exact locations can be found in the Supplement (Table S1).
To validate the lower levels of the atmosphere, tropospheric lidars are a valuable option, because of their great vertical resolution and stable and precise ozone profile measurements. Unfortunately they are not as widely distributed as ozonesonde and stratospheric lidar sites. For the limited TROPOMI/CrIS data set, ozone profiles from three different locations are available: Table Mountain Observatory (CA, USA), University of Alabama Huntsville (AL, USA), and Observatoire de Haute-Provence (France). Both sites located in the US, Table Mountain and Huntsville, are part of the Tropospheric Ozone Lidar Network (TOLNet) (Newchurch et al., 2016). The vertical range of the ozone profiles from Huntsville and Observatoire de Haute-Provence (OHP) is 3–14 km with a precision of better than 10 % (Kuang et al., 2013; Gaudel et al., 2015). The tropospheric lidar measurements are done during daytime in Huntsville and after sunset in OHP. For Table Mountain, where ozone profiles during daytime and nighttime are available, the vertical range is increased up to 25 km during the night. The overall precision reaches from 5 % in the free troposphere to up to 15 % above 20 km (Leblanc et al., 2016).
For a comparison of the lower vertically sampled retrievals to the fine sampled tropospheric lidar and ozonesondes, a pseudo-inverse (linear) regridding (Rodgers, 2002, Sect. 10.3.1) from the finer to the coarser grid is performed. Therefore, the interpolation matrix L is inverted to
The pseudo-inverse matrix L* is applied to the fine lidar grid xfine as follows:
The ozone profiles are retrieved with the IUP Bremen TOPAS (Tikhonov regularised Ozone Profile retrievAl with SCIATRAN) algorithm as applied to TROPOMI UV measurements. It is based on the first-order Tikhonov regularisation approach (Tikhonov, 1963) and is described in detail by Mettig et al. (2021).
In general, the TOPAS algorithm comprises three steps within each iteration. The first is the radiative transfer model (RTM) calculation, where a radiance spectrum is simulated using the a priori information or the retrieval results from the previous iteration. The second step is a pre-processing to account for effects that can not be handled within the RTM, for instance, the secondary calibration and the correction for rotational Raman scattering and polarisation. In the final step, the physical quantities contained in the state vector x are determined. At the ith iterative step, the solution is given by
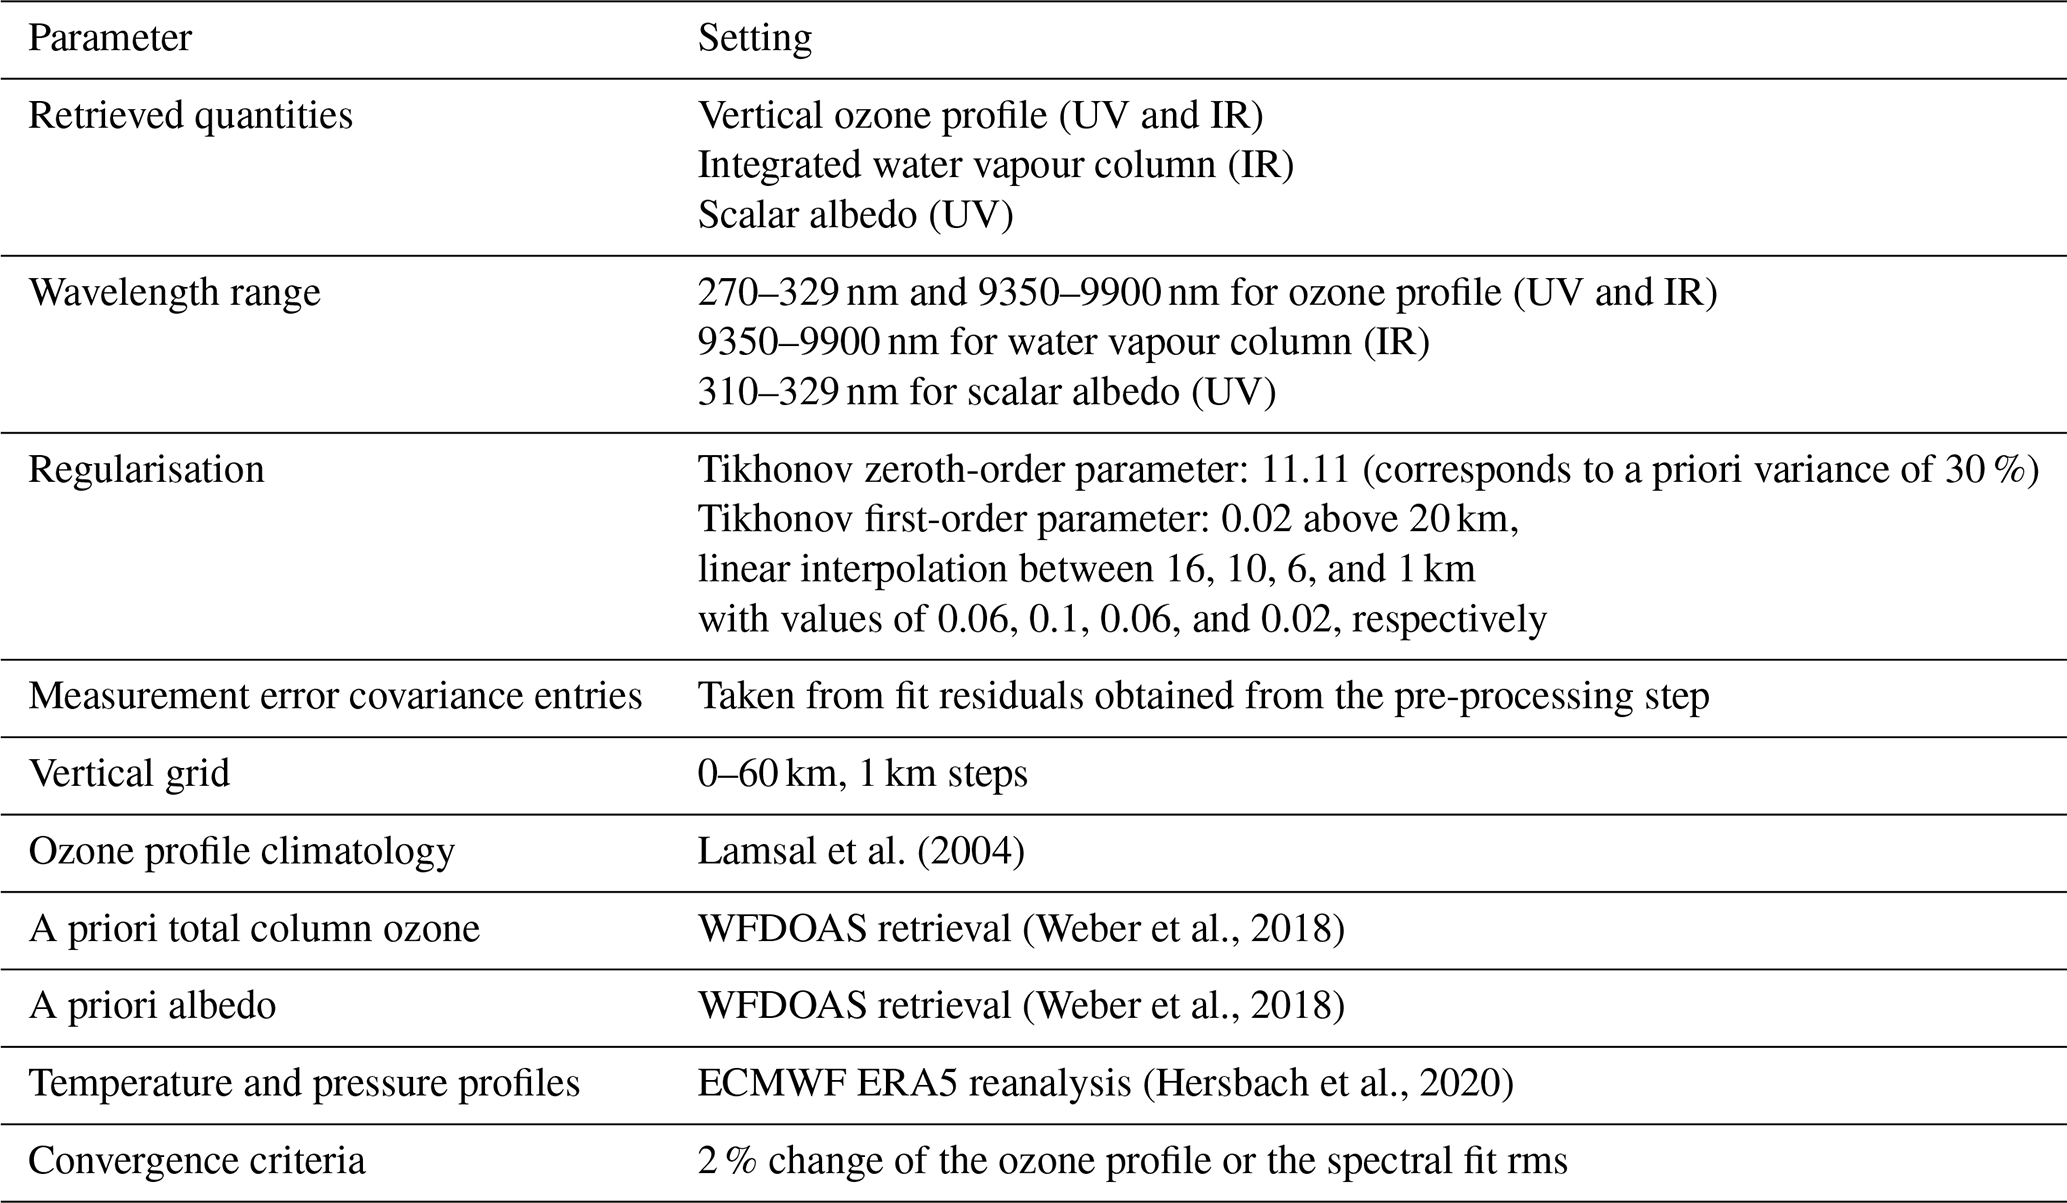
Here, the forward model simulation F(x) is compared to the measurement vector y, while the a priori state vector xa is compared to the state vector from the last iteration (or first guess values) xi. The Jacobian matrix of the forward model, K, is also referred to as the weighting function matrix. The constraints are the measurement error covariance matrix Sy and the first-order Tikhonov regularisation matrix Sr. The retrieval step comprises information from both UV and IR spectral ranges. For the final combination of the two spectral ranges, no additional steps in the Tikhonov regularisation are necessary. In contrast to the individual retrievals, the vector y contains the measurement from both spectral ranges. The forward simulation F(x) is performed according to the following two chapters for both spectral ranges, and the error covariance matrix Sy is filled with entries for both spectral ranges. All other variables and dimensions remain unchanged. The essential retrieval settings for the combined retrieval are listed in Table 1. The settings which remain the same as in the TOPAS UV-only retrieval are not explained in detail here. The corresponding information can be found in Mettig et al. (2021).
Compared to the ozone profile retrieval from TROPOMI UV data described in Mettig et al. (2021), there are two main changes: the way the measurement error covariance matrix Sy and an altitude-dependent first-order Tikhonov regularisation is constructed (see Table 1). For Sy, the fit residuals from the pre-processing step are used instead of instrument SNRs. Tests have shown that this approach works better for combined UV + IR retrievals. The underlying problem is the different SNR of TROPOMI and CrIS and the different spatial resolution of the instruments measurements before binning the pixels. The huge and fluctuating differences between the SNR in UV and IR, which are due to the binning and the illumination conditions, make it nearly impossible to stabilise the retrieval for all possible conditions. The use of fit residuals as measurement error covariance for both spectral ranges mitigates this problem and enables retrievals with constant settings which deliver meaningful results under all measurement conditions. The first-order Tikhonov regularisation parameter is no longer constant but is now altitude dependent. With the inclusion of the IR spectral range, the information content in the troposphere increases. To make optimal use of this fact, the regularisation below 20 km is weakened. Above 20 km, the Tikhonov parameter is constant and is 0.02. Below, the values are linearly interpolated between the altitudes 16, 10, 6, and 1 km. The values are 0.06, 0.1, 0.06, and 0.02, respectively. The strength and distribution of the Tikhonov parameter is found through empirical studies as a trade-off between the vertical resolution of the retrieval and its stability.
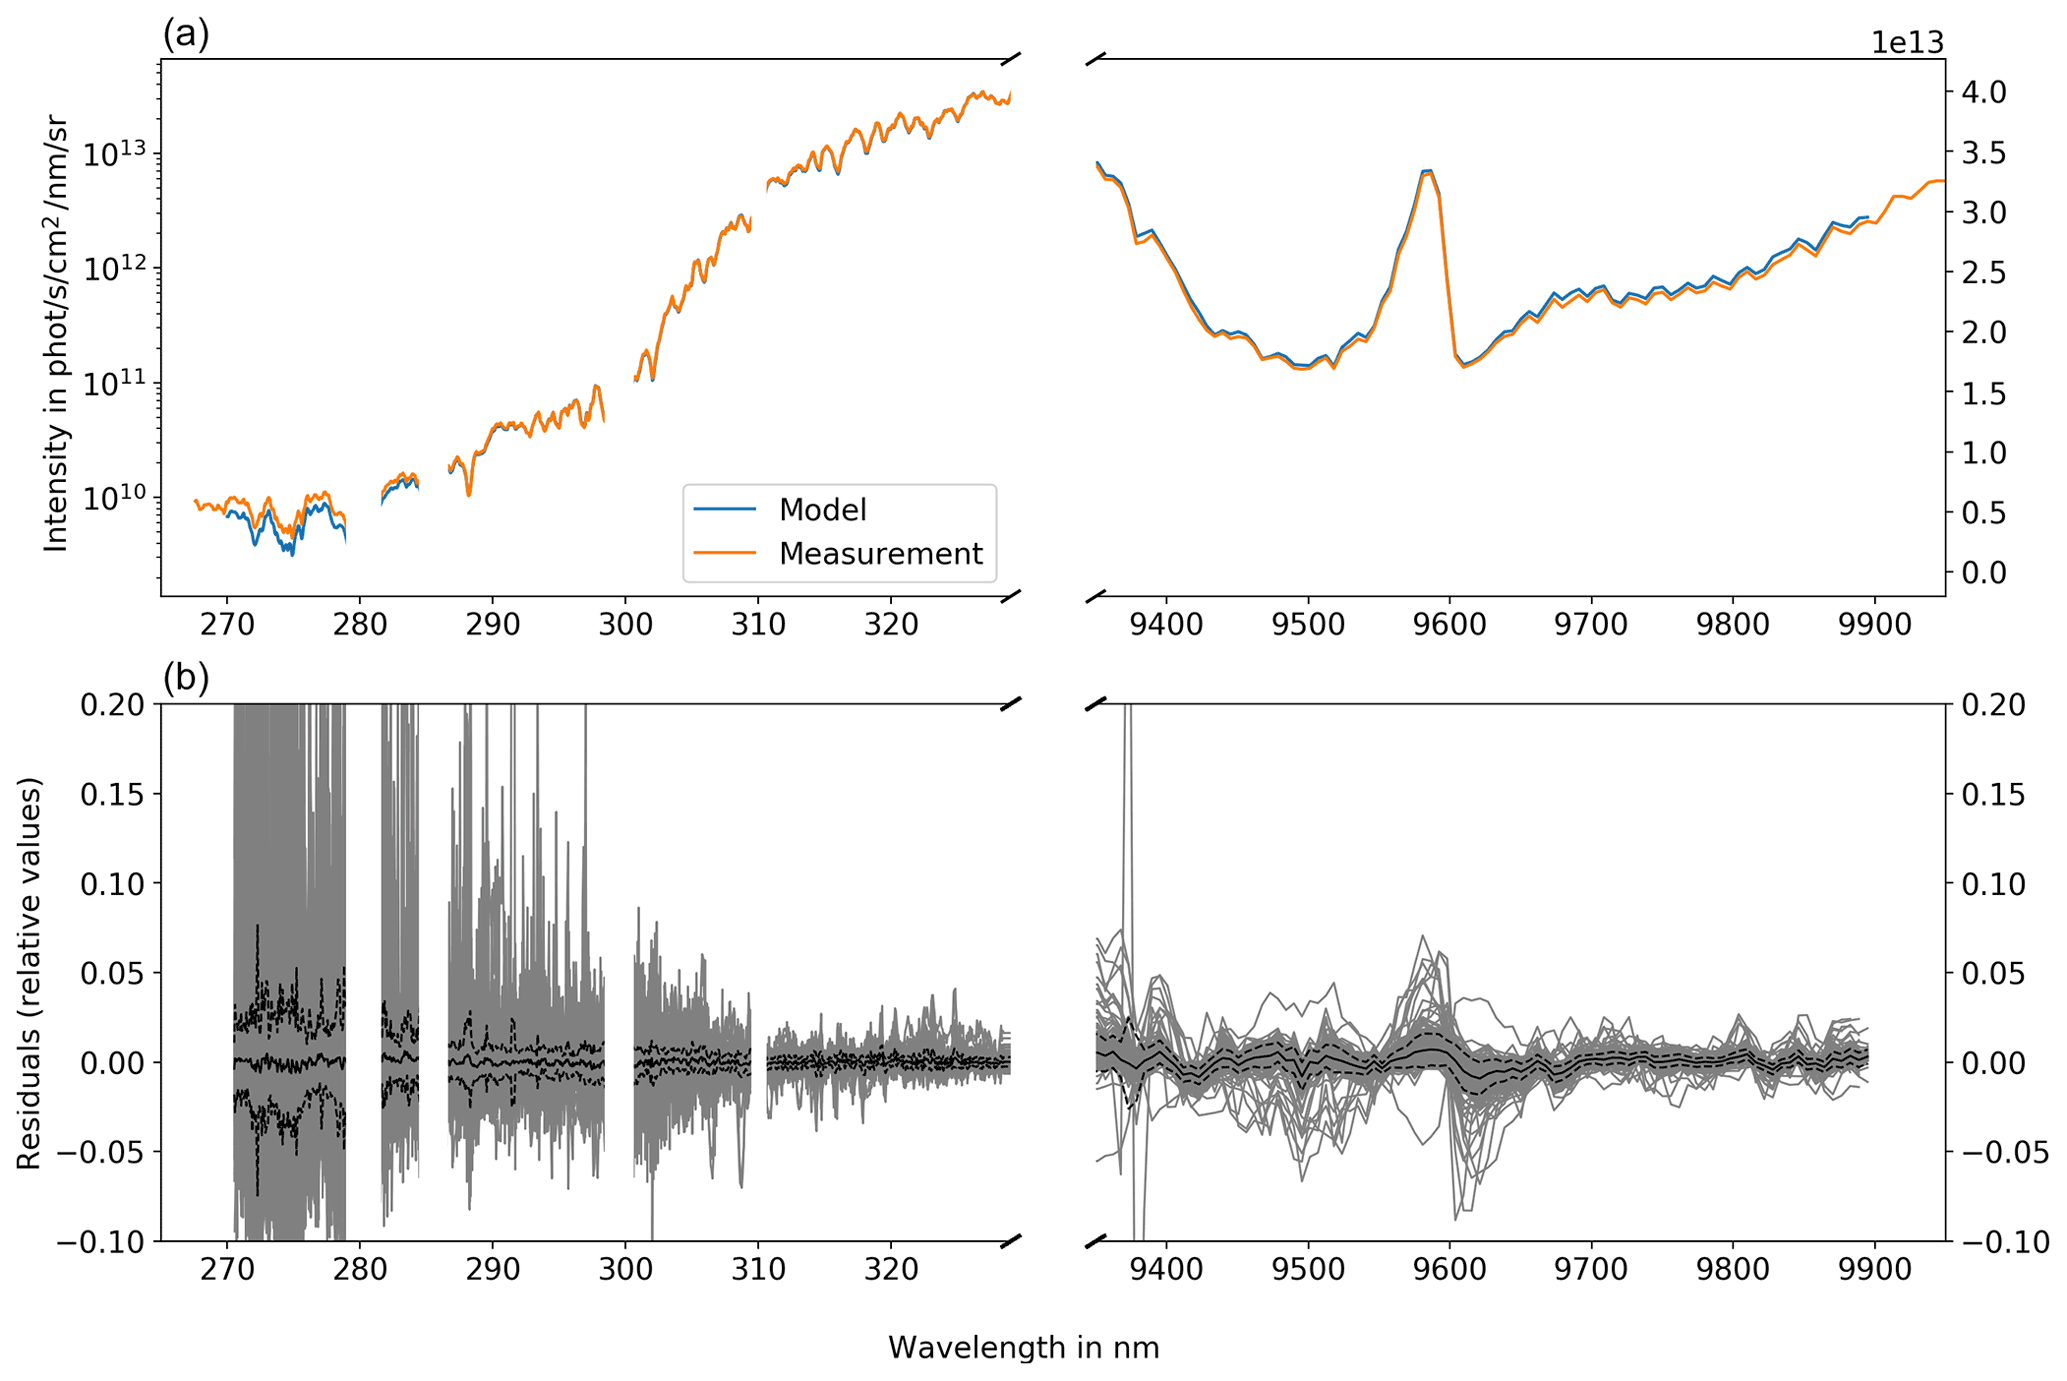
Figure 1(a) Measured intensity from TROPOMI (270–329 nm) and CrIS (9350–9900 nm) on 6 July 2018 at 12:11 LT (TROPOMI) compared to the modelled intensity after the iterative process. (b) Residuals from logarithmic fits for 242 ozone profile retrievals where collocated ozonesonde measurements are available. The residuals of individual retrievals are plotted in grey, while the mean of all residual spectra (solid line) and its standard deviation (dashed line) are given in black.
The simulated UV and IR intensities from which the residuals are calculated are shown in Fig. 1. Some spectral points are excluded in the region of 300 and 310 nm and around 280 and 283 nm, which contain magnesium Fraunhofer lines. A comparison between modelled and measured intensity in the UV and IR spectral ranges (a) and residuals for 242 ozone profile retrievals collocated with ozonesonde measurements (b) are shown. In the UV spectral range, the residuals increase for shorter wavelengths, while for longer UV wavelengths (310–330 nm), the standard deviation is about 0.25 %. It increases to about 7.5 % for the shortest UV wavelengths.
3.1 UV RTM and pre-processing
In the UV spectral range, the RTM simulates TROPOMI measurements assuming a pseudo-spherical atmosphere with the ozone absorption cross sections from Serdyuchenko et al. (2014) convolved with the TROPOMI instrument response function (ISRF) (ESA/KNMI, 2021). Other input parameters in the forward simulations are the measured solar spectrum from TROPOMI, the viewing geometry angles, the effective scene height, as well as a priori values for ozone (profile and total column amount) and albedo. The a priori ozone profile originates from a climatology (Lamsal et al., 2004), where the profile's shape is selected in accordance with the input total ozone value. Additionally, it is scaled with the weighting function differential optical absorption spectroscopy method (WFDOAS) L2 total column amount (Weber et al., 2018) to receive an a priori ozone profile that is as close as possible to the truth. Temperature and pressure profiles are taken from ECMWF ERA5 reanalysis (Hersbach et al., 2020). The polarisation and the rotational Raman scattering, which have a significant impact in the UV spectral range, are ignored in the RTM for computational reasons. They are accounted for in the pre-processing step using look-up tables (LUTs). The polarisation is described by a wavelength-dependent factor applied to the measured spectra, which is given by the ratio of polarised and unpolarised synthetic intensities calculated for appropriate values of the viewing geometry angles, albedo, total ozone, and scene height. Another part of the pre-processing is the subtraction of a polynomial, spectral fitting of three pseudo-absorbers, and wavelength adjustments (shift and squeeze correction). In total, three different pseudo-absorber parameters are fitted:
-
the rotational Raman scattering (Ring) correction, which is given by a LUT in the same manner as the polarisation correction (ratio of spectra with and without Raman effect),
-
the recalibration spectrum, which is determined by a comparison of TROPOMI measurements with simulations using MLS ozone profiles, and
-
the inverse solar irradiance spectrum representing a wavelength independent offset in the measured data.
The pseudo-absorber fit and the shift and squeeze correction are performed for each of the separate UV spectral windows listed in Table 2 independently. A linear polynomial is subtracted in the lower UV2 spectral window only, while no polynomials are subtracted in the other UV spectral windows.
Serdyuchenko et al. (2014) (Gordon et al., 2021)(Han et al., 2015)(Barnet, 2019a)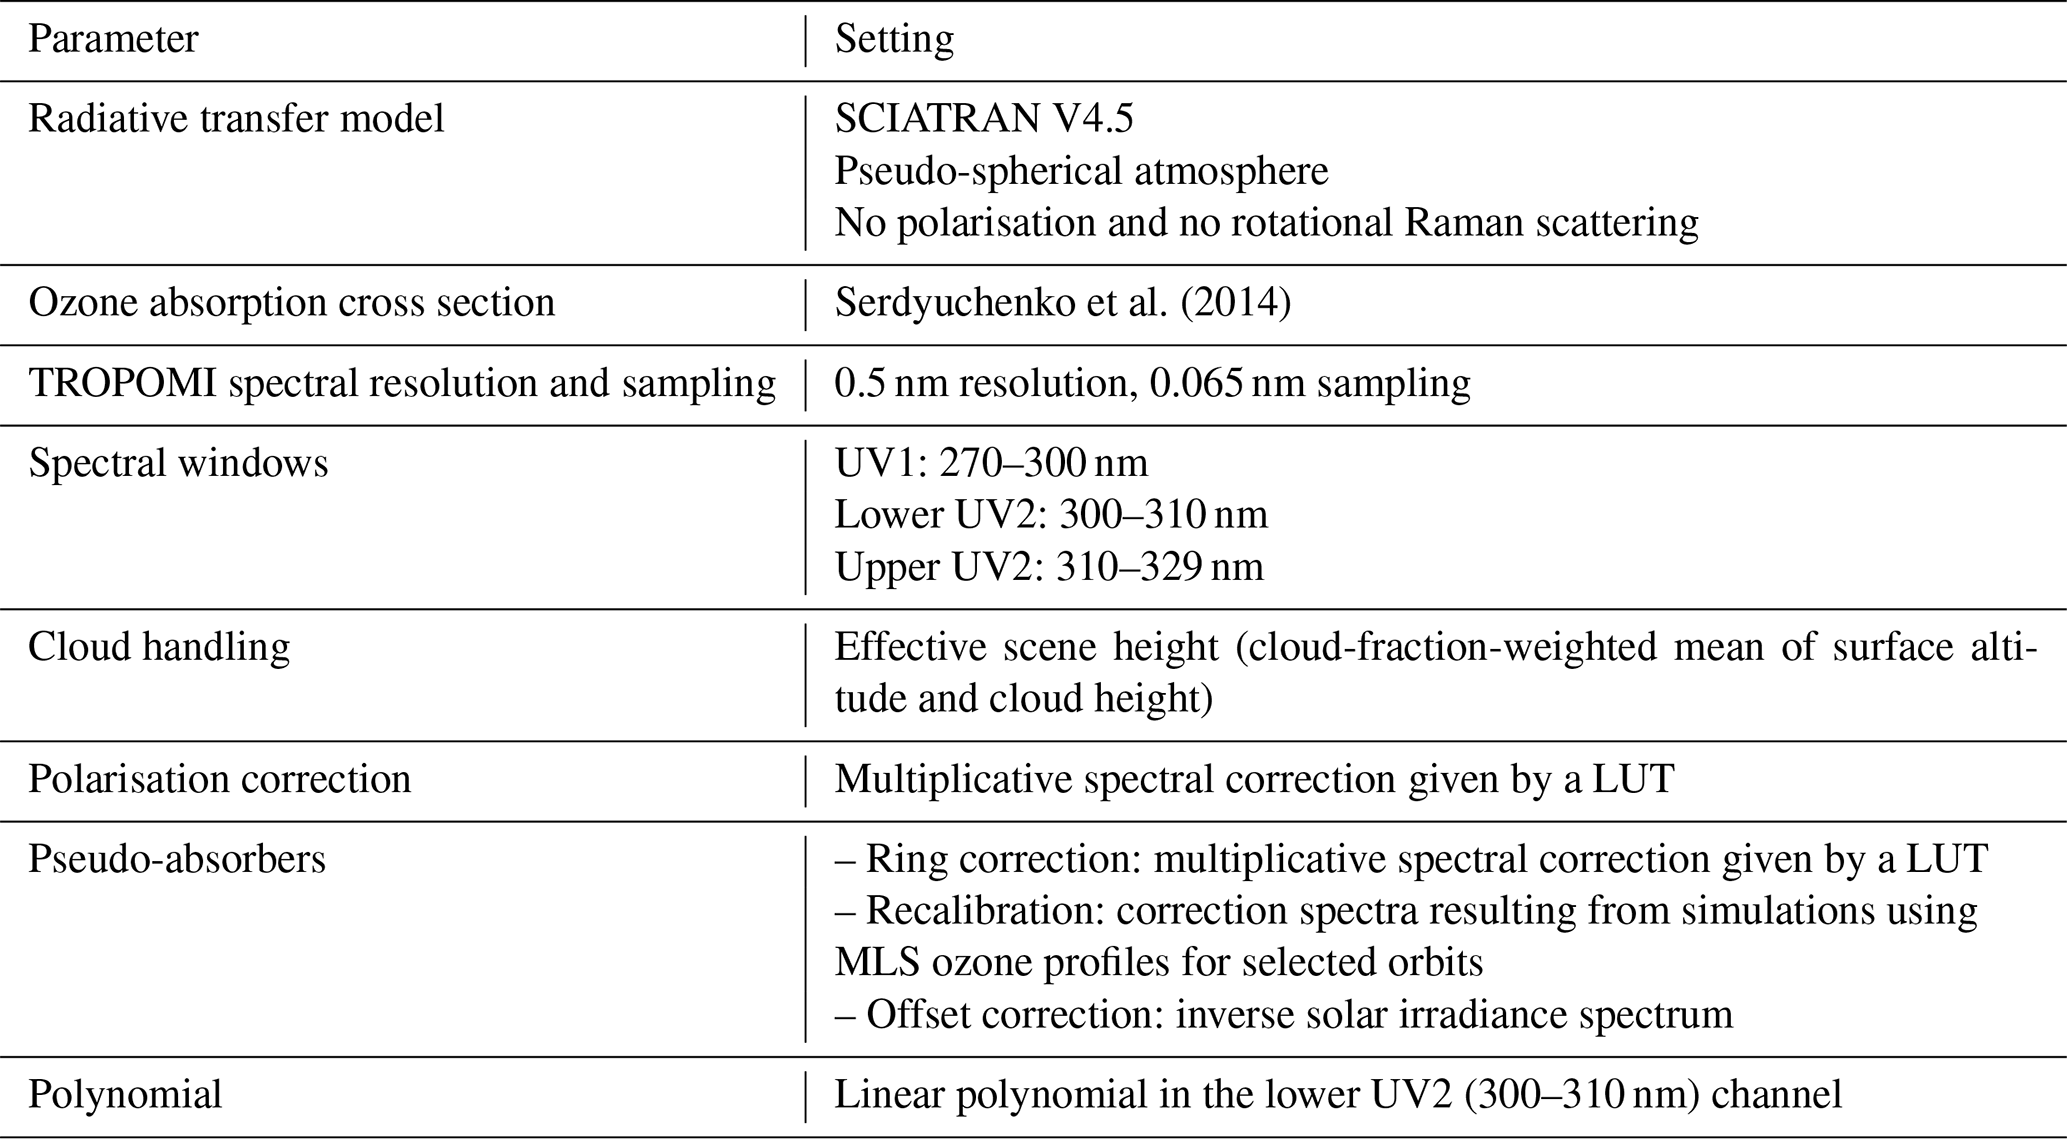
3.2 IR RTM and pre-processing
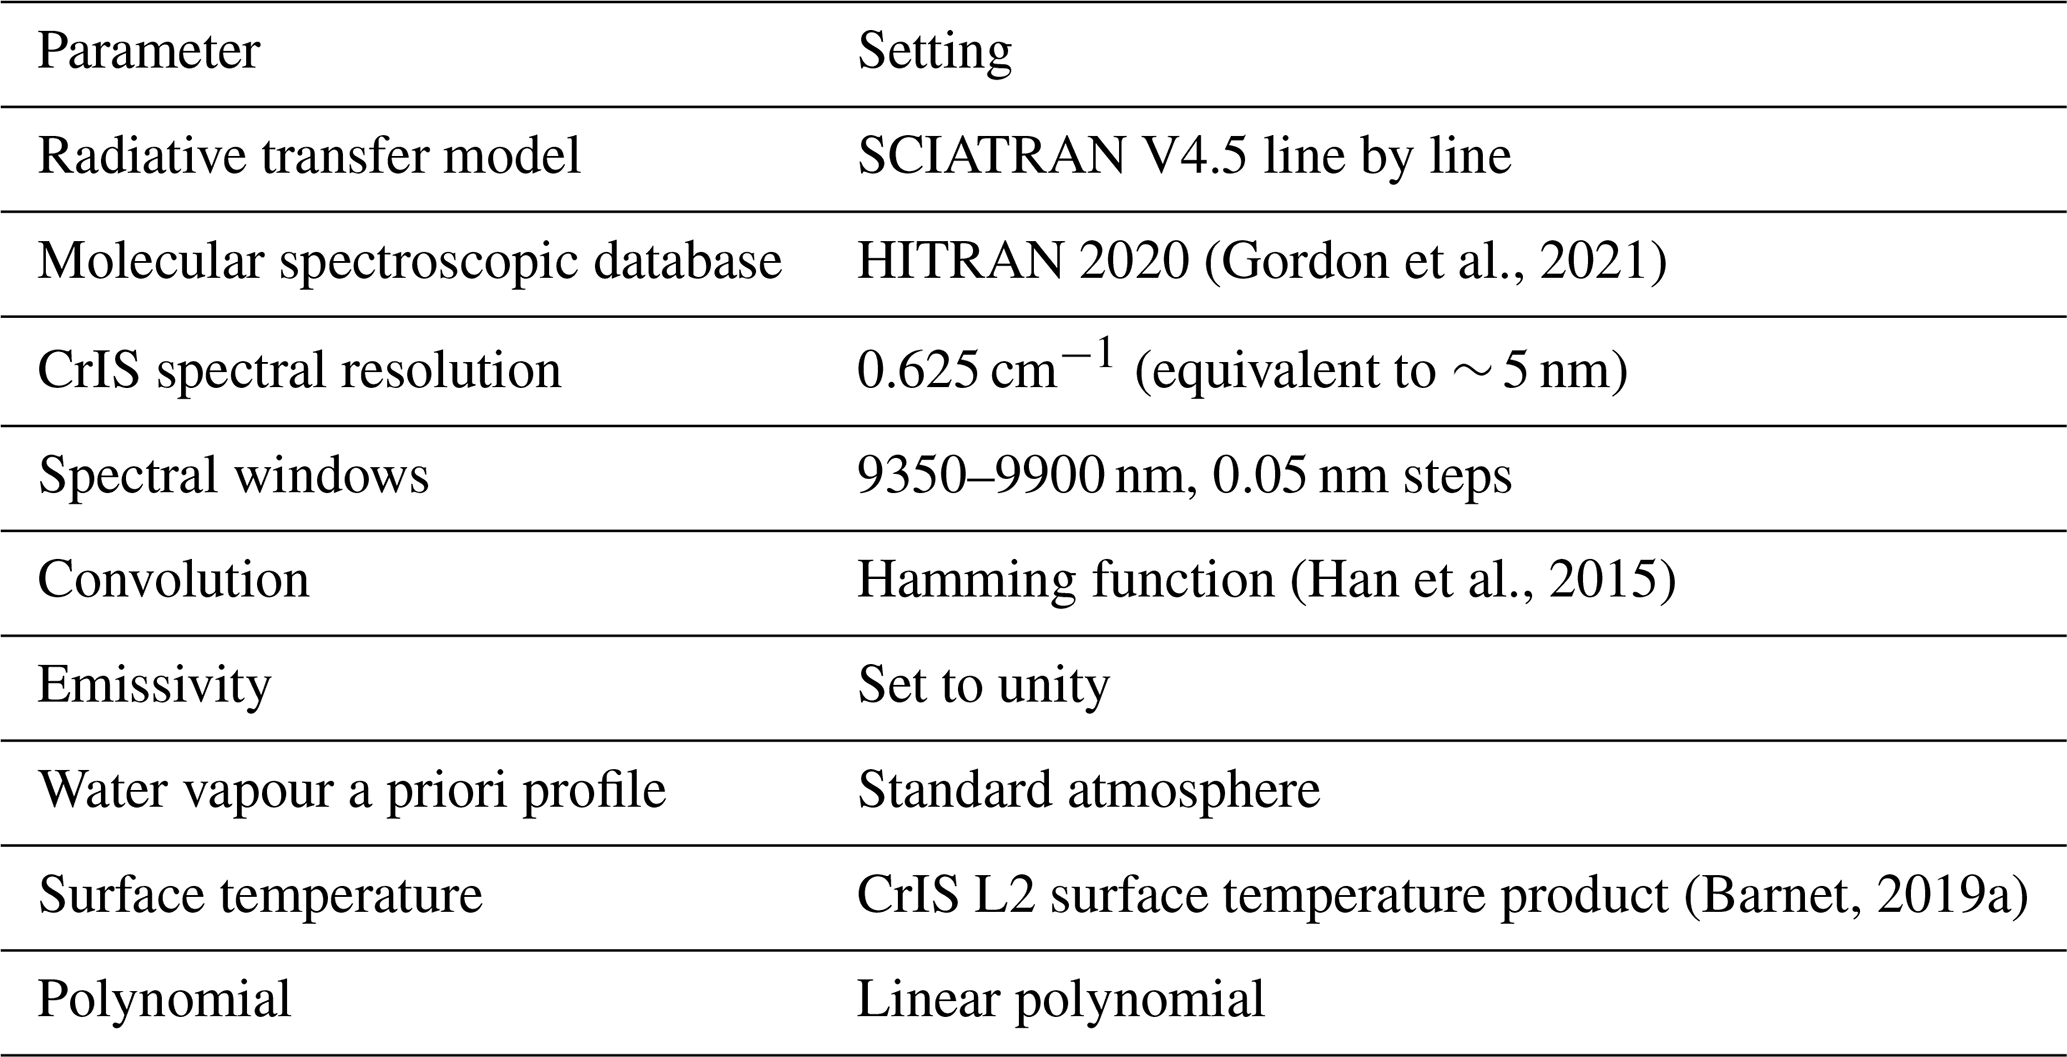
In the IR wavelength range, the intensities are simulated using a line-by-line model, which is also part of SCIATRAN-V4.5. The HITRAN (HIgh-resolution TRANsmission molecular absorption database) 2020 (Gordon et al., 2021) spectroscopy database is used. A continuous spectrum between 9350 and 9900 nm with a sampling of 0.05 nm is modelled containing atmospheric trace gases O3, H2O, and CO2 in the forward model. Because CO2 does not affect the ozone profile retrieval, it is kept constant using a climatological CO2 profile calculated with B2D chemistry-transport model (Sinnhuber, 2003). The change of water vapour is taken into account by retrieving the integrated column value and scaling the climatological H2O profile. The rotational Raman scattering and polarisation are not taken into account, as the contribution of scattered solar radiation is negligible. The surface emissivity is set to unity and is not changed during retrieval. Instead, the contribution of the surface emission is approximated by a polynomial and subtracted from the measured and modelled spectra within the pre-processing step. The surface temperature is taken from the CrIS L2 product (Barnet, 2019a). Temperature and pressure profiles are taken from the ECMWF ERA5 reanalysis data, same as for the UV range. Typical spectral residuals, which are used to initialise the error covariance matrix, are shown in Fig. 1. In the IR spectral range, the residuals scatter in the 1 % range. In comparison, the noise measured by CrIS is 10 to 20 times smaller. The use of higher noise levels as weights in the retrieval reduces the information content of our retrieval. If the original CrIS noise is used in an IR-only retrieval, the DOF increases from 2–2.5 to 3–3.5. In the combined retrieval, however, we have to make a compromise in order to guarantee stability using both UV and IR wavelength ranges as mentioned above.
During the pre-processing step, the modelled radiance is convolved with the spectral response function of the CrIS instrument, which is represented by the Hamming function (Han et al., 2015). A linear polynomial is included in the fit to account for the surface emissivity. The settings for RTM and the pre-processing in the IR are listed in Table 3.
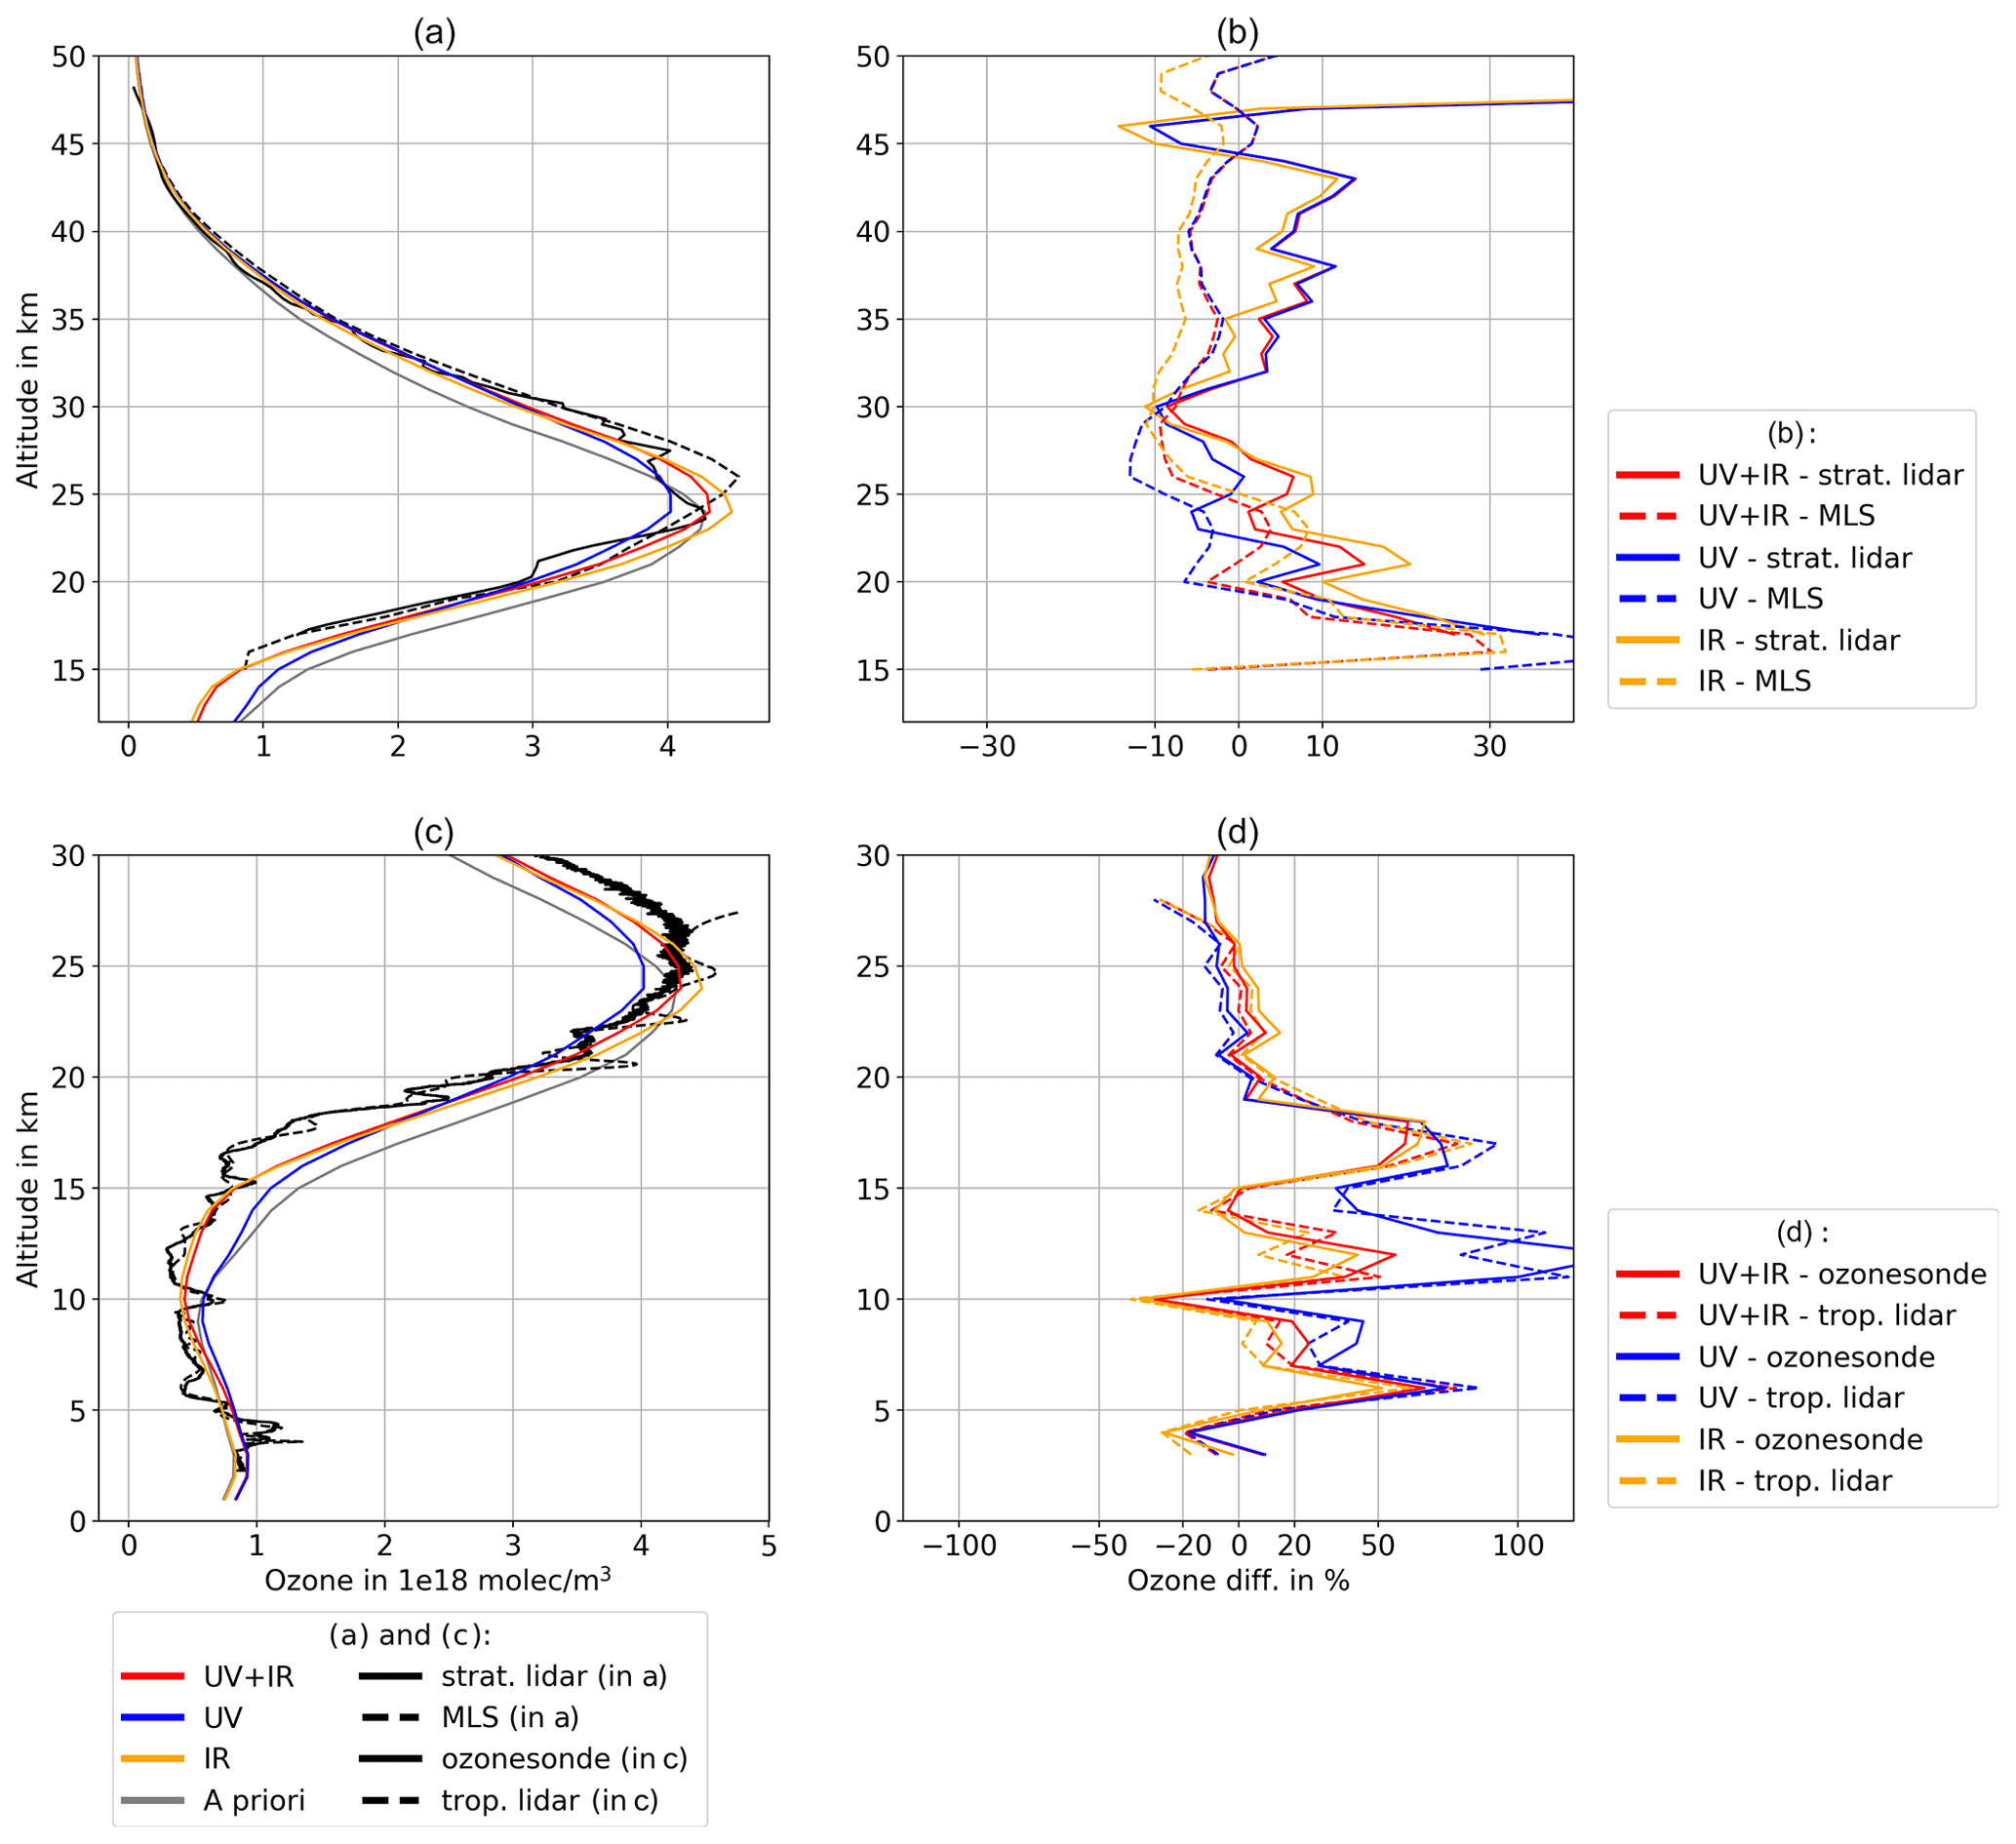
Figure 2Comparison between UV + IR, UV-only, and IR-only ozone profile retrievals and collocated stratospheric lidar and MLS measurements (a and b) and collocated tropospheric lidar and ozonesonde profiles (c and d). The TROPOMI and CrIS data were obtained at 34.2∘ latitude and −117.9∘ longitude on 27 September 2018 at 21:20:11 LT. All measurements, the MLS ozone profile, the ozonesonde, and tropospheric and stratospheric lidar sounding from Table Mountain facility, are within 100 km distance of TROPOMI/CrIS. The time difference is 25 min for MLS and between 6 and 8 h (nighttime profile) for the lidars and ozonesonde.
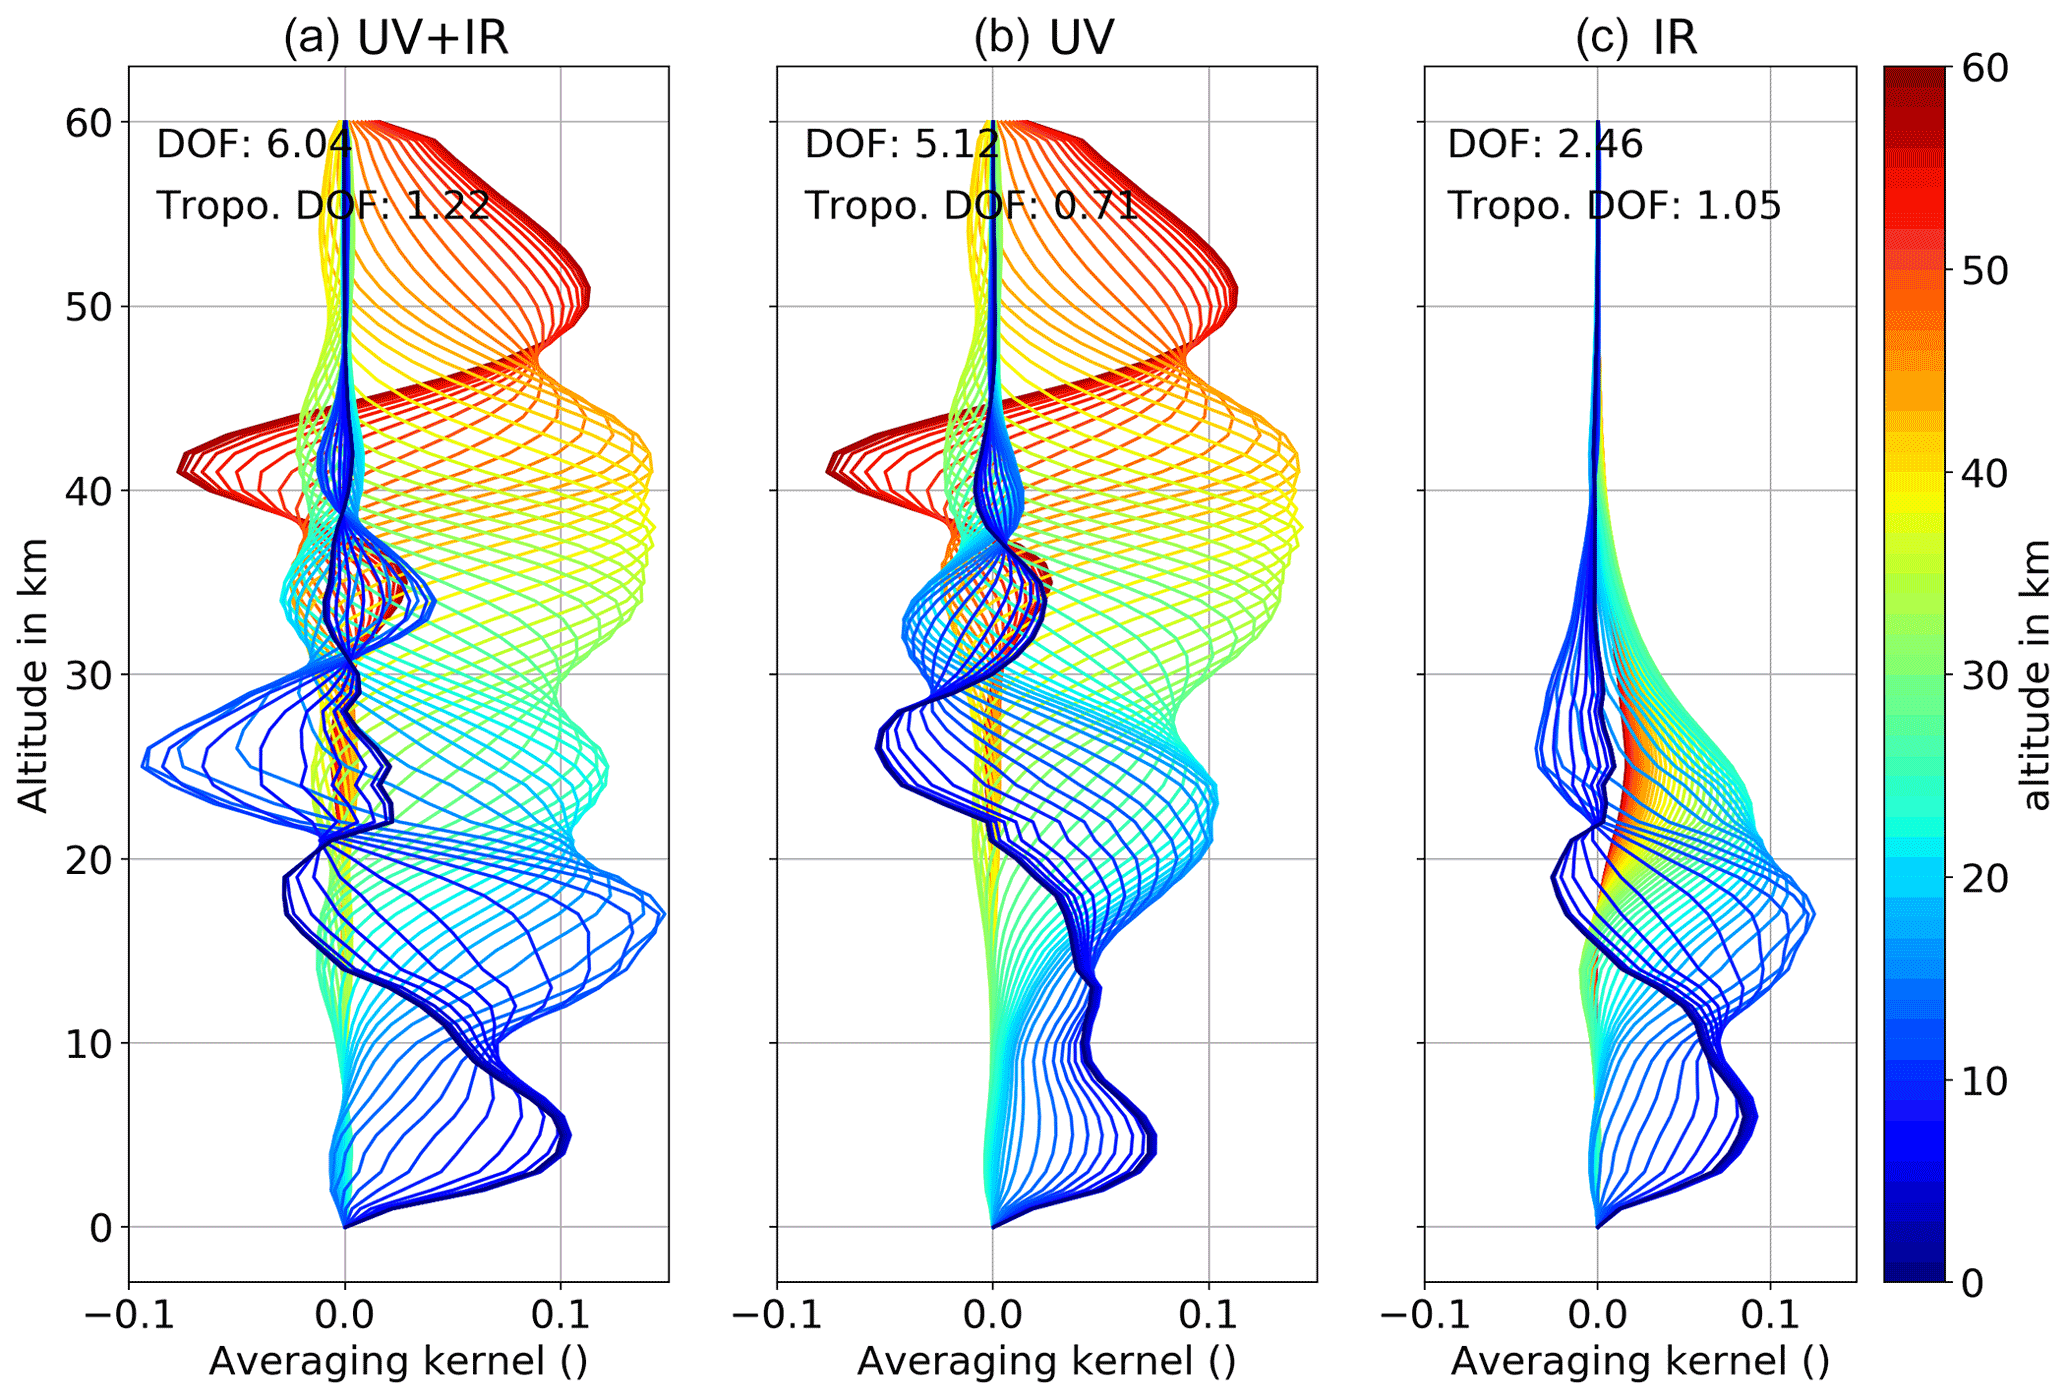
Figure 3Rows of the averaging kernel matrix for the three retrievals shown in Fig. 2. Each line represents the sensitivity of the ozone profile retrieval at a certain altitude level from 0 km (blue) to 60 km (red). DOF is given by the sum of the averaging kernel (AK) matrix main diagonal. The tropopause is defined by 2 PVU from ERA5 reanalysis.
Our approach to compare the combined UV + IR ozone profile retrieval with UV-only and IR-only retrievals is based on the principle that all retrievals should be as similar as possible. All retrievals are run using the settings optimised for the combined retrieval with corresponding spectral ranges switched off for the UV-only and IR-only retrievals, respectively. This approach represents the most straightforward way to analyse the impact of combining both spectral ranges. The vertical resolution in the stratosphere of the UV-only retrieval, presented here, is somewhat reduced compared to the optimised UV retrieval reported in Mettig et al. (2021). A compromise has to be made in order to stabilise the lower stratosphere (20–30 km), since both UV and IR measurements affect the ozone profile in this altitude range and any disturbances that may occur have to be compensated for. The following analysis shows that the resolution in the stratosphere is reduced from 6–10 km (optimised retrieval in Mettig et al., 2021) to about 7–12 km (UV-only retrieval in this work).
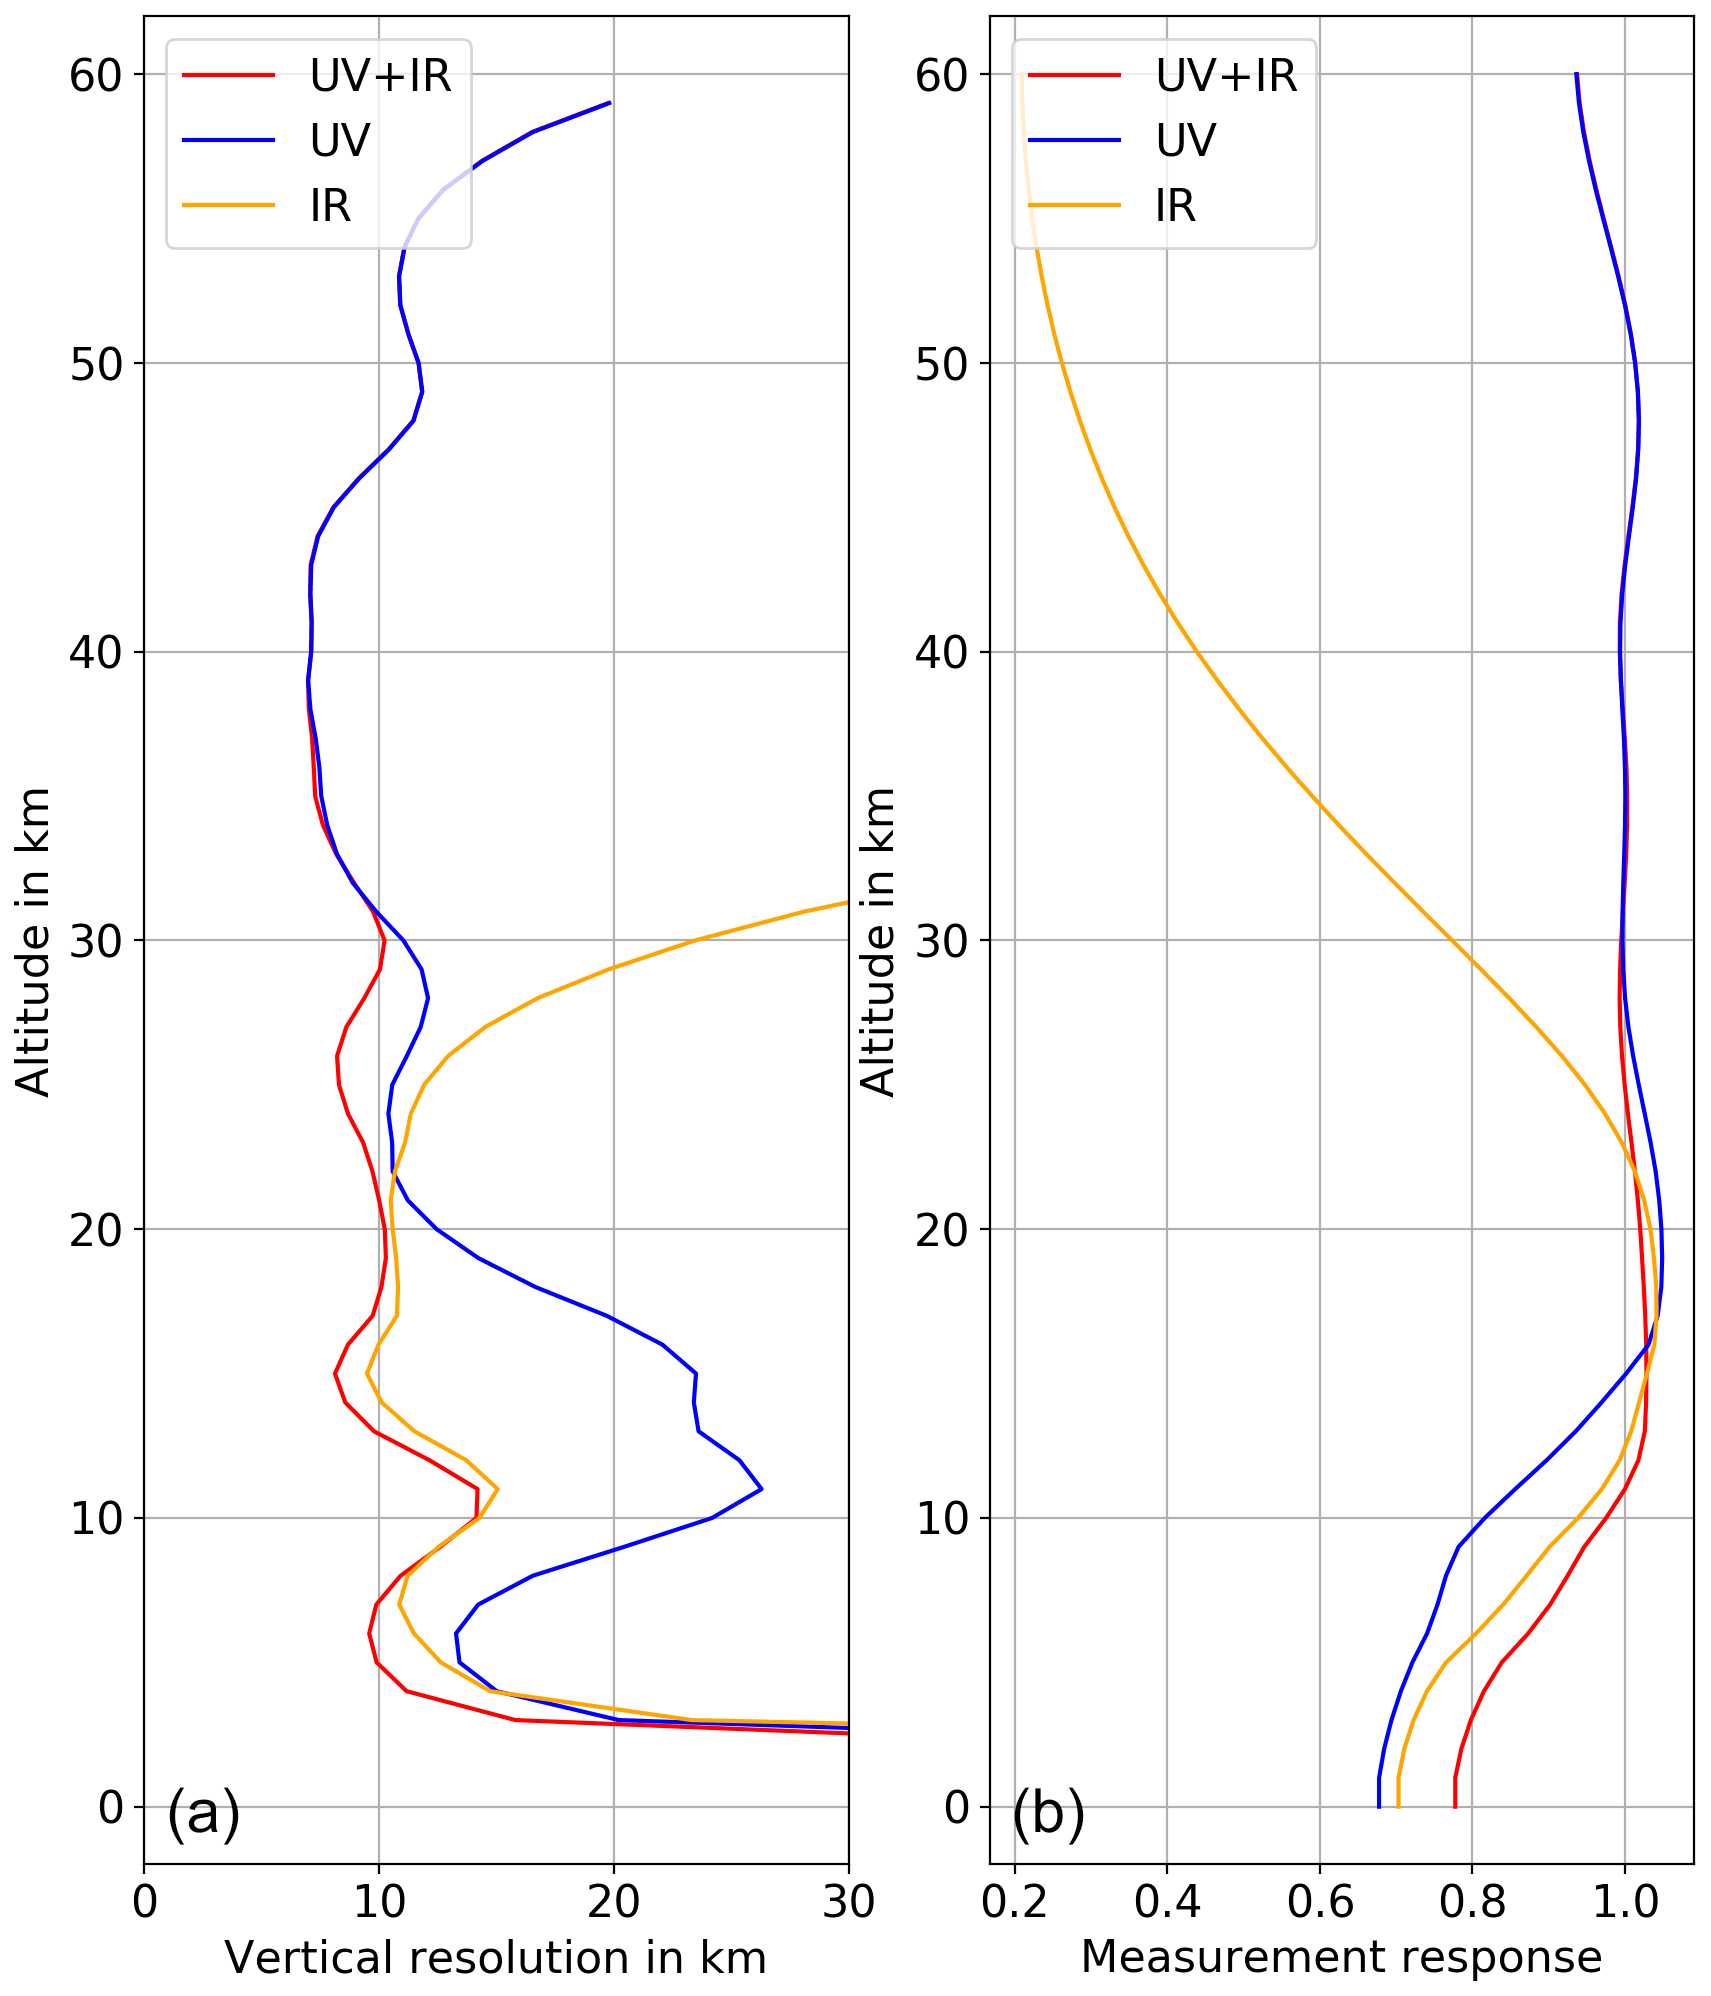
Figure 4(a) Vertical resolution of the ozone profiles shown in Fig. 2 given by the inverse main diagonal elements of the AK matrix. (b) Altitude-dependent measurement response functions derived as the sum of the rows of the AK matrix.
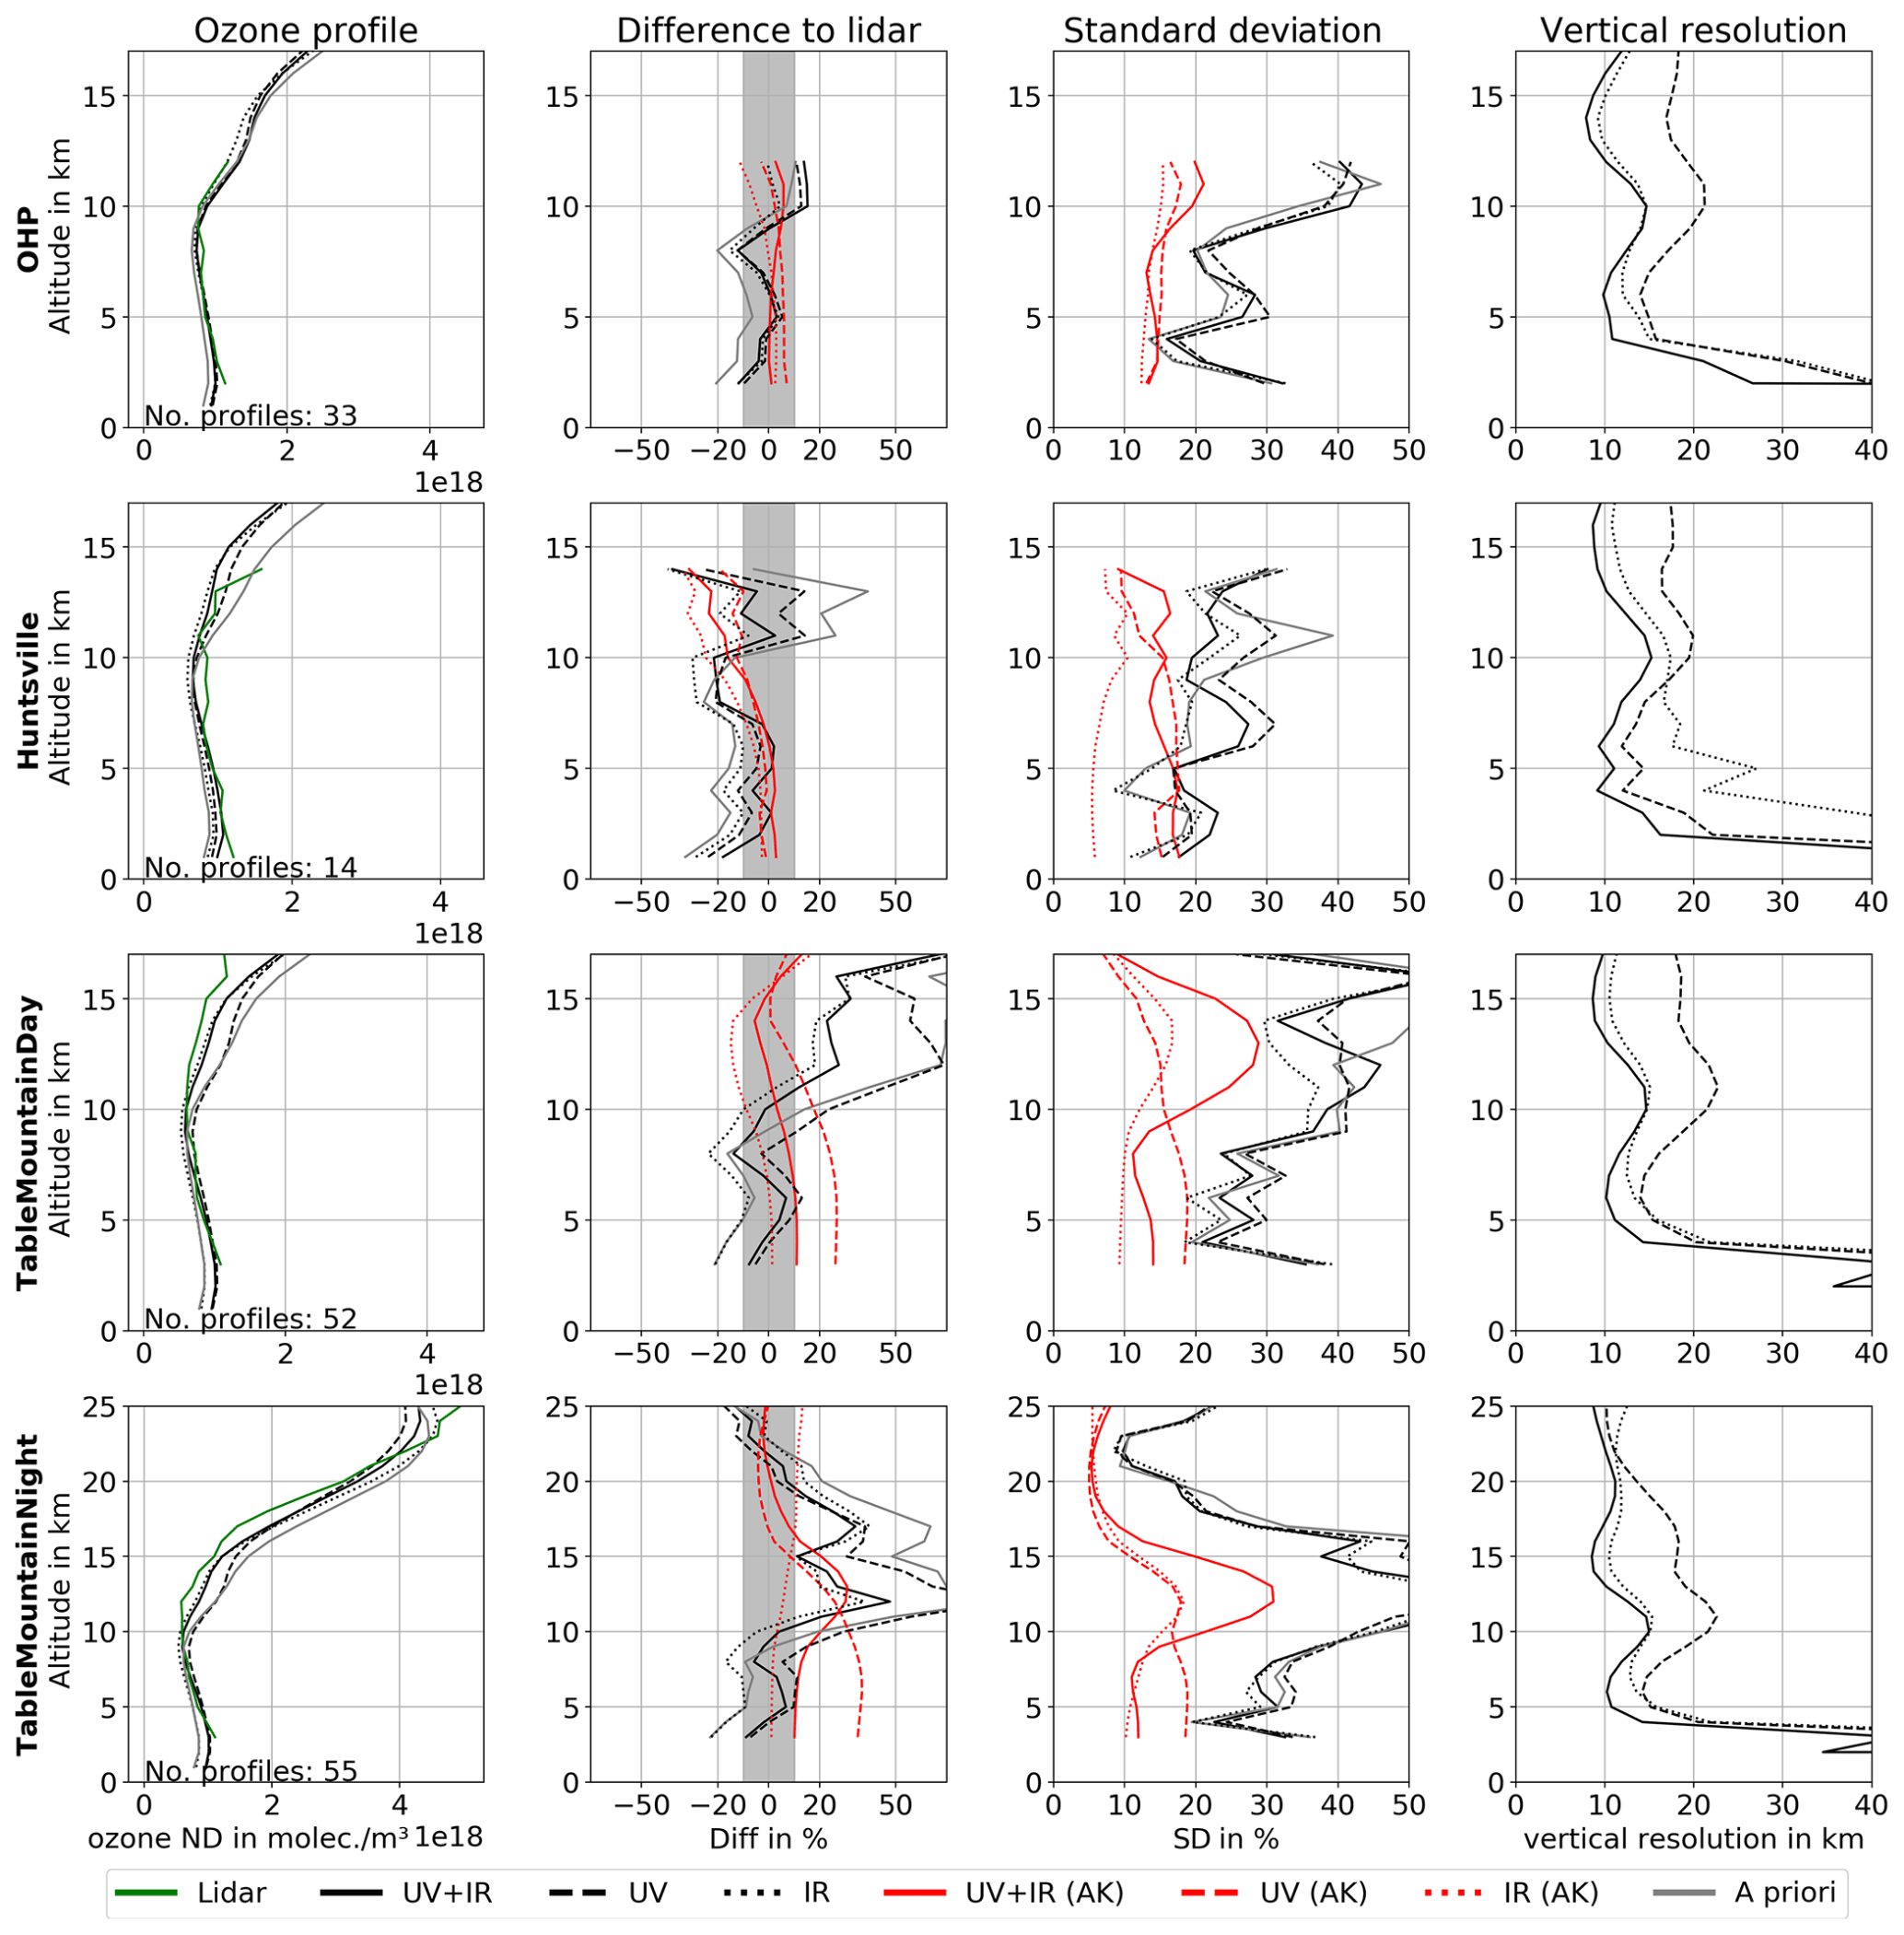
Figure 5Ozone profile comparison between UV + IR, UV-only, and IR-only retrievals and tropospheric ozone lidar measurements from three different sites. Table Mountain provides daytime (matching S5P/CrIS overpasses) profiles in addition. Nighttime profiles can reach a height of up to 28 km and are used for comparison up to 25 km. In the panel showing the difference, the grey shaded area marks the ± 10 % range.
Figure 2 shows as an example comparison of results at a single location from our UV + IR, UV-only, and IR-only retrievals with collocated ozone profiles from tropospheric and stratospheric lidars, ozonesonde, and MLS. All measurements were performed within a 100 km radius around the Table Mountain facility (34.4∘ N, 117.7∘ W) on 27 September 2018. The various collocated profiles from the satellites and ground are shown in panel (a) with a focus on the stratosphere and (c) with a focus on the troposphere. Corresponding relative differences between profiles are shown in panels (b) and (d). The a priori ozone profile, which is shown in grey, contains more ozone below 24 km and less ozone above 24 km in comparison with the lidars, ozonesonde, and MLS. Our three ozone profile retrievals differ in the altitude ranges between 8 and 28 km. Between 10 and 15 km, the UV-only retrieval remains close to the a priori profile. In the troposphere, the advantage of UV + IR and IR-only retrievals over the UV-only one is evident. Between 10 and 15 km altitude, differences of more than 100 % are observed in the UV-only retrieval, which are reduced to about 50 % in the combined and IR-only retrievals. In the stratosphere, between 20 and 30 km, the comparison between the TOPAS retrievals and the stratospheric lidar and MLS is not as clear as in the troposphere. Here, the combined retrieval agrees with MLS better than the UV-only retrieval, but UV-only retrieval agrees better with the lidar. The IR-only retrieval has a slightly positive bias compared to both MLS and lidar.
The distribution of information content in the ozone profile retrievals is presented in more detail in Fig. 3, where the rows of the averaging kernel (AK) matrices are shown. The lack of information between 7 and 17 km in the UV-only retrieval (panel b) appears partially compensated by the IR retrieval component from the CrIS measurements. Above 30 km, the AKs of UV + IR and UV-only retrieval are the same (diminishing role of IR part). The UV + IR retrieval is, however, not a simple linear combination of the UV-only and IR-only retrievals. This is evident, for example, from the lighter blue contour lines (10–15 km). In the UV + IR retrieval, they display a significant negative peak around 25 km, which is not present in the other two retrievals. It means that the overlapping sensitivity can change the altitude distribution of the information content. Overall, the information content of the UV + IR retrieval increases in contrast to the UV-only and IR-only retrieval, as seen from the DOFs (see text in the panels of Fig. 3). Compared to the UV-only retrieval, DOF increases by almost 1 for UV + IR. About half of this enhancement comes from the troposphere and the other half from the lower stratosphere. The tropospheric DOF for the IR-only retrieval is lower compared to the values for other IR sensors reported in previous publications (e.g. Cuesta et al., 2013; Fu et al., 2013). This may be due to the lower spectral resolution of CrIS compared to IASI and TES. In a future next step, this hypothesis can be checked by artificially increasing the spectral resolution of CrIS in a simulation.
The vertical resolution of the three retrievals, which is given by the inverse main diagonal elements of the AK matrix, is shown in Fig. 4 (left). This approach is based on the concept of data density (Purser and Huang, 1993) and is explained by the definition of DOF and the resulting assumption that the diagonal of the AK matrix is a “measure of the number of degrees of freedom per level, and its reciprocal is a number per degree of freedom, and thus a measure of resolution” (Rodgers, 2002, Sect. 3.3, pp. 54). As is known from previous studies, the UV-only retrieval from TROPOMI measurements (blue) has high vertical resolution above 20 km and reduced vertical resolution between 10 and 15 km (Mettig et al., 2021). The IR-only retrieval from CrIS measurements (orange) has a vertical resolution of around 10 km between 5 and 25 km. The combined UV + IR ozone profile retrieval shows a vertical resolution of about 10 km from 5 to 55 km. The contribution from the IR to the combined retrieval diminishes above about 30 km, meaning that the upper stratosphere is derived mostly from the UV part of the retrieval. The measurement response functions, shown in the right panel of Fig. 4, confirm the previous findings. In the optimal case, the measurement response should approach unity, which is nearly reached for the combined retrieval between 10–50 km. Below 15 km, the UV-only retrieval shows a lower response than IR and UV+IR retrievals, and above 20 km the IR-only retrieval progresses towards zero.
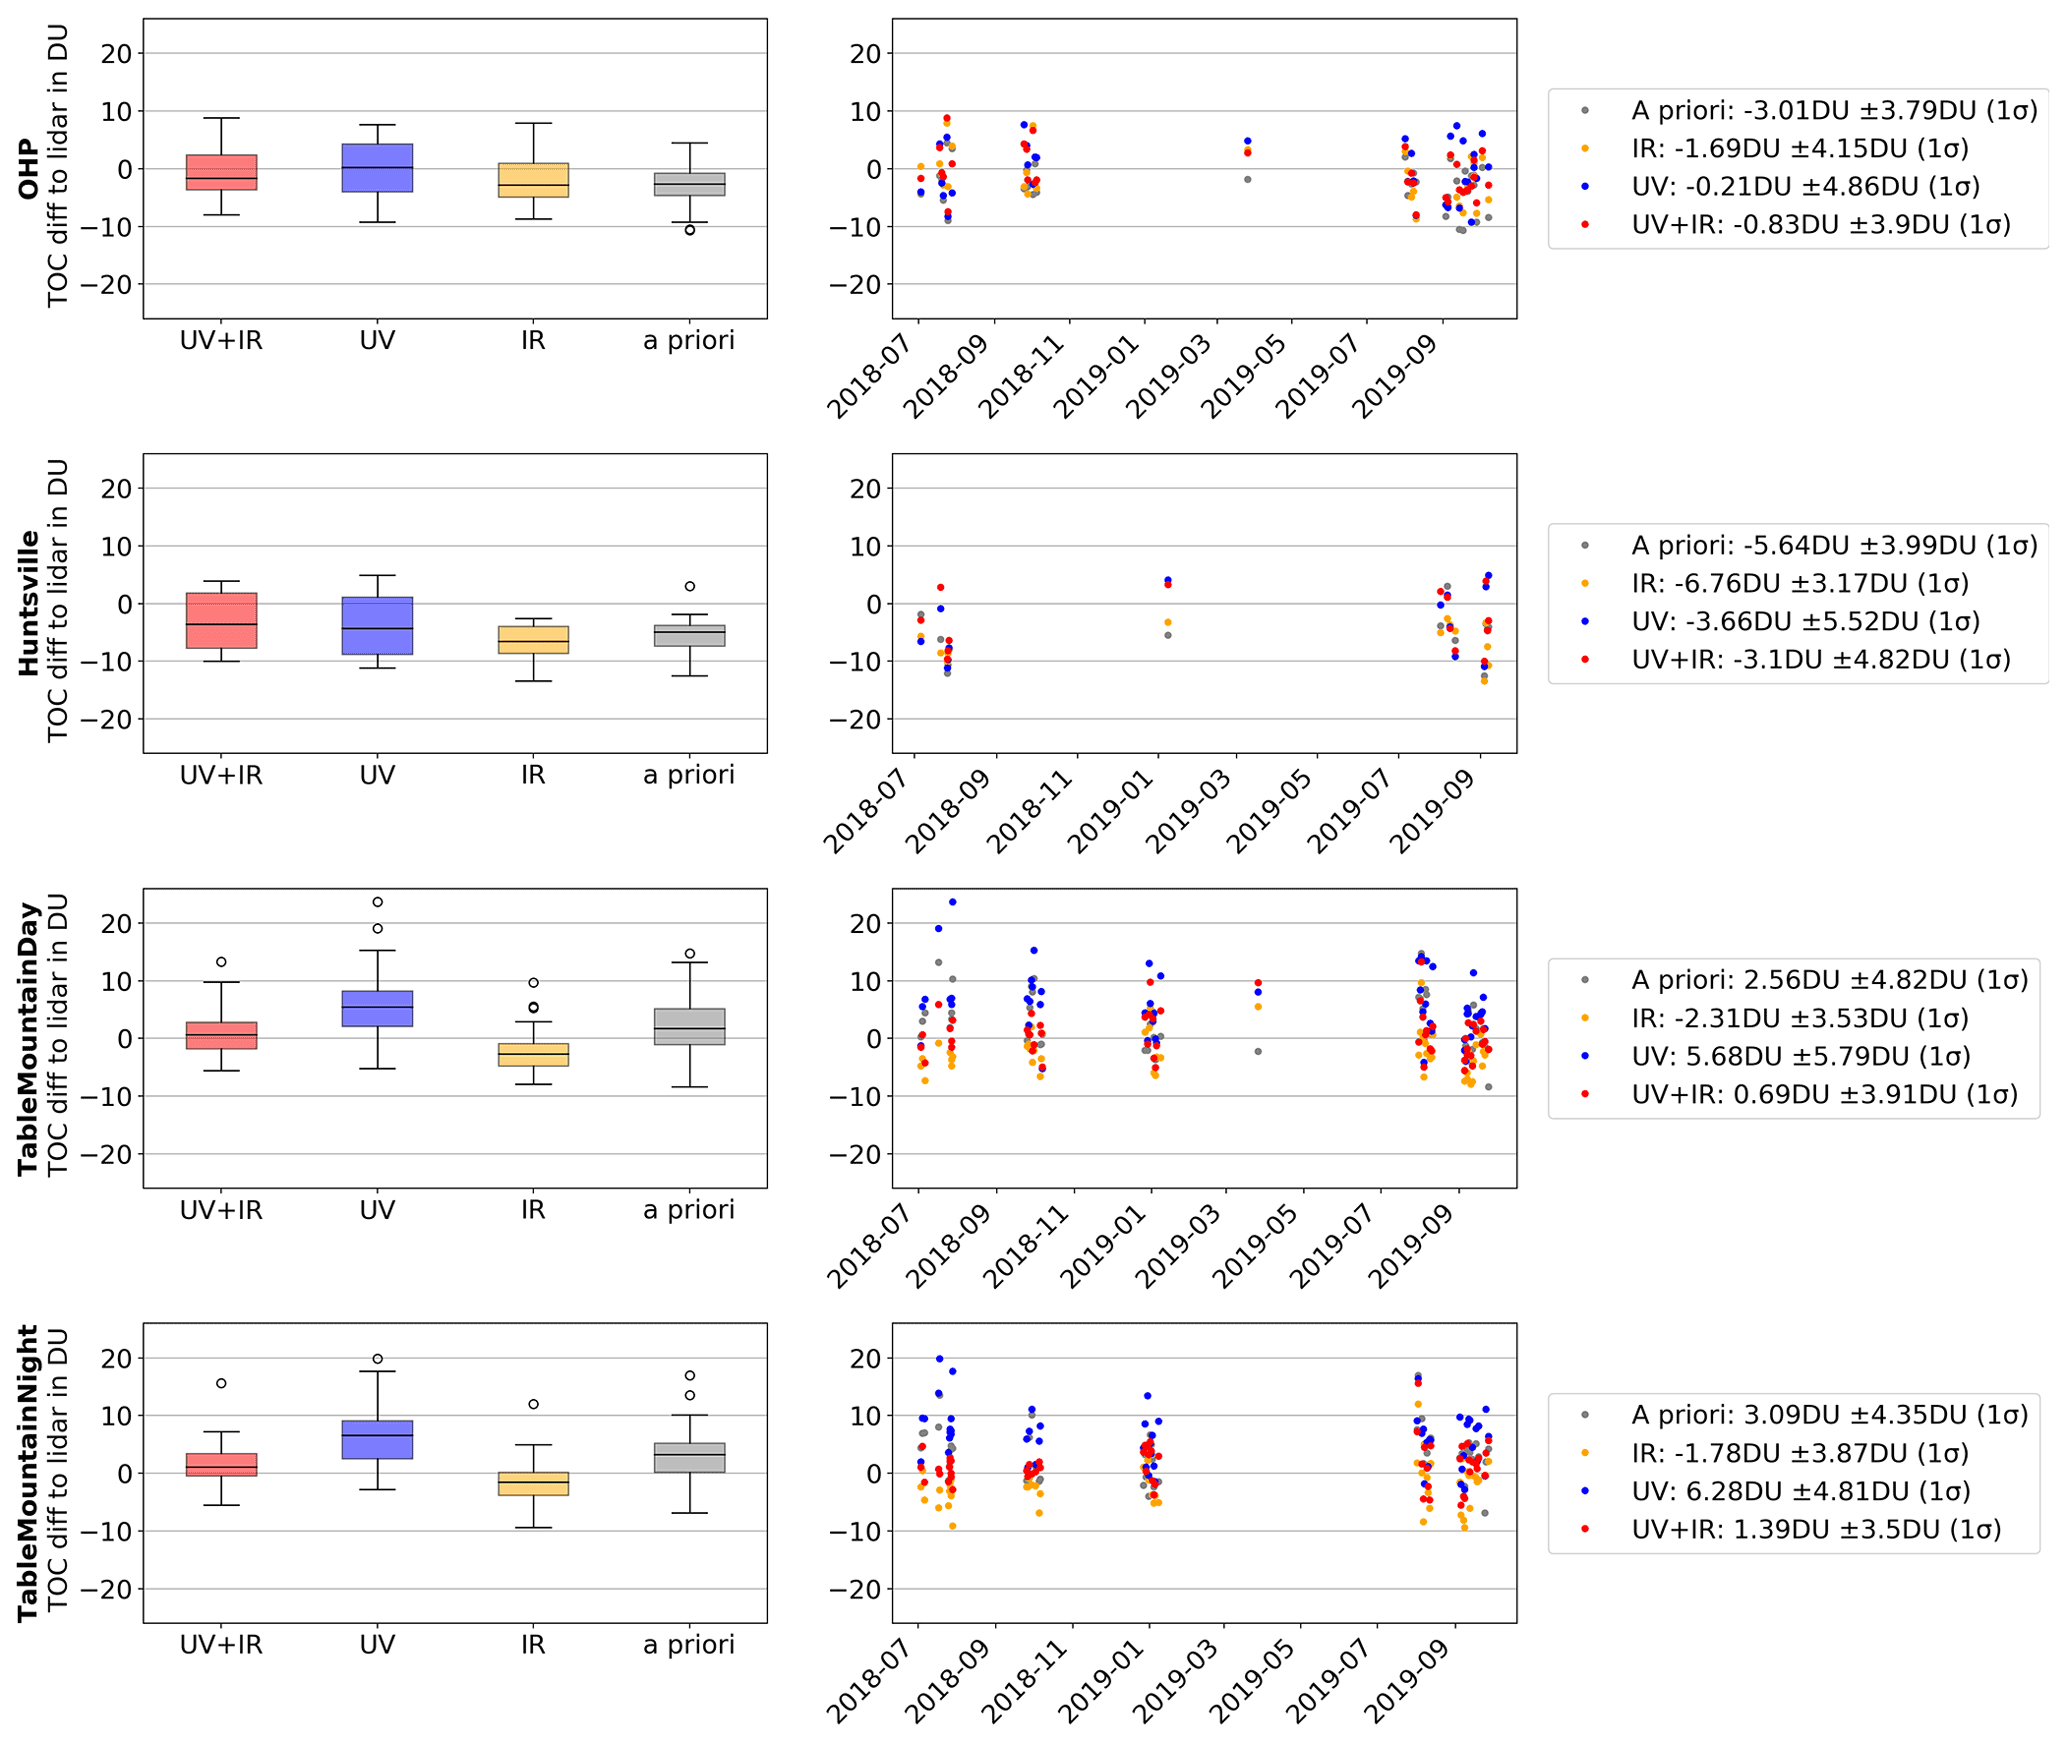
Figure 6Absolute differences in the TOC with respect to the tropospheric lidar data. The differences are shown as box-and-whisker plots in the left panels and as time series in the middle panels. The right panels show statistical information (mean absolute differences and the standard deviations). TOCs are calculated by integrating ozone profiles from the lowermost retrieval level altitude up to the tropopause. The height of the tropopause is obtained from the ERA5 reanalysis data using the 2 PVU definition.
The validation of the TOPAS UV + IR retrieval focuses here on the troposphere, which we try to improve using the combined UV and IR retrieval. Profiles and tropospheric ozone content (TOC) resulting from the TOPAS retrieval are compared with measurements from ozonesondes and tropospheric lidars. In the stratosphere, the ozone profiles of the combined retrievals largely agree with those from the UV-only retrievals as shown in Sect. 4; the latter have been validated in Mettig et al. (2021). We only provide some example results in the lower stratosphere.
5.1 Tropospheric lidar
For the validation in the troposphere, tropospheric lidar measurements are particularly suitable. There are only three locations where lidar measurements are carried out regularly with a high temporal frequency (up to two times a day) and with which collocations were found in the TROPOMI test data set period. Since lidars have a high vertical resolution (below 100 m), similar to the ozonesondes, the lidar altitude grid is adjusted in accordance with Eq. (2) before comparisons are made.
Figure 5 shows the comparison of the TOPAS-retrieved ozone profiles and tropospheric lidar measurements at three different sites. While the measurements in Huntsville take place during daytime, the ozone profiles in OHP are measured after sunset. Only Table Mountain provides night- and daytime measurements, where the latter match in time with TROPOMI/CrIS overpasses. Nighttime profiles can reach a height of up to 28 km and are used for comparison up to 25 km into the stratosphere. Although daytime and nighttime tropospheric ozone profiles can differ significantly, this is not expected at the Table Mountain station. The station is located at about 1800 m altitude in a non-polluted area and no diurnal variation is expected in the troposphere. Furthermore, the tropospheric lidar does not reach high enough to observe the photolytic diurnal cycle in the upper stratosphere. For each of the stations and each retrieval type, the mean ozone profile in number density, the relative mean difference profile in percent, the standard deviation in percent, and the TOPAS vertical resolution are shown. The AK matrix can be applied to the regridded lidar profiles xcoarse to account for the higher vertical resolution of the lidar measurements. The vertical convolution with the averaging kernels is done as follows:
as the retrieval is done in terms of the relative deviations from the a priori profile, the averaging kernel matrix is converted appropriately; see Mettig et al. (2021, Eqs. 6, 8, and 9) for details. The comparison to lidar profiles convolved with AKs is shown in red, but the results should be taken with care as in the altitude ranges where the combined retrieval is sensitive and a single retrieval is not, the former might appear to be worse. This is because the difference between retrieval and the reference profile multiplied by the AK matrix by definition approaches zero in altitude ranges where the retrieval has low sensitivity; i.e. AKs are close to zero.
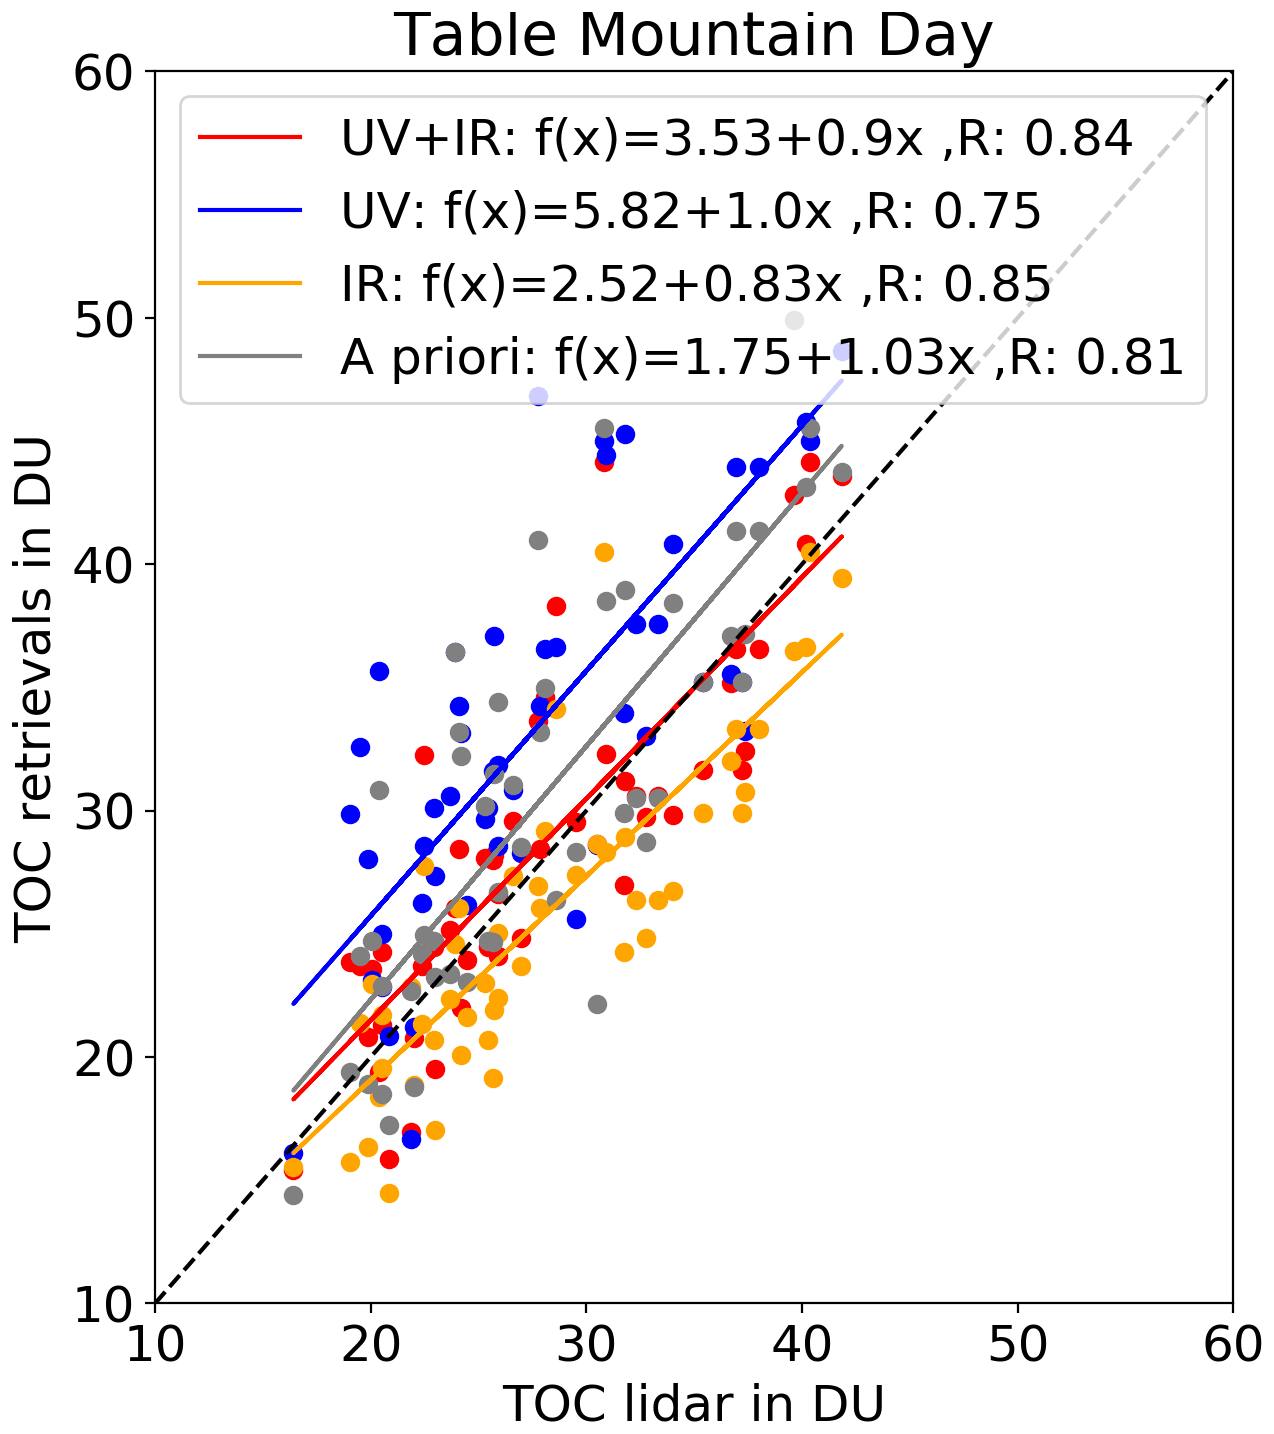
Figure 7TOC scatter plot of TOPAS retrievals with respect to Table Mountain tropospheric lidar data (daylight measurements). The one-to-one line is given by the dashed black line. The linear regression curves are plotted with different colours and their equations are given in the legend.

Figure 8Ozone profile comparisons between UV + IR, UV-only, and IR-only retrievals and ozonesonde measurements for northern and tropical latitudes.
At the OHP site (top row of Fig. 5), all retrievals agree well with a relative mean difference within ± 10 % up to 10 km. Above this altitude, the IR-only retrieval shows better results, but the accuracy of the lidar data decreases here. For Huntsville, where we have the lowest number of collocated profiles, the best agreement with the lidar is found for the combined UV + IR retrieval below 10 km. UV-only and IR-only retrievals show a negative bias up to −20 %. Above 10 km, the UV + IR and UV-only retrievals are both within the ± 10 % range. At the Table Mountain site, a clear improvement is seen for the UV + IR retrieval. For both daytime and nighttime, the combined retrieval shows smaller relative mean differences with respect to the lidar measurements. The IR-only retrieval is slightly better than the combined retrieval in the 10–15 km range but has a negative bias up to −20 % below 10 km. Between 8 and 18 km, the UV-only retrieval remains close to the climatology, while the combined and IR-only retrievals are closer to the lidar measurement. The standard deviations for all comparisons are similar to those of the a priori profiles. That means, for a single profile, the precision or rather the scattering around the mean value is not improved in comparison to the a priori information. The differences between the three retrievals are not that large, but the standard deviations of the UV + IR and IR-only retrievals tend to be smaller than that of the UV-only retrieval. For the vertical resolution, the conclusion from Fig. 2c that the vertical resolution of the UV + IR retrieval is typically better than that of the single retrievals is confirmed. In Huntsville, the vertical resolution of the IR-only retrieval below 10 km is worse in comparison to the combined and UV-only retrievals. The reason might be the higher viewing angle of most of the collocated CrIS measurements (compared to the other stations).
The absolute difference in the TOC for each site is shown in Fig. 6. To obtain these results, the ozone profiles are integrated from the lowermost retrieval level altitude up to the tropopause. The tropopause height is obtained from the ERA5 reanalysis data set using the 2 PVU (e.g. Zbinden et al., 2006) definition for a dynamical tropopause (Hoskins et al., 1985). For cloudy pixels, the lidar profile is cut at the effective scene height. Overall good agreement with the lidar TOC is found for the UV + IR retrieval and an improvement in comparison to the UV-only retrieval is observed. The box-and-whisker plots on the left give a good overview of the results and their distribution. The time series in the middle is intended to illustrate how the compared data are distributed over time and which gaps occur in the test data set. Secondly, it can be shown that there is no time dependency within the first year for any of the stations. With the mean values and the standard deviations in the legend on the right, statements can finally be made about the significance of the results. For OHP, the UV-only retrieval already has a very small bias of −0.21 DU. The UV + IR retrieval also has a small bias (−0.83 DU), and in addition, the standard deviation is reduced by nearly 1 DU. In comparison to the a priori, each of the three retrievals improves the results. For Huntsville, the a priori TOC does not statistically agree within 1 standard derivation with the lidar TOC. Again, the UV + IR and UV-only retrievals can significantly improve the agreement and reduce the TOC difference from −5.64 DU to −3.1 and −3.66 DU, respectively. The combined retrieval shows a smaller standard deviation in comparison to UV-only retrieval. For Table Mountain (day and night), the UV + IR retrieval shows the best results. The TOC from the combined retrieval has the smallest bias (0.69 DU for daytime and 1.39 DU for nighttime measurements) and the lowest standard deviation in comparison to single retrievals and to the a priori. For all sites, we found that TOC from the IR-only retrieval has a negative bias with a relatively small standard deviation.
Figure 7 shows the TOC comparison to Table Mountain daytime measurements as a scatter plot. One notices that the linear regression line for the UV + IR retrieval (red) agrees very well with the one-to-one line (dashed black). The UV-only retrieval overestimates the TOC, while the IR-only retrieval underestimates it. The correlation between TOCs from the TOPAS retrievals and lidar data is quantified by the R values, which do not differ much from each other. Only for the UV-only retrieval is the correlation below 0.8. The results for the other stations are given in the Supplement (Fig. S1). They do not show such an impressive improvement from the UV + IR retrieval, as it is seen for Table Mountain but are in line with the previous assessments from Fig. 6.
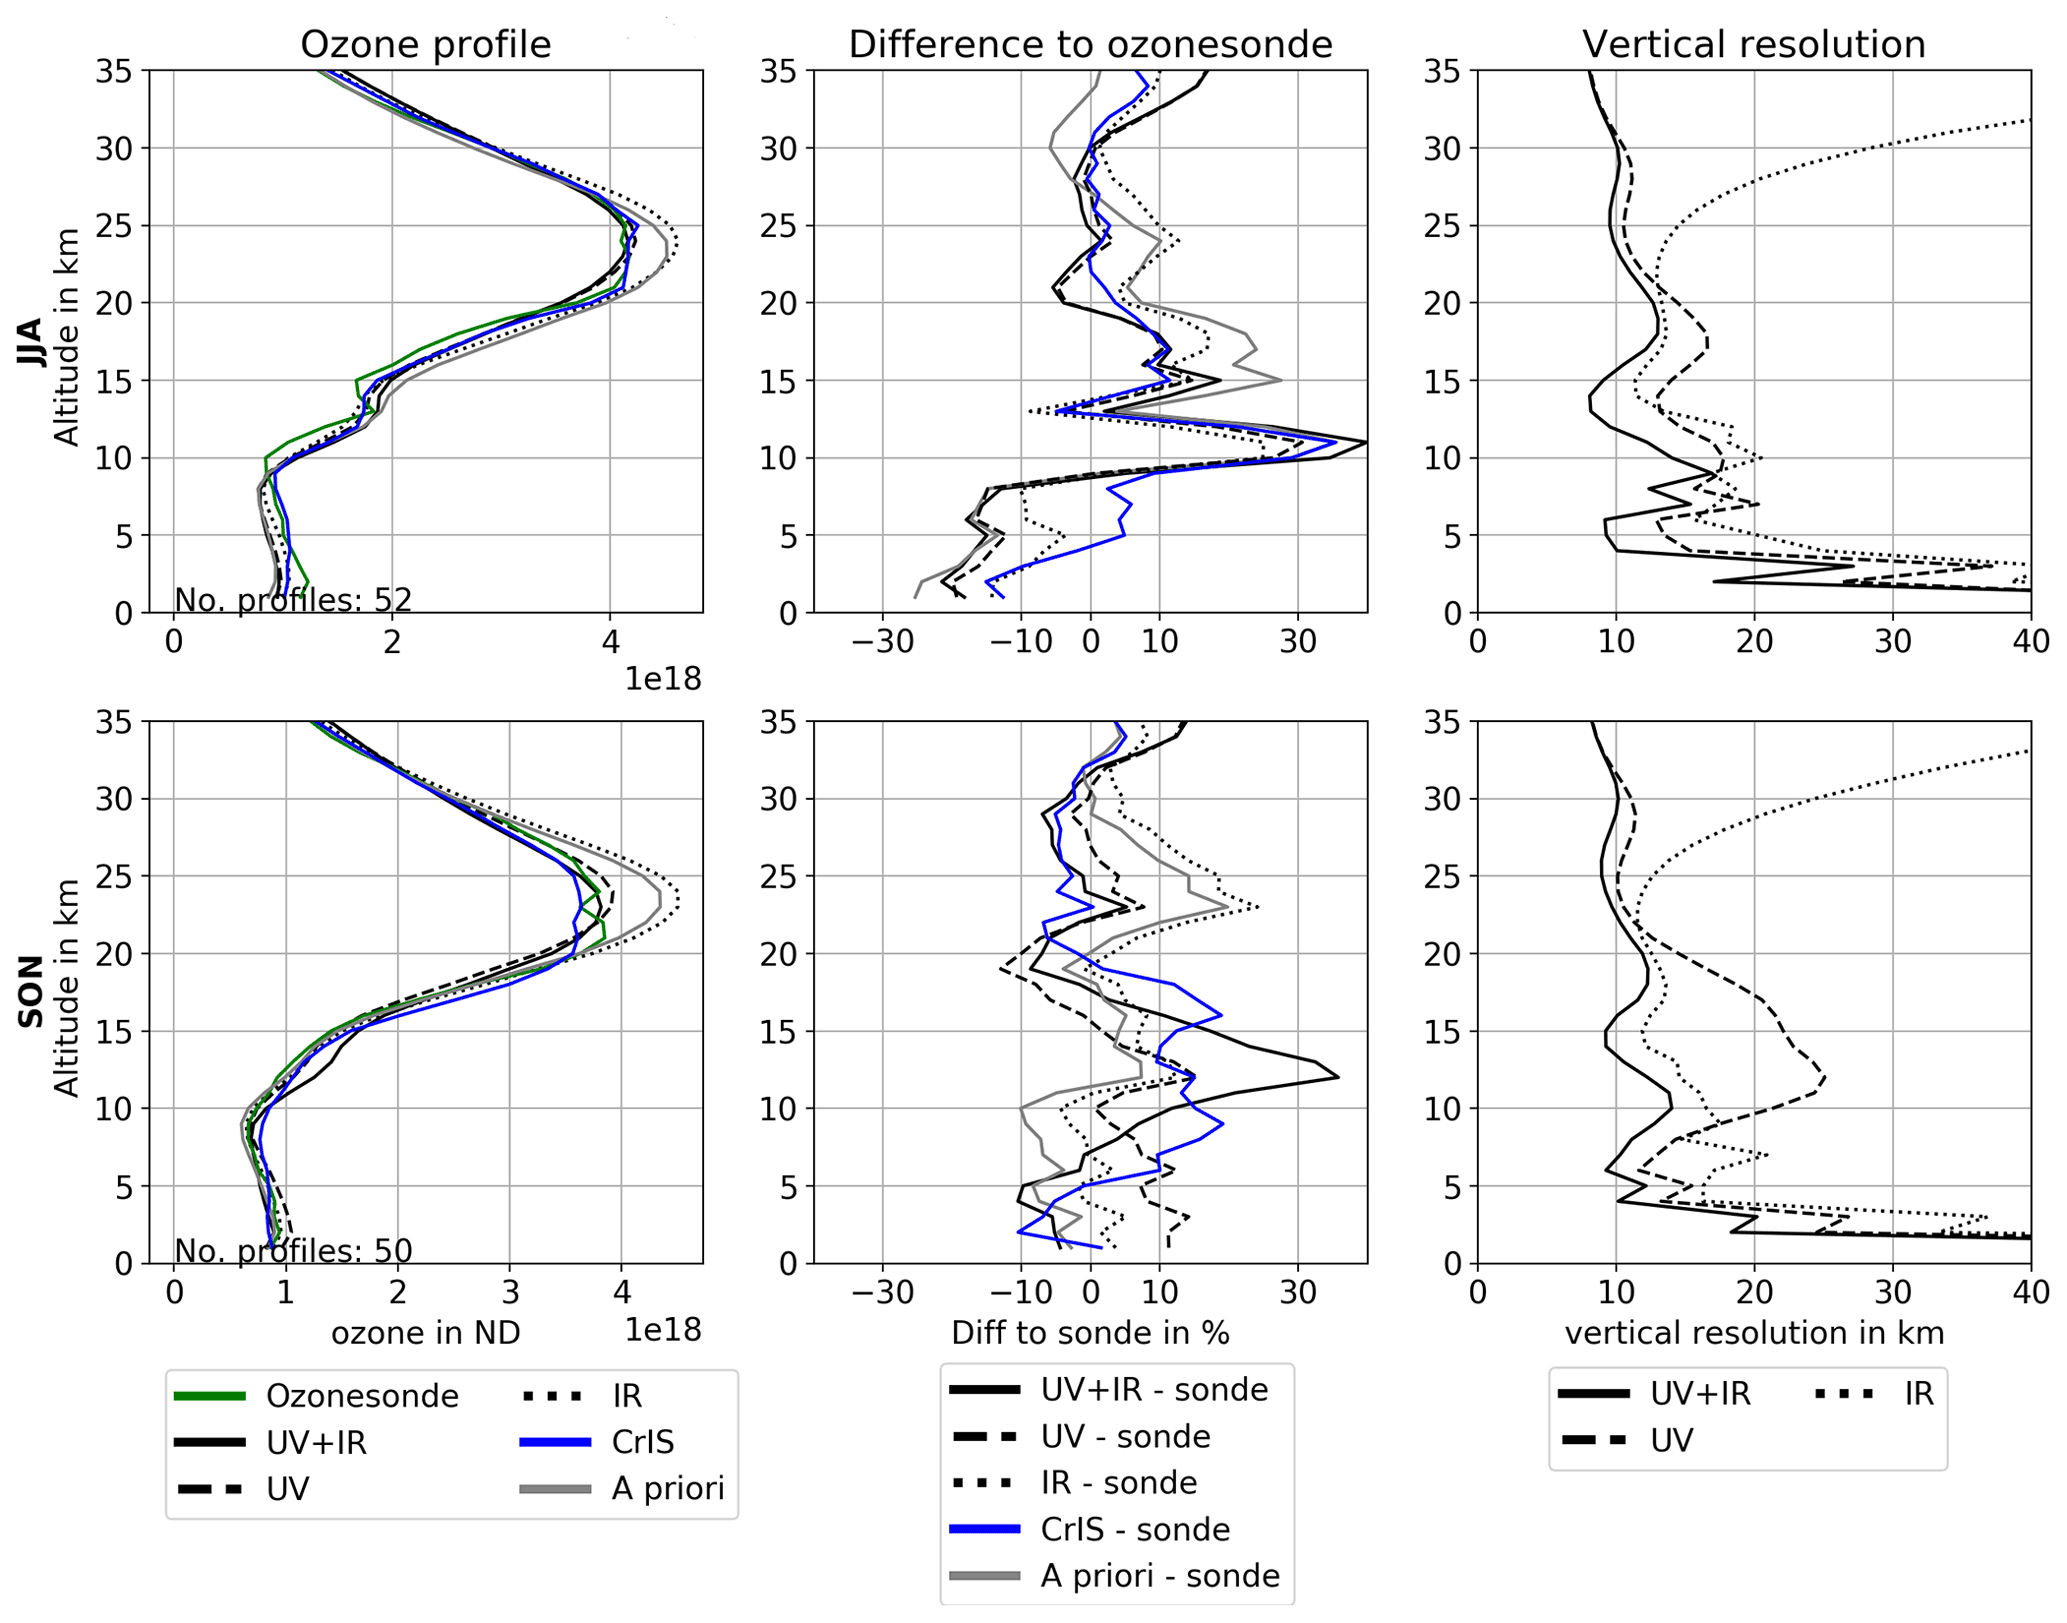
Figure 9Ozone profile comparisons using ozonesondes and NASA operational CrIS profiles at northern latitudes (20–60∘ N) separated into summer (JJA) and autumn (SON) seasons.
5.2 Troposphere and lower stratosphere: ozonesondes
Overall, we found 205 globally distributed ozone soundings, which are collocated with TROPOMI and CrIS. Figure 8 shows a comparison of the three different ozone profile retrievals with ozonesonde data in the tropical region (−20 to 20∘) and northern midlatitudes (20 to 60∘). Much fewer collocated data were available in other latitude regions, making the comparisons less reliable. They are shown in Fig. S2. The overall findings are similar to those for the tropics and northern latitudes, as discussed below.
Looking at the mean ozone profiles in both latitude regions shown in Fig. 8, it is apparent that the UV-only retrieval results already agree very well with the ozonesonde profiles. Potential improvements from using a combined retrieval can therefore be only minor. In the tropics, the UV + IR retrieval shows good agreement below 7 km, a positive bias of about +20 % between 10–15 km, about 10 % positive bias between 15 and 22 km, and is within ±10 % range above 22 km. The UV-only retrieval has a slightly positive bias of about +15 % below 10 km but it agrees very well with ozonesondes above 10 km. The IR-only retrieval agrees well with the ozonesondes below 15 km but has a positive bias in the stratosphere. The combined retrieval shows traceable impacts from both independent retrievals but it does not seem to improve results everywhere. The altitude region between 10 and 15 km is quite challenging in general. This is because the ozone values are lowest in this altitude range approaching the detection limits of the electrochemical concentration cell (ECC) sensors used in ozonesondes. From Witte et al. (2018), it is known that ozonesondes in the tropics have an uncertainty up to 15 % in the vicinity of the tropopause. At northern latitudes, the results show similarities to the tropics. The UV + IR and UV-only retrievals agree very well with the ozonesonde profiles above 15 km in the stratosphere. The IR-only retrieval has a positive stratospheric bias similar to the tropics. Near the tropopause, the UV + IR retrieval shows large positive differences (more than 40 %), while the UV-only and IR-only profiles stay close to the a priori with a +20 % bias. Below 7 km, the UV-only and IR-only retrievals agree well with the ozonesondes, while the combined retrieval shows a slight negative bias of −10 %. The standard deviations are comparable to those obtained in the comparisons with the tropospheric lidar data (Fig. 5). The vertical resolution shows a strong dependence on latitude. This dependence is due to the different solar zenith angles and the typically low ozone content in the tropical upper troposphere–lower stratosphere (UTLS) region.

Figure 10Comparison of TOC with box-and-whisker plots, time series, and statistical information similar to the tropospheric lidar comparisons shown in Fig. 6. Panels (a) and (b) show the absolute differences in TOC with respect to the ozonesonde data in the tropics (20∘ S–20∘ N). Panels (c) and (d) are the same as the upper panel but for the northern latitudes (20–60∘ N).
To investigate the larger differences observed from the combined retrieval, the validation results for northern latitudes are separated into seasons. Figure 9 presents the results in summer (JJA) and autumn (SON) (both seasons with most collocations), while plots for other seasons are provided in Fig. S3. The mean collocated ozone profiles from NASA's operational CrIS level 2 product for the same ozonesonde measurements are also shown. For the comparison with CrIS, it must be taken into account that the NASA operational retrieval provides only about 2 DOF. High vertical sampling of the CrIS data and its good accuracy in the stratosphere and troposphere results to some extent from the use of the MERRA2 ozone profile data as a priori information (Wargan et al., 2017). In the comparison with the ozonesondes (solid black line), a positive bias of up to 40 % is found for the combined retrieval in the altitude region between 10 and 15 km in both seasons, as mentioned above. However, there are two different situations to be considered. In summer, the a priori profile does not agree well with the ozonesonde data and none of the retrievals can substantially improve it. The results from the three retrievals are very similar. The UV-only retrieval already has a quite good vertical resolution under the given conditions and no further improvement can be achieved by adding the IR measurements. CrIS/MERRA2 ozone profiles (blue) show the same differences with the ozonesondes as the TOPAS retrievals, which means they agree very well. It should be noted that Wargan et al. (2017) also reported deviations between MERRA2 and ozonesondes of up to ± 30 % in the tropopause region for 2003 and 2005. In autumn, the situation is different. The mean a priori profile agrees well with the ozonesondes. Because the UV-only retrieval between 10 and 15 km has a low vertical resolution as a result of a low sensitivity, as it is shown in Fig. 4, it remains close to the climatology. Below 10 km, it shows a slight positive deviation of +10 %. In contrast, the UV + IR retrieval shows a positive difference of +35 % at 12 km and a 10 % negative bias at 5 km. The CrIS product has a similar shape of the difference profile. The positive bias peak between 8 and 18 km seems to be smoothed and less pronounced but still exists.
The reason for the positive bias between 10–15 km might be a compensation effect that occurs when both spectral ranges are combined. It is known from previous studies (Boynard et al., 2016; Dufour et al., 2012; Nassar et al., 2008; J. Worden et al., 2007; Verstraeten et al., 2013) that retrieved ozone profiles from nadir-viewing IR instruments show a positive bias in the UTLS and in the stratosphere above (20–30 km). Boynard et al. (2016) showed that ozone profiles retrieved from IASI have a clear positive bias of up to +30 % in the tropics and +10 % in the middle latitudes between 20 and 35 km. In the UTLS region, a positive bias up to +40 % was found in the tropics and polar regions. Dufour et al. (2012) found similar results in the UTLS from comparing three different IASI ozone profile algorithms. Ozone profile retrievals using IR measurements from TES (J. Worden et al., 2007; Nassar et al., 2008; Verstraeten et al., 2013) point out similar features, an overestimation of ozone of up to +20 % in the stratosphere (20–30 km) and in some latitude regions in the UTLS as well. The cause of this stratospheric bias is not yet fully understood. Possible explanations include insufficient vertical resolution of the ozone profiles, instrument artefacts, spectroscopy problems, forward model errors, and insufficient quality of a priori profiles (Verstraeten et al., 2013; Boynard et al., 2016). For the combined retrieval, the retrieval solution in the 20–30 km altitude range is dominated by the UV measurements, and thus it does not show the typical bias of the IR retrievals. On the other hand, the uncompensated contribution from the IR spectra in this altitude range then gets balanced by overcorrecting the profiles at lower altitudes, where the sensitivity of UV measurements is low. From AKs shown in Fig. 3, we see that a positive variation of the true state around 15 km causes a significant negative response around 25 km. Thus, the positive bias around 25 km present in the IR-only retrieval and removed in the combined retrieval might be compensated in the IR part of the combined retrieval by increasing the values around 15 km. From the comparison with the tropospheric lidar shown in Fig. 2, it is also seen that the UV + IR retrieval performs well around 15 km when the IR-only retrieval does not show a positive bias in the stratosphere. The reason why in this particular case the stratospheric IR-only results are nearly bias free remains to be investigated.

Figure 11Scatter plot of TOCs from TOPAS retrievals with respect to ozonesonde data in the tropics. The one-to-one line is given as a dashed black line. The linear regression curves are plotted with different colours and their equations are given in the legend.
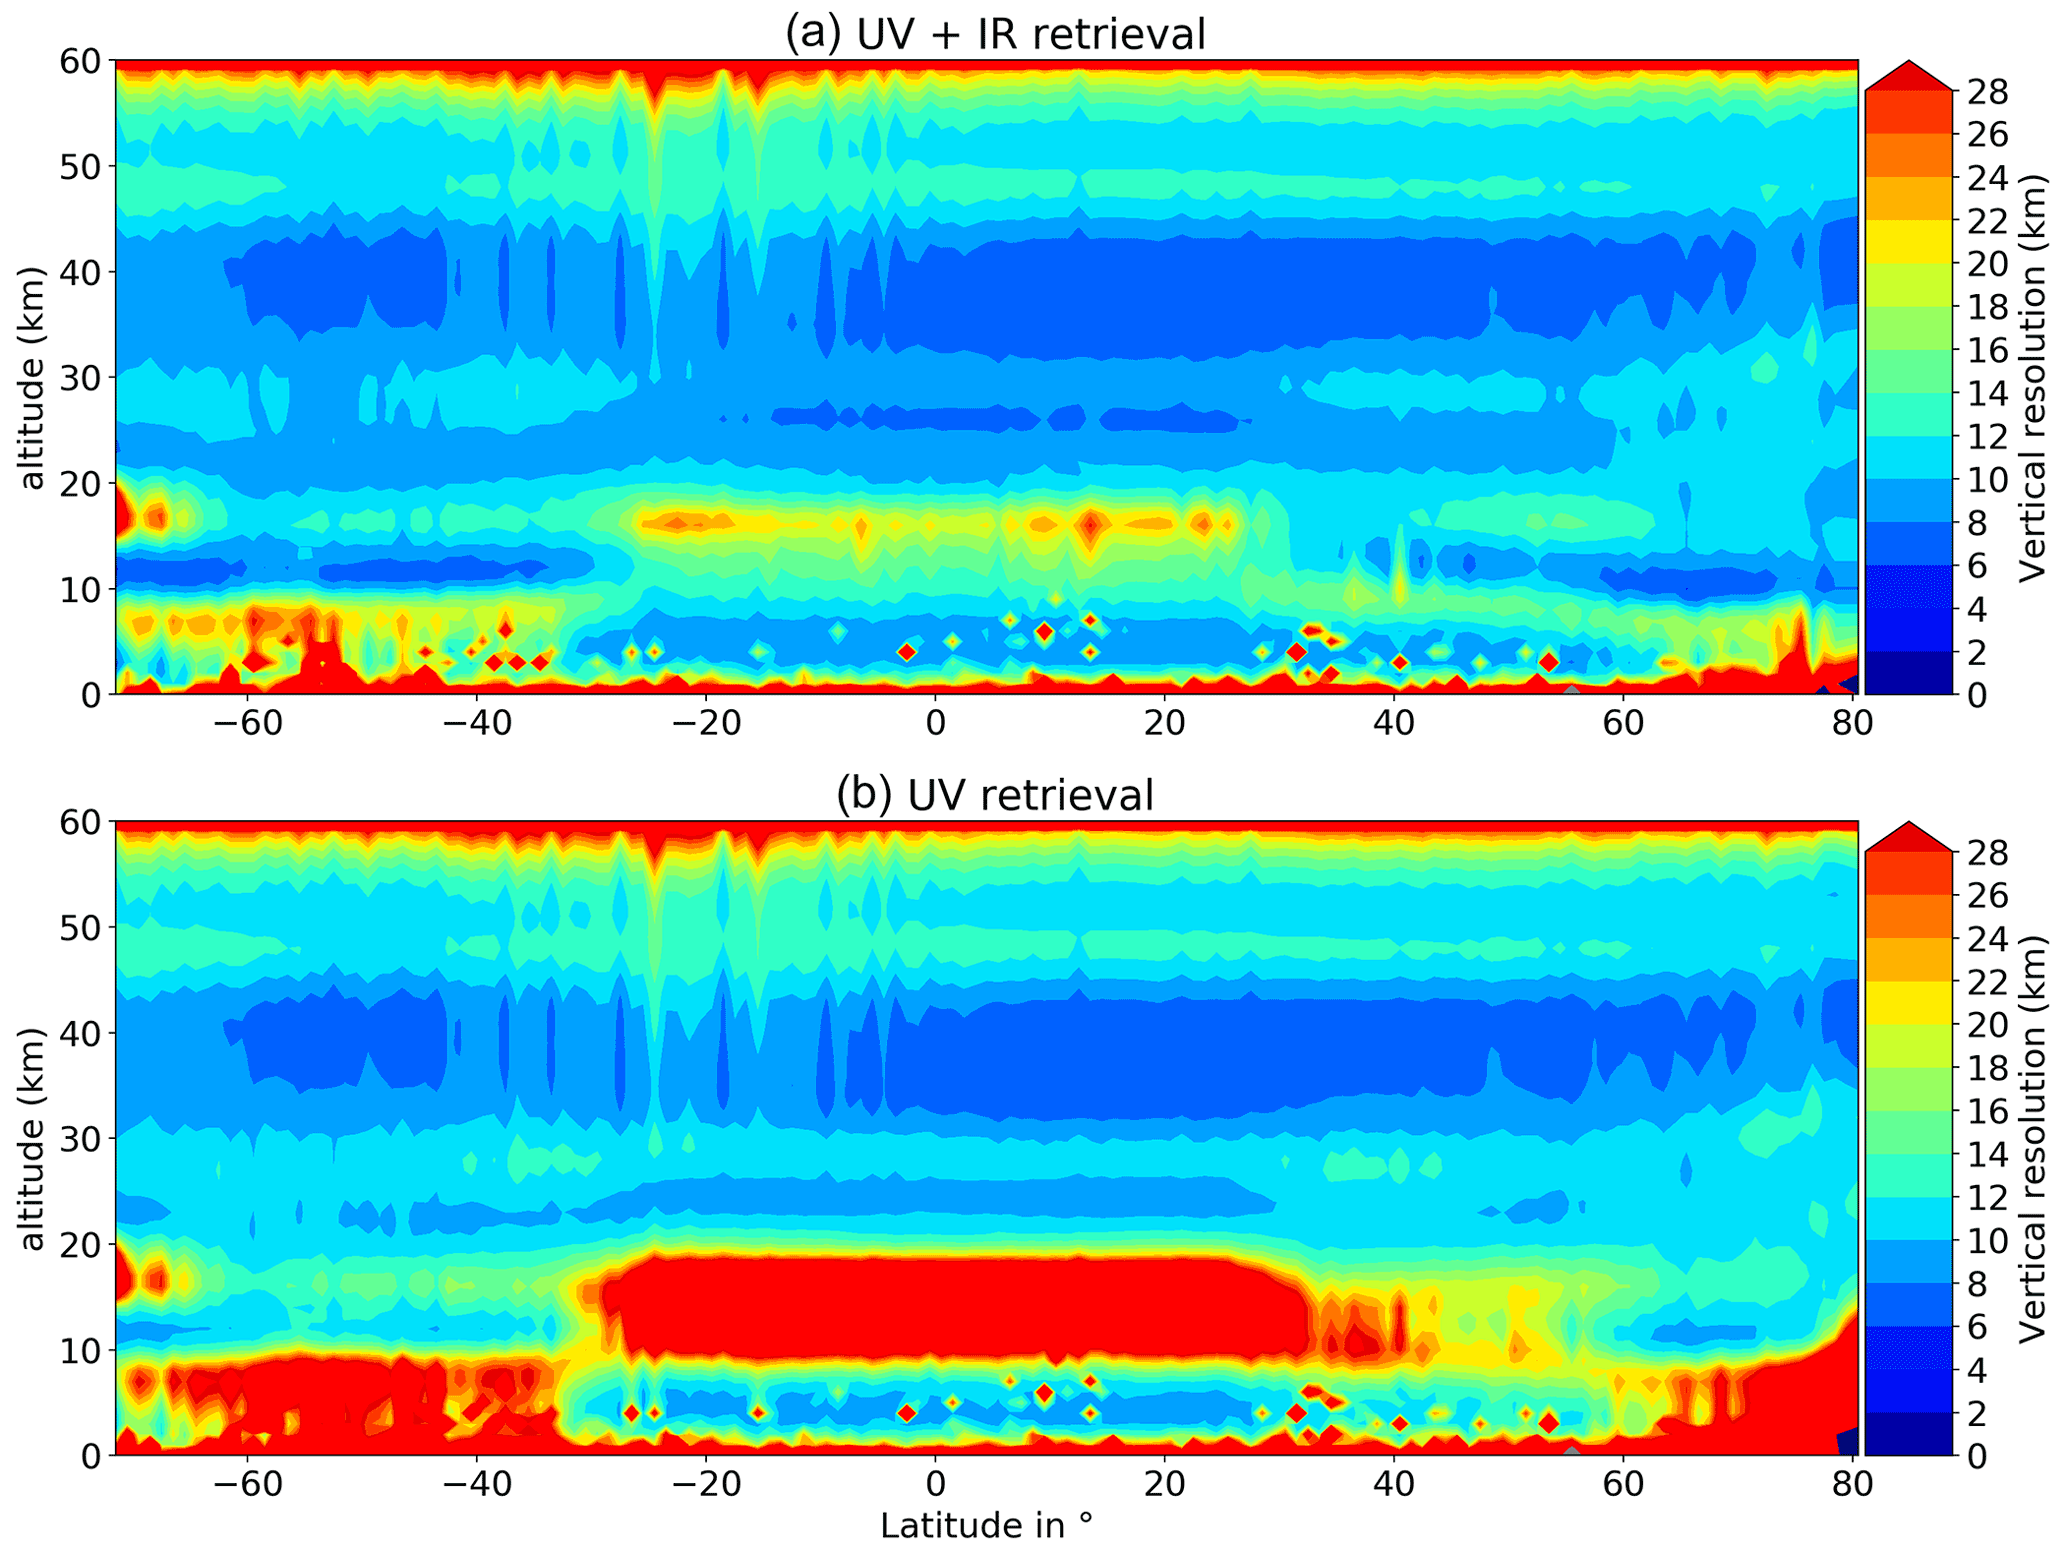
Figure 12Zonally averaged vertical resolution for 1 d of TOPAS retrieval data (1 October 2018). The vertical resolution is given by the inverse main diagonal elements of the AK matrix. (a) Vertical resolution for the combined retrieval. (b) Vertical resolution from the UV-only retrieval.
In Fig. 10, the TOCs from TOPAS retrievals are compared to collocated ozonesonde data in the tropical region and at northern midlatitudes. The comparison results largely confirm the findings from the ozone profile comparisons. As in Fig. 6, box-and-whisker plots are shown on the left-hand side for a better overview, and the time series are shown in the middle. In northern latitudes, a slight annual variation with a positive bias outside the summer might be suspected, but further data are needed for a more detailed analysis. Overall, all of the retrievals and the a priori data show a slight positive bias. The best agreement with +1.28 ± 3.2 DU is found for the IR-only retrieval in the tropics. The combined retrieval has a larger +3.79 DU mean difference but the standard deviation is reduced by 1.5 DU in comparison to the UV-only retrieval and to the a priori. The findings are comparable to the results obtained with the convective clouds differential (CCD) method using TROPOMI data in the tropics (Hubert et al., 2020). In a validation using SHADOZ ozonesondes, a positive bias of +2.3 DU with a dispersion (1σ) of 4.6 DU was shown. At northern latitudes, the mean a priori TOC already agrees very well with the mean ozonesonde TOC but the scattering of the results is rather large, with a standard deviation of 5.73 DU. Neither IR-only nor UV + IR retrievals can significantly improve the results here. However, a comparison with UV-only TOC and standard deviation shows that the combined retrieval improves both the TOC and the scattering of differences. Tropospheric ozone retrieved from the combined retrieval is improved compared to the results from the UV-only retrieval, even if the UV + IR profile has a larger bias at 12 km.
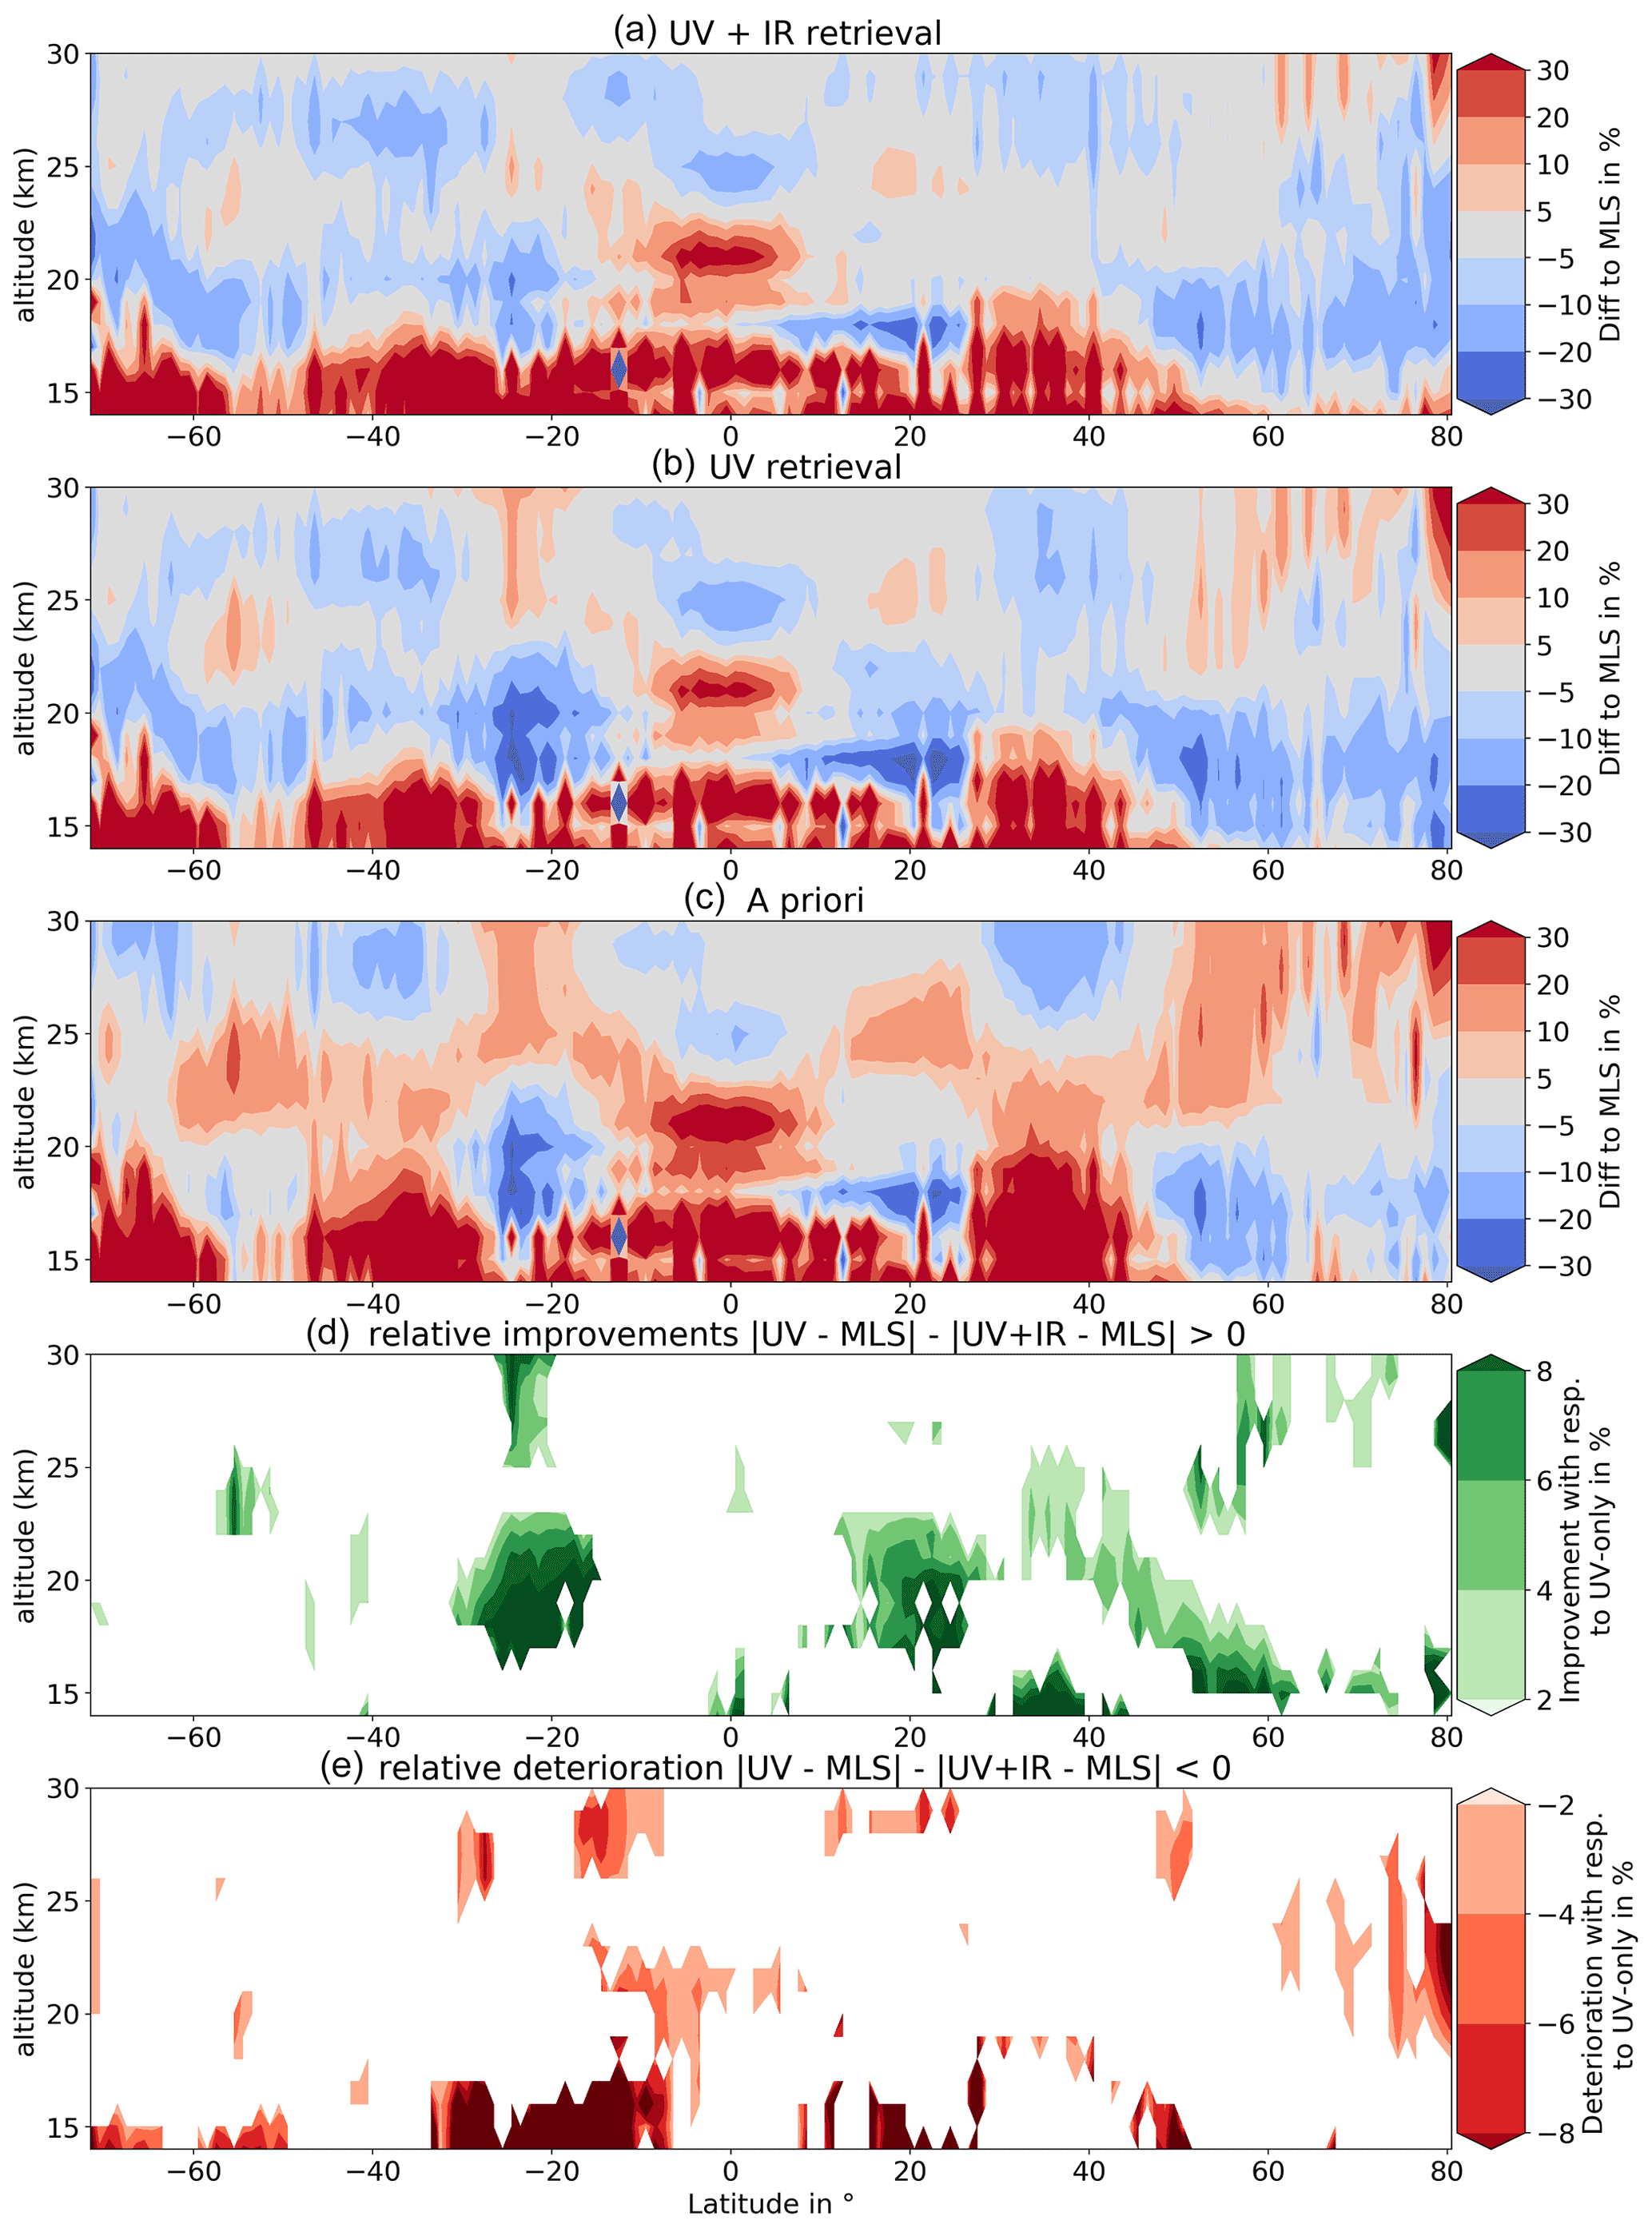
Figure 13Zonal mean differences in percent between combined TOPAS ozone profiles (a), UV-only TOPAS profiles, (b) as well as the climatological (a priori) (c) and MLS data on 1 October 2018. Panels (d) and (e) show the difference between the relative differences from panels (a) and (b), which can be interpreted as improvement/deterioration in the UV + IR retrieval with respect to the UV-only retrieval. All changes within ±2 % are masked out to highlight the larger differences.
An additional assessment of the retrieval quality is presented in Fig. 11 as a scatter plot of TOCs from the various TOPAS retrievals with respect to ozonesonde data. This plot shows the results from the tropical region. A similar plot for the northern latitudes is presented in Fig. S4. While in the profile and TOC comparisons no issues could be identified for a priori data, it becomes apparent from the scatter plot that climatological TOCs have a quite low correlation with ozonesonde data resulting in a correlation coefficient of only 0.55. The UV-only retrieval correlates slightly better with a correlation coefficient of 0.66. The IR-only and UV + IR results show much better correlation with the TOCs from ozonesondes with R values of 0.8 and higher. This means that if only the tropospheric ozone content matters, IR-only retrieval is the best choice in the tropics. If, however, the entire atmosphere is to be considered, then UV + IR retrieval yields better results.
5.3 Comparison with MLS
As follows from Fig. 2, the inclusion of CrIS IR measurements in the ozone profile retrieval has an impact not only on the troposphere but also on the stratosphere. To assess the effect in more detail, the UV + IR and UV-only retrievals are compared with collocated MLS ozone profiles as an example for 1 d, 1 October 2018. About 1400 collocated measurements were identified for this day. Results for some other days are presented in Figs. S5–S8. Figure 12 shows the vertical resolution of the UV + IR and UV-only ozone profile retrievals as a function of latitude and altitude. The UV-only retrieval has high vertical resolution of about 10 km in the stratosphere between 20 and 50 km. Below 20 km, its vertical resolution degrades showing strong latitude dependence due to the viewing geometry and the respective ozone content in the atmosphere. As expected, there are no differences between UV + IR and UV-only retrievals above 30 km (retrieval dominated by the UV range). Between 20 and 30 km, the vertical resolution of the UV + IR retrieval is typically higher, which is reflected by the wider areas of dark blue colour in the respective contour plot. Only in the northern high latitudes almost no change in the vertical resolution is observed. The greatest improvement of the UV + IR retrieval vertical resolution in comparison to that of UV-only retrieval is observed in the altitude range between 10 and 20 km. At higher latitudes, a vertical resolution of 10 km is achieved, similar to that in the stratosphere. In the tropics, the vertical resolution of UV + IR is also significantly higher but remains at values between 15 and 20 km; i.e. still the vertical resolution is not sufficient to retrieve an independent subcolumn layer from this altitude range. In the northern subtropics near 30–35∘ N, there are particularly significant changes. Here, the resolution reaches more than 28 km (red) in the UV-only retrieval, while it optimises to 10 km (blue) in the combined retrieval. This is consistent with the very good results achieved from the latter retrieval, as seen in the comparisons with tropospheric lidar data. Below 10 km, the differences in the vertical resolutions of both retrievals are less pronounced. In the tropics, the vertical resolution below 10 km altitude is already quite good for the UV-only retrieval and only slightly better for the combined retrieval. In the northern and southern higher latitudes, the vertical resolution of the UV + IR retrieval (15–25 km below 10 km altitude) is better than that of the UV-only retrieval (∼ 30 km) but again no independent subcolumn layer can yet be determined in this altitude range.
The zonal mean differences between MLS and TOPAS (UV + IR, UV-only, and a priori) ozone profiles are shown in Fig. 13. The plot is limited to the 14–30 km altitude range because MLS provides the most reliable profiles above the tropopause, and differences between UV + IR and UV-only retrievals are observed only below 30 km. The differences of the climatological (a priori) ozone profiles (panel c) with all observations reach up to +20 % and show an oscillating pattern above 20 km. Near the Equator, there is a large positive difference of over +30 %. Below 20 km, some areas with differences higher than 30 % are observed. For both UV + IR (panel a) and UV-only (panel b) retrievals, the oscillating positive pattern above 20 km is not present any more while the differences in the tropics and in the troposphere are still observed, although less pronounced. In both UV + IR and UV-only retrievals, the negative differences are more dominant. Overall, the relative mean differences of the combined retrieval are lower. The distribution of regions of improvements and deterioration of the UV + IR retrieval results with respect to the UV-only retrieval is presented in panels (d) and (e). For that purpose, the difference between the relative deviations of the UV-only and UV + IR retrievals with respect to MLS data is calculated. Improvements (panel d) show up in the altitude range between 18–22 km in the region around ±20∘ and in a band vertically descending between +30 and +60∘. Large-scale degradation occurs only below 17 km, where the validation has weaknesses due to the lower MLS's precision, and in the very high northern latitudes between 20–25 km. As the information content from UV measurements is clearly dominating in the stratosphere, the improvement in the stratospheric part of the retrieved ozone profiles due to inclusion of the IR spectral range is rather moderate and not observed on every day. Further studies with a larger amount of data would be helpful to investigate this in more detail.
Spectral measurements from the instruments TROPOMI and CrIS were combined to improve the ozone profile retrieval using either instrument alone. The combined retrieval is particularly suited for CrIS and TROPOMI, as they fly in the same orbit just a few minutes apart. The combined UV and IR retrieval was successfully implemented by applying our TOPAS algorithm to the UV spectral range of 270–329 nm (TROPOMI) and the IR spectral range between 9350–9900 nm (CrIS). Advantages of the combined UV + IR ozone profile retrieval were demonstrated by comparing with our UV-only and IR-only retrievals. All TOPAS retrievals were run using the same settings and the same measurement data set. Even though the available TROPOMI data set is still very limited, improvements in the UV + IR retrieval were demonstrated by validation with collocated tropospheric lidar, ozonesondes, and MLS data. The main findings are as follows:
-
The vertical resolution improves by adding CrIS IR spectral measurements to the TROPOMI UV ozone profile retrieval. The effect extends up to an altitude of 30 km. The improvement depends on the latitude and ozone content in the atmosphere. Overall, an improvement of DOF by 1 was observed. In the altitude range of 10–20 km, the vertical resolution is about 10 km, which is similar to the values in the stratosphere. The improvement is relatively small in comparison to the results for other combined UV (OMI, GOME-2) and IR (TES, IASI) retrievals obtained in previous publications. We assume that the main reason is the lower spectral resolution of CrIS compared to IASI and TES.
-
The validation with tropospheric lidar shows reduced mean differences and reduced standard deviation of the mean differences in tropospheric ozone columns for the UV + IR profile in comparison to the UV-only retrieval. Since only a few tropospheric lidar stations are available, this validation was limited to the northern subtropical region.
-
The validation with ozonesondes shows rather minor improvements. When only TOCs are compared, the results from the combined ozone profile retrieval are found to be better than those from UV-only retrieval in the tropics and northern latitudes. Nonetheless, the UV + IR ozone profiles show a positive bias of +20 % to +40 % in the altitude range of 10–15 km. The reason for this might be a positive stratospheric bias in the IR-only retrieval results. In the combined retrieval, the stratospheric bias is removed because of the dominating influence from the UV spectral range. To retain the consistency in the IR spectral region, this is compensated by an overcorrection in the 10–15 km range, where the sensitivity of the UV measurements is low. A positive stratospheric bias in the IR-only retrieval was also found in previous publications using TES and IASI data (e.g. Verstraeten et al., 2013; Boynard et al., 2016). Its possible reasons are still a matter of debate.
-
Analysing an example day of collocated MLS and TROPOMI/CrIS measurements, it was shown that the inclusion of the IR spectral range affects the retrieved profiles up to 30 km altitude. In the stratosphere, improvements in comparison with the UV-only retrieval were seen especially in the subtropical region.
There are still some open questions to be answered in the future. The improvement of the combined retrieval over the UV-only one was mostly small. One possible reason is a rather low spectral resolution of the CrIS data. It would be therefore interesting to combine TROPOMI data with higher-resolved IR instruments, e.g. IASI; however, collocation of TROPOMI with IASI is not as favourable as in the case for the co-flying CrIS instrument. Further investigations are needed to understand the positive bias seen in the stratosphere for the IR-only retrieval. It is expected that the elimination of this bias may help to further improve the combined retrieval in the troposphere. A potential alternative approach would be a sequential retrieval where the IR-only retrieval is done first and then used in a second step as a priori for the UV-only retrieval. With respect to the stratospheric ozone profiles further investigations are needed to compare the optimised UV-IR retrieval with optimised UV-only retrieval; i.e. the latter retrieval needs to be performed with its own optimised settings rather than with the same settings as the UV+IR retrieval. Irrespective of these open questions, it was successfully shown that the approach using combined TROPOMI and CrIS ozone profile retrieval is highly promising.
All resulting data are available upon request from Nora Mettig (mettig@iup.physik.uni-bremen.de) or Mark Weber (weber@uni-bremen.de). The L1B version of the S5P test data is available upon request to the S5P Validation Team. All CrIS L2 products and MLS ozone profiles can be downloaded from the NASA Goddard Space Flight Center Earth Sciences Data and Information Services Center (GES DISC; Barnet, 2019a, https://doi.org/10.5067/9HR0XHCH3IGS; Barnet, 2019b, https://doi.org/10.5067/ATJX1J10VOMU; Schwartz et al., 2020, https://doi.org/10.5067/Aura/MLS/DATA2516). S5P WFDOAS total ozone and albedo data are available from Mark Weber. Ozonesonde data from the WOUDC can be downloaded from https://doi.org/10.14287/10000008 WOUDC Ozonesonde Monitoring Community et al. (2022). Ozonesonde data from SHADOZ (Witte et al., 2017, https://doi.org/10.1002/2016JD026403; Thompson et al., 2017, https://doi.org/10.1002/2017JD027406; Witte et al., 2018, https://doi.org/10.1002/2017JD027791; Sterling et al., 2018, https://doi.org/10.5194/amt-11-3661-2018). The tropospheric lidar data used in this publication were obtained from Thierry Leblanc, Mike Newchurch, and Shi Kuang as part of the Network for the Detection of Atmospheric Composition Change (NDACC) (De Maziére et al. , 2018) and are available through the NDACC website http://www.ndaccdemo.org/ (last access: 1 March 2022, Network for Detection of Atmospheric Composition Change, 2021). Further tropospheric lidar data from the Observatoire de Haute-Provence station are provided by Gerard Ancellete through personal contact.
The supplement related to this article is available online at: https://doi.org/10.5194/amt-15-2955-2022-supplement.
NM developed the ozone profile retrieval algorithms and performed all analysis and validations. MW and AR provided direct advice and support. AR made the SCIATRAN model code available. NM, MW, AR, and JPB defined the paper structure and content. MW provided the S5P WFDOAS total ozone and albedo data. PV provided support by discussing the TROPOMI measurements and the ozone profile retrieval. AMT, RMS, TL, GA, MN, SK, RK, MBT, RVM, AP, BK, RS, and PS provided ozonesonde and lidar data for the validation. All authors reviewed the paper.
At least one of the co-authors are part of the editorial board.
Publisher’s note: Copernicus Publications remains neutral with regard to jurisdictional claims in published maps and institutional affiliations.
This article is part of the special issue “Atmospheric ozone and related species in the early 2020s: latest results and trends (AMT/ACP inter-journal SI)”. It is not associated with a conference.
This study was supported and funded by the BMWi/DLR project “S5P Datennutzung” (Förderkennzeichen 50EE1811A), the University of Bremen, and the federal state of Bremen. All calculations reported here were performed on HPC facilities of the IUP, University of Bremen, funded under DFG/FUGG grant nos. INST 144/379-1 and INST 144/493-1. The S5P L1b version 2 data are provided by ESA/KNMI via the S5P validation team (S5P-VT) activities. We acknowledge all ozonesonde providers and their funding agencies for performing regular sonde measurements and thank the WOUDC and SHADOZ networks archiving these data. The same applies to the teams from all lidar stations we used. We thank the NDACC network, especially Thierry Leblanc, Mike Newchurch and Shi Kuang, and Gerard Ancellete from the Observatoire de Haute-Provence for providing the tropospheric lidar measurements and ozone profiles. Ozone profiles of the MLS limb measurements and all level 2 products from CrIS are provided by NASA. Special thanks are given to Nadia Smith (Science and Technology Corporation, Columbia, MD) who supported us with productive discussions on CrIS. Retrievals described in this paper use the GALAHAD Fortran library. We thank the developers for providing the source code and support.
This research has been supported by the Deutsches Zentrum für Luft- und Raumfahrt (grant no. 50EE1811A), the Universität Bremen (grant nos. INST 144/379-1 and INST 144/493-1), and the Freie Hansestadt Bremen.
The article processing charges for this open-access publication were covered by the University of Bremen.
This paper was edited by Birgit Hassler and reviewed by two anonymous referees.
Barnet, C.: Sounder SIPS: Suomi NPP CrIMSS Level 2 CLIMCAPS Full Spectral Resolution: Atmosphere cloud and surface geophysical state V2, Goddard Earth Sciences Data and Information Services Center (GES DISC) [data set], https://doi.org/10.5067/62SPJFQW5Q9B, 2019a. a, b, c, d, e
Barnet, C.: Sounder SIPS: Suomi NPP CrIMSS Level 2 CLIMCAPS Full Spectral Resolution: Cloud Cleared Radiances V2, Goddard Earth Sciences Data and Information Services Center (GES DISC) [data set], https://doi.org/10.5067/ATJX1J10VOMU, 2019b. a, b
Bowman, K. W., Steck, T., Worden, H. M., Worden, J., Clough, S., and Rodgers, C.: Capturing time and vertical variability of tropospheric ozone: A study using TES nadir retrievals, J. Geophys. Res., 107, ACH21-1–ACH21-11, https://doi.org/10.1029/2002JD002150, 2002. a
Bowman, K. W., Rodgers, C. D., Kulawik, S. S., Worden, J., Sarkissian, E., Osterman, G., Steck, T., Lou, M., Eldering, A., Shephard, M., Worden, H., Lampel, M., Clough, S., Brown, P., Rinsland, C., Gunson, M., and Beer, R.: Tropospheric emission spectrometer: retrieval method and error analysis, IEEE Trans. Geosci. Remote Sens., 44, 1297–1307, https://doi.org/10.1109/TGRS.2006.871234, 2006. a
Boynard, A., Clerbaux, C., Coheur, P.-F., Hurtmans, D., Turquety, S., George, M., Hadji-Lazaro, J., Keim, C., and Meyer-Arnek, J.: Measurements of total and tropospheric ozone from IASI: comparison with correlative satellite, ground-based and ozonesonde observations, Atmos. Chem. Phys., 9, 6255–6271, https://doi.org/10.5194/acp-9-6255-2009, 2009. a
Boynard, A., Hurtmans, D., Koukouli, M. E., Goutail, F., Bureau, J., Safieddine, S., Lerot, C., Hadji-Lazaro, J., Wespes, C., Pommereau, J.-P., Pazmino, A., Zyrichidou, I., Balis, D., Barbe, A., Mikhailenko, S. N., Loyola, D., Valks, P., Van Roozendael, M., Coheur, P.-F., and Clerbaux, C.: Seven years of IASI ozone retrievals from FORLI: validation with independent total column and vertical profile measurements, Atmos. Meas. Tech., 9, 4327–4353, https://doi.org/10.5194/amt-9-4327-2016, 2016. a, b, c, d
Burrows, J., Bovensmann, H., Bergametti, G., Flaud, J., Orphal, J., Noël, S., Monks, P., Corlett, G., Goede, A., von Clarmann, T., Steck, T., Fischer, H., and Friedl-Vallon, F.: The geostationary tropospheric pollution explorer (GeoTROPE) mission: objectives, requirements and mission concept, Adv. Space Res., 34, 682–687, https://doi.org/10.1016/j.asr.2003.08.067, 2004. a
Costantino, L., Cuesta, J., Emili, E., Coman, A., Foret, G., Dufour, G., Eremenko, M., Chailleux, Y., Beekmann, M., and Flaud, J.-M.: Potential of multispectral synergism for observing ozone pollution by combining IASI-NG and UVNS measurements from the EPS-SG satellite, Atmos. Meas. Tech., 10, 1281–1298, https://doi.org/10.5194/amt-10-1281-2017, 2017. a
Cuesta, J., Eremenko, M., Liu, X., Dufour, G., Cai, Z., Höpfner, M., von Clarmann, T., Sellitto, P., Foret, G., Gaubert, B., Beekmann, M., Orphal, J., Chance, K., Spurr, R., and Flaud, J.-M.: Satellite observation of lowermost tropospheric ozone by multispectral synergism of IASI thermal infrared and GOME-2 ultraviolet measurements over Europe, Atmos. Chem. Phys., 13, 9675–9693, https://doi.org/10.5194/acp-13-9675-2013, 2013. a, b, c
Cuesta, J., Kanaya, Y., Takigawa, M., Dufour, G., Eremenko, M., Foret, G., Miyazaki, K., and Beekmann, M.: Transboundary ozone pollution across East Asia: daily evolution and photochemical production analysed by IASI + GOME2 multispectral satellite observations and models, Atmos. Chem. Phys., 18, 9499–9525, https://doi.org/10.5194/acp-18-9499-2018, 2018. a
De Mazière, M., Thompson, A. M., Kurylo, M. J., Wild, J. D., Bernhard, G., Blumenstock, T., Braathen, G. O., Hannigan, J. W., Lambert, J.-C., Leblanc, T., McGee, T. J., Nedoluha, G., Petropavlovskikh, I., Seckmeyer, G., Simon, P. C., Steinbrecht, W., and Strahan, S. E.: The Network for the Detection of Atmospheric Composition Change (NDACC): history, status and perspectives, Atmos. Chem. Phys., 18, 4935–4964, https://doi.org/10.5194/acp-18-4935-2018, 2018. a
Deshler, T., Mercer, J. L., Smit, H. G. J., Stubi, R., Levrat, G., Johnson, B. J., Oltmans, S. J., Kivi, R., Thompson, A. M., Witte, J., Davies, J., Schmidlin, F. J., Brothers, G., and Sasaki, T.: Atmospheric comparison of electrochemical cell ozonesondes from different manufacturers, and with different cathode solution strengths: The Balloon Experiment on Standards for Ozonesondes, J. Geophys. Res., 113, D04307, https://doi.org/10.1029/2007JD008975, 2008. a
Dufour, G., Eremenko, M., Griesfeller, A., Barret, B., LeFlochmoën, E., Clerbaux, C., Hadji-Lazaro, J., Coheur, P.-F., and Hurtmans, D.: Validation of three different scientific ozone products retrieved from IASI spectra using ozonesondes, Atmos. Meas. Tech., 5, 611–630, https://doi.org/10.5194/amt-5-611-2012, 2012. a, b
Eremenko, M., Dufour, G., Foret, G., Keim, C., Orphal, J., Beekmann, M., Bergametti, G., and Flaud, J.-M.: Tropospheric ozone distributions over Europe during the heat wave in July 2007 observed from infrared nadir spectra recorded by IASI, Geophys. Res. Lett., 35, L18805, https://doi.org/10.1029/2008GL034803, 2008. a
ESA/KNMI: Tropomi: ISRF Dataset, http://www.tropomi.eu/data-products/isrf-dataset, last acces: 31 May 2021. a
Froidevaux, L., Jiang, Y. B., Lambert, A., Livesey, N. J., Read, W. G., Waters, J. W., Browell, E. V., Hair, J. W., Avery, M. A., McGee, T. J., Twigg, L. W., Sumnicht, G. K., Jucks, K. W., Margitan, J. J., Sen, B., Stachnik, R. A., Toon, G. C., Bernath, P. F., Boone, C. D., Walker, K. A., Filipiak, M. J., Harwood, R. S., Fuller, R. A., Manney, G. L., Schwartz, M. J., Daffer, W. H., Drouin, B. J., Cofield, R. E., Cuddy, D. T., Jarnot, R. F., Knosp, B. W., Perun, V. S., Snyder, W. V., Stek, P. C., Thurstans, R. P., and Wagner, P. A.: Validation of Aura Microwave Limb Sounder stratospheric ozone measurements, J. Geophys. Res., 113, D15S20, https://doi.org/10.1029/2007JD008771, 2008. a
Fu, D., Worden, J. R., Liu, X., Kulawik, S. S., Bowman, K. W., and Natraj, V.: Characterization of ozone profiles derived from Aura TES and OMI radiances, Atmos. Chem. Phys., 13, 3445–3462, https://doi.org/10.5194/acp-13-3445-2013, 2013. a, b
Fu, D., Kulawik, S. S., Miyazaki, K., Bowman, K. W., Worden, J. R., Eldering, A., Livesey, N. J., Teixeira, J., Irion, F. W., Herman, R. L., Osterman, G. B., Liu, X., Levelt, P. F., Thompson, A. M., and Luo, M.: Retrievals of tropospheric ozone profiles from the synergism of AIRS and OMI: methodology and validation, Atmos. Meas. Tech., 11, 5587–5605, https://doi.org/10.5194/amt-11-5587-2018, 2018. a
Gaudel, A., Ancellet, G., and Godin-Beekmann, S.: Analysis of 20 years of tropospheric ozone vertical profiles by lidar and ECC at Observatoire de Haute Provence (OHP) at 44∘ N, 6.7∘ E, Atmos. Environ., 113, 78–89, https://doi.org/10.1016/j.atmosenv.2015.04.028, 2015. a
Gordon, I. E., Rothman, L. S., Hargreaves, R. J., Hashemi, R., Karlovets, E. V., Skinner, F. M., Conway, E. K., Hill, C., Kochanov, R. V., Tan, Y., Wcisło, P., Finenko, A. A., Nelson, K., Bernath, P. F., Birk, M., Boudon, V., Campargue, A., Chance, K. V., Coustenis, A., Drouin, B. J., Flaud, J.-M., Gamache, R. R., Hodges, J. T., Jacquemart, D., Mlawer, E. J., Nikitin, A. V., Perevalov, V. I., Rotger, M., Tennyson, J., Toon, G. C., Tran, H., Tyuterev, V. G., Adkins, E. M., Baker, A., Barbe, A., Canè, E., Császár, A. G., Dudaryonok, A., Egorov, O., Fleisher, A. J., Fleurbaey, H., Foltynowicz, A., Furtenbacher, T., Harrison, J. J., Hartmann, J.-M., Horneman, V.-M., Huang, X., Karman, T., Karns, J., Kassi, S., Kleiner, I., Kofman, V., Kwabia-Tchana, F., Lavrentieva, N. N., Lee, T. J., Long, D. A., Lukashevskaya, A. A., Lyulin, O. M., Makhnev, V., Matt, W., Massie, S. T., Melosso, M., Mikhailenko, S. N., Mondelain, D., Müller, H., Naumenko, O. V., Perrin, A., Polyansky, O. L., Raddaoui, E., Raston, P. L., Reed, Z. D., Rey, M., Richard, C., Tóbiás, R., Sadiek, I., Schwenke, D. W., Starikova, E., Sung, K., Tamassia, F., Tashkun, S. A., Auwera, J. V., Vasilenko, I. A., Vigasin, A. A., Villanueva, G. L., Vispoel, B., Wagner, G., Yachmenev, A., and Yurchenko, S. N.: The HITRAN2020 molecular spectroscopic database, J. Quant. Spectrosc. Ra. Transf., 277, p. 107949, https://doi.org/10.1016/j.jqsrt.2021.107949, 2021. a, b
Han, Y., Revercomb, H., Cromp, M., Gu, D., Johnson, D., Mooney, D., Scott, D., Strow, L., Bingham, G., Borg, L., Chen, Y., DeSlover, D., Esplin, M., Hagan, D., Jin, X., Knuteson, R., Motteler, H., Predina, J., Suwinski, L., Taylor, J., Tobin, D., Tremblay, D., Wang, C., Wang, L., Wang, L., and Zavyalov, V.: Suomi NPP CrIS measurements, sensor data record algorithm, calibration and validation activities, and record data quality, J. Geophys. Res.-Atmos., 118, 12734–12748, https://doi.org/10.1002/2013JD020344, 2013. a
Han, Y., Suwinski, L., Tobin, D., and Chen, Y.: Effect of self-apodization correction on Cross-track Infrared Sounder radiance noise, Appl. Opt., 54, 10114–10122, https://doi.org/10.1364/AO.54.010114, 2015. a, b
Hasekamp, O. P. and Landgraf, J.: Ozone profile retrieval from backscattered ultraviolet radiances: The inverse problem solved by regularization, J. Geophys. Res., 106, 8077–8088, https://doi.org/10.1029/2000JD900692, 2001. a
Hersbach, H., Bell, B., Berrisford, P., Hirahara, S., Horányi, A., Muñoz-Sabater, J., Nicolas, J., Peubey, C., Radu, R., Schepers, D., Simmons, A., Soci, C., Abdalla, S., Abellan, X., Balsamo, G., Bechtold, P., Biavati, G., Bidlot, J., Bonavita, M., Chiara, G., Dahlgren, P., Dee, D., Diamantakis, M., Dragani, R., Flemming, J., Forbes, R., Fuentes, M., Geer, A., Haimberger, L., Healy, S., Hogan, R. J., Hólm, E., Janisková, M., Keeley, S., Laloyaux, P., Lopez, P., Lupu, C., Radnoti, G., Rosnay, P., Rozum, I., Vamborg, F., Villaume, S., and Thépaut, J.-N.: The ERA5 global reanalysis, Q. J. Roy. Meteorol. Soc., 146, 1999–2049, https://doi.org/10.1002/qj.3803, 2020. a, b
Hoogen, R., Rozanov, V. V., and Burrows, J. P.: Ozone profiles from GOME satellite data: Algorithm description and first validation, J. Geophys. Res., 104, 8263–8280, https://doi.org/10.1029/1998JD100093, 1999. a
Hoskins, B. J., McIntyre, M. E., and Robertson, A. W.: On the use and significance of isentropic potential vorticity maps, Q. J. Roy. Meteorol. Soc., 111, 877–946, https://doi.org/10.1002/qj.49711147002, 1985. a
Huang, G., Liu, X., Chance, K., Yang, K., Bhartia, P. K., Cai, Z., Allaart, M., Ancellet, G., Calpini, B., Coetzee, G. J. R., Cuevas-Agulló, E., Cupeiro, M., De Backer, H., Dubey, M. K., Fuelberg, H. E., Fujiwara, M., Godin-Beekmann, S., Hall, T. J., Johnson, B., Joseph, E., Kivi, R., Kois, B., Komala, N., König-Langlo, G., Laneve, G., Leblanc, T., Marchand, M., Minschwaner, K. R., Morris, G., Newchurch, M. J., Ogino, S.-Y., Ohkawara, N., Piters, A. J. M., Posny, F., Querel, R., Scheele, R., Schmidlin, F. J., Schnell, R. C., Schrems, O., Selkirk, H., Shiotani, M., Skrivánková, P., Stübi, R., Taha, G., Tarasick, D. W., Thompson, A. M., Thouret, V., Tully, M. B., Van Malderen, R., Vömel, H., von der Gathen, P., Witte, J. C., and Yela, M.: Validation of 10-year SAO OMI Ozone Profile (PROFOZ) product using ozonesonde observations, Atmos. Meas. Tech., 10, 2455–2475, https://doi.org/10.5194/amt-10-2455-2017, 2017. a
Hubert, D., Heue, K.-P., Lambert, J.-C., Verhoelst, T., Allaart, M., Compernolle, S., Cullis, P. D., Dehn, A., Félix, C., Johnson, B. J., Keppens, A., Kollonige, D. E., Lerot, C., Loyola, D., Maata, M., Mitro, S., Mohamad, M., Piters, A., Romahn, F., Selkirk, H. B., da Silva, F. R., Stauffer, R. M., Thompson, A. M., Veefkind, J. P., Vömel, H., Witte, J. C., and Zehner, C.: TROPOMI tropospheric ozone column data: geophysical assessment and comparison to ozonesondes, GOME-2B and OMI, Atmos. Meas. Tech., 14, 7405–7433, https://doi.org/10.5194/amt-14-7405-2021, 2021. a
IPCC (Ed.): Climate Change 2021: The Physical Science Basis: Contribution of Working Group I to the IPCC Sixth Assessment Report|Sixth Assessment Report of the Intergovernmental Panel on Climate Change, Cambridge University Press, in press, https://www.ipcc.ch/report/ar6/wg1/downloads/report/IPCC_AR6_WGI_Full_Report.pdf (last access: 2 May 2022), 2021. a
Johnson, B. J.: Electrochemical concentration cell (ECC) ozonesonde pump efficiency measurements and tests on the sensitivity to ozone of buffered and unbuffered ECC sensor cathode solutions, J. Geophys. Res., 107, 4393, https://doi.org/10.1029/2001JD000557, 2002. a
Kuang, S., Newchurch, M. J., Burris, J., and Liu, X.: Ground-based lidar for atmospheric boundary layer ozone measurements, Appl. Opt., 52, 3557–3566, https://doi.org/10.1364/AO.52.003557, 2013. a
Lamsal, L. N., Weber, M., Tellmann, S., and Burrows, J. P.: Ozone column classified climatology of ozone and temperature profiles based on ozonesonde and satellite data, J. Geophys. Res.-Atmos., 109, D20304, https://doi.org/10.1029/2004JD004680, 2004. a, b
Landgraf, J. and Hasekamp, O. P.: Retrieval of tropospheric ozone: The synergistic use of thermal infrared emission and ultraviolet reflectivity measurements from space, J. Geophys. Res., 112, D08310, https://doi.org/10.1029/2006JD008097, 2007. a
Leblanc, T., Sica, R. J., van Gijsel, J. A. E., Godin-Beekmann, S., Haefele, A., Trickl, T., Payen, G., and Liberti, G.: Proposed standardized definitions for vertical resolution and uncertainty in the NDACC lidar ozone and temperature algorithms – Part 2: Ozone DIAL uncertainty budget, Atmos. Meas. Tech., 9, 4051–4078, https://doi.org/10.5194/amt-9-4051-2016, 2016. a
Lefohn, A. S., Malley, C. S., Smith, L., Wells, B., Hazucha, M., Simon, H., Naik, V., Mills, G., Schultz, M. G., Paoletti, E., de Marco, A., Xu, X., Zhang, L., Wang, T., Neufeld, H. S., Musselman, R. C., Tarasick, D., Brauer, M., Feng, Z., Tang, H., Kobayashi, K., Sicard, P., Solberg, S., and Gerosa, G.: Tropospheric ozone assessment report: Global ozone metrics for climate change, human health, and crop/ecosystem research, Elementa (Washington, D.C.), 1, 1, https://doi.org/10.1525/elementa.279, 2018. a
Liu, X., Chance, K., Sioris, C. E., Spurr, R. J. D., Kurosu, T. P., Martin, R. V., and Newchurch, M. J.: Ozone profile and tropospheric ozone retrievals from the Global Ozone Monitoring Experiment: Algorithm description and validation, J. Geophys. Res., 110, D20307, https://doi.org/10.1029/2005JD006240, 2005. a
Liu, X., Bhartia, P. K., Chance, K., Froidevaux, L., Spurr, R. J. D., and Kurosu, T. P.: Validation of Ozone Monitoring Instrument (OMI) ozone profiles and stratospheric ozone columns with Microwave Limb Sounder (MLS) measurements, Atmos. Chem. Phys., 10, 2539–2549, https://doi.org/10.5194/acp-10-2539-2010, 2010a. a
Liu, X., Bhartia, P. K., Chance, K., Spurr, R. J. D., and Kurosu, T. P.: Ozone profile retrievals from the Ozone Monitoring Instrument, Atmos. Chem. Phys., 10, 2521–2537, https://doi.org/10.5194/acp-10-2521-2010, 2010b. a
Livesey, N. J., Filipiak, M. J., Froidevaux, L., Read, W. G., Lambert, A., Santee, M. L., Jiang, J. H., Pumphrey, H. C., Waters, J. W., Cofield, R. E., Cuddy, D. T., Daffer, W. H., Drouin, B. J., Fuller, R. A., Jarnot, R. F., Jiang, Y. B., Knosp, B. W., Li, Q. B., Perun, V. S., Schwartz, M. J., Snyder, W. V., Stek, P. C., Thurstans, R. P., Wagner, P. A., Avery, M., Browell, E. V., Cammas, J.-P., Christensen, L. E., Diskin, G. S., Gao, R.-S., Jost, H.-J., Loewenstein, M., Lopez, J. D., Nedelec, P., Osterman, G. B., Sachse, G. W., and Webster, C. R.: Validation of Aura Microwave Limb Sounder O3 and CO observations in the upper troposphere and lower stratosphere, J. Geophys. Res., 113, D15S02, https://doi.org/10.1029/2007JD008805, 2008. a
Livesey, N. J., Read, W. G., Wagner, P. A., Froidevaux, L., Lambert, A., Manney, G. L., Valle, L., Pumphrey, H. C., Santee, M. L., Schwartz, M. J., Fuller, R. A., Jarnot, R. F., Knosp, B. W., and Lay, R. R.: Aura Microwave Limb Sounder (MLS): Version 5.0x Level 2 and 3 data quality and description document, Jet Propulsion Laboratory, https://mls.jpl.nasa.gov/data/v5-0_data_quality_document.pdf (last access: 2 May 2022), JPL D-105336 Rev. B, 2020. a, b
Ludewig, A., Kleipool, Q., Bartstra, R., Landzaat, R., Leloux, J., Loots, E., Meijering, P., van der Plas, E., Rozemeijer, N., Vonk, F., and Veefkind, P.: In-flight calibration results of the TROPOMI payload on board the Sentinel-5 Precursor satellite, Atmos. Meas. Tech., 13, 3561–3580, https://doi.org/10.5194/amt-13-3561-2020, 2020. a
Mettig, N., Weber, M., Rozanov, A., Arosio, C., Burrows, J. P., Veefkind, P., Thompson, A. M., Querel, R., Leblanc, T., Godin-Beekmann, S., Kivi, R., and Tully, M. B.: Ozone profile retrieval from nadir TROPOMI measurements in the UV range, Atmos. Meas. Tech., 14, 6057–6082, https://doi.org/10.5194/amt-14-6057-2021, 2021. a, b, c, d, e, f, g, h, i, j, k, l
Miles, G. M., Siddans, R., Kerridge, B. J., Latter, B. G., and Richards, N. A. D.: Tropospheric ozone and ozone profiles retrieved from GOME-2 and their validation, Atmos. Meas. Tech., 8, 385–398, https://doi.org/10.5194/amt-8-385-2015, 2015. a
Nair, P. J., Godin-Beekmann, S., Froidevaux, L., Flynn, L. E., Zawodny, J. M., Russell III, J. M., Pazmiño, A., Ancellet, G., Steinbrecht, W., Claude, H., Leblanc, T., McDermid, S., van Gijsel, J. A. E., Johnson, B., Thomas, A., Hubert, D., Lambert, J.-C., Nakane, H., and Swart, D. P. J.: Relative drifts and stability of satellite and ground-based stratospheric ozone profiles at NDACC lidar stations, Atmos. Meas. Tech., 5, 1301–1318, https://doi.org/10.5194/amt-5-1301-2012, 2012. a
Nalli, N. R., Gambacorta, A., Liu, Q., Tan, C., Iturbide-Sanchez, F., Barnet, C. D., Joseph, E., Morris, V. R., Oyola, M., and Smith, J. W.: Validation of Atmospheric Profile Retrievals from the SNPP NOAA-Unique Combined Atmospheric Processing System. Part 2: Ozone, IEEE Trans. Geosci. Remote Sens., 56, 598–607, https://doi.org/10.1109/TGRS.2017.2762600, 2018. a
Nassar, R., Logan, J. A., Worden, H. M., Megretskaia, I. A., Bowman, K. W., Osterman, G. B., Thompson, A. M., Tarasick, D. W., Austin, S., Claude, H., Dubey, M. K., Hocking, W. K., Johnson, B. J., Joseph, E., Merrill, J., Morris, G. A., Newchurch, M., Oltmans, S. J., Posny, F., Schmidlin, F. J., Vömel, H., Whiteman, D. N., and Witte, J. C.: Validation of Tropospheric Emission Spectrometer (TES) nadir ozone profiles using ozonesonde measurements, J. Geophys. Res., 113, D15S17, https://doi.org/10.1029/2007JD008819, 2008. a, b
Newchurch, M. J., Kuang, S., Leblanc, T., Alvarez, R. J., Langford, A. O., Senff, C. J., Burris, J. F., McGee, T. J., Sullivan, J. T., DeYoung, R. J., Al-Saadi, J., Johnson, M., and Pszenny, A.: TOLNET – A Tropospheric Ozone Lidar Profiling Network for Satellite Continuity and Process Studies, EPJ Web of Conferences, 119, 20001, https://doi.org/10.1051/epjconf/201611920001, 2016. a
Purser, R. J. and Huang, H.-L.: Estimating Effective Data Density in a Satellite Retrieval or an Objective Analysis, J. Appl. Meteorol., 32, 1092–1107, https://doi.org/10.1175/1520-0450(1993)032<1092:EEDDIA>2.0.CO;2, 1993. a
Rodgers, C. D.: Inverse methods for atmospheric sounding: Theory and practice, vol. 2 of Series on atmospheric oceanic and planetary physics, World Scientific, Singapore, https://doi.org/10.1142/3171, 2002. a, b
Schwartz, M., Froidevaux, L., Livesey, N., and Read, W.: MLS/Aura Level 2 Ozone (O3) Mixing Ratio V005, Greenbelt, MD, USA, Goddard Earth Sciences Data and Information Services Center (GES DISC), Earth Data [data set], https://doi.org/10.5067/Aura/MLS/DATA2516, 2020. a
Serdyuchenko, A., Gorshelev, V., Weber, M., Chehade, W., and Burrows, J. P.: High spectral resolution ozone absorption cross-sections – Part 2: Temperature dependence, Atmos. Meas. Tech., 7, 625–636, https://doi.org/10.5194/amt-7-625-2014, 2014. a, b
Singer, S. F. and Wentworth, R. C.: A method for the determination of the vertical ozone distribution from a satellite, J. Geophys. Res., 62, 299–308, https://doi.org/10.1029/JZ062i002p00299, 1957. a
Sinnhuber, B.-M.: Total ozone during the unusual Antarctic winter of 2002, Geophys. Res. Lett., 30, 1580, https://doi.org/10.1029/2002GL016798, 2003. a
Smit, H. G. J., Straeter, W., Johnson, B. J., Oltmans, S. J., Davies, J., Tarasick, D. W., Hoegger, B., Stubi, R., Schmidlin, F. J., Northam, T., Thompson, A. M., Witte, J. C., Boyd, I., and Posny, F.: Assessment of the performance of ECC-ozonesondes under quasi-flight conditions in the environmental simulation chamber: Insights from the Juelich Ozone Sonde Intercomparison Experiment (JOSIE), J. Geophys. Res., 112, D19306, https://doi.org/10.1029/2006JD007308, 2007. a
Smith, N. and Barnet, C. D.: Uncertainty Characterization and Propagation in the Community Long-Term Infrared Microwave Combined Atmospheric Product System (CLIMCAPS), Remote Sens., 11, 1227, https://doi.org/10.3390/rs11101227, 2019. a
Smith, N. and Barnet, C. D.: CLIMCAPS observing capability for temperature, moisture, and trace gases from AIRS/AMSU and CrIS/ATMS, Atmos. Meas. Tech., 13, 4437–4459, https://doi.org/10.5194/amt-13-4437-2020, 2020. a
Sterling, C. W., Johnson, B. J., Oltmans, S. J., Smit, H. G. J., Jordan, A. F., Cullis, P. D., Hall, E. G., Thompson, A. M., and Witte, J. C.: Homogenizing and estimating the uncertainty in NOAA's long-term vertical ozone profile records measured with the electrochemical concentration cell ozonesonde, Atmos. Meas. Tech., 11, 3661–3687, https://doi.org/10.5194/amt-11-3661-2018, 2018. a, b
Strow, L. L., Motteler, H., Tobin, D., Revercomb, H., Hannon, S., Buijs, H., Predina, J., Suwinski, L., and Glumb, R.: Spectral calibration and validation of the Cross-track Infrared Sounder on the Suomi NPP satellite, J. Geophys. Res.-Atmos., 118, 12,486–12,496, https://doi.org/10.1002/2013JD020480, 2013. a
Thompson, A. M., Witte, J. C., Sterling, C., Jordan, A., Johnson, B. J., Oltmans, S. J., Fujiwara, M., Vömel, H., Allaart, M., Piters, A., Coetzee, G. J. R., Posny, F., Corrales, E., Diaz, J. A., Félix, C., Komala, N., Lai, N., Ahn Nguyen, H. T., Maata, M., Mani, F., Zainal, Z., Ogino, S.-y., Paredes, F., Penha, T. L. B., Silva, F. R., Sallons-Mitro, S., Selkirk, H. B., Schmidlin, F. J., Stübi, R., and Thiongo, K.: First Reprocessing of Southern Hemisphere Additional Ozonesondes (SHADOZ) Ozone Profiles (1998–2016): 2. Comparisons With Satellites and Ground–Based Instruments, J. Geophys. Res.-Atmos., 122, 13000–13025, https://doi.org/10.1002/2017JD027406, 2017. a, b
Tikhonov, A. N.: Solution of incorrectly formulated problems and the regularization method, Soviet Math. Dokl., 4, 1035–1038, 1963. a
Tobin, D., Revercomb, H., Knuteson, R., Taylor, J., Best, F., Borg, L., DeSlover, D., Martin, G., Buijs, H., Esplin, M., Glumb, R., Han, Y., Mooney, D., Predina, J., Strow, L., Suwinski, L., and Wang, L.: Suomi-NPP CrIS radiometric calibration uncertainty, J. Geophys. Res.-Atmos., 118, 10,589–10,600, https://doi.org/10.1002/jgrd.50809, 2013. a
van Peet, J. C. A., van der A, R. J., Tuinder, O. N. E., Wolfram, E., Salvador, J., Levelt, P. F., and Kelder, H. M.: Ozone ProfilE Retrieval Algorithm (OPERA) for nadir-looking satellite instruments in the UV–VIS, Atmos. Meas. Tech., 7, 859–876, https://doi.org/10.5194/amt-7-859-2014, 2014. a
Veefkind, J. P., Aben, I., McMullan, K., Förster, H., de Vries, J., Otter, G., Claas, J., Eskes, H. J., de Haan, J. F., Kleipool, Q., van Weele, M., Hasekamp, O., Hoogeveen, R., Landgraf, J., Snel, R., Tol, P., Ingmann, P., Voors, R., Kruizinga, B., Vink, R., Visser, H., and Levelt, P. F.: TROPOMI on the ESA Sentinel-5 Precursor: A GMES mission for global observations of the atmospheric composition for climate, air quality and ozone layer applications, Remote Sens. Environ., 120, 70–83, https://doi.org/10.1016/j.rse.2011.09.027, 2012. a
Verstraeten, W. W., Boersma, K. F., Zörner, J., Allaart, M. A. F., Bowman, K. W., and Worden, J. R.: Validation of six years of TES tropospheric ozone retrievals with ozonesonde measurements: implications for spatial patterns and temporal stability in the bias, Atmos. Meas. Tech., 6, 1413–1423, https://doi.org/10.5194/amt-6-1413-2013, 2013. a, b, c, d
Wargan, K., Labow, G., Frith, S., Pawson, S., Livesey, N., and Partyka, G.: Evaluation of the Ozone Fields in NASA's MERRA-2 Reanalysis, J. Climate, 30, 2961–2988, https://doi.org/10.1175/JCLI-D-16-0699.1, 2017. a, b
Weber, M., Coldewey-Egbers, M., Fioletov, V. E., Frith, S. M., Wild, J. D., Burrows, J. P., Long, C. S., and Loyola, D.: Total ozone trends from 1979 to 2016 derived from five merged observational datasets – the emergence into ozone recovery, Atmos. Chem. Phys., 18, 2097–2117, https://doi.org/10.5194/acp-18-2097-2018, 2018. a, b, c
Witte, J. C., Thompson, A. M., Smit, H. G. J., Fujiwara, M., Posny, F., Coetzee, G. J. R., Northam, E. T., Johnson, B. J., Sterling, C. W., Mohamad, M., Ogino, S.-Y., Jordan, A., and da Silva, F. R.: First reprocessing of Southern Hemisphere ADditional OZonesondes (SHADOZ) profile records (1998-2015): 1. Methodology and evaluation, J. Geophys. Res.-Atmos., 122, 6611–6636, https://doi.org/10.1002/2016JD026403, 2017. a, b
Witte, J. C., Thompson, A. M., Smit, H. G. J., Vömel, H., Posny, F., and Stübi, R.: First Reprocessing of Southern Hemisphere ADditional OZonesondes Profile Records: 3. Uncertainty in Ozone Profile and Total Column, J. Geophys. Res.-Atmos., 123, 3243–3268, https://doi.org/10.1002/2017JD027791, 2018. a, b, c, d
Worden, H. M., Logan, J. A., Worden, J. R., Beer, R., Bowman, K., Clough, S. A., Eldering, A., Fisher, B. M., Gunson, M. R., Herman, R. L., Kulawik, S. S., Lampel, M. C., Luo, M., Megretskaia, I. A., Osterman, G. B., and Shephard, M. W.: Comparisons of Tropospheric Emission Spectrometer (TES) ozone profiles to ozonesondes: Methods and initial results, J. Geophys. Res., 112, D03309, https://doi.org/10.1029/2006JD007258, 2007. a
Worden, J.: Predicted errors of tropospheric emission spectrometer nadir retrievals from spectral window selection, J. Geophys. Res., 109, D09308, https://doi.org/10.1029/2004JD004522, 2004. a
Worden, J., Liu, X., Bowman, K., Chance, K., Beer, R., Eldering, A., Gunson, M., and Worden, H.: Improved tropospheric ozone profile retrievals using OMI and TES radiances, Geophys. Res. Lett., 34, L01809, https://doi.org/10.1029/2006GL027806, 2007. a, b
World Meteorological Organization: Scientific assessment of ozone depletion: 2018, vol. no. 58 of Global Ozone Research and Monitoring Project–Report, World Meteorological Organization, Geneva, Switzerland, 2018. a
WOUDC Ozonesonde Monitoring Community: World Meteorological Organization-Global Atmosphere Watch Program, and World Ozone And Ultraviolet Radiation Data Centre: Ozonesonde, Canada [data set], https://doi.org/10.14287/10000008, 2022. a, b
Zbinden, R. M., Cammas, J.-P., Thouret, V., Nédélec, P., Karcher, F., and Simon, P.: Mid-latitude tropospheric ozone columns from the MOZAIC program: climatology and interannual variability, Atmos. Chem. Phys., 6, 1053–1073, https://doi.org/10.5194/acp-6-1053-2006, 2006. a
- Abstract
- Introduction
- Data
- Retrieval method
- Retrieval characterisation and comparison: UV, IR, and UV + IR retrievals
- Validation
- Conclusions
- Data availability
- Author contributions
- Competing interests
- Disclaimer
- Special issue statement
- Acknowledgements
- Financial support
- Review statement
- References
- Supplement