the Creative Commons Attribution 4.0 License.
the Creative Commons Attribution 4.0 License.
 | 17 May 2022
Contrasting mineral dust abundances from X-ray diffraction and reflectance spectroscopy
Mohammad R. Sadrian
Wendy M. Calvin
John McCormack
Mineral dust particles dominate aerosol mass in the atmosphere and directly modify Earth's radiative balance through absorption and scattering. This radiative forcing varies strongly with mineral composition, yet there is still limited knowledge on the mineralogy of atmospheric dust. In this study, we performed X-ray diffraction (XRD) and reflectance spectroscopy measurements on 37 different dust deposition samples collected as airfall in an urban setting to determine mineralogy and the relative proportions of minerals in the dust mixture. Most commonly, XRD has been used to characterize dust mineralogy; however, without prior special sample preparation, this technique is less effective for identifying poorly crystalline or amorphous phases. In addition to XRD measurements, we performed visible and short-wave infrared (VSWIR) reflectance spectroscopy for these natural dust samples as a complementary technique to determine mineralogy and mineral abundances. Reflectance spectra of dust particles are a function of a nonlinear combination of mineral abundances in the mixture. Therefore, we used a Hapke radiative transfer model along with a linear spectral mixing approach to derive relative mineral abundances from reflectance spectroscopy. We compared spectrally derived abundances with those determined semi-quantitatively from XRD. Our results demonstrate that total clay mineral abundances from XRD are correlated with those from reflectance spectroscopy and follow similar trends; however, XRD underpredicts the total amount of clay for many of the samples. On the other hand, calcite abundances are significantly underpredicted by SWIR compared to XRD. This is caused by the weakening of absorption features associated with the fine particle size of the samples, as well as the presence of dark non-mineral materials (e.g., asphalt) in these samples. Another possible explanation for abundance discrepancies between XRD and SWIR is related to the differing sensitivity of the two techniques (crystal structure vs. chemical bonds). Our results indicate that it is beneficial to use both XRD and reflectance spectroscopy to characterize airfall dust because the former technique is good at identifying and quantifying the SWIR-transparent minerals (e.g., quartz, albite, and microcline), while the latter technique is superior for determining abundances for clays and non-mineral components.
- Article
(7215 KB) - Full-text XML
- BibTeX
- EndNote


Mineral dust aerosols are lofted from the surface into the atmosphere, mainly in the arid regions of the world, either affecting the area nearby or traveling long distances causing global impacts (Goudie and Middleton, 2006). Suspended mineral particles affect air temperature by scattering and absorption of incoming sunlight and outgoing long-wave radiation (Miller and Tegen, 1998). Mineral dust–radiation interactions (e.g., absorption and scattering) directly modify Earth's radiative balance and energy budget, consequently contributing to climate change (Tegen and Lacis, 1996; Tegen et al., 1996). Past studies have discussed that dust particles' distinctive radiative forcing strongly depends on their particle size distribution (PSD) and mineral composition (Sokolik and Toon, 1999; Sokolik et al., 2001; Ginoux 2017). Atmospheric dust particles contain a diverse mix of minerals. Such dust is dominantly composed of quartz, carbonates, iron oxides, clays, sulfates, and feldspars (Engelbrecht et al., 2016, their Supplement Sects. S2.1 and S2.2). Therefore, the relative quantity of the various minerals defines the optical properties of these aerosols.
As a common approach, particulate matter deposited by airfall is collected at different geographic locations to determine mineralogical composition and abundance, as well as particle size distribution. Despite the fact that the physico-chemical properties of minerals have a substantial impact on dust-related radiative forcing, there is no ideal measurement technique for identifying these properties. To date, X-ray diffraction (XRD) has been frequently used in various research studies as a primary or complementary technique to measure the mineral content of dust particles (e.g., Caquineau et al., 1997; Kandler et al., 2009; Engelbrecht et al., 2009, 2016, 2017; Nowak et al., 2018). For example, Engelbrecht et al. (2017) performed XRD measurements on 27 dust samples collected from the Arabian Red Sea coast in order to obtain mineralogy and fractional abundances of minerals. In that study, they found that the dust samples were mainly dominated by quartz, feldspars, micas, clays, and halite and to a lesser extent by carbonates, iron oxides, and gypsum. While XRD is a powerful technique for characterizing crystalline phases, it is less effective at measuring poorly crystalline and amorphous phases (Moore and Reynolds, 1997).
In this research, we use visible and short-wave infrared (VSWIR) reflectance spectroscopy as a complementary method to obtain mineral identification and abundances. To date, very limited studies have used VSWIR to determine natural dust particle mineralogy (e.g., Reynolds et al., 2020); however, it can provide quantitative measurements and identify both amorphous and crystalline phases (Clark, 1999). This approach has been widely used to obtain mineral compositional information in laboratory and remote sensing applications with particular attention to mineral mixtures (e.g., Mustard and Pieters, 1987; Combe et al., 2008). Reflectance spectra of mixtures are modeled using radiative transfer (RT) theories, such as that developed by Hapke (1981), or linear spectral mixing (LSM) (e.g., Ramsey and Christensen, 1998). LSM is employed when a sample reflectance spectrum is simply a linear combination of the constituents' spectra, whereas RT is commonly utilized when materials are intimately mixed, and light is interacting with several minerals, resulting in a nonlinear relationship between abundance and spectral feature strength. Since planetary surfaces are mostly composed of intimately mixed minerals with nonlinear spectral interactions, RT has been found to be an effective way to derive mineral abundances from reflectance spectra measured from spacecraft and in the laboratory (e.g., Mustard and Pieters, 1987, 1989; Hiroi and Pieters, 1994; Lucey, 1998; Cheek and Pieters, 2014; Robertson et al., 2016; Lapotre et al., 2017). Additionally, many studies have employed RT to model reflectance spectra of synthetic or laboratory mineral mixtures, validating the derived abundances. For example, Robertson et al. (2016) demonstrated that physical mixtures of clay and sulfate at varying abundances were accurately determined (within 5 %) using a Hapke RT model.

Figure 1Map (© Google Earth) shows the distribution of samplers throughout Ilam. Annotations note sample numbers identified in Appendix A, Table A1. Latitudes and longitudes are the coordinates for the corners of the map.
Moreover, multiple past studies have shown that the mineral abundances (for rocks and rocking forming fine-grained mineral samples) derived from visible and infrared reflectance spectra are in good agreement with mineral abundances that are obtained using XRD (e.g., Pan et al., 2015; Thorpe et al., 2015; Leask and Ehlmann, 2016). For example, Leask and Ehlmann (2016) performed measurements on 15 rock samples (with various particle sizes) collected from Oman, and they found that VSWIR reflectance spectroscopy paired with linear spectral unmixing yields quantitative mineral abundance estimates that are consistent (within 10 %–15 %) with XRD abundance estimations.
Here, we used both XRD and reflectance spectroscopy as complementary techniques to investigate the variation of both mineral composition and abundance in natural samples of atmospheric dust deposited in the city of Ilam, Iran. We estimated mineral abundances of these homogenous samples using their reflectance spectra and a Hapke RT model combined with linear mixing, and we compared those results with semi-quantitative abundances determined by XRD. We examined the ability of widely used spectral mixing approaches to determine if they can be used accurately to quantify mineral abundances in dust samples collected in urban settings.
2.1 Sample collection
For this study, we conducted measurements on 37 samples of dust captured with marble dust collectors (MDCOs), located in Ilam, Iran. Based on an original design by Ganor (1975), we chose MDCOs due to the efficiency and popularity in desert research (e.g., Offer et al., 1992; Goossens and Offer, 1994; Goossens and Rajot, 2008). In general, the representation of dust in the sample depends on the selected sampling method, which may result in underestimation or overprediction of some important minerals (von Holdt et al., 2021). MDCOs (like many other dust catchers) are less efficient in dust collection in high-wind regimes (Goossens, 2005). However, they were proven to be efficient at collecting dry deposition and less sensitive to local weather conditions (Goossens and Offer, 1994; Sow et al., 2006; Goss et al., 2013). Sadrian et al. (2012) selected Ilam as their study area because it is located in western Iran and is affected by large dust sources in neighboring countries including Iraq, Kuwait, and Saudi Arabia (Shahsavani et al., 2012), and thus it is commonly impacted by severe dust storms. To collect deposition of airborne dust, 13 dust samplers were distributed and installed throughout the city area (Fig. 1). Deposited dust was collected in three intervals from September 2011 through June 2012 (Table A1). Specific 3-month periods were 23 September to 21 December 2011 (fall) and 22 December 2011 to 19 March 2012 (winter), and 20 March to 20 June 2012 (spring). As part of sample collection procedure, first, dust samples in MDCOs were dried at room temperature to preserve the mineralogical and physical properties of the surface soils from which they were transported. Then, the dry samples were collected from the samplers by thoroughly cleaning the dust depositions using a brush. All samples were transferred to separate plastic bottles for the further experiments. A total of 39 samples were collected in order to determine their mineralogy, heavy metal content, and deposition rate in different areas of Ilam (Sadrian et al., 2012). In the current research, we revisit the compositional information of these dust samples. The mass for the collected dust samples ranges from minimum ∼0.01 g to maximum ∼5 g. Since two samples did not contain enough dust for our analysis, as shown in Table A1, the measurements for this study were conducted on 37 samples. It should be noted that there was no special sample preparation that was performed for the purpose of dust measurements (with XRD and spectroscopy) described in the next sections. Prior to these measurements unwanted debris and detectable man-made and plant materials were removed from the samples, and we made sure to use a similar quantity of dust (∼1 g) for each of the experiments that were conducted with spectroscopy and for the measurements that were collected using XRD.
2.2 X-ray diffraction (XRD)
XRD is a technique used to obtain the unique crystal structure of a material. Diffracted beams are measured over a range of angles (2-theta) and peaks at specific angles are related to the crystal structure of the mineral (Klein, 2002). For the Ilam samples we used a Bruker D2 Phaser benchtop X-ray diffractometer. Qualitative phase identification was performed using XRD evaluation software (DIFFRAC.EVA), which helps to identify phases in a specimen by comparison with standard patterns existing in a library. Figure 2 displays standard reference minerals with unique diffraction patterns extracted from an accessible, established dataset (American Mineralogist Crystal Structure Database (AMCSD); Downs and Hall-Wallace, 2003) compared with unknown peaks in an Ilam sample (S11). As shown in Fig. 2, matches for quartz (Q), calcite (C), albite (Al), microcline (M), gypsum (G), kaolinite (K), and actinolite (Ac) (representative amphibole) were found in S11. The identification of the illite peak in Fig. 2 uses data from the published literature such as from Gualtieri (2000) and Drits et al. (2010). While this peak pattern was available for our analysis in the DIFFRAC.EVA software, we were not able to export the reference patterns in order to show them in Fig 2. We used the AMCSD database for other minerals shown in Fig. 2, but this database does not include a pattern for illite. Montmorillonite was readily identified in most of the samples using spectroscopy (Fig. 3). However, in XRD plots it is difficult to discriminate without special sample preparation (e.g., clay separation). Because the volumes of dust samples were low, XRD sample preparation specifically for clay minerals was not conducted. Also, we could not follow sample preparation developed for low-mass atmospheric dust samples (Caquineau et al., 1997) due to a lack of access to specialized equipment. In order to account for montmorillonite, we included the standard reference pattern in all diffractograms and mineral abundance determinations. Semi-quantitative (S-Q) assessment of mineral abundances was obtained through integrated band area ratios and relative intensities of several lines after removing background and source peak noise. The result from S-Q analysis of all dust samples is discussed in Sect. 3.1. S-Q abundances made from the diffraction measurements are derived from the relative proportion of minerals in the sample (weight percentage %) and should add up to 100 %. Given that the XRD is less effective at detecting and quantifying poorly crystalline minerals and amorphous phases (Moore and Reynolds, 1997), the obtained abundance results for other existing crystalline minerals can be overestimated. Past studies reported a detection limit which is generally <2 % for crystalline minerals and an uncertainty of approximately ±10 % related to mineral quantification. (e.g., Bish and Chipera, 1991).
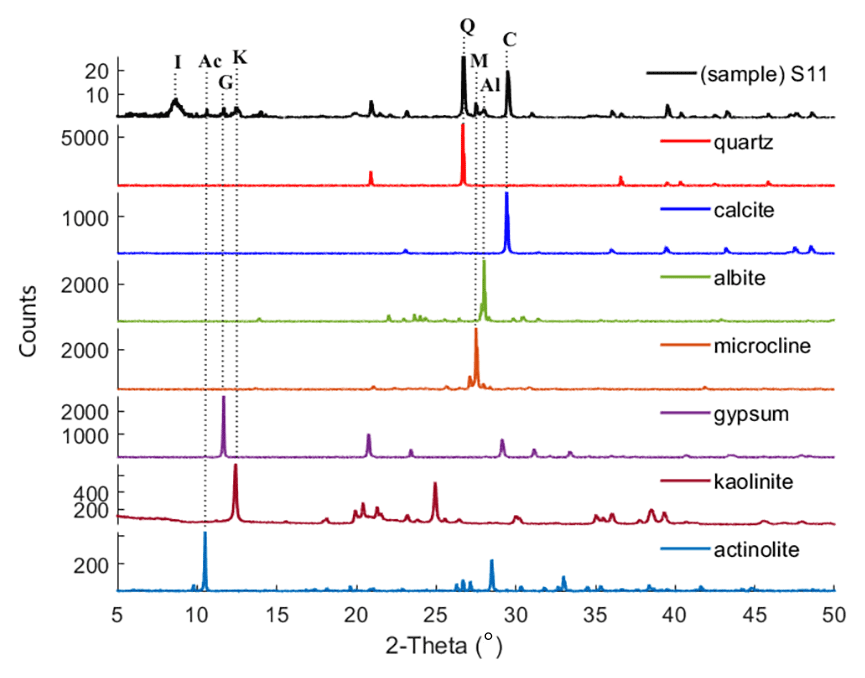
Figure 2XRD pattern of sample S11 is compared with those of standard reference minerals from AMCSD. Dotted lines connect the diagnostic XRD peak in quartz (Q), calcite (C), albite (Al), microcline (M), gypsum (G), kaolinite (K), and actinolite (Ac) to the corresponding XRD patterns in S11, confirming the presence of these minerals in this particular dust sample. Illite (I) was identified as described in the text.
2.3 VSWIR reflectance spectroscopy
Minerals have distinctive spectral characteristics, and band center, strength, shape, and width are utilized to confidently identify species (Gaffey et al. 1993; Clark, 1999). In the VSWIR (350 to 2500 nm) diagnostic absorption bands arise from transition electrons (generally caused by iron oxides) in various crystallographic sites and from the overtones and combinations of the fundamental vibrations of species such as hydroxyl, water, and carbonate (Hunt, 1977; Clark et al., 1990). VSWIR reflectance measurements of dust samples were carried out using a fine-resolution and high-sensitivity spectral evolution (SE), model RS-5400 portable spectroradiometer. To collect sample spectra, dust samples were placed in a holder, and a contact probe with a halogen light source was used to capture VSWIR data. As part of routine calibration, the contact probe measures a white Spectralon plate. All sample measurements are automatically ratioed to the Spectralon calibration target. We subsequently multiplied measured spectra by the absolution reflectance of Spectralon, resulting in a measurement that is in reflectance (Kokaly et al., 2017). Sample spectra were measured with a 0∘ incidence angle and a 38∘ emergence angle, yielding a 38∘ phase angle. Because sample volumes were small (lowest mass ∼0.01 g) and to minimize the effect of the aluminum holder reflectance, we measured the sample on a holder covered with black tape. Measurements of the tape alone confirmed there were no features introduced by this method.
Mineralogy for the reflectance spectra of the Ilam dust samples was determined by comparing the samples with the well-characterized USGS library (Kokaly et al., 2017). Mineral constituents were identified with an iterative procedure and inspection in which phases were identified on the basis of H2O, OH, and Al–OH absorption features for phyllosilicates, the H2O band in sulfates, and CO3 in carbonates (Hunt, 1977; Gaffey, 1986; Clark et al., 1990). Figure 3 shows representative spectra from three Ilam samples (S25, S26, S30) having varying mineralogy. These samples (S25, S26, S30) represent a range of mineral compositions including calcite, montmorillonite, illite, and gypsum. In this spectral range (1350–2500 nm), common silicates such as microcline, quartz, and albite have no absorption features (dotted flat lines in Fig. 3) and are thus known as transparent minerals in the VSWIR spectral range (Clark, 1999). Iron oxides have strong diagnostic spectral signatures in the visible and near infrared (up to around 1000 nm); however, we did not see absorption features attributed to them in these samples. Therefore, we truncated all spectral plots at 1350 nm in order to focus on the spectral range above 1350 nm with the strongest features (SWIR range). Hence, the exclusion of the spectral range from 350 to 1350 nm will not miss any major mineral components.
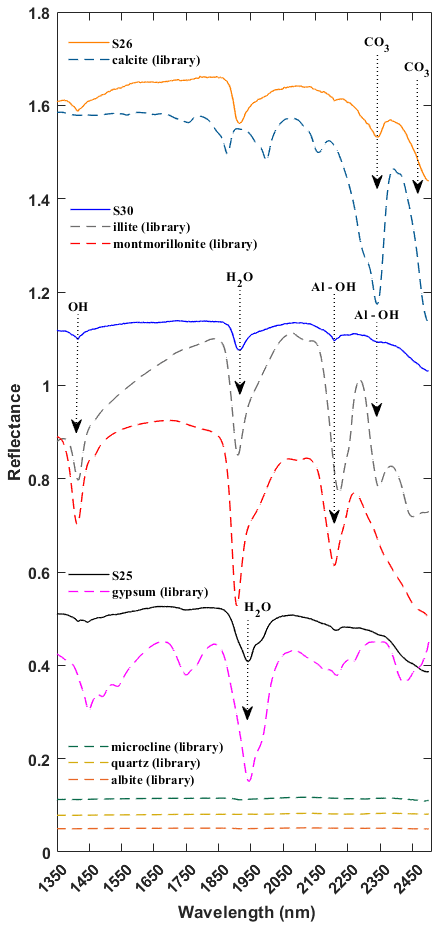
Figure 3SWIR spectra for three representative samples (S25, S26, S30) and library spectra of pure minerals showing diagnostic features for calcite, montmorillonite, illite, and gypsum. All spectra are offset for clarity. Arrows near 1400, 1900, 2200, and 2345 nm call out features arising from OH, water, and Al–OH in mineral structures, common to many clay minerals such as montmorillonite and illite. Arrows targeting 2340 and 2480 nm show the wavelengths of dominant absorption features in calcite. The arrow at 1945 nm represents the unique spectral signature attributed to water in sulfates such as gypsum.
2.4 Optical microscopy (OM)
An Olympus petrographic optical microscope was used to assess mineralogical composition and relative abundance of minerals in the samples. Mineral grains were mounted on a glass slide immersed with Cargille 1.544 refractive index oil. Particles were identified based on their diagnostic properties such as color, cleavage, refractive index, and texture. We were able to detect some coarser particles such as quartz, carbonates, and amphibole (Fig. 4a and b); however, fine-grain clay minerals were not identifiable due to the petrographic microscopy limitation for grain sizes less than 10 µm. The presence of man-made materials (which could be related to asphalt and tar) was revealed by visual inspection of OM images. Figure 4a and b illustrate the relative abundances of these dark materials in samples compared to mineral particles. Additionally, there are numerous angular particles, particularly in Fig. 4b, that have no cleavage, a refractive index significantly lower than 1.544, and no crystal structure and that seem to be amorphous and isotropic. Because these samples were collected in an urban setting, they contain a variety of different anthropogenic particles that are difficult to identify using OM.

Figure 4Panels (a) and (b) are OM images of representative samples S6 and S11, respectively, depicting the presence of quartz, calcite, amphiboles (red rectangles), and dark materials (yellow circles). Quantitative and visual assessments reveal that both images contain a high abundance of dark materials and other unknown particles that have no diagnostic mineral properties.
2.5 Particle size distribution (PSD)
PSD was determined for all Ilam samples using a Malvern Mastersizer 3000. This instrument is based on a compact optical system that uses laser diffraction to measure particle size distribution for both wet and dry dispersions (known as hydro and aero methods). We selected the wet dispersion method for PSD analysis because this technique will separate sand-sized micro-aggregates of particles into their smaller constituents for the final results (Hartshorn et al., 2021). This method also allows for full sample recovery. For subsequent analysis, the particle size fractions that make up the samples were categorized into three groups: clay (<2 µm), silt (2–63 µm), and sand (63–500 µm). The 37 dust samples were dominated by silt sizes but showed a variable size range distribution, as shown in Fig. 5. The mean for each size range is clay ∼7 %, silt ∼83 %, and sand ∼10 %.
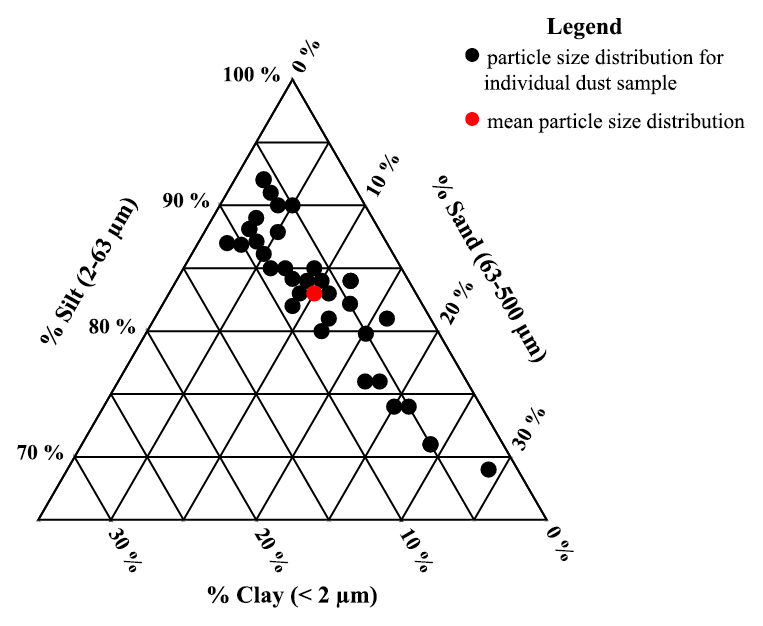
Figure 5Ternary diagram showing volume distributions for 37 dust samples analyzed with the Malvern Mastersizer 3000. Silt is the most prevalent size class in the samples with a minimum ∼69 % and maximum ∼93 %.
2.6 Mineral abundance estimation from reflectance spectra
In order to determine dust mineral abundances from reflectance spectra, we initially used linear spectral mixing (LSM) of the reflectance spectra. This approach assumes that the spectrum of the sample is a linear combination of the spectra of individual minerals (endmembers), and it has been extensively used to characterize materials on the surface of Earth (e.g., Metternicht and Fermont, 1998; Roberts et al., 1998; Dennison and Roberts, 2003) and Mars (e.g., Bell et al., 2002; Combe et al., 2008). Based on LSM, the reflectance spectra of a mixture can be expressed as (Keshava and Mustard, 2002)
where Y denotes the reflectance for the mixed spectrum, αi is the abundance of the ith endmember in the mixture spectra, λ is the wavelength, ε represents the residual error between sample and modeled spectra, and X(λ) is the matrix of input endmember reflectance spectra obtained from the USGS spectral library (Kokaly et al., 2017).
To solve Eq. (1) for α1, we employed a non-negative linear least squares (NNLS) algorithm which calculates a component's coefficient or abundance, which must be a positive number (Rogers and Aharonson, 2008). Our NNLS algorithm was designed using MATLAB R2019a and an available function called non-negative linear least squares (lsqnonneg). The inputs for the NNLS model are the dust reflectance and the matrix of endmember reflectance spectra from the USGS library, and outputs are the vectors of abundances and the root mean square error (RMSE) between the dust sample spectra and the model fit. In order to assess the quality and the accuracy of the modeled spectra, both the visual comparison of the calculated fit and the RMSE were evaluated. While application of this method resulted in a very low RMSE for the fit between the sample and modeled spectra, the modeled spectra did not match band centers and strengths for the absorption features and did not produce reasonable mineral abundances. As these samples are very fine-grained, with an intimate association with one another, multiple scattering effects are expected to be important, and thus reflectance spectra of the mixture are a nonlinear combination of constituents' abundances (Nash and Conel, 1974; Singer, 1981). In order to address this nonlinear mixing, we implemented a widely used radiative transfer model based on Hapke (1981) that has been shown to provide reliable mineral abundances from laboratory particulate mixtures (e.g., Mustard and Pieters, 1987, 1989; Hiroi and Pieters, 1994; Lucey, 1998; Robertson et al., 2016; Lapotre et al., 2017). In order to determine abundance, the dust sample and library mineral endmember reflectance spectra are converted to single scattering albedo (SSA) according to Eq. (2) (Hapke, 1981). SSA is the ratio of the scattering to the extinction of the medium. A combination of the SSA of mineral endmembers do mix linearly (Johnson et al., 1983) and thus are able to accurately reproduce the mixture reflectance spectra. Mixture reflectance spectra are related to the average SSA (w) through
where r is the reflectance, μo and μ are the cosines of the angles of incident and reflected light, w is the average single scattering albedo, H is the Chandrasekhar function for isotropic scatterers, B(g) is backscatter function, P(g) is the average single-particle phase function, and (g) is the phase angle. Following the reasoning of Mustard and Pieters (1989) that there is negligible backscattering at intermediate phase angles, we set backscatter function B(g) to zero. We assume these particles scatter isotropically, and we can set P(g)=1. Hapke's approximation of Chandrasekhar's H function is defined by Eq. (3),
where . We now invert Eq. (2) to calculate w based on the reflectance measurement, which yields the expression
where we use Eq. (3) to obtain H(μ) and H(μo). This equation includes w on both the left side and in the H functions. In order to solve this, w is subtracted from both sides of the equation, and we solve for the value of w that results in zero, using the MATLAB command “fzero”. This command is used to find the roots for nonlinear equations of a single variable. As r, μ (38∘), and μo (0∘) are known, the root is the value of w that makes the whole equation zero. Using this method, we derived SSA at each wavelength for both dust sample spectra and the mineral endmembers from the library. Because the average SSA (w) of a sample is a linear combination of individual mineral SSA, we employ a linear spectral mixing approach (Eq. 1), but Y is now w of the measured sample, and X is the SSA spectra of pure minerals from the USGS library. Using Eq. (5), we determine the fractional contribution of a given mineral.
where wmix is the average SSA, wi is the SSA for individual endmember i, and fi is the fractional geometric cross-section for component i. Based on Lapotre et al. (2017), fi can be expressed as
for an n component mixture. In Eq. (6), di, ρi, and mi are the grain size, density, and mass abundance of endmember i. Past studies reported the density of dust particles between 2 and 3 g cm−3 (e.g., Delany et al., 1967; Maring et al., 2000; Reid et al., 2003; Fratini et al., 2007), so we set the density as 2.5 g cm−3 for all dust samples. Based on information provided in the USGS library, we selected spectra measured at finer grain sizes when available. For some samples, the USGS library includes multiple samples for a given mineral type. Through trial and error, we selected individual samples that provided the best fits. These spectra are shown in Appendix B (Fig. B1). Most library minerals used were in the grain size range <150 µm. Our samples have a narrow size distribution (Fig. 5) so that our model assumes all components have the same grain size and does not allow this to vary as a free parameter.
To derive fractional abundances, the NNLS MATLAB solver is used to input a matrix of mineral endmember SSA and dust sample w. This algorithm attempts to find the mass abundances that reproduce the best model fit for a dust sample spectrum. Figure 6 displays the calculated linear least squares fit of the model to the measured spectra of three representative dust samples (S15, S33, S17). In addition to minerals, we found hydrocarbon (C–H) absorption features related to asphalt and tar in many of the samples in our preliminary analysis, and thus we included their spectra (Fig. 7a) in the input endmember bundles for modeling all 37 samples. Our analysis determined the RMSE between the sample and the modeled spectrum with variable small numbers between 0.022 and 0.16 (Appendix A, Table A1 and Appendix C, Fig. C1). Sample S15 (Fig. 6a) displays a relatively well-modeled fit based on our visual evaluation and a low RMSE (0.044). Many of the samples, such as S33 (Fig. 6b), used a substantial amount of asphalt or tar to reproduce a good fit in the wavelength region between 2300 and 2370 nm. Some parts of the fit for S15 and S33 have minor discrepancies (e.g., near 2255 nm for S15 and between 1550 and 1730 nm for S33), but absorption feature shapes and centers are accurately determined. We found many spectra (e.g., S17, Fig. 6c) are not modeled well due to the contribution and presence of other materials. We visually identified dry grass, plastic, and styrofoam in some samples. Figure 7b shows the spectra for dry grass and plastic extracted from the USGS library (Kokaly et al., 2017), as well as styrofoam that we characterized in the laboratory. These urban materials have strong absorptions with a wide range of spectral features (Kokaly et al., 2017). Not including them in the model likely prevents a good match to the measured spectra. Because the focus of this research was on the mineral constituents, we did not attempt to include other non-mineral components in order to obtain good fits for all samples. Asphalt and tar were included in all models because their absorption bands occur in many samples and provide a good match to the overall SSA.
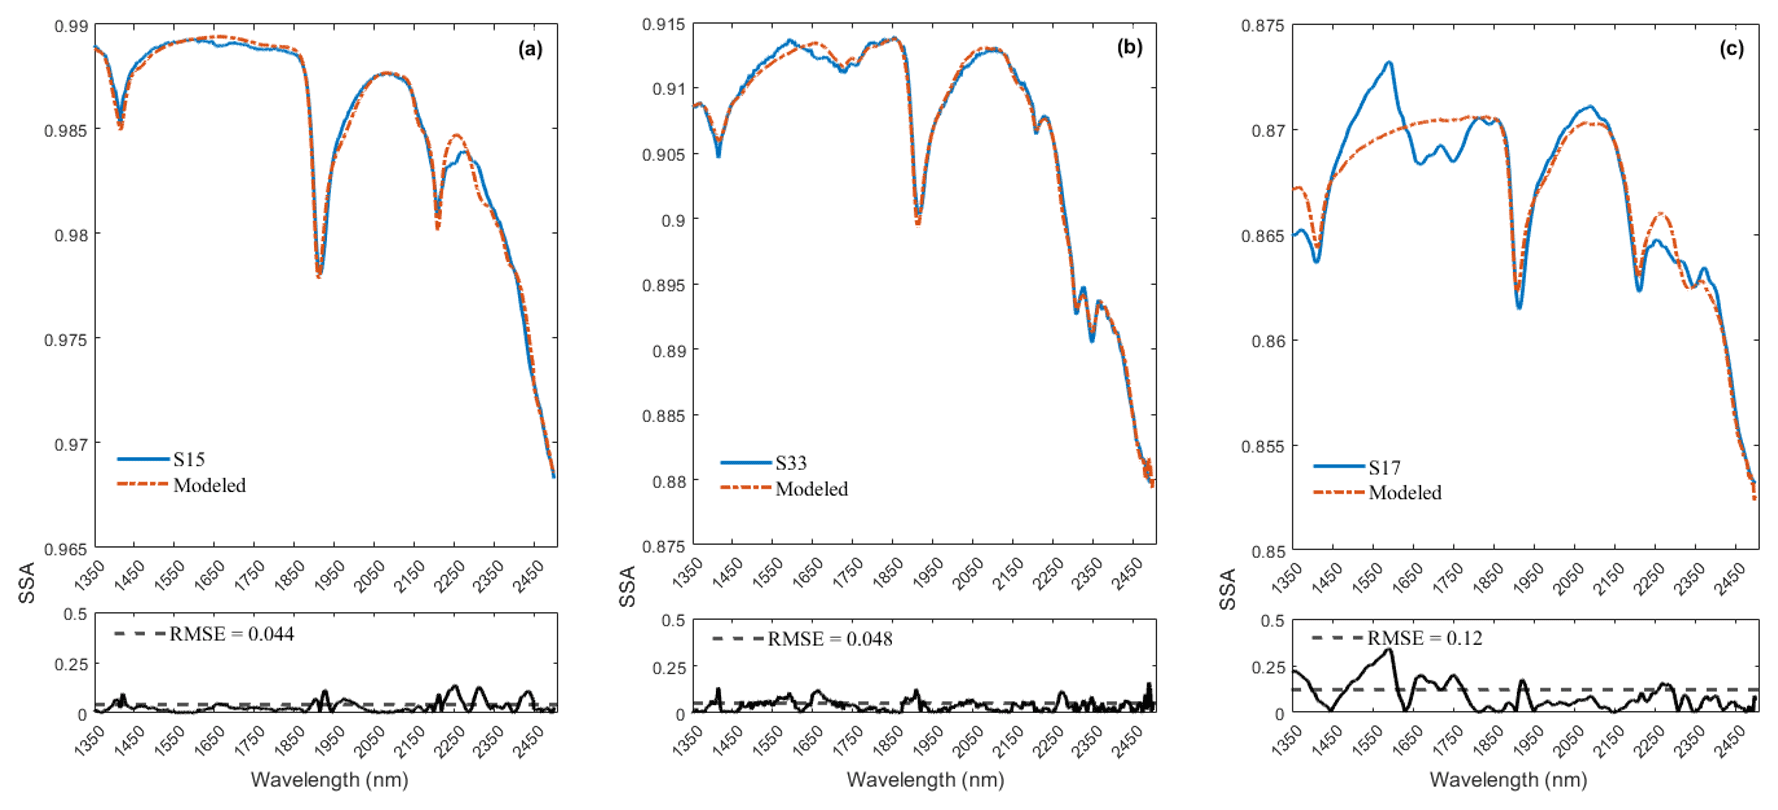
Figure 6Panels (a)–(c) display the model fit for the representative samples S15, S33, and S17. Measured spectra are shown with solid blue lines and modeled with dash-dot red lines. The smaller plots on the bottom show the root mean square error (RMSE) as a function of wavelength and the total RMSE. The fit uses SSA derived from library endmember reflectance spectra. Out of 37 modeled spectra, S15 (a) and S33 (b) represent relatively good fits and low RMSE; however, S17 (c) shows misfits and a relatively high RMSE. Materials contributing to the misfits are discussed in the text.

Figure 7Panels (a) and (b) show the spectra for non-mineral materials common in urban settings. The arrows in panel (a) point to a doublet arising from C–H bonds in asphalt and tar. Spectra in (b) are for other materials that were visually identified in the samples whose absorption features may lead to poorer model fits. All spectra for both figures are offset for clarity.
3.1 XRD (total mineral abundance)
S-Q analysis, as described in Sect. 2.2, resulted in mineral mass abundances shown in Fig. 8. The XRD bar chart (Fig. 8) indicates that individual mineral abundances vary from sample to sample, yet there is some regularity. Quartz and albite (plagioclase), followed by illite (clay), are the most common minerals in the samples. Kaolinite and montmorillonite (clays) are dominantly detected in minor and trace levels in the samples and thus make up a small fraction of the total abundances. Some minerals in the XRD bar chart are more variable both in their presence and abundance. Calcite (carbonate) shows the highest variation with a range between 0 % and 63 % of the total mineral abundance. Microcline (K-feldspar), actinolite (amphibole), and gypsum (sulfate) are among the least common minerals. XRD detected gypsum in only three samples collected close to construction sites. Since sulfate is a common mineral on many construction sites, its infrequent and rare presence may be derived from nearby building materials.
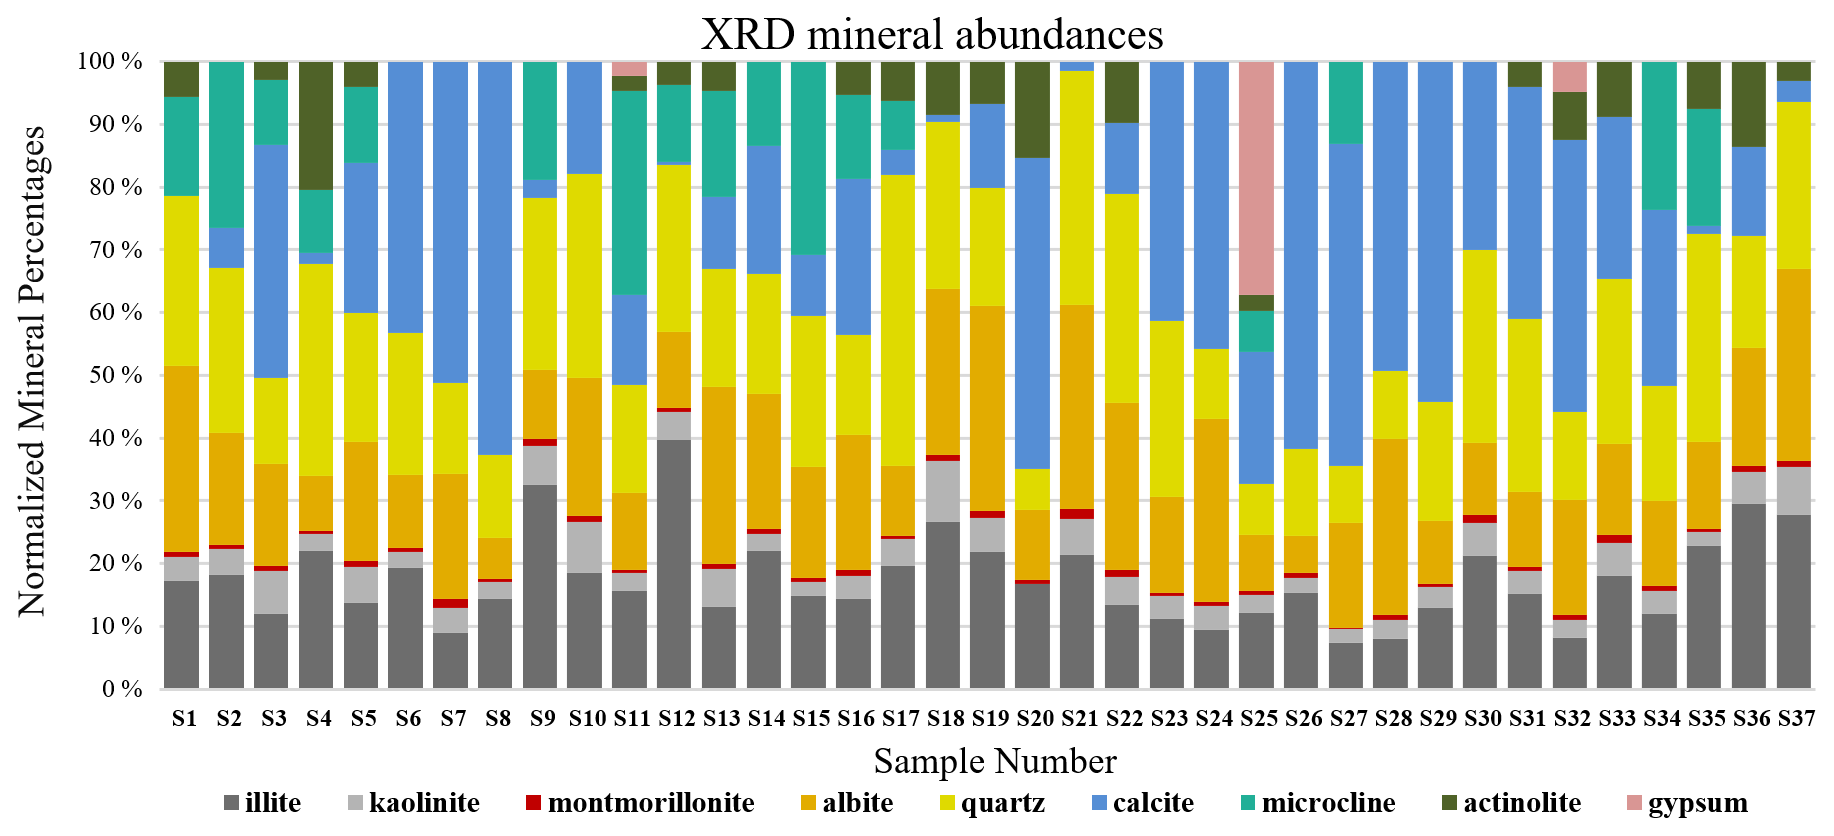
Figure 8Bar charts demonstrate the relative phase concentration (wt %) calculated from the total diffracted peak area of various minerals obtained by XRD analysis.
3.2 SWIR reflectance spectroscopy (total mineral abundance)
As discussed in Sect. 2.6, all spectra were modeled to derive mineral abundances. The goodness of the fit is highly dependent on the input endmembers. While additional endmembers can improve the quality of the model, incorporating extra endmembers just to improve the fit can lead to erroneous abundances. Therefore, we included only the phases that were identified with SWIR and XRD based on diagnostic features. Figure 9 demonstrates mineral abundance variations obtained from linear mixing of SSA. This figure depicts a high abundance of microcline, quartz, and albite in the samples, although these minerals are featureless in the SWIR range (Fig. 3). As also shown in Fig. 3, pure library minerals have much stronger absorption features (greater depth) than those observed in the Ilam samples. This is referred to as higher spectral contrast. Therefore, the model automatically uses microcline, quartz, and albite as neutral endmembers to create a model spectrum that fits weaker features. By incorporating featureless material, the overall spectral contrast is reduced at all wavelengths (Hamilton et al., 1997, 2000). This results in relatively low abundances of other minerals (Fig. 9). In order to better compare to XRD, we removed microcline and other spectrally neutral minerals (quartz and albite) and then re-normalized the abundances for both XRD and SWIR (Fig. 10).
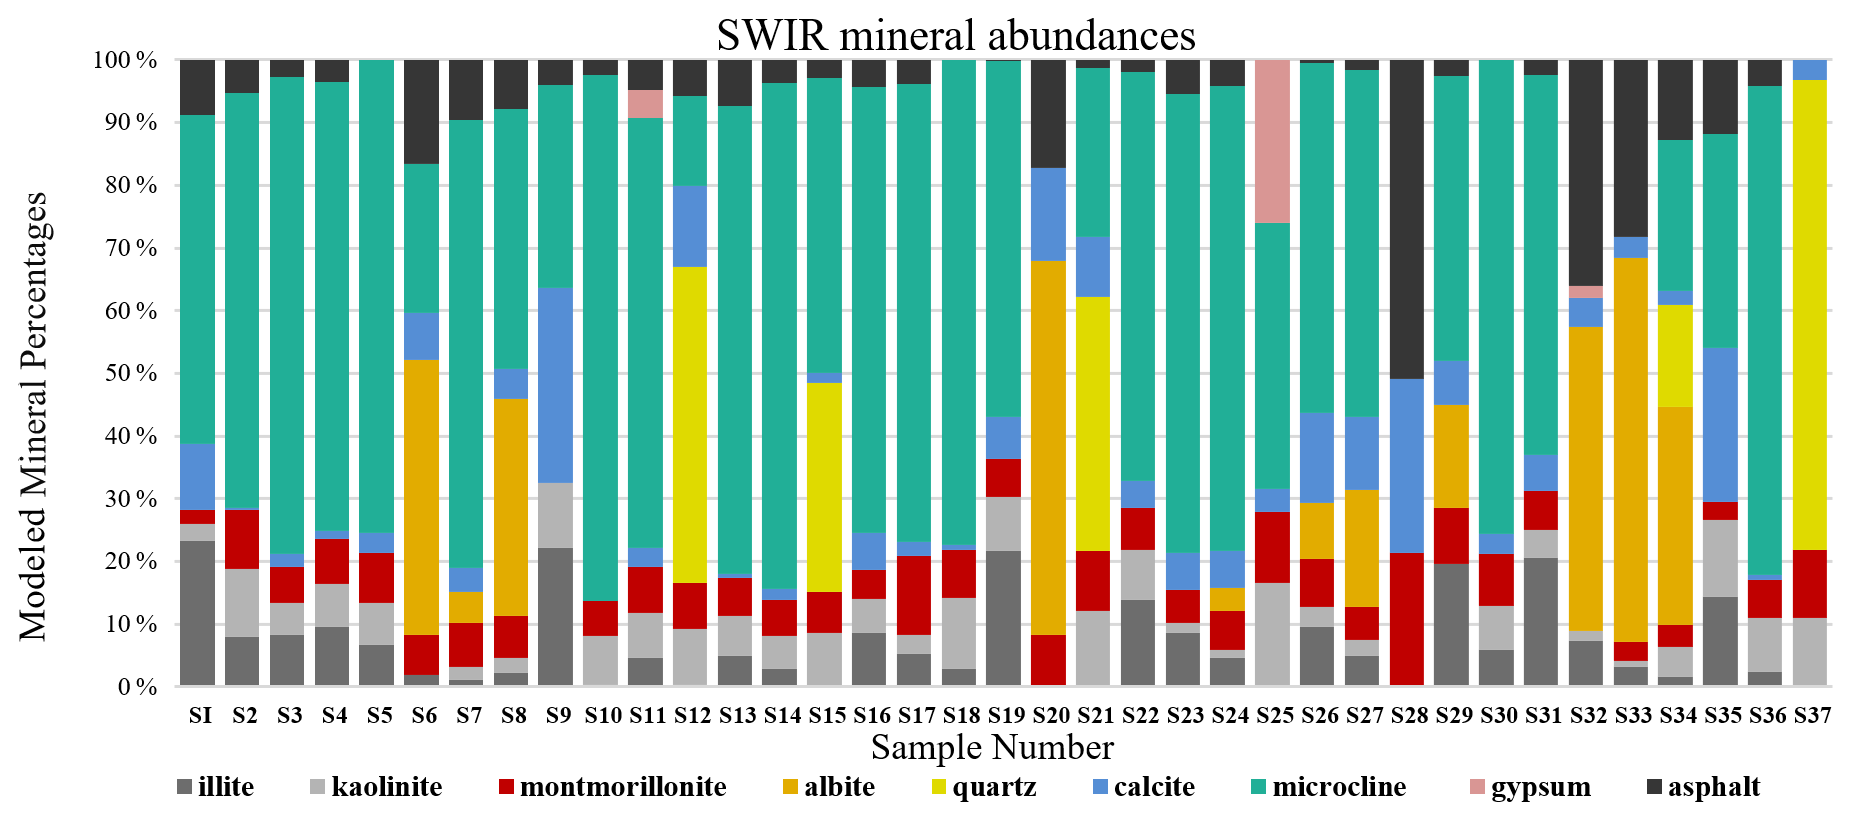
Figure 9Bar charts show the relative mass fraction (%) calculated from a linear combination of SSA of minerals and asphalt. The unrealistically large proportions of microcline, quartz, and albite are discussed in the text.
Figure 10 displays normalized mineral fractions (%) after removing microcline, quartz, and albite from both SWIR and XRD. A comparison of these bar charts reveals that SWIR models are dominated by the abundance of clays, with often a lower abundance of carbonate and asphalt. Montmorillonite, kaolinite, and illite are the most prevalent components and are highly variable in the samples. Since it is difficult to distinguish montmorillonite from illite using XRD, we will compare the abundance of all clay minerals in the next section. Surprisingly, asphalt has a relatively high fraction and is included in the models of the majority of samples but would not be observed by XRD due to its lack of crystal structure. This suggests that asphalt may act as an agent to reduce spectral contrast and contribute to the lower relative abundance of carbonate, similar to that of microcline and other transparent minerals. The three samples that contain gypsum are the same in both SWIR and XRD. Although actinolite (amphibole) is a variable component in the XRD data, it is not apparent or used in the SWIR models at a detectable level.
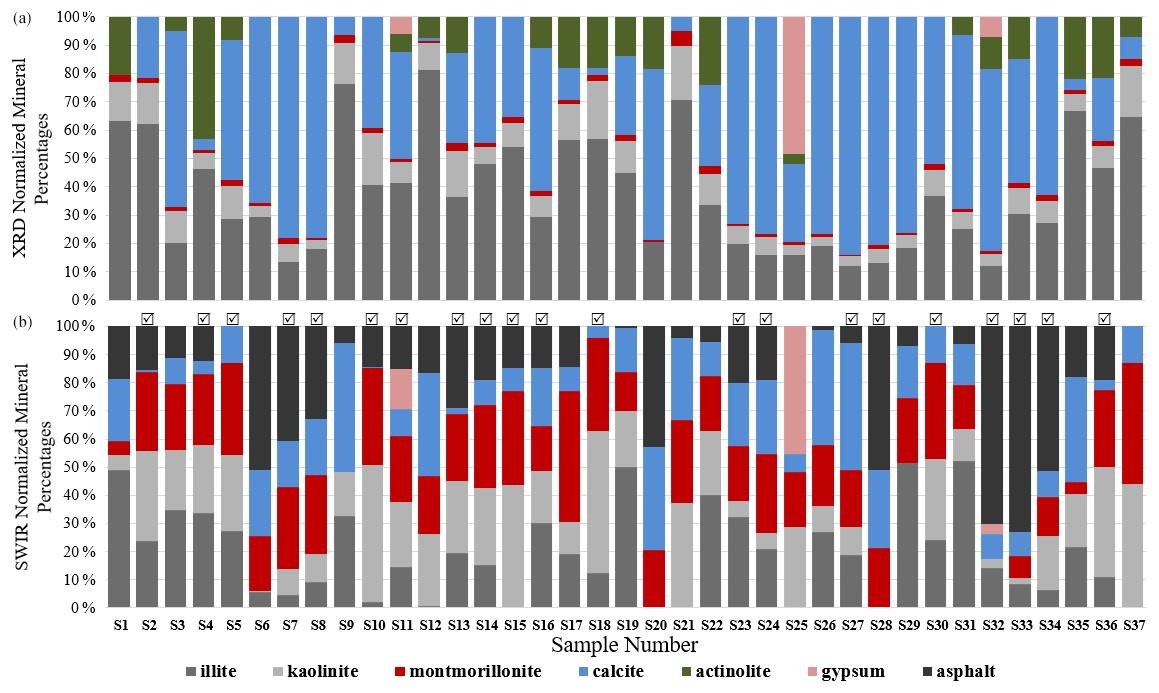
Figure 10Bar charts show XRD (a) and SWIR (b) normalized abundances after removing the transparent minerals. Those samples with check marks had a relatively well-modeled spectral fit (e.g., Fig. 6a and b) as described in the text and are used for subsequent comparison as described in Sect. 3.3.
3.3 Comparison of mineral abundances from XRD and SWIR spectroscopy
Due to the contribution of the non-mineral materials in the samples, many model fits were poor (e.g., Fig. 6c) and hence did not retrieve mineral abundances correctly. Poor models may omit, underestimate, or even overestimate the abundance value for specific minerals. In order to better compare the mineral abundances derived from the spectra and XRD S-Q results, a thorough examination inspected both model fit match quality and RMSE (Appendix C, Fig. C1) and identified 21 samples that had well-matched absorption feature centers and strengths (check marks in Fig. 10 and Appendix C, and, e.g., Fig. 6a and b) and RMSE values below 0.07. In order to compare equivalent abundances, transparent mineral amounts were first removed from both SWIR and XRD (Fig. 10), and then endmember fractions that had non-zero values were re-normalized to 100 %. Illite and kaolinite are among the most common minerals detected with XRD, but in SWIR, both display a very high variability. Montmorillonite presents as a small fraction in XRD abundances but is often quite high in SWIR. In order to compare illite, kaolinite, and montmorillonite abundances from XRD and SWIR, we collected their abundances together into a clay group. Figure 11 compares the abundance of the dominant non-transparent mineral components (clays and carbonates) for the 21 samples having good spectral fits. Figure 11 demonstrates a positive correlation for both clay and carbonate abundance values from XRD and SWIR. However, whereas the best fit correlation for clays displays a linear relationship between abundances generated from these two approaches, the one-to-one comparison of the fractions mostly shows an underestimation of the amount of clay by XRD. On the other hand, the best fit correlation plot for calcite (Fig. 11b) indicates that SWIR significantly underestimates calcite abundances compared to the corresponding XRD percentages.
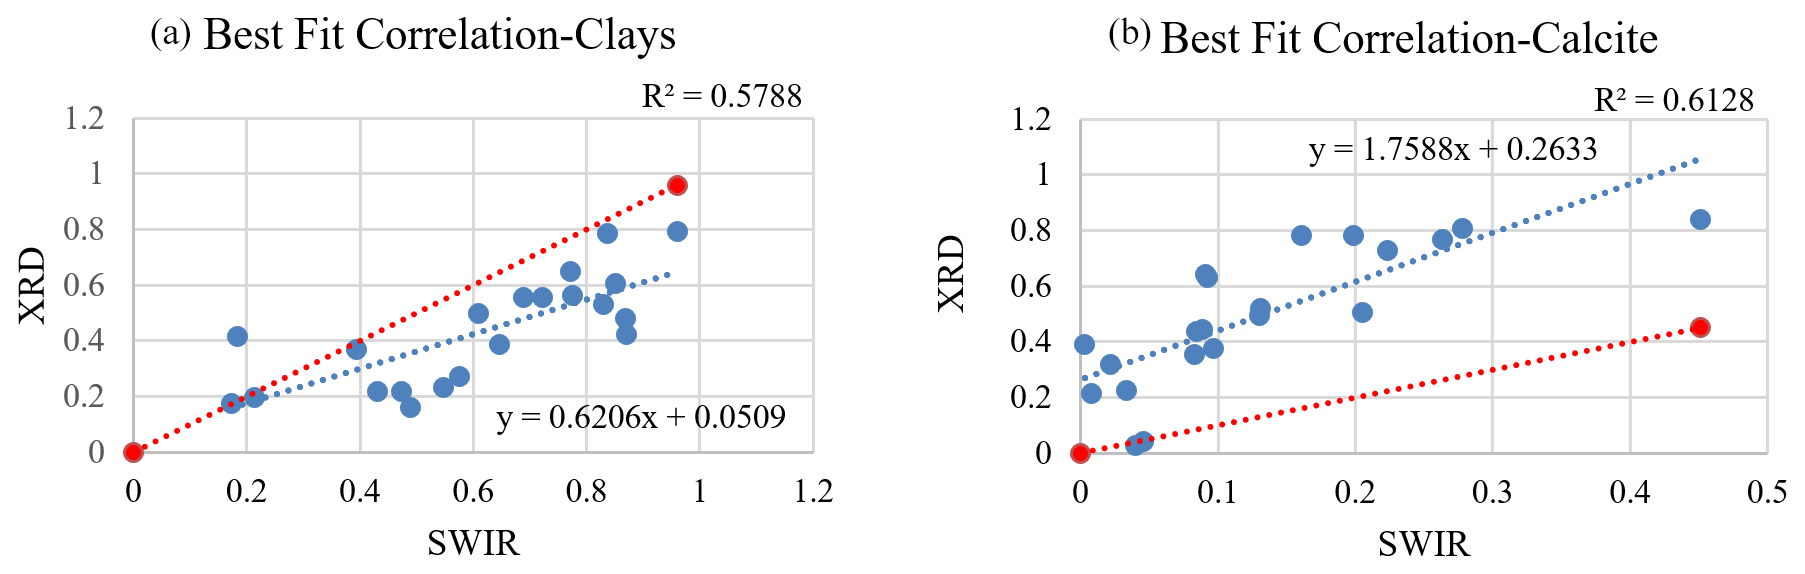
Figure 11Plots display the difference between abundance values (in wt %) derived from XRD and SWIR. Data and the best fit line are in blue, and a 1:1 correspondence is shown in red. In (a) clay abundances obtained from SWIR demonstrate a relatively higher value, suggesting underestimation by the XRD. In (b) the SWIR-derived abundances strongly underestimate the amount of calcite compared to XRD.
In this study, we obtained compositional information and mineral mass abundances for dust samples from both XRD and SWIR. The goal was to compare spectrally derived abundances with S-Q-determined abundance values via XRD. We also aimed to evaluate if combining the Hapke model for SSA and the LSM can accurately predict mineral abundances in natural dust samples collected in urban areas. SWIR vastly overpredicts microcline, quartz, and albite abundances as these spectrally neutral minerals are automatically employed in modeling to uniformly decrease spectral contrast between measured spectra and model fit. After normalizing both datasets for the influence of transparent minerals on the SWIR data, our analysis illustrates that XRD somewhat underpredicts total clay mineral content (Fig. 11a) but underpredicts montmorillonite by a significant margin (Fig. 10). In contrast, spectral modeling predicts a considerable amount of montmorillonite (up to 47 %) in the samples. A comparison of clay abundances from these two techniques showed a positive correlation. However, individual sample comparisons mostly showed a higher abundance for clays derived from spectroscopy. Calcite abundances determined from XRD and SWIR also have a linear correlation (Fig. 11b), although SWIR greatly underestimates its abundance. These results also reveal that SWIR is highly sensitive to non-mineral components such as man-made and plant materials (Figs. 6c, 7a, and b). In Fig. 10, asphalt is one of the most common constituents detected by SWIR, and it substantially contributes to the total abundances for many samples. XRD detected actinolite in a few samples, with varied levels of abundance; however, the SWIR models did not use this mineral even though it was included in the endmember bundle. Possible reasons for the discrepancies in the results obtained from XRD and SWIR are discussed next.
4.1 Nature of techniques
X-ray diffraction (XRD) is the most frequent technique used to characterize dust mineralogy; nevertheless, it is less effective at detecting weakly crystalline or amorphous phases. Given that S-Q mineral abundances tend to underpredict clay mineral abundances, when the sum of all phases in the mixture is normalized to 100 %, the abundance value for calcite and other crystalline minerals may then be overestimated. SWIR spectroscopy, being sensitive to molecular bonding, provides additional information. In SWIR, clay minerals have unique features and strong absorptions; hence their abundances can be best estimated using this wavelength range. Our result determined that XRD underpredicts total clays and, in particular, montmorillonite abundances compared to SWIR. Therefore, we recommend using SWIR in combination with XRD for identifying and quantifying mineral dust particles as the latter traditional approach may overlook some clay phases in the sample.
4.2 Limitation of library and modeling for fine grains
Natural samples have a range of particle sizes, and the minerals in the library used for modeling should match the particle size of the sample. Variable size classes (clay, silt, and sand) were present in our dust mixtures, which substantially altered the strengths of absorption features (Fig. 3) and the overall brightness of the reflectance in each sample spectrum (Gaffey, 1986; Cooper and Mustard, 1999). Gaffey (1986) showed that calcite absorption feature depth is weakened with decreasing particle size. The well-characterized suite of minerals used in the USGS spectral library (Kokaly et al., 2017) often contains minerals at smaller grain sizes, but for the most part, published data use a grain size of 74–250 µm. This larger particle size results in a relatively high spectral contrast for the library minerals. We used Hapke's equation to convert reflectance spectra to single scattering albedo (SSA). The model was able to fit the absorption features in most cases. However, as a result of the different particle sizes encountered in our samples and the library, our model used neutral endmembers (microcline, quartz, and albite) to reduce spectral contrast and match the absorption feature strength of the samples (Hamilton and Christensen, 2000, and Fig. 9).
We explored whether sample particle size distribution had an effect on the quality of the model fit, particularly for the fraction of particle sizes greater than 30 µm. We found no systematic relationship between the quality of the model fit and the fraction of particles larger than 30 µm in the samples. Samples S15 and S17 (Fig. 6), respectively, have 14 % and 40 % of their particle sizes larger than 30 µm; however, S15, with a higher fraction of fine particles, has a better modeled fit. Although we found no link between particle size and fit quality, there may still be some uncertainty in the derived abundances. Hapke models were initially derived for grain sizes larger than the wavelength, allowing geometric optics assumptions to be utilized. Many models did not match the measured spectra and so did not produced accurate mineral abundances. As a result, we recommend constructing a suite of endmembers for LSM from a spectral library that is within the same size range as typical natural dust samples. This will help to reduce differences in absorption band intensities across the spectrum, which should lead to improved model fits and more accurate mineral abundances.
4.3 Contribution of non-mineral constituents
Inspection of all model fits identified 16 samples that had poor matches (e.g., Appendix C and Fig. 6c). These samples showed a strong contribution of known and unknown man-made and plant materials (Fig. 7a and b) in their measured spectra. Among the possible additional materials are a variety of particles such as asphalt, tar, styrofoam, plastic, and dry grass, some of which were visually identified. Absorption from these materials can contribute strongly to the measured spectra preventing a good match. Additionally, many studies have demonstrated that mixing dark grains with other minerals can diminish the mixture's reflectance and considerably weaken the absorption bands observed (Nash and Conel, 1974; Singer, 1981; Clark, 1983). We note that the absolute reflectance values for asphalt and tar in the USGS library (Kokaly et al., 2017) are less than 23 %, thus contributing as dark agents in dust samples. Calcite has a strong diagnostic absorption feature around 2340 nm, but this appears only weakly in our measurements (e.g., Figs. 3 and 6). The absence of this feature may be due not only to fine grain size but also to the contribution of strong absorption from dark man-made constituents. This also leads to the underestimation of calcite abundance obtained from SWIR. XRD is not sensitive to non-crystalline phases and thus is not sensitive to their presence in the samples. Therefore, it is preferable to use XRD to obtain abundances for crystalline phases when mixed with other materials. To characterize and quantify urban dust, reflectance spectroscopy should also be utilized to account for non-mineral materials that are present in mixtures as XRD would miss them. As Fig. 7 displays, SWIR can quickly identify non-mineral diagnostic absorptions (such a hydrocarbon bonds). These materials can contribute strongly to dust mixtures collected from urban settings. Including various additional urban materials in spectral libraries would probably help improve the model fit, but this was not in the scope of this research.
XRD detected both actinolite and kaolinite in trace and minor levels. In SWIR, however, actinolite was included in endmember bundles, but it was not selected by the models. Spectrally derived kaolinite, on the other hand, had highly variable amounts (0 %–50 %), although we did not uniquely observe its diagnostic absorption features in any of the samples. The absence of abundance values for actinolite and unique spectral signatures for kaolinite could be due to their absorption features being suppressed when mixing with other minerals and with dark grains. In addition to the effect of non-mineral components, kaolinite absorption features can be weakened or disappear as montmorillonite abundances increase in the mixture (e.g., Ducasse et al., 2020).
4.4 Obtaining abundances from long-wave infrared (LWIR)
In the VSWIR, reflectance spectra are shaped by electronic and vibrational transitions (Hunt, 1977) allowing detection of compositional information of surface materials. Clay minerals commonly display sharp and narrow diagnostic absorption bands in this wavelength range (Fig. 3) and thus can be best identified and abundances estimated. For other minerals, the vibrational absorptions detectable in VSWIR are weaker signals compared to corresponding features in the long-wave infrared (LWIR, ∼2.5 to 25 µm). In particular, carbonates and silicates have very strong vibrational absorptions in LWIR and are readily detectable in this wavelength range (e.g., Salisbury and Walter, 1989). As noted above, SWIR is not sensitive to the common dust minerals quartz and feldspars (albite and microcline). LWIR water absorptions in clay minerals remain strong when mixed with dark grains (Clark, 1983). Therefore, employing LWIR may better estimate abundances of minerals that are either featureless or are obscured in VSWIR. Additionally, LWIR mineral absorption features in a mixture combine linearly (e.g., Thomson and Salisbury, 1993), allowing the interpretation of measured spectra as a linear combination of its components' abundances. Thorpe et al. (2015) showed that LWIR spectra modeled with LSM can recover mineral abundances (such as for quartz and feldspars) that are relatively in a good agreement with XRD-determined abundances. Therefore, in future work, to identify all clays, as well as quartz and feldspars, using combined VSWIR and LWIR is recommended, which should identify all minerals present in the samples.
In this research, we set out to test if SWIR reflectance spectroscopy combined with a Hapke model and linear spectral mixing of SSA can accurately estimate mineral abundance consistent with semi-quantitative values determined by XRD. The techniques showed better agreement after normalizing for the use of transparent minerals to match weak features in the measured spectra. Both total clay content and carbonate are linearly correlated between the two techniques. However, XRD underpredicted total clay content, and SWIR significantly underpredicted carbonate content. Our analysis showed that SWIR is well-suited to identify clay phases that would be missed by XRD techniques and is also a quick and effective way to survey a group of samples with little preparation. Figure 11a shows that spectrally derived clay abundances correlate well with XRD-derived abundances, but the latter technique underpredicts clay abundances unless samples undergo time-consuming additional sample preparation (e.g., clay separations). From the evaluation of SWIR spectra of dust samples, we conclude that calcite-dominant absorption features are weakened when mixtures are composed of very fine-grained minerals combined with dark man-made materials. This limitation consequently leads to underprediction of calcite in the SWIR abundance determinations. SWIR is advantageous in detecting absorption features attributed to non-mineral materials in samples. These materials are common in urban settings and may also be important for radiative forcing in the atmosphere. Optical microscope images confirm the presence of black and angular-shaped materials, but their composition is not readily identified with this technique. XRD, on the other hand, is not sensitive to non-crystalline phases, so it does not have the ability to characterize them. While each of these approaches are useful for estimating abundances of different types of particles, a combination of the two for full characterization of urban dust has yielded complementary results. However, because quartz and feldspars are substantial fractions of total mineral abundances of dust samples (Fig. 8), we suggest the use of XRD as an initial reliable method for mineral identification and quantification. Based on our analysis, we recommend that future research include spectral measurements in both VSWIR and LWIR as the latter spectral range can be complementary to the former and obtain abundances for VSWIR-transparent minerals (e.g., quartz and feldspars). As a result, the present minerals in the bulk sample can be qualitatively and quantitatively assessed by both VSWIR and LWIR, and then confidently compared with XRD-determined mineral abundances.
Because our analysis uses VSWIR and contributes to fundamental measurements of dust, it can guide further dust mineralogy investigations by satellite imaging spectrometers such as the Earth Surface Mineral Dust Source Investigation (EMIT) (Green et al., 2020). VSWIR reflectance spectroscopy can readily identify clays, carbonates, and iron oxides and distinguish them from non-mineral materials that are components of dust mixtures.
Table A1Locality of 13 deposition samplers in Ilam. Sample numbers shown with N/A did not have enough sample volume for analysis. Root mean square errors (RMSEs) for spectral model fit are also shown. Bold and italic fonts on sample number and RMSE indicate those with a good spectral model fit as described in the text and shown with checks in Fig. 10 and Fig C1.
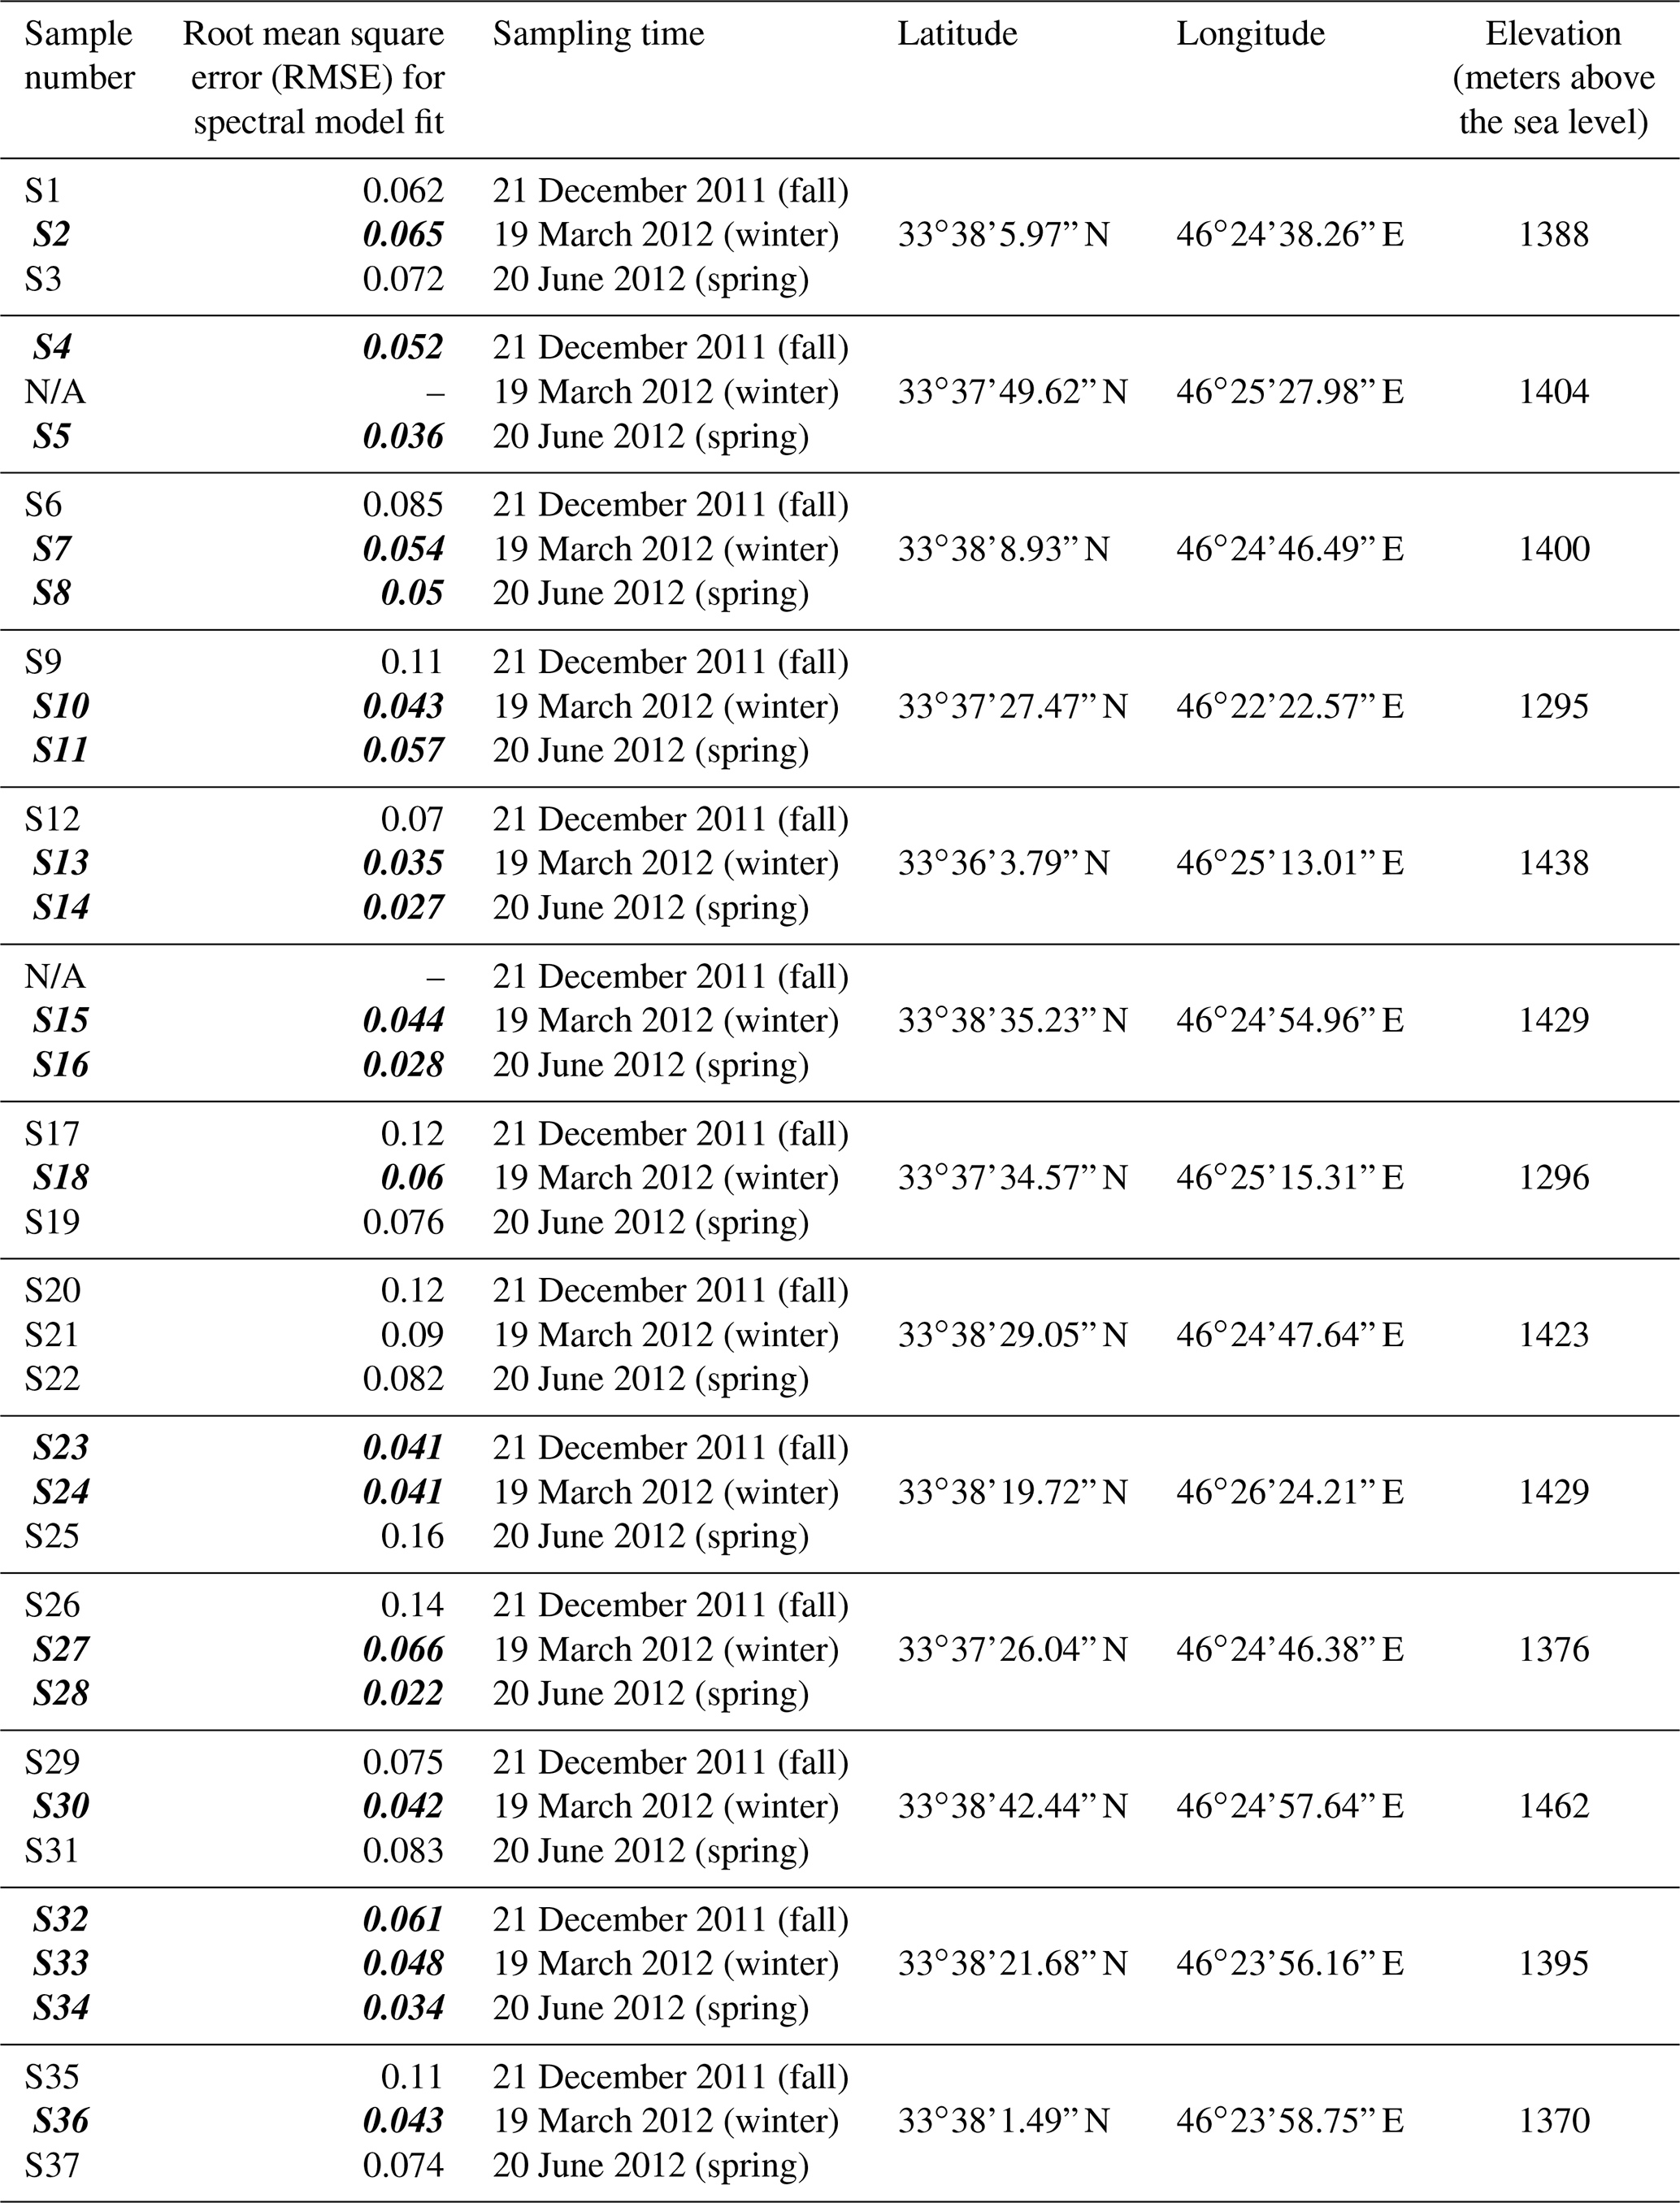
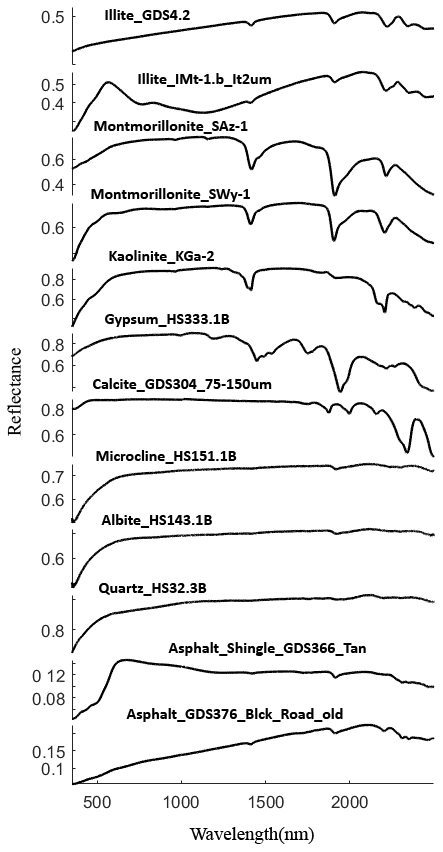
Figure B1Mineral spectra from USGS library (Kokaly et al., 2017) used by model to retrieve mineral abundances for natural dust samples.

Figure C1Spectral model fit (red line) and RMSE are shown for all 37 dust sample SSA spectra (blue line). Check marks represent that the model fits relatively well based on visual inspection and relatively low RMSE.
Data and code used in this study are available in Kokaly et al. (2017) and on request to msadrian@nevada.unr.edu or wcalvin@unr.edu.
MRS and WMC collaborated on project conceptualization, funding, and goals. MRS performed all measurements and data analysis. JM provided OM image interpretation. MRS prepared the manuscript with contributions from all co-authors.
The contact author has declared that neither they nor their co-authors have any competing interests.
Publisher’s note: Copernicus Publications remains neutral with regard to jurisdictional claims in published maps and institutional affiliations.
The authors thank UNR Chemistry Department Shared Instrumentation Laboratory for making its XRD facilities available, Janina Ruprecht for assisting with XRD training, Mohammad Jafari who helped with writing algorithms in MATLAB, and Patrick Arnott and Hans Moosmuller for their helpful comments on the draft manuscript. We appreciate the detailed external reviews provided by the anonymous reviewer, Gregg Swayze, and Longyi Shao that improved the manuscript content and clarity.
This work has been supported in part by the UNR Graduate Student Association Graduate Research Grant and Travel Grant programs, the College of Science Dean's Office, Nevada NASA EPSCoR Research Infrastructure Seed Grant #18-83 from Federal Award Number NNX15AK48a, and co-author Wendy M. Calvin's discretionary funds.
This paper was edited by Mingjin Tang and reviewed by Gregg Swayze, Longyi Shao, and one anonymous referee.
Bell, J. F., Farrand, W. H., Johnson, J. R., and Morris, R. V.: Low abundance materials at the Mars Pathfinder landing site: An investigation using spectral mixture analysis and related techniques, Icarus, 158, 56–71, https://doi.org/10.1006/icar.2002.6865, 2002.
Bish, D. L. and Chipera, S. J.: Detection of trace amounts of erionite using x-ray-powder diffraction – erionite In Tuffs of Yucca Mountain, Nevada, And Central Turkey, Clay Miner., 39, 437–445, https://doi.org/10.1346/ccmn.1991.0390413, 1991.
Caquineau, S., Magonthier, M. C., Gaudichet, A., and Gomes, L.: An improved procedure for the X-ray diffraction analysis of low-mass atmospheric dust samples, Eur. J. Mineral., 9, 157–166, 1997.
Cheek, L. C. and Pieters, C. M.: Reflectance spectroscopy of plagioclase-dominated mineral mixtures: Implications for characterizing lunar anorthosites remotely, Am. Mineral., 99, 1871–1892, https://doi.org/10.2138/am-2014-4785, 2014.
Clark, R. N.: Spectral properties of mixtures of montmorillonite and dark carbon grains: Implications for remote sensing minerals containing chemically and physically adsorbed water, J. Geophys. Res., 88, 635–644, https://doi.org/10.1029/JB088iB12p10635, 1983.
Clark, R. N.: Spectroscopy of Rocks and Minerals, and Principles of Spectroscopy, in: Manual of Remote Sensing, Wiley, 3–58, ISBN: 978-0-471-29405-4, 1999
Clark, R. N., King, T. V. V., Klejwa, M., Swayze, G. A., and Vergo, N.: High spectral resolution reflectance spectroscopy of minerals, J. Geophys. Res.-Solid, 95, 12653–12680, https://doi.org/10.1029/JB095iB08p12653, 1990.
Combe, J. P., Le Mouelic, S., Sotin, C., Gendrin, A., Mustard, J. F., Le Deit, L., Launeau, P., Bibring, J. P., Gondet, B., Langevin, Y., Pinet, P., and Team, O. S.: Analysis of OMEGA/Mars express data hyperspectral data using a Multiple-Endmember Linear Spectral Unmixing Model (MELSUM): Methodology and first results, Planet Space Sci., 56, 951–975, https://doi.org/10.1016/j.pss.2007.12.007, 2008.
Cooper, C. D. and Mustard, J. F.: Effects of very fine particle size on reflectance spectra of smectite and palagonitic soil, Icarus, 142, 557–570, https://doi.org/10.1006/icar.1999.6221, 1999.
Delany, A. C., Parkin, D. W., Griffin, J. J., Goldberg, E. D., and Reimann, B. E. F.: Airborne dust collected at Barbados, Geochim. Cosmochim. Ac., 31, 885–900, https://doi.org/10.1016/s0016-7037(67)80037-1, 1967.
Dennison, P. E. and Roberts, D. A.: Endmember selection for multiple endmember spectral mixture analysis using endmember average RMSE, Remote Sens. Environ., 87, 123–135, https://doi.org/10.1016/S0034-4257(03)00135-4, 2003.
Downs, R. T. and Hall-Wallace, M.: The American mineralogist crystal structure database, Am. Mineral., 88, 247–250, 2003.
Drits, V. A., Zviagina, B. B., McCarty, D. K., and Salyn, A. L.: Factors responsible for crystal-chemical variations in the solid solutions from illite to aluminoceladonite and from glauconite to celadonite, Am. Mineral., 95, 348–361, https://doi.org/10.2138/am.2010.3300, 2010.
Ducasse, E., Adeline, K., Briottet, X., Hohmann, A., Bourguignon, A., and Grandjean, G.: Montmorillonite estimation in clay-quartz-calcite samples from laboratory SWIR imaging spectroscopy: a comparative study of spectral preprocessings and unmixing methods, Remote Sens., 12, 1723, https://doi.org/10.3390/rs12111723, 2020.
Engelbrecht, J., McDonald, E., Gillies, J., Jayanty, R., Casuccio, G., and Gertler, A.: Characterizing mineral dusts and other aerosols from the middle east—part 2: Grab samples and re-suspensions, Inhal. Toxicol., 21, 327–336, https://doi.org/10.1080/08958370802464299, 2009.
Engelbrecht, J. P., Moosmüller, H., Pincock, S., Jayanty, R. K. M., Lersch, T., and Casuccio, G.: Technical note: Mineralogical, chemical, morphological, and optical interrelationships of mineral dust re-suspensions, Atmos. Chem. Phys., 16, 10809–10830, https://doi.org/10.5194/acp-16-10809-2016, 2016.
Engelbrecht, J. P., Stenchikov, G., Prakash, P. J., Lersch, T., Anisimov, A., and Shevchenko, I.: Physical and chemical properties of deposited airborne particulates over the Arabian Red Sea coastal plain, Atmos. Chem. Phys., 17, 11467–11490, https://doi.org/10.5194/acp-17-11467-2017, 2017.
Fratini, G., Ciccioli, P., Febo, A., Forgione, A., and Valentini, R.: Size-segregated fluxes of mineral dust from a desert area of northern China by eddy covariance, Atmos. Chem. Phys., 7, 2839–2854, https://doi.org/10.5194/acp-7-2839-2007, 2007.
Gaffey, S. J.: Spectral reflectance of carbonate minerals in the visible and near infrared (0.35–2.55 microns); calcite, aragonite, and dolomite, Am. Mineral., 71, 151–162, 1986.
Gaffey, S. J., McFadden, L. A., Nash, D., and Pieters, C. M.: Ultraviolet, visible, and near-infrared reflectance spectroscopy: Laboratory spectra of geologic materials, in: Remote geochemical analysis: Elemental and mineralogical composition, edited by: Pieters, C. M. and Englert P. A. J., Cambridge University Press, Cambridge, 43–78, ISBN: 978-0521402811, 1993.
Ganor, E.: Atmospheric dust in Israel. Sedimentological and meteorological analysis of dust deposition, Hebrew University of Jerusalem, 1975.
Ginoux, P.: Atmospheric chemistry: Warming or cooling dust?, Nat. Geosci., 10, 246–247, https://doi.org/10.1038/ngeo2923, 2017.
Goossens, D.: Quantification of the dry aeolian deposition of dust on horizontal surfaces: an experimental comparison of theory and measurements, Sedimentology, 52, 859–873, https://doi.org/10.1111/j.1365-3091.2005.00719.x, 2005.
Goossens, D. and Offer, Z. Y.: An evaluation of the efficiency of some eolian dust collectors, Soil Technol., 7, 25–35, https://doi.org/10.1016/0933-3630(94)90004-3, 1994.
Goossens, D. and Rajot, J. L.: Techniques to measure the dry aeolian deposition of dust in arid and semi-arid landscapes: a comparative study in West Niger, Earth Surf. Proc. Land., 33, 178–195, https://doi.org/10.1002/esp.1533, 2008.
Goss, N. R., Mladenov, N., Seibold, C. M., Chowanski, K., Seitz, L., Wellemeyer, T. B., and Williams, M. W.: Quantifying particulate matter deposition in Niwot Ridge, Colorado: Collection of dry deposition using marble inserts and particle imaging using the FlowCAM, Atmos. Environ., 80, 549–558, https://doi.org/10.1016/j.atmosenv.2013.08.037, 2013.
Goudie, A. and Middleton, N.: Desert Dust in the Global System, Springer, 1–287, https://doi.org/10.1007/3-540-32355-4, 2006.
Green, R. O., Thompson, D. R., and the EMIT Team: An earth science imaging spectroscopy mission: The earth surface mineral dust source investigation (EMIT), Int. Geosci. Remote Se., 6262–6265, https://doi.org/10.1109/igarss39084.2020.9323741, 2020.
Gualtieri, A. F.: Accuracy of XRPD QPA using the combined Rietveld-RIR method, J. Appl. Crystallogr., 33, 267–278, https://doi.org/10.1107/s002188989901643x, 2000.
Hamilton, V. E. and Christensen, P. R.: Determining the modal mineralogy of mafic and ultramafic igneous rocks using thermal emission spectroscopy, J. Geophys. Res.-Planet., 105, 9717–9733, https://doi.org/10.1029/1999je001113, 2000.
Hamilton, V. E., Christensen, P. R., and McSween, H. Y.: Determination of Martian meteorite lithologies and mineralogies using vibrational spectroscopy, J. Geophys. Res.-Planet., 102, 25593–25603, https://doi.org/10.1029/97je01874, 1997.
Hapke, B.: Bidirectional reflectance spectroscopy: 1. Theory, J. Geophys. Res.-Sol. Ea., 86, 3039–3054, https://doi.org/10.1029/JB086iB04p03039, 1981.
Hartshorn, E. J., McDonald, E. V., Weir, W. B., Sweeney, M., Houseman, S. M., and Lacey, T.: An integrated model combining UAS imagery and PI-SWERL for evaluating intra-landform dust emission variability, Report Prepared for U.S. Army Corps of Engineers, Engineer Research and Development Center, Cold Regions Research and Engineering Laboratory, https://www.dri.edu/publication/12515/ (last access: 10 February 2022), 2021.
Hiroi, T. and Pieters, C. M.: Estimation of grain sizes and mixing ratios of fine powder mixtures of common geologic minerals, J. Geophys. Res.-Planet., 99, 10867–10879, https://doi.org/10.1029/94je00841, 1994.
Hunt, G. R.: Spectral signatures of particulate minerals in the visible and near infrared, Geophysics, 42, 501–513, https://doi.org/10.1190/1.1440721, 1977.
Johnson, P. E., Smith, M. O., Taylorgeorge, S., and Adams, J. B.: A semiempirical method for analysis of the reflectance spectra of binary mineral mixtures, J. Geophys. Res., 88, 3557–3561, https://doi.org/10.1029/JB088iB04p03557, 1983.
Kandler, K., Schutz, L., Deutscher, C., Ebert, M., Hofmann, H., Jackel, S., Jaenicke, R., Knippertz, P., Lieke, K., Massling, A., Petzold, A., Schladitz, A., Weinzierl, B., Wiedensohler, A., Zorn, S., and Weinbruch, S.: Size distribution, mass concentration, chemical and mineralogical composition and derived optical parameters of the boundary layer aerosol at Tinfou, Morocco, during SAMUM 2006, Tellus B, 61, 32–50, https://doi.org/10.1111/j.1600-0889.2008.00385.x, 2009.
Keshava, N. and Mustard, J. F.: Spectral unmixing, IEEE Signal Proc. Mag., 19, 44–57, https://doi.org/10.1109/79.974727, 2002.
Klein, C., Hurlbut, C. S., and Dana, J. D.: Analytical Methods in Mineral Science, in: The 22nd edition of the manual of mineral science, J. Wiley, New York, 290–332, ISBN: 0-471-25177-1, 2002.
Kokaly, R. F., Clark R. N., Swayze, G. A., Livo, K. E., Hoefen, T. M., Pearson, N. C., Wise, R. A., Benzel, W. M., Lowers, H. A., Driscoll, R. L., Klein A. J.: USGS Spectral Library Version 7, Reston, VA, Report Rep. 1035, 68 pp., https://doi.org/10.3133/ds1035, 2017.
Lapotre, M. G. A., Ehlmann, B. L., and Minson, S. E.: A probabilistic approach to remote compositional analysis of planetary surfaces, J. Geophys. Res.-Planet., 122, 983–1009, https://doi.org/10.1002/2016je005248, 2017.
Leask, E. K., Ehlmann, B. L.: Identifying and quantifying mineral abundance through VSWIR microimaging spectroscopy: A comparison to XRD and SEM, 8th Workshop on Hyperspectral Image and Signal Processing: Evolution in Remote Sensing (Whispers), Los Angeles, California, 21–24 August 2016, IEEE, 1–5, https://doi.org/10.1109/WHISPERS.2016.8071774, 2016.
Lucey, P. G.: Model near-infrared optical constants of olivine and pyroxene as a function of iron content, J. Geophys. Res.-Planet., 103, 1703–1713, https://doi.org/10.1029/97je03145, 1998.
Maring, H., Savoie, D. L., Izaguirre, M. A., McCormick, C., Arimoto, R., Prospero, J. M., and Pilinis, C.: Aerosol physical and optical properties and their relationship to aerosol composition in the free troposphere at Izana, Tenerife, Canary Islands, during July 1995, J. Geophys. Res.-Atmos., 105, 14677–14700, https://doi.org/10.1029/2000jd900106, 2000.
Metternicht, G. I. and Fermont, A.: Estimating erosion surface features by linear mixture modeling, Remote Sens. Environ., 64, 254–265. https://doi.org/10.1016/S0034-4257(97)00172-7, 1998.
Miller, R. L. and Tegen, I.: Climate response to soil dust aerosols, J. Climate, 11, 3247–3267, https://doi.org/10.1175/1520-0442(1998)011<3247:crtsda>2.0.co;2, 1998.
Moore, D. M. and Reynolds Jr., R. C.: X-Ray diffraction and the identification and analysis of clay minerals, 2nd edn., Oxford University Press, Oxford, New York, ISBN: 978-0195087130, 1997.
Mustard, J. F. and Pieters, C. M.: Quantitative abundance estimates from bidirectional reflectance measurements, J. Geophys. Res.-Solid, 92, E617–E626, https://doi.org/10.1029/JB092iB04p0E617, 1987.
Mustard, J. F. and Pieters, C. M.: Photometric phase functions of common geologic minerals and applications to quantitative-analysis of mineral mixture reflectance spectra, J. Geophys. Res.-Solid, 94, 13619–13634, https://doi.org/10.1029/JB094iB10p13619, 1989.
Nash, D. B. and Conel, J. E.: Spectral reflectance systematics for mixtures of powdered hypersthene, labradorite, and illmenite, J. Geophys. Res., 79, 1615–1621, https://doi.org/10.1029/JB079i011p01615, 1974.
Nowak, S., Lafon, S., Caquineau, S., Journet, E., and Laurent, B.: Quantitative study of the mineralogical composition of mineral dust aerosols by X-ray diffraction, Talanta, 186, 133–139, https://doi.org/10.1016/j.talanta.2018.03.059, 2018.
Offer, Z. Y., Goossens, D., and Shachak, M.: Aeolian deposition of nitrogen to sandy and loessial ecosystems in the negev desert, Journal Arid Environ., 23, 355–363, https://doi.org/10.1016/s0140-1963(18)30609-8, 1992.
Pan, C., Rogers, A. D., and Thorpe, M. T.: Quantitative compositional analysis of sedimentary materials using thermal emission spectroscopy: 2. Application to compacted fine-grained mineral mixtures and assessment of applicability of partial least squares methods, J. Geophys. Res.-Planet., 120, 1984–2001, https://doi.org/10.1002/2015je004881, 2015.
Ramsey, M. S. and Christensen, P. R.: Mineral abundance determination: Quantitative deconvolution of thermal emission spectra, J. Geophys. Res.-Sol. Ea., 103, 577–596, https://doi.org/10.1029/97jb02784, 1998.
Reid, E. A., Reid, J. S., Meier, M. M., Dunlap, M. R., Cliff, S. S., Broumas, A., Perry, K., and Maring, H.: Characterization of African dust transported to Puerto Rico by individual particle and size segregated bulk analysis, J. Geophys. Res.-Atmos., 108, 8591, https://doi.org/10.1029/2002jd002935, 2003.
Reynolds, R. L., Goldstein, H. L., Moskowitz, B. M., Kokaly, R. F., Munson, S. M., Solheid, P., Breit, G. N., Lawrence, C. R., and Derry, J.: Dust deposited on snow cover in the San Juan Mountains, Colorado, 2011–2016: Compositional Variability Bearing on Snow-Melt Effects, J. Geophys. Res.-Atmos., 125, 24, https://doi.org/10.1029/2019jd032210, 2020.
Roberts, D. A., Gardner, M., Church, R., Ustin, S., Scheer, G., and Green, R. O.: Mapping chaparral in the Santa Monica Mountains using multiple endmember spectral mixture models, Remote Sens. Environ., 65, 267–279, https://doi.org/10.1016/s0034-4257(98)00037-6, 1998.
Robertson, K. M., Milliken, R. E., and Li, S.: Estimating mineral abundances of clay and gypsum mixtures using radiative transfer models applied to visible-near infrared reflectance spectra, Icarus, 277, 171–186, https://doi.org/10.1016/j.icarus.2016.04.034, 2016.
Rogers, A. D. and Aharonson, O.: Mineralogical composition of sands in Meridiani Planum determined from Mars Exploration Rover data and comparison to orbital measurements, J. Geophys. Res.-Planet., 113, E06S14, https://doi.org/10.1029/2007je002995, 2008.
Sadrian, M. R., Mohammadkhan, S., Mashhadi, N., Alavipanah, S. K., and Dashtakian, K.: Analyzing and investigation of dustfall by MDCO (case study: the city of Ilam), International desert research center, University of Tehran, 2012.
Salisbury, J. W. and Walter, L. S.: Thermal infrared (2.5–13.5 µm) spectroscopic remote sensing of igneous rock types on particulate planetary surfaces, J. Geophys. Res.-Solid, 94, 9192–9202, https://doi.org/10.1029/JB094iB07p09192, 1989.
Shahsavani, A., Naddafi, K., Haghighifard, N. J., Mesdaghinia, A., Yunesian, M., Nabizadeh, R., Arahami, M., Sowlat, M. H., Yarahmadi, M., Saki, H., Alimohamadi, M., Nazmara, S., Motevalian, S. A., and Goudarzi, G.: The evaluation of PM10, PM2.5, and PM1 concentrations during the Middle Eastern Dust (MED) events in Ahvaz, Iran, from April through September 2010, J. Arid Environ., 77, 72–83, https://doi.org/10.1016/j.jaridenv.2011.09.007, 2012.
Singer, R. B.: Near-infrared spectral reflectance of mineral mixtures – systematic combinations of pyroxenes, olivine, and iron-oxides, J. Geophys. Res., 86, 7967–7982, https://doi.org/10.1029/JB086iB09p07967, 1981.
Sokolik, I. N. and Toon, O. B.: Incorporation of mineralogical composition into models of the radiative properties of mineral aerosol from UV to IR wavelengths, J. Geophys. Res.-Atmos., 104, 9423–9444, https://doi.org/10.1029/1998jd200048, 1999.
Sokolik, I. N., Winker, D. M., Bergametti, G., Gillette, D. A., Carmichael, G., Kaufman, Y. J., Gomes, L., Schuetz, L., and Penner, J. E.: Introduction to special section: Outstanding problems in quantifying the radiative impacts of mineral dust, J. Geophys. Res.-Atmos., 106, 18015–18027, https://doi.org/10.1029/2000jd900498, 2001.
Sow, M., Goossens, D., and Rajot, J. L.: Calibration of the MDCO dust collector and of four versions of the inverted frisbee dust deposition sampler, Geomorphology, 82, 360–375, https://doi.org/10.1016/j.geomorph.2006.05.013, 2006.
Tegen, I. and Lacis, A. A.: Modeling of particle size distribution and its influence on the radiative properties of mineral dust aerosol, J. Geophys. Res.-Atmos., 101, 19237–19244, https://doi.org/10.1029/95jd03610, 1996.
Tegen, I., Lacis, A. A., and Fung, I.: The influence on climate forcing of mineral aerosols from disturbed soils, Nature, 380, 419–422, https://doi.org/10.1038/380419a0, 1996.
Thomson, J. L. and Salisbury, J. W.: The midinfrared reflectance of mineral mixtures (7–14 µm), Remote Sens. Environ., 45, 1–13, https://doi.org/10.1016/0034-4257(93)90077-b, 1993.
Thorpe, M. T., Rogers, A. D., Bristow, T. F., and Pan, C.: Quantitative compositional analysis of sedimentary materials using thermal emission spectroscopy: 1. Application to sedimentary rocks, J. Geophys. Res.-Planet., 120, 1956–1983, https://doi.org/10.1002/2015je004863, 2015.
von Holdt, J. R. C., Eckardt, F. D., Baddock, M. C., Hipondoka, M. H. T., and Wiggs, G. F. S.: Influence of sampling approaches on physical and geochemical analysis of aeolian dust in source regions, Aeolian Res., 50, 100684, https://doi.org/10.1016/j.aeolia.2021.100684, 2021.
- Abstract
- Introduction
- Methods and material
- Results
- Discussion – discrepancies in derived abundances between XRD and SWIR
- Conclusions
- Appendix A
- Appendix B
- Appendix C
- Code and data availability
- Author contributions
- Competing interests
- Disclaimer
- Acknowledgements
- Financial support
- Review statement
- References