the Creative Commons Attribution 4.0 License.
the Creative Commons Attribution 4.0 License.
 | 24 May 2022
Impact of particle size, refractive index, and shape on the determination of the particle scattering coefficient – an optical closure study evaluating different nephelometer angular truncation and illumination corrections
Marilena Teri
Thomas Müller
Josef Gasteiger
Sara Valentini
Helmuth Horvath
Roberta Vecchi
Paulus Bauer
Adrian Walser
Bernadett Weinzierl
Aerosol particles in the atmosphere interact with solar radiation through scattering and absorption. Accurate aerosol optical properties are needed to reduce the uncertainties of climate predictions. The aerosol optical properties can be obtained via optical modeling based on the measured particle size distribution. This approach requires knowledge or assumptions on the particle refractive index and shape. Meanwhile, integrating nephelometry provides information on the aerosol scattering properties directly. However, their measurements are affected by angular non-idealities, and their data need to be corrected for angular truncation and illumination to provide the particle scattering coefficient. We performed an extensive closure study, including a laboratory and a simulated experiment, aiming to compare different nephelometer angular truncation and illumination corrections (further referred to as “angular corrections”). We focused on coarse-mode irregularly shaped aerosols, such as mineral dust, a worldwide abundant aerosol component. The angular correction of irregular particles is found to be only ∼2 % higher than the angular correction of volume-equivalent spheres. If the angular correction is calculated with Mie theory, the particle size distribution is needed. Our calculations show that if the particle size distribution is retrieved from optical particle spectrometer measurements and the irregular shape effect is not considered, the angular correction can be overestimated by about 5 % and up to 22 %. For mineral dust, the traditional angular correction based on the wavelength dependency of the scattering coefficient seems more accurate. We propose a guideline to establish the most appropriate angular correction depending on the aerosol type and the investigated size range.
Please read the corrigendum first before continuing.
-
Notice on corrigendum
The requested paper has a corresponding corrigendum published. Please read the corrigendum first before downloading the article.
-
Article
(5286 KB)
- Corrigendum
-
Supplement
(1927 KB)
-
The requested paper has a corresponding corrigendum published. Please read the corrigendum first before downloading the article.
- Article
(5286 KB) - Full-text XML
- Corrigendum
-
Supplement
(1927 KB) - BibTeX
- EndNote


The atmosphere contains aerosol particles that scatter or absorb the solar radiation (direct effect) and act as cloud condensation nuclei (indirect effect), influencing the Earth's energy budget and thus the climate system. The aerosol radiative forcing constitutes one of the largest uncertainties in climate predictions (IPCC, 2013). To reduce this uncertainty, climate models require more accurate information on the optical properties of aerosol particles. In particular, the particle scattering coefficient, the angular distribution of the scattered light, and the particle absorption coefficient are crucial quantities for calculating the aerosol direct radiative forcing. The traditional method to obtain the aerosol optical properties is to calculate them via optical modeling based on the particle size distribution measured with particle spectrometers (e.g., Hermann et al., 2016; Vasilatou, 2021), but different measurement techniques also exist to measure the aerosol optical properties directly. For example, integrating nephelometry, firstly introduced by Beuttell and Brewer (1949), is extensively used in monitoring stations, field campaigns, and laboratory experiments (e.g., Pandolfi et al., 2018; Cappa et al., 2016; Di Biagio et al., 2019). An integrating nephelometer performs a geometrical integration of the light scattered by gas molecules and aerosol particles in an enclosed volume over almost the complete angular range (Heintzenberg and Charlson, 1996; Anderson et al., 1996; Horvath, 1973). Therefore, it is possible to obtain values close to the total scattering coefficient without assuming the particle refractive index and shape.
Different measurement techniques and models could be used to independently derive the same parameters of an aerosol. This practice, called “closure experiment”, aims not only to characterize a specific parameter but also to minimize the measurement uncertainties (Weinzierl et al., 2017). In particular, the closure, between optical properties simulated from the measured size distribution and the optical properties measured directly, in principle allows constraining the refractive index of the investigated aerosol (e.g., Abo Riziq et al., 2007; Mack et al., 2010; Kassianov et al., 2014).
The largest uncertainty of nephelometer measurements is the impossibility of measuring the light scattered by particles and air in the whole angular range, the angular truncation error (Heintzenberg and Charlson, 1996; Anderson et al., 1996), combined with the angular non-idealities of the light source (Anderson et al., 1996; Müller et al., 2009). Therefore, data from integrating nephelometers must be corrected to obtain the particle scattering coefficient. Since larger particles scatter more into the forward direction than smaller particles, the angular truncation error depends on size; the aerosol type can also affect the angular correction, and its determination is not straightforward. This correction is commonly called “truncation correction”, but the correct term is angular correction, since it takes into account both errors: the angular truncation and the non-idealities of the light source.
An empirical angular correction, exploiting the wavelength dependence of scattering, was developed by Anderson and Ogren (1998) for the nephelometer TSI model 3563. This angular correction was adapted for the Ecotech Aurora 3000 nephelometer by Müller et al. (2011a). The correlation between the scattering wavelength dependence and angular correction is due to the dependency of both quantities on the particle size. However, Bond et al. (2009) and Massoli et al. (2009) pointed out that this angular correction might be erroneous in some cases since the wavelength and angular dependence of scattering can be different for absorbing particles. Even if the uncertainty of this angular correction is only about 5 %, Bond et al. (2009) remarked that this uncertainty is almost as large as the angular truncation error itself in the sub-micrometer size range, where absorbing particles are relevant.
Another method of calculating the angular correction uses Mie theory and the angular sensitivity function, which takes into account the geometrical limitations of the nephelometer (Heintzenberg et al., 2006). This method requires knowledge of the particle size distribution and the refractive index, in addition to the nephelometer measurements. However, Heintzenberg et al. (2006) found larger uncertainties (∼ 20 %) associated with super-micrometer particles. In addition, Schladitz et al. (2009, 2011) showed that this approach also requires the knowledge of particle shape in the case of non-spherical particles, such as mineral dust aerosol. Mineral dust, raised from desert areas by the wind and transported around the globe, is the most abundant aerosol component in terms of dry mass (Choobari et al., 2014; Textor et al., 2006). A study based on the spheroids model (Quirantes et al., 2008) indicated that the effect of non-sphericity on the angular correction might be small. Meanwhile, Sorribas et al. (2015) estimated an uncertainty of about 13 % for the Anderson and Ogren (1998) angular correction in the case of coarse-mode desert dust aerosol and recommended the re-evaluation of this angular correction for coarse-mode aerosol.
This work aims to evaluate and compare different nephelometer angular truncation and illumination corrections with a focus on mineral dust aerosol. We used the Ecotech Aurora 4000 polar nephelometer, which measures the light scattering in 18 different angular sectors in addition to the total scattering coefficient. Müller et al. (2012) measured the angular illumination function of the Aurora 4000 polar nephelometer and provided its angular sensitivity function for all angular sectors. An alternative angular correction, exploiting the information on scattering for different angular sectors of the Aurora 4000 nephelometer, was developed by Müller et al. (2012). This angular correction, in addition to spherical particles, considers several particle shapes.
Very recently, when our data were already processed, a new angular correction was proposed by Qiu et al. (2021). The new angular correction exploits the wavelength dependency of the scattering coefficient, the hemispheric back-scattering fraction, and new technologies such as the random forest machine learning. The random forest machine learning was trained based on a data set representing regional anthropogenic aerosol in the North China Plain, including mainly sub-micrometer particles. The utilized data set limits the use of the new angular correction to sub-micrometer spherical particles. Since our work mainly focused on coarse-mode irregularly shaped particles, we did not consider this angular correction in our comparison.
We conducted an extensive closure study, including a laboratory and a simulated experiment, focusing on coarse-mode irregularly shaped particles (mineral-dust-like). Laboratory test aerosols were generated using polystyrene latex (PSL) particles, ammonium sulfate (AS), and soil dust samples. Their extinction, scattering, and absorption properties, as well as the particle number concentration and size distribution, were measured by seven instruments in parallel. To better interpret the results of the laboratory experiment, we performed a simulated closure experiment randomly selecting several size distributions, refractive indices, and shapes (e.g., irregularly shaped dust-like particles (Gasteiger et al., 2011)). We estimated the uncertainties in the angular correction of the Aurora 4000 polar nephelometer calculated using parallel particle size distribution measurements from a TSI OPS 3330. The TSI OPS 3330 is an optical particle spectrometer, a class of instrument widely used to measure the aerosol size distributions during aircraft field experiments (e.g, Weinzierl et al., 2017; Spanu et al., 2020; Brock et al., 2021).
In Sect. 2, we describe the principle of operation of the Aurora 4000 polar nephelometer. In Sect. 3, we review the methods considered for calculating the angular correction and their main limitations. In Sect. 4, we describe the laboratory closure experiment and the most important results. In Sect. 5, we describe the simulated closure experiment and its main outcomes. In Sect. 6, we discuss the results of both the laboratory and the simulated experiments and we compare them with the literature. In Sect. 7, we draw the main conclusions and we give recommendations for an appropriate angular correction.
The Aurora 4000 polar nephelometer is a three-wavelength integrating nephelometer. Integrating nephelometers measure the light scattered by particles and air in a volume. The light detector is placed orthogonally to a nearly Lambertian light source1 such that the angular illumination function is similar to a sin (θ), where θ is the scattering angle (Müller et al., 2009). Volume elements along the detector field of view contribute to the measured signal with light scattered at different θ. The measured signal is the integral over nearly all angles of the angular scattering function γ(Ω), the fraction of light scattered out of a parallel beam of light per unit length and per unit solid angle Ω with respect to the direction of the incident beam. In other words, integrating nephelometers measure a signal proportional to the scattering coefficient σs, the fraction of light scattered out of a parallel beam of light per unit length. A full description of the measurement principle of an integrating nephelometer is available in the appendix of Anderson et al. (1996).
The Aurora 4000 polar nephelometer uses as light sources three light-emitting diodes (LEDs) at different wavelengths: blue (λB=450 nm), green (λG=525 nm), and red (λR=635 nm). It is marked as “polar” because it integrates γ(Ω) in several angular sectors. A shutter can block the angular illumination, such that the detector measures only the light scattered between the shutter position α and 180∘. The shutter of the Aurora 4000 can consecutively assume up to 18 angular positions (0, 10, 15, …, 90∘). For a given shutter position α and wavelength λ, the signal measured by the Aurora 4000 can be written as
where describes the angular sensitivity of the Aurora 4000 for shutter position α at scattering angle θ (see Eq. 5 in Sect. 3.1). The signal is proportional to the scattering coefficient in the angular sector . The two extreme positions and yield a signal proportional to the total scattering coefficient and hemispheric back-scattering coefficient , respectively.
Calibration with particle-free gases of known Rayleigh scattering coefficient leads to the constant of calibration , which relates the measured signal to the particle scattering coefficient in the angular sector :
where is the Rayleigh scattering coefficient of particle-free air in the angular sector . It can be derived integrating in the angular sector the Rayleigh angular scattering function :
where is the Rayleigh total scattering coefficient of air (e.g., Bucholtz, 1995) at the wavelength λ calculated at the temperature and pressure of the carrier gas. The second term is a value changing from 1 for to 0.5 for .
3.1 Angular sensitivity function
In an ideal nephelometer, the light source is perfectly Lambertian and the angular integration is complete from α to 180∘. Thus, the angular sensitivity function can be written as
Any real nephelometer is affected by non-idealities that need to be considered in the angular sensitivity function. First, the angular truncation error: the light scattered into the extreme forward () and backward () directions cannot be measured, and the detector field of view is restricted to angular detection limits (Anderson et al., 1996; Moosmüller and Arnott, 2003). Second, the light source is not perfectly Lambertian and the angular illumination function deviates a little from a sine function (Anderson et al., 1996; Müller et al., 2009). Third, the separation by the shutter is not perfectly sharp and the shadowing of the shutter has to be considered when its position is different from zero (Müller et al., 2011a). The angular sensitivity function of the Aurora 4000 polar nephelometer can be written as (Müller et al., 2012)
Table 1Parameters of the Aurora 4000 angular sensitivity function given by Müller et al. (2012).

The angular limits of detection θ1 and θ2 are reported in the Aurora 4000 polar nephelometer user manual. β1 and β2 describe the deviation from the sine as measured by Müller et al. (2012) with the method described in Müller et al. (2009). δ1(α) and δ2(α) account for the shadowing of the shutter as a function of its position α and are provided by Müller et al. (2012). The parameters for the Aurora 4000 polar nephelometer are reported in Table 1 and are the same for the three wavelengths.
The ideal particle scattering coefficient and the Aurora 4000 particle scattering coefficient can be explicitly written as
where CR,α takes into account the angular truncation and illumination correction implicitly performed through the particle-free gases calibration (Anderson and Ogren, 1998; Müller et al., 2011a). It can be calculated as
For the Aurora 4000 polar nephelometer, the Rayleigh angular truncation and illumination correction for is a non-negligible value:
Taking into account both the angular truncation and the non-Lambertian illumination, the angular correction Cα for any position of the shutter α can be defined, following the definition given by Anderson and Ogren (1998), as
Table 2Different angular corrections for the particle scattering coefficient and their limitations.
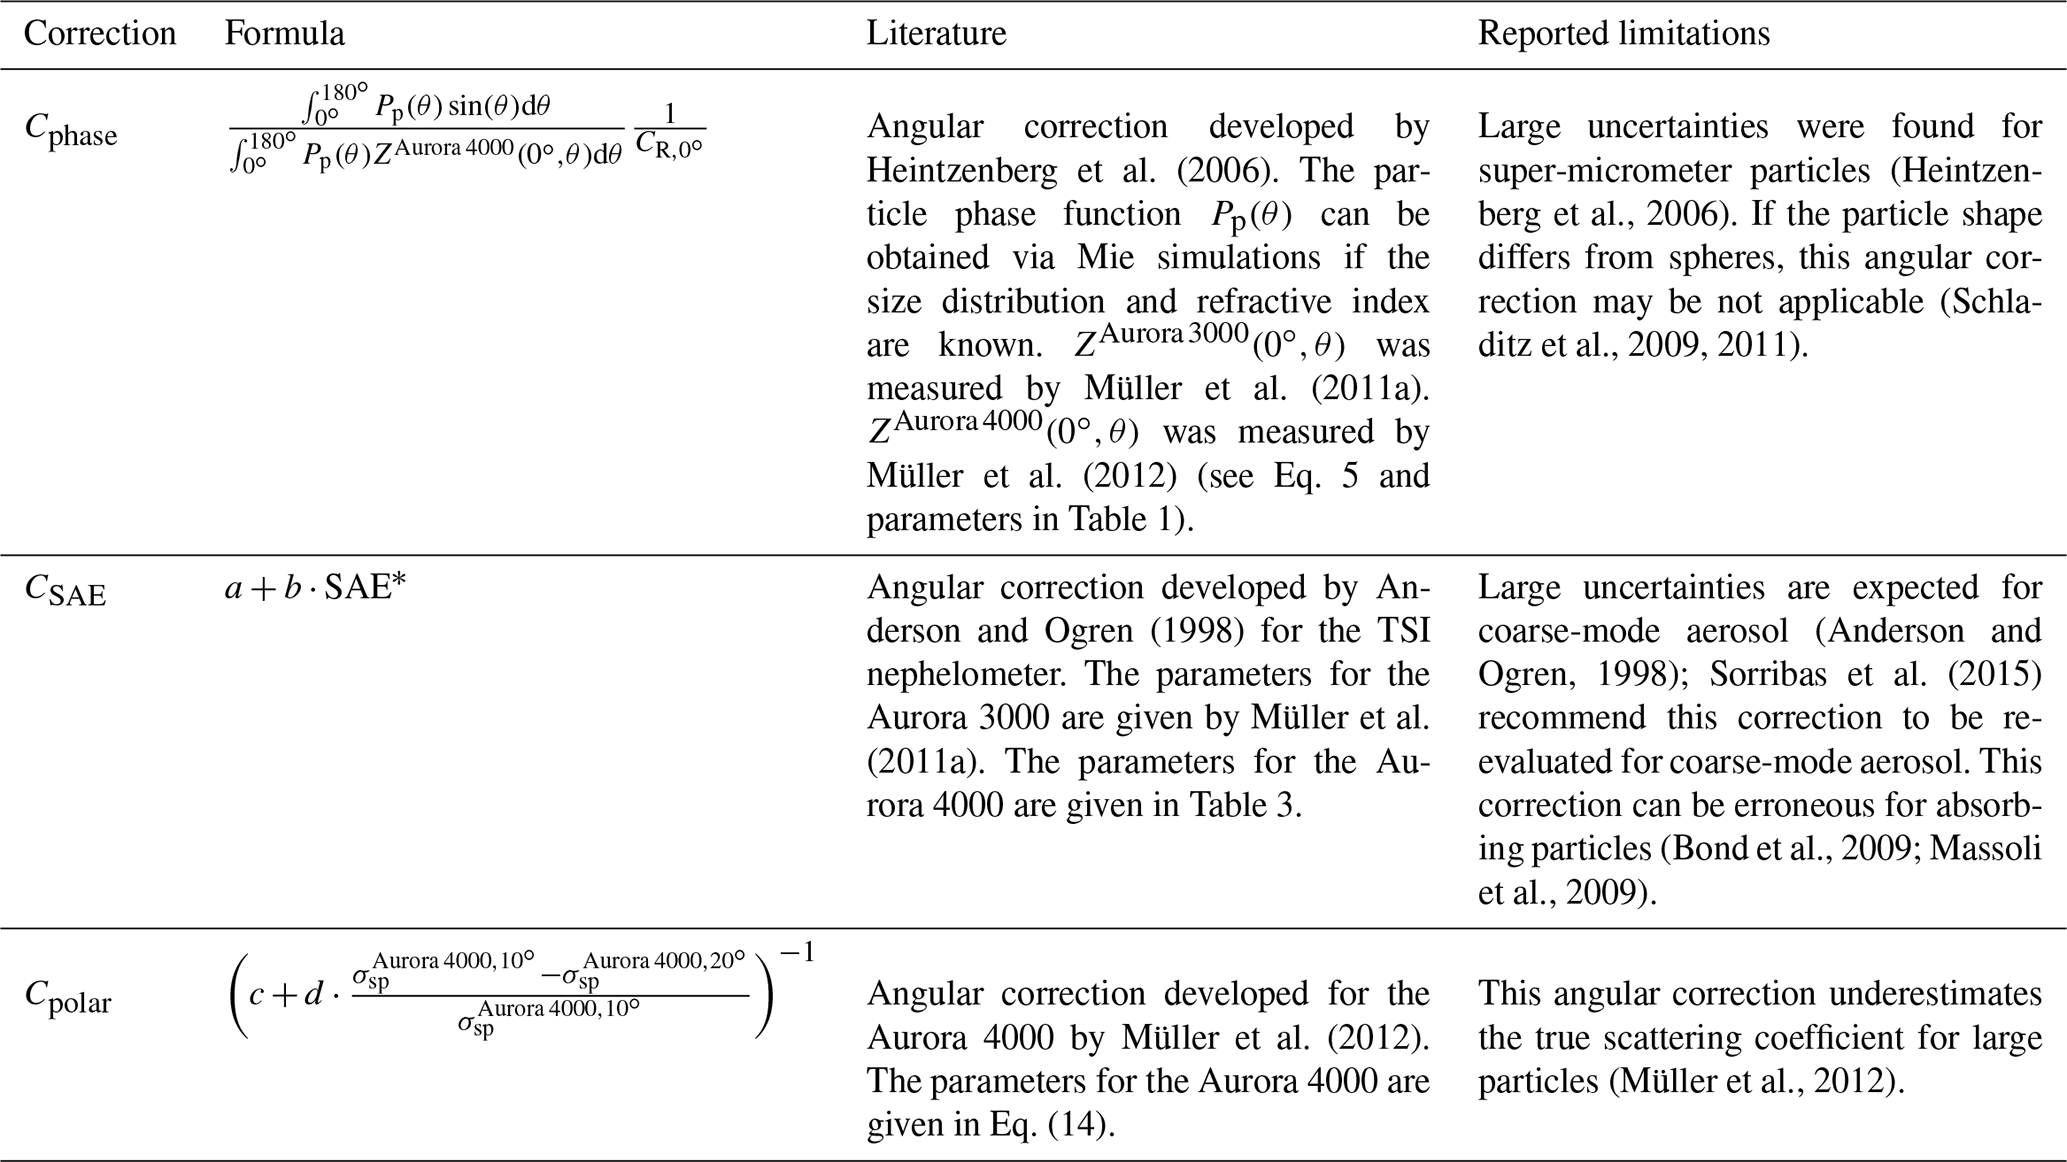
In this work, we focus on the angular correction , that is the angular correction to obtain the particle scattering coefficient from the particle scattering coefficient measured by the Aurora 4000 for shutter position , . Since larger particles scatter into the forward direction more than smaller particles, is size-dependent and increases with increasing particle size. This effect was originally reported by Heintzenberg and Quenzel (1973). Different methods have been proposed in the literature to calculate the angular correction . The angular correction can be calculated analytically using the definition (Eq. 10) if the angular distribution of scattering by particles, i.e., the particle phase function, is known. To highlight the importance of the particle phase function to apply this method, we refer to this angular correction as Cphase. Other methods of calculating the angular correction exploit the relationship between and quantities measured by the nephelometer. We consider an angular correction based on the wavelength dependence of the particle scattering coefficient, the scattering Ångström exponent, CSAE, and one based on the polar measurements of the particle scattering coefficient Cpolar. In the following sections, we describe each method and its limitations by reviewing the related literature, as also summarized in Table 2. To the best of our knowledge, there is currently no literature comparing these corrections and describing which correction works best.
3.2 Angular correction using the phase function: Cphase
The angular correction can be calculated on the basis of the definition Eq. (10) if the particle phase function Pp(θ) is available. Considering the definition of particle phase function () and writing explicitly the ideal and Aurora 4000 particle scattering coefficient (see Eqs. 6–9) with , the angular correction can be written as
where the second term takes into account the angular truncation and illumination error for Rayleigh scattering. Knowledge about the particle phase function is required to calculate the first term. The particle phase function for a given wavelength can be calculated via Mie theory if the particles are spherical and homogeneous with a known size distribution and refractive index. This method was proposed, e.g., by Heintzenberg et al. (2006). However, Schladitz et al. (2009) found high discrepancies between Mie-calculated and measured scattering coefficients for desert dust events and showed that the particle shape also needs to be considered in the case of non-spherical particles. As an alternative, the particle phase function can be measured directly using a non-integrating polar nephelometer, an instrument that uses a rotating arm to measure the angular scattering function with high angular resolution without performing the angular integration (e.g., Waldram, 1945; Horvath et al., 2018).
3.3 Angular correction using the scattering Ångström exponent: CSAE
A method to calculate the angular correction without additional measurements exploits the wavelength dependence of scattering expressed by the scattering Ångström exponent (SAE). If the particle scattering coefficient is measured at two wavelengths, λ1 and λ2, the scattering Ångström exponent can be obtained as
Anderson and Ogren (1998) found a linear relationship between the SAE and and proposed that the angular correction can be constrained using the SAE. The angular correction CSAE exploiting the SAE is given by
where SAE∗ is the scattering Ångström exponent calculated using uncorrected nephelometer measurement of σsp. Wavelength pairs are λB and λG for the angular correction at the blue wavelength (λB), λB and λR for the angular correction at the green wavelength (λG), and λG and λR for the angular correction at the red wavelength (λR). The parameters a and b are derived from Mie calculations of for ranges of particle sizes and refractive indices. The parameters a and b for the TSI nephelometer model 3563 are given by Anderson and Ogren (1998) and for the Ecotech Aurora 3000 nephelometer by Müller et al. (2011a). To apply this method to the Ecotech Aurora 4000 polar nephelometer, we calculated the parameters for the angular correction CSAE considering the angular sensitivity function measured by Müller et al. (2012). We used the same size distribution and refractive indices used by Anderson and Ogren (1998) and Müller et al. (2011a). The parameters are given in Table 3.
Table 3Angular corrections for Aurora 4000 for the total scattering coefficient as a function of the scattering Ångström exponent: . For correction of the scattering coefficients for the blue wavelength (λB), the scattering Ångström exponent calculated from uncorrected scattering coefficients of blue and green wavelengths (λB, λG) is used. At wavelength λG and λR, scattering Ångström exponents at the wavelength pairs (λB, λR) and (λG, λR) are used, respectively.
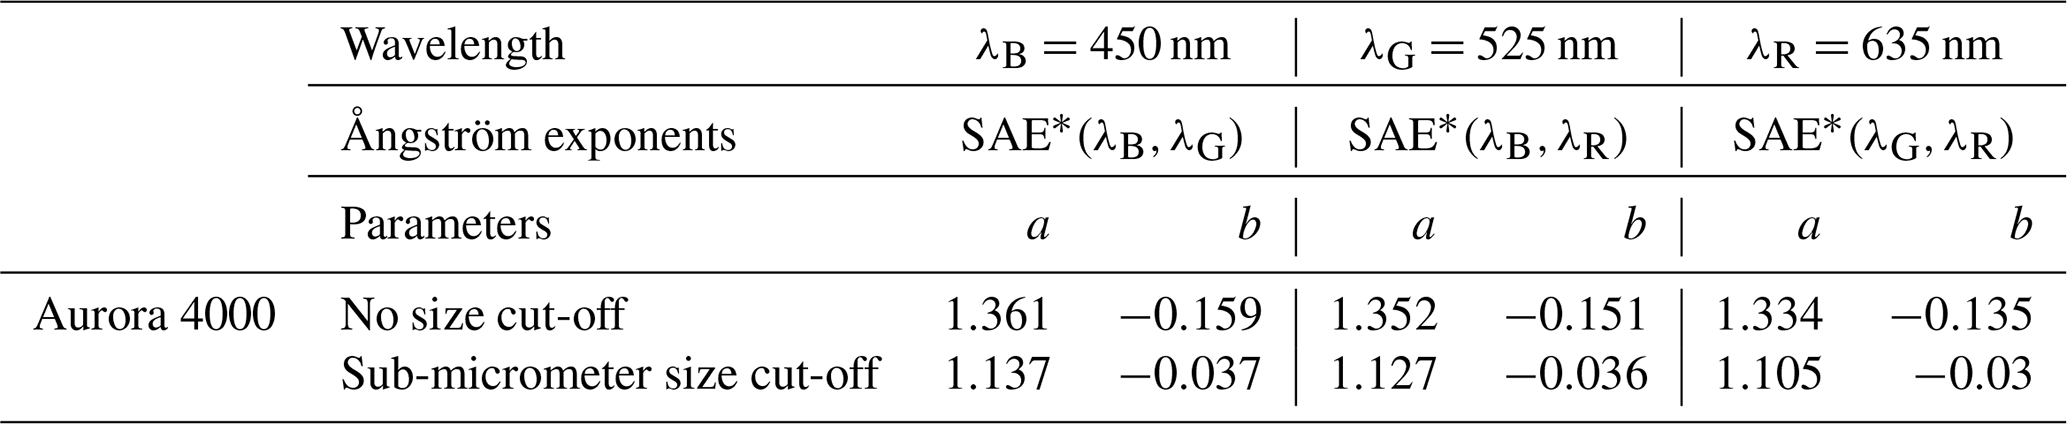
Calculations are limited to weakly absorbing particles with the imaginary part of the refractive index k in the range of 0.00–0.01. The real part of the refractive index n is in the range of 1.40–1.52. The size distributions are bimodal log-normal functions with a geometric standard deviation of 1.8 and a geometric volume median diameter in the range of 0.2–0.4 µm for the fine mode and 2.0–4.0 µm for the coarse mode. The fine-mode volume fraction varies between 0.1 and 0.9. Calculations are done considering either the complete size distribution (no size cut-off) or a sub-micrometer size cut-off, with an aerodynamic diameter smaller than 1 µm (0.77 µm for density ρ=1.7 g cm−3). This size segregation was introduced by Anderson and Ogren (1998). They point out that the angular correction is better constrained by the SAE when only sub-micrometer particles are measured, while larger uncertainties ∼ 23 % are expected when coarse-mode particles are also measured.
Further limitations of this method were found by Bond et al. (2009) theoretically and by Massoli et al. (2009) experimentally. They point out that the uncertainty of the angular correction CSAE increases for absorbing particles. Indeed, the wavelength dependence of the particle scattering coefficient is related to particle size only indirectly.
3.4 Angular correction using the polar measurements of the particle scattering coefficient: Cpolar
A new angular correction based on the specific feature of the Aurora 4000 that integrates the angular scattering function γ(θ) at many different angular sectors was developed by Müller et al. (2012).
In particular, the particle scattering coefficients for and are used to obtain the polar factor
The angular correction Cpolar is given by
The parameters were derived from scattering theory using both Mie and discrete dipole approximation codes. Calculations were done for different shapes: spheres, cubes and nested cubes, and three different kinds of dust shapes. The size parameter () ranges from 0.1 to 28. The imaginary part of the refractive index k is in the range of 0.00–0.1. The real part of refractive index n is in the range of 1.53–1.55. Via model simulations, Müller et al. (2012) showed that the angular correction Cpolar is more accurate than the angular correction CSAE for volume median diameters below 1 µm and for a large range of refractive indices and particle shapes, and that both corrections underestimate the particle scattering coefficient for particles larger than 1 µm.
4.1 Experimental methods
To test the different angular corrections for the Aurora 4000 polar nephelometer, we deploy several instruments to measure the optical and microphysical properties of laboratory-generated aerosol, both monodisperse and polydisperse. The experimental set-up is shown in Fig. 1. The Aurora 4000 polar nephelometer and a self-built polar nephelometer, hereafter referred to as Horvath's polar nephelometer (Horvath et al., 2018), were used to measure the particle scattering coefficients at λ=450, 525, and 635 nm and the particle phase function at λ=532 nm, respectively. Besides the particle scattering properties, the particle extinction coefficient at 530 nm was measured by a cavity attenuated phase shift monitor PMext (CAPS PMext, Aerodyne) and the particle absorption coefficient at 467, 528, and 652 nm by a tricolor absorption photometer (TAP, Brechtel). The particle number concentration was measured with a condensation particle counter (CPC 3772, TSI) and the particle size distribution with two optical particle spectrometers: the UHSAS (DMT) and the OPS 3330 (TSI), covering the nominal size range 0.06–1 and 0.3–10 µm, respectively. All instruments were connected to a stainless-steel chamber where the aerosol flow was mixed and diluted with particle-free dry air. Nearly monodisperse aerosols were generated using PSL particles of a nominal diameter in the range of 0.1–1.8 µm or ammonium sulfate in combination with a Vienna-type differential mobility analyzer (DMA) (Steiner et al., 2010), obtaining particle size distributions with a diameter in the range of 0.2–0.85 µm. Polydisperse aerosols were generated by blowing dry air through a hermetic glass bottle containing the sample powder. The bottle cap had two holes for the air inlet and outlet. A metal tube was placed from the inlet almost to the bottle bottom so that the blown air flowed horizontally to the surface where the sample powder was deposited. An electrical vibrating device was mounted outside the bottle and could be activated to mobilize the powder better. The samples included synthetic non-absorbing silica dust and soil samples collected from desert areas such as sediments from a plain near Tagounite (Morocco), river sediments at Tagounite (Morocco), sand from the Sahara desert, dust from Mauritania, and soil dust from Zagora (Morocco). Moreover, one sample of volcanic ash from Eyjafjallajökull (Iceland) was included.

Figure 1Scheme of the laboratory closure experiment set-up. Different aerosol types, such as monodisperse polystyrene latex (PSL) spheres, ammonium sulfate (AS), and polydisperse powder (mineral dust, silica dust, and volcanic ash), were generated using three different aerosol generation and size selection systems (in the upper left). The aerosol generation and size selection systems were connected via the aerosol inlet to a dilution chamber, where the aerosol flow is mixed with particle-free dry air. The dilution chamber was operated at a pressure slightly above ambient. Seven measurement instruments were connected to the dilution chamber to measure extinction, scattering, and absorption aerosol properties as well as particle number concentration and size distributions.
Measurements were repeated twice, with and without a cyclone for size-selective sampling, in order to achieve different size distributions. Although the nominal aerodynamic size cut-off of the cyclone was ∼ 1 µm, we could not attain the nominal airflow through the cyclone and the achieved dimensional cut-off was most probably larger than 1 µm. We measured volume median diameters in the range of 0.85–1.85 µm for measurements with the cyclone and in the range of 2.20–2.79 µm for measurements without the cyclone.
Before each measurement, the dilution chamber was filled in with particle-free dry air to remove any residual particles. Stable concentrations were required for at least 35 min due to the temporal resolution of Horvath's polar nephelometer. Moreover, concentrations corresponding to a particle extinction coefficient between 100 and 200 Mm−1 were preferred, since they are the CAPS PMext best condition of operation. At the beginning of each measurement, the flow was set to satisfy these requirements. However, these conditions were challenging to obtain, in particular for the mineral dust measurements. If an adjustment was required during one measurement, a manual bottle shaking was preferred rather than a flow adjustment to avoid changes in the size cut-off.
4.2 Data evaluation
The data evaluation of the laboratory experiment had the overall aim of investigating the uncertainty of the particle scattering coefficient measurements by testing different angular corrections. A summary of data evaluation from the raw data is provided in Fig. 2. The top line displays all instruments involved in the laboratory experiment. The descending arrows include all corrections performed to obtain the measured quantities of each instrument (indicated in yellow boxes). Black arrows indicate when data from an instrument are an input for the correction of a different instrument. The tested angular corrections are reported in red boxes. The angular corrections CSAE, based on the scattering Ångström exponent, and Cpolar, based on the polar measurements of the particle scattering coefficient, are obtained directly from the Aurora 4000 polar nephelometer measurements. The angular correction based on the phase function Cphase is calculated, on the one hand, considering the particle phase function measured by Horvath's polar nephelometer, from now on referred to as Cphase,H. On the other hand, this angular correction is calculated considering the particle phase function simulated using the size distribution measured by the two OPSs (DMT UHSAS and TSI OPS 3330), from now on referred to as Cphase,OPS. The four angular corrections CSAE, Cpolar, Cphase,H, and Cphase,OPS were tested comparing the corrected Aurora 4000 particle scattering coefficient with the difference of the particle extinction coefficient and the particle absorption coefficient. In addition, the particle size distributions measured by the two OPSs were used to simulate the Aurora 4000 scattering coefficients and to obtain the simulated angular corrections CSAE,OPS and Cpolar,OPS. The six angular corrections were compared to each other.
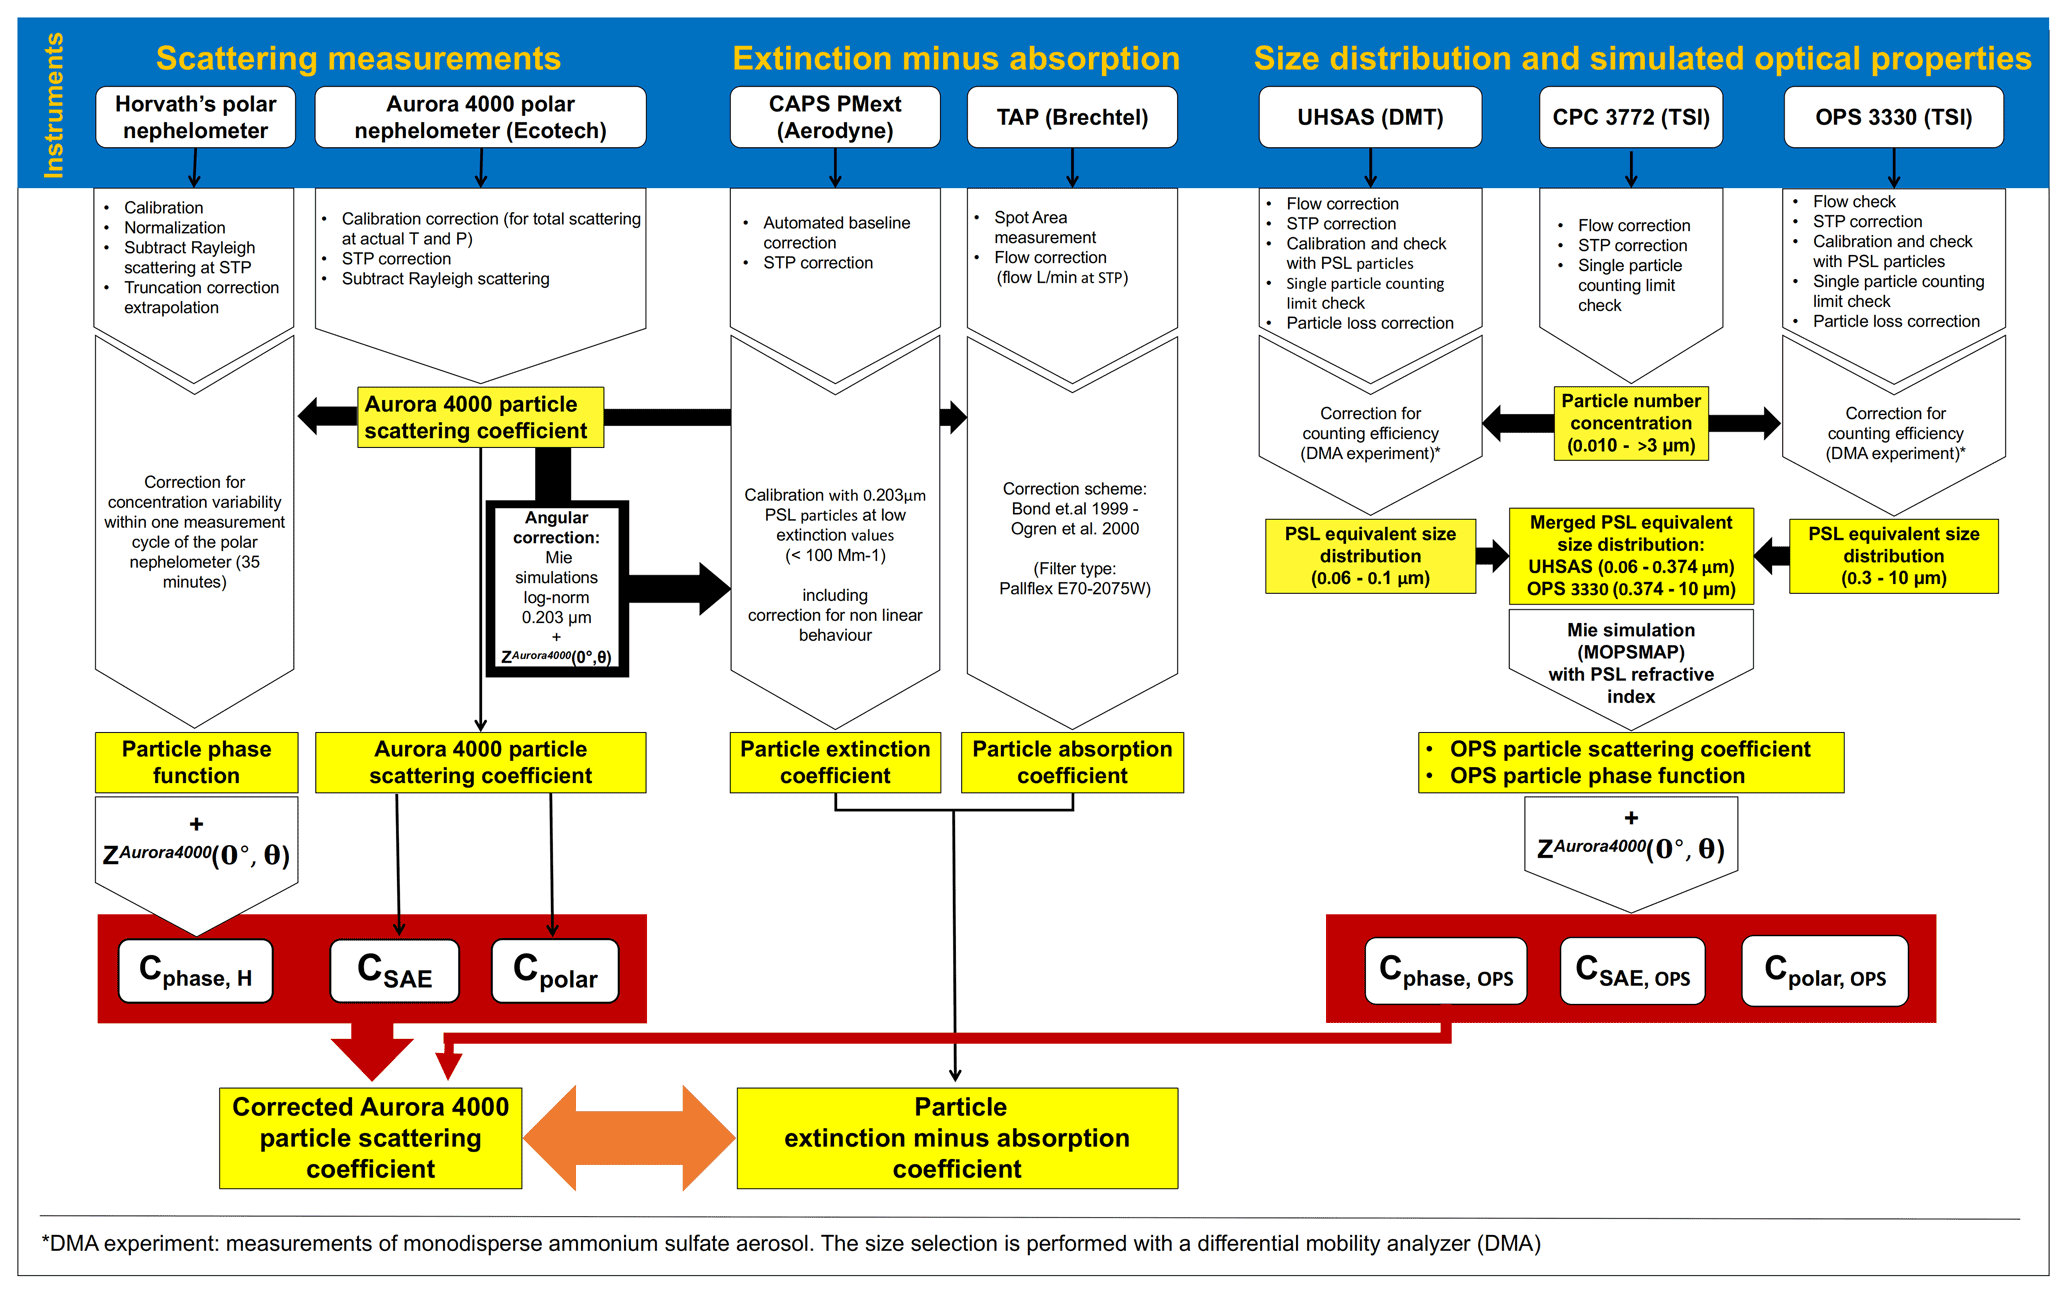
Figure 2Flow chart of the data evaluation for the laboratory closure experiment. All instruments involved in the laboratory closure experiment are on the top bar. The descending arrows illustrate the data elaboration to obtain from raw data the relevant quantities (in the yellow boxes) and the different angular corrections (in the red boxes). Thick black arrows indicate when data are used in the data processing of a different instrument.
The most important considerations of the data analysis of each instrument are summarized below. Further details of the data analysis are provided in the Supplement. All data were converted to standard temperature and pressure (STP: T0=273.15 K, P0=1013.25 hPa). The Aurora 4000 polar nephelometer was calibrated with particle-free air and CO2, following the procedure recommended by Anderson and Ogren (1998). A set of calibrations were performed, and the combined uncertainty due to calibration and noise for 1 min data was found to be about 8 %, while for the data averaged along with longer sequences, it is smaller than 3 %. The higher uncertainty for the 1 min data was due to the temporal resolution of about 30 s obtained by measuring the scattering coefficient for all the 18 available positions of the scatter shutter.
The particle extinction coefficient σep at λ=530 nm was measured by the CAPS PMext. Due to the high reliability and low uncertainties (±3 % according to Petzold et al., 2013, and Onasch et al., 2015) of the CAPS PMext, this instrument was considered to be the reference. It is not affected by angular truncation error, since it measures the phase shift of a square modulated signal after being reflected several times between two highly reflective mirrors placed at the extremes of the measurement chamber. The CAPS PMext was calibrated and corrected for non-linear behavior considering measurements of the Aurora 4000 particle scattering coefficient for 0.203 µm PSL particles. For this correction, the Aurora 4000 particle scattering coefficient was corrected for angular truncation and illumination correction. The angular correction was calculated with Mie simulations considering a log-normal size distribution (dg=203 nm, σg=1.026, as reported in Devon and Rudin, 1987). Besides a larger uncertainty, this calibration may introduce some compensation for the inaccuracy of the Aurora 4000 angular sensitivity function and therefore some circularity in our analysis. However, the calculated Aurora 4000 angular correction for this size is very small (1 %).
Since mineral dust is expected to absorb in the green and blue wavelengths, the particle absorption coefficient was measured by the TAP at three different wavelengths: blue (467 nm), green (528 nm), and red (652 nm). The particle absorption coefficients were corrected using the angular correction developed by Bond et al. (1999) and refined by Ogren (2010). The single scattering albedo (SSA) was calculated from the particle extinction coefficient measured by the CAPS PMext at λ=530 nm and the particle absorption coefficient measured by the TAP at λ=528 nm and resulted in the range 0.95–0.99 for mineral dust measurements, in agreement with literature values (Ansmann et al., 2011; Schladitz et al., 2009; Müller et al., 2011b; Petzold et al., 2011). The related uncertainty for SSA in the range of 0.95−0.99 and the raw (i.e., uncorrected) absorption coefficient > 3 Mm−1 is estimated to increase from 35 % to 100 % as SSA increases (Ogren et al., 2017). Even considering the highest uncertainty (∼ 100 %), this error hardly affects the difference between particle extinction coefficient and particle absorption coefficient because we measured only weakly absorbing aerosol with a low absorption coefficient. For all the measurements where some absorption is expected, the difference between particle extinction coefficient and particle absorption coefficient is regarded as the reference value for light scattering because it is the best we can get for weakly absorbing irregular particles in the coarse mode. If the aerosols are expected to be non-absorbing as for PSL particles, AS, and synthetic silica, the particle absorption coefficient is set to zero and the particle extinction coefficient measured by the CAPS PMext is set as a reference value.
The Horvath's polar nephelometer was deployed to measure the particle phase function Pp(θ) at λ=532 nm. Its detector is mounted on a rotating arm with an angular resolution of 5∘, which can be moved between 5 and 175∘, detecting the light scattered into its direction. A complete measurement cycle takes 35 min. Calibrations were performed with CO2 and particle-free air. The extrapolation procedure described in Horvath (2015) is used in order to extend the phase function to 0 and 180∘. The accuracy of the full integration of the phase function given by this procedure is 1 %. However, the particle phase function measured by Horvath's polar nephelometer has high uncertainty due to the low temporal resolution of the instrument and the highly variable concentration during mineral dust measurements. For compensation of the variable signal, Horvath's polar nephelometer signal at each measurement angle is divided by the 1 min average Aurora 4000 particle scattering coefficient at the green wavelength. Since is proportional to the particle concentration and the aerosol type does not change, the value obtained at each angle is proportional to the particle angular scattering function γp(θ). The particle phase function Pp(θ) is obtained by normalization. In the data set collected during this experiment, there are a few cases where the extrapolation procedure performed to extend the particle phase function to 0∘ leads to a decreasing phase function from 10 to 0∘. These results were considered unrealistic and excluded from further data analysis.
For each measurement, data were averaged along sequences with a constant number concentration or along the 35 min measurements of Horvath's polar nephelometer even if the number concentration is not constant. The result is not affected as long as the average is performed at the same time for all instrumentation. No significant variation in the scattering Ångström exponent SAE(λB,λR) was observed during the selected sequences. We considered all measured quantities at the green wavelength. Although the instruments involved have slightly different wavelengths (up to 7 nm difference), no wavelength correction has been considered.
The particle size distribution was obtained by merging the particle size distribution measured by the UHSAS in the range of 0.06–0.374 µm and the OPS 3330 in the range of 0.374–10 µm. The counting efficiency of the two instruments was estimated by comparing their particle number concentration with the particle number concentration given by the CPC in monodisperse ammonium sulfate aerosols. The accuracy of the CPC number concentration reported by the manufacturer is 10 %. The calibration of the two OPSs was performed with PSL particles. The calibration accuracy was found to be ±2.5 % for the UHSAS and ±5 % for the OPS 3330, in agreement with the estimate given by the manufacturer. The particle number concentration was mainly below the single-particle counting limits reported by the manufacturers of the three instruments. The particle loss in the tubes from the dilution chamber to the different instruments was estimated to be similar for all instruments except for the UHSAS and the OPS 3330, using the Particle Loss Calculator software (PLC, von der Weiden et al., 2009). A size-dependent correction factor was estimated and applied to the UHSAS and the OPS 3330 measurements. Further details are reported in the Supplement.
The particle size distribution was obtained assuming the PSL refractive index, e.g., the PSL-equivalent nominal diameter values for the bin boundaries provided by the manufacturer. The PSL equivalent size distribution was used to calculate the OPS particle scattering coefficient and the OPS particle phase function via optical simulations. The optical simulations were performed with the program MOPSMAP (Gasteiger and Wiegner, 2018), using the option to give the binned size data directly as input. We considered spherical shapes only (Mie code) and the refractive index of PSL particles was used, i.e., at λ=450 nm, at λ=525 nm, and at λ=635 nm taken from Devon and Rudin (1987). This choice was done to be consistent with the particle size distribution used as input where the PSL particle refractive index was assumed. To estimate the uncertainty of the simulated optical properties, the simulations were repeated 1000 times modifying randomly the number concentration and the bin diameters of the input data. More detailed information is provided in the Supplement.
4.3 Results of the laboratory closure experiment
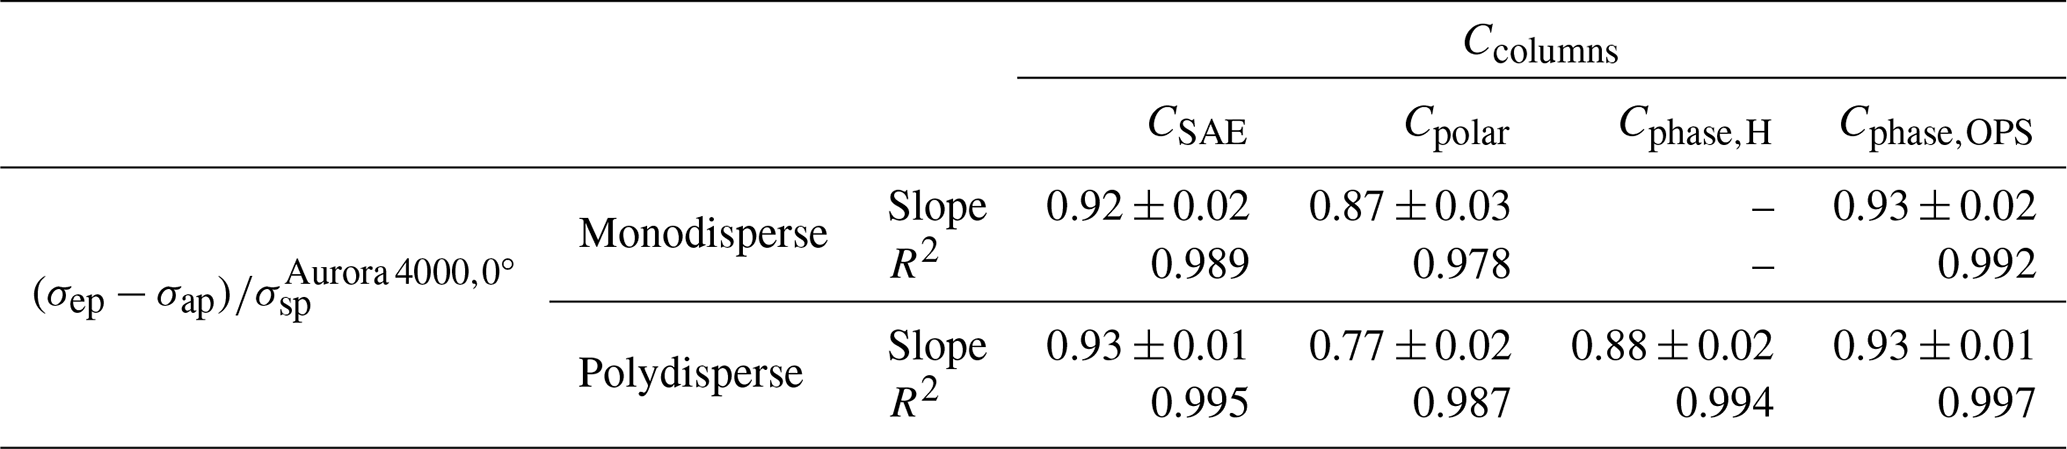
The four angular corrections CSAE, Cpolar, Cphase,H, and Cphase,OPS were tested by applying each of them to the Aurora 4000 particle scattering coefficient at λG=525 nm, called corrected , and comparing them to the difference between the particle extinction coefficient and the particle absorption coefficient (σep−σap), where σep and σap were measured by a CAPS PMext at λ=530 nm and by a TAP at λ=528 nm, respectively. σep−σap represents the reference value for the particle scattering coefficient as discussed in Sect. 4.1. The ratios of corrected to (σep−σap) as a function of the PSL equivalent volume median diameter (PSL eq. VMD) are shown in Fig. 3. Each row of Fig. 3 (e.g., a–b, c–d, e–f, or g–h) shows results for a different angular correction. The results for monodisperse aerosols (PSL and AS) are shown in the panels on the left (Fig. 3a, c, e, g), and the results for polydisperse aerosols (mineral dust, silica dust, and volcanic ash) in the panels on the right (Fig. 3b, d, f, h). Results of a correlation analysis for each angular correction are reported in Table 4. The slope of linear regression through the origin and the coefficient of determination were calculated for each angular correction vs. , which represents the reference angular correction. The slopes represent the average deviation from 1 of the ratio between the corrected and the reference particle scattering coefficient. Further details for each correction are described in the following sections.

Figure 3Result of the laboratory experiment for each angular correction. Ratio of the Aurora 4000 particle scattering coefficient corrected for angular truncation and illumination error (corrected ) and the difference between the particle extinction coefficient and the particle absorption coefficient (σep−σap) vs. the measured PSL equivalent volume median diameter. Each panel row shows the results for the corrected with a different angular correction: (a, b) for the angular correction CSAE; (c, d) for the angular correction Cpolar; (e, f) for the angular correction Cphase,H; (g, h) for the angular correction Cphase,OPS. Monodisperse aerosol measurements are reported in the panels on the left (a, c, e, g); polydisperse aerosol measurements are reported in the panels on the right (b, d, f, h). Error bars represent the 95 % confidence interval. Different symbols refer to different aerosol types.
Table 4Results of the regression analysis ( and the coefficient of determination R2) of each angular correction in the table columns Ccolumns and the ratio between the reference particle scattering coefficient vs. the Aurora 4000 particle scattering coefficient, .
4.3.1 Results for the angular correction CSAE
The angular correction CSAE (Eq. 13), using the scattering Ångström exponent, was calculated with the parameters in Table 3. For the monodisperse aerosol measurement, we used the parameters for sub-micrometer size cut-off in the case of nominal d<1 µm and the one for no size cut-off in the case of nominal d>1 µm. For polydisperse aerosol measurements, we used the parameters for no size cut-off.
The corrected with the angular correction CSAE agrees with σep−σap within ±15 % for most of the measurements (Fig. 3a, b). In particular, the agreement is excellent for polydisperse measurement with a volume median diameter smaller than 2 µm, with almost all values of the ratio between corrected and (σep−σap) equal to 1 within the expected uncertainties (Fig. 3b). For a larger volume median diameter, the angular correction CSAE leads to an underestimation of σep−σap by up to 15 %, showing a slightly size-dependent performance. For monodisperse aerosol larger than 1 µm, the corrected underestimates σep−σap by about 20 % (Fig. 3b). Results from the linear regression analysis show that the angular correction CSAE underestimates the reference angular correction on average by 8 % for the monodisperse aerosol measurements and by 7 % for the polydisperse aerosol measurements (Table 4).
4.3.2 Results for the angular correction Cpolar
The angular correction Cpolar (Eq. 14), using the polar measurements of the Aurora 4000 particle scattering coefficients, shows a performance that strongly depends on particle size for both monodisperse and polydisperse aerosol. The agreement between corrected and (σep−σap) is within ±10 % for small sizes (PSL eq. VMD <600 nm). Conversely, for larger sizes the corrected underestimates (σep−σap) by up to 40 % (Fig. 3c, d). Results from the linear regression analysis show that the angular correction Cpolar underestimates the reference angular correction on average by 13 % for the monodisperse aerosol measurements and by 23 % for the polydisperse aerosol measurements (Table 4).
4.3.3 Results for the angular correction Cphase,H
The angular correction Cphase,H, using the phase function measured by Horvath's polar nephelometer, shows a performance that does not depend on particle size but generally underestimates (σep−σap). The corrected is in agreement with (σep−σap) for only a few measurements, while it underestimates (σep−σap) by 23 % in the worst case (Fig. 3e, f). Results from the linear regression analysis show that the angular correction Cphase,H underestimates the reference angular correction on average by 12 % for the polydisperse aerosol measurements (Table 4).
4.3.4 Results for the angular correction Cphase,OPS
The angular correction Cphase,OPS, using the particle phase function simulated considering the UHSAS and OPS PSL equivalent size distributions, shows a performance that does not depend on particle size. The corrected agrees within ±20 % with (σep−σap) for all sizes and aerosol types. In particular, the agreement for the large size (VMD > 2 µm) of the polydisperse aerosol measurement is within ±10 % (Fig. 3g, h). Results from the linear regression analysis show that the angular correction Cphase,OPS underestimates the reference angular correction on average by 7 % for both the monodisperse and the polydisperse aerosol measurements (Table 4).
4.3.5 Results of the comparison among different angular corrections
To compare different angular corrections, we performed a correlation analysis among all the considered angular corrections. The slopes of linear regression through the origin and coefficients of determination obtained are reported in Table 5 for monodisperse aerosols and in Table 6 for polydisperse aerosols. In Tables 5 and 6, results highlighted in bold indicate an agreement within ±3 %.
Table 5Monodisperse aerosol: PSL and AS. Results of the regression analysis ( and coefficient of determination R2) of each angular correction reported in the table rows Crows vs. each angular correction reported in the table columns Ccolumns. Results within ±3 % are highlighted in bold.
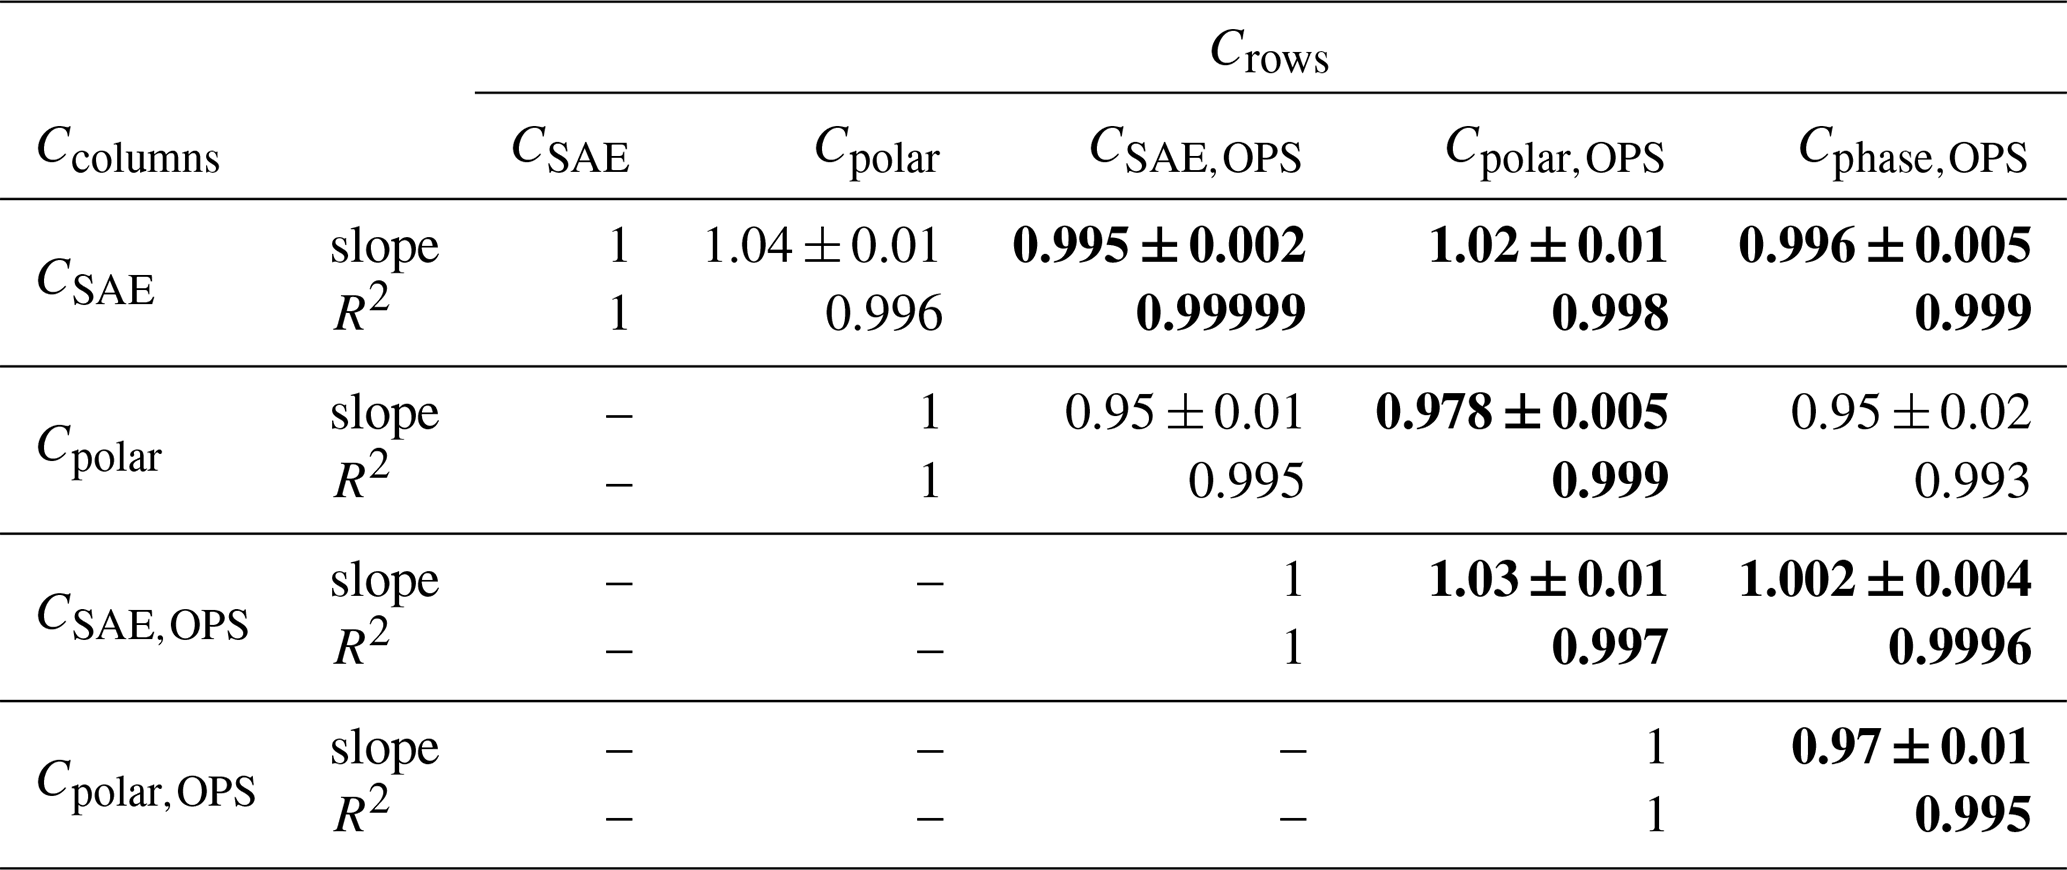
Table 6Polydisperse aerosol: mineral dust, silica dust, and volcanic ash. Results of the regression analysis ( and coefficient of determination R2) of each angular correction reported in the table rows Crows vs. each angular correction reported in the table columns Ccolumns. Results within ±3 % are highlighted in bold.
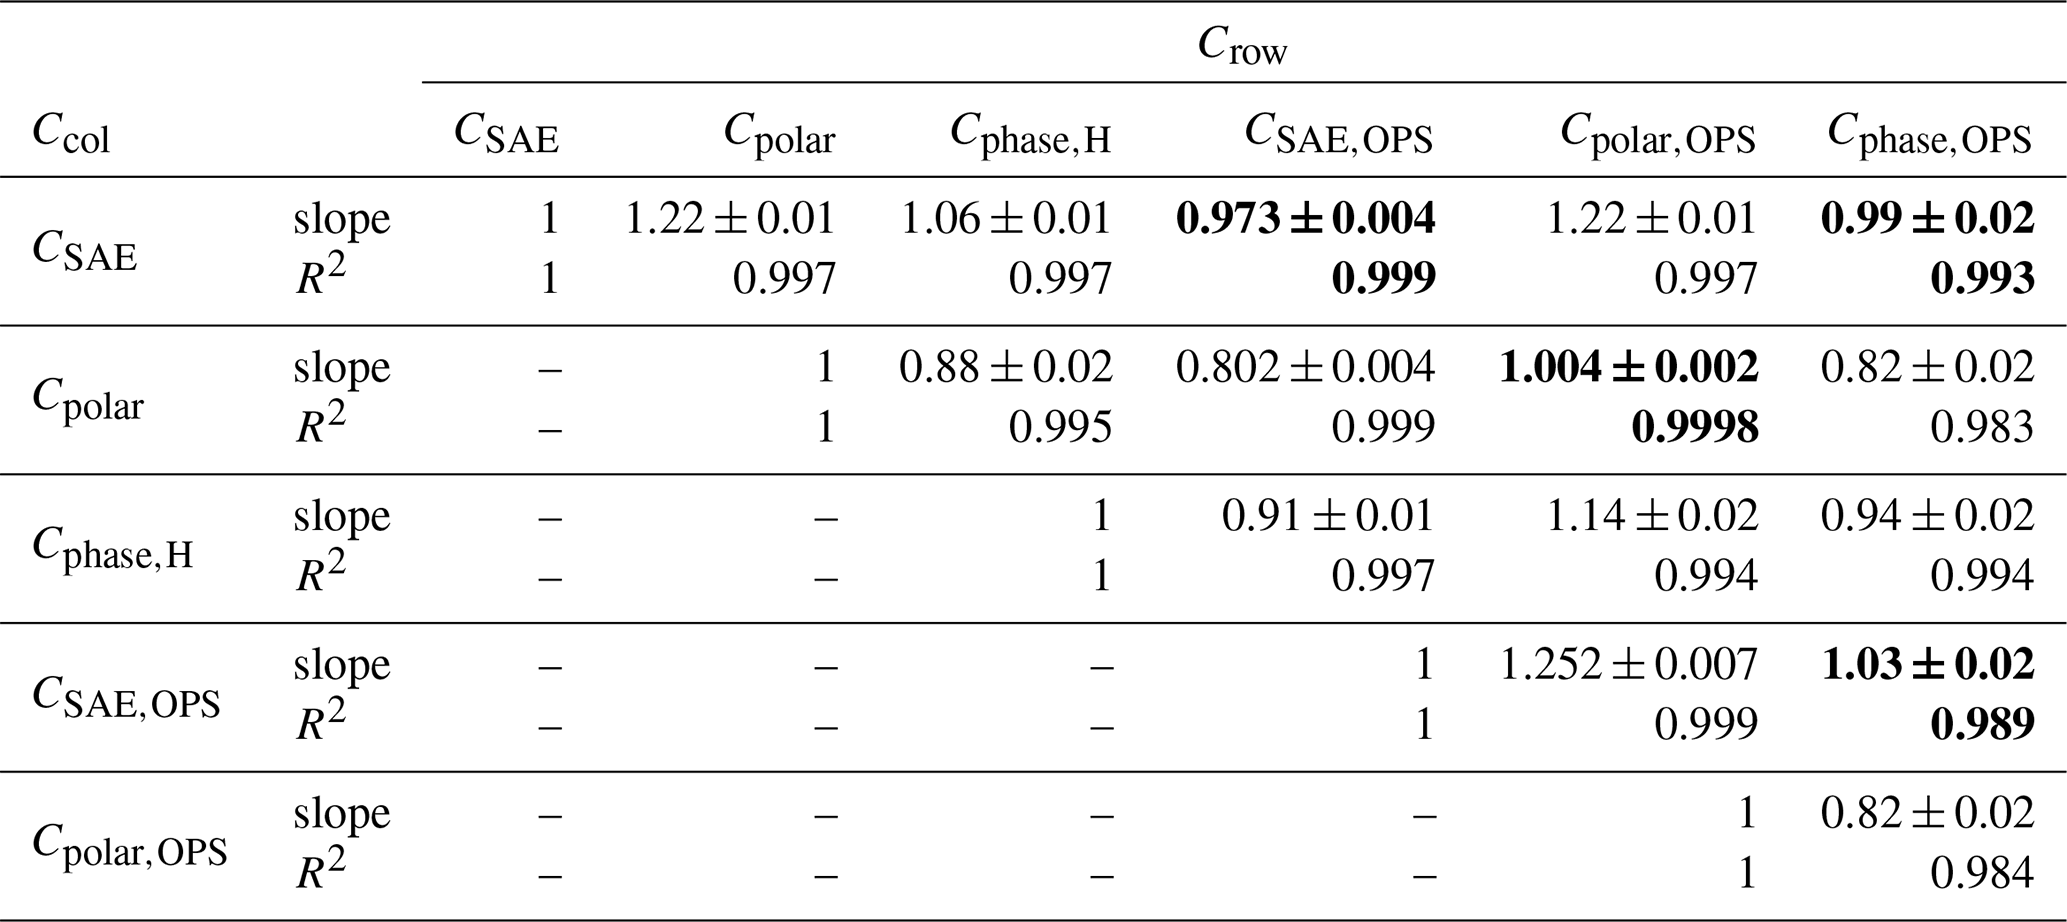
The angular corrections CSAE and Cpolar agree within ±3 % with the corresponding OPS-simulated angular corrections, called CSAE,OPS and Cpolar,OPS (see Fig. 2 and related text in Sect. 4.1), both for the monodisperse and polydisperse cases. The angular correction Cphase,OPS agrees within ±3 % with CSAE, CSAE,OPS, and Cpolar,OPS for the monodisperse aerosol measurements and with CSAE and CSAE,OPS for the polydisperse aerosol measurements.
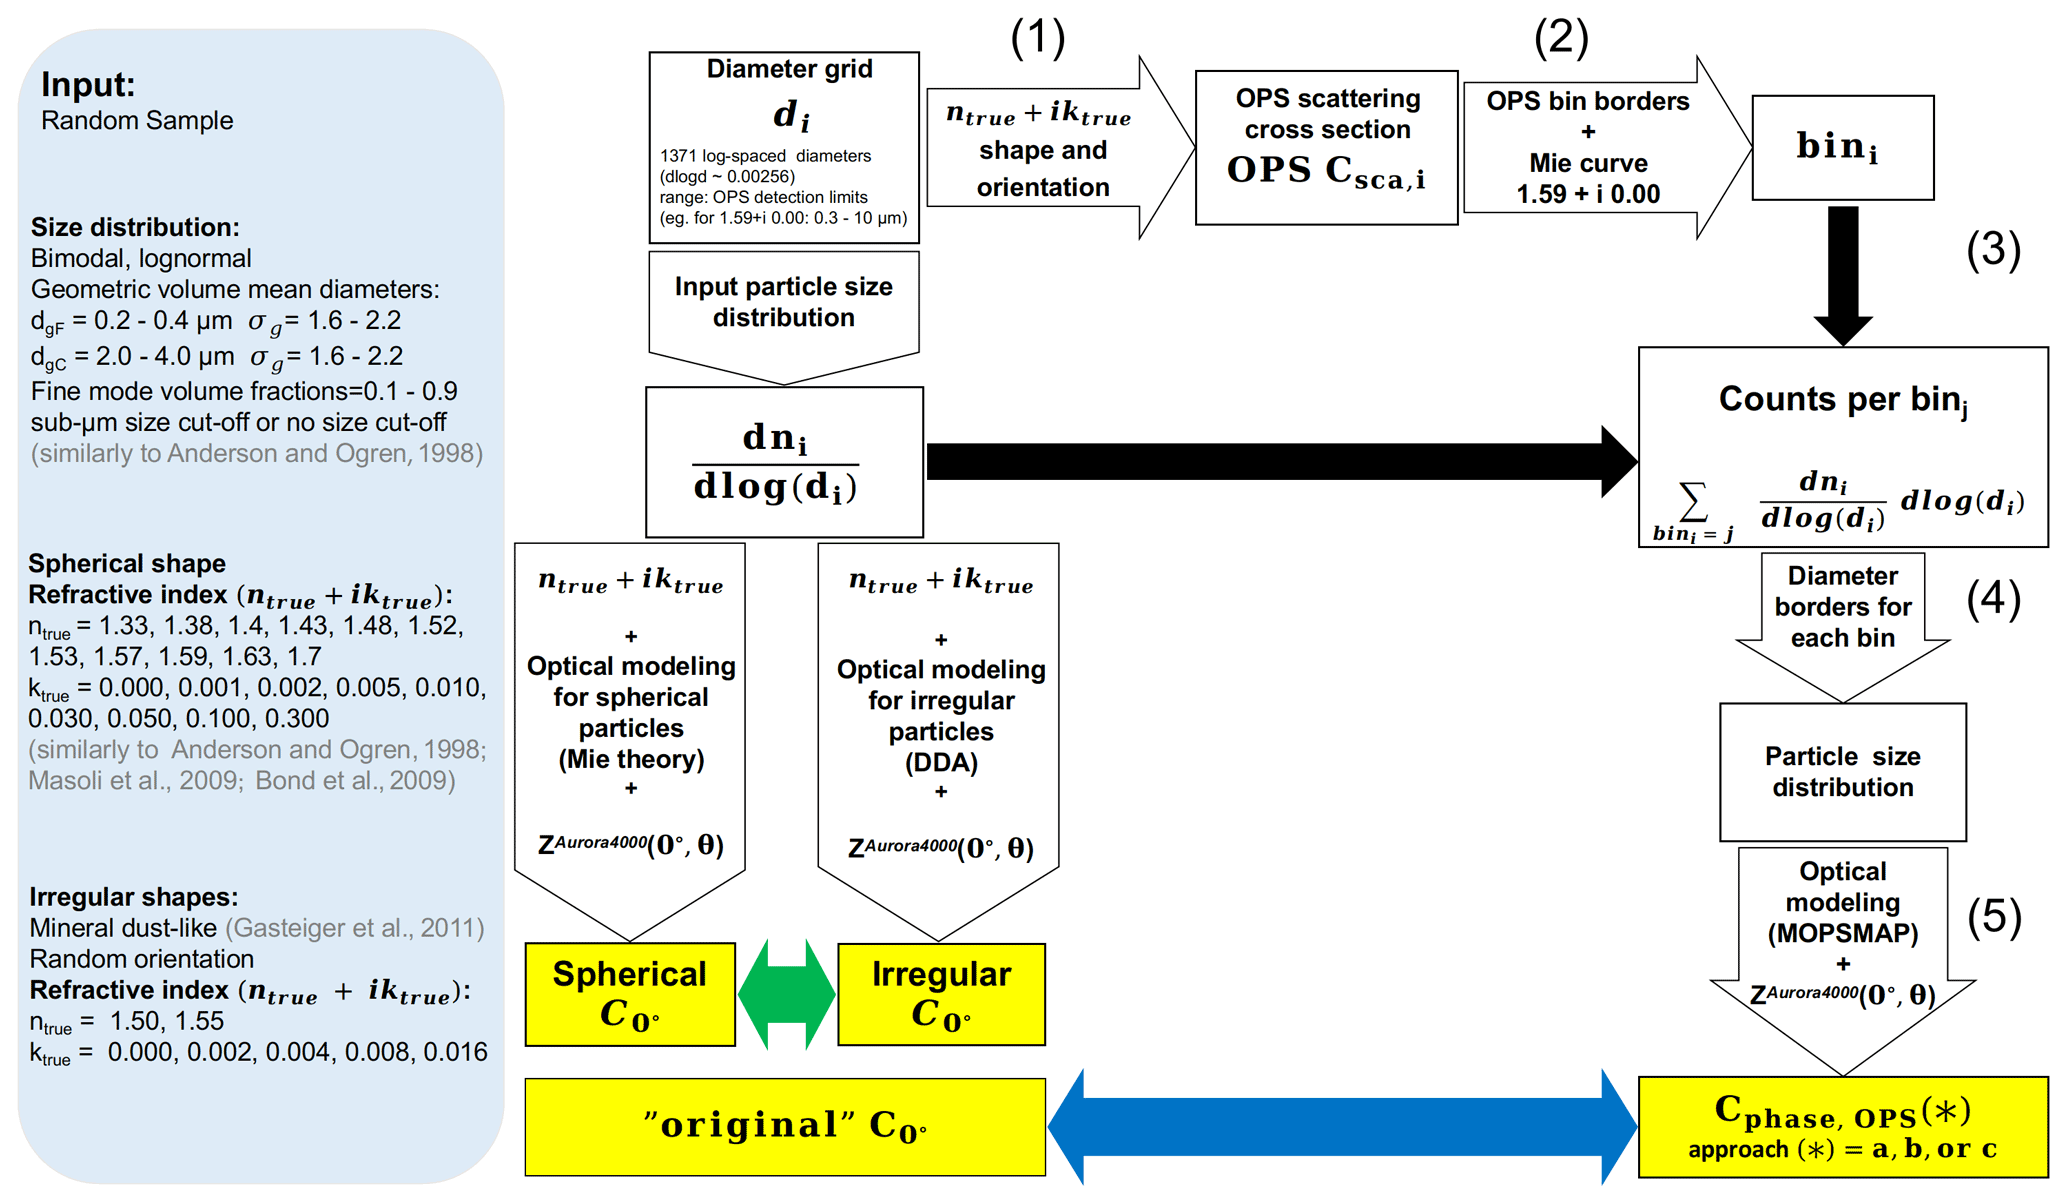
Figure 4Flow chart for the simulated closure experiment. The input parameters are selected randomly among the values indicated in the left box. The “original” angular correction is calculated directly on a given diameter grid for the input size distributions and refractive indices (left side of the flow chart), for homogeneous spherical particles with Mie calculations (spherical ), and for irregular particles with discrete dipole approximation (irregular ). To simulate the angular correction Cphase,OPS corresponding to each original considered, the steps 1–5 are performed. Different approaches to run the five steps are possible.
The angular correction Cphase,H, obtained with the phase function measured with Horvath's polar nephelometer, agrees within 6 % with the angular correction Cphase,OPS, obtained from the OPS-simulated phase function for the polydisperse measurements.
In the case of the polydisperse aerosol measurements, the agreement within ±3 % between each angular correction and the corresponding OPS-simulated angular correction is surprisingly good. First, the refractive index of the calibration material was assumed in the size distribution retrieval. Second, we did not consider any irregular shape effect, even if our polydisperse aerosols are irregularly shaped. Based on previous closure experiments (Schladitz et al., 2009, 2011), we did not expect to achieve good agreement using Mie theory for irregularly shaped particles. This result leads us to the following questions: what is the impact of particle shape on the nephelometer angular truncation and illumination error? What is the impact of different refractive indices and shapes on the angular correction Cphase,OPS derived from the size distribution measured by an OPS? What is the effect of different possible approaches (e.g., assuming different refractive indices) to obtain the OPS size distribution and the simulated angular correction Cphase,OPS? To answer these questions and interpret the laboratory experiment results, we performed an extensive modeling effort simulating the TSI OPS 3330 response for several particle types.
5.1 Simulation methods
We conducted a simulated closure experiment to answer the questions raised by the laboratory experiment result, in particular concerning the effect of particle shape on the determination of the particle scattering coefficient. We estimated the effect of the particle shape on the “original” angular correction (see Eq. 10 with ) and on the two methods to calculate the angular correction that showed the best results for mineral dust aerosol during the laboratory experiment: the CSAE and Cphase,OPS. The overall goal of these simulations is to estimate the effect of the different approaches on the angular correction Cphase,OPS, e.g., assuming different refractive indices for the particle size distribution retrieval.
The flow chart for this simulated closure experiment is represented in Fig. 4. Several size distributions and refractive indices were selected randomly among values indicated in the left box of Fig. 4. The original angular correction was calculated directly on a given diameter grid for the input particle size distributions, refractive indices, and shapes. For homogeneous spherical particles, we hereafter will call it spherical and for irregular particles irregular . The irregular was compared with the spherical obtained for volume-equivalent spheres with the same particle size distribution and refractive index (green arrow, Fig. 4). The response of the TSI OPS 3330 and the angular correction Cphase,OPS for the selected particle size distributions and particle types were simulated (step 1–5 in Fig. 4). The angular corrections Cphase,OPS obtained with different approaches were compared with the original angular correction obtained for the same aerosol types (blue arrow, Fig. 4). We performed the same comparison for the angular correction CSAE.
We selected 5000 random samples with particle size distributions and refractive indices similar to previous studies on the nephelometer angular correction (Anderson and Ogren, 1998; Müller et al., 2011a; Bond et al., 2009; Massoli et al., 2009). The particle size distributions were bimodal log-normal with the geometric volume mean diameter varying in the range of 0.2–0.4 µm for the fine mode and in the range of 2.0–4.0 µm for the coarse mode. The geometric standard deviation varied in the range of 1.6–2.2. Fine-mode volume fraction varied in the range of 0.1–0.9. Half of the simulations were performed with sub-micrometer size cut-off, half of them with no size cut-off. The real part of the refractive index varied in the range of 1.33–1.70 and the imaginary part in the range of 0.0–0.3. Calculations were performed for homogeneous spherical particles using the miepython module (Prahl, 2020), developed by Scott Prahl and based on Wiscombe (1980).
Additionally, we selected 1000 random samples with refractive indices similar to mineral dust aerosol (e.g., Di Biagio et al., 2019): the real part of the refractive index was chosen between 1.50 and 1.55, and the imaginary part was selected in the range of 0.000–0.016. The calculations for these samples were repeated twice for homogeneous spherical particles and for irregular shapes selected among mineral dust shapes from Gasteiger et al. (2011) and using the discrete dipole approximation code (ADDA, Yurkin and Hoekstra, 2011).
The selected values of the refractive index for each case are referred to hereafter in the text as well as in Fig. 4 as the “true” refractive index (ntrue+iktrue).
Calculations were performed on a diameter grid with size range corresponding to the TSI OPS detection limits. The OPS diameter detection limits corresponding to each ntrue+iktrue were calculated via Mie theory considering the manufacturer-provided diameter detection limits of 0.3–10 µm for homogeneous spherical particles with a refractive index 1.59+i0.00. In the case of irregularly shaped particles, the ADDA calculations were limited up to a volume-equivalent diameter of 5.8 µm.
Although particles smaller than 0.3 µm are still relevant for the calculation of the angular correction, here we limited the calculations to the OPS size range because we would like to assess the impact of the assumptions of refractive index and shapes in calculating the angular correction from the size distribution measured by an OPS. Considering a size range of 0.06–10 µm and combining the size distribution of UHSAS and OPS 3330, we obtained similar results, but we did not report these results here.
For each randomly sampled set of particle size distribution, refractive index, and shape, the response of the TSI OPS 3330 was simulated (step 1–2–3, Fig. 4). An optical particle spectrometer, such as the TSI OPS 3330, measures the scattering cross section (OPS Csca) by collecting the light scattered in the angular range 30–150∘ with a mirror. We simulated the OPS Csca,i for each diameter of the grid di (step 1, Fig. 4), using a (custom) Mie code based on Bohren and Huffman (2008) for homogeneous spherical particles and the ADDA code from Yurkin and Hoekstra (2011) for the mineral-dust-like shapes from Gasteiger et al. (2011). In the latter, the orientations and shapes were selected randomly for each di. Each simulated OPS Csca was sorted into the corresponding OPS bin (step 2, Fig. 4). In order to perform this step, we had to convert the manufacturer-provided diameter bin boundaries for the calibration material () into scattering cross-section bin boundaries. The randomly sampled size distribution was considered only in the following step, to reduce the computational time (step 3, Fig. 4). As a result, we obtained the counts for each of the 16 bins of the TSI OPS 3330. Based on this simulated OPS histogram, we used three different approaches to calculate the particle size distribution (step 4, Fig. 4) and the angular correction Cphase,OPS (step 5, Fig. 4).
- Approach a:
-
The particle size distribution was obtained (step 4, Fig. 4) with the manufacturer-provided PSL-equivalent nominal diameter values for the bin boundaries. The angular correction Cphase,OPS was calculated (step 5, Fig. 4) via Mie theory with the refractive index of the calibration material, i.e., the refractive index of PSL particles (1.59+i0.00).
- Approach b:
-
The particle size distribution was obtained (step 4, Fig. 4) with the manufacturer-provided PSL-equivalent nominal diameter values for the bin boundaries. The angular correction Cphase,OPS was calculated (step 5, Fig. 4) via Mie theory with the true refractive index, i.e., the randomly selected refractive index used as a input.
- Approach c:
-
The particle size distribution was obtained (step 4, Fig. 4) with diameter values of the bin boundaries calculated through an inversion procedure. As a refractive index, we assumed the true refractive, i.e., the randomly selected refractive index used as a input. The angular correction Cphase,OPS was calculated (step 5, Fig. 4) via Mie theory with the true refractive index.
In addition, we calculated the angular correction CSAE for the same size distributions and aerosol types. For the calculation of the correction CSAE the parameters obtained with sub-micrometer size cut-off or with no size cut-off are used in the corresponding case.
Further details of the method used for this sensitivity study are described in the Supplement.
5.2 Results of the simulated closure experiment
5.2.1 Non-sphericity effect on the angular correction
To estimate the effect of the particle shape on the nephelometer angular correction, we compared the angular correction for randomly oriented mineral-dust-like irregular particles with the angular correction obtained for the volume-equivalent spheres with the same size distribution and refractive index (green arrow, Fig. 4). In the case of size distribution with sub-micrometer cut-off, the angular correction obtained with Mie simulation (i.e., for spherical particles) underestimates the angular correction for irregular particles by 1 % on average as shown in Fig. 5a. In the case of size distribution with no cut-off, the angular correction obtained with Mie simulation (e.g., for spherical particles) underestimates the angular correction on average by 2 % and up to 3.5 %, as shown in Fig. 5b. These results indicate that the effect of the non-spherical shape contributes to an uncertainty on the angular correction smaller than 3.5 %.
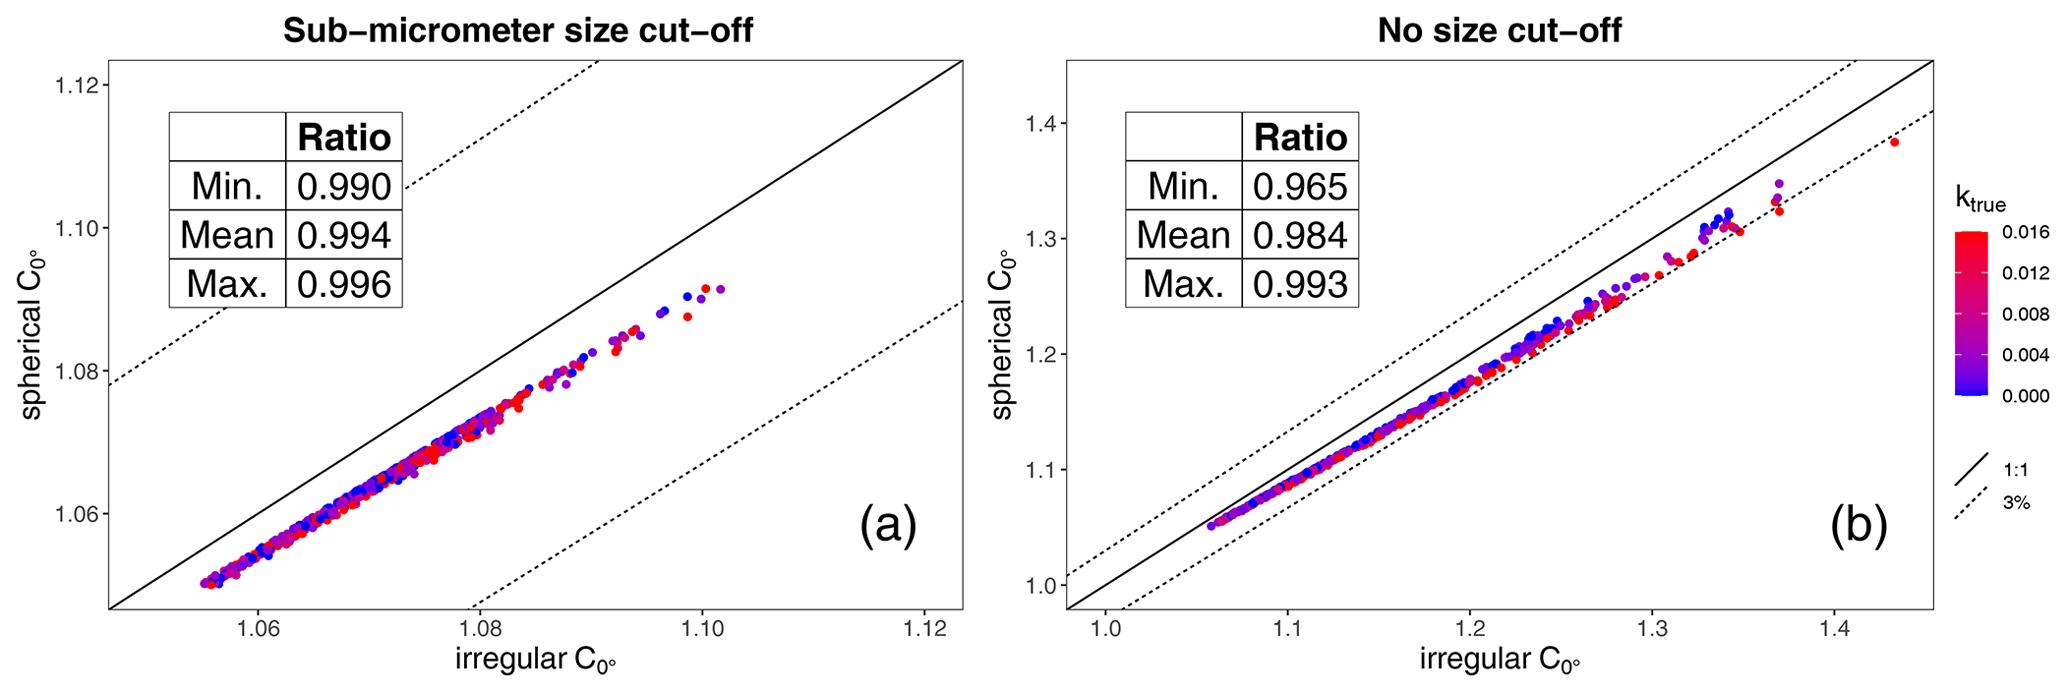
Figure 5Comparison between the angular correction for irregular particles and for spherical particles. Calculations are performed for λ=525 nm and on a diameter range of 0.06–5.8 µm. Panel (a) shows the comparison for particle size distributions with sub-micrometer size cut-off. Panel (b) shows the comparison for particle size distributions with no size cut-off. The color indicates the imaginary part of the refractive index used in the simulations ktrue. The solid line is the 1 : 1 line. The dashed lines are the ±3 % lines. The minimum, mean, and maximum value of the ratio between spherical and irregular is reported in the table.
5.2.2 Results of the different approaches to calculate Cphase,OPS
The Cphase,OPS calculated using the three different approaches (a, b, c; Sect. 5.1) were compared with the original angular correction calculated on the input size distribution considering the true refractive index and shape. For input particles with a spherical shape, the comparison is done with the Mie-calculated spherical ; for input particles with irregular shape the comparison is done with the ADDA calculated irregular (blue arrow, Fig. 4). The results of this comparison are summarized in Fig. 6 for the size distribution with sub-micrometer size cut-off and in Fig. 7 for the size distribution with no size cut-off. In each column, the comparison for an angular correction Cphase,OPS calculated with one of the three different approaches (see Sect. 5.1) or for the angular correction CSAE is shown. The six panel rows of Figs. 6 and 7 report results for six aerosol categories:
-
non-absorbing spherical particles, with ntrue=1.59;
-
non-absorbing spherical particles, with ntrue=1.33–1.70;
-
weakly absorbing spherical particles with ntrue=1.33–1.70 and ktrue=0.001–0.010;
-
absorbing spherical particles with ntrue=1.33–1.70 and ktrue=0.030–0.300;
-
weakly absorbing spherical particles with mineral-dust-like refractive index ntrue=1.50–1.55 and ktrue=0.000–0.016;
-
weakly absorbing irregular particles with mineral-dust-like shape and refractive index ntrue=1.50–1.55 and ktrue=0.000–0.016.
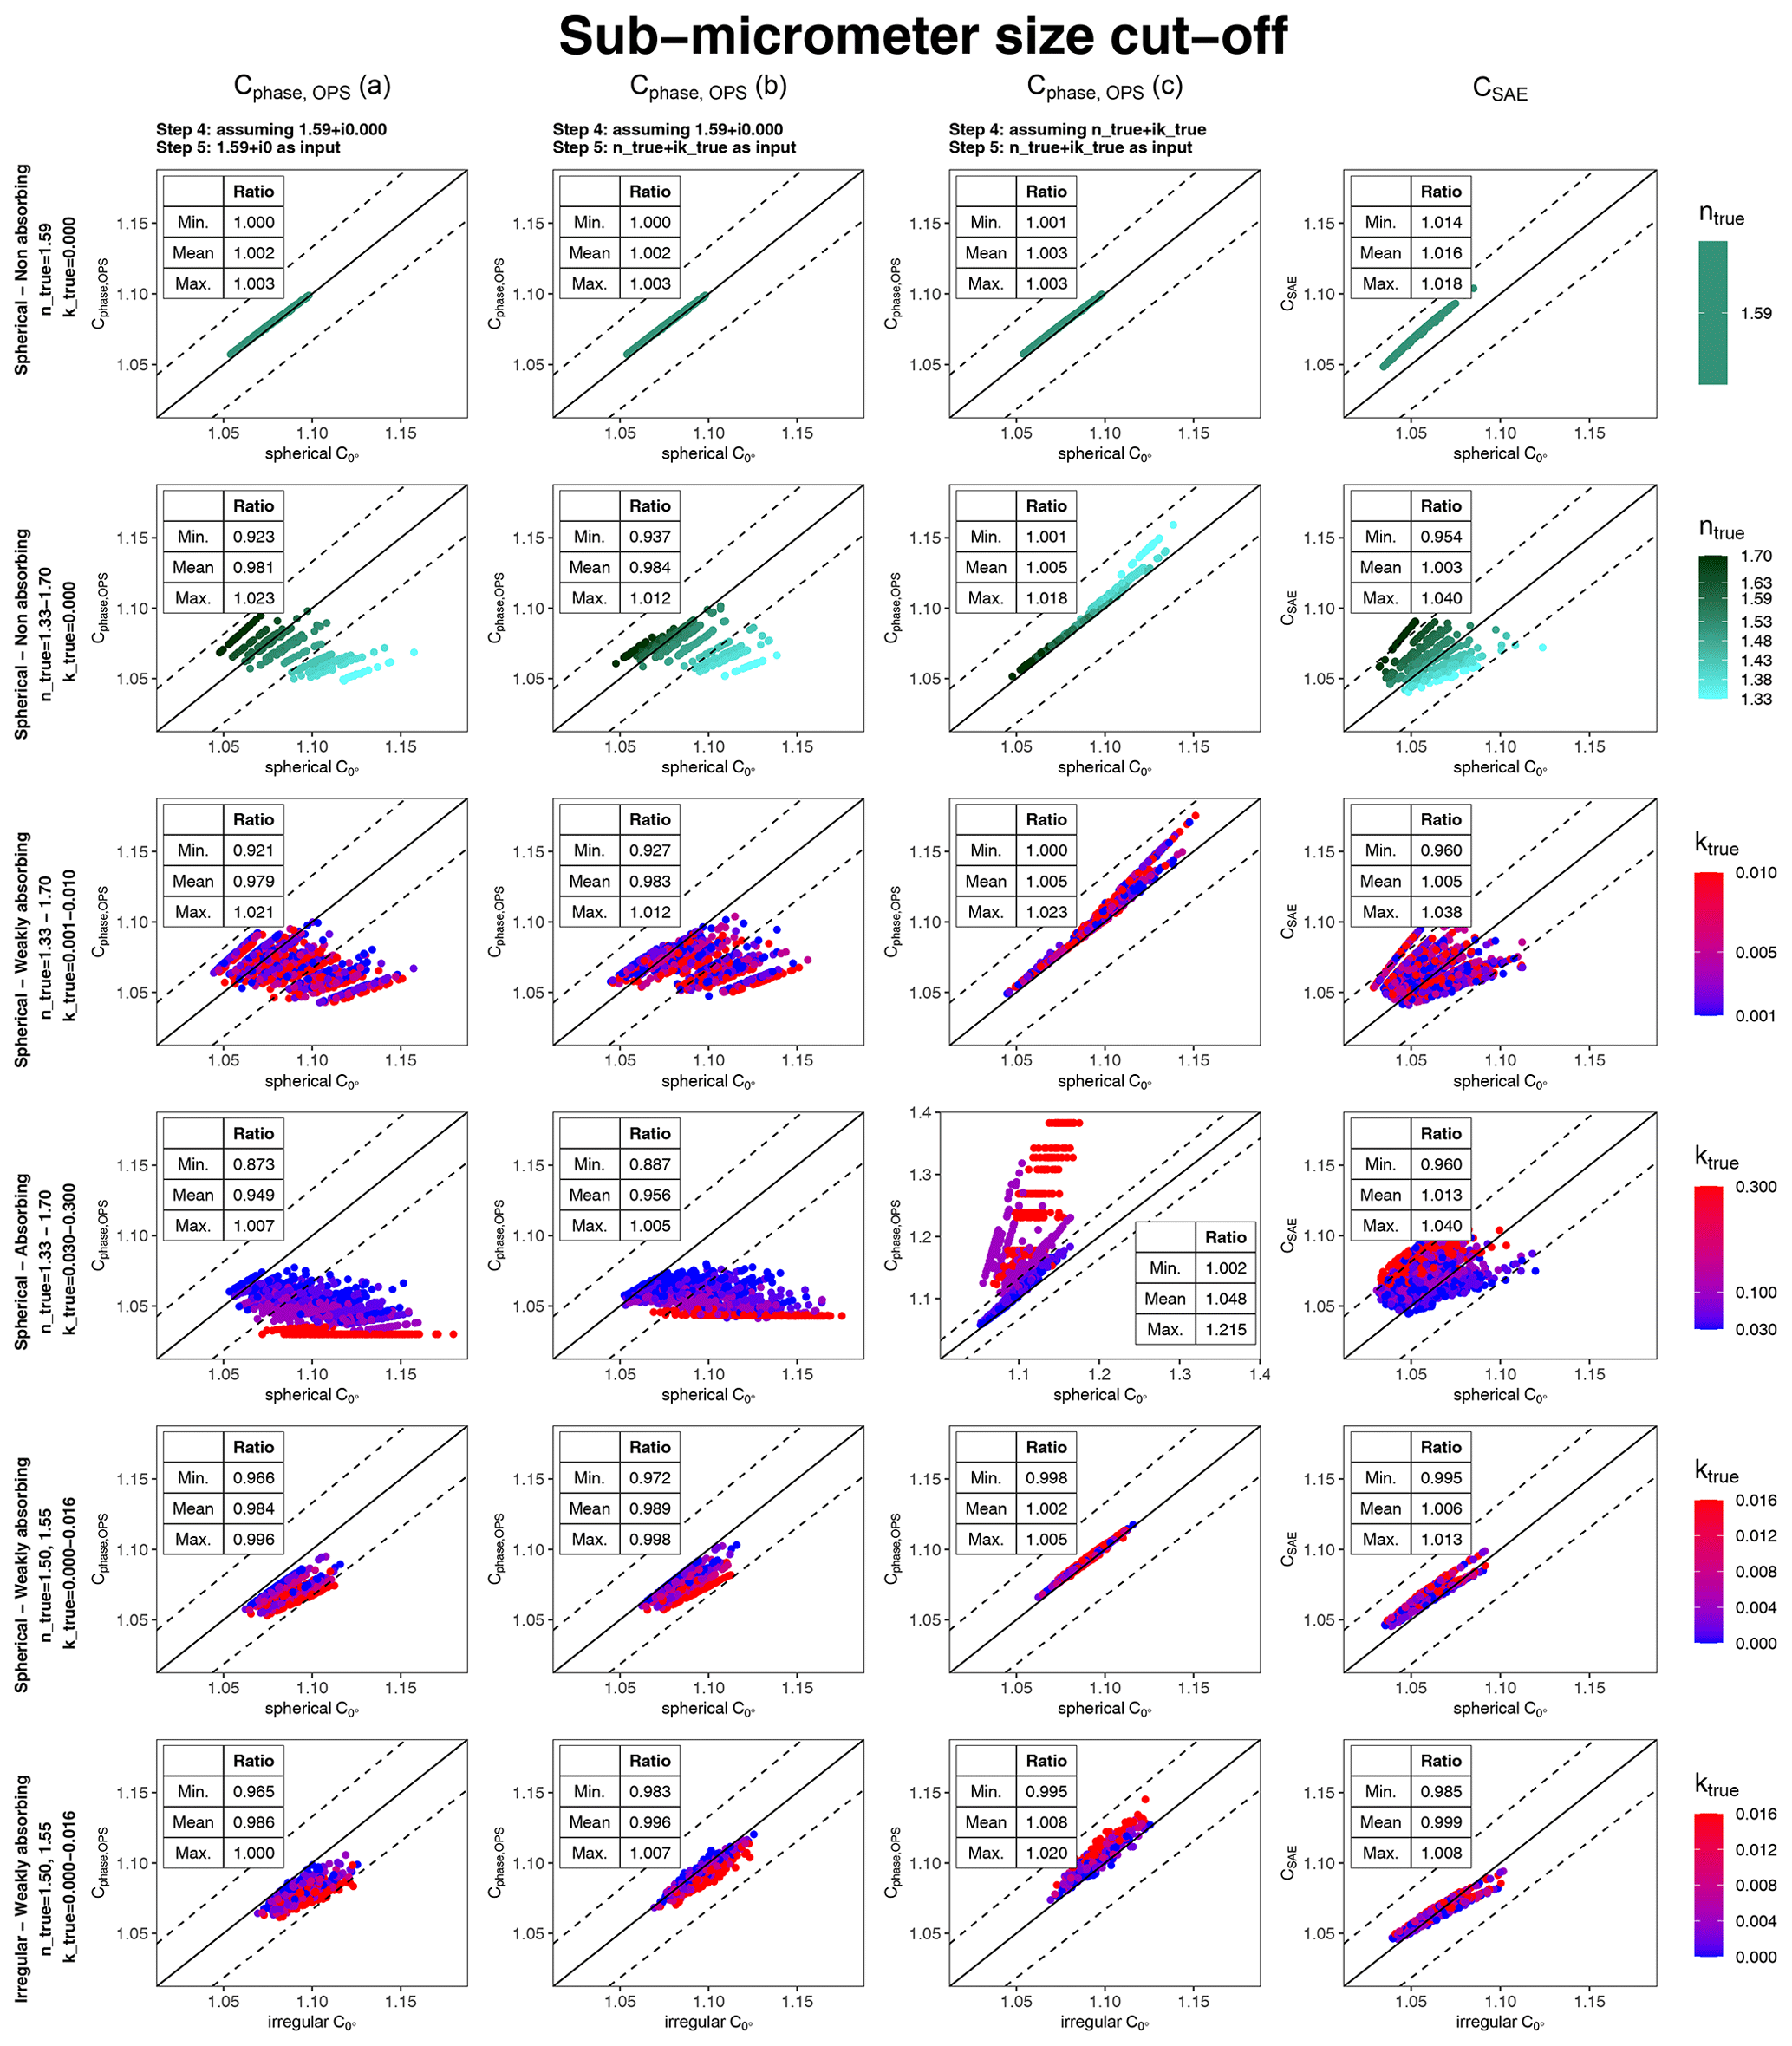
Figure 6Simulated closure experiment to assess the limitations and uncertainties of the angular correction obtained with Mie theory from the size distribution measured by an OPS. The comparisons for the angular correction Cphase,OPS calculated with the three approaches (a, b, c) are shown in the first three columns. The comparison for the angular correction CSAE is reported in the last column. Different lines refer to different aerosol input. The color code indicates different values of the real part of the refractive index for the non absorbing cases (rows 1–2) and of the imaginary part of the refractive index for all the other cases (rows 3–6). The solid lines are the 1 : 1 lines. The dashed lines are the ±3 % lines. The minimum, mean, and maximum value of the ratio between the quantity reported on the y axis and the quantity reported on the x axis is reported in the tables.
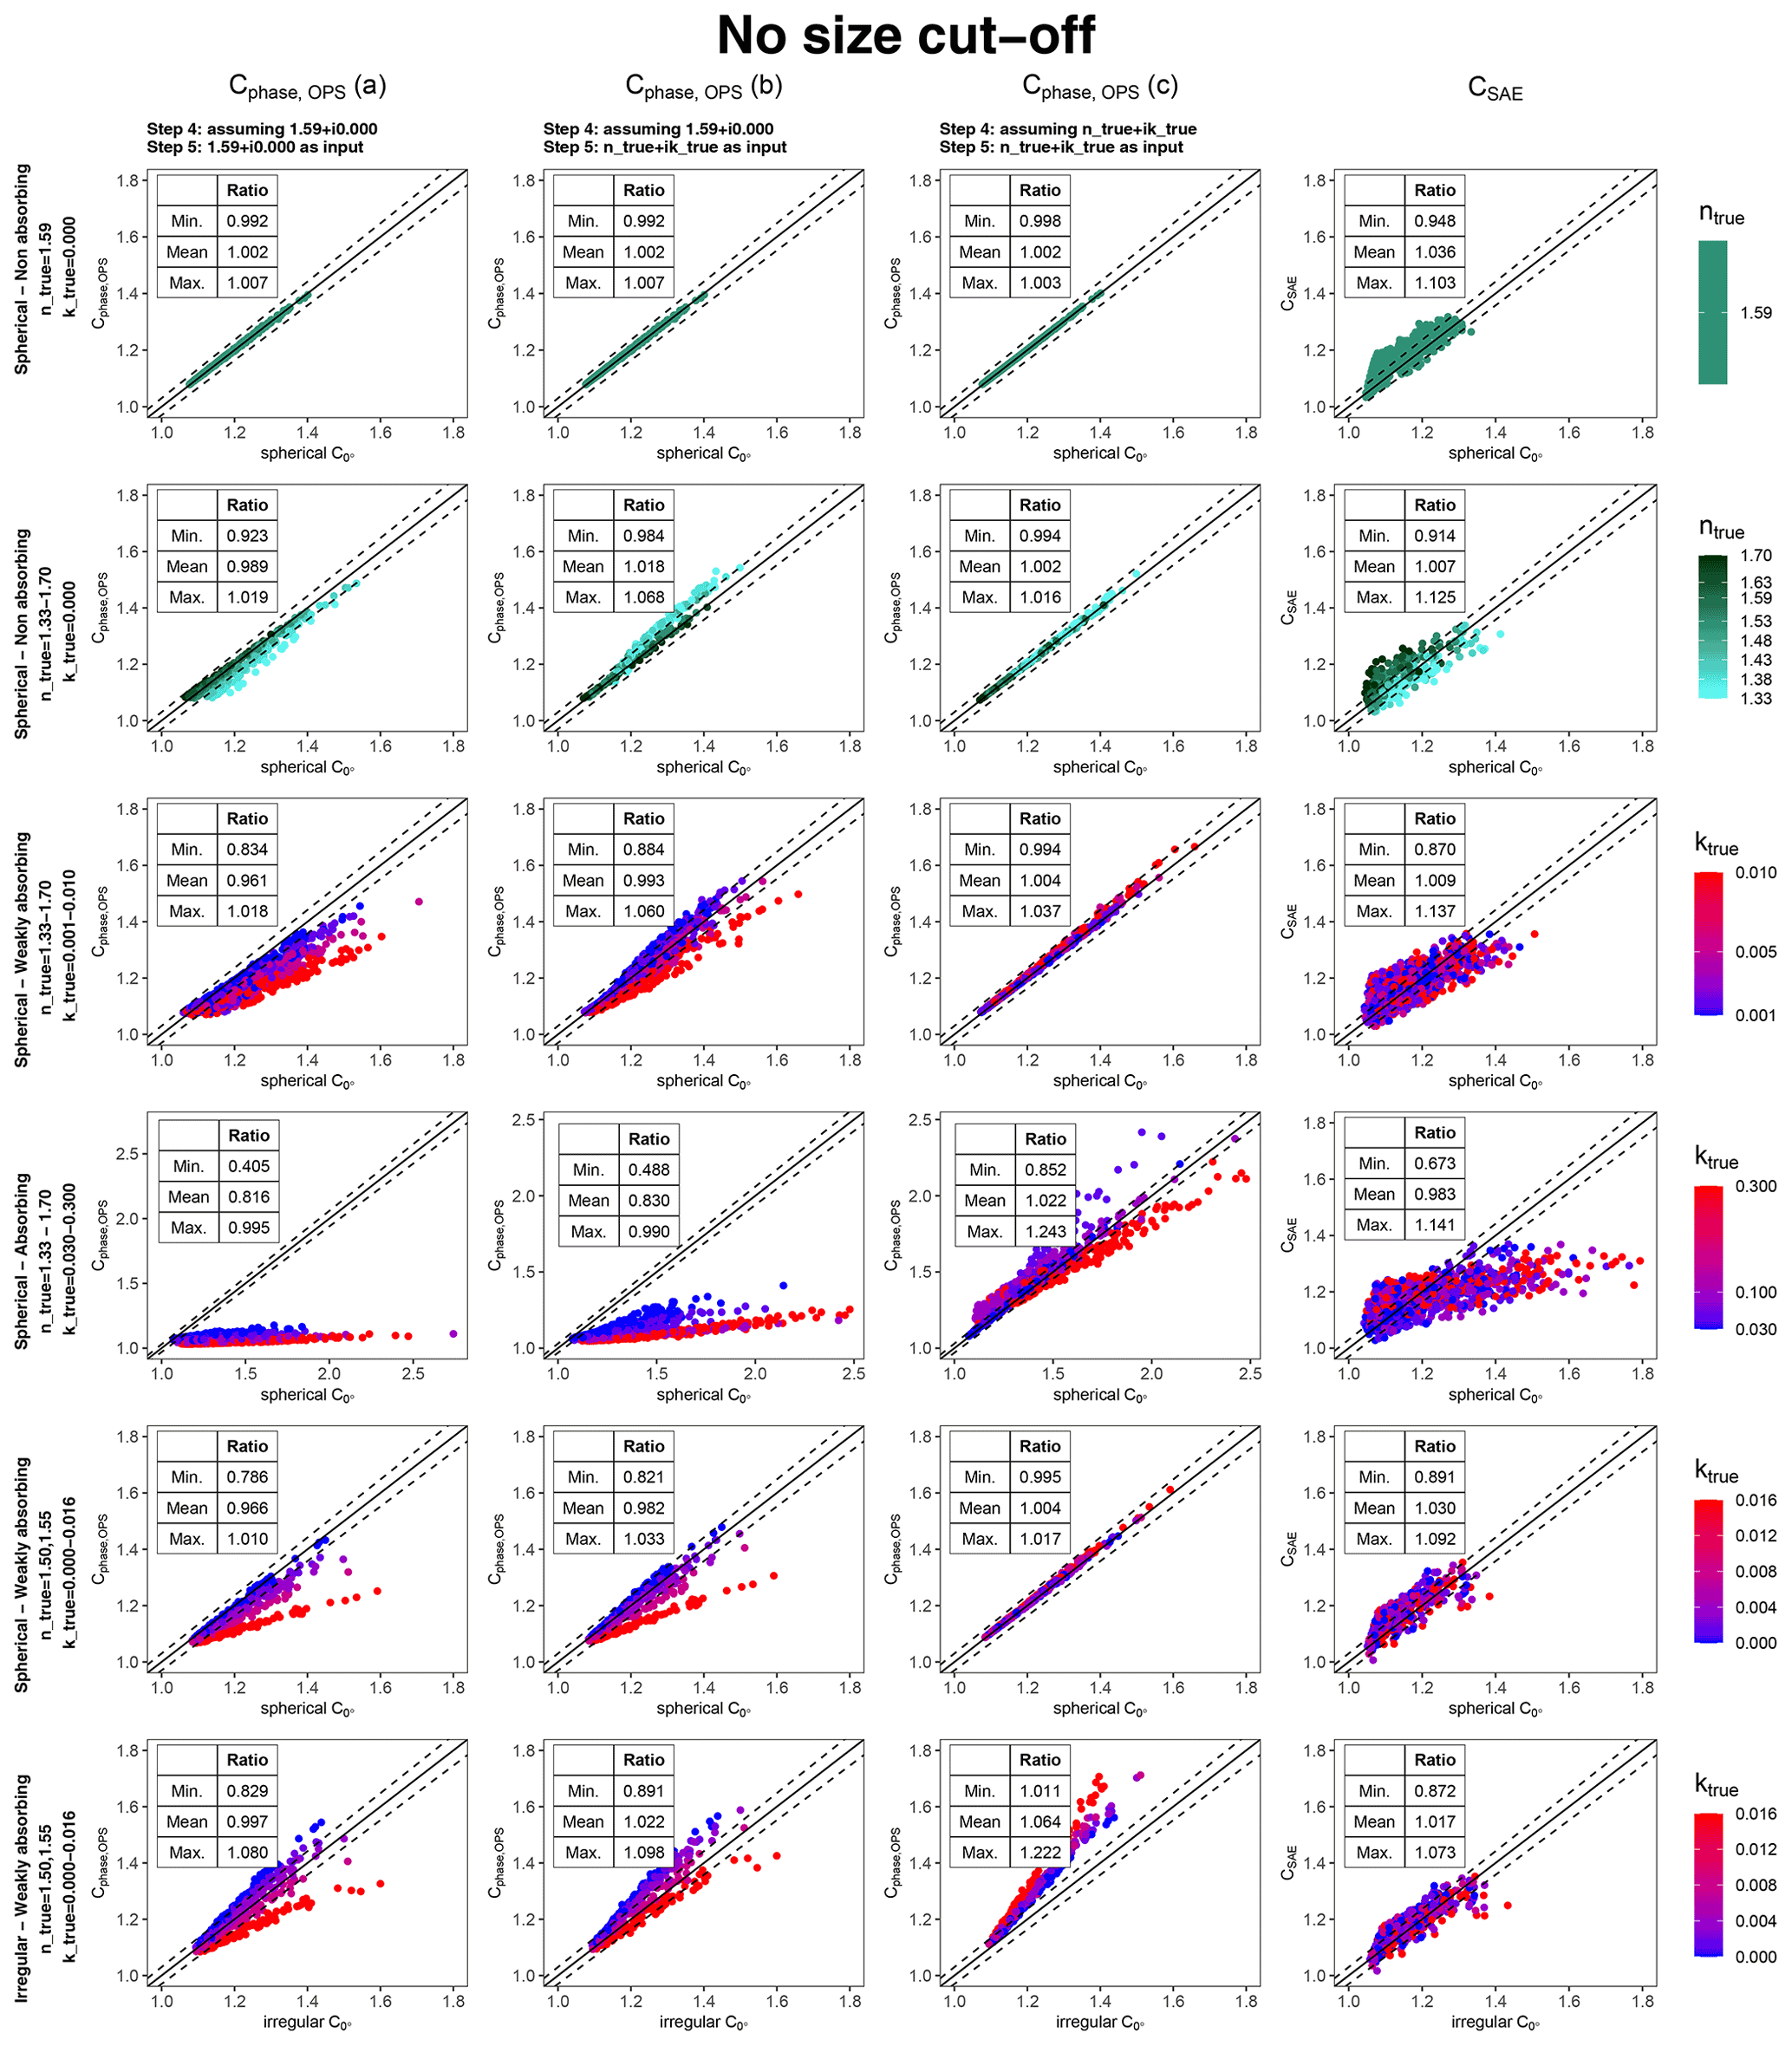
Figure 7Simulated closure experiment to assess the limitations and uncertainties of the angular correction obtained with Mie theory from the size distribution measured by an OPS. The comparisons for the angular correction Cphase,OPS calculated with the three approaches (a, b, c) are shown in the first three columns. The comparison for the angular correction CSAE is reported in the last column for comparison. Different rows refer to different aerosol input. The color code indicates different values of the real part of the refractive index for the non absorbing cases (rows 1–2) and of the imaginary part of the refractive index for all the other cases (rows 3–6). The solid lines are the 1 : 1 lines. The dashed lines are the ±3 % lines. The minimum, mean, and maximum value of the ratio between the quantity reported on the y axis and the quantity reported on the x axis is reported in the tables. Calculations are limited for computational purposes to particle diameter ranges of 0.3–10 and 0.3–5.8 µm for homogeneous spherical particles and for irregular particles.
Several observations can be made looking at the results represented in Figs. 6 and 7. First, the panels in the first row of Figs. 6 and 7 show that the effect of the TSI OPS 3330 binning on the angular correction is smaller than 0.7 %. Indeed, 1.59+i0.000 is the refractive index used for the calibration of the TSI OPS 3330 and, in this case, the difference between and Cphase,OPS is the result of the TSI OPS 3330 binning.
Second, if the particle size distribution is calculated with the calibration refractive index, the use of the true refractive index in the optical modeling of the angular correction Cphase,OPS does not improve the accuracy significantly. Indeed, panels in the first and second columns (approaches a and b) look quite similar for all aerosol types, both with sub-micrometer and with no size cut-off.
Third, if the particle size distribution is calculated with the true refractive index, the agreement between Cphase,OPS and the original significantly improves, for all cases with spherical particles. The agreement is within 3 %–4 % for all weakly absorbing aerosols with spherical particles for both with and with no size cut-off (rows 2 and 3, column 3 of Figs. 6 and 7).
Fourth, in the case of absorbing aerosol, the Cphase,OPS (c) calculated with the refractive index correction can have large uncertainties. In the case of size distributions with sub-micrometer size cut-off, when ktrue=0.1–0.3, Cphase,OPS (c) overestimates by up to 21 % (row 4, column 3 of Fig. 6). The comparison plot shows unusual features as the retrieval procedure used for the refractive index correction failed. Indeed, the TSI OPS 3330 Mie curve for ktrue=0.3 is almost flat in the diameter range from 0.5 to 1.0 µm. The angular correction CSAE is accurate within 4 % in this case. In the case of size distributions with no size cut-off, Cphase,OPS (c) can have up to ±25 % uncertainty, when ktrue=0.1–0.3 (row 4, column 3 of Fig. 7).
Finally, an interesting result is found in the case of irregular particles when no size cut-off is considered (last panel row of Fig. 7). The angular correction Cphase,OPS (a), obtained with the refractive index of the calibration material, agrees on average with the original C0 within 0.3 %. However, the relationship is strongly dependent on the imaginary part of the refractive index. If ktrue=0.000, Cphase,OPS (a) overestimates the original C0 up to 8 %. If ktrue=0.016, Cphase,OPS (a) underestimates the original up to 18 %. Surprisingly, when the true refractive index is taken into account, the angular correction Cphase,OPS (c) systematically overestimates the original on average by 5 % and up to 22 % in the worst case.
6.1 Nephelometer angular corrections
Integrating nephelometer measurements require an angular correction to provide the particle scattering coefficient. Several methods to calculate the angular correction are available in the literature and are covered by our laboratory and modeling study. The applicability and uncertainty of these corrections depend on the particle type and the availability of other measurements.
The angular correction Cpolar is a method developed by Müller et al. (2012). Nephelometer data corrected with the angular correction Cpolar (Fig. 3c–d) are in agreement with the reference particle scattering coefficient only for particles with sizes smaller than 1 µm, while they strongly underestimate (up to ∼ 40 %) the particle scattering coefficient for larger particle sizes. This observation is in agreement with the model calculation performed by Müller et al. (2012). Müller et al. (2012) also showed that this correction is not affected by the imaginary part of the refractive index and that it can reduce the uncertainty of the angular correction for sub-micrometer to about 2 %.
The angular correction CSAE is the method most commonly used in the literature (e.g., Pandolfi et al., 2018; Valenzuela et al., 2015; Costabile et al., 2013; Clarke et al., 2007). Nephelometer data of polydisperse coarse-mode irregularly shaped aerosols corrected with the angular correction CSAE (Fig. 3b) are in very good agreement with the reference particle scattering coefficient for small volume median diameters (<2 µm). For volume median diameters larger than 2 µm, the reference particle scattering coefficient is underestimated by up to 15 %. This performance is much better than the one achieved with the Cpolar angular correction. This result is in agreement with the model calculations of weakly absorbing polydisperse aerosol of spherical and irregularly shaped particles (Fig. 7 last panel column, rows 3, 5, and 6), which show that the angular correction CSAE has an overall uncertainty of about ±13 %. A possible explanation for the underestimation of the angular correction CSAE for large particle sizes (volume median diameter >2 µm) is that the SAE is already around zero. Even if the SAE can reach slightly negative numbers, it is no longer linearly related to the particle size.
The overall higher uncertainty of the angular correction CSAE for coarse-mode aerosol is already highlighted by Anderson and Ogren (1998). For this reason, they introduce the sub-micrometer size segregation and point out that very accurate information, within a few percent, on the particle scattering coefficient of sub-micrometer polydisperse non-absorbing aerosol can be achieved, as confirmed experimentally by Massoli et al. (2009).
Nevertheless, the angular correction CSAE is not very accurate in the case of absorbing aerosol. The SAE is only indirectly related to the particle size, and this relationship is altered for absorbing particles. Bond et al. (2009) showed that the angular correction CSAE might have an error of about 5 % for sub-micrometer aerosol. Even if this error looks rather small, Bond et al. (2009) point out that the error is in the same order of magnitude as the angular correction for absorbing sub-micrometer particles. In addition, Massoli et al. (2009) showed this issue experimentally and pointed out that for sub-micrometer particles, the relationship between SAE and angular correction is also strongly dependent on the real part of the refractive index. Our calculations (last panel column of Fig. 6) confirm the finding of Bond et al. (2009) and Massoli et al. (2009). In addition, our calculations for particle size distributions with no size cut-off (Fig. 7) show that, in extreme cases, if coarse-mode highly absorbing particles are present, the uncertainty of the CSAE correction may rise up to 33 %.
The angular correction Cphase,OPS is a rarely used method in the literature (e.g.,Di Biagio et al., 2019) as it requires simultaneous particle size distribution measurements and also knowledge about the refractive index and particle shape. For the mineral dust measurements, the performance of the angular correction Cphase,OPS is surprisingly good (Fig. 3h) even though no refractive index or shape is considered in the size distribution retrieval. This result might lead one to the conclusion that there is no need to take into account the refractive index or shape of the measured aerosol for the calculation of the angular correction Cphase,OPS. The optical particle spectrometer is an optical cross-section selector rather than a particle sizer. The use of the refractive index of the calibration material might lead to compensations of the effects of refractive index and shapes on the measured particle size distribution (see Supplement in Sect. S3 and Fig. S3) and, thus, on the calculated angular correction. Results of our simulated closure experiment (Fig. 7, last row) suggest that the good performance of the angular correction Cphase,OPS for mineral dust measurements (Fig. 3h) might be partly due to a compensation of the non-spherical shape effect by the small imaginary part of the refractive index. In the case of mineral dust measurements, the particle size distribution by an OPS, obtained with the manufacturer-provided PSL-equivalent nominal diameters of the bin boundaries, leads to an angular correction which is on average correct (within ±0.3 %). However, Cphase,OPS has a strong dependence on the imaginary part of the refractive index; it overestimates the true angular correction by up to 8 % for non-absorbing particles and underestimates it by up to 17 % for absorbing particles (Fig. 7, last row, approach a).
The direct effect of particle shape on the angular correction itself (i.e., original ) is very small. Our calculations (Fig. 5) show that the angular correction for dust-like irregularly shaped particles is on average 2 % higher than the angular correction for volume-equivalent spheres. This result is in agreement with the one obtained by Quirantes et al. (2008), who found that angular corrections calculated for oblate particles and prolate spheroids are similar within 1 %–2 % to results obtained for equal-projected-area spheres. The observation that the near-forward scattering is quite insensitive to the particle shape (e.g., Mishchenko et al., 1995) further supports this finding.
If the true refractive index is assumed for the particle size distribution retrieval, the Cphase,OPS is systematically overestimated on average by 5 %–6 % up to a maximum of 22 % (Fig. 7 last row, approach c). This result highlights that even if the direct effect of the particle shape on the angular correction looks rather small, the non-sphericity contributes to a higher uncertainty in the determination of the particle size distribution and thus in the angular correction Cphase,OPS.
In the case of irregularly shaped particles, the angular correction CSAE looks more accurate, and it requires less effort than considering the non-sphericity for the retrieval of the size distribution. Our calculations show that the angular correction CSAE is accurate on average within 2 % with an overall uncertainty of about ±13 % (Fig. 7 last row, last column). In addition, the angular correction CSAE shows a less strong dependence on the imaginary part of the refractive index than the angular correction Cphase,OPS (a), calculated with the refractive index of the calibration material.
Results of the simulated closure experiment show that the angular correction Cphase,OPS calculated with the approach (c), e.g., assuming the true refractive index for both the particle size retrieval and the optical calculations, is more accurate than the ones calculated for the other approaches for all cases except for irregular particles (Fig. 7). The overall uncertainties obtained are within a few percent for slightly absorbing particles, but larger uncertainties (about ±25 %) are found for absorbing aerosol. Quite similar results were obtained for the other two approaches (a and b), where the angular correction Cphase,OPS is calculated from the PSL equivalent particle size distribution and the optical simulations used the PSL refractive index for the approach (a) and the true refractive index for the approach (b). This result highlights that the angular correction is quite insensitive to the refractive index as also pointed out by Bond et al. (2009), who estimate about 2 % uncertainty due to the refractive index when calculating the angular correction with Mie theory. Our analysis points out that while the angular correction is quite insensitive to both the refractive index and the shape, it is critical to assume the correct refractive index and shape for the particle size distribution retrieval and in the calculation of the angular correction Cphase,OPS.
6.2 Implications for optical closure studies
Optical closure studies, where the aerosol optical properties measured directly are compared with the aerosol optical properties simulated using the measured size distribution and optics theory, allow not only the evaluating and minimizing of the measurement uncertainties but also constraining specific parameters. Iteratively comparing the measured particle scattering and absorption coefficient with the corresponding derived quantities, it is possible to retrieve the aerosol refractive index (e.g., Abo Riziq et al., 2007; Mack et al., 2010)
If the instruments' uncertainties are comparatively high, it is difficult to achieve a perfect closure, and the refractive index retrieval might fail. For instance, Schladitz et al. (2009, 2011) found discrepancies in the range of 32 %–42 % between measured and Mie-simulated optical properties and could not determine an average refractive index in the case of high mineral dust particle concentrations. These studies attributed the discrepancies to a superposition of irregular shape effect on both the nephelometer angular correction and the sizing and counting uncertainty. While Schladitz et al. (2009, 2011) used a combination of a differential mobility particle sizer and an aerodynamic particle sizer, Di Biagio et al. (2019) could retrieve the refractive index of mineral dust within a chamber closure experiment using a combination of two OPSs. Even if they recognized the potential role of non-sphericity in affecting their results, they assumed the mineral dust to be spherical for the whole data treatment.
Our study suggests that while the particle shape affects the angular correction only by 2 % (Fig. 5), the overestimation of particle size of mineral dust by optical particle spectrometers can be estimated to result on average in about 5 % up to 22 % overestimation of the angular correction (Fig. 7 last row, approach c). This result allows the decoupling of the effect of the coarse-mode irregular particles on the angular correction itself and on the measured size distribution. Our analysis suggests that the non-sphericity mainly affects the retrieval of the particle size distribution, and therefore a more accurate refractive index might be obtained by considering the shape in the particle size retrieval.
6.3 Limitations of the study
Measurement uncertainties of the measurement instruments Aurora 4000, CAPS PMext, and TAP might partly explain the observed deviations in the result of the laboratory experiment. An additional source of uncertainty is given by the parameters of the Aurora 4000 angular sensitivity function (see Eq. 5). Indeed, all angular corrections tested rely on the parameters and truncation angles of (Table 1).
Differences in the angular sensitivity function of the Aurora 4000 and the Aurora 3000 (Müller et al., 2011a) lead to a difference of 3 %–6 % in the angular correction CSAE. The truncation angles of Aurora 4000 are 9 and 170∘ according to the Aurora 4000 manual, while the truncation angles of Aurora 3000 are 10 and 171∘ (Müller et al., 2011a). To our knowledge, there is no experimental method to verify these angles. In addition, the parameters of the Aurora 4000 angular illumination function measured by Müller et al. (2012) are different from those of the Aurora 3000 angular illumination function published by Müller et al. (2011a). We cannot exclude that small differences may exist even within different units of the same model. The Aurora 4000 used in this experiment was the Aurora 4000 of the University of Vienna, while the angular sensitivity function was measured on the unit of the TROPOS Institute by Müller et al. (2012).
In our data analysis, we introduced some circularity when the CAPS PMext was calibrated considering the total particle scattering coefficient for measurements of PSL particles with a nominal diameter of 200 nm, as discussed in Sect. 4.2. The particle scattering coefficient was obtained from the value measured by the Aurora 4000 corrected for the angular truncation and illumination error. The angular correction was calculated with the method Cphase, where the particle phase function was obtained via Mie calculations assuming a log-normal particle size distribution and assuming the validity of . This correction might contribute to compensations in the comparison between the reference particle scattering coefficient and the corrected Aurora 4000 particle scattering coefficient. Nevertheless, the angular correction increases with particle sizes and the parameters of the angular sensitivity function remain a source of uncertainty for coarse-mode particles.
A method to evaluate the accuracy of the angular sensitivity function could consist of considering the angular correction Cphase,H, obtained from the particle phase function measured by Horvath's polar nephelometer. Indeed, the latter does not require assumptions on the refractive index and shape of the measured aerosols. The particle scattering coefficient measured by Horvath's polar nephelometer might be used as a reference value for this purpose. Unfortunately, it was not possible to obtain the particle scattering coefficient from Horvath's polar nephelometer because of the very variable signal during dust measurements and the low temporal resolution (35 min) of the instrument. The angular correction Cphase,H leads to an underestimation of the reference particle scattering coefficient of on average 12 % (Table 4). Even if we do not fully understand the reasons for this discrepancy, we cannot attribute it completely to the uncertainty of the angular sensitivity function. Most probably, the use of the 1 min Aurora 4000 particle scattering coefficient to cope with the very variable signal introduced a high uncertainty. The Horvath's polar nephelometer has been corrected for its angular truncation error considering an extrapolation procedure (Horvath, 2015). Even if the accuracy reported for this procedure is better than 1 %, we cannot exclude being worse for our measurements where the instability of the aerosol number concentration together with the use of coarse-mode irregular particles represents a major challenge.
We performed an extensive closure study, including laboratory and modeling effort, to evaluate and compare different angular corrections for the Aurora 4000 polar nephelometer. We focused on their performance for coarse-mode irregularly shaped aerosol such as mineral dust, which is the most abundant aerosol worldwide in terms of dry mass (Choobari et al., 2014; Textor et al., 2006). In the laboratory experiment, we used soil samples collected in desert areas, synthetic silica, and a volcanic ash sample to generate polydisperse test aerosol. In addition, PSL particles and ammonium sulfate were used to generate monodisperse test aerosol. We tested and compared four angular corrections: CSAE using the measured scattering Ångström exponent, Cpolar using the polar measurements of the particle scattering coefficient, Cphase,H using the particle phase function measured by Horvath's polar nephelometer, and Cphase,OPS using the particle phase function simulated on the basis of the size distributions measured by the two optical particle sizers.
We compared the particle scattering coefficients corrected with each angular correction with the reference particle scattering coefficient obtained as the difference between the measured particle extinction and absorption coefficients. As a result, we found that the angular correction Cpolar is reliable for sub-micrometer particles while strongly underestimating the true particle scattering coefficient for larger particle sizes. The two angular corrections that showed the best performance for mineral dust measurements are CSAE and Cphase,OPS, as they both underestimate the reference angular correction on average by 7 %. The good performance of Cphase,OPS for mineral dust aerosol looks surprising because a simple approach was used for its calculation. The refractive index of the calibration material was assumed for both the particle size distribution retrieval and the optical calculations. In addition, the non-spherical shape was not considered.
To interpret these results, we performed an extensive modeling effort, simulating a closure experiment for randomly selected particle size distributions, refractive indices, and shapes. First, we estimated the effect of the particle shape on the original angular correction . We found that using the Mie theory to calculate the angular correction for mineral-dust-like irregular shapes leads to an underestimation of about 2 %. Second, we investigated the uncertainties of the two angular corrections CSAE and Cphase,OPS that showed the best performance for mineral dust measurements. The signal measured by a TSI OPS 3330 was simulated for the selected particle size distributions, refractive indices, and shapes.

The angular correction Cphase,OPS was calculated with three different approaches: (a), (b), and (c) (see Fig. 4 and related text). Overall, the angular correction Cphase,OPS (c), which considers the refractive index of the selected aerosol for both the particle size distribution retrieval and the optical calculations, leads to an improvement in the agreement between the derived angular correction and the original angular correction . An exception is the case of irregular particles, where the angular correction Cphase,OPS (c) overestimates the original angular correction on average by 5 % and up to 22 %. Using the angular correction Cphase,OPS (a) (i.e., the refractive index of the calibration material was assumed for both the particle size distribution retrieval and the optical calculations), the effect of the non-spherical shape seems to be almost compensated for by the effect of the imaginary part of the refractive index. In conclusion, through an extensive closure experiment and modeling effort, we could decouple the effect of the coarse-mode irregular particles on the angular correction itself and on the measured size distribution.
7.1 Recommendation for the use of an appropriate correction method
Based on the current knowledge and the present work, we conclude that there is no generally “best” method to calculate the angular correction. Rather the angular correction should be selected depending on the aerosol type and the investigated size range. The angular correction CSAE is the most accurate in many of the analyzed cases and may serve as the “default” method, even if its uncertainty can be relatively large (up to 33 %). If higher accuracy of the particle scattering coefficient by a nephelometer is desired, the angular correction might be obtained via optical simulations from the measured aerosol size distribution Cphase,OPS. However, the retrieval of the particle size distribution from the OPS would need to consider the correct refractive index and the particle shape, even if the direct effect of the particle shape on the nephelometer angular truncation and illumination error was found to be comparatively small.
We provide uncertainties for different approaches to calculate the angular correction from the measured particle size distribution, and we indicate the least uncertain approach for several situations. The reported uncertainties are calculated on the basis of the simulated closure experiment and do not consider the uncertainty of the angular sensitivity function. We recommend the procedure shown in the flow chart in Fig. 8 to establish the nephelometer data correction method.
If the measurements are performed with a sub-micrometer cut-off or if the aerosol scattering is dominated by sub-micrometer aerosols,
-
and the nephelometer provides the scattering coefficient for various angular ranges (in particular and ), the angular correction Cpolar can be used. The uncertainty for this method is 2 % (Müller et al., 2012).
-
and the nephelometer does not provide the scattering coefficient for various angular ranges, the angular correction can be calculated with the CSAE method, with 5 % uncertainty.
A size segregation into sub-micrometer and total aerosol is often motivated by technical issues (e.g., the inlet efficiency). However, a sub-micrometer cut-off may also be applied on purpose to better characterize the fine aerosol fraction (e.g., Cappa et al., 2016), in particular in mixtures where the fine- and coarse-mode aerosol are dominated by different aerosol types (e.g., in mineral dust and black carbon mixtures).
If the measurements are performed without a sub-micrometer cut-off or if the aerosol scattering is dominated by coarse-mode aerosols,
-
the size distribution is not measured over a relevant size range, or the aerosol type is not known, the angular correction can be calculated with the CSAE method. However, the uncertainty is up to 33 % in the case of large (>1 µm) absorbing particles and 13 % for slightly absorbing particles.
-
the aerosol type is known, the particles are spherical, and the size distribution is measured over a relevant size range, the best method is the Cphase,OPS with the approach (c), considering the true refractive index via an inversion procedure to retrieve the measured size distribution. The uncertainty is 3 % in the case of slightly absorbing aerosols, while it is 25 % if the aerosols are highly absorbing.
-
the aerosol type is known and the particles are mineral dust, the angular correction CSAE can be used with an uncertainty of 13 %. To further reduce the uncertainty, the correction Cphase,OPS could be calculated from an optically measured size distribution, but it would need to consider not only the refractive index but also the irregular shape.
-
the aerosol type is known to be non-spherical but it is not mineral dust, more investigation is needed on the angular correction. However, CSAE can still be used but with an unknown uncertainty.
Last but not least, nephelometer data should always be reported in both forms with and without angular correction. Indeed, the uncorrected nephelometer particle scattering coefficients might be used within a closure experiment to constrain the particle refractive index without introducing additional uncertainty in the nephelometer scattering coefficient by the angular correction method.
By improving the understanding of the nephelometer angular correction for irregularly shaped coarse particles – in particular mineral dust – this study reduces uncertainties in observations of aerosol scattering properties. Future studies with the aim of further reducing the uncertainty of scattering measurements should focus on environments with a high load of absorbing particles like urban sites or moderately absorbing mixtures such as mixtures of mineral dust and black carbon.
| Symbol | parameter |
| σs | scattering coefficient |
| σsp | particle scattering coefficient |
| σsR | Rayleigh scattering coefficient |
| σep | particle extinction coefficient |
| σap | particle absorption coefficient |
| θ | scattering angle |
| γ | angular scattering function |
| Ω | solid angle with respect to the direction of the incident beam |
| λ | wavelength |
| λB | blue wavelength of the Aurora 4000 polar nephelometer = 450 nm |
| λG | green wavelength of the Aurora 4000 polar nephelometer = 525 nm |
| λR | red wavelength of the Aurora 4000 polar nephelometer = 635 nm |
| α | shutter position in degree |
| ρ | particle density |
| d | particle diameter |
| x | size parameter |
| n | real part of the refractive index |
| k | imaginary part of the refractive index |
| SAE | scattering Ångström exponent |
| SAE∗ | scattering Ångström exponent calculated using the uncorrected Aurora 4000 measurement of σsp |
| Zideal | angular sensitivity function for an ideal nephelometer |
| ZAurora 4000 | angular sensitivity function of the Aurora 4000 polar nephelometer |
| parameters of the angular sensitivity function | |
| S | signal measured by the Aurora 4000 polar nephelometer |
| particle scattering coefficient measured by the Aurora 4000 polar nephelometer for shutter position α | |
| OPS Csca | scattering cross section of the optical particle spectrometer |
| CR,α | Rayleigh angular correction for shutter position α |
| Cα | angular correction for shutter position α |
| angular correction for total particle scattering coefficient () | |
| Cphase | angular correction calculated using the particle phase function |
| Cphase,OPS | angular correction calculated using the Mie simulated particle phase function with the OPS particle size distribution |
| Cphase,H | angular correction calculated using the particle phase function measured by Horvath's polar nephelometer |
| CSAE | angular correction calculated using the SAE |
| Cpolar | angular correction calculated using the polar measurements of the particle scattering coefficient |
| CSAE,OPS | angular correction calculated using the Mie simulated SAE with the OPS particle size distribution |
| Cpolar,OPS | angular correction calculated using the Mie simulated polar measurements of σsp with the OPS particle size distribution |
Data of the laboratory study shown in this paper are available on request to bernadett.weinzierl@univie.ac.at and marilena.teri@univie.ac.at.
The supplement related to this article is available online at: https://doi.org/10.5194/amt-15-3161-2022-supplement.
MT, TM, and BW designed the study. MT, SV, and BW prepared the experiment. MT, SV, TM, and HH tested the experimental set-up and performed the measurements. MT analyzed the data with support from BW, TM, and JG. HH analyzed and provided Horvath's polar nephelometer data. MT performed the simulated closure experiment with contributions from AW for the Mie code reproducing the TSI OPS signal and JG for the ADDA calculations. The interpretation of the results is the outcome of numerous discussions among MT, TM, JG, SV, HH, RV, PB, AW, and BW. MT wrote the paper with contributions from JG, PB, and BW. All co-authors read and commented on the paper.
The contact author has declared that neither they nor their co-authors have any competing interests.
Publisher’s note: Copernicus Publications remains neutral with regard to jurisdictional claims in published maps and institutional affiliations.
The research leading to these results has received funding from the European Research Council (ERC) under the European Union's Horizon 2020 research and innovation program (grant agreement no. 640458, A-LIFE). We acknowledge financial support by the Vienna Doctoral School in Physics (VDSP). The Erasmus+ Traineeship Programme is also acknowledged for the financial support to Sara Valentini. The authors thank Scott Prahl and Maxim Yurkin for providing their optical modeling codes.
This research has been supported by the European Research Council, H2020 (A-LIFE (grant no. 640458)), Vienna Doctoral School in Physics (VDSP), and Erasmus+ Traineeship Programme.
This paper was edited by Mingjin Tang and reviewed by two anonymous referees.
Abo Riziq, A., Erlick, C., Dinar, E., and Rudich, Y.: Optical properties of absorbing and non-absorbing aerosols retrieved by cavity ring down (CRD) spectroscopy, Atmos. Chem. Phys., 7, 1523–1536, https://doi.org/10.5194/acp-7-1523-2007, 2007. a, b
Anderson, T., Covert, D., Marshall, S., Laucks, M., Charlson, R., Waggoner, A., Ogren, J., Caldow, R., Holm, R., Quant, F., Sem, G., Wiedensohler, A., Ahlquist, N., and Bates, T.: Performance Characteristics of a High-Sensitivity, Three-Wavelength, Total Scatter/Backscatter Nephelometer, J. Atmos. Ocean. Tech., 13, 967–986, https://doi.org/10.1175/1520-0426(1996)013<0967:PCOAHS>2.0.CO;2, 1996. a, b, c, d, e, f
Anderson, T. L. and Ogren, J. A.: Determining Aerosol Radiative Properties Using the TSI 3563 Integrating Nephelometer, Aerosol Sci. Tech., 29, 57–69, https://doi.org/10.1080/02786829808965551, 1998. a, b, c, d, e, f, g, h, i, j, k, l, m
Ansmann, A., Petzold, A., Kandler, K., Tegen, I., Wendisch, M., Müller, D., Weinzierl, B., Müller, T., and Heintzenberg, J.: Saharan Mineral Dust Experiments SAMUM-1 and SAMUM-2: What Have We Learned?, Tellus B, 63, 403–429, https://doi.org/10.1111/j.1600-0889.2011.00555.x, 2011. a
Beuttell, R. G. and Brewer, A. W.: Instruments for the Measurement of the Visual Range, J. Sci. Instrum., 26, 357–359, https://doi.org/10.1088/0950-7671/26/11/302, 1949. a
Bohren, C. F. and Huffman, D. R.: Absorption and scattering of light by small particles, John Wiley & Sons, https://doi.org/10.1002/9783527618156, 2008. a
Bond, T. C., Anderson, T. L., and Campbell, D.: Calibration and Intercomparison of Filter-Based Measurements of Visible Light Absorption by Aerosols, Aerosol Sci. Tech., 30, 582–600, https://doi.org/10.1080/027868299304435, 1999. a
Bond, T. C., Covert, D. S., and Müller, T.: Truncation and Angular-Scattering Corrections for Absorbing Aerosol in the TSI 3563 Nephelometer, Aerosol Sci. Tech., 43, 866–871, https://doi.org/10.1080/02786820902998373, 2009. a, b, c, d, e, f, g, h, i
Brock, C. A., Froyd, K. D., Dollner, M., Williamson, C. J., Schill, G., Murphy, D. M., Wagner, N. J., Kupc, A., Jimenez, J. L., Campuzano-Jost, P., Nault, B. A., Schroder, J. C., Day, D. A., Price, D. J., Weinzierl, B., Schwarz, J. P., Katich, J. M., Wang, S., Zeng, L., Weber, R., Dibb, J., Scheuer, E., Diskin, G. S., DiGangi, J. P., Bui, T., Dean-Day, J. M., Thompson, C. R., Peischl, J., Ryerson, T. B., Bourgeois, I., Daube, B. C., Commane, R., and Wofsy, S. C.: Ambient aerosol properties in the remote atmosphere from global-scale in situ measurements, Atmos. Chem. Phys., 21, 15023–15063, https://doi.org/10.5194/acp-21-15023-2021, 2021. a
Bucholtz, A.: Rayleigh-Scattering Calculations for the Terrestrial Atmosphere, Appl. Optics, 34, 2765–2773, https://doi.org/10.1364/AO.34.002765, 1995. a
Cappa, C. D., Kolesar, K. R., Zhang, X., Atkinson, D. B., Pekour, M. S., Zaveri, R. A., Zelenyuk, A., and Zhang, Q.: Understanding the optical properties of ambient sub- and supermicron particulate matter: results from the CARES 2010 field study in northern California, Atmos. Chem. Phys., 16, 6511–6535, https://doi.org/10.5194/acp-16-6511-2016, 2016. a, b
Choobari, O. A., Zawar-Reza, P., and Sturman, A.: The Global Distribution of Mineral Dust and Its Impacts on the Climate System: A Review, Atmos. Res., 138, 152–165, https://doi.org/10.1016/j.atmosres.2013.11.007, 2014. a, b
Clarke, A., McNaughton, C., Kapustin, V., Shinozuka, Y., Howell, S., Dibb, J., Zhou, J., Anderson, B., Brekhovskikh, V., Turner, H., and Pinkerton, M.: Biomass Burning and Pollution Aerosol over North America: Organic Components and Their Influence on Spectral Optical Properties and Humidification Response, J. Geophys. Res.-Atmos., 112, D12S18, https://doi.org/10.1029/2006JD007777, 2007. a
Costabile, F., Barnaba, F., Angelini, F., and Gobbi, G. P.: Identification of key aerosol populations through their size and composition resolved spectral scattering and absorption, Atmos. Chem. Phys., 13, 2455–2470, https://doi.org/10.5194/acp-13-2455-2013, 2013. a
Devon, M. J. and Rudin, A.: A Simple Technique for Measuring the Refractive Index of Polymer Latexes at Various Wavelengths, J. Appl. Polym. Sci., 34, 469–476, https://doi.org/10.1002/app.1987.070340202, 1987. a, b
Di Biagio, C., Formenti, P., Balkanski, Y., Caponi, L., Cazaunau, M., Pangui, E., Journet, E., Nowak, S., Andreae, M. O., Kandler, K., Saeed, T., Piketh, S., Seibert, D., Williams, E., and Doussin, J.-F.: Complex refractive indices and single-scattering albedo of global dust aerosols in the shortwave spectrum and relationship to size and iron content, Atmos. Chem. Phys., 19, 15503–15531, https://doi.org/10.5194/acp-19-15503-2019, 2019. a, b, c, d
Gasteiger, J. and Wiegner, M.: MOPSMAP v1.0: a versatile tool for the modeling of aerosol optical properties, Geosci. Model Dev., 11, 2739–2762, https://doi.org/10.5194/gmd-11-2739-2018, 2018. a
Gasteiger, J., Wiegner, M., GROß, S., Freudenthaler, V., Toledano, C., Tesche, M., and Kandler, K.: Modelling Lidar-Relevant Optical Properties of Complex Mineral Dust Aerosols, Tellus B, 63, 725–741, https://doi.org/10.1111/j.1600-0889.2011.00559.x, 2011. a, b, c
Heintzenberg, J. and Charlson, R. J.: Design and Applications of the Integrating Nephelometer: A Review, J. Atmos. Ocean. Techn., 13, 987–1000, https://doi.org/10.1175/1520-0426(1996)013<0987:DAAOTI>2.0.CO;2, 1996. a, b
Heintzenberg, J. and Quenzel, H.: Calculations on the Determination of the Scattering Coefficient of Turbid Air with Integrating Nephelometers, Atmos. Environ., 7, 509–519, https://doi.org/10.1016/0004-6981(73)90004-8, 1973. a
Heintzenberg, J., Wiedensohler, A., Tuch, T. M., Covert, D. S., Sheridan, P., Ogren, J. A., Gras, J., Nessler, R., Kleefeld, C., Kalivitis, N., Aaltonen, V., Wilhelm, R.-T., and Havlicek, M.: Intercomparisons and Aerosol Calibrations of 12 Commercial Integrating Nephelometers of Three Manufacturers, J. Atmos. Ocean. Tech., 23, 902–914, https://doi.org/10.1175/JTECH1892.1, 2006. a, b, c, d, e
Hermann, M., Weigelt, A., Assmann, D., Pfeifer, S., Müller, T., Conrath, T., Voigtländer, J., Heintzenberg, J., Wiedensohler, A., Martinsson, B. G., Deshler, T., Brenninkmeijer, C. A. M., and Zahn, A.: An optical particle size spectrometer for aircraft-borne measurements in IAGOS-CARIBIC, Atmos. Meas. Tech., 9, 2179–2194, https://doi.org/10.5194/amt-9-2179-2016, 2016. a
Horvath, H.: A Simple Method for the Absolute Calibration of the Integrating Nephelometer, Atmos. Environ., 7, 521–525, https://doi.org/10.1016/0004-6981(73)90005-X, 1973. a
Horvath, H.: Extrapolation of a Truncated Aerosol Volume Scattering Function to the Far Forward and Back Region, J. Aerosol Sci., 90, 26–35, https://doi.org/10.1016/j.jaerosci.2015.08.001, 2015. a, b
Horvath, H., Alados Arboledas, L., and Olmo Reyes, F. J.: Angular scattering of the Sahara dust aerosol, Atmos. Chem. Phys., 18, 17735–17744, https://doi.org/10.5194/acp-18-17735-2018, 2018. a, b
IPCC: Climate Change 2013: The Physical Science Basis. Contribution of Working Group I to the Fifth Assessment Report of the Intergovernmental Panel on Climate Change, edited by: Stocker, T. F., Qin, D., Plattner, G.-K., Tignor, M., Allen, S. K., Boschung, J., Nauels, A., Xia, Y., Bex, V., and Midgley, P. M.,, Cambridge University Press, Cambridge, United Kingdom and New York, NY, USA, https://www.ipcc.ch/site/assets/uploads/2018/02/WG1AR5_all_final.pdf (last access: 12 April 2022), 2013. a
Kassianov, E., Barnard, J., Pekour, M., Berg, L. K., Shilling, J., Flynn, C., Mei, F., and Jefferson, A.: Simultaneous retrieval of effective refractive index and density from size distribution and light-scattering data: weakly absorbing aerosol, Atmos. Meas. Tech., 7, 3247–3261, https://doi.org/10.5194/amt-7-3247-2014, 2014. a
Mack, L. A., Levin, E. J. T., Kreidenweis, S. M., Obrist, D., Moosmüller, H., Lewis, K. A., Arnott, W. P., McMeeking, G. R., Sullivan, A. P., Wold, C. E., Hao, W.-M., Collett Jr., J. L., and Malm, W. C.: Optical closure experiments for biomass smoke aerosols, Atmos. Chem. Phys., 10, 9017–9026, https://doi.org/10.5194/acp-10-9017-2010, 2010. a, b
Massoli, P., Murphy, D. M., Lack, D. A., Baynard, T., Brock, C. A., and Lovejoy, E. R.: Uncertainty in Light Scattering Measurements by TSI Nephelometer: Results from Laboratory Studies and Implications for Ambient Measurements, Aerosol Sci. Tech., 43, 1064–1074, https://doi.org/10.1080/02786820903156542, 2009. a, b, c, d, e, f, g
Mishchenko, M. I., Lacis, A. A., Carlson, B. E., and Travis, L. D.: Nonsphericity of Dust-like Tropospheric Aerosols: Implications for Aerosol Remote Sensing and Climate Modeling, Geophys. Res. Lett., 22, 1077–1080, https://doi.org/10.1029/95GL00798, 1995. a
Moosmüller, H. and Arnott, W. P.: Angular Truncation Errors in Integrating Nephelometry, Rev. Sci. Instrum., 74, 3492–3501, https://doi.org/10.1063/1.1581355, 2003. a
Müller, T., Nowak, A., Wiedensohler, A., Sheridan, P., Laborde, M., Covert, D. S., Marinoni, A., Imre, K., Henzing, B., Roger, J.-C., dos Santos, S. M., Wilhelm, R., Wang, Y.-Q., and de Leeuw, G.: Angular Illumination and Truncation of Three Different Integrating Nephelometers: Implications for Empirical, Size-Based Corrections, Aerosol Sci. Tech., 43, 581–586, https://doi.org/10.1080/02786820902798484, 2009. a, b, c, d
Müller, T., Laborde, M., Kassell, G., and Wiedensohler, A.: Design and performance of a three-wavelength LED-based total scatter and backscatter integrating nephelometer, Atmos. Meas. Tech., 4, 1291–1303, https://doi.org/10.5194/amt-4-1291-2011, 2011a. a, b, c, d, e, f, g, h, i, j, k
Müller, T., Schladitz, A., Kandler, K., and Wiedensohler, A.: Spectral Particle Absorption Coefficients, Single Scattering Albedos and Imaginary Parts of Refractive Indices from Ground Based in Situ Measurements at Cape Verde Island during SAMUM-2, Tellus B, 63, 573–588, https://doi.org/10.1111/j.1600-0889.2011.00572.x, 2011b. a
Müller, T., Paixão, M., Pfeifer, S., and Wiedensohler, A.: Scattering Coefficients and Asymmetry Parameters derived from the Polar Nephelometer Aurora 4000, in: EEuropean Aerosol Conference EAC 2012, Granada, 2–7 September 2012, Zenodo [poster], https://doi.org/10.5281/zenodo.5588445, 2012. a, b, c, d, e, f, g, h, i, j, k, l, m, n, o, p, q, r
Ogren, J. A.: Comment on “Calibration and Intercomparison of Filter-Based Measurements of Visible Light Absorption by Aerosols”, Aerosol Sci. Tech., 44, 589–591, https://doi.org/10.1080/02786826.2010.482111, 2010. a
Ogren, J. A., Wendell, J., Andrews, E., and Sheridan, P. J.: Continuous light absorption photometer for long-term studies, Atmos. Meas. Tech., 10, 4805–4818, https://doi.org/10.5194/amt-10-4805-2017, 2017. a
Onasch, T. B., Massoli, P., Kebabian, P. L., Hills, F. B., Bacon, F. W., and Freedman, A.: Single Scattering Albedo Monitor for Airborne Particulates, Aerosol Sci. Tech., 49, 267–279, https://doi.org/10.1080/02786826.2015.1022248, 2015. a
Pandolfi, M., Alados-Arboledas, L., Alastuey, A., Andrade, M., Angelov, C., Artiñano, B., Backman, J., Baltensperger, U., Bonasoni, P., Bukowiecki, N., Collaud Coen, M., Conil, S., Coz, E., Crenn, V., Dudoitis, V., Ealo, M., Eleftheriadis, K., Favez, O., Fetfatzis, P., Fiebig, M., Flentje, H., Ginot, P., Gysel, M., Henzing, B., Hoffer, A., Holubova Smejkalova, A., Kalapov, I., Kalivitis, N., Kouvarakis, G., Kristensson, A., Kulmala, M., Lihavainen, H., Lunder, C., Luoma, K., Lyamani, H., Marinoni, A., Mihalopoulos, N., Moerman, M., Nicolas, J., O'Dowd, C., Petäjä, T., Petit, J.-E., Pichon, J. M., Prokopciuk, N., Putaud, J.-P., Rodríguez, S., Sciare, J., Sellegri, K., Swietlicki, E., Titos, G., Tuch, T., Tunved, P., Ulevicius, V., Vaishya, A., Vana, M., Virkkula, A., Vratolis, S., Weingartner, E., Wiedensohler, A., and Laj, P.: A European aerosol phenomenology – 6: scattering properties of atmospheric aerosol particles from 28 ACTRIS sites, Atmos. Chem. Phys., 18, 7877–7911, https://doi.org/10.5194/acp-18-7877-2018, 2018. a, b
Petzold, A., Veira, A., Mund, S., Esselborn, M., Kiemle, C., Weinzierl, B., Hamburger, T., Ehret, G., Lieke, K., and Kandler, K.: Mixing of Mineral Dust with Urban Pollution Aerosol over Dakar (Senegal): Impact on Dust Physico-Chemical and Radiative Properties, Tellus B, 63, 619–634, https://doi.org/10.1111/j.1600-0889.2011.00547.x, 2011. a
Petzold, A., Onasch, T., Kebabian, P., and Freedman, A.: Intercomparison of a Cavity Attenuated Phase Shift-based extinction monitor (CAPS PMex) with an integrating nephelometer and a filter-based absorption monitor, Atmos. Meas. Tech., 6, 1141–1151, https://doi.org/10.5194/amt-6-1141-2013, 2013. a
Prahl, S.: Miepython, a pure Python module to calculate light scattering by non-absorbing, partially-absorbing, or perfectly conducting spheres, Mie theory is used, following the procedure described by Wiscombe, GitHub [code], https://miepython.readthedocs.io (last access: 12 April 2022), 2020. a
Qiu, J., Tan, W., Zhao, G., Yu, Y., and Zhao, C.: New correction method for the scattering coefficient measurements of a three-wavelength nephelometer, Atmos. Meas. Tech., 14, 4879–4891, https://doi.org/10.5194/amt-14-4879-2021, 2021. a
Quirantes, A., Olmo, F. J., Lyamani, H., and Alados-Arboledas, L.: Correction Factors for a Total Scatter/Backscatter Nephelometer, J. Quant. Spectrosc. Ra., 109, 1496–1503, https://doi.org/10.1016/j.jqsrt.2007.12.014, 2008. a, b
Schladitz, A., Müller, T., Kaaden, N., Massling, A., Kandler, K., Ebert,M., Weinbruch, S., Deutscher, C., and Wiedensohler, A.: In Situ Measurements of Optical Properties at Tinfou (Morocco) during the Saharan Mineral Dust Experiment SAMUM 2006, Tellus B, 61, 64–78, https://doi.org/10.1111/j.1600-0889.2008.00397.x, 2009. a, b, c, d, e, f, g
Schladitz, A., Müller, T., Nordmann, S., Tesche, M., Groß, S., Freudenthaler, V., Gasteiger, J., and Wiedensohler, A.: In Situ Aerosol Characterization at Cape Verde, Tellus B, 63, 549–572, https://doi.org/10.1111/j.1600-0889.2011.00568.x, 2011. a, b, c, d, e
Sorribas, M., Olmo, F. J., Quirantes, A., Lyamani, H., Gil-Ojeda, M., Alados-Arboledas, L., and Horvath, H.: Role of Spheroidal Particles in Closure Studies for Aerosol Microphysical-Optical Properties: Spheroidal Particles in Aerosol Closure Studies, Q. J. Roy. Meteor. Soc., 141, 2700–2707, https://doi.org/10.1002/qj.2557, 2015. a, b
Spanu, A., Dollner, M., Gasteiger, J., Bui, T. P., and Weinzierl, B.: Flow-induced errors in airborne in situ measurements of aerosols and clouds, Atmos. Meas. Tech., 13, 1963–1987, https://doi.org/10.5194/amt-13-1963-2020, 2020. a
Steiner, G., Attoui, M., Wimmer, D., and Reischl, G. P.: A Medium Flow, High-Resolution Vienna DMA Running in Recirculating Mode, Aerosol Sci. Tech., 44, 308–315, https://doi.org/10.1080/02786821003636763, 2010. a
Textor, C., Schulz, M., Guibert, S., Kinne, S., Balkanski, Y., Bauer, S., Berntsen, T., Berglen, T., Boucher, O., Chin, M., Dentener, F., Diehl, T., Easter, R., Feichter, H., Fillmore, D., Ghan, S., Ginoux, P., Gong, S., Grini, A., Hendricks, J., Horowitz, L., Huang, P., Isaksen, I., Iversen, I., Kloster, S., Koch, D., Kirkevåg, A., Kristjansson, J. E., Krol, M., Lauer, A., Lamarque, J. F., Liu, X., Montanaro, V., Myhre, G., Penner, J., Pitari, G., Reddy, S., Seland, Ø., Stier, P., Takemura, T., and Tie, X.: Analysis and quantification of the diversities of aerosol life cycles within AeroCom, Atmos. Chem. Phys., 6, 1777–1813, https://doi.org/10.5194/acp-6-1777-2006, 2006. a, b
Valenzuela, A., Olmo, F., Lyamani, H., Antón, M., Titos, G., Cazorla, A., and Alados-Arboledas, L.: Aerosol Scattering and Absorption Angström Exponents as Indicators of Dust and Dust-Free Days over Granada (Spain), Atmos. Res., 154, 1–13, https://doi.org/10.1016/j.atmosres.2014.10.015, 2015. a
Vasilatou, K., Wälchli, C., Koust, S., Horender, S., Iida, K., Sakurai, H., Schneider, F., Spielvogel, J., Wu, T. Y., and Auderset, K.: Calibration of Optical Particle Size Spectrometers against a Primary Standard: Counting Efficiency Profile of the TSI Model 3330 OPS and Grimm 11-D Monitor in the Particle Size Range from 300 nm to 10 µm, J. Aerosol Sci., 157, 105818, https://doi.org/10.1016/j.jaerosci.2021.105818, 2021. a
von der Weiden, S.-L., Drewnick, F., and Borrmann, S.: Particle Loss Calculator – a new software tool for the assessment of the performance of aerosol inlet systems, Atmos. Meas. Tech., 2, 479–494, https://doi.org/10.5194/amt-2-479-2009, 2009. a
Waldram, J. M.: Measurement of the Photometric Properties of the Upper Atmosphere, Transactions of the Illuminating Engineering Society, 10, 147–187, https://doi.org/10.1177/147715354501000801, 1945. a
Weinzierl, B., Ansmann, A., Prospero, J. M., Althausen, D., Benker, N., Chouza, F., Dollner, M., Farrell, D., Fomba, W. K., Freudenthaler, V., Gasteiger, J., Groß, S., Haarig, M., Heinold, B., Kandler, K., Kristensen, T. B., Mayol-Bracero, O. L., Müller, T., Reitebuch, O., Sauer, D., Schäfler, A., Schepanski, K., Spanu, A., Tegen, I., Toledano, C., and Walser, A.: The Saharan Aerosol Long-Range Transport and Aerosol – Cloud-Interaction Experiment: Overview and Selected Highlights, B. Am. Meteorol. Soc., 98, 1427–1451, https://doi.org/10.1175/BAMS-D-15-00142.1, 2017. a, b
Wiscombe, W. J.: Improved Mie Scattering Algorithms, Appl. Optics, 19, 1505–1509, https://doi.org/10.1364/AO.19.001505, 1980. a
Yurkin, M. A. and Hoekstra, A. G.: The Discrete-Dipole-Approximation Code ADDA: Capabilities and Known Limitations, J. Quant. Spectrosc. Ra., 112, 2234–2247, https://doi.org/10.1016/j.jqsrt.2011.01.031, 2011. a, b
A light source is Lambertian if the emitted radians are proportional to cos (ϕ), where ϕ is the angle between the direction of the emitted light and the surface normal to the light surface.
- Abstract
- Introduction
- Principle of operation of the Aurora 4000 polar nephelometer
- Angular truncation and illumination correction
- Laboratory closure experiment
- Simulated closure experiment
- Discussion
- Summary and conclusions
- Appendix A: List of symbols
- Data availability
- Author contributions
- Competing interests
- Disclaimer
- Acknowledgements
- Financial support
- Review statement
- References
- Supplement
The requested paper has a corresponding corrigendum published. Please read the corrigendum first before downloading the article.
- Article
(5286 KB) - Full-text XML
- Corrigendum
-
Supplement
(1927 KB) - BibTeX
- EndNote
- Abstract
- Introduction
- Principle of operation of the Aurora 4000 polar nephelometer
- Angular truncation and illumination correction
- Laboratory closure experiment
- Simulated closure experiment
- Discussion
- Summary and conclusions
- Appendix A: List of symbols
- Data availability
- Author contributions
- Competing interests
- Disclaimer
- Acknowledgements
- Financial support
- Review statement
- References
- Supplement