the Creative Commons Attribution 4.0 License.
the Creative Commons Attribution 4.0 License.
 | 08 Jun 2022
Quantification of lightning-produced NOx over the Pyrenees and the Ebro Valley by using different TROPOMI-NO2 and cloud research products
Francisco J. Pérez-Invernón
Heidi Huntrieser
Thilo Erbertseder
Diego Loyola
Pieter Valks
Song Liu
Dale J. Allen
Kenneth E. Pickering
Eric J. Bucsela
Patrick Jöckel
Jos van Geffen
Henk Eskes
Sergio Soler
Francisco J. Gordillo-Vázquez
Jeff Lapierre
Lightning, one of the major sources of nitrogen oxides (NOx) in the atmosphere, contributes to the tropospheric concentration of ozone and to the oxidizing capacity of the atmosphere. Lightning produces between 2 and 8 Tg N yr−1 globally and on average about 250 ± 150 mol NOx per flash. In this work, we estimate the moles of NOx produced per flash (LNOx production efficiency) in the Pyrenees (Spain, France and Andorra) and in the Ebro Valley (Spain) by using nitrogen dioxide (NO2) and cloud properties from the TROPOspheric Monitoring Instrument (TROPOMI) as well as lightning data from the Earth Networks Global Lightning Network (ENGLN) and from the EUropean Co-operation for LIghtning Detection (EUCLID). The Pyrenees are one of the areas in Europe with the highest lightning frequencies, which, along with their remoteness as well as their very low NOx background, enables us to better distinguish the LNOx signal produced by recent lightning in TROPOMI NO2 measurements. We compare the LNOx production efficiency estimates for eight convective systems in 2018 using two different sets of TROPOMI research products provided by the Royal Netherlands Meteorological Institute (KNMI) and the Deutsches Zentrum für Luft- und Raumfahrt (DLR). According to our results, the mean LNOx production efficiency in the Pyrenees and in the Ebro Valley, using a 3 h chemical lifetime, ranges between 14 and 103 mol NOx per flash from the eight systems. The mean LNOx production efficiency estimates obtained using both TROPOMI products and ENGLN lightning data differ by ∼ 23 %, while they differ by ∼ 35 % when using EUCLID lightning data. The main sources of uncertainty when using ENGLN lightning data are the estimation of background NOx that is not produced by lightning and the time window before the TROPOMI overpass that is used to count the total number of lightning flashes contributing to freshly produced LNOx. The main source of uncertainty when using EUCLID lightning data is the uncertainty in the detection efficiency of EUCLID.
- Article
(9596 KB) - Full-text XML
-
Supplement
(10319 KB) - BibTeX
- EndNote


Lightning is one of the major sources of nitrogen oxides (NOx = NO + NO2) in the upper troposphere (e.g., Schumann and Huntrieser, 2007, and references therein). Lightning channels are formed by plasma reaching several thousands of kelvin (Wallace, 1964). Such a high temperature produces dissociation of nitrogen and oxygen air molecules (Ripoll et al., 2014b, a; Kieu et al., 2021), contributing to the formation of NOx by the Zeldovich mechanism (Zeldovich et al., 1947). Lightning-induced nitrogen oxides (LNOx) contribute about 10 % to global NOx emissions and play an important role in determining the concentrations of ozone and other chemical species in the upper troposphere as well as the oxidizing capacity of the atmosphere (e.g., Labrador et al., 2005; Schumann and Huntrieser, 2007; Murray et al., 2012; Gordillo-Vázquez et al., 2019). Lightning produces between 2 and 8 Tg N yr−1 globally (100–400 mol NOx per flash), and on average about 250 mol NOx per flash (Schumann and Huntrieser, 2007).
Reducing the uncertainty of the NOx production by lightning and understanding the factors that influence this production is still a challenge. Aircraft measurements have significantly contributed to determining the production of NOx per flash, or the LNOx production efficiency (PE) (e.g., Huntrieser et al., 2002, 2016; Allen et al., 2021b). However, aircraft campaigns cannot provide continuous monitoring of LNOx and are difficult to carry out in some regions. Nadir-viewing satellite instruments such as the Ozone Monitoring Instrument (OMI), the SCanning Imaging Absorption spectroMeter for Atmospheric CHartographY (SCIAMACHY) and the TROPOspheric Monitoring Instrument (TROPOMI) measure spectra that are employed to estimate column densities of NO2 over thunderstorms. Several authors have used OMI NO2 measurements to estimate the LNOx PE in a case-based approach or systematically over different regions (Beirle et al., 2010; Marais et al., 2018), including midlatitude regions (Bucsela et al., 2019), tropical regions (Allen et al., 2019) and the US (e.g., Pickering et al., 2016; Lapierre et al., 2020; Zhang et al., 2020; Allen et al., 2021a). Satellite-based measurements can help us to estimate LNOx amounts over regions where aircraft campaigns are rare, or to systematically investigate possible relationships between the characteristics of thunderstorms and LNOx over different geographical regions (Bucsela et al., 2019). However, the opacity of thunderclouds can strongly affect the retrieval of NO2 (Beirle et al., 2009), while convection can transport NOx released at the surface to the upper troposphere, where it is mixed with freshly produced LNOx. Therefore, the use of atmospheric and radiative models in combination with NO2 measurements is needed to estimate the NOx production efficiency (LNOx PE).
The TROPOMI instrument on board the European Space Agency's Sentinel-5 Precursor (S5P) satellite was launched on 13 October 2017. TROPOMI operates from a low earth polar orbit, providing daily global measurements of several trace gases (including NO2) and cloud properties (Veefkind et al., 2012). The horizontal resolution at nadir was 3.6 km × 7.2 km before 6 August 2019; it has been 3.6 km × 5.6 km since then. This unprecedented spatial resolution represents a unique opportunity to investigate the LNOx PE from satellite measurements. Recently, Allen et al. (2021a) used, for the first time, TROPOMI measurements to estimate the LNOx PE for 29 cases in the USA lightning data from the Earth Network Global Lightning Network (ENGLN) and from the Geostationary Lightning Mapper (GLM) aboard the Geostationary Operational Environmental Satellite-16 (GOES-16). They reported 175 ± 100 and 120 ± 65 mol NOx per flash using ENGLN and GLM lightning data, respectively. These values are at the lower end of the globally averaged LNOx PE of 250 ± 150 mol NOx per flash as given by Schumann and Huntrieser (2007).
In this work, we, for the first time, quantify the amount of LNOx over the Pyrenees and the Ebro Valley in Spain by using different TROPOMI-NO2 and cloud research products provided by two European research institutes, the Royal Netherlands Meteorological Institute (KNMI) and the Deutsches Zentrum für Luft- und Raumfahrt (DLR). The Pyrenees are one of the areas in Europe with the highest lightning frequencies (Molinie et al., 1999; Pineda et al., 2010; Anderson and Klugmann, 2014), and are a suitable place to distinguish the LNOx signal due to their remoteness and very low NOx background (Vinken et al., 2014). Airflows over the studied areas are influenced by the proximity of the Mediterranean Sea and the Atlantic Ocean, the high mountains of the Pyrenees, cold fronts crossing Europe, and a thermal low centered over the Iberian Peninsula (Pineda et al., 2010). In this study, we analyze eight thunderstorms that took place in April and May (the months with the highest occurrence of lightning in Spain; Pineda et al., 2010) of 2018. During late spring, lightning activity in the area reaches its maximum over the mountains and is driven by solar heating (Esteban et al., 2006; Pineda et al., 2010). Therefore, we expect that during this time of the year, a number of thunderstorms are active during the TROPOMI overpass (∼ 13:30 LT). We combine two TROPOMI research products with lightning data from the ENGLN (Zhu et al., 2017; Lapierre et al., 2020) and the EUropean Co-operation for LIghtning Detection (EUCLID) (Schulz et al., 2016) systems. Apart from providing new valuable estimates of LNOx for Europe, this analysis will enable us to quantify the effect of using different lightning data sets and different TROPOMI NO2 and cloud research products for the estimates of LNOx PE. It is important to emphasize that the analyzed thunderstorms are not confined to the Pyrenees; they include lightning in adjacent regions where significant boundary layer pollution can be present. Therefore, a careful analysis of the background NOx is stil needed to estimate the LNOx for the analyzed cases.
2.1 TROPOMI NO2 and cloud research products
We use TROPOMI NO2 and cloud research products for eight deep convective systems observed in the Pyrenees and adjacent regions between April and May 2018. TROPOMI is a passive imaging spectrometer with eight spectral bands covering the ultraviolet (UV), visible (VIS), near-infrared (NIR) and short-wavelength IR (SWIR) spectral regions (Veefkind et al., 2012). TROPOMI provides spectral data that are combined with different methods/algorithms to retrieve NO2 column densities and cloud properties (e.g., Wang et al., 2008; Loyola et al., 2018; Marais et al., 2021; S. Liu et al., 2021). In this work, we use two different sets of TROPOMI research products. The variables extracted from the TROPOMI products are the slant column density (SCD) of NO2, the error in the SCD of NO2, the quality assurance (QA) value, the stratospheric vertical column density (VCD) of NO2, the stratospheric air mass factor (AMF), the cloud fraction (CF) and the optical centroid pressure (OCP).
The first set of TROPOMI research products are referred to here as the Royal Netherlands Meteorological Institute (KNMI) version 2.1 research product (Allen et al., 2021a; van Geffen et al., 2022; Zhang et al., 2022) (TROP-KNMI), based on the official TROPOMI NO2 Algorithm Theoretical Basis Document (ATBD) (van Geffen et al., 2021). This product is not automatically produced for all the TROPOMI orbits. We produce it on a case-by-case basis as needed to analyze particular thunderstorms. The TROP-KNMI cloud research product is based on the Fast Retrieval Scheme for Clouds from the Oxygen A-band-S (FRESCO-S) algorithm with the Cloud as Reflecting Boundaries (CRB) model of clouds (Koelemeijer et al., 2001). In the CRB model, clouds are described as Lambertian reflecting boundaries. The separation of the contributions of the troposphere and stratosphere to the NO2 column density for the TROP-KNMI NO2 research product is based on a priori chemical profiles from the chemistry transport model TM5-MP (Williams et al., 2017; Myriokefalitakis et al., 2020). We use version 2.1_test of this product, a modified NO2 product that increases the data coverage for bright pixels over deep convective clouds and includes spike removal to better deal with saturation and blooming effects in the radiance spectra (Williams et al., 2017; Ludewig et al., 2020; Allen et al., 2021a). The reflectance value at 440 nm is reconstructed from the differential optical absorption spectroscopy (DOAS) method polynomial and the ring correction used as input to the routine that calculates the cloud (radiance) fraction in the NO2 window. We refer to van Geffen et al. (2020) and Allen et al. (2021a) for a detailed description of the TROP-KNMI NO2 and cloud research products. Following Allen et al. (2021a), we use pixels with quality assurance values above 0.28 (fair or better quality). This selection ensures that the NO2 SCD error is less than 2 × 10¹⁹ molec m−2.
We refer to the second set of TROPOMI research products as the Deutsches Zentrum für Luft- und Raumfahrt (DLR) research product (TROP-DLR). The TROP-DLR cloud research product uses the OCRA/ROCINN algorithms for retrieving cloud properties (Loyola et al., 2018). The cloud properties provided by ROCINN uses the Clouds-As-Layers (CAL) model (Loyola et al., 2018). In the CAL model, clouds are treated as optically uniform layers using a more realistic cloud scattering model than the CRB model (Lindfors et al., 2018). This product is produced on a case-by-case basis as needed to analyze particular thunderstorms. We refer to Loyola et al. (2018) for a more extended description of the TROP-DLR cloud research product. The TROP-DLR NO2 research product uses the Directionally dependent STRatospheric Estimation Algorithm from Mainz (DSTREAM) to separate the contributions of the troposphere and stratosphere to the NO2 column density (Y. Liu et al., 2021). This method does not require any input from atmospheric models. The DSTREAM method does not distinguish free tropospheric diffuse NO2 from stratospheric NO2. This is different from the TROP-KNMI approach, where the free tropospheric column is derived from the TM5-MP profiles. In the case of TROP-KNMI, the stratospheric NO2 retrieval does not include free tropospheric NO2, while it does include free tropospheric NO2 in the case of the TROP-DLR product. So, we expect the tropospheric background to be substantially higher in the TROP-KNMI product than in the TROP-DLR product. A detailed description of the TROP-DLR NO2 research product can be found in (Y. Liu et al., 2021). In this work, we use pixels with an NO2 SCD error lower than 2 × 10¹⁹ molec m−2 to be consistent with the QA threshold defined for the TROP-KNMI product.
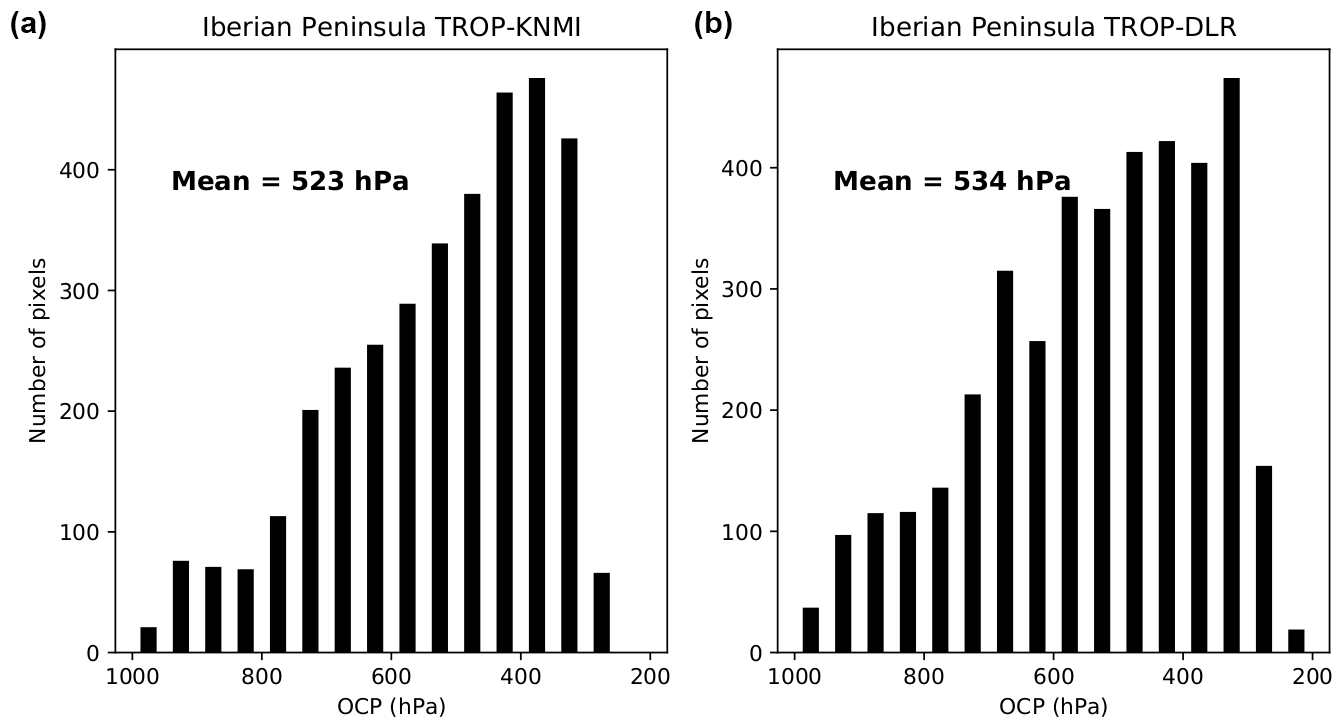
Figure 1Distributions of OCP for pixels containing ENGLN flashes 5 h prior to the TROPOMI overpass for the TROP-KNMI (a) and the TROP-DLR (b) products in all the studied cases.
Pixels with deep convection are defined as pixels in which the effective cloud fraction is greater than 0.95 (Allen et al., 2021a) and the OCP value is lower than a threshold. The threshold is defined as the averaged OCP for all lightning flashes included in this study. We calculate it using the OCP values for all pixels containing lightning flashes during the 5 h period before the TROPOMI overpass according to the TROPOMI cloud products, providing that the OCP value is not undefined. The averaged OCPs for the TROP-KNMI and the TROP-DLR products are 523 and 534 hPa, respectively. These pressures are slightly higher than the 500 hPa threshold employed by Pickering et al. (2016) and Allen et al. (2021a) for deep convective systems over the USA. Figure 1 shows the distributions of OCP values for TROP-KNMI and TROP-DLR using ENGLN lightning data over all the studied cases. Both distributions peak at around 400 hPa, while there are more lightning flashes in pixels with OCP values between 650 and 500 hPa in the TROP-DLR product than in the TROP-KNMI product (3923 versus 3489 pixels). We calculated the t-test for the means of the OCP distributions plotted in Fig. 1 and obtained a p-value lower than 0.05. This p-value indicates that differences in the mean OCPs derived from the TROP-KNMI and the TROP-DLR products are statistically significant.
2.2 Lightning measurements
We apply lightning data provided by two lightning location systems, ENGLN and EUCLID, to calculate the amount of LNOx produced per flash (or LNOx PE).
The ENGLN is a global network composed of both broadband sensors from the Earth Networks Total Lightning Network (Liu et al., 2014) and very low frequency (VLF) sensors from the World Wide Lightning Location Network (Hutchins et al., 2012) that provide the position, time of occurrence, polarity and peak current of each lightning stroke. ENGLN has a detection efficiency (DE) of about 90 % for cloud-to-ground (CG) strokes over the USA (Marchand et al., 2019). In this work, we use the flash product provided by ENGLN. This product is based on the flash criteria proposed by Liu and Heckman (2011) to cluster these strokes into flashes; two strokes are part of the same flash if they occur in a 0.7 s temporal window and in a 10 km spatial window.
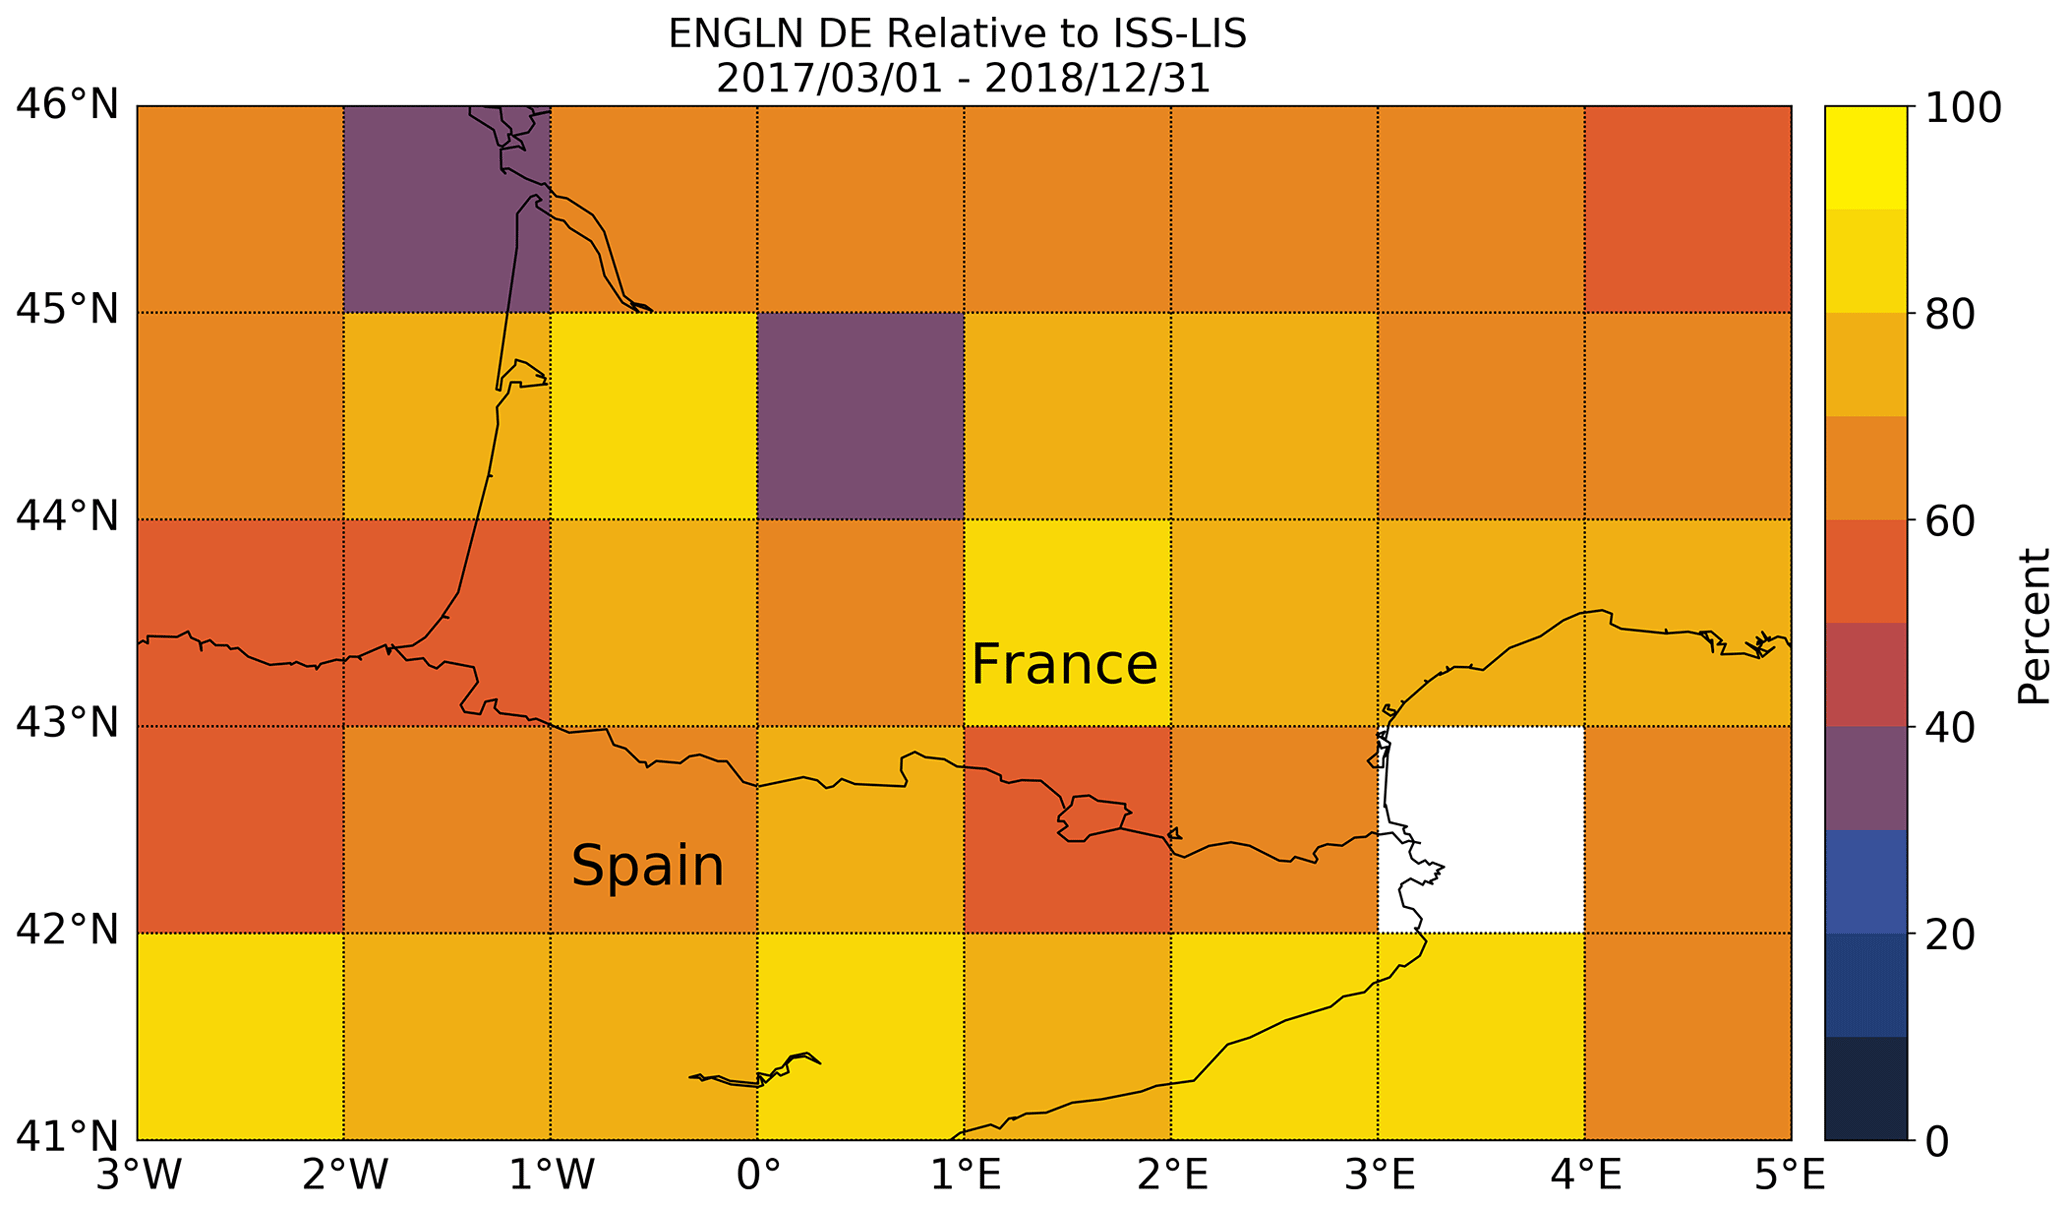
Figure 2Spatial distribution of the ENGLN DE (in %) relative to ISS-LIS between March 2017 and December 2018 over northern Spain, southern France and Andorra.
We use lightning data from the Lightning Imaging Sensor (LIS) onboard the International Space Station (ISS) (Blakeslee et al., 2020) to estimate the DE of ENGLN over the Pyrenees. ISS-LIS detects optical emissions from lightning with a frame integration time of 1.79 ms and a spatial resolution of 4 km (Bitzer and Christian, 2015; Blakeslee et al., 2020). LIS sorts contiguous events into groups and clusters groups into flashes with a temporal criterion of 330 ms and a spatial criterion of 5.5 km (Mach et al., 2007). ISS-LIS has a spatially uniform DE of about 60 %. We compare ENGLN and ISS-LIS lightning data over the Pyrenees using the Bayesian approach proposed by Bitzer et al. (2016), with 330 ms and 25 km as the matching criteria. The Bayesian approach is more accurate than a direct comparison between lightning data, as neither of the detection systems can be characterized as the truth. We show in Fig. 2 the spatial distribution of the obtained ENGLN DE over the Pyrenees. The average DE in this region is 68 ± 12 % based on 30 thunderstorms simultaneously detected over the area by ENGLN and ISS-LIS.
EUCLID is a European network composed of 149 lightning sensors manufactured by Vaisala Inc. and distributed over Europe (Schulz et al., 2016). Despite the high DE of EUCLID over Europe, the mean DE of EUCLID over the Pyrenees and the Ebro Valley is only about 30 %–60 % (Poelman and Schulz, 2020) because of the low number of stations over that area and in Africa. We have selected two thunderstorms that took place between April and May 2018 over the Pyrenees and the Ebro Valley and were simultaneously detected by EUCLID and ISS-LIS. We have compared the total number of flashes reported by EUCLID and ISS-LIS in both thunderstorms, calculating a DE of 0.40 in the Pyrenees and a DE of 0.15 in the Ebro Valley. We use 27 % ± 12 % as the DE correction for EUCLID. The significant difference between the DEs of EUCLID and ENGLN over the Pyrenees represents a good opportunity to investigate the influence of the lightning location system (LSS) DE on the LNOx PE.
2.3 Meteorological and chemistry data
As we will describe in Sect. 2.4, estimating the tropospheric background concentration of NOx (NOx that is not produced by lightning) is essential for the calculation of LNOx. Although the Pyrenees are an area with a relatively low background NOx concentration (Vinken et al., 2014), tropospheric background NOx can be transported from the boundary layer to the upper troposphere by convection or advected from the Ebro Valley or the city of Barcelona. Therefore, we cannot neglect the background NOx, and we have to subtract it from the satellite measurements of VCD. To account for this, we use a combination of meteorological and chemical data, as described below.
We use meteorological data provided by the European Centre for Medium-Range Weather Forecasts (ECMWF) ERA5 reanalysis data set. In this work, we use the 1-hourly ERA5 horizontal wind averaged between the 200 and 500 hPa pressure levels with a horizontal resolution of 0.25∘. For each TROPOMI pixel containing lightning flashes prior to the TROPOMI overpass, we use the wind velocity and direction to estimate the advection of LNOx. All the pixels that satisfy the deep convection constraint and are not influenced by the spread of LNOx are then considered non-flashing pixels and are employed to estimate the background NOx.
Alternatively, we use airborne measurements to estimate the background NO. Measurements of NOx over convective systems are rare, and no airborne campaigns over convective systems in the Pyrenees and the Ebro Valley have been undertaken. However, we have found NO measurements taken over a convective system in the studied area from the In-service Aircraft for a Global Observing System (IAGOS) and from the Civil Aircraft for the Regular Investigation of the Atmosphere Based on an Instrument Container (CARIBIC) (Brenninkmeijer et al., 2007). On 22 June 2005, a CARIBIC flight passed over a convective system in the Pyrenees. Unfortunately, we do not have access to lightning data for that day, only cloud satellite products. However, the measured ratio NO NOy can be used to estimate the age of the freshly produced NOx (Huntrieser et al., 2002). The measured ratio of NO to NOy (about 0.1) during the passage over the convective system suggests no impact of fresh LNOx. The measured mixing ratio of CO can be used as a proxy for upward transport of NO from the boundary layer (Huntrieser et al., 2002). Simultaneous increases of CO and NO measured on the 22 June 2005 flight suggest upward transport of polluted boundary layer air, confirming that the airplane passed across a convective system. The measured mixing ratio of NO at 12 km altitude during the passage over the convective system was 0.3 ± 0.1 ppb, in agreement with previous airborne NO measurements over convective systems without lightning in Europe during the EULINOX campaign (Huntrieser et al., 2002). We assume a NO NO2 ratio in the upper troposphere of 2 mol mol−1 (Silvern et al., 2018). Therefore, we use 0.45 ppb as an alternative to the estimation of the background NOx from non-flashing pixels.
We can estimate the VCD of NOx using CARIBIC measurements at 12 km. We assume that the shape of the vertical profile of NOx for the 22 June 2005 convective system is similar to the mean vertical profile of NOx in Europe reported by Huntrieser et al. (2002) (Fig. 7a in Huntrieser et al., 2002). Using the shape of the EULINOX profile and the CARIBIC measurement at 12 km, we can estimate the mixing ratio of NOx between the surface and the 12 km level. Finally, we can integrate the vertical profile to obtain the VCD of NOx, resulting in 0.75 × 10¹⁹ molec m−2. This value is within the range of the average background tropospheric NOx for the TROP-KNMI and the TROP-DLR research products: 1.06 × 10¹⁹ and 0.37 × 10¹⁹ molec m−2, respectively (see Tables 1 and 2).
Table 1Results for the eight studied cases from 2018 using the TROP-KNMI research product. The values of Vtropbck 10th/30th correspond to the background-NOx calculated as the 30th and the 10th percentiles of over non-flashing pixels with deep convection, respectively.
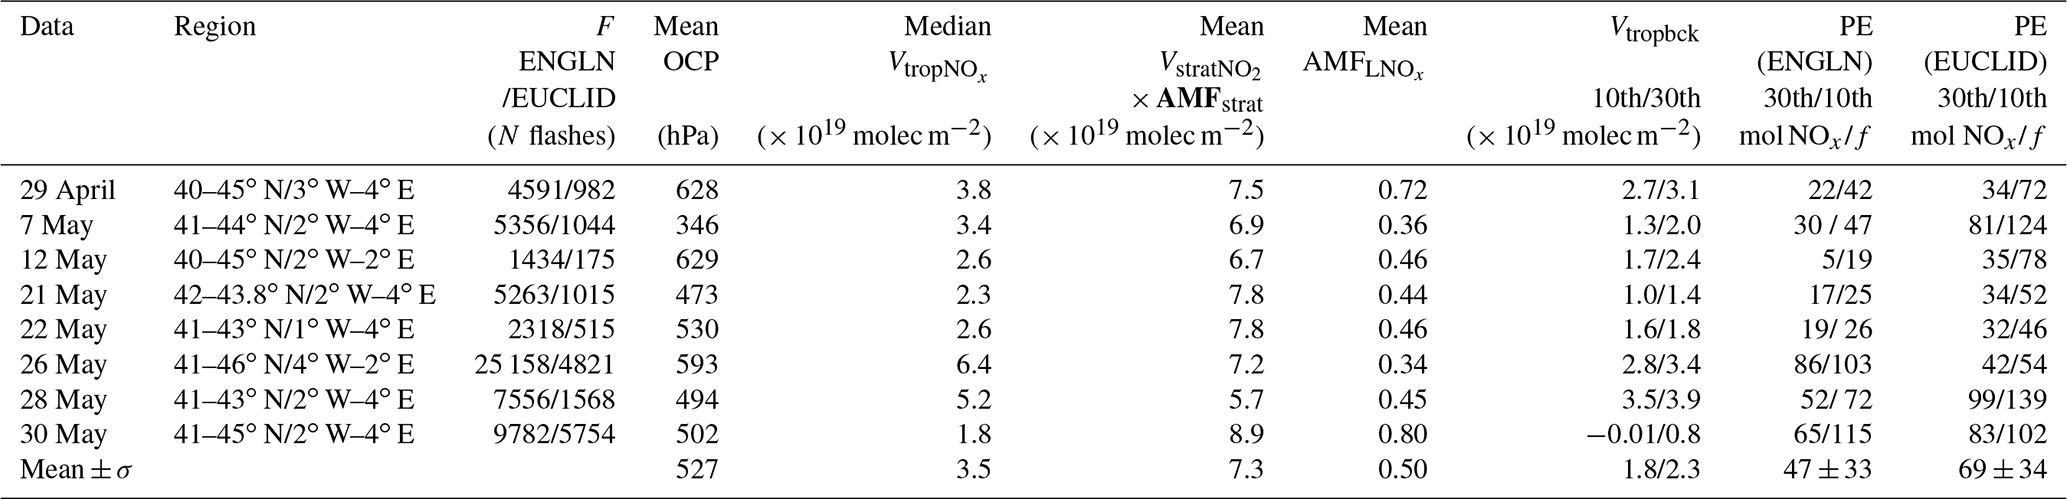
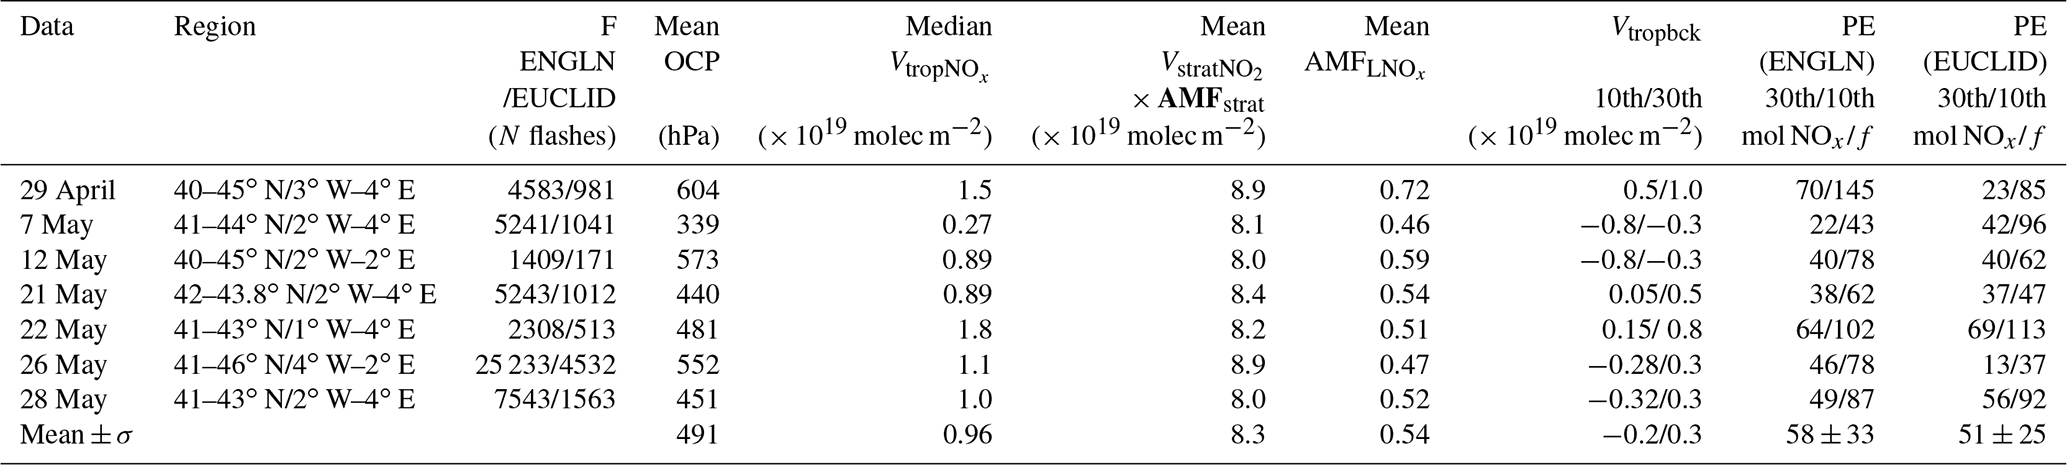
Table 2Results for the seven studied cases from 2018 using the TROP-DLR research product. The values of Vtropbck 10th/30th correspond to the background-NOx calculated as the 30th and the 10th percentiles of over non-flashing pixels with deep convection, respectively.
2.4 Calculation of the LNOx air mass factor
TROPOMI provides total NO2 SCD. In the case of cloudy pixels, TROPOMI provides the NO2 SCD over the cloud top and in the upper parts of the clouds. As we will see in Sect. 2.5, our LNOx PE algorithm requires the LNOx VCD to be determined from the NO2 SCD. The ratio used to convert the NO2 SCD to the LNOx VCD is denoted AMF, and its calculation requires a priori estimations of the mean LNO2 and LNOx profiles over the studied region (Pickering et al., 2016) and of the absorption of the atmosphere (Beirle et al., 2009; Bucsela et al., 2013). The AMF is obtained by calculating the scattering weights for each of the eight studied cases using the viewing geometry and the cloud properties for each pixel. It is important to note that a conversion of the NO2 SCD into the NO2 VCD using an overall AMF followed by a conversion of the NO2 VCD into the NOx VCD using the mean NO2 to NOx ratio is not appropriate, as explained by Beirle et al. (2009).
We employ the ECMWF–Hamburg (ECHAM)/Modular Earth Submodel System (MESSy version 2.54.0) Atmospheric Chemistry (EMAC) model (Jöckel et al., 2016) to extract the mean LNO2 and LNOx profiles over the studied area by performing two simulations (with and without lightning). We perform the simulations following the Quasi Chemistry-Transport Model (QCTM) mode proposed by Deckert et al. (2011). Firstly, we perform a 1-year global simulation (1 January 2018 to 1 January 2019) without lightning that is nudged towards ERA-Interim reanalysis meteorological fields. Secondly, we perform a second simulation with lightning for the same period using meteorological fields that are numerically identical to those in the simulation without lightning. The QCTM mode decouples the dynamics from the chemistry in order to operate the model as a chemistry-transport model, implying that small chemical perturbations do not alter the simulated meteorology by introducing noise (Deckert et al., 2011). The simulations are conducted at T42L90MA resolution, i.e., with a quadratic Gaussian grid of 2.8∘ × 2.8∘ in latitude and longitude, 90 vertical levels reaching up to the 0.01 hPa pressure level, and 720 s time steps (Jöckel et al., 2016). LNOx is calculated by using the MESSy submodel LNOX (Tost et al., 2007). Lightning is parameterized according to the updraft velocity (Grewe et al., 2001) and using a scaling factor that ensures a global lightning occurrence rate of ∼ 45 flashes per second (Christian et al., 2003; Cecil et al., 2014). We set the production of NOx per flash following Price et al. (1997) and employ the C-shaped vertical profiles of LNOx reported by Pickering et al. (1998). We use the same chemical setup and chemical mechanism as described by Jöckel et al. (2016) for RC1 simulations.
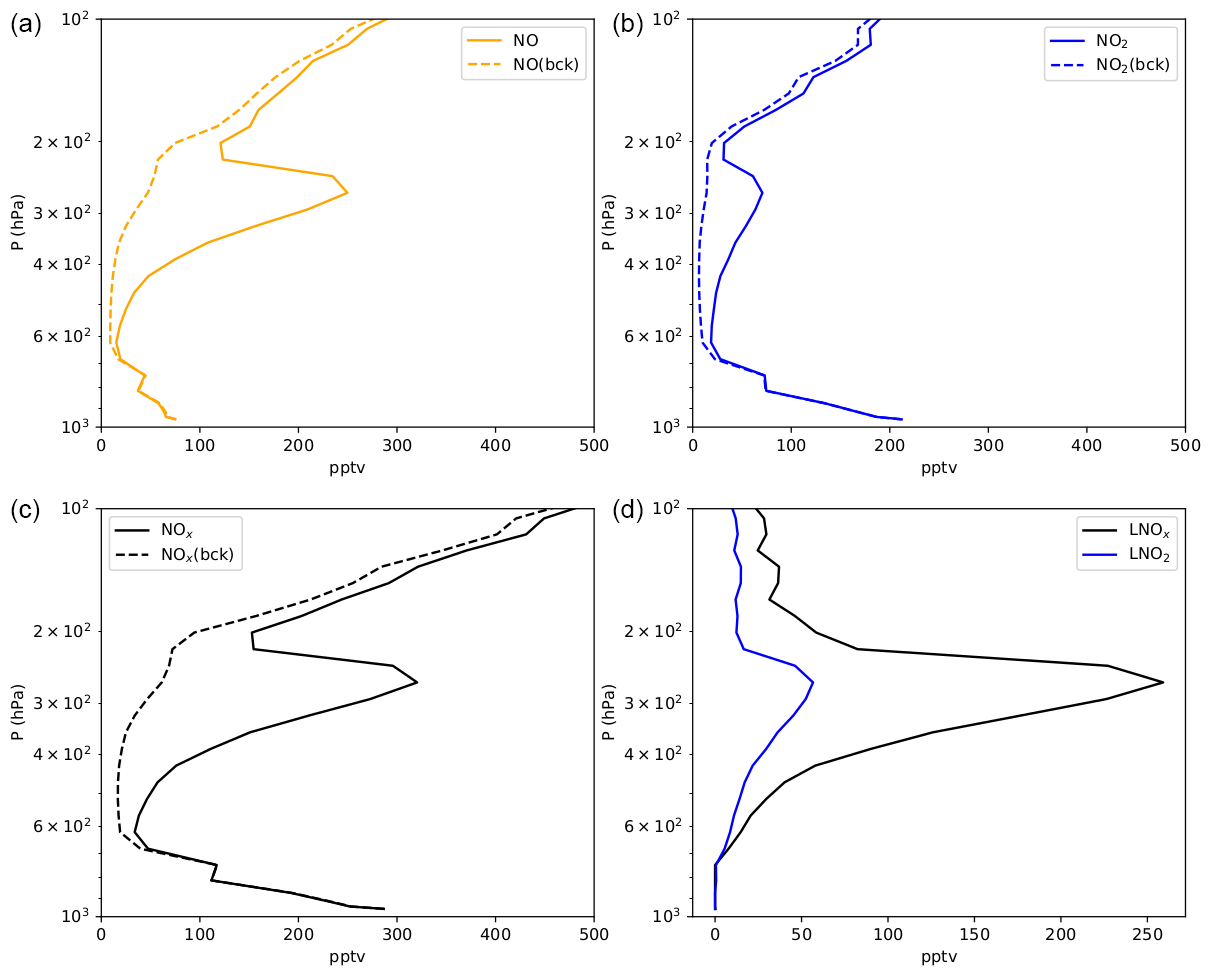
Figure 3Vertical mixing ratio profiles of NO (a), NO2 (b), NOx (c), LNOx and LNO2 (d) extracted from EMAC simulations with (solid lines) and without (dashed lines) lightning (background: bck) on 13 May 2018 at 12:00 LT (close to the TROPOMI overpass).
We extract the vertical profiles of NO and NO2 with and without lightning for May 2018 that are coincident with the TROPOMI overpass time to calculate the LNO2 and LNOx vertical profiles. We find that the day in May 2018 with the highest LNOx column density is 13 May 2018. Figure 3 shows the vertical profiles obtained from the EMAC simulations. Both the LNOx and the LNO2 vertical profiles peak between the 300 and 250 hPa pressure levels (between ∼ 9 and 11 km altitude), while the vertical profiles of LNOx and LNO2 calculated by Pickering et al. (2016) over the Gulf of Mexico peak at about 150 hPa. The reason for this difference is that thunderstorms are taller at sub-tropical latitudes than at midlatitudes. Non-negligible LNOx and LNO2 values between 100 and 200 hPa (Fig. 3) may have been transported to the Pyrenees from tropical latitudes.
We use the LNO2 and LNOx vertical profiles from the simulations to calculate the AMF following Bucsela et al. (2013). We use the TOMRAD forward vector radiative transfer model (Dave, 1965) to calculate the scattering weights for each of the eight studied cases using the viewing geometry and the cloud properties for each pixel, which depend on the TROPOMI cloud product. We obtain AMF values ranging between 0.28 and 0.71.
2.5 Calculation of the LNOx PE
We use the TROPOMI LNOx PE method proposed by Allen et al. (2021a). Figure 4 shows an overview graphic indicating the variables that are included in the calculation of the LNOx PE. The sources of these variables are TROPOMI products, lightning data, simulations and parameters that are introduced based on the literature. The LNOx PE is calculated as
where PE is the moles of NOx produced per flash, is the tropospheric column of NOx produced by recent lightning (molec cm−2) and calculated from the TROP NO2, A is the area (cm−2) of the thunderstorm with deep convection or with undefined OCP, NA is Avogadro's number (molec mol−1), DE is the detection efficiency of ENGLN or EUCLID, and τ is the lifetime of NOx in the near field of convection, assumed to be 3 h (Nault et al., 2017; Allen et al., 2021a). The lifetime is uncertain and can vary between 2 h and 2 d (e.g., Pickering et al., 1998; Beirle et al., 2010; Nault et al., 2017, and references therein), as it depends on the height at which LNOx is emitted, the proximity to deep convection and how it is transported by convection in each particular thunderstorm. ti is the age of an individual flash at the time of the overpass (the time since the flash occurred), and F is the total number of flashes 5 h prior to the TROPOMI overpass of each pixel. We use a 5 h flash window because it is larger than the assumed 3 h lifetime of NOx in the near field of convection. Sensitivity studies using other flash windows are performed in Sect. 3.3. is calculated as
where is the vector containing the VCD NOx over pixels with deep convection or with an undefined cloud fraction, and Vtropbck is the background NOx. We use the median instead of the mean of the in order to remove the influence of possible outlier pixels. is defined as
where is the vector containing the SCD of NO2, is the vector containing the stratospheric VCD of NO2, and AMFstrat is the matrix of stratospheric AMF. As previously explained by Allen et al. (2021a), the values of and AMFstrat are sometimes missing over pixels affected by deep convection. Therefore, using the average × AMFstrat product increases the number of pixels available to estimate .
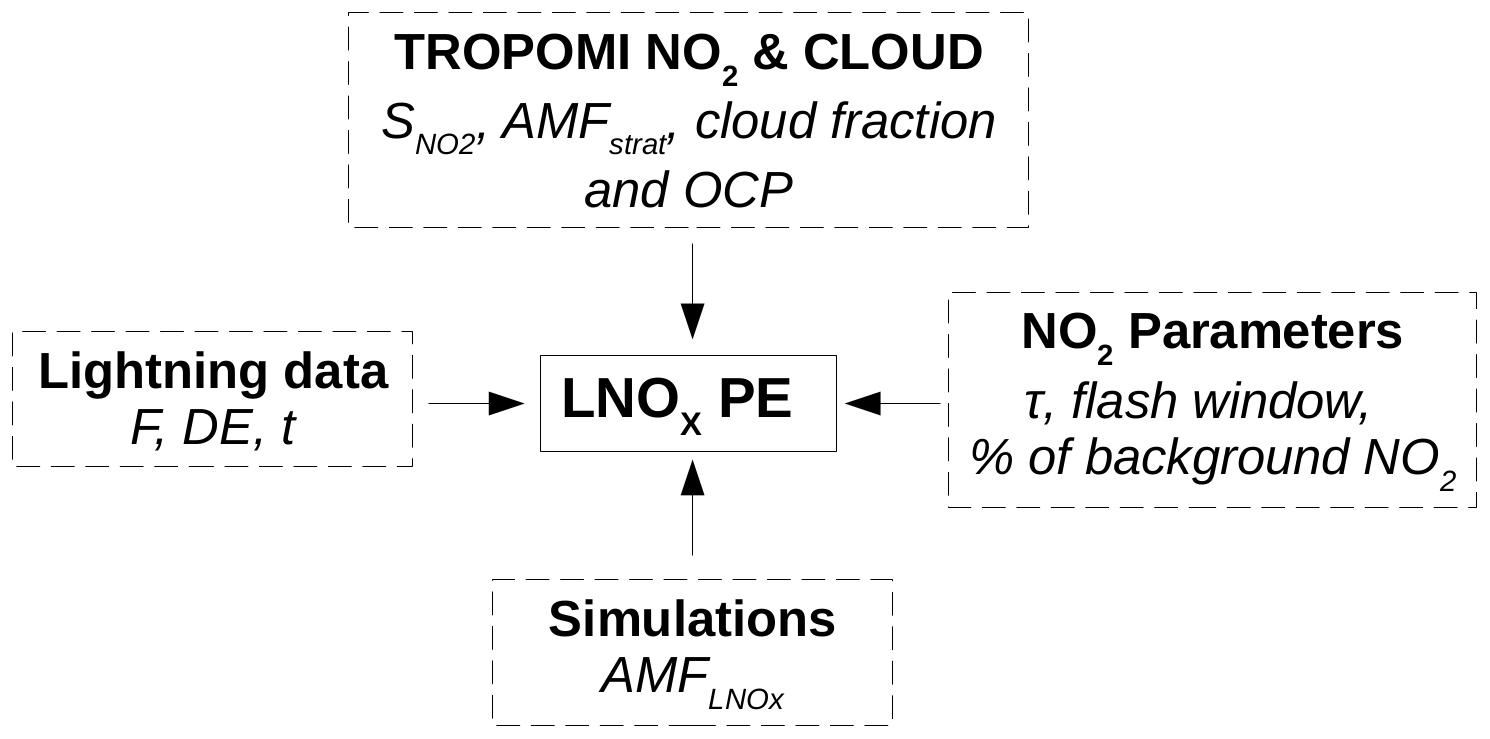
Figure 4Overview graphic showing the variables that are included in the calculation of the LNOx PE.
Following Allen et al. (2021a), we calculate Vtropbck as the 30th and the 10th percentiles of over non-flashing pixels with deep convection. These percentiles are in agreement with airborne measurements taken during the EULINOX campaign (Huntrieser et al., 2002). Alternatively, we calculate the background as the mean concentration averaged over 3 d with low lightning activity over the Pyrenees from TROPOMI data and using CARIBIC measurements in a convective system with low lightning activity over the Pyrenees (as described in Sect. 2.3). Several events are outside the Pyrenees, with considerably higher background NOx. Thus, the local tropospheric background estimate over the clean Pyrenees can be considered a lower limit.
2.6 Calculation of the background NOx based on days with low lightning activity
Apart from calculating the background NOx from non-flashing pixels in a case-based approach, we have selected three cases with low lightning activity before the TROPOMI overpass to estimate the mean background NOx over convective systems. In particular, we have used TROPOMI measurements taken on 8, 12 and 13 April 2018 in the region encompassing 41–45∘ N latitude and 3∘ W–5∘ E longitude. The total number of lightning flashes 3 h prior to the TROPOMI overpass for the three studied cases were 149, 65 and 50, respectively. The mean values during these days using the TROP-KNMI research product were 1.07 × 10¹⁹, 1.98 × 10¹⁹ and 0.39 × 10¹⁹ molec m−2, while the values using the TROP-DLR research product were 0.37 × 10¹⁹, 1.00 × 10¹⁹ and −0.5 × 10¹⁹ molec m−2. Negative values suggest that the average stratospheric column exceeds the local vertical column (Eq. 3) or that the tropospheric background exceeds the signal (Eq. 2). The average background values for the TROP-KNMI and the TROP-DLR research products were, respectively, 1.06 × 10¹⁹ and 0.37 × 10¹⁹ molec m−2. These estimates are, respectively, slightly above and below the background VCD of NOx estimated using CARIBIC measurements (0.75 × 10¹⁹ molec m−2).
In this section, we present LNOx estimates for eight selected cases. We describe the TROPOMI product for the selected cases in Sect. 3.1. The LNOx PE estimates are presented in Sect. 3.2, while a sensitivity analysis of the results is discussed in Sect. 3.3.
3.1 Selected case studies
The eight selected cases correspond to eight thunderstorms that were active no more than 5 h before the TROPOMI overpass on the following days: 29 April, 7 May, 12 May, 21 May, 22 May, 26 May, 28 May and 30 May 2018. Unfortunately, the TROP-DLR research product was not available for the case on 30 May 2018 because the raw data files are missing. In addition, the thunderstorm that took place on 26 May 2018 had significant lightning activity between 45 and 46∘ N, but we do not have access to EUCLID data north of 45∘ N.
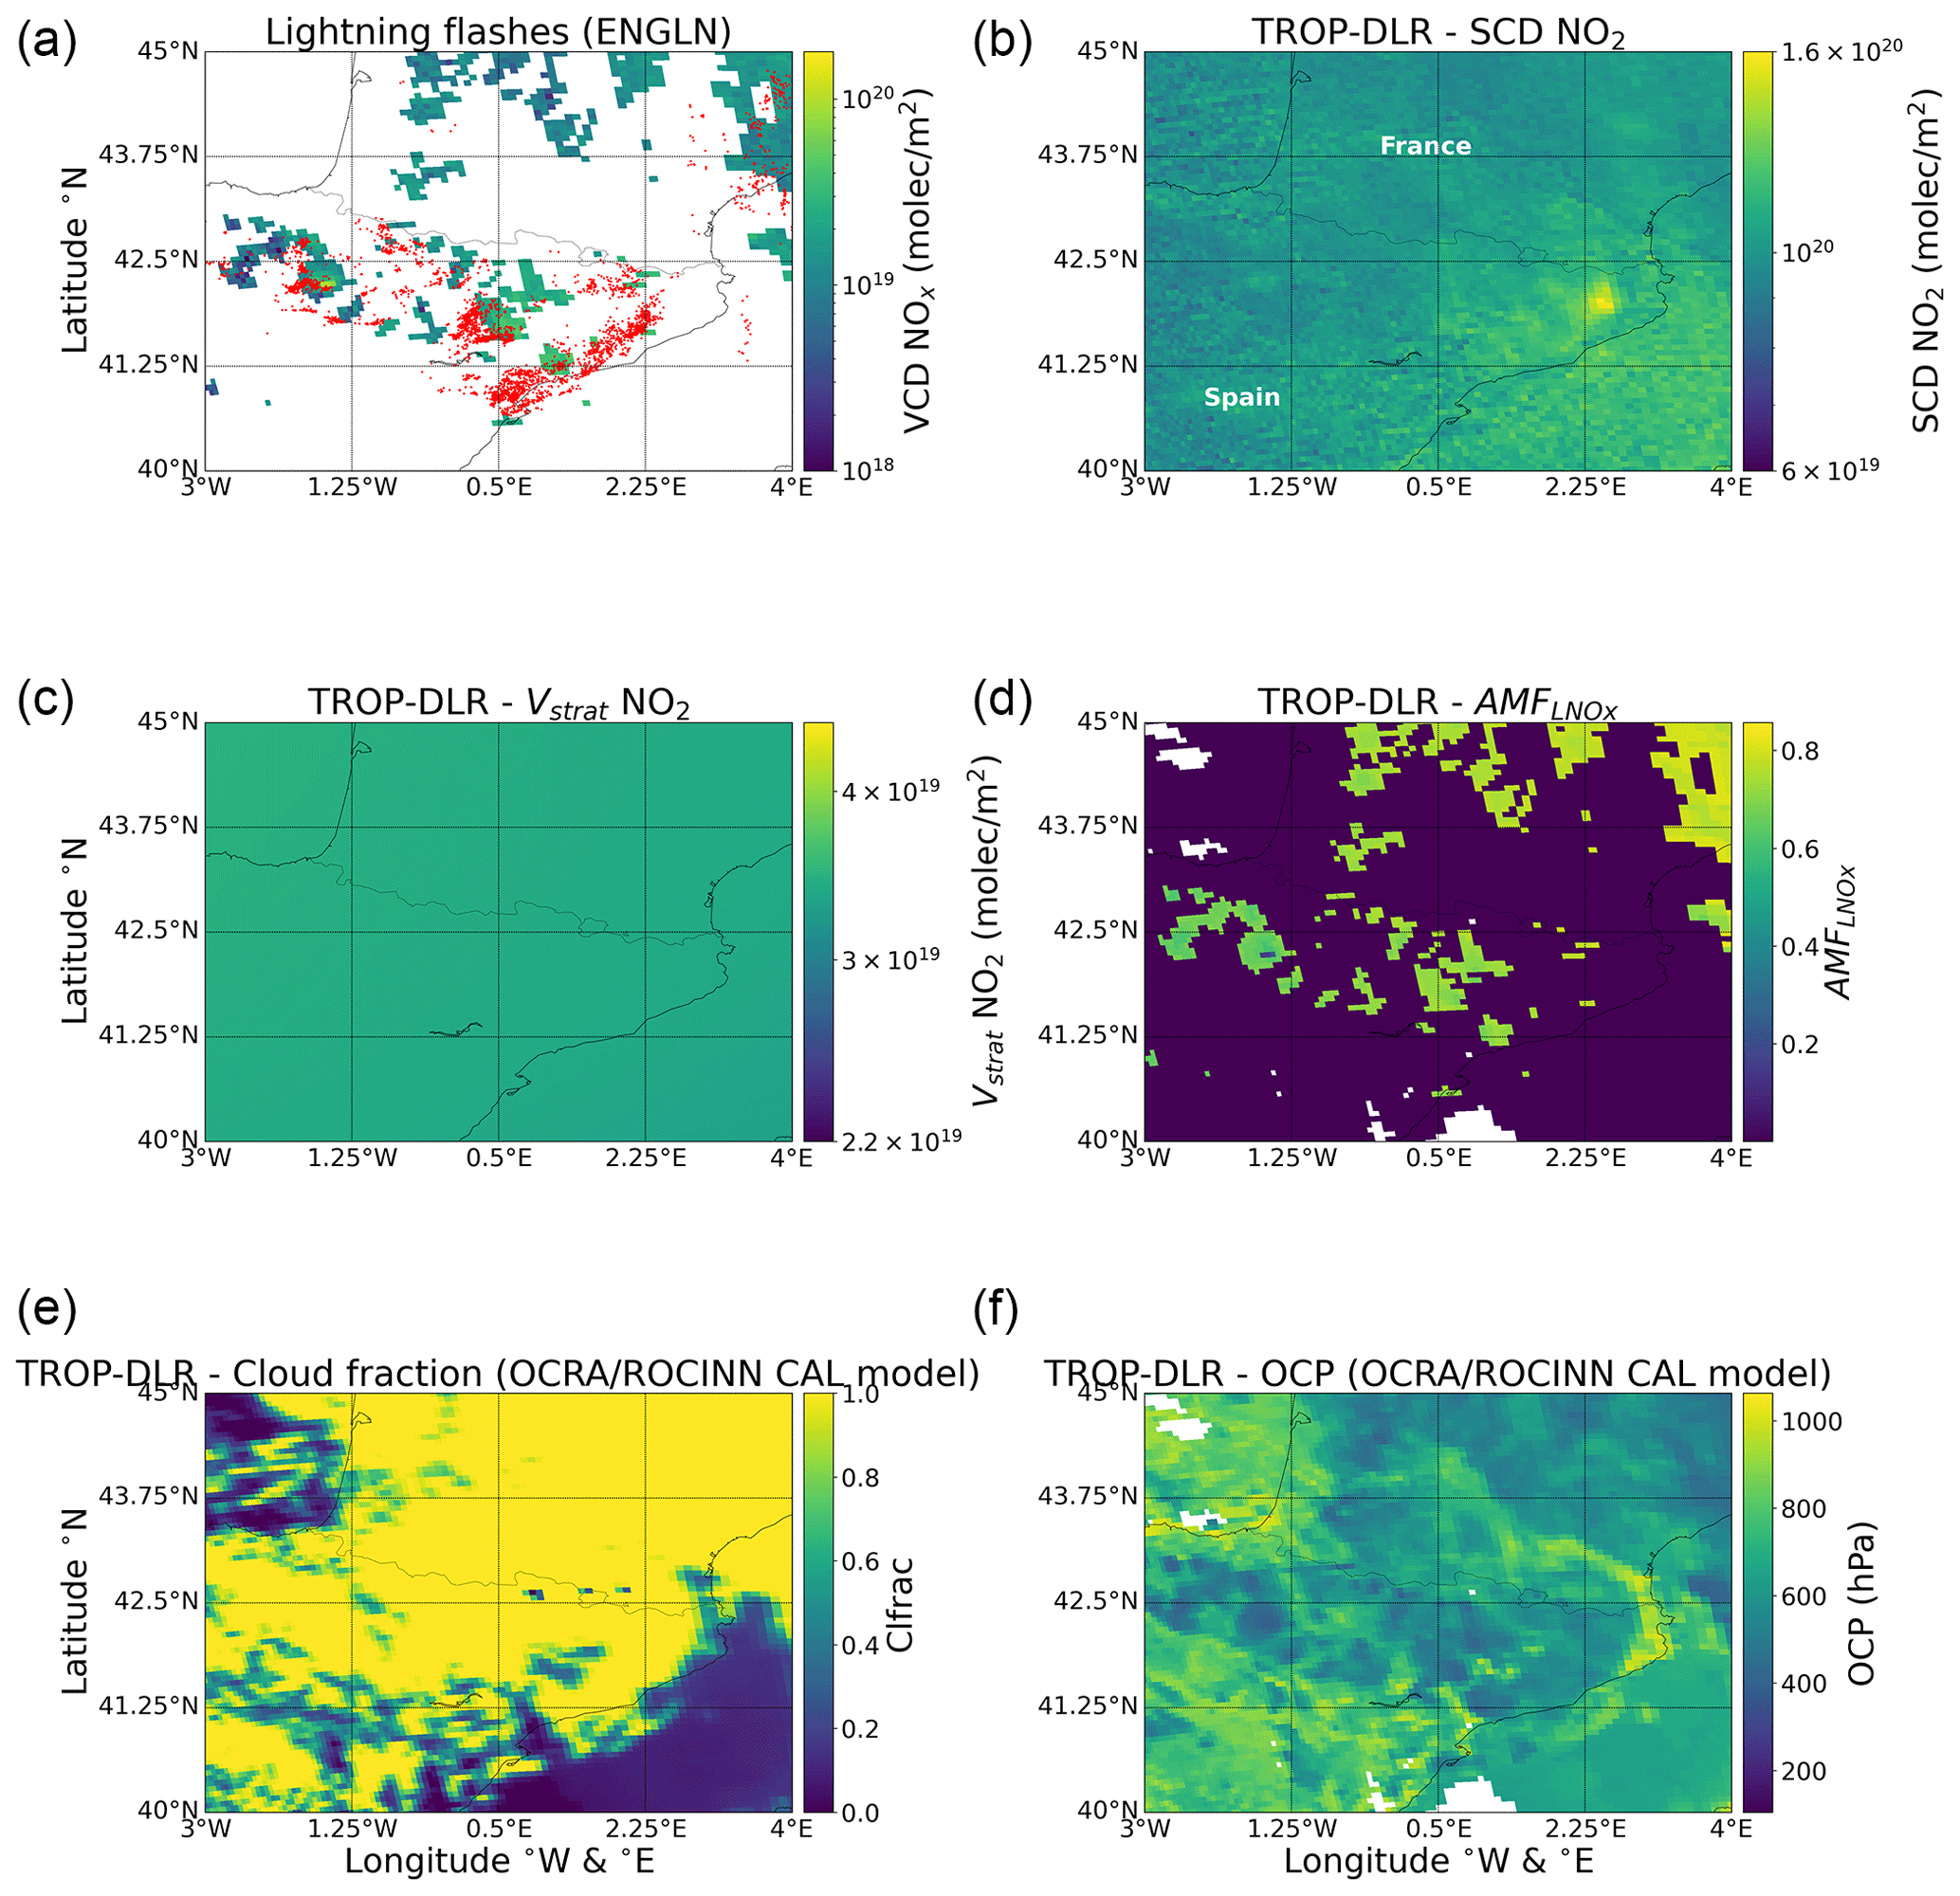
Figure 5TROP-DLR product and ENGLN lightning data for the case from 29 April 2018. Panel (a) shows the positions of lightning flashes (red dots) reported by ENGLN during the 5 h period before the TROPOMI overpass and the calculated NOx VCD. Panel (b) shows the SCD of NO2, while panels (c) and (d) show the stratospheric VCD of NO2 and the AMF, respectively. Panels (e) and (f) show the cloud fraction and the OCP, respectively.
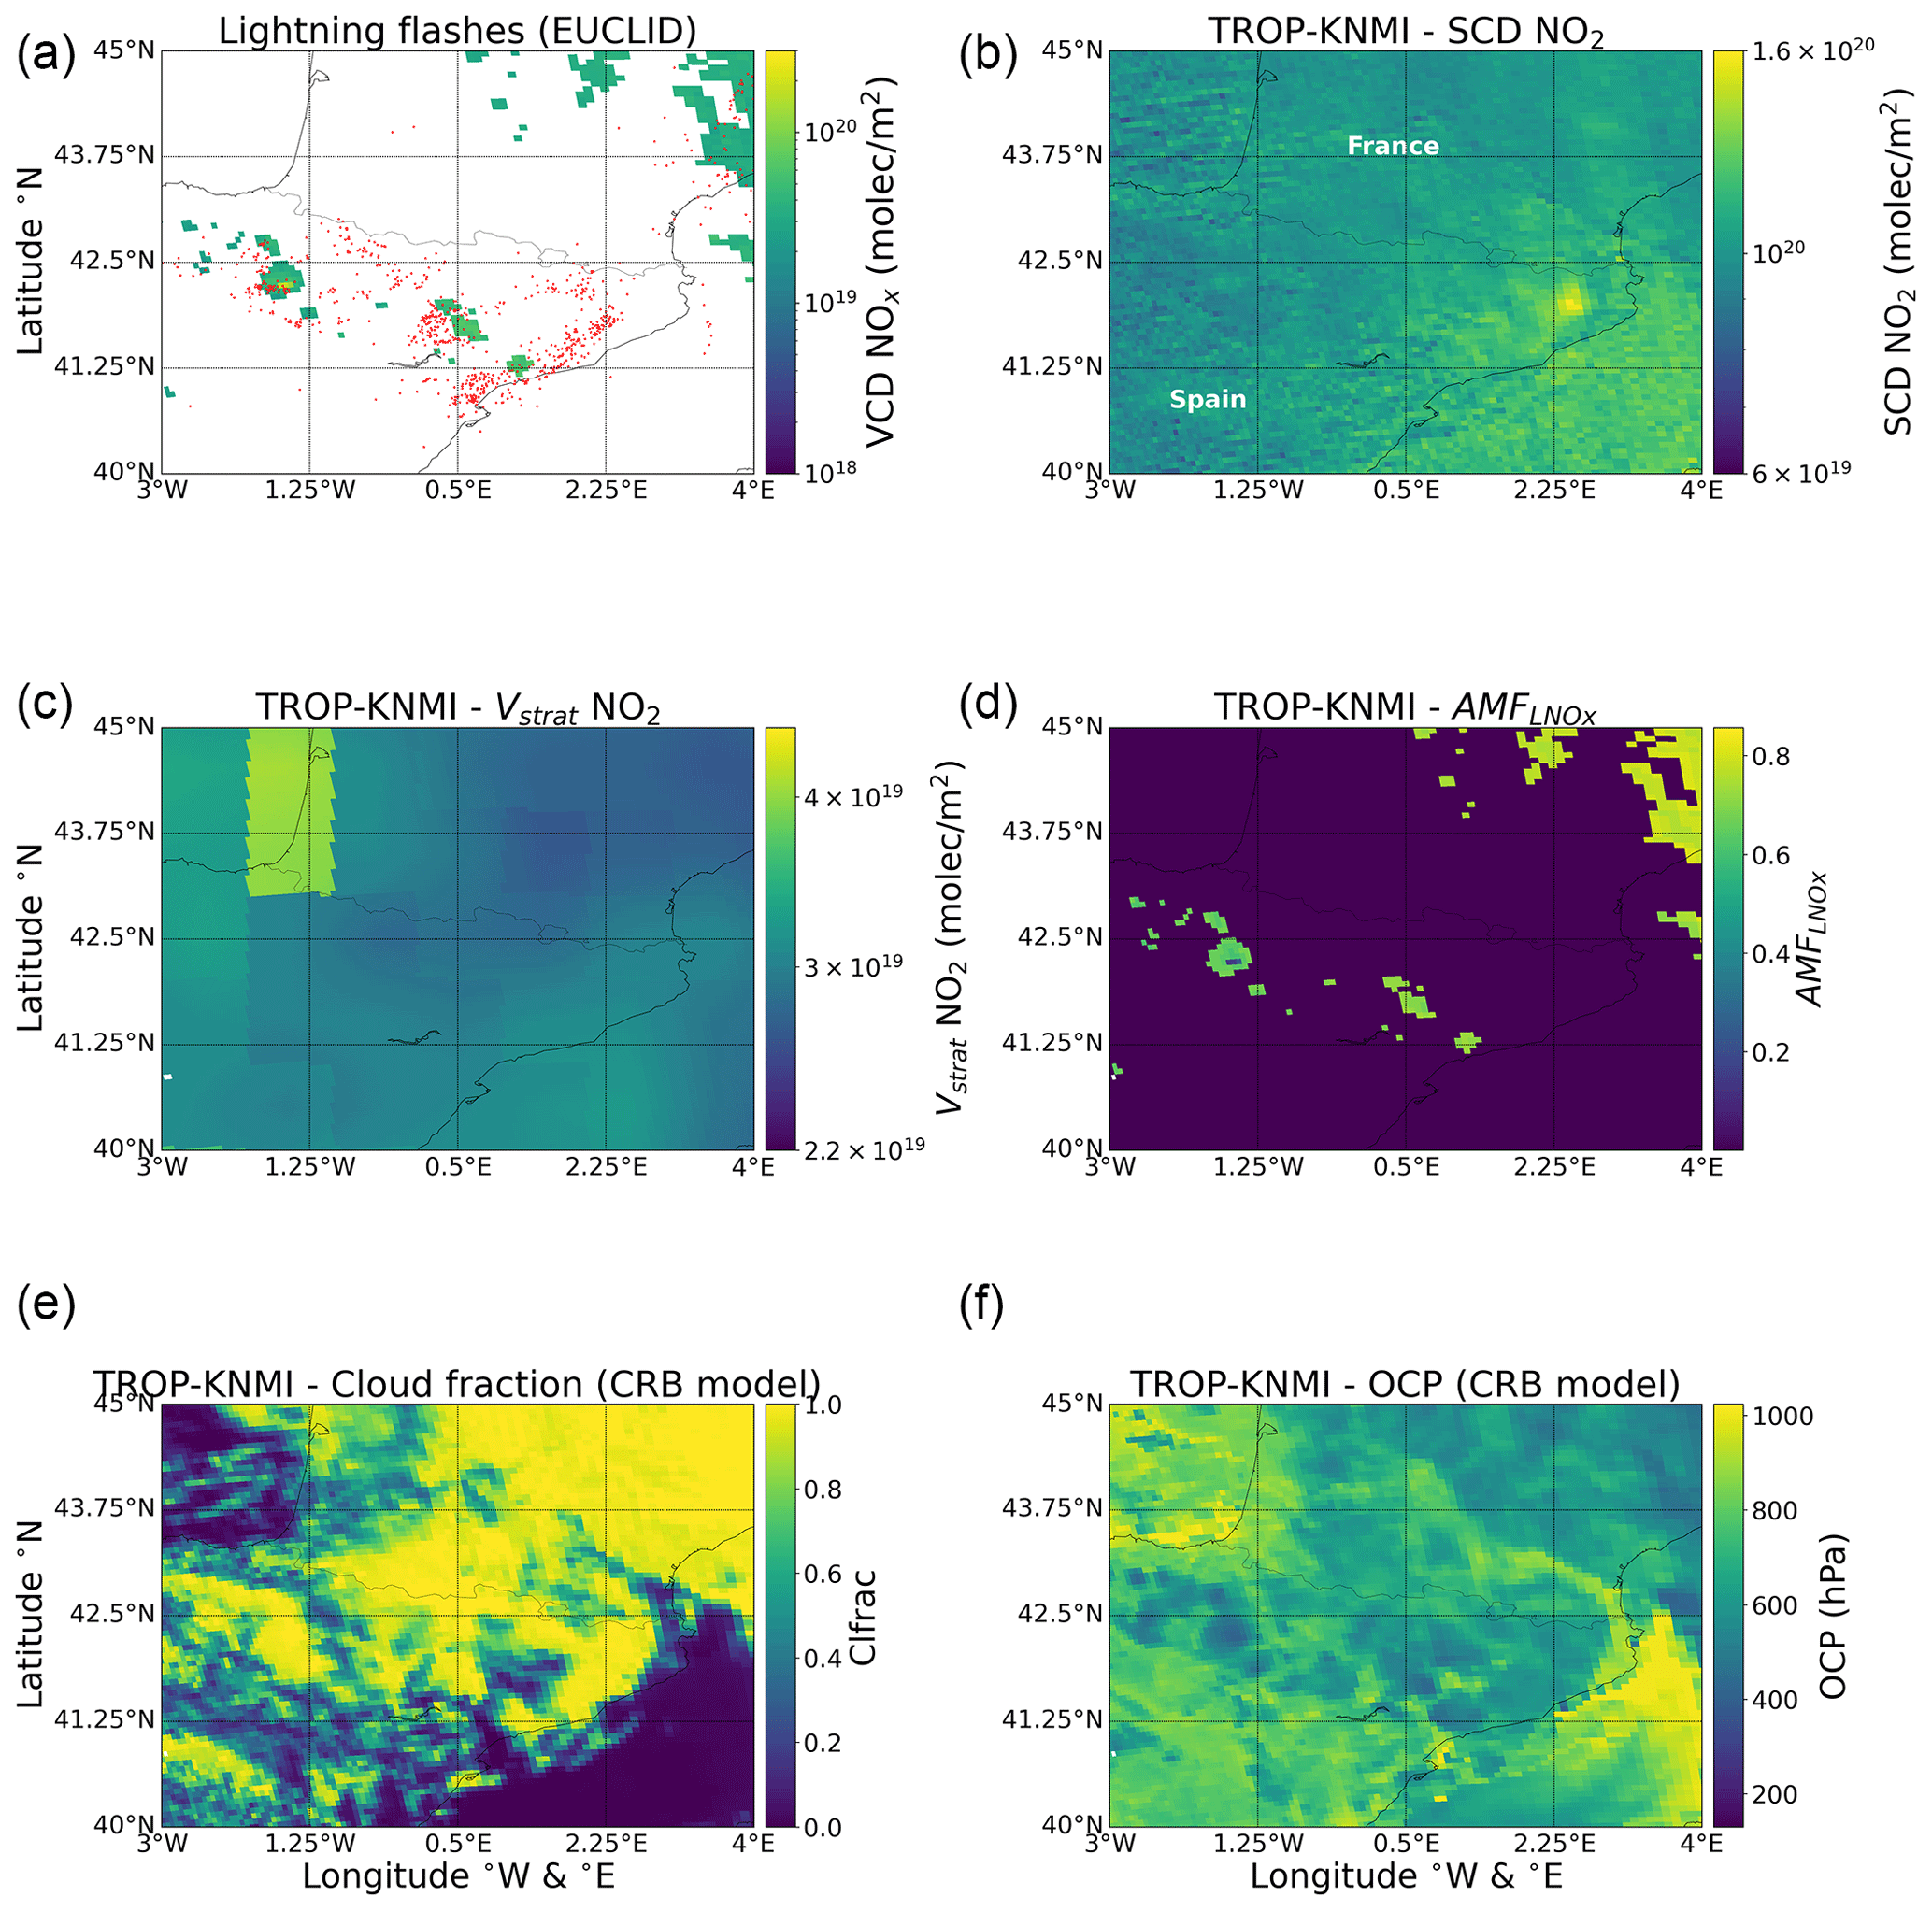
Figure 6TROP-KNMI product and EUCLID lightning data for the case on 29 April 2018. Panel (a) shows the positions of lightning flashes (red dots) reported by EUCLID during the 5 h period before the TROPOMI overpass and the calculated NOx VCD. Panel (b) shows the SCD of NO2, while panels (c) and (d) show the stratospheric VCD of NO2 and the AMF, respectively. Panels (e) and (f) show the cloud fraction and the OCP, respectively.
Figure 5 shows the ENGLN lightning data and some of the variables from the TROP-DLR product for the case on 29 April 2018. Figure 6 is similar to Fig. 5 but instead shows EUCLID lightning data and some of the variables from the TROP-KNMI product. Lightning activity is distributed between the Ebro Valley, the Pyrenees and the French coast.
The upper left panels of Figs. 5 and 6 show the positions of lightning flashes and the calculated NOx VCD in pixels with deep convection. A comparison of the upper left maps of Figs. 5 and 6 shows that there more lightning flashes were reported by ENGLN than by EUCLID. The upper right panels show the NO2 SCD for each of the TROPOMI products used, and indicate that there are no significant differences between them. Areas with high lightning activity coincide with areas with high NO2 SCD, suggesting that the LNOx signal is detectable by TROPOMI. There are also high NO2 SCD values near the city of Barcelona, a highly populated area producing high emissions of NOx. However, pixels near Barcelona do not satisfy the deep convective constraint.
The center left and right panels show the stratospheric VCD of NO2 and the calculated AMF, respectively. The VCD from the TROP-DLR product is slightly larger than that from the TROP-KNMI product, while both the stratospheric VCD of NO2 and the stratospheric AMF of NO2 are more homogeneous for the TROP-DLR product than for the TROP-KNMI product. The method used to separate the contributions of the troposphere and stratosphere to the NO2 column density is different for each product, which can affect the spatial distribution of the VCD and the AMF. The TROP-KNMI NO2 product uses a priori chemical profiles from the chemistry transport model TM5-MP (Myriokefalitakis et al., 2020), while the TROP-DLR NO2 product uses the DSTREAM method to separate the contributions of the troposphere and stratosphere to the NO2 column density (Y. Liu et al., 2021) (see Sect. 2). Inhomogeneities in the TROP-KNMI product are due to jumps in the tropopause level associated with thunderstorms (Pan et al., 2014). The TROP-KNMI product uses the temperature of the tropopause, which may jump up and down by a few levels due to horizontal changes in temperature gradients. The STREAM model used in the TROP-DLR product will absorb free tropospheric NO2 into the stratosphere, while the free tropospheric background may be larger in the TM5-MP model that is used to estimate the stratospheric column in the TROP-KNMI product (Boersma et al., 2018). The obtained values of the AMF are different for each product because they depend on the cloud information.
Finally, the lower panels show that there are no significant differences between the cloud products, except for some pixels in which the TROP-DLR product estimates larger cloud fractions. The existence of more pixels with high cloud fractions in the TROP-DLR product than in the TROP-KNMI product can influence the total number of pixels labeled as cloud convective pixels. The values of AMF for each product differ because they depend on details of the cloud product.
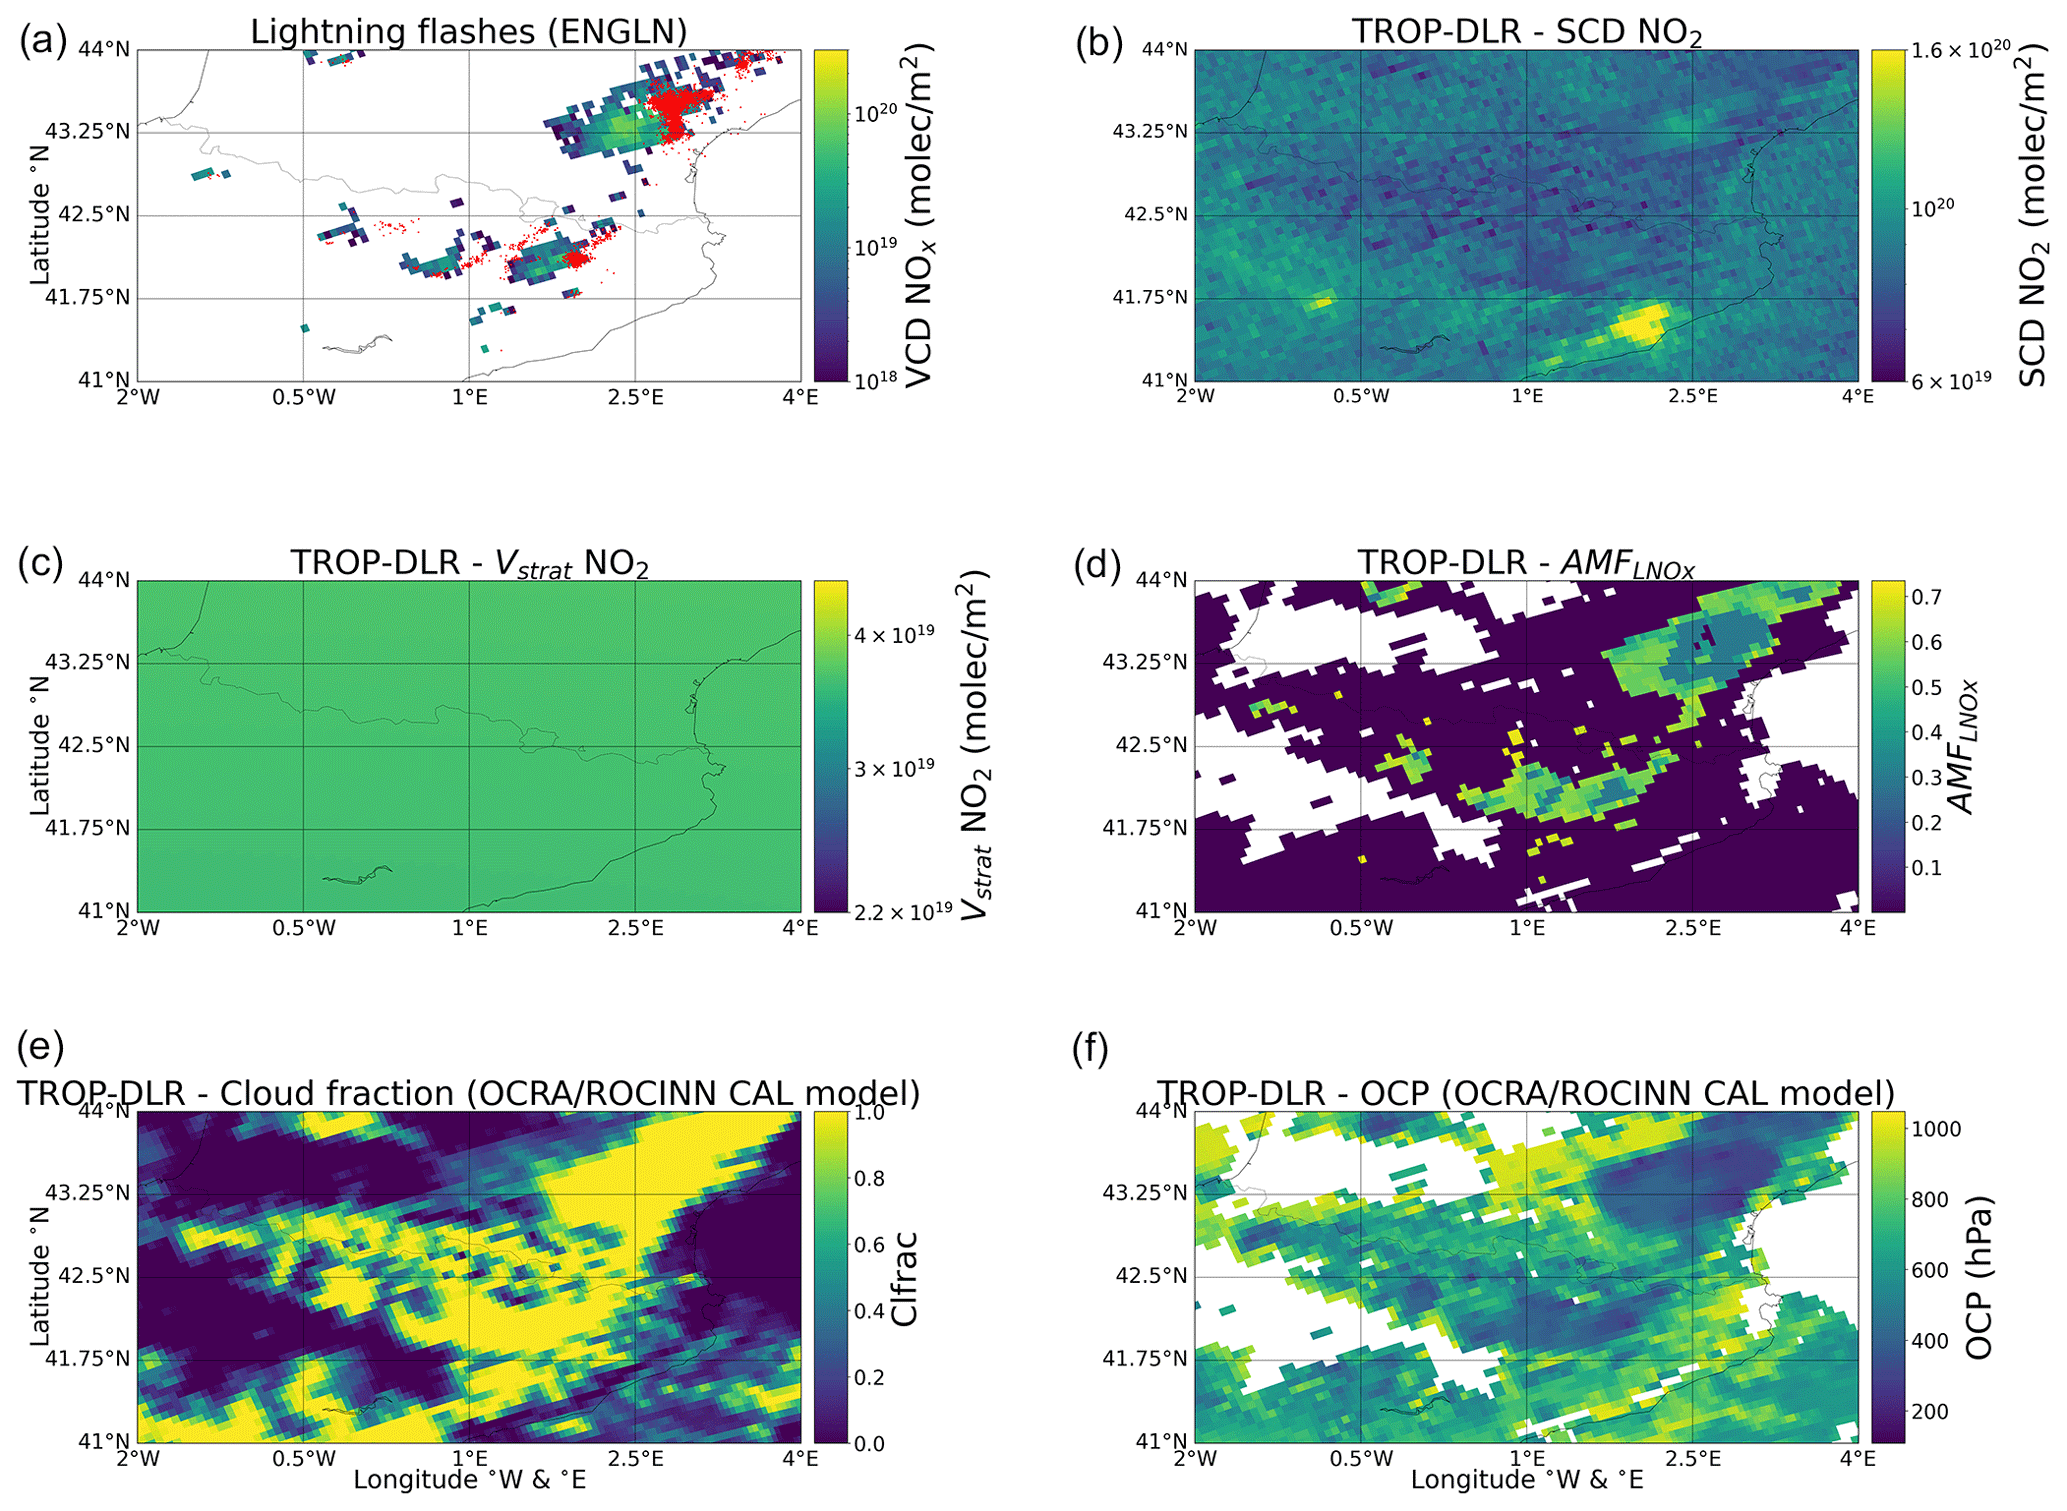
Figure 7TROP-DLR product and ENGLN lightning data for the case on 7 May 2018. Panel (a) shows the positions of lightning flashes (red dots) reported by ENGLN during the 5 h period before the TROPOMI overpass and the calculated NOx VCD. Panel (b) shows the SCD of NO2, while panels (c) and (d) show the stratospheric VCD of NO2 and the AMF, respectively. Panels (e) and (f) show the cloud fraction and the OCP, respectively.
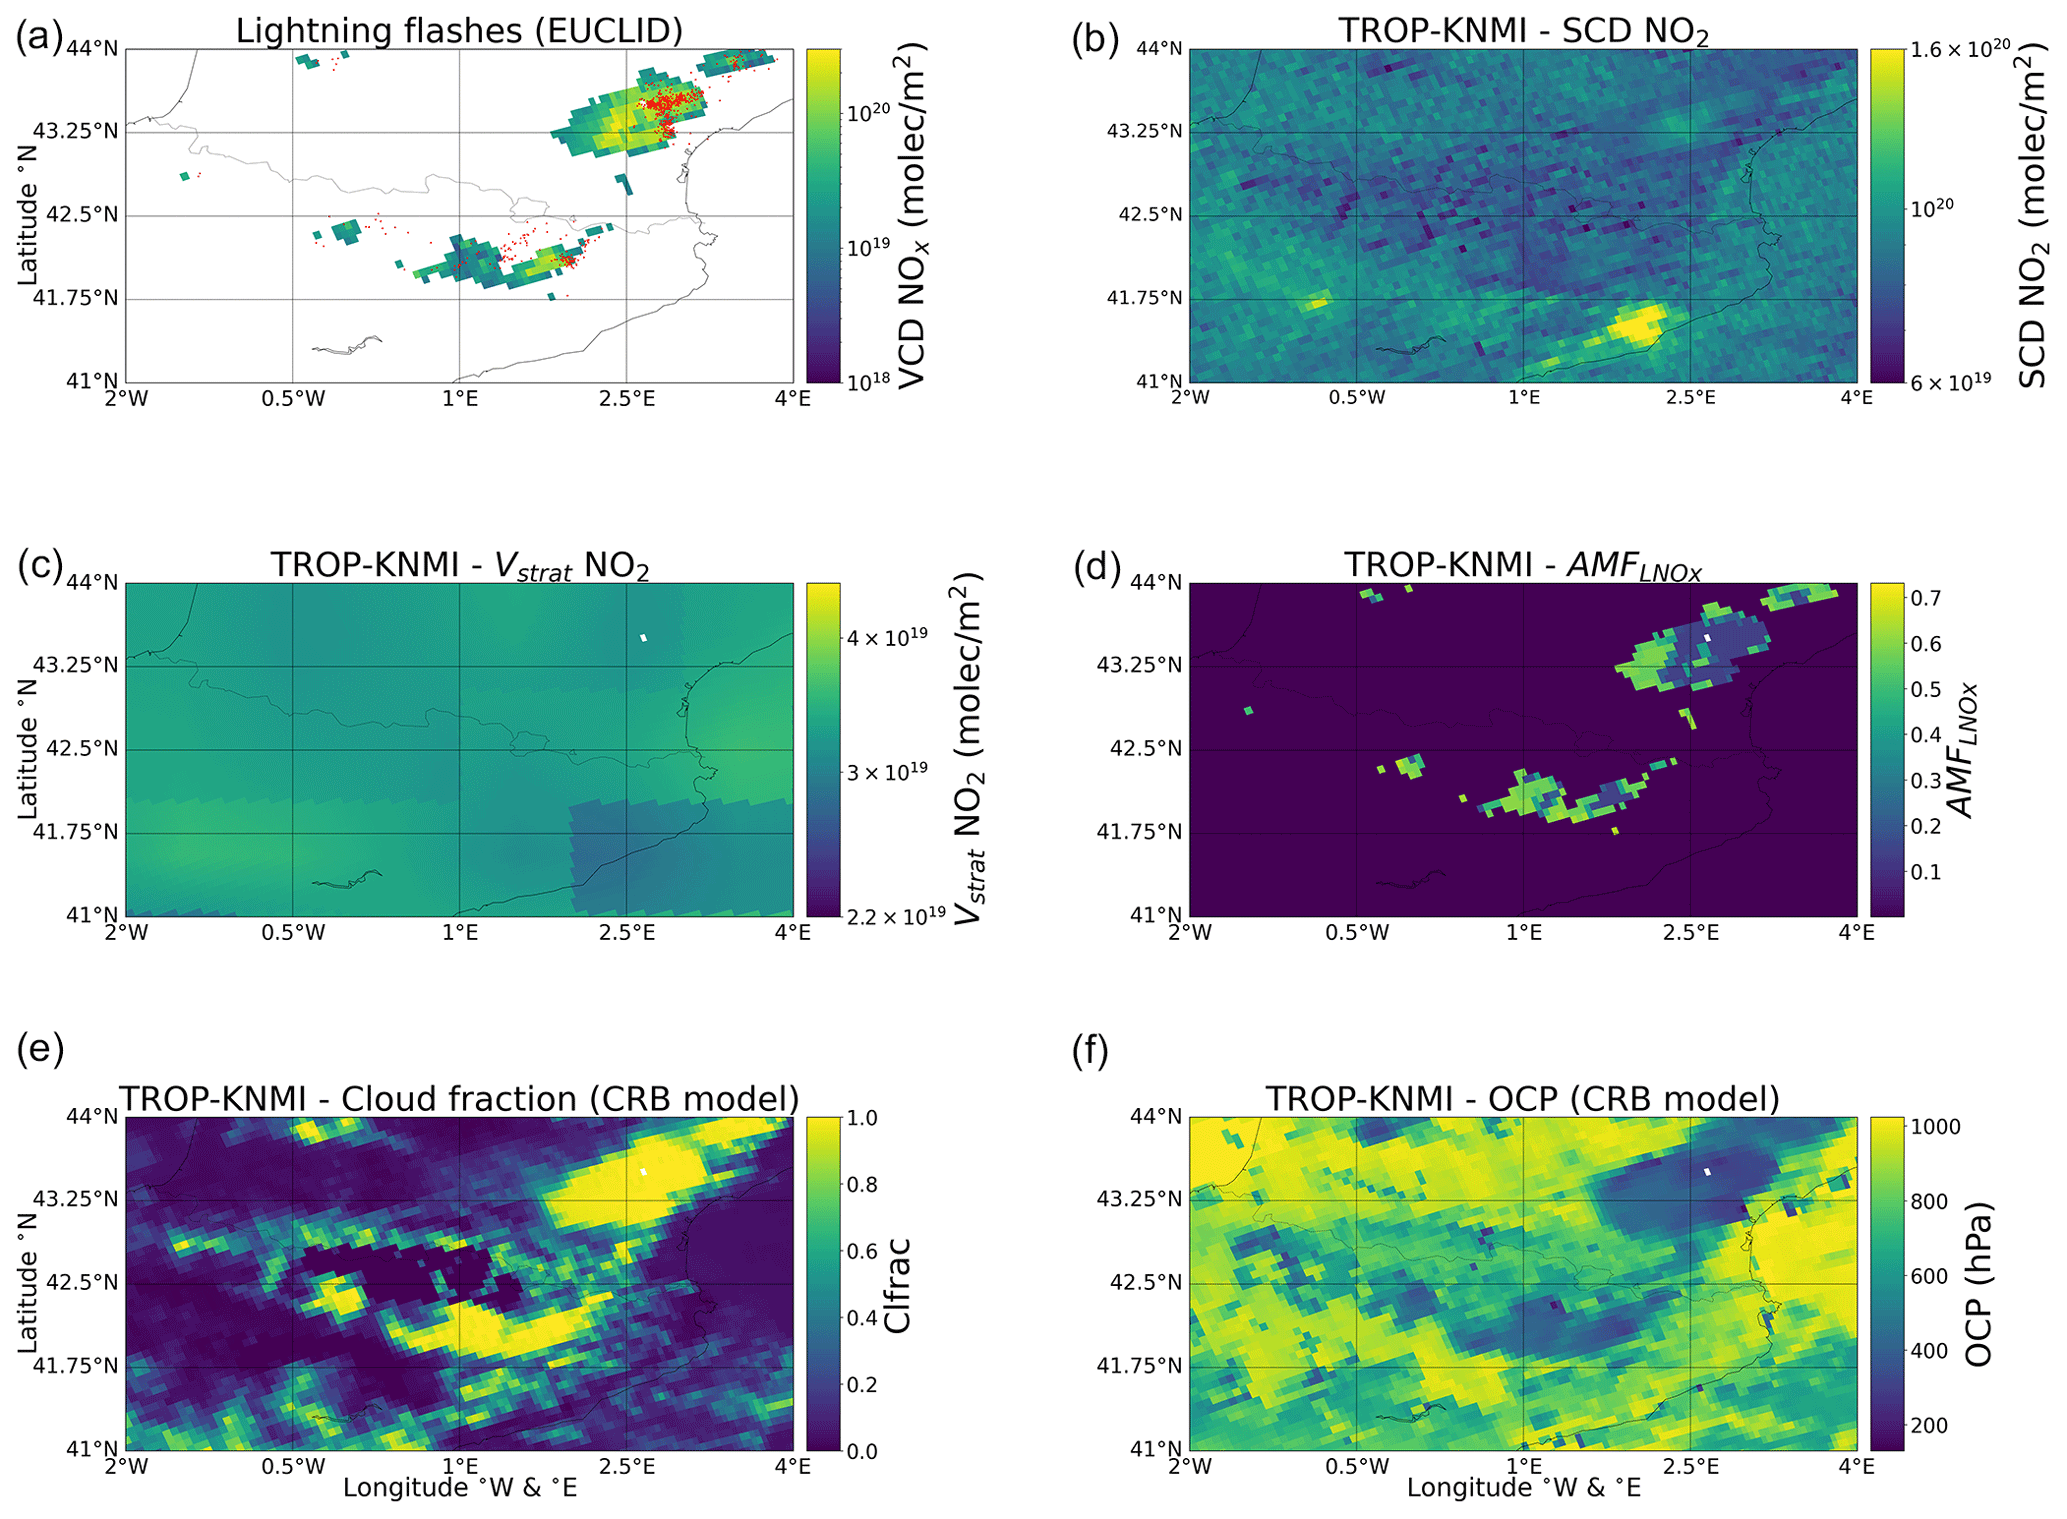
Figure 8TROP-KNMI product and EUCLID lightning data for the case on 7 May 2018. Panel (a) shows the positions of lightning flashes (red dots) reported by EUCLID during the 5 h period before the TROPOMI overpass and the calculated NOx VCD. Panel (b) shows the SCD of NO2, while panels (c) and (d) show the stratospheric VCD of NO2 and the AMF, respectively. Panels (e) and (f) show the cloud fraction and the OCP, respectively.
We present in Figs. 7 and 8 similar plots for the case on 7 May. As in the case on 29 April, lightning activity is distributed between the Ebro Valley, the Pyrenees and the French coast. Areas with high lightning activity coincide with areas with high NO2 SCD, while there are also high NO2 SCD values near the city of Barcelona. We can see the same differences between the TROP-KNMI and the TROP-DLR products as in the case on 29 April. Figures 9 and 10 show plots for the case on 28 May 2018. In this case, lightning activity is limited to the Ebro Valley and the Pyrenees. There is a profuse LNOx signal in the NO2 SCD map. The stratospheric VCD of NO2 and the stratospheric AMF of NO2 provided by the TROP-KNMI product are more homogeneous than in the previous two cases. The rest of the cases analyzed in this study are plotted in the Supplement.
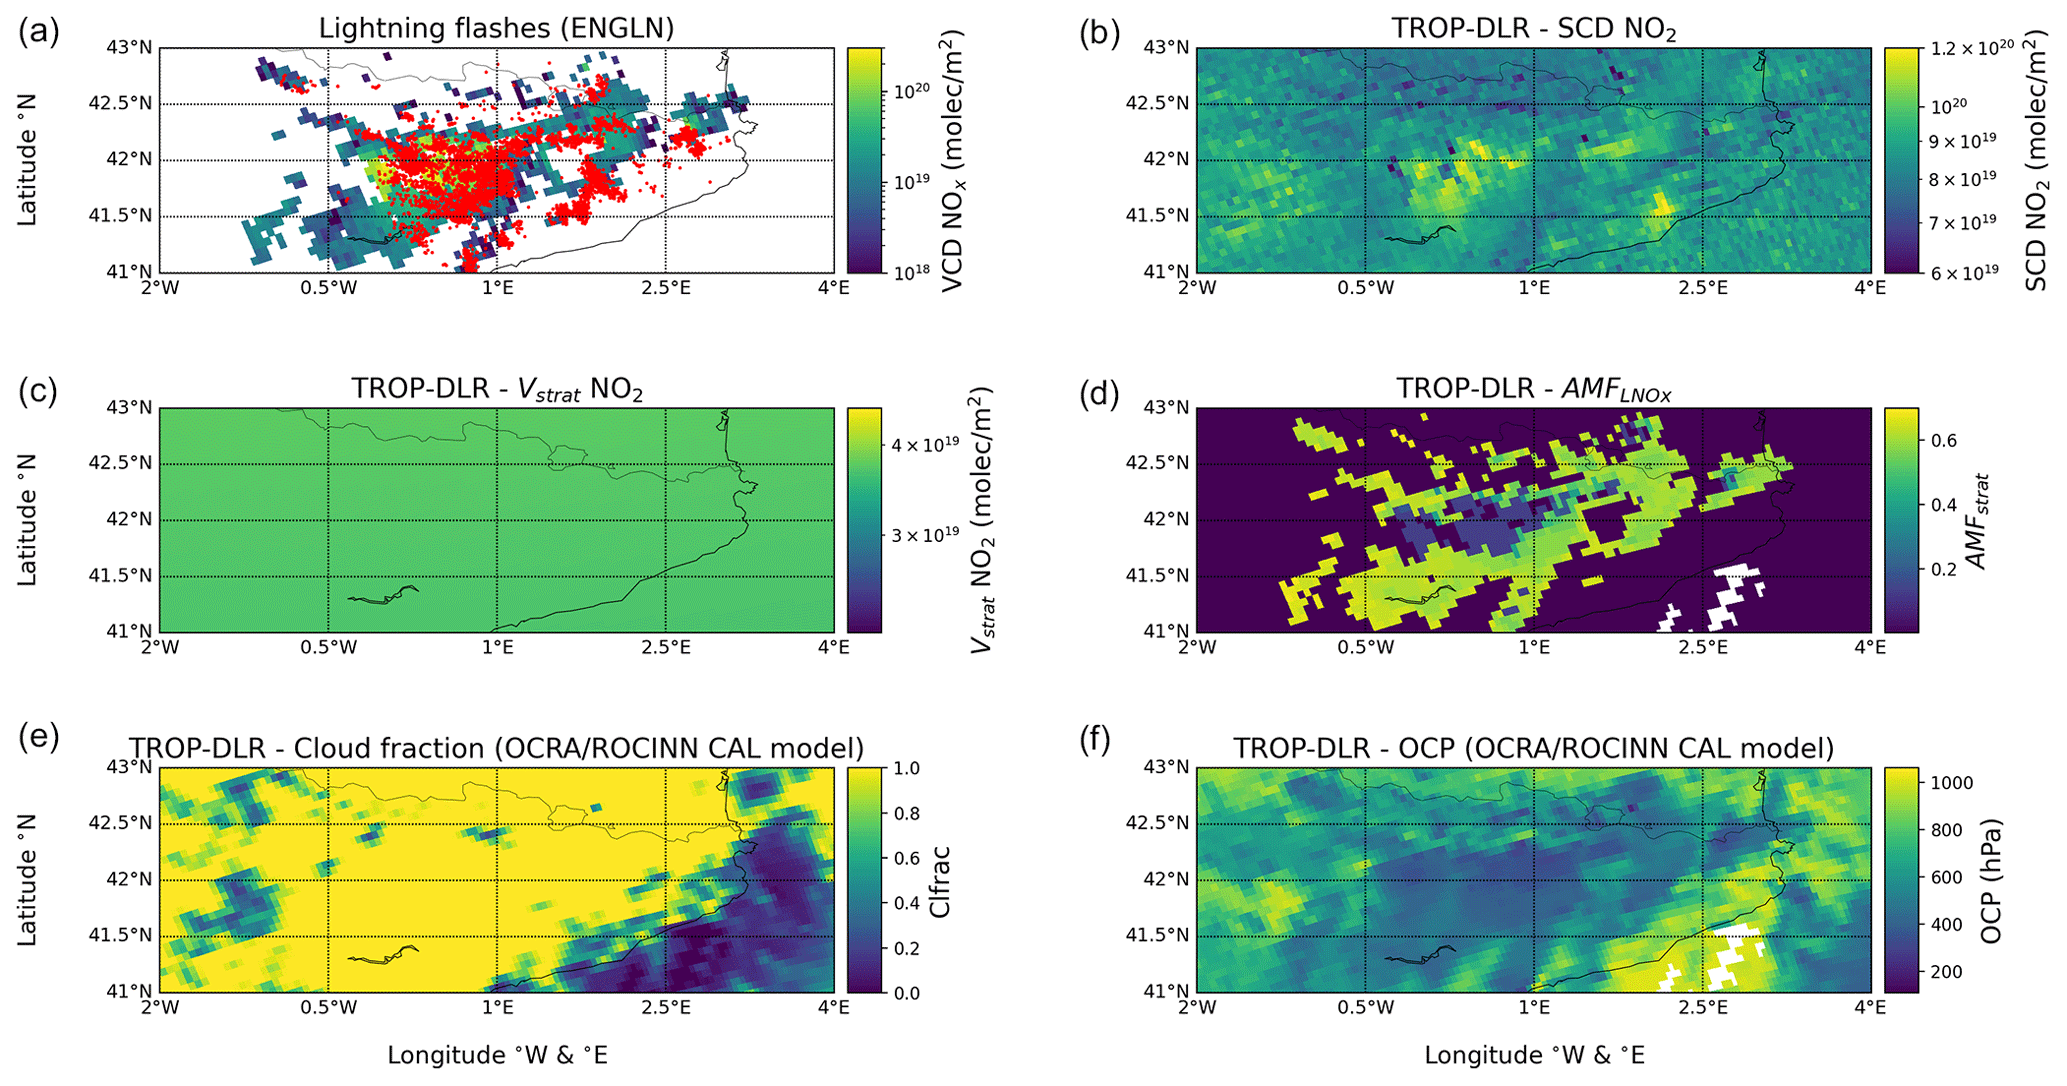
Figure 9TROP-DLR product and ENGLN lightning data for the case on 28 May 2018. Panel (a) shows the positions of lightning flashes (red dots) reported by ENGLN during the 5 h period before the TROPOMI overpass and the calculated NOx VCD. Panel (b) shows the SCD of NO2, while panels (c) and (d) show the stratospheric VCD of NO2 and the AMF, respectively. Panels (e) and (f) show the cloud fraction and the OCP, respectively.
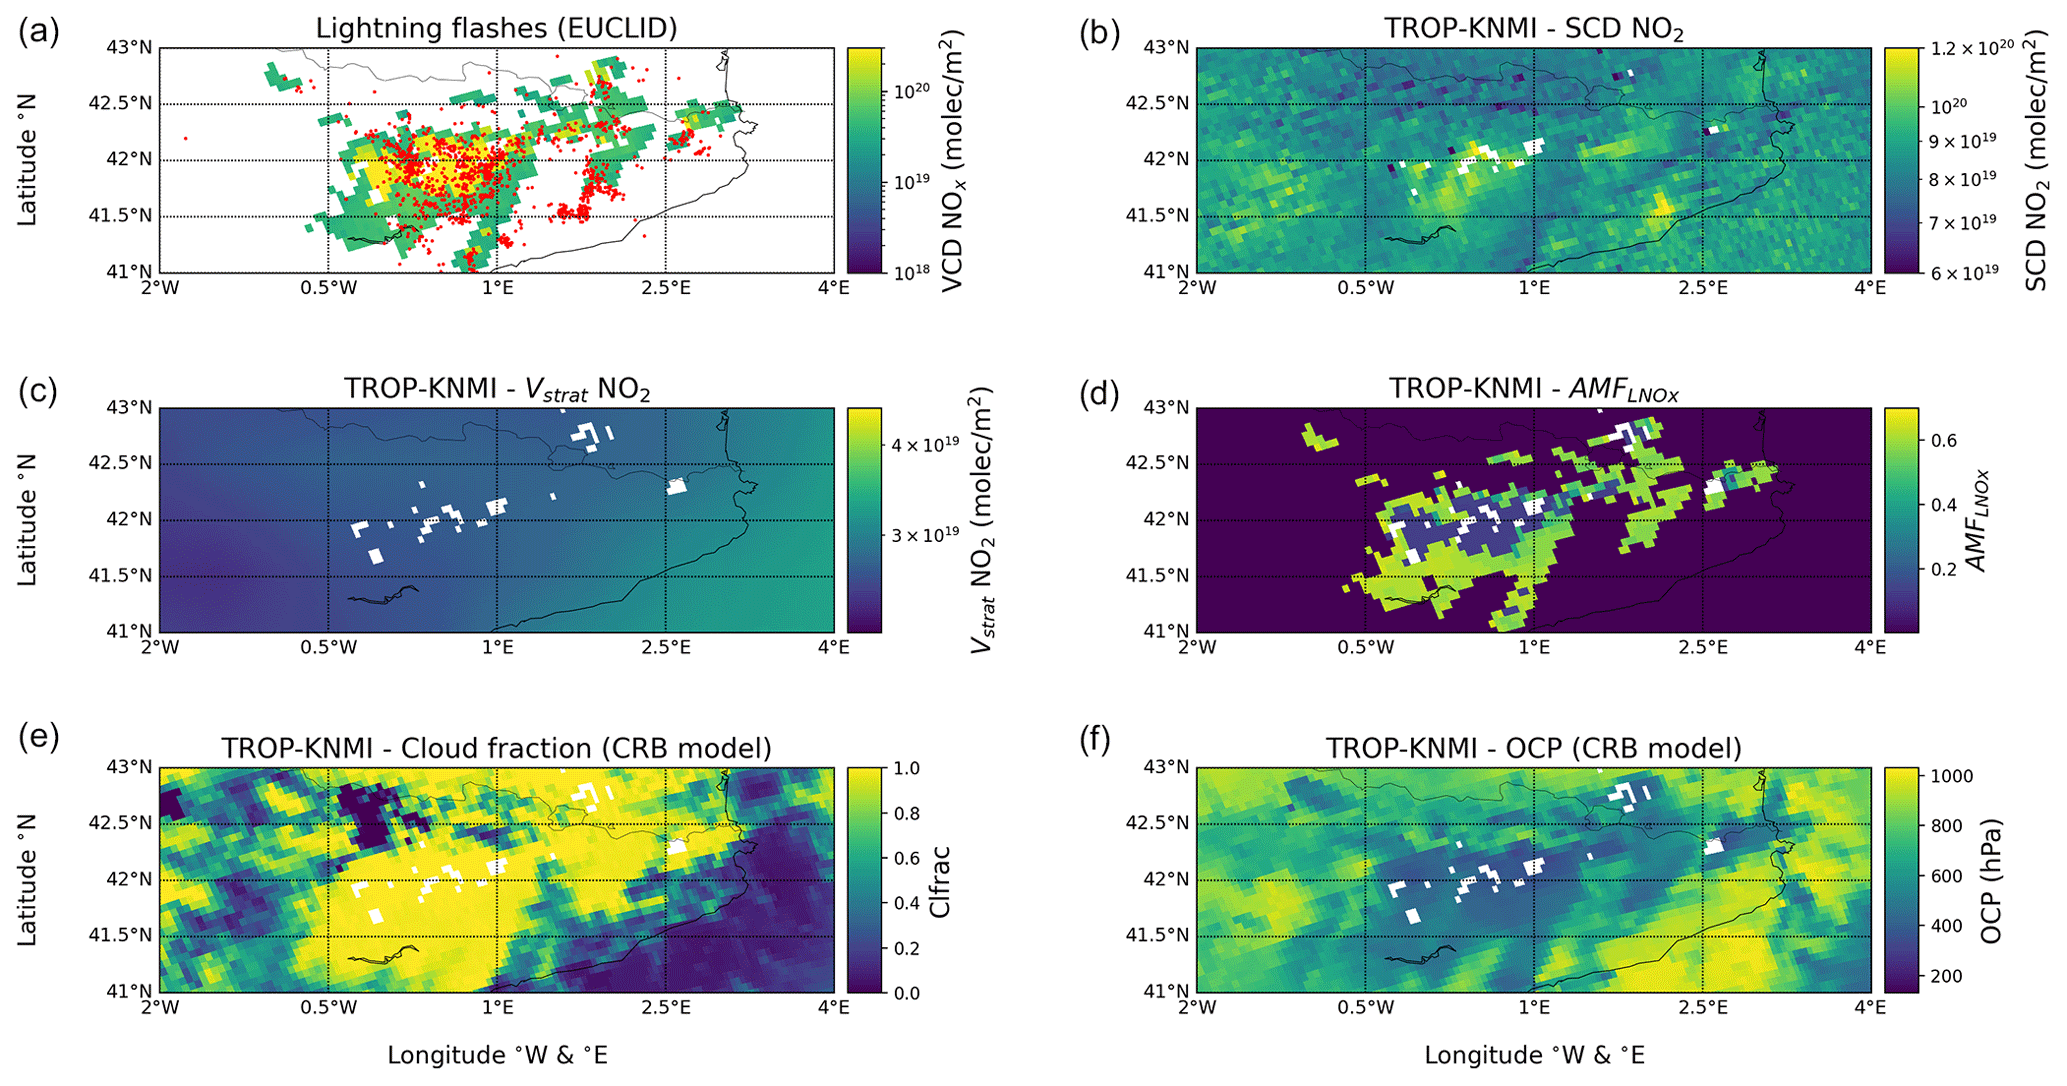
Figure 10TROP-KNMI product and EUCLID lightning data for the case on 28 May 2018. Panel (a) shows the positions of lightning flashes (red dots) reported by EUCLID during the 5 h period before the TROPOMI overpass and the calculated NOx VCD. Panel (b) shows the SCD of NO2, while panels (c) and (d) show the stratospheric VCD of NO2 and the AMF, respectively. Panels (e) and (f) show the cloud fraction and the OCP, respectively.
Figure 11 shows the velocity and direction of the horizontal wind averaged between the 200 and 500 hPa pressure levels for the cases on 29 April, 7 May and 28 May 2018. The average of the wind velocity is calculated with the values provided by ERA5 at the 200, 250, 300, 350, 400, 450 and 500 hPa pressure levels. On 29 April 2018, strong southerly winds could have transported LNOx to the north, which is in agreement with the relative positions of flashes and pixels with high concentrations of NO2, as shown in Figs. 6 and 5. On 7 May 2018, northeasterly winds could have transported LNOx to the southwest according to the locations of the flashes, in agreement with Figs. 7 and 8. Finally, the wind velocity was weak on 28 May 2018, so the transport of lightning NOx from the flash positions was unlikely, in agreement with Figs. 9 and 10. We have calculated the Pearson correlation coefficient (r) between the SCD of NO2 in convective cells with flashes and the total number of flashes reported by ENGLN in each cell averaged over all the studied cases. We obtained r=0.18 for TROP-DLR and r=0.11 for TROP-KNMI. These values indicate a positive correlation between the SCD of NO2 and flashes that is larger for TROP-DLR than for TROP-KNMI. This correlation is larger when we use the tropospheric winds to identify the cells that have been influenced by LNOx. We copied each flash to the cells that are influenced by the LNOx produced by the flash with the purpose of calculating the upwind correlation coefficient by taking into account the transport of LNOx. With that, we obtained r=0.20 for TROP-DLR and r=0.15 for TROP-KNMI. The larger correlation coefficients obtained indicate that accounting for the transport of LNOx can improve the estimation of the LNOx PE.
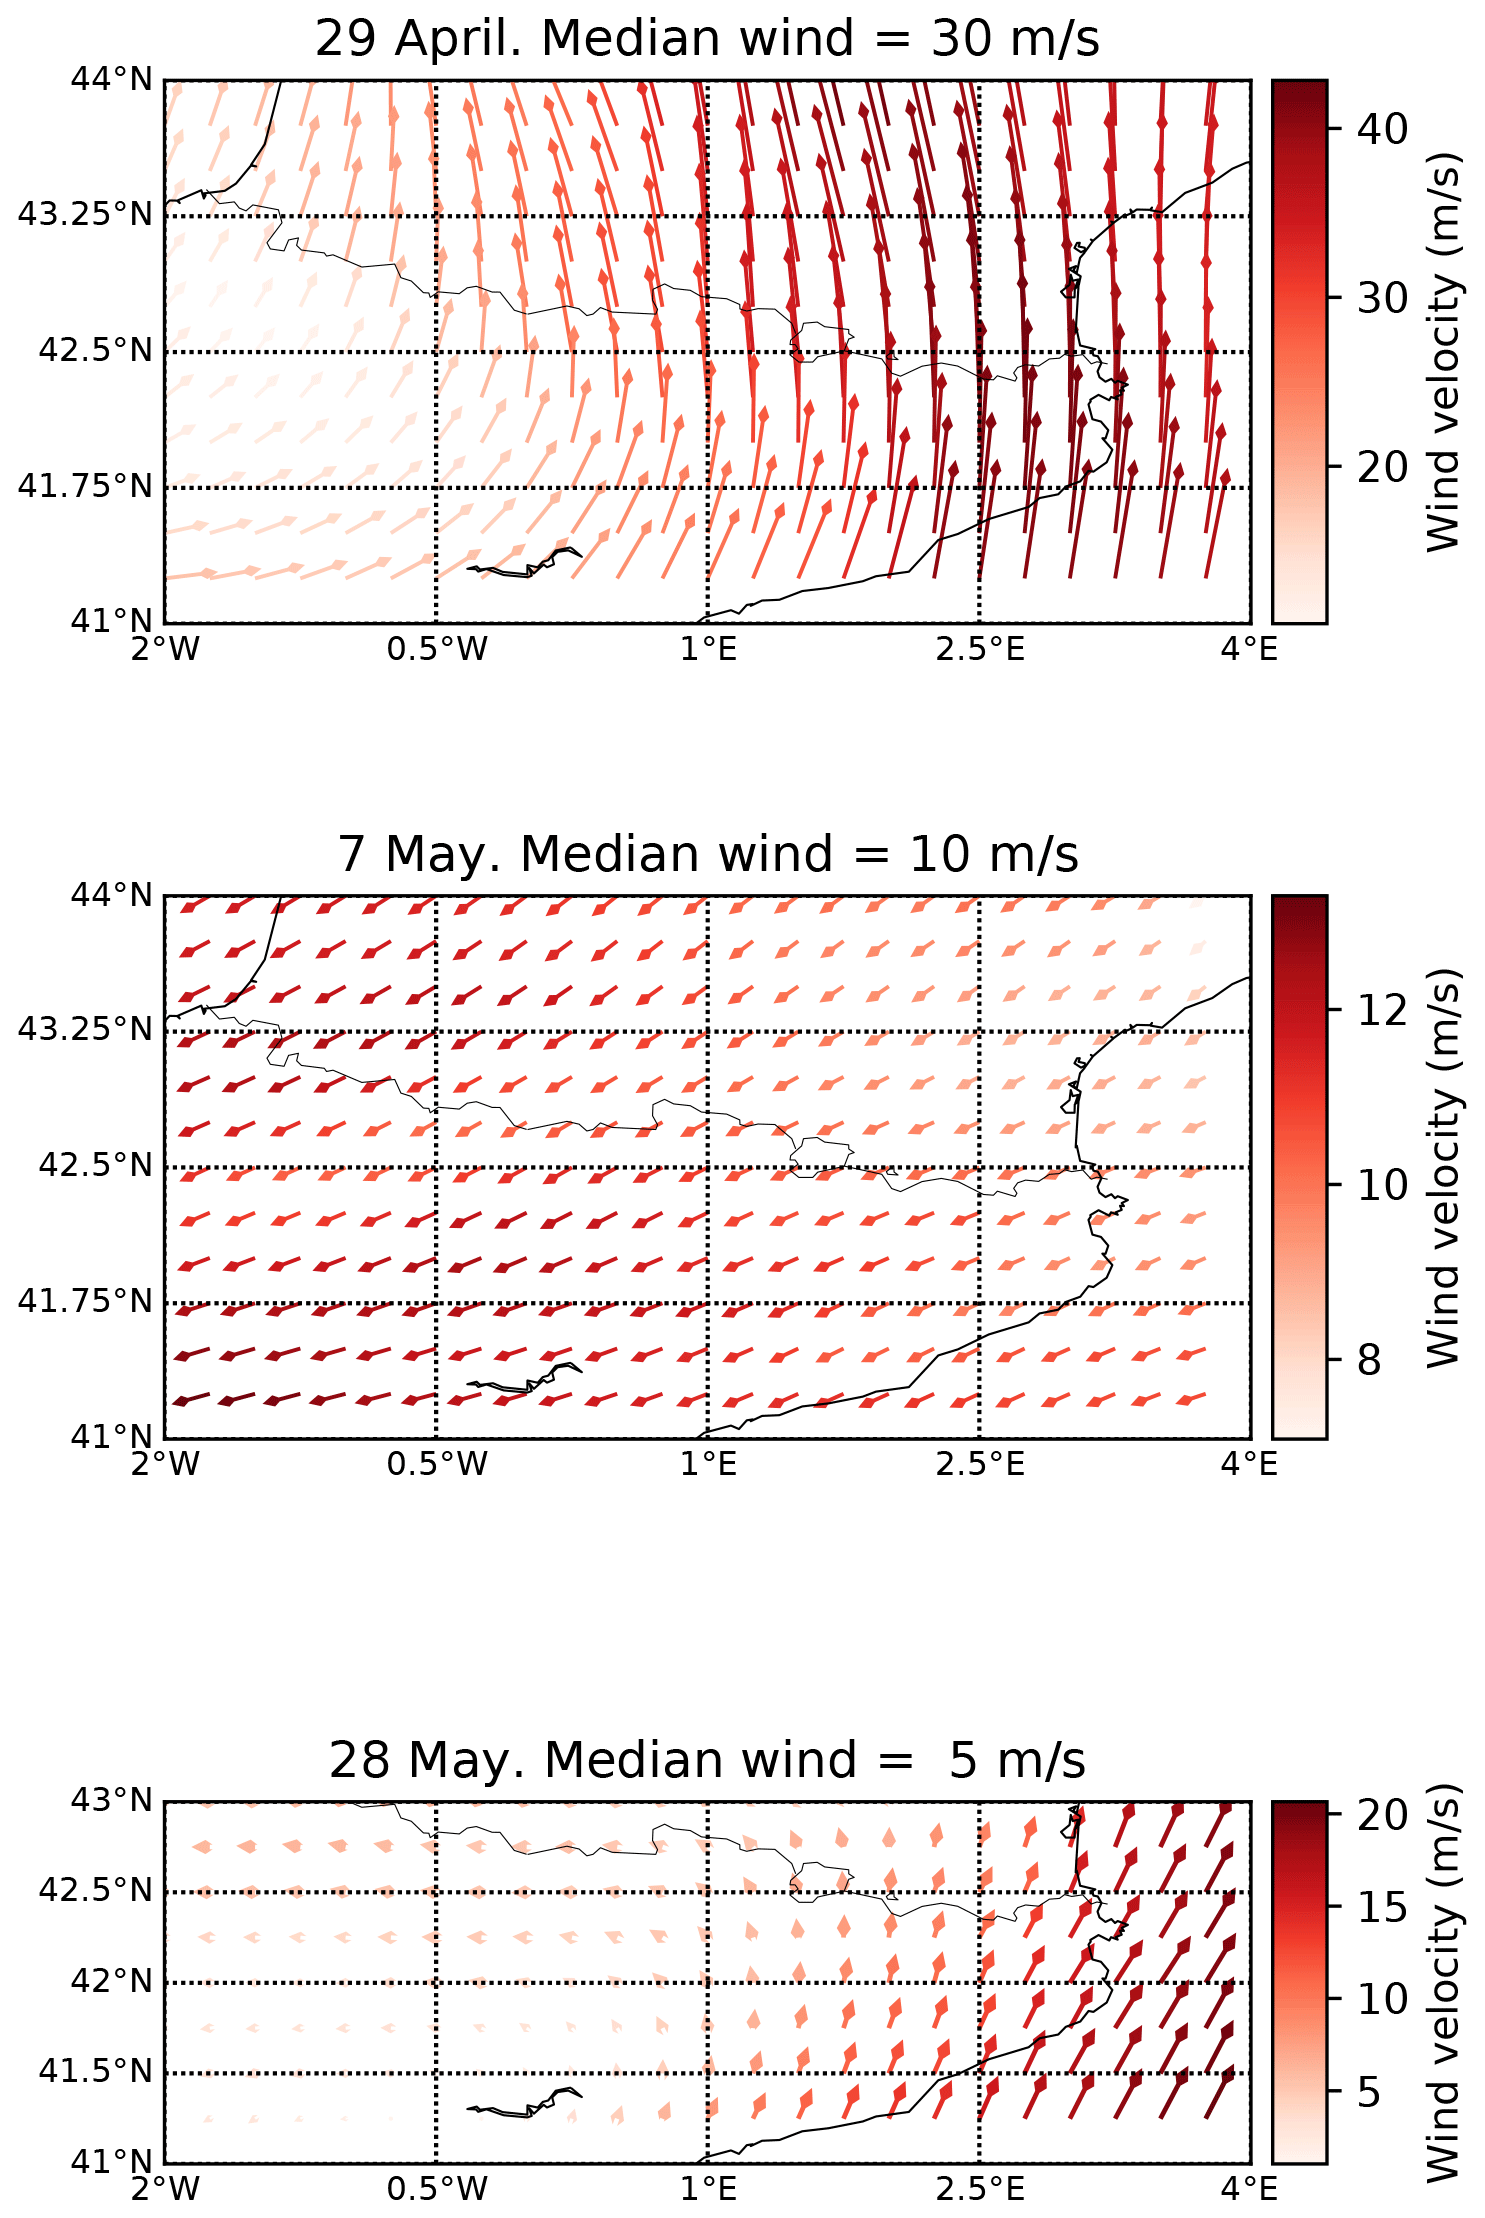
Figure 11Horizontal wind velocity and direction averaged between the 200 and 500 hPa pressure levels for the studied cases on 29 April, 7 May and 28 May 2018. The horizontal winds are extracted from ERA5 reanalysis data. The spatial median of the wind velocity is also shown above each plot.
3.2 LNOx PE estimates
In this section, we present the LNOx PE estimates for the selected cases, using two different methods to estimate the background NOx. The first method (Sect. 3.2.1) is exclusively based on case-by-case TROPOMI measurements, as it uses non-flashing pixels with deep convection to estimate the background NOx. The second method (Sect. 3.2.2) uses fixed values for the background NOx from measurements taken over days with low lightning activity.
3.2.1 LNOx PE estimates obtained using non-flashing pixels to estimate the background NOx
In this section, we present the LNOx PE estimates for the selected cases by using the 30th and 10th percentiles of over non-flashing pixels with deep convection as background NOx estimations. Table 1 shows the results for eight cases in the Pyrenees using the described method and the TROP-KNMI research product, while Table 2 shows the results obtained using the TROP-DLR research product. Here we have used a 5 h time window before the TROPOMI overpass and a chemical lifetime of NOx (τ) of 3 h for all the cases shown in these tables. We have chosen these values for the flash window and τ as reference values to show the LNOx estimates in Table 1. However, later (in Sect. 3.3), we perform a sensitivity analysis using different values for the flash window and τ. The case-based averaged age of individual flashes ranges between 0.9 h for 7 May and 2.3 h for 26 May.
In this section, we present the LNOx PE estimates for the selected cases using two different methods to estimate the background NOx. The first method (Sect. 3.2.1) is exclusively based on case-by-case TROPOMI measurements, as it uses non-flashing pixels with deep convection to estimate the background NOx. The second method (Sect. 3.2.2) uses fixed values for the background NOx from measurements taken over days with low lightning activity.
Columns 1 and 2 show the date and thunderstorm region of each studied case and some mean values, respectively. Column 3 shows the total number of lightning flashes reported by ENGLN/EUCLID 5 h before the TROPOMI overpass without the application of a DE. The total number of flashes reported by ENGLN is always larger than that reported by EUCLID. Minor differences in the total number of flashes between both TROPOMI products (compare Tables 1 and 2) are due to minor differences in the product grids.
Column 4 shows the OCP averaged for all lightning flashes reported by ENGLN. Significant differences are obtained between the cases. We obtain a lower limit of 339 hPa from the TROP-DLR research product for the 7 May case, while we obtain an upper limit of 629 hPa from the TROP-KNMI research product for the 12 May case. The mean OCP values for the TROP-KNMI and the TROP-DLR products are 527 and 491 hPa, respectively. These values do not coincide with the mean OCP values shown in Fig. 1 because they correspond to the mean OCP per lightning flash instead of the mean OCP value per pixel. As a consequence, the mean OCP values shown in column 4 are dominated by pixels with high lightning activity. The OCP values depend on the intensity of convection in each thunderstorm as well as on the phase of the thunderstorm during the TROPOMI overpass (Emersic et al., 2011).
Columns 5 and 6 of Tables 1 and 2 show the median tropospheric VCD of NOx () and the mean product of the stratospheric VCD of NO2 () times the AMFstrat over pixels with deep convection, respectively. Higher values of and the product of times the AMFstrat for the TROP-DLR research product compared to the TROP-KNMI product can be seen for all cases, except for the case on 30 May. As described in Sect. 2.5, is calculated by converting the slant column densities into vertical column densities and substracting the contribution of the stratosphere. As is larger for the TROP-DLR research product, we receive lower values of than for the TROP-KNMI research product.
Column 7 shows the mean AMF over pixels with deep convection for each case. The value of AMF ranges between 0.34 and 0.80, while the averaged values for the TROP-KNMI and TROP-DLR products are 0.50 and 0.54, respectively. These values are in agreement with typical values reported by Allen et al. (2021a) for thunderstorms observed by TROPOMI over the US (0.41 ± 0.10) and are similar to the averaged AMF value in thunderstorms (0.46) reported by Beirle et al. (2009) over the Pacific.
Background NOx values obtained as the 30th and 10th percentiles of over non-flashing pixels with deep convection (Vtropbck) are shown in column 8. As in the case of , we obtain lower values of Vtropbck for TROP-DLR than for the TROP-KNMI research product. Despite similarities in the NO2 SCDs from both products, higher values in the TROP-DLR product produce lower values of Vtropbck after the subtraction of the stratospheric contribution. There are even some negative values, suggesting that the average stratospheric column exceeds the local vertical column (Eq. 3) or the tropospheric background exceeds the signal (Eq. 2). The Vtropbck values show large variability, although the mean values are of the same order as the background estimated from CARIBIC measurements (0.75 × 10¹⁹ molec m−2) and from TROPOMI measurements over convective systems with low lightning activity (1.06 × 10¹⁹ molec m−2 for the TROP-KNMI product and 0.37 molec cm−2 for the TROP-DLR research product), as detailed in Sect. 2.6.
The LNOx PEs for each case obtained using ENGLN and EUCLID lightning data are shown in columns 9 and 10 of Tables 1 and 2, respectively. We have used the standard deviation over all cases in order to estimate the error of the mean PE. We can see a factor of ∼ 2 difference between the LNOx PEs obtained using different backgrounds for most of the cases, indicating that the method used to estimate the background introduces a significant uncertainty into the results. Using the TROP-KNMI research product, we obtain a lower LNOx PE for ENGLN than for EUCLID (47 ± 33 mol NOx per flash vs. 69 ± 34 mol NOx per flash). On the contrary, we obtain a slightly higher LNOx PE for ENGLN than for EUCLID when using the TROP-DLR product (58 ± 33 mol NOx per flash vs. 51 ± 25 mol NOx per flash). The mean LNOx PE values averaged over ENGLN and EUCLID for the TROP-KNMI and the TROP-DLR products are 58 and 54.5 mol NOx per flash, respectively. The LNOx PE value obtained using the TROP-KNMI product is then higher than the value obtained using the TROP-DLR product. We suggest that this slight difference is caused by the higher stratospheric NO2 VCD value in the TROP-DLR product.
The standard deviations of the LNOx PEs derived from the TROP-DLR and the TROP-KNMI products are rather similar, suggesting that the variability in the column densities of NO2 provided by the TROP-DLR NO2 product is similar to the variability provided by the TROP-KNMI product.
The average number of pixels with deep convection that satisfy the quality criterion when using the TROP-KNMI product is 370, while it is 758 for the TROP-DLR product. This difference is a consequence of the cutoffs employed for both the retrieved cloud fraction and the OCP. The cloud fraction over the studied cases is about 30 % larger for the TROP-DLR product than for the TROP-KNMI product, while the OCP is about 10 % lower for the TROP-DLR product than for the TROP-KNMI product, leading to more pixels with deep convection in the case of the TROP-DLR product than in the case of the TROP-KNMI product. We have found that using 650 hPa as the OCP threshold for the TROP-KNMI product instead of 523 hPa produces a similar total number of pixels with deep convection that satisfy the quality criterion when using the TROP-KNMI and the TROP-DLR products. This change in the OCP threshold for the TROP-KNMI product produces a change of only +14 % in the LNOx PE estimates, as more pixels with low convection are included in the estimation of the background NOx.
3.2.2 LNOx PE estimates obtained using fixed background NOx values
Let us now estimate the average LNOx PE over all cases using the background NOx based on days with low lightning activity as calculated in Sect. 2.6. Instead of using the Vtropbck values of Tables 1 and 2, we use 1.06 × 10¹⁹, and 0.37 × 10¹⁹ molec m−2 for estimations of the LNOx PE based on the TROP-KNMI and the TROP-DLR research products, respectively. We obtain 86 ± 63 mol NOx per flash by using the TROP-KNMI product with ENGLN lightning data and 160 ± 102 mol NOx per flash by using the TROP-KNMI product with EUCLID lightning data. These values are larger than the mean LNOx PE obtained using non-flashing pixels (47 ± 33 and 69 ± 34 mol NOx per flash). By using the background NOx based on days with low lightning activity, we calculate 44 ± 61 mol NOx per flash by using the TROP-DLR product with ENGLN lightning data and 53 ± 59 mol NOx per flash using the TROP-DLR product with EUCLID lightning data. The LNOx PE estimates based on the TROP-DLR product for the two cases of 7 and 12 May are negative when using the background NOx based on days with low lightning activity, causing lower values of LNOx PE and larger standard deviations than when using the TROP-KNMI product. These values are in agreement with the mean LNOx PE obtained using non-flashing pixels (58 ± 33 and 51 ± 25 mol NOx per flash). We calculate the average LNOx PE over all cases by using the background NOx estimated from CARIBIC measurements (0.75 × 10¹⁹ molec m−2), as described in Sect. 2.6. We obtain 96 ± 67 mol NOx per flash using the TROP-KNMI product with ENGLN lightning data and 176 ± 108 mol NOx per flash using the TROP-KNMI product with EUCLID lightning data. These values are larger than the mean LNOx PE obtained using non-flashing pixels (47 ± 33 and 69 ±34 mol NOx per flash).
Finally, we calculate 17 ± 48 mol NOx per flash by using the TROP-DLR product with ENGLN lightning data and 34 ± 74 mol NOx per flash using the TROP-DLR product with EUCLID lightning data. Again, the standard deviation of the TROP-DLR LNOx PE using a fixed value as the background NOx mixing ratio is lower than in the previous cases as a consequence of the low NOx VCD of the cases on 12 and 7 May. The LNOx PE estimates obtained using the TROP-DLR product are negative because the tropospheric VCD of NOx is lower than the CARIBIC-based estimated background NOx (fourth column in Table 2). The obtained TROP-DLR values are lower than the mean LNOx PE obtained using non-flashing pixels (58 ± 33 and 51 ± 25 mol NOx per flash).
Given that the standard deviation of the received LNOx PE estimates obtained by using fixed values of the background NOx are larger than the means for the TROP-DLR product, we conclude that using fixed values for the background is not adequate in this case-based study. This is a consequence of the observed large variability of the tropospheric VCD of NOx for each studied thunderstorm. Fixed background values could be useful to estimate the mean LNOx PE over a number of case studies but they are less useful for individual case studies.
3.3 Sensitivity analysis and uncertainties
In this section, we discuss the most important uncertainties in the estimation of LNOx PE presented in Sect. 3.2.1. We calculate the uncertainty associated with each parameter by comparing the maximum and the minimum received LNOx PE values to the mean of the value for the possible choices of that parameter.
Let us begin by discussing the contribution of the employed lightning data to the uncertainty of the LNOx PE estimates. The mean LNOx PE of both TROPOMI products (KNMI and DLR) obtained by using ENGLN lightning data is 52.5 mol NOx per flash, while it is 60 mol NOx per flash using EUCLID lightning data. Therefore, the uncertainty introduced by different lightning data sets is 7 %. We calculated the t-test for the means of the LNOx PE estimates when using ENGLN and EUCLID lightning data, obtaining a p-value of 0.43. Therefore, we conclude that differences in LNOx PE when using ENTLN and EUCLID are not statistically significant based on the t-test for the means. It is important to mention that the statistical significance is influenced by the population of the sample.
The LNOx PE estimates obtained by using different TROPOMI products (KNMI versus DLR) are not similar, as obtained in Sect. 3.2.1. There is a 23 % difference between the LNOx PE estimates obtained using both TROPOMI products and ENGLN lightning data, and a 35 % difference when using EUCLID lightning data. The difference is reduced when using only ENGLN lightning data, whose DE is higher than for EUCLID. The uncertainty introduced in the LNOx PE per flash between the choice of the TROPOMI product for the ENGLN and EUCLID lightning data combined is only 3 %. We obtain a p-value of 0.44 by calculating the t-test for the means of the LNOx PE estimates when using TROP-KNMI and TROP-DLR, indicating that differences in LNOx PE arising from the use of different TROPOMI products are not statistically significant.
As shown in Tables 1 and 2, the estimation of the background NOx as the 30th or 10th percentile of over non-flashing pixels with deep convection can significantly influence the LNOx PE estimates. The average LNOx PE considering both TROPOMI products and using the 30th percentile of is 42 mol NOx per flash, while it is 70 mol NOx per flash using the 10th percentile of . Therefore, the choice of the background NOx method contributes an uncertainty of 29 %. The p-value obtained by calculating the t-test for the means of the LNOx PE estimates using the 30th or 10th percentile of over non-flashing pixels with deep convection as background NOx is lower than 0.05, which indicates that differences in LNOx PE arising from the use of different methods to estimate the background NOx products are statistically significant.
The DE of the used LLS can also contribute to the uncertainty of the LNOx PE estimates. As explained in Sect. 2.2, we obtain a DE for ENGLN over the Pyrenees of 0.676 ± 0.12 (ranging between 0.556 and 0.769). The mean LNOx PE obtained using both TROPOMI products and a DE of 0.769 is 59 mol NOx per flash, while it is 43 mol NOx per flash when using a DE of 0.556. Therefore, the uncertainty of the DE of ENGLN contributes a LNOx PE uncertainty of 17 %. For EUCLID, we obtain a DE of 0.27 ± 0.12. The mean LNOx PE obtained using EUCLID data corrected by a DE of 0.40 is 86 mol NOx per flash, while it is 33 mol NOx per flash when using a DE of 0.15. Therefore, the uncertainty of the DE of EUCLID contributes an LNOx PE uncertainty of 62 %. The contribution of the DE of EUCLID to the uncertainty is higher than the contribution of the DE of ENGLN because the DE of EUCLID is significantly lower than the DE of ENGLN.
The lifetime of NOx in the near field of convection (τ) is another parameter that can introduce uncertainty into the LNOx PE estimates. We have used 3 h, but it can vary between 2 and several days (Penner et al., 1998; Nault et al., 2017; Allen et al., 2021a). Nault et al. (2017) reinterpreted previous analyses of the lifetime of NOx in the near field of convection from the Deep Convective Clouds and Chemistry (DC3) by including rapid CH3O2NO2 and alkyl and multifunctional nitrates (ANs), and reported that it can vary between 2 and 12 h. Based on the recent estimations from Nault et al. (2017), we have performed LNOx PE calculations using the TROPOMI products and ENGLN lightning data and setting τ=12 h as an upper limit while keeping the time windows used at 5 h, which yielded a mean LNOx PE of 38 mol NOx per flash. Given that the LNOx PE with τ=3 h is 52.5 mol NOx per flash, we estimate that τ contributes an uncertainty in the LNOx PE of about 18 %.
The time window before the TROPOMI overpass, which is used to count the total number of lightning flashes contributing to the freshly produced LNOx, can also be a source of uncertainty. We have calculated the LNOx PE estimates using a time window of 1 h instead of 5 h in order to get an estimation of the uncertainty introduced by the time window. We obtain 88 mol NOx per flash as the mean value by using the TROP-KNMI and the TROP-DLR products and ENGLN lightning data. The LNOx PE estimation using the same TROPOMI products and lightning data with a time window of 5 h was 52.5 mol NOx per flash. According to our estimations, the time window contribution to the uncertainty of the LNOx PE is about 29 %. We do not perform calculations using a larger time window because studying the transport of LNOx at longer timescales is beyond the scope of this work.
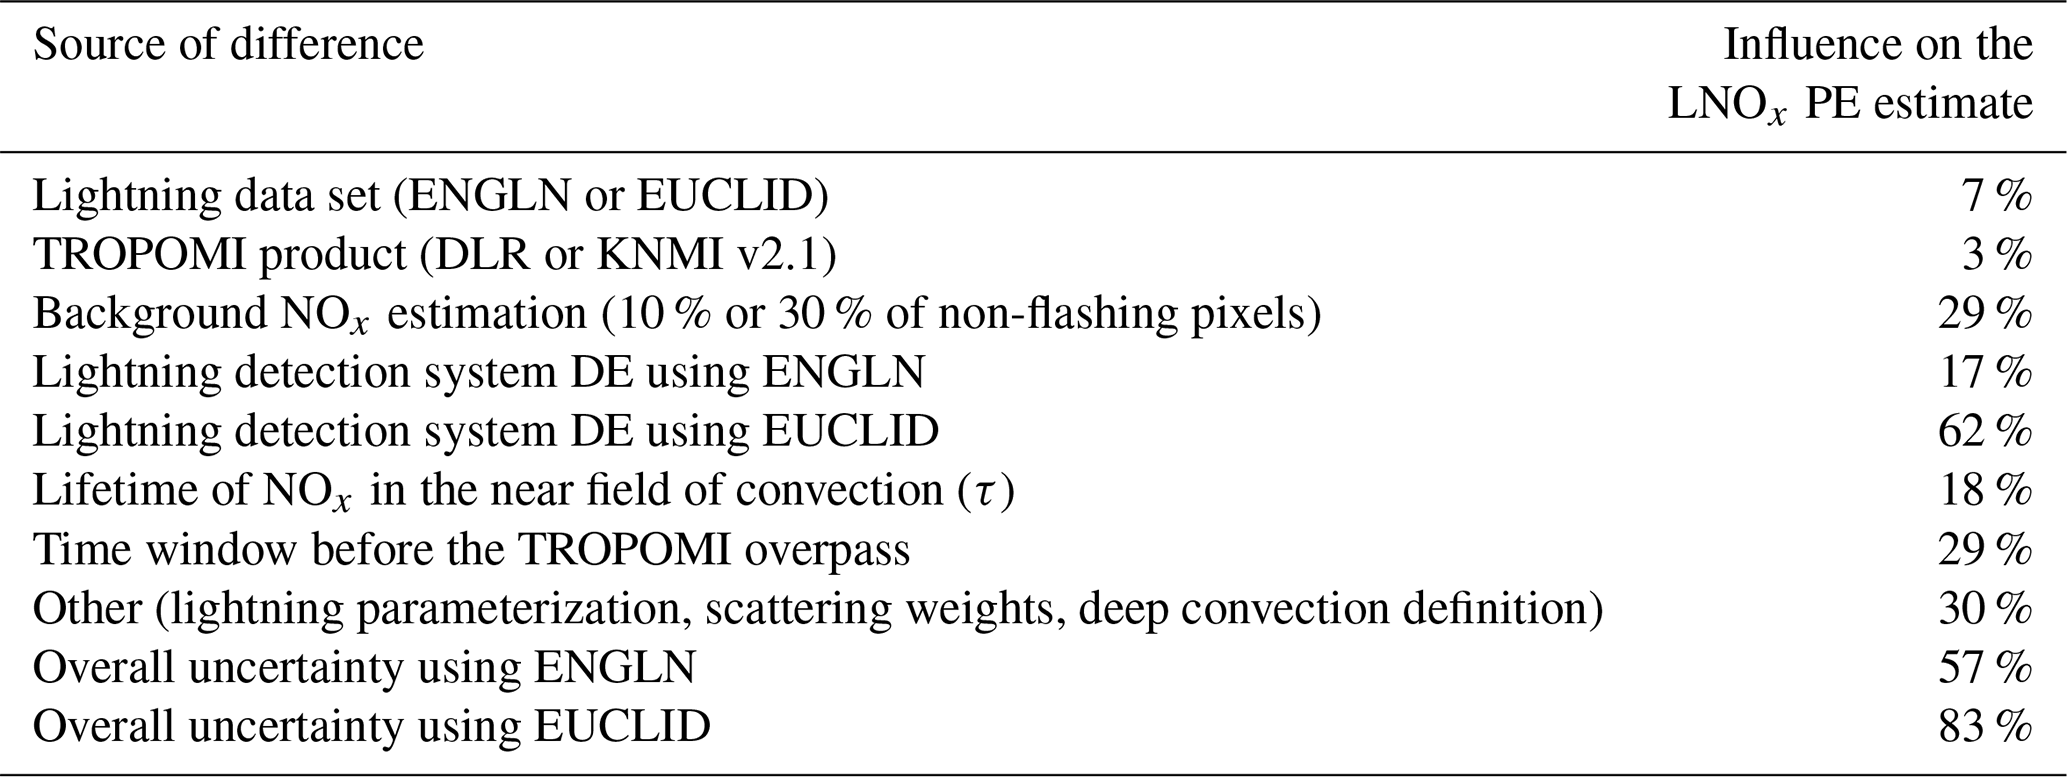
The sources of the differences in the LNOx PE estimation evaluated in this study are summarized in Table 3. As discussed in previous studies (e.g., Pickering et al., 2016; Allen et al., 2019; Lapierre et al., 2020; Zhang et al., 2020; Allen et al., 2021a), there are other possible sources of uncertainty, such as the calculation of the AMF, which contributes an uncertainty of about 30 %, the method of selecting the OCP to be used for the definition of deep convection, which contributes an uncertainty of about 10 %, or other systematic errors in the retrieval algorithms of TROPOMI. In turn, the calculation of the AMF is influenced by the calculation of the LNOx profile type, the lightning parameterization and the assumed NOx = NO2 ratios in the 35 simulations and scattering weight calculations. However, estimates of the influence of these parameters on the uncertainty of LNOx PE for the particular area of the Pyrenees is beyond the scope of this paper, as we do not expect them to be dependent on the studied area.
We can estimate the overall LNOx PE uncertainty by summing the uncertainties in the PE collected in Table 3. We obtain an overall LNOx PE uncertainty of 57 % using ENGLN lightning data and 83 % using EUCLID lightning data.
Previous studies have used OMI NO2 measurements to estimate the LNOx PE over different regions, as shown in Table 4. Pickering et al. (2016) reported a LNOx PE of 80 ± 45 mol per flash over the Gulf of Mexico. Bucsela et al. (2019) systematically estimated the LNOx PE over midlatitudes, obtaining an average LNOx PE of 180 ± 100 mol per flash. Interestingly, Bucsela et al. (2019) (see Table 1) found a lower LNOx PE in Europe (150 ± 90 mol per flash). Allen et al. (2019) reported a mean LNOx PE over the tropics of 170 ± 100 mol per flash. Lapierre et al. (2020) reported a LNOx PE over the USA of ∼ 24 mol per flash (estimated from mol per stroke calculations), while Zhang et al. (2022) reported 90 ± 50 mol per flash over the USA. Recently, Allen et al. (2021a) have estimated the LNOx PE in 29 thunderstorms over the USA by using new TROPOMI NO2 data, finding a LNOx PE of 120 ± 50 mol per flash based on the use of ENGLN lightning data. We have calculated the t-test for the means of the LNOx PE estimates when using ENGLN lightning data together with the TROP-KNMI product and the LNOx PE estimates provided by Allen et al. (2021a) when using ENGLN lightning data, obtaining a p-value lower than 0.05. Therefore, we conclude that differences in LNOx PE between the Pyrenees and the US are statistically significant.
Pickering et al. (2016)Bucsela et al. (2019)Allen et al. (2019)Lapierre et al. (2020)Zhang et al. (2020)Allen et al. (2021a)Table 4Some recent LNOx PE estimates. CNLDN stands for the China National Lightning Detection Network.
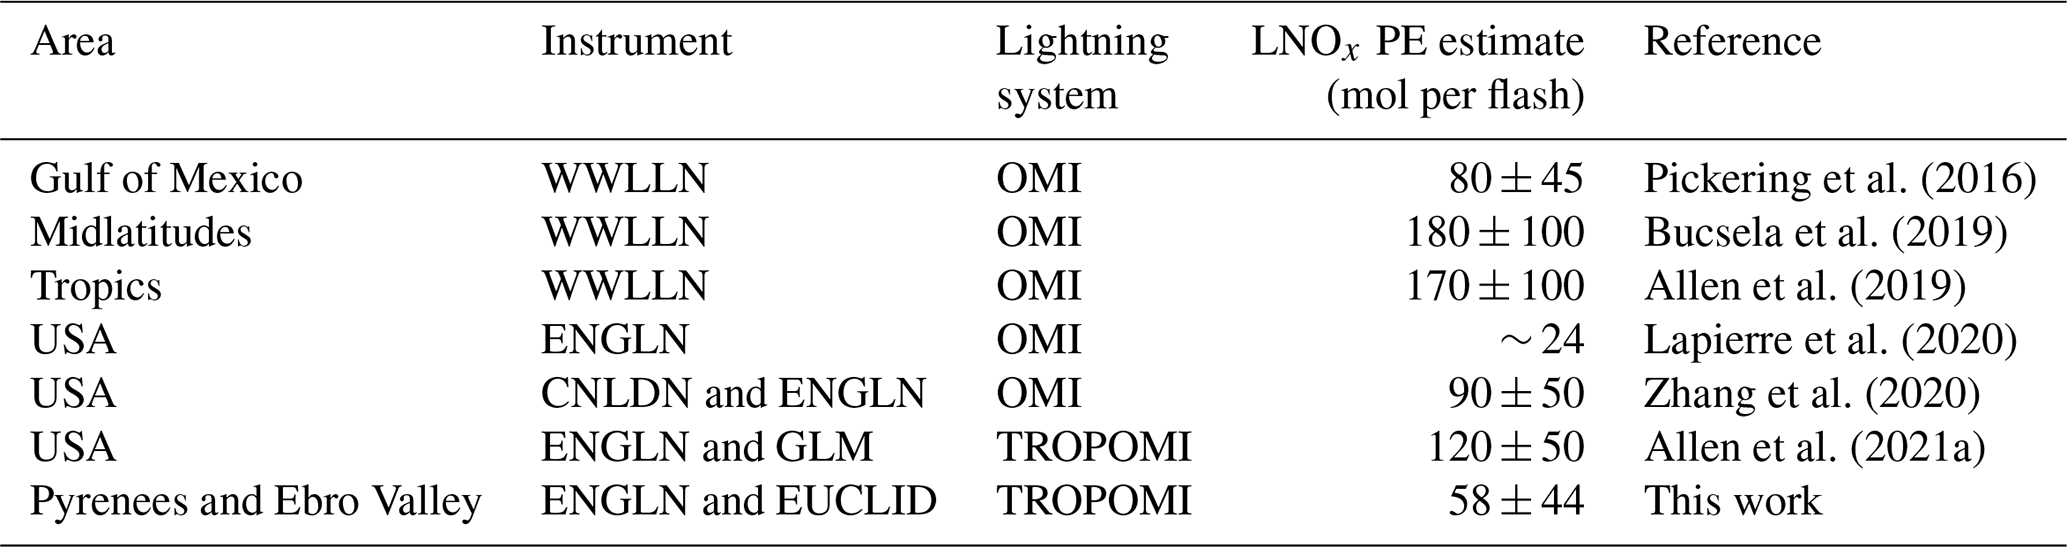
We have used the LNOx PE algorithm employed by Pickering et al. (2016), Bucsela et al. (2019) and Allen et al. (2019, 2021a) to provide new LNOx PE estimates based on TROPOMI NO2 measurements over the Pyrenees. We obtain 47 ± 33 (69 ± 34) mol NOx per flash using the TROP-KNMI research product and ENGLN (EUCLID) lightning data and 58 ± 33 (51 ± 25 mol NOx) mol NOx per flash using the TROP-DLR product and ENGLN (EUCLID) lightning data. Our mean LNOx PE estimates are slightly lower than the LNOx PE reported by, e.g., Pickering et al. (2016), Allen et al. (2019), Zhang et al. (2020) and Allen et al. (2021a), and a factor of ∼ 2 higher than that determined by Lapierre et al. (2020). The employed method uses only TROPOMI measurements over cloudy pixels to estimate freshly produced LNOx. As a consequence, part of the LNOx produced before the TROPOMI overpass can be overlooked. Consequently, the obtained LNOx PE can be biased low.
When comparing our results with TROPOMI-based estimates by Allen et al. (2021a) over the USA using ENGLN lightning data (120 ± 50 mol), we obtain lower LNOx PE estimates, which is in agreement with Bucsela et al. (2019), who reported a lower LNOx PE over Europe than over the USA. We estimate a mean tropospheric VCD of NOx of 3.5 × 10¹⁹ molec m−2 from the TROP-KNMI product. Allen et al. (2021a) reported a slightly higher mean VCD of NOx of 4.4 × 10¹⁹ molec m−2 from the TROP-KNMI product. The Pyrenees are a low-contamination area, which explains why the tropospheric VCD of NOx is lower than for the 29 cases studied by Allen et al. (2021a) over the USA. We have also found a comparable influence of the background NOx on the uncertainty of our results than Allen et al. (2021a), (29 % vs. 22.5 %). The explanation for this difference could be that Allen et al. (2021a) analyzed 29 cases, while in this study we have analyzed only eight cases.
The obtained LNOx PE are significantly influenced by the TROPOMI (KNMI and DLR) and the lightning (ENGLN and EUCLID) data sets. The difference between the LNOx PEs calculated by using the TROP-KNMI and the TROP-DLR products together with the ENGLN lightning data is 3 %. There is a factor of 3.5 difference between the estimated median tropospheric VCD of NOx obtained using the TROP-KNMI product (3.5 × 10¹⁹ molec m−2) and that obtained using the TROP-DLR product (0.96 × 10¹⁹ molec m−2), while the differences in the provided mean stratospheric VCD of NO2 over pixels with deep convection is 14 % (7.3 and 8.3 × 10¹⁹ molec m−2 for the TROP-KNMI and the TROP-DLR products, respectively). The background NOx is estimated from non-flashing pixels, leading to similar and LNOx PE values. However, using a fixed value for the background NOx produces a significantly lower LNOx PE for the TROP-DLR product than for the TROP-KNMI product as a consequence of the lower tropospheric VCD of NOx obtained from the TROP-DLR product.
Despite significant differences in the DE of ENGLN and EUCLID in the studied area, we have not found significant differences in the mean estimation of the LNOx PE using lightning data from both networks after correction with the DE. The LNOx PE estimates obtained using the TROP-DLR product together with ENGLN and EUCLID lightning data are fairly similar (58 ± 33 mol NOx per flash and 51 ± 25 mol NOx, respectively). However, we have found that the LNOx PE obtained using the TROP-KNMI product differs for ENGLN (47 ± 33 mol per flash) and EUCLID data (69 ± 34 mol per flash). We have found that the LNOx PE obtained using ENGLN ranges between 39 and 59 mol NOx per flash after correction by the DE of 0.676 ± 0.12, while the calculated LNOx PE using EUCLID ranges between 33 and 86 mol NOx per flash after correction by the DE of 0.27 ± 0.12. Therefore, we conclude that the higher DE of ENGLN provides a more precise LNOx PE than EUCLID in the studied area.
We have estimated the LNOx PE over the Pyrenees, a European region with high lightning activity and a relatively low concentration of background NOx. We have used two lightning data sets (ENGLN and EUCLID) and two TROPOMI NO2 and cloud products (DLR and KNMI v2.1) in this study. The main conclusions of this work are as follows:
-
We obtain 47 ± 33 mol NOx per flash using the TROP-KNMI research product and ENGLN lightning data, 69 ± 34 mol NOx per flash using the TROP-KNMI research product and EUCLID lightning data, 58 ± 33 mol NOx per flash using the TROP-DLR product and ENGLN lightning data, and 51 ± 25 mol NOx per flash by using the TROP-DLR product and EUCLID lightning data. Overall, the obtained LNOx PE ranges between 14 and 103 mol NOx per flash. These estimates are lower than the globally averaged LNOx PE (250 ± 150 mol per flash) estimated by Schumann and Huntrieser (2007) and the LNOx PE estimates from the TROPOMI measurements and ENGLN lightning data in the USA by Allen et al. (2021a) (120 ± 50 mol per flash).
-
We have used different methods to estimate the background NOx, i.e., the background NOx from non-flashing pixels and from measurements over days with low lightning activity. We have found that the most important sources of uncertainty for LNOx PE are the estimation of the background NOx and the time window prior to the TROPOMI overpass time used to collect the lightning data (both about 29 %). The overall uncertainty when using ENGLN lightning data is 57 %. When using EUCLID lightning data, the most important source of uncertainty is the DE of EUCLID (about 62 %), while the overall uncertainty when using EUCLID lightning data is 83 %.
-
The estimated median tropospheric VCD of NOx in convective systems after subtraction of the stratospheric NO2 contribution is a factor of 3.5 lower for the TROP-DLR product than for the TROP-KNMI product as a consequence of the larger stratospheric VCD of NO2 in the TROP-DLR product over pixels with deep convection.
-
The uncertainty introduced by the estimate of the background NOx is considerably larger than the uncertainty introduced by the choice of the lightning data set (ENGLN or EUCLID).
This paper reports on partly new and partly established methods to estimate LNOx PE. It confirms that the uncertainty in the calculation of the LNOx PE is still high, even when using high-resolution measurements from TROPOMI. It also suggests that the LNOx PE varies substantially between different regions, as suggested by a comparison between our results and recent OMI- and TROPOMI-based LNOx PE over the USA (Lapierre et al., 2020; Allen et al., 2021a). This study also shows that differences in LNOx PE estimates can be caused by the different lightning monitoring systems. The launch of the Meteosat Third Generation (MTG) geostationary satellites of the EUropean organization for the exploitation of METeorological SATellites (EUMETSAT) in 2022 will, for the first time, provide continuous monitoring of the occurrence of lightning flashes from space in Europe and Africa through the Lightning Imager (LI) instrument from 2023 onwards (Stuhlmann et al., 2005). Lightning data from the MTG-LI can contribute to improving LNOx estimates over the studied region, Europe and Africa. In fact, lightning data from the geostationary GLM has already contributed to new LNOx PE estimations over the US (Allen et al., 2021b, a). High temporal and spatial resolution observations from the Geostationary Environment Monitoring Spectrometer (GEMS) and future NO2-retrieving instruments on-board geostationary satellites, such as SENTINEL-4 GEO in 2023 (Courrèges-Lacoste et al., 2017) and Tropospheric Emissions: Monitoring of Pollution (TEMPO) (Zoogman et al., 2017) in 2022, will also contribute more data to estimate the LNOx PE over Asia, North America, Europe and Africa.
All data used in this paper are directly available upon request to the authors Francisco J. Pérez-Invernón (franciscojavier.perez-invernon@dlr.de) or Heidi Huntrieser (heidi.huntrieser@dlr.de). The official TROPOMI data are available via ESA’s public data hub (https://s5phub.copernicus.eu/dhus, ESA, 2018). The ERA5 meteorological data are freely accessible through the global climate from the Copernicus Climate Change Service Climate Data Store (CDS, https://cds.climate.copernicus.eu/cdsapp, last access: 1 September 2021; https://doi.org/10.24381/cds.bd0915c6, Hersbach et al., 2018a; https://doi.org/10.24381/cds.adbb2d47, Hersbach et al., 2018b). ENTLN lightning data are available from Earth Networks (https://www.earthnetworks.com, last access: 1 September 2021; Earth Networks, 2021) and AEMET (http://www.aemet.es/ca/eltiempo/observacion/radar, last access: 1 September 2021, AEMET, 2021), respectively. ISS-LIS lightning data are freely accessible through the NASA Global Hydrology Resource Center (https://ghrc.nsstc.nasa.gov/lightning/data/data_lis_iss, last access: 1 September 2021; https://doi.org/10.5067/LIS/ISSLIS/DATA110, Blakeslee, 2021). IAGOS-CARIBIC data can be freely downloaded from https://www.iagos.org/iagos-data/ (last access: 1 September 2021, Brenninkmeijer et al., 2007).
The supplement related to this article is available online at: https://doi.org/10.5194/amt-15-3329-2022-supplement.
FJPI took responsibility for the conceptualization, methodology, validation, formal analysis, investigation, data curation and writing the original draft. HHu also contributed to the conceptualization, methodology, validation, formal analysis, supervision, investigation and writing (review and editing). TE contributed to the validation and data curation. DL, PV and SL contributed to the validation, data curation and preparation of the TROP-DLR product. DA, KP and EB participated in the methodology, validation and formal analysis. PJ contributed to the validation and supervision of EMAC simulations. JvG and HHe participated in the validation, data curation and preparation of the TROP-KNMI product. FJGV, SS and JL contributed to the data curation, validation and preparation of the ENGLN lightning data.
The contact author has declared that neither they nor their co-authors have any competing interests.
Publisher’s note: Copernicus Publications remains neutral with regard to jurisdictional claims in published maps and institutional affiliations.
The authors would like to thank DLR and KNMI for providing TROPOMI research NO2 and cloud data, Earth Networks for providing ENTGN lightning data, the Spanish State Meteorological Agency (AEMET) for providing EUCLID lightning data, NASA for providing ISS-LIS lightning data, ECMWF for providing the data from ERA5 forecasting models and IAGOS Research Infrastructure for providing NO data. The EMAC simulations were performed at the German Climate Computing Centre (DKRZ) through support from the Bundesministerium für Bildung und Forschung (BMBF). DKRZ and its scientific steering committee are gratefully acknowledged for providing the HPC and data archiving resources. The authors would also like to thank Volker Grewe (Deutsches Zentrum für Luft-und Raumfahrt, DLR) for providing valuable comments on this manuscript.
Francisco J. Pérez-Invernón acknowledges the sponsorship provided by the Federal Ministry for Education and Research of Germany through the Alexander von Humboldt Foundation. Additionally, this work was supported by the Spanish Ministry of Science and Innovation under project PID2019-109269RB-C43 and the FEDER program. Sergio Soler acknowledges a PhD research contract through the project PID2019-109269RB-C43. Francisco J. Gordillo-Vázquez and Sergio Soler acknowledge financial support from the State Agency for Research of the Spanish MCIU through the “Center of Excellence Severo Ochoa” award for the Instituto de Astrofísica de Andalucía (SEV-2017-0709).
This research has been supported by the Alexander von Humboldt-Stiftung, the Spanish Ministry of Science and Innovation (project PID2019-109269RB-C43 and the FEDER program) and the State Agency for Research of the Spanish MCIU through the “Center of Excellence Severo Ochoa” award for the Instituto de Astrofísica de Andalucía (SEV-2017-0709).
The article processing charges for this open-access publication were covered by the German Aerospace Center (DLR).
This paper was edited by Steffen Beirle and reviewed by two anonymous referees.
Agencia Estatal de Meteorologica (AEMET): http://www.aemet.es/ca/eltiempo/observacion/radar, last access: 1 September 2021. a
Allen, D. J., Pickering, K. E., Bucsela, E., Krotkov, N., and Holzworth, R.: Lightning NOx production in the tropics as determined using OMI NO2 retrievals and WWLLN stroke data, J. Geophys. Res.-Atmos., 124, 13498–13518, https://doi.org/10.1029/2018JD029824, 2019. a, b, c, d, e, f
Allen, D. J., Pickering, K. E., Bucsela, E., Van Geffen, J., Lapierre, J., Koshak, W., and Eskes, H.: Observations of Lightning NOx Production From Tropospheric Monitoring Instrument Case Studies Over the United States, J. Geophys. Res.-Atmos., 126, e2020JD034174, https://doi.org/10.1029/2020JD034174, 2021a. a, b, c, d, e, f, g, h, i, j, k, l, m, n, o, p, q, r, s, t, u, v, w, x, y, z, aa, ab
Allen, D. J., Pickering, K. E., Lamsal, L., Mach, D. M., Quick, M. G., Lapierre, J., Janz, S., Koshak, W., Kowalewski, M., and Blakeslee, R.: Observations of Lightning NOx Production From GOES R Post Launch Test Field Campaign Flights, J. Geophys. Res.-Atmos., 126, e33769, https://doi.org/10.1029/2020JD033769, 2021b. a, b
Anderson, G. and Klugmann, D.: A European lightning density analysis using 5 years of ATDnet data, Nat. Hazards Earth Syst. Sci., 14, 815–829, https://doi.org/10.5194/nhess-14-815-2014, 2014. a
Beirle, S., Salzmann, M., Lawrence, M. G., and Wagner, T.: Sensitivity of satellite observations for freshly produced lightning NOx, Atmos. Chem. Phys., 9, 1077–1094, https://doi.org/10.5194/acp-9-1077-2009, 2009. a, b, c, d
Beirle, S., Huntrieser, H., and Wagner, T.: Direct satellite observation of lightning-produced NOx, Atmos. Chem. Phys., 10, 10965–10986, https://doi.org/10.5194/acp-10-10965-2010, 2010. a, b
Bitzer, P. M. and Christian, H. J.: Timing uncertainty of the lightning imaging sensor, J. Atmos. Ocean. Technol., 32, 453–460, https://doi.org/10.1175/JTECH-D-13-00177.1, 2015. a
Bitzer, P. M., Burchfield, J. C., and Christian, H. J.: A Bayesian approach to assess the performance of lightning detection systems, J. Atmos. Ocean. Technol., 33, 563–578, https://doi.org/10.1175/JTECH-D-15-0032.1, 2016. a
Blakeslee, R. J., Lang, T. J., Koshak, W. J., Buechler, D., Gatlin, P., Mach, D. M., Stano, G. T., Virts, K. S., Walker, T. D., Cecil, D. J., Ellett, W., Goodman, S. J., Harrison, S., Hawkins, D. L., Heumesser, M., Lin, H., Maskey, M., Schultz, C. J., Stewart, M., Bateman, M., Chanrion, O., and Christian, H.: Three years of the Lightning Imaging Sensor onboard the International Space Station: Expanded Global Coverage and Enhanced Applications, Earth Space Sci. Open Archive, 35812, 83, https://doi.org/10.1029/2020JD032918, 2020. a, b
Blakeslee, R. J.: Non-Quality Controlled Lightning Imaging Sensor (LIS) on International Space Station (ISS) Science Data, NASA Global Hydrometeorology Resource Center DAAC, Huntsville, Alabama, USA [data set], https://doi.org/10.5067/LIS/ISSLIS/DATA110, 2021. a
Boersma, K. F., Eskes, H. J., Richter, A., De Smedt, I., Lorente, A., Beirle, S., van Geffen, J. H. G. M., Zara, M., Peters, E., Van Roozendael, M., Wagner, T., Maasakkers, J. D., van der A, R. J., Nightingale, J., De Rudder, A., Irie, H., Pinardi, G., Lambert, J.-C., and Compernolle, S. C.: Improving algorithms and uncertainty estimates for satellite NO2 retrievals: results from the quality assurance for the essential climate variables (QA4ECV) project, Atmos. Meas. Tech., 11, 6651–6678, https://doi.org/10.5194/amt-11-6651-2018, 2018. a
Brenninkmeijer, C. A. M., Crutzen, P., Boumard, F., Dauer, T., Dix, B., Ebinghaus, R., Filippi, D., Fischer, H., Franke, H., Frieβ, U., Heintzenberg, J., Helleis, F., Hermann, M., Kock, H. H., Koeppel, C., Lelieveld, J., Leuenberger, M., Martinsson, B. G., Miemczyk, S., Moret, H. P., Nguyen, H. N., Nyfeler, P., Oram, D., O'Sullivan, D., Penkett, S., Platt, U., Pupek, M., Ramonet, M., Randa, B., Reichelt, M., Rhee, T. S., Rohwer, J., Rosenfeld, K., Scharffe, D., Schlager, H., Schumann, U., Slemr, F., Sprung, D., Stock, P., Thaler, R., Valentino, F., van Velthoven, P., Waibel, A., Wandel, A., Waschitschek, K., Wiedensohler, A., Xueref-Remy, I., Zahn, A., Zech, U., and Ziereis, H.: Civil Aircraft for the regular investigation of the atmosphere based on an instrumented container: The new CARIBIC system, Atmos. Chem. Phys., 7, 4953–4976, https://doi.org/10.5194/acp-7-4953-2007, 2007 (data available at: https://www.iagos.org/iagos-data/, last access: 1 September 2021). a, b
Bucsela, E. J., Krotkov, N. A., Celarier, E. A., Lamsal, L. N., Swartz, W. H., Bhartia, P. K., Boersma, K. F., Veefkind, J. P., Gleason, J. F., and Pickering, K. E.: A new stratospheric and tropospheric NO2 retrieval algorithm for nadir-viewing satellite instruments: applications to OMI, Atmos. Meas. Tech., 6, 2607–2626, https://doi.org/10.5194/amt-6-2607-2013, 2013. a, b
Bucsela, E. J., Pickering, K. E., Allen, D. J., Holzworth, R. H., and Krotkov, N. A.: Midlatitude lightning NOx production efficiency inferred from OMI and WWLLN data, J. Geophys. Res.-Atmos., 124, 13475–13497, https://doi.org/10.1029/2018JD029824, 2019. a, b, c, d, e, f, g
Cecil, D. J., Buechler, D. E., and Blakeslee, R. J.: Gridded lightning climatology from TRMM-LIS and OTD: Dataset description, Atmos. Res., 135, 404–414, https://doi.org/10.1016/j.atmosres.2012.06.028, 2014. a
Christian, H. J., Blakeslee, R. J., Boccippio, D. J., Boeck, W. L., Buechler, D. E., Driscoll, K. T., Goodman, S. J., Hall, J. M., Koshak, J. M., Mach, D. M., and Stewart, M. F.: Global frequency and distribution of lightning as observed from space by the Optical Transient Detector, J. Geophys. Res., 108, ACL 4-1–ACL 4-15, https://doi.org/10.1029/2002JD002347, 2003. a
Courrèges-Lacoste, G. B., Sallusti, M., Bulsa, G., Bagnasco, G., Veihelmann, B., Riedl, S., Smith, D., and Maurer, R.: The Copernicus Sentinel 4 mission: a geostationary imaging UVN spectrometer for air quality monitoring, in: Sensors, Systems, and Next-Generation Satellites XXI, vol. 10423, p. 1042307, International Society for Optics and Photonics, https://doi.org/10.1117/12.2282158, 2017. a
Dave, J. V.: Multiple Scattering in a Non-Homogeneous, Rayliegh Atmosphere, J. Atmos. Sci., 22, 273–279, 1965. a
Deckert, R., Jöckel, P., Grewe, V., Gottschaldt, K.-D., and Hoor, P.: A quasi chemistry-transport model mode for EMAC, Geosci. Model Dev., 4, 195–206, https://doi.org/10.5194/gmd-4-195-2011, 2011. a, b
Earth Networks: https://www.earthnetworks.com, last access: 1 September 2021. a
Emersic, C., Heinselman, P. L., MacGorman, D. R., and Bruning, E. C.: Lightning Activity in a Hail-Producing Storm Observed with Phased-Array Radar, Mon. Weather Rev., 139, 1809–1825, 2011. a
ESA: Sentinel-5P Pre-Operations Data Hub, ESA [data set], https://s5phub.copernicus.eu/dhus (last access: 1 September 2021), 2018. a
Esteban, P., Martin-Vide, J., and Mases, M.: Daily atmospheric circulation catalogue for western Europe using multivariate techniques, Int. J. Climatol., 26, 1501–1515, https://doi.org/10.1002/joc.1391, 2006. a
Gordillo-Vázquez, F. J., Pérez-Invernón, F. J., Huntrieser, H., and Smith, A. K.: Comparison of Six Lightning Parameterizations in CAM5 and the Impact on Global Atmospheric Chemistry, Earth Space Sci., 6, 2317–2346, https://doi.org/10.1029/2019EA000873, 2019. a
Grewe, V., Brunner, D., Dameris, M., Grenfell, J., Hein, R., Shindell, D., and Staehelin, J.: Origin and variability of upper tropospheric nitrogen oxides and ozone at northern mid-latitudes, Atmos. Environ., 35, 3421–3433, https://doi.org/10.1016/S1352-2310(01)00134-0, 2001. a
Hersbach, H., Bell, B., Berrisford, P., Biavati, G., Horányi, A., Muñoz Sabater, J., Nicolas, J., Peubey, C., Radu, R., Rozum, I., Schepers, D., Simmons, A., Soci, C., Dee, D., and Thépaut, J.-N.: ERA5 hourly data on pressure levels from 1979 to present, Copernicus Climate Change Service (C3S) Climate Data Store (CDS) [data set], https://doi.org/10.24381/cds.bd0915c6, 2018a. a
Hersbach, H., Bell, B., Berrisford, P., Biavati, G., Horányi, A., Muñoz Sabater, J., Nicolas, J., Peubey, C., Radu, R., Rozum, I., Schepers, D., Simmons, A., Soci, C., Dee, D., and Thépaut, J.-N.: ERA5 hourly data on single levels from 1979 to present, Copernicus Climate Change Service (C3S) Climate Data Store (CDS) [data set], https://doi.org/10.24381/cds.adbb2d47, 2018b. a
Huntrieser, H., Feigl, C., Schlager, H., Schröder, F., Gerbig, C., van Velthoven, P., Flatøy, F., Théry, C., Petzold, A., Höller, H., and Schumann, U.: Airborne measurements of NOx, tracer species, and small particles during the European Lightning Nitrogen Oxides Experiment, J. Geophys. Res.-Atmos., 107, 4113, https://doi.org/10.1029/2000JD000209, 2002. a, b, c, d, e, f, g
Huntrieser, H., Lichtenstern, M., Scheibe, M., Aufmhoff, H., Schlager, H., Pucik, T., Minikin, A., Weinzierl, B., Heimerl, K., Pollack, I. B., Peischl, J., Ryerson, T. B., Weinheimer, A. J., Ho- nomichl, S., Ridley, B. A., Biggerstaff, M. I., Betten, D. P., Hair, J. W., Butler, C. F., Schwartz, M. J., and Barth, M. C.: Injection of lightning-produced NOx, water vapor, wildfire emissions, and stratospheric air to the UT/LS as observed from DC3 measurements, J. Geophys. Res.-Atmos., 121, 6638–6668, https://doi.org/10.1002/2015JD024273, 2016. a
Hutchins, M. L., Holzworth, R. H., Rodger, C. J., and Brundell, J. B.: Far-field power of lightning strokes as measured by the World Wide Lightning Location Network, J. Atmos. Ocean. Tech., 29, 1102–1110, 2012. a
Jöckel, P., Tost, H., Pozzer, A., Kunze, M., Kirner, O., Brenninkmeijer, C. A. M., Brinkop, S., Cai, D. S., Dyroff, C., Eckstein, J., Frank, F., Garny, H., Gottschaldt, K.-D., Graf, P., Grewe, V., Kerkweg, A., Kern, B., Matthes, S., Mertens, M., Meul, S., Neumaier, M., Nützel, M., Oberländer-Hayn, S., Ruhnke, R., Runde, T., Sander, R., Scharffe, D., and Zahn, A.: Earth System Chemistry integrated Modelling (ESCiMo) with the Modular Earth Submodel System (MESSy) version 2.51, Geosci. Model Dev., 9, 1153–1200, https://doi.org/10.5194/gmd-9-1153-2016, 2016. a, b, c
Kieu, N., Gordillo-Vázquez, F. J., Passas, M., Sánchez, J., and Pérez-Invernón, F. J.: High-speed spectroscopy of lightning-like discharges: evidence of molecular optical emissions, J. Geophys. Res.-Atmos., 126, e2021JD035016, https://doi.org/10.1029/2021JD035016, 2021. a
Koelemeijer, R., Stammes, P., Hovenier, J., and De Haan, J.: A fast method for retrieval of cloud parameters using oxygen A band measurements from the Global Ozone Monitoring Experiment, J. Geophys. Res.-Atmos., 106, 3475–3490, https://doi.org/10.1029/2000JD900657, 2001. a
Labrador, L. J., von Kuhlmann, R., and Lawrence, M. G.: The effects of lightning-produced NOx and its vertical distribution on atmospheric chemistry: sensitivity simulations with MATCH-MPIC, Atmos. Chem. Phys., 5, 1815–1834, https://doi.org/10.5194/acp-5-1815-2005, 2005. a
Lapierre, J. L., Laughner, J. L., Geddes, J. A., Koshak, W. J., Cohen, R. C., and Pusede, S. E.: Observing US regional variability in lightning NO2 production rates, J. Geophys. Res.-Atmos., 125, e2019JD031362, https://doi.org/10.1029/2019JD031362, 2020. a, b, c, d, e, f, g
Lindfors, A. V., Kujanpää, J., Kalakoski, N., Heikkilä, A., Lakkala, K., Mielonen, T., Sneep, M., Krotkov, N. A., Arola, A., and Tamminen, J.: The TROPOMI surface UV algorithm, Atmos. Meas. Tech., 11, 997–1008, https://doi.org/10.5194/amt-11-997-2018, 2018. a
Liu, C. and Heckman, S.: The application of total lightning detection and cell tracking for severe weather prediction, in: 91st Bull. Am. Meteorol. Soc. Annual Meeting, 23–27 January 2011, Seattle, WA, USA, 1–10, https://library.wmo.int/pmb_ged/wmo-td_1546_en/P2_7_Heckman_USA.pdf (last acces: 7 June 2022), 2011. a
Liu, C., Sloop, C., and Heckman, S.: Application of lightning in predicting high impact weather, in: Preprints, WMO Technical Conference on Meteorological and Environmental Instruments and Methods of Observation (TEC0-2014), 7–9 July 2014, St. Petersburg, Russian Federation, https://library.wmo.int/pmb_ged/iom_116_en/Session 1/O1_6_Liu_Lightning_application_DTA.pdf (last access: 7 June 2022), 2014. a
Liu, S., Valks, P., Pinardi, G., Xu, J., Chan, K. L., Argyrouli, A., Lutz, R., Beirle, S., Khorsandi, E., Baier, F., Huijnen, V., Bais, A., Donner, S., Dörner, S., Gratsea, M., Hendrick, F., Karagkiozidis, D., Lange, K., Piters, A. J. M., Remmers, J., Richter, A., Van Roozendael, M., Wagner, T., Wenig, M., and Loyola, D. G.: An improved TROPOMI tropospheric NO2 research product over Europe, Atmos. Meas. Tech., 14, 7297–7327, https://doi.org/10.5194/amt-14-7297-2021, 2021. a
Liu, Y., Williams, E., Li, Z., Guha, A., LaPierre, J., Stock, M., Heckman, S., Zhang, Y., and DiGangi, E.: Lightning Enhancement in Moist Convection with Smoke-laden Air Advected from Australian Wildfires, Geophys. Res. Lett., 48, e2020GL092355, https://doi.org/10.1029/2020GL092355, 2021. a, b, c
Loyola, D. G., Gimeno García, S., Lutz, R., Argyrouli, A., Romahn, F., Spurr, R. J. D., Pedergnana, M., Doicu, A., Molina García, V., and Schüssler, O.: The operational cloud retrieval algorithms from TROPOMI on board Sentinel-5 Precursor, Atmos. Meas. Tech., 11, 409–427, https://doi.org/10.5194/amt-11-409-2018, 2018. a, b, c, d
Ludewig, A., Kleipool, Q., Bartstra, R., Landzaat, R., Leloux, J., Loots, E., Meijering, P., van der Plas, E., Rozemeijer, N., Vonk, F., and Veefkind, P.: In-flight calibration results of the TROPOMI payload on board the Sentinel-5 Precursor satellite, Atmos. Meas. Tech., 13, 3561–3580, https://doi.org/10.5194/amt-13-3561-2020, 2020. a
Mach, D. M., Christian, H. J., Blakeslee, R. J., Boccippio, D. J., Goodman, S. J., and Boeck, W. L.: Performance assessment of the optical transient detector and lightning imaging sensor, J. Geophys. Res.-Atmos., 112, D09210, https://doi.org/10.1029/2006JD007787, 2007. a
Marais, E. A., Jacob, D. J., Choi, S., Joiner, J., Belmonte-Rivas, M., Cohen, R. C., Beirle, S., Murray, L. T., Schiferl, L. D., Shah, V., and Jaeglé, L.: Nitrogen oxides in the global upper troposphere: interpreting cloud-sliced NO2 observations from the OMI satellite instrument, Atmos. Chem. Phys., 18, 17017–17027, https://doi.org/10.5194/acp-18-17017-2018, 2018. a
Marais, E. A., Roberts, J. F., Ryan, R. G., Eskes, H., Boersma, K. F., Choi, S., Joiner, J., Abuhassan, N., Redondas, A., Grutter, M., Cede, A., Gomez, L., and Navarro-Comas, M.: New observations of NO2 in the upper troposphere from TROPOMI, Atmos. Meas. Tech., 14, 2389–2408, https://doi.org/10.5194/amt-14-2389-2021, 2021. a
Marchand, M., Hilburn, K., and Miller, S. D.: Geostationary Lightning Mapper and Earth Networks lightning detection over the contiguous United States and dependence on flash characteristics, J. Geophys. Res.-Atmos., 124, 11552–11567, https://doi.org/10.1029/2019JD031039, 2019. a
Molinie, G., Soula, S., and Chauzy, S.: Cloud-to-ground lightning activity and radar observations of storms in the Pyrénées range area, Q. J. Roy. Meteor. Soc., 125, 3103–3122, https://doi.org/10.1002/qj.49712556015, 1999. a
Murray, L. T., Jacob, D. J., Logan, J. A., Hudman, R. C., and Koshak, W. J.: Optimized regional and interannual variability of lightning in a global chemical transport model constrained by LIS/OTD satellite data, J. Geophys. Res.-Atmos., 117, D20307, https://doi.org/10.1029/2012JD017934, 2012. a
Myriokefalitakis, S., Daskalakis, N., Gkouvousis, A., Hilboll, A., van Noije, T., Williams, J. E., Le Sager, P., Huijnen, V., Houweling, S., Bergman, T., Nüß, J. R., Vrekoussis, M., Kanakidou, M., and Krol, M. C.: Description and evaluation of a detailed gas-phase chemistry scheme in the TM5-MP global chemistry transport model (r112), Geosci. Model Dev., 13, 5507–5548, https://doi.org/10.5194/gmd-13-5507-2020, 2020. a, b
Nault, B. A., Laughner, J. L., Wooldridge, P. J., Crounse, J. D., Dibb, J., Diskin, G., Peischl, J., Podolske, J. R., Pollack, I. B., Ryerson, T. B., Scheuer, E., Wennberg, P. O., and Cohen, R. C.: Lightning NOx Emissions: Reconciling Measured and Modeled Estimates With Updated NOx Chemistry, Geophys. Res. Lett., 44, 9479–9488, https://doi.org/10.1002/2017GL074436, 2017. a, b, c, d, e
Pan, L. L., Homeyer, C. R., Honomichl, S., Ridley, B. A., Weisman, M., Barth, M. C., Hair, J. W., Fenn, M. A., Butler, C., Diskin, G. S., Crawford, J. H., Ryerson, T. B., Pollack, I., Peischl, J., and Huntrieser, H.: Thunderstorms enhance tropospheric ozone by wrapping and shedding stratospheric air, Geophys. Res. Lett., 41, 7785–7790, https://doi.org/10.1002/2014GL061921, 2014. a
Penner, J. E., Bergmann, D. J., Walton, J. J., Kinnison, D., Prather, M. J., Rotman, D., Price, C., Pickering, K. E., and Baughcum, S. L.: An evaluation of upper troposphere NOx with two models, J. Geophys. Res.-Atmos., 103, 22097–22113, https://doi.org/10.1029/98JD01565, 1998. a
Pickering, K. E., Wang, Y., Tao, W.-K., Price, C., and Müller, J.-F.: Vertical distributions of lightning NOx for use in regional and global chemical transport models, J. Geophys. Res.-Atmos., 103, 31203–31216, https://doi.org/10.1029/98JD02651, 1998. a, b
Pickering, K. E., Bucsela, E., Allen, D., Ring, A., Holzworth, R., and Krotkov, N.: Estimates of lightning NOx production based on OMI NO2 observations over the Gulf of Mexico, J. Geophys. Res.-Atmos., 121, 8668–8691, https://doi.org/10.1002/2015JD024179, 2016. a, b, c, d, e, f, g, h, i
Pineda, N., Esteban, P., Trapero, L., Soler, X., and Beck, C.: Circulation types related to lightning activity over Catalonia and the Principality of Andorra, Phys. Chem. Earth, Parts A/B/C, 35, 469–476, https://doi.org/10.1016/j.pce.2009.12.009, 2010. a, b, c, d
Poelman, D. R. and Schulz, W.: Comparing lightning observations of the ground-based European lightning location system EUCLID and the space-based Lightning Imaging Sensor (LIS) on the International Space Station (ISS), Atmos. Meas. Tech., 13, 2965–2977, https://doi.org/10.5194/amt-13-2965-2020, 2020. a
Price, C., Penner, J., and Prather, M.: NOx from lightning: 1. Global distribution based on lightning physics, J. Geophys. Res., 102, 5929, https://doi.org/10.1029/96JD03504, 1997. a
Ripoll, J.-F., Zinn, J., Colestock, P. L., and Jeffery, C. A.: On the dynamics of hot air plasmas related to lightning discharges: 2. Electrodynamics, J. Geophys. Res.-Atmos., 119, 9218–9235, https://doi.org/10.1002/2013JD020067, 2014a. a
Ripoll, J.-F., Zinn, J., Jeffery, C. A., and Colestock, P. L.: On the dynamics of hot air plasmas related to lightning discharges: 1. Gas dynamics, J. Geophys. Res.-Atmos., 119, 9196–9217, https://doi.org/10.1002/2013JD020068, 2014b. a
Schulz, W., Diendorfer, G., Pedeboy, S., and Poelman, D. R.: The European lightning location system EUCLID – Part 1: Performance analysis and validation, Nat. Hazards Earth Syst. Sci., 16, 595–605, https://doi.org/10.5194/nhess-16-595-2016, 2016. a, b
Schumann, U. and Huntrieser, H.: The global lightning-induced nitrogen oxides source, Atmos. Chem. Phys., 7, 3823–3907, https://doi.org/10.5194/acp-7-3823-2007, 2007. a, b, c, d, e
Silvern, R., Jacob, D., Travis, K., Sherwen, T., Evans, M., Cohen, R., Laughner, J., Hall, S., Ullmann, K., Crounse, J., Wennberg, P. O., Peischl, J., and Pollack, I. B.: Observed NO NO2 ratios in the upper troposphere imply errors in NO-NO2-O3 cycling kinetics or an unaccounted NOx reservoir, Geophys. Res. Lett, 45, 4466–4474, https://doi.org/10.1029/2018GL077728, 2018. a
Stuhlmann, R., Rodriguez, A., Tjemkes, S., Grandell, J., Arriaga, A., Bézy, J.-L., Aminou, D., and Bensi, P.: Plans for EUMETSAT’s Third Generation Meteosat geostationary satellite programme, Adv. Space Res, 36, 975–981, https://doi.org/10.1016/j.asr.2005.03.091, 2005. a
Tost, H., Jöckel, P., and Lelieveld, J.: Lightning and convection parameterisations – uncertainties in global modelling, Atmos. Chem. Phys., 7, 4553–4568, https://doi.org/10.5194/acp-7-4553-2007, 2007. a
van Geffen, J., Boersma, K. F., Eskes, H., Sneep, M., ter Linden, M., Zara, M., and Veefkind, J. P.: S5P TROPOMI NO2 slant column retrieval: method, stability, uncertainties and comparisons with OMI, Atmos. Meas. Tech., 13, 1315–1335, https://doi.org/10.5194/amt-13-1315-2020, 2020. a
van Geffen, J., Eskes, H., Compernolle, S., Pinardi, G., Verhoelst, T., Lambert, J.-C., Sneep, M., ter Linden, M., Ludewig, A., Boersma, K. F., and Veefkind, J. P.: Sentinel-5P TROPOMI NO2 retrieval: impact of version v2.2 improvements and comparisons with OMI and ground-based data, Atmos. Meas. Tech., 15, 2037–2060, https://doi.org/10.5194/amt-15-2037-2022, 2022. a
van Geffen, J. H. G. M., Eskes, H. J., Boersma, K. F., and Veefkind, J. P.: Report S5P-KNMI-L2-0005-RP, version 2.2.0, released 16 June 2021, KNMI, De Bilt, The Netherlands, https://sentinel.esa.int/documents/247904/2476257/Sentinel-5P-TROPOMI-ATBD-NO2-data-products, last access: 1 September 2021. a
Veefkind, J., Aben, I., McMullan, K., Förster, H., De Vries, J., Otter, G., Claas, J., Eskes, H., De Haan, J., Kleipool, Q., van Weele, M., Hasekamp, O., Hoogeveen, R., Landgraf, J., Snel, R., Tol, P., Ingmann, P., Voors, R., Kruizinga, B., Vink, R., Visser, H., and Levelt, P. F.: TROPOMI on the ESA Sentinel-5 Precursor: A GMES mission for global observations of the atmospheric composition for climate, air quality and ozone layer applications, Remote Sens. Environ., 120, 70–83, https://doi.org/10.1016/j.rse.2011.09.027, 2012. a, b
Vinken, G. C. M., Boersma, K. F., van Donkelaar, A., and Zhang, L.: Constraints on ship NOx emissions in Europe using GEOS-Chem and OMI satellite NO2 observations, Atmos. Chem. Phys., 14, 1353–1369, https://doi.org/10.5194/acp-14-1353-2014, 2014. a, b
Wallace, L.: The Spectrum of Lightning, Astrophys. J., 139, 994, https://doi.org/10.1086/147833, 1964. a
Wang, P., Stammes, P., van der A, R., Pinardi, G., and van Roozendael, M.: FRESCO+: an improved O2 A-band cloud retrieval algorithm for tropospheric trace gas retrievals, Atmos. Chem. Phys., 8, 6565–6576, https://doi.org/10.5194/acp-8-6565-2008, 2008. a
Williams, J. E., Boersma, K. F., Le Sager, P., and Verstraeten, W. W.: The high-resolution version of TM5-MP for optimized satellite retrievals: description and validation, Geosci. Model Dev., 10, 721–750, https://doi.org/10.5194/gmd-10-721-2017, 2017. a, b
Zeldovich, Y., Frank-Kamenetskii, D., and Sadovnikov, P.: Oxidation of nitrogen in combustion, Publishing House of the Acad of Sciences of USSR, ISSN 1434-6001, 1947. a
Zhang, X., Yin, Y., van der A, R., Lapierre, J. L., Chen, Q., Kuang, X., Yan, S., Chen, J., He, C., and Shi, R.: Estimates of lightning NOx production based on high-resolution OMI NO2 retrievals over the continental US, Atmos. Meas. Tech., 13, 1709–1734, https://doi.org/10.5194/amt-13-1709-2020, 2020. a, b, c, d
Zhang, X., Yin, Y., van der A, R., Eskes, H., van Geffen, J., Li, Y., Kuang, X., Lapierre, J. L., Chen, K., Zhen, Z., Hu, J., He, C., Chen, J., Shi, R., Zhang, J., Ye, X., and Chen, H.: Influence of convection on the upper-tropospheric O3 and NOx budget in southeastern China, Atmos. Chem. Phys., 22, 5925–5942, https://doi.org/10.5194/acp-22-5925-2022, 2022. a, b
Zhu, Y., Rakov, V. A., Tran, M. D., Stock, M. G., Heckman, S., Liu, C., Sloop, C. D., Jordan, D. M., Uman, M. A., Caicedo, J. A., Kotovsky, D. A., Wilkes, R. A., Carvalho, F. L., Ngin, T., Gamerota, W. R., Pilkey, J. T., and Hare, B. M.: Evaluation of ENTLN performance characteristics based on the ground truth natural and rocket-triggered lightning data acquired in Florida, J. Geophys. Res.-Atmos., 122, 9858–9866, 2017. a
Zoogman, P., Liu, X., Suleiman, R., Pennington, W., Flittner, D., Al-Saadi, J., Hilton, B., Nicks, D., Newchurch, M., Carr, J., Janz, S., Andraschko, M., Arola, A., Baker, B., Canova, B., Chan Miller, C., Cohen, R., Davis, J., Dussault, M., Edwards, D., Fishman, J., Ghulam, A., González Abad, G., Grutter, M., Herman, J., Houck, J., Jacob, D., Joiner, J., Kerridge, B., Kim, J., Krotkov, N., Lamsal, L., Li, C., Lindfors, A., Martin, R., McElroy, C., McLinden, C., Natraj, V., Neil, D., Nowlan, C., O'Sullivan, E., Palmer, P., Pierce, R., Pippin, M., Saiz-Lopez, A., Spurr, R., Szykman, J., Torres, O., Veefkind, J., Veihelmann, B., Wang, H., Wang, J., and Chance, K.: Tropospheric emissions: Monitoring of pollution (TEMPO), J. Quant. Spectrosc. Radiat. Transf., 186, 17–39, https://doi.org/10.1016/j.jqsrt.2016.05.008, 2017. a