the Creative Commons Attribution 4.0 License.
the Creative Commons Attribution 4.0 License.
 | 24 Jan 2022
Moderate spectral resolution solar irradiance measurements, aerosol optical depth, and solar transmission, from 360 to 1070 nm, using the refurbished rotating shadow band spectroradiometer (RSS)
Joseph J. Michalsky
Peter W. Kiedron
This paper reports on a third-generation rotating shadow band spectroradiometer (RSS) used to measure global and diffuse horizontal plus direct normal irradiances and transmissions at 1002 wavelengths between 360 and 1070 nm. The prism-dispersed spectral data are from the Atmospheric Radiation Measurement (ARM) Southern Great Plains site in north-central Oklahoma (36.605∘ N, 97.486∘ W) and cover dates between August 2009 and February 2014. The refurbished RSS isolates the detector in a vacuum chamber with pressures near 10−7 torr. This prevents the deposition of outgassed vapors from the interior of the spectrometer shell on the cooled detector that affected the operation of the first commercial RSS. Methods for (1) ensuring the correct wavelength registration of the data and (2) deriving extraterrestrial responses over the entire spectrum, including throughout strong water vapor and oxygen bands, are described. The resulting data produced are archived as ARM data records and include cloud-screened aerosol optical depths, spectral irradiances and direct normal solar transmission, as well as normalized diffuse and global irradiances.
- Article
(4644 KB) - Full-text XML
- BibTeX
- EndNote


The rotating shadow band spectroradiometer was developed to provide spectrally resolved measurements of the shortwave spectrum for the Atmospheric Radiation Measurement (ARM) program (Stokes and Schwartz, 1994). The instrument measures global and diffuse horizontal irradiance by alternately shading and unshading the diffuser that serves as the 2π sr input optic to the spectrometer; it then calculates the direct normal irradiance from these measurements and a laboratory-measured, spectrally dependent correction for the angular (cosine) response of the receiver. A spectrally dependent correction for diffuse horizontal irradiance is also made using these measured angular responses of the receiver.
To date, rotating shadow band spectroradiometer (RSS) data have been used in several studies; for example, to derive water vapor by fitting a model to direct spectral irradiance data (Kiedron et al., 2001), to derive water vapor in overcast conditions by using diffuse spectral irradiance (Kiedron et al., 2003), to measure the photon pathlength to help decipher the structure of clouds over the ARM site in northern Oklahoma (Min and Harrison, 1999; Min et al., 2001; Min and Clothiaux, 2003), and to better understand aerosol retrievals (Gianelli et al., 2005) using the expanded wavelength data set.
Only the key features of the RSS will be highlighted in this paper. The first generation of visible-wavelength RSSs are briefly described in Harrison et al. (1999). The two prototypes used 512 and 1024 charge-coupled device (CCD) pixel arrays and were reasonably stable. The first commercial RSS had a problem with contamination of the detector surface due to suspected outgassing from the walls of the housing surrounding the optical train, and consequently, it was difficult to maintain calibration. This third version of the RSS fixes this problem, as will be discussed in the next section. Our method to ensure correct wavelength assignments to the spectra is described and illustrated. Our approach to estimating the top-of-atmosphere responses of the instrument in the water vapor and oxygen bands, where traditional Langley analysis cannot be used, is described and demonstrated. Examples of derived quantities, including normalized irradiances, aerosol optical depths, and spectral irradiances for all three components are given in the next three sections. These results are summarized in the final section, and links to where the data sets and documentation can be found are provided.
Since the basics of the rotating shadow band spectroradiometer (RSS) that operates at visible and ultraviolet (UV-RSS) wavelengths have been described in previous papers (Harrison et al., 1999; Kiedron et al., 2002, respectively), only a brief description of the key features of the RSS will be provided in this paper.
The light from the Sun and/or sky passes through a diffusing disk that is designed to provide an approximate Lambertian (cosine) response to incoming radiation at all wavelengths. The light from the diffuser enters an integrating cavity that has an exit slit that passes light to the optical train discussed next. After the slit, there is a shutter that is used to assess the dark counts coming from each pixel. The spectrograph contains a collimating lens, followed by two prisms in tandem that achieve a moderate spectral resolution, which has a FWHM (full width at half maximum) of 0.6 nm near 360 nm and FWHM of 7 nm near 1070 nm. The pixel spacing is about 0.2 nm at the shortest wavelengths and about 2.0 nm at the longest. The chromatic aberration in this system requires that the detector, positioned after the focusing lens, be tilted to optimize the focus at all wavelengths.
The band that shadows the diffuser is positioned below the horizon at the beginning of every cycle where dark and then global horizontal samples are taken to set the integration time that depends on the irradiance level; it then moves to three positions near the Sun and samples at each of these. There are two stops that are near and on either side of the Sun but do not block it; the mid-stop totally blocks direct sunlight. The sideband measurements are used to calculate a first-order correction for excess skylight blocked by the band during the measurement, with the direct sunlight being totally blocked. Using these measurements and pre-deployment, wavelength-dependent cosine response corrections, global and diffuse horizontal and direct normal irradiances can be calculated for 1002 contiguous wavelengths.
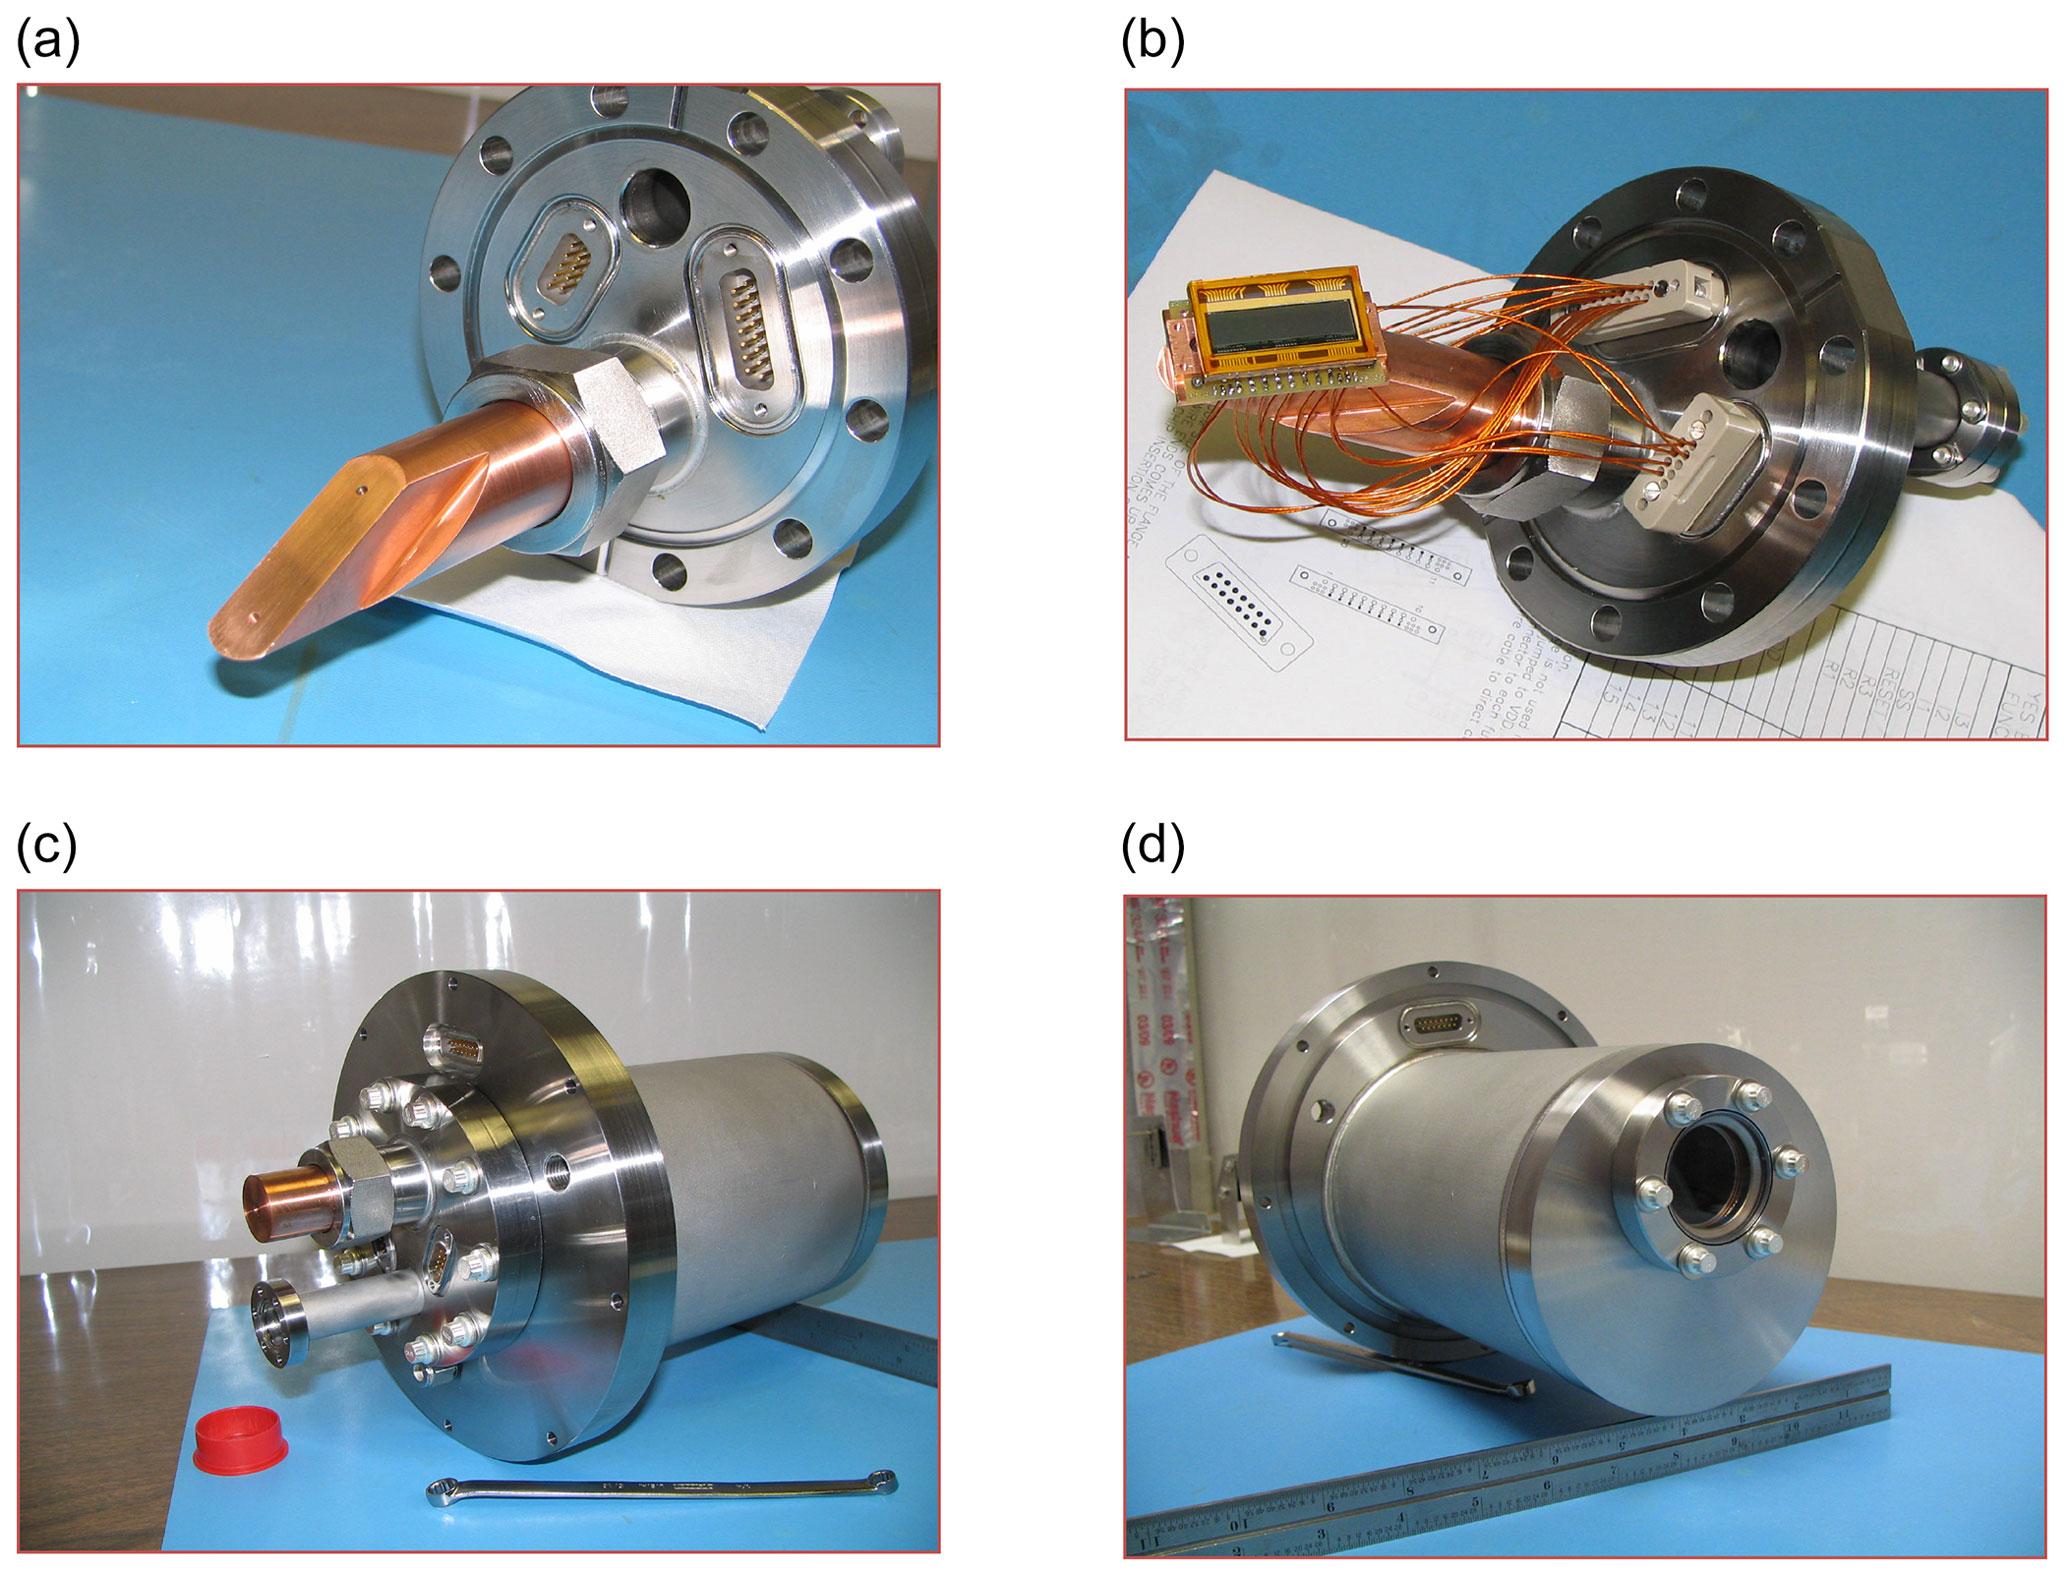
Figure 1(a) The cold finger that is held at 20 ∘C. (b) The CCD detector that mounts on the copper cold finger. (c, d) The back and front, respectively, of the assembled housing. The CCD detector is behind the window.
The inside of the spectrograph is maintained at a temperature near 45 ∘C, but the detector itself is maintained at a temperature near 20 ∘C. This provided a detector surface in the original design that was a target for condensates from outgassing vapors from the interior of the spectrograph that caused the responsivity to change over time. In the original commercial instrument, this meant frequent recalibrations to keep up with the changing response of the detector. In this new design, the detector is mounted on a copper cold finger and housed in a windowed vacuum chamber that is held at a pressure of around 10−7 torr, which effectively eliminates the condensation issue (see Fig. 1).
The refurbished RSS was deployed at the ARM site in northern Oklahoma (36.605∘ N, 97.486∘ W; 317 m) and began operating on 26 August 2009; the shutter stopped opening on 21 February 2014. Intermittently between 25 December 2013 and 21 February 2014, the shutter did not open for the measurement cycle; thus, many data were lost during the last 2 months of operation. The cycle of four irradiance measurements plus one dark measurement was repeated every minute, starting at the top of the minute. Exposure times for each measurement were between 0.4 and 4 s, based on the irradiance level at the start of the cycle. There is a small variation in the sampling time caused by the band travel to the Sun's position. In the morning, the sampling is nearer the top of the minute, and it is somewhat later in the afternoon. The band motor speed is, however, about one revolution per 6 s; therefore, the delay in afternoon sampling is less than this.
There were some issues with band alignment, which were detected using a fast Fourier transform (FFT) procedure (see, for example, Alexandrov et al., 2007), that resulted in data being flagged as suspect. Furthermore, the initial 5 weeks of data showed suspicious wavelength dependencies in the aerosol optical depths (AODs), perhaps caused by a few very poorly determined extraterrestrial response retrievals at the beginning of the measurement set, and therefore, we suggest that the data taken before 1 October 2009 have a large uncertainty; however, irradiances, direct normal transmissions, and normalized diffuse and global irradiances for the first 5 weeks were not removed from the database and should be used with caution.
3.1 Wavelength registration
Although the spectrograph is rigidly secured to the frame that stabilizes it, slight changes in the pixel alignment (note that pixels are about 14 µm wide) can occur due to optical shifts associated with the thermal environment or slight mechanical movements within the instrument that are, for example, caused by high wind speeds. During the 4.5 years of measurements, pixel shifts to shorter and longer wavelengths of up to 4 pixels, or about 0.8 nm, at the shortest wavelengths and about 8 nm at the longest wavelengths in either direction were noted. Since we wish to use the same wavelength coverage for the entire period, we were left with 1002 wavelengths, for which the response was deemed satisfactory over the complete period of record. This included wavelengths between 360.4 and 1070.1 nm.

Figure 2The average of nine spectra near solar noon appears as the blue line; the extraterrestrial spectrum (ET) at RSS resolution is the black line (units on the y axis refer to the ET), and the gray line is the carefully determined spectrum used as the standard total horizontal spectrum that is compared to all RSS data. The blue spectrum in panel (a) is shifted shortward by 2 pixels, and panel (b) shows the shift-corrected spectrum. The two absorption lines are in the solar spectrum since they also appear in the ET spectrum; these are the sodium doublet line 589.0/589.6 nm and the hydrogen alpha line 656.3 nm.
To ensure proper wavelength registration, nine global horizontal spectra, typically taken near solar noon each day, were averaged. This average was compared to the global horizontal spectrum used as a standard for all days where the wavelength registration was carefully determined using pencil lamp spectra and solar absorption features. Both of these global horizontal spectra were fitted with low-order spline fits that were subtracted from each to enhance the major absorption features. A cross-correlation was performed between these two residual spectra at 0.1 pixel increments until the correlation between the spectra reached a maximum. Only wavelengths less that 672 nm were used for the spline fit and cross-correlation because these absorption features were mostly in the solar spectrum, and the terrestrial spectrum only has weak absorption lines in this part of the spectrum. We did not want to cross-correlate terrestrial features on different days where the water vapor content may have influenced the cross-correlation. The spectra for that day were then shifted by the number of pixels offset from the standard spectrum. This spectral shift process is illustrated in Fig. 2. Note that the blue-colored spectrum on the left is displaced slightly shortward relative to the extraterrestrial and standard spectrum (designated as tothor in the figure legends). The shift in the left panel of Fig. 2 was by 2 pixels. The process described above was then perform, and the blue-colored spectrum was replotted on the right. On the right, all three spectra are well aligned, indicating that a simple shift in the spectrum to the nearest 0.1 pixel realigns the measured spectrum to the standardized total horizontal and extraterrestrial spectra. This shift for the spectra is performed only once each day since the shifts that are observed undergo slow, subtle changes.
3.2 Estimation of extraterrestrial response in strong terrestrial absorption bands
It is our goal to generate a continuous spectrum of the direct normal transmission and normalized diffuse and global irradiances over the entire wavelength span of the RSS. These are calculated by dividing the measured response of the RSS by the response at the top of the atmosphere (TOA), which is adjusted for solar distance. Many portions of the solar spectrum can use the standard Langley analysis technique to estimate the TOA response (see, for example, chapter 7 of WMO/GAW, 2016). In this method, the natural logarithm of the measured response is plotted against the calculated air mass to yield estimates of the total optical depth and the response of the instrument at the top of the atmosphere. Kindel et al. (2001) used MODTRAN (MODerate-resolution atmospheric TRANsmission) runs to generate model-based Langley analysis to demonstrate where in the spectrum the Langley analyses were valid. Measurements in the strong bands of H2O and O2 are not appropriate for a standard Langley analysis, since a linear curve of growth is not expected for these strong molecular bands, and consequently, the extrapolation to zero air mass underestimates the TOA at these wavelengths.
Reagan et al. (1987) and Bruegge et al. (1992) were among the first to perform a modified Langley analysis to derive water vapor, but as Michalsky et al. (1995) pointed out, this method depends on stable water vapor over the measurement period used for the modified Langley analysis, which is seldom observed. Consequently, a very large number of modified Langley analyses, which require a very long period of time and a stable instrument over that time, are typically required to even approach the accuracy in extraterrestrial response that a standard Langley analysis can achieve when working outside strong molecular bands.
Kindel et al. (2001) describe a technique for determining extraterrestrial (ET) responses over the continuous solar spectrum, using spectral regions where Langley analyses are appropriate and lamp calibrations where they are not. The lamp and Langley calibrations where Langley calibrations are valid determine a scale factor applied to the lamp calibrations that is used to estimate ET responses in the spectral regions where Langley analyses are not appropriate. In this paper, however, we will use the method described below.
Here, we used an interpolation over two strong O2 bands and three strong H2O bands. The function used for the interpolation is given by Eq. (1) as follows:
where is the estimated extraterrestrial response in the molecular band at wavelength λ. Subscripts 1 and 2 of λ indicate V0(λ) determined from standard Langley analysis, RSS responsivity R(λ), and extraterrestrial irradiances ET(λ) at wavelengths λ1,2 just before and just after each of these five molecular bands, respectively.
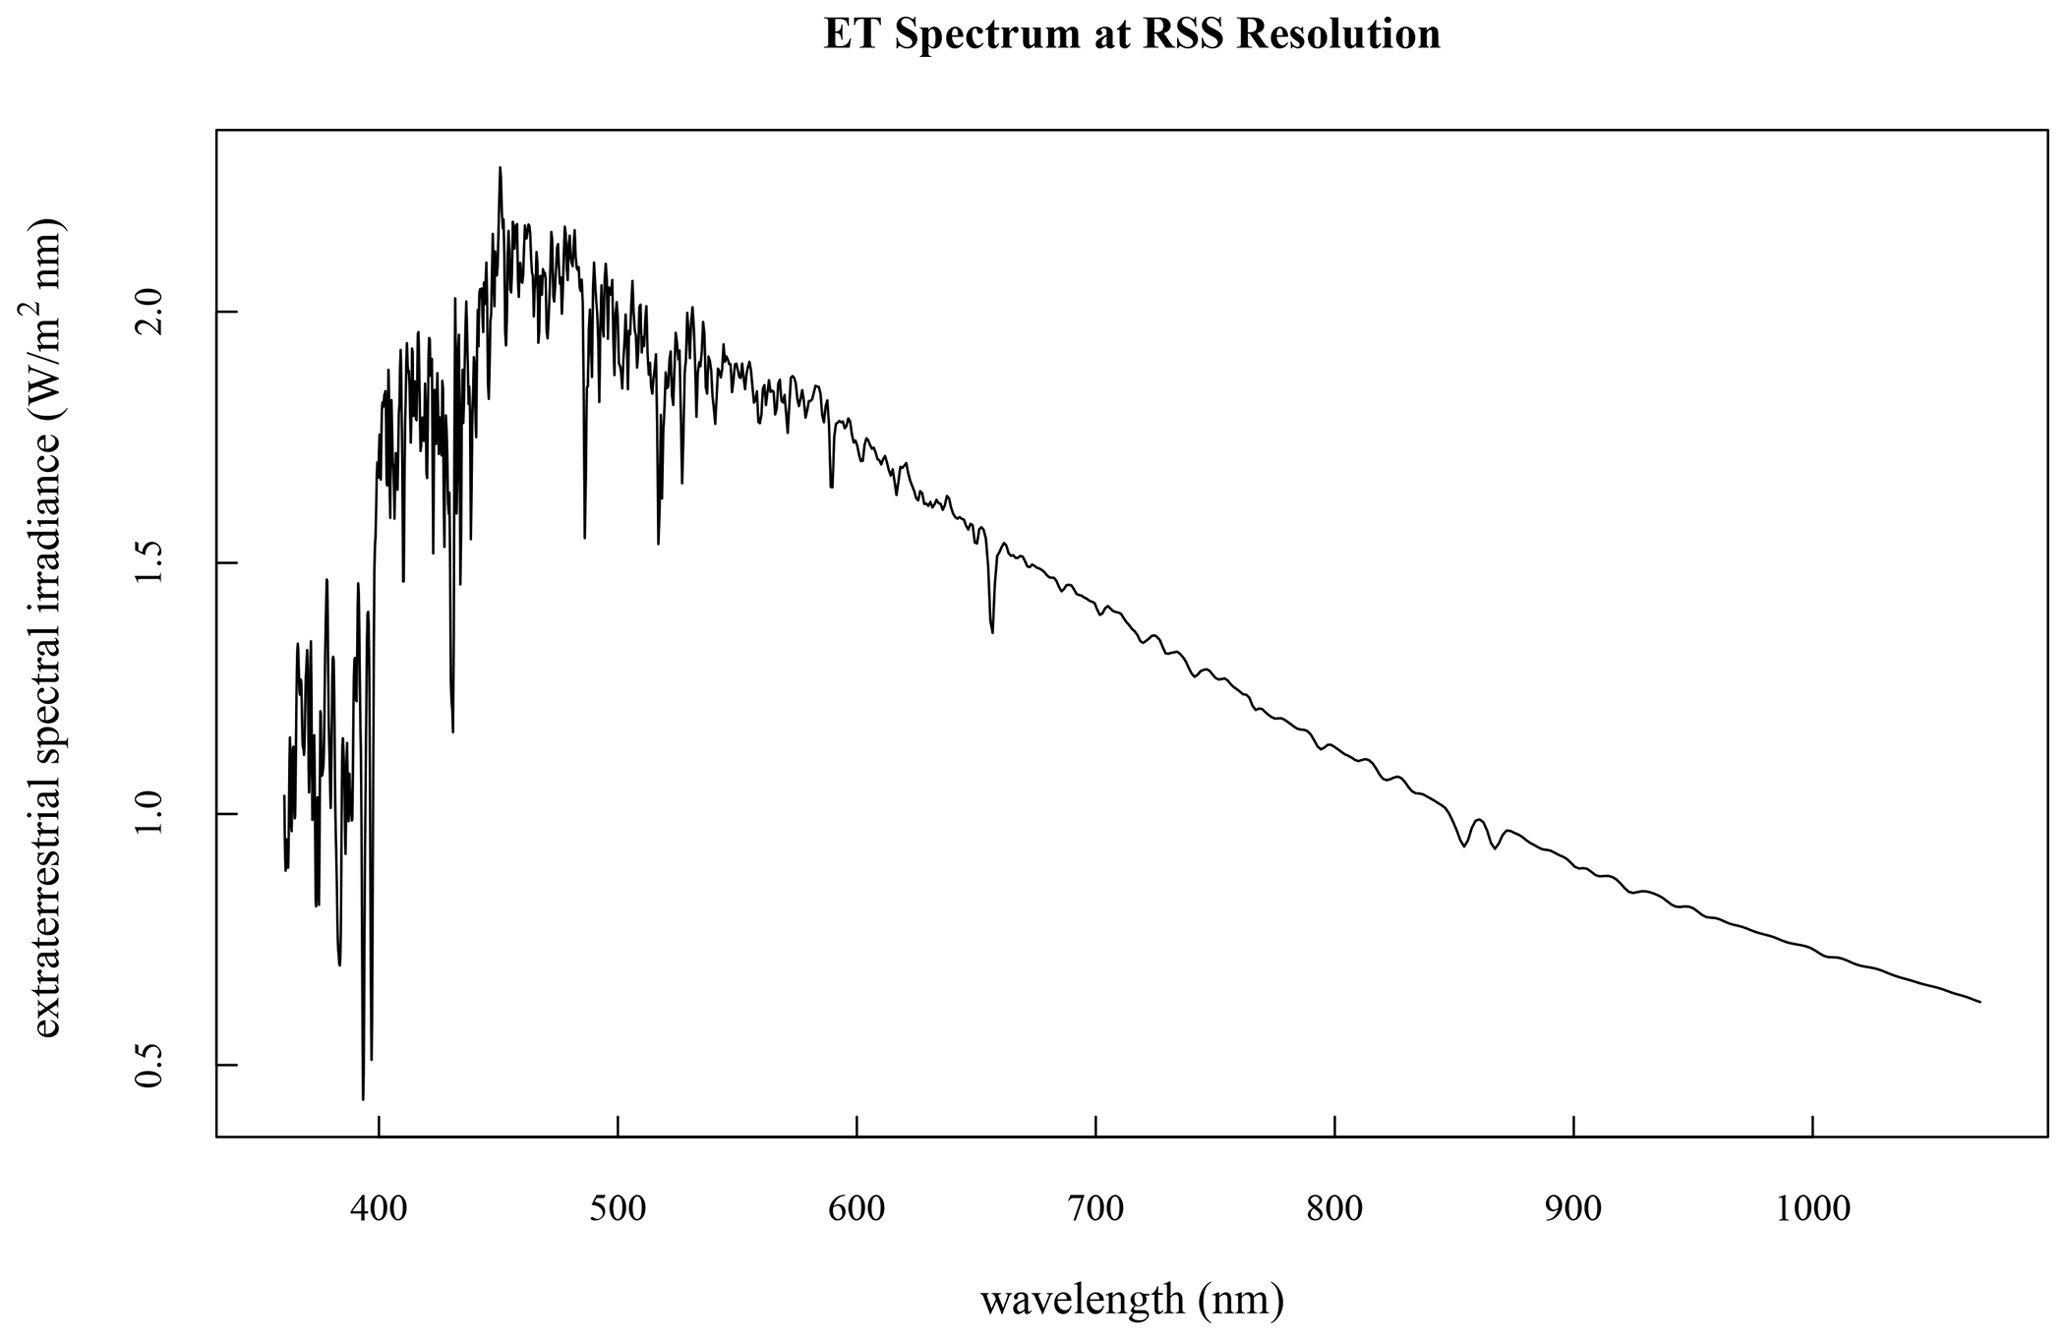
Figure 3Extraterrestrial solar spectrum used for this paper, using the RSS slit function applied to a Kurucz high-resolution calculated ET solar spectrum and then scaled to the Gueymard low-resolution ET solar spectrum, which is regarded as our best estimate of absolute irradiances.
ET solar irradiance at RSS spectral resolution was determined using the estimated slit function of the RSS applied to the high spectral resolution ET spectrum of Kurucz (http://rtweb.aer.com/solar_frame.html, last access: 21 December 2021) but scaled to the low-resolution, but well determined, absolute ET spectrum of Gueymard (2006). Figure 3 displays the extraterrestrial spectrum at RSS spectral resolution, indicating a higher spectral resolution in the short wavelengths and a lower resolution at long wavelengths, as expected for a prism spectrograph.
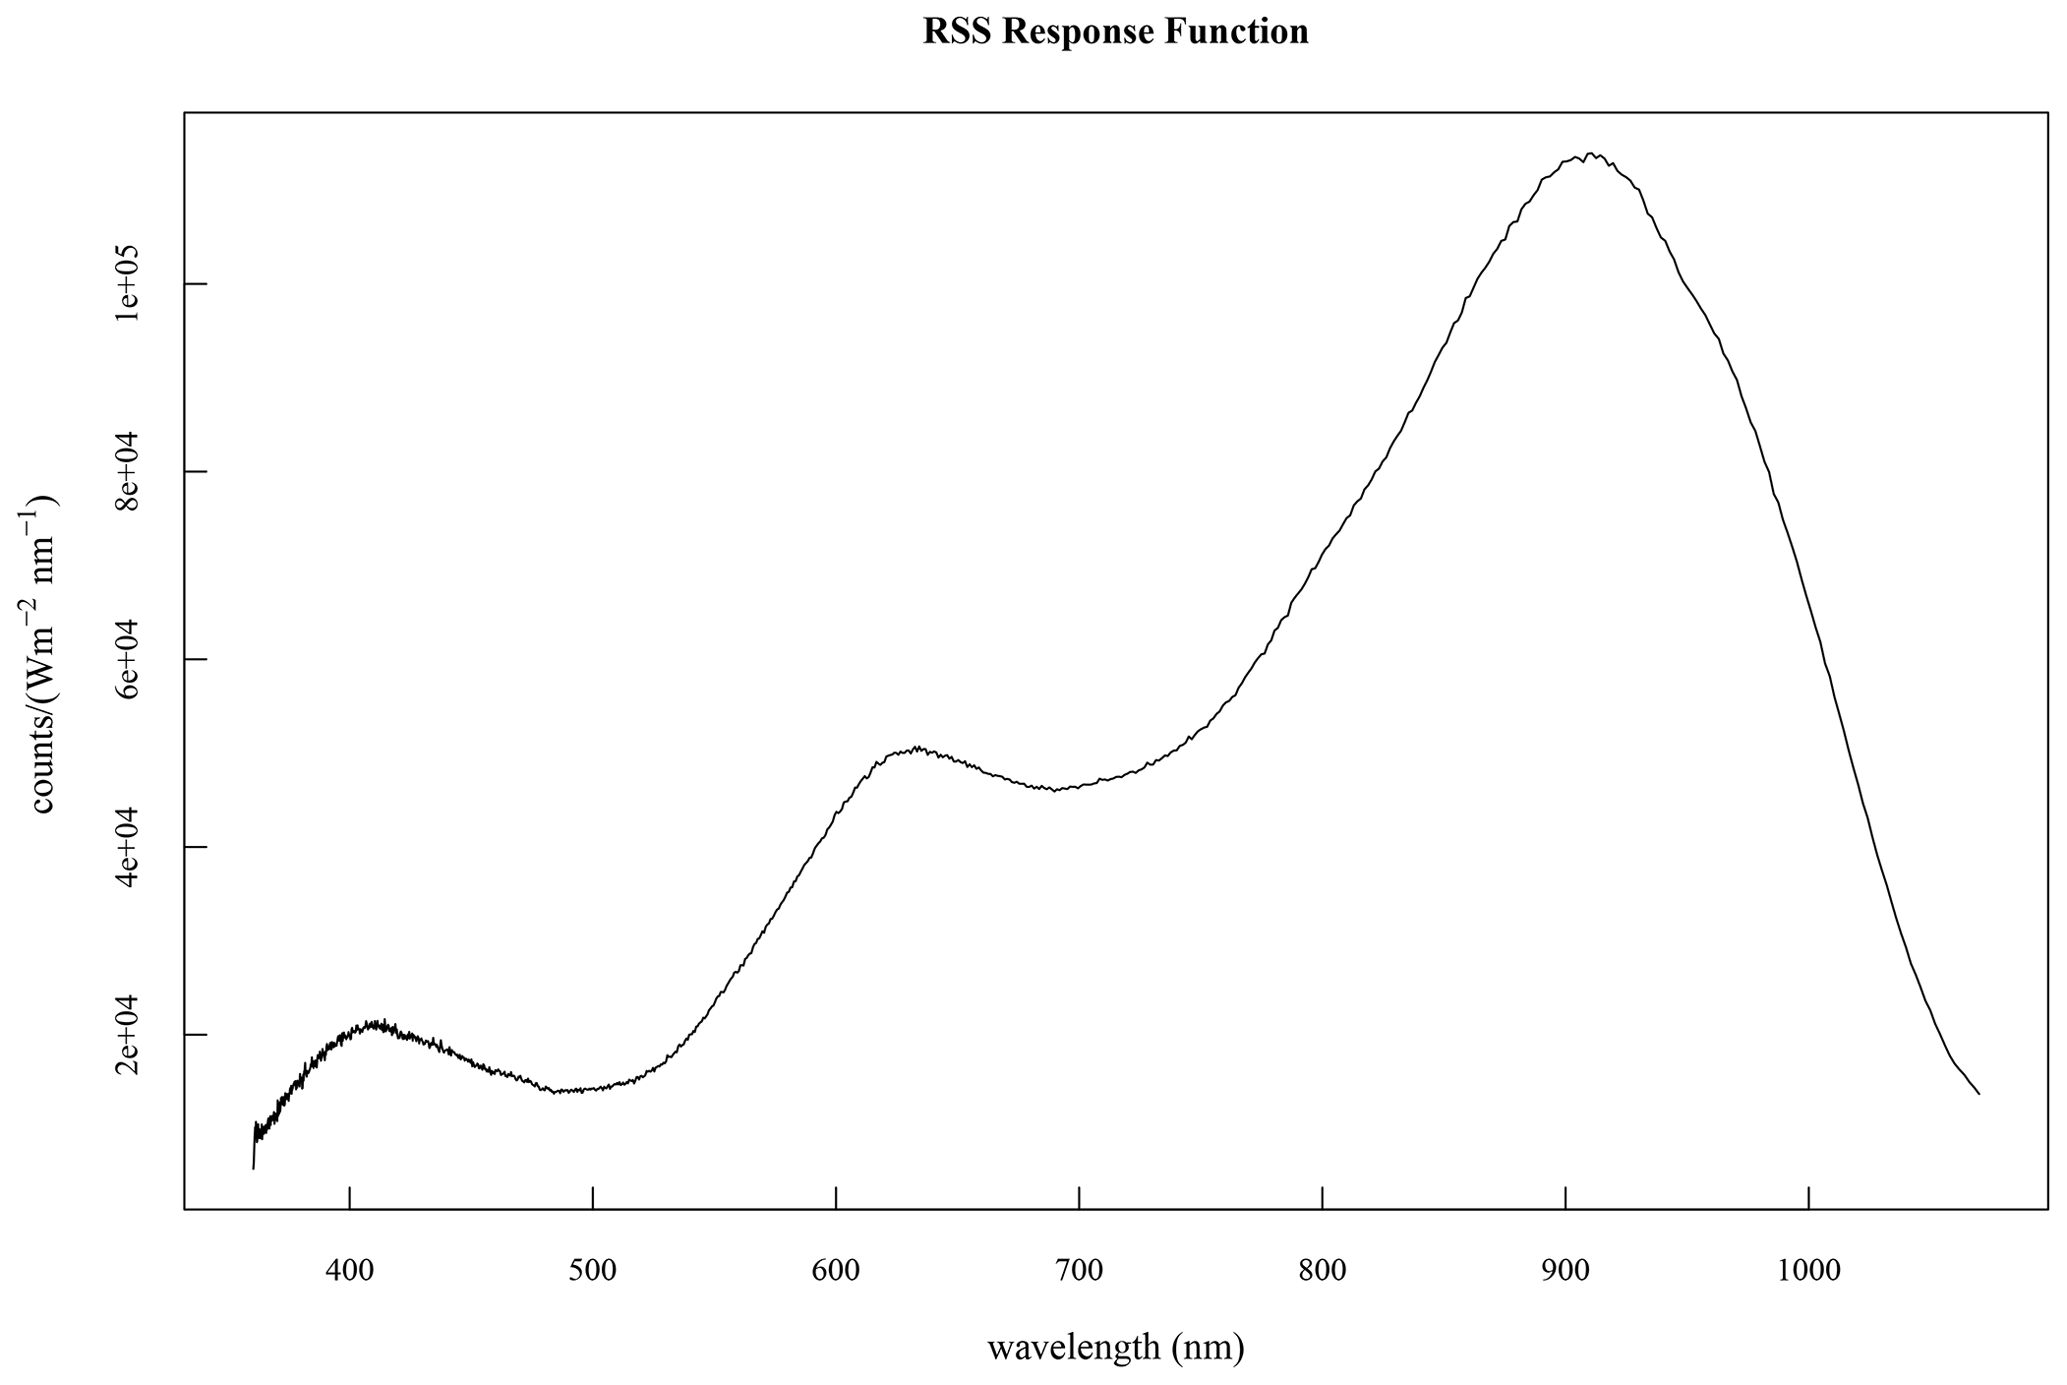
Figure 4Measured relative response of the RSS that is needed for the interpolation scheme represented by Eq. (1).
The response function R(λ) in Eq. (1) was determined by dividing the RSS response in counts by the calibration lamp output in Watts per meter squared per nanometer. Figure 4 is a plot of the RSS responsivity. We only require relative response for the interpolations using Eq. (1).
If we divide both sides of Eq. (1) by ET(λ), and if we set and , then Eq. (1) becomes the following:
In this configuration, the form of Eq. (2) implies that this is effectively a linear interpolation of the lamp-measured response between the two wavelengths, λ1 and λ2, where we have valid Langley calibrations. The only variables in this configuration are responsivity and wavelength. Therefore, given the Langley-measured response at λ1 and λ2, and forcing the lamp-calibrated response at these two wavelengths to agree, we can interpolate between these two wavelengths using the scaled lamp-measured response from Fig. 4. Moreover, this interpolation in the response is to be preferred over an interpolation in V0 because of the inherit smoothness of the response of the detector itself. Given , we then solve for , using .
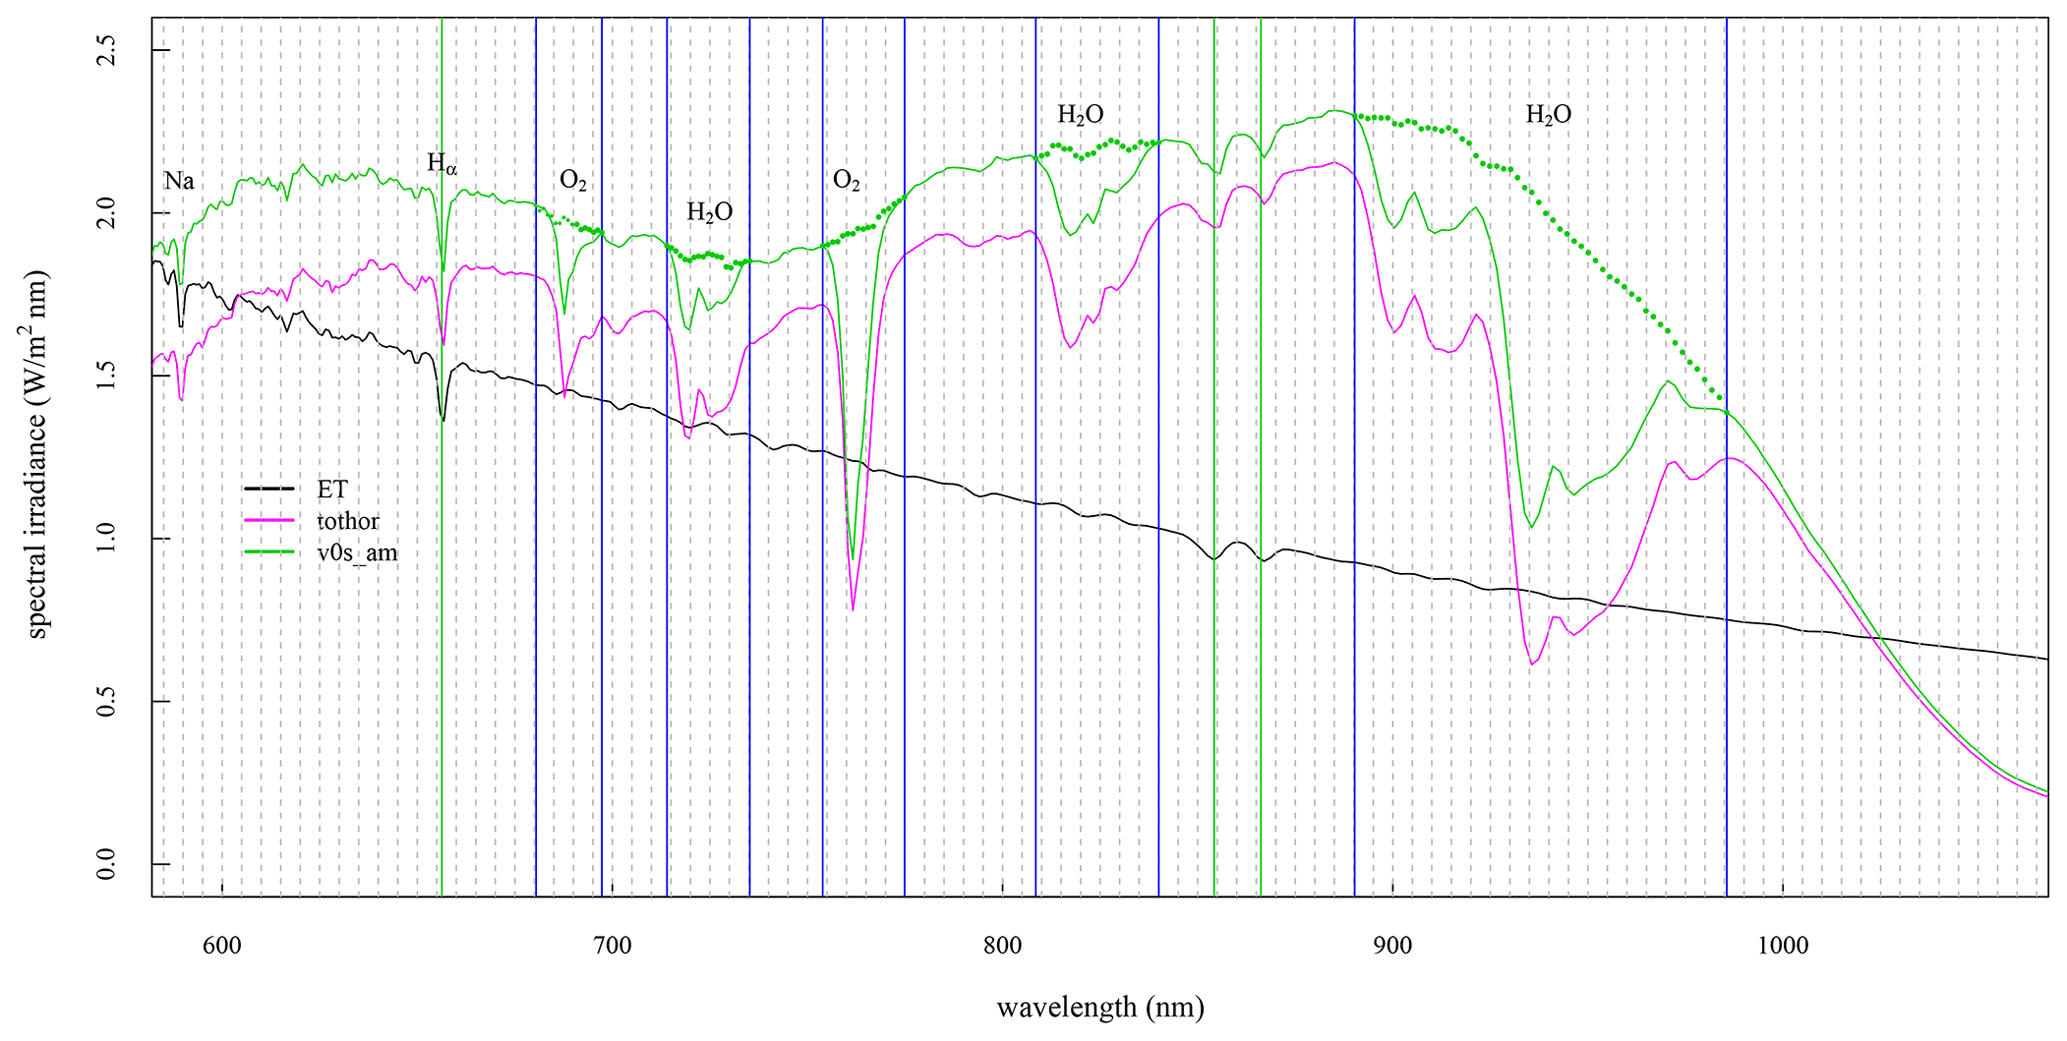
Figure 5An illustration of the V0 interpolation over strong O2 and H2O molecular bands, using Eq. (1) (green dots are interpolated points). The black ET line is the extraterrestrial irradiance (y axis label) for the mean distance to the Sun. The tothor and v0s_am are scaled to fit the plot.
Figure 5 illustrates the V0 interpolation, using Eq. (1), when implemented for five strong molecular bands within the wavelength span of the RSS. The black line is the extraterrestrial spectrum (y axis label), the magenta line is the scaled, uncalibrated total horizontal irradiance in counts that form our standard for wavelength registration, as discussed previously, and the solid green line is a scaled, uncalibrated retrieval of the RSS extraterrestrial response from a morning Langley plot, with the green dots representing the estimated extraterrestrial response for the strong bands of O2 and H2O. The Hα and Na lines that are in the extraterrestrial solar spectrum are identified and appear in all three spectra. The interpolations of the extraterrestrial spectrum over the O2 and H2O bands appear reasonable and will be used for extraterrestrial responses as these are considered plausible estimates. With these estimates, we can now calculate the continuous normalized global and diffuse horizontal irradiances and direct normal solar spectral transmission from 360 to 1070 nm.
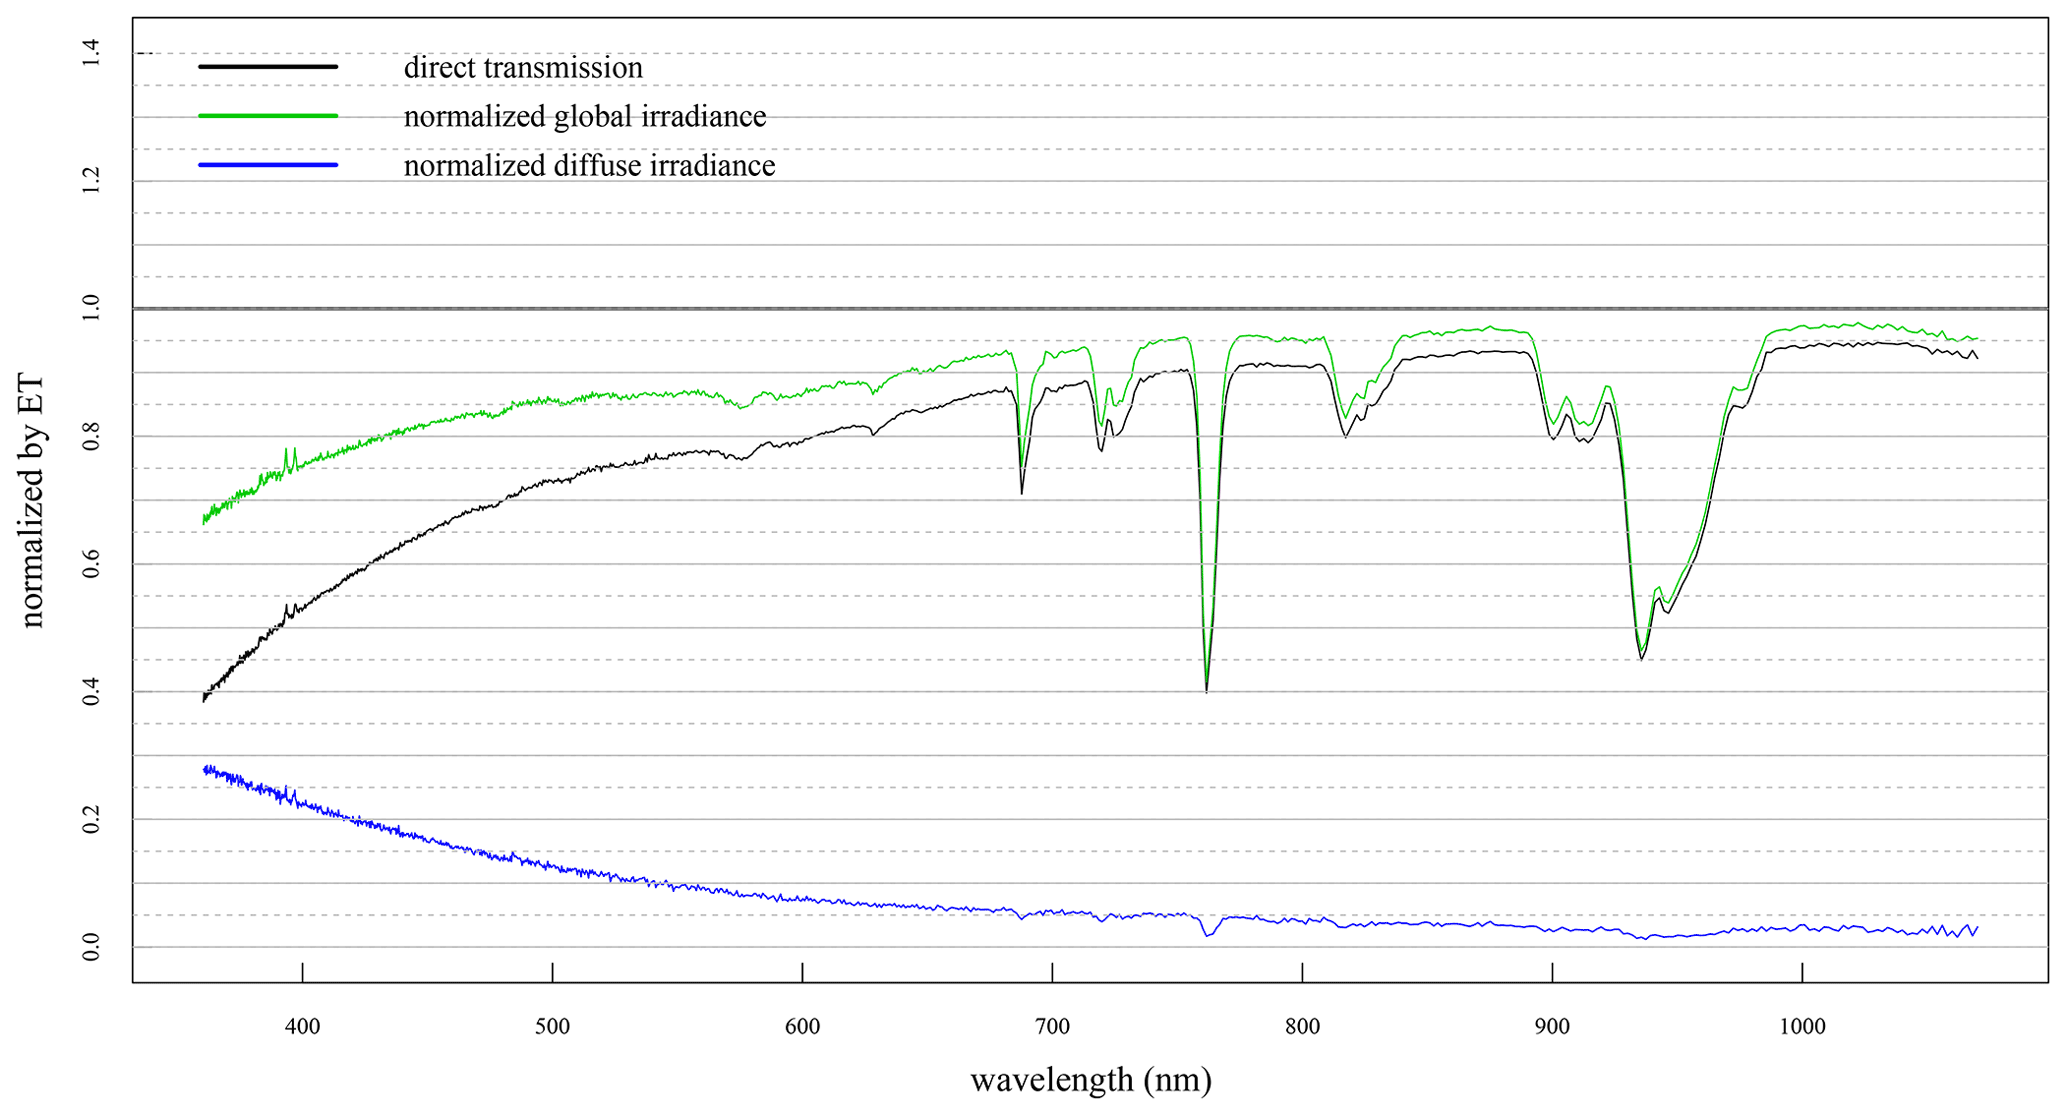
Figure 6The direct transmission and normalized global and diffuse irradiances on a clear day (27 October 2009) at the ARM site in northern Oklahoma. Note that both the direct normal transmission and the horizontal component of direct normal transmission, which is dni⋅cos (sza), where sza is the solar zenith angle, would have the same transmission profile. Note, also, that the direct transmission plus the normalized diffuse irradiance sum to the normalized global irradiance.
As explained in the previous paragraphs, now that we have estimates for the extraterrestrial response over the entire RSS spectral response wavelength span, we can calculate the transmission (direct normal) and normalized global and diffuse horizontal irradiances at any time. Figure 6 is a plot of the direct normal transmission and normalized global and diffuse irradiances near solar noon on 27 October 2009, which was clear from horizon to horizon at this time of day. Compared to the structure at short wavelengths in the extraterrestrial spectral irradiance (see Fig. 3), these quantities are extremely monotonic up to 550 nm and mostly the result of Rayleigh scattering and aerosol extinction, although Rayleigh scattering and aerosol extinction contribute throughout the entire RSS spectral range, with decreasing contributions at the longer wavelengths. Both Rayleigh scattering (λ−4) and aerosol scattering (often ∼ λ−1.3) are wavelength dependent, with the contributions falling with increasing wavelength. This explains the lower values at the shortest wavelengths for the dni (direct normal irradiance) transmission and the higher values at the shortest wavelengths for the normalized diffuse horizontal irradiance. There is only a minor indication of the imperfect RSS slit function specification that gives rise to small residuals of the very strong H and K lines of singly ionized calcium (Ca II) at 393.4 and 396.9 nm in the solar spectrum. The major absorption bands of O2 near 690 and 760 nm and H2O near 725, 820, and 940 nm, as noted in Fig. 5, can be clearly identified. Much less obvious are the O2–O2 bands near 477, 577, and 630 nm, although the latter two bands are near a weak H2O water band (577 nm) or near weak H2O and O2 bands (630 nm) that complicate their identification and separation. The slight fall in the direct transmission at the longest wavelengths near the end of the RSS spectrum is mostly the result of a weak O2–O2 band centered near 1065 nm and, perhaps, weak water vapor absorption that will be discussed later. Somewhat less discernible is the broad Chappuis O3 band centered near 610 nm. Although no retrievals will be performed in this paper, the direct normal transmission in the H2O bands can be used to estimate column H2O by running a suitable radiative transfer code at the RSS spectral resolution in transmission until an optimum match to the three H2O bands is attained. A less obvious and more uncertain approach is the use of the Chappuis band transmission to estimate column O3. Notice that the dni transmission on this clear day is about 95 % at wavelengths above 1000 nm, with slightly higher normalized global irradiance.

Figure 7RSS spectra for an instance where there is a clear path to the Sun on a partly cloudy day. Note that normalized global irradiance exceeds 100 % at many of the longer wavelengths.

Figure 8A plot of the direct normal transmission and the normalized global and diffuse irradiances near 500 nm for 24 October 2009 at the ARM site in northern Oklahoma. The vertical red line marks the time of the measured spectra in Fig. 7. The direct transmission appears unaffected by nearby clouds, but the normalized diffuse irradiance and, therefore, the normalized global diffuse irradiance are enhanced over the clear-sky values, which explain the effect of apparent normalized global irradiance greater than 100 % in Fig. 7.
Figure 7 is interesting in that this is a plot with a clear path to the Sun, with normalized global irradiance exceeding 100 % at wavelengths greater than about 650 nm (except, of course, for the strong absorption features). dni transmission is slightly lower than it was in Fig. 6, and the normalized diffuse horizontal irradiance is considerably higher. We can understand how values above 100 % are possible if we consider Fig. 8, where the vertical red line marks the time of day that the spectra in Fig. 7 were measured. dni appears unaffected at this point in time, but a short time later, clouds are clearly moving in front of the Sun. Because clouds are encroaching, the normalized diffuse irradiance is enhanced by direct sunlight scattering from them, which causes enhancements in the normalized global irradiance. This is a well-recognized effect in broadband solar measurements that is discussed, for example, in Vignola et al. (2020; see p. 21 and Fig. 2.14 therein). Additionally, Fig. 7 illustrates the wavelengths where the apparent normalized global irradiance exceeds 100 %.
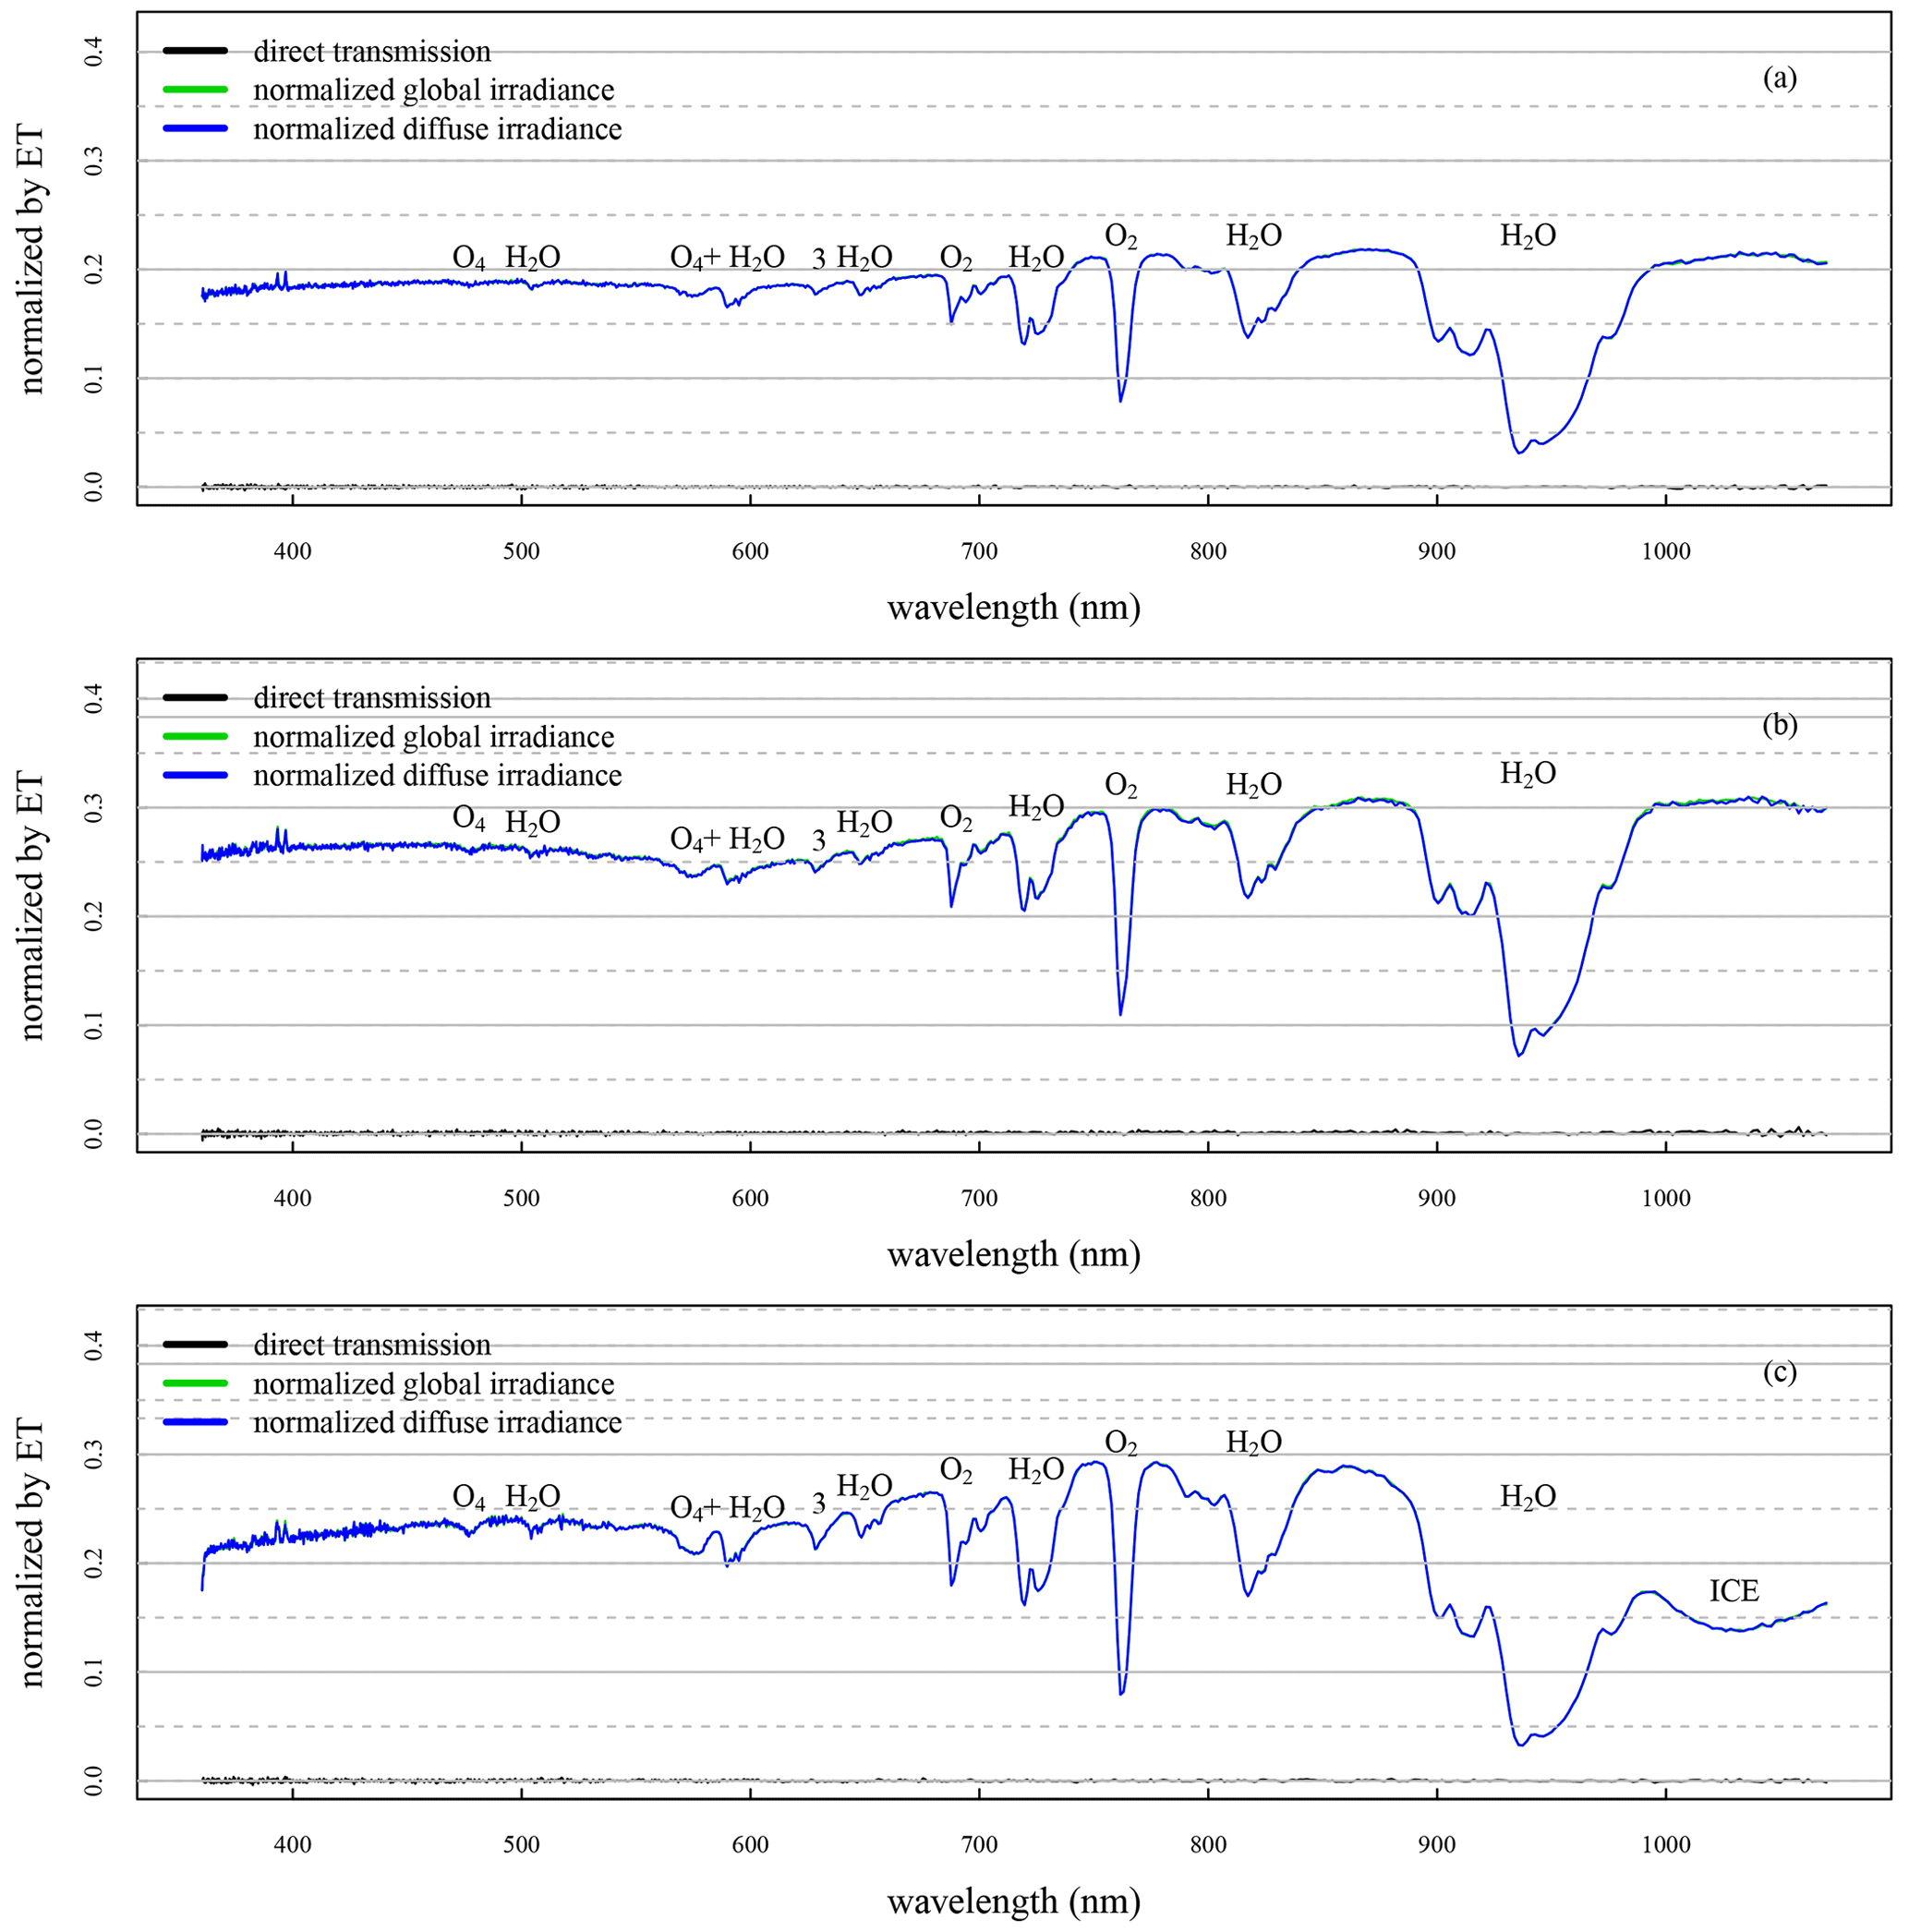
Figure 9(a) A spectrally continuous transmission spectrum for a totally overcast sky on 25 October 2009 at the northern Oklahoma ARM site. Outside the molecular bands, there is an overall monotonic increase in transmission with wavelength. The band (identified by the number 3) near 630 nm includes overlapping H2O, O2, and O4 bands. The bands labeled O4 + H2O are overlapping bands. H2O near 505 nm is identified as a weak water band in the HITRAN (high-resolution transmission molecular absorption) database. Panel (b) is a similar plot to panel (a) but for overcast skies on 24 October 2009, with a higher overall normalized global/diffuse irradiance. Note the same details for the absorption features, except for the more pronounced Chappuis ozone band centered near 600 nm. Panel (c) is a spectral irradiance plot for an overcast day (24 December 2009), with ice clouds present as identified from the ARM radar measurements. Note the pronounced difference in the spectrum beyond 1000 nm, compared to panels (a) and (b), indicated by the ICE label between 1000 and 1100 nm.
Figure 9a is a plot of the normalized irradiances for a totally overcast sky on 25 October 2009 at the ARM site in northern Oklahoma. The fact that the sky was totally cloudy was confirmed using the total sky imager collocated at the site. Note that the dni transmission is zero for all wavelengths, and the normalized global horizontal irradiance is hidden by the normalized diffuse horizontal irradiance plot that should (and does) exactly overlay it for overcast conditions. Normalized global and normalized diffuse horizontal irradiances are equal because ghi (global horizontal irradiance) is calculated using , where θ is the angle between the Sun and the zenith direction. The spectrum outside molecular absorption bands indicates a slight monotonic increase with wavelength. This increase in transmission outside molecular bands is likely caused by the increasing surface albedo with wavelength (see, e.g., McFarlane et al., 2011), which increases the shortwave radiation backscattered to the clouds and, hence, causes them to appear brighter in the near-infrared range. Although there is a slight decrease centered near 600 nm that appears to counter the suggestion that the continuum monotonically increases with wavelength, this is the broad, weak Chappuis O3 band. The large H2O and O2 bands identified in Fig. 5 are labeled from left to right, starting at around 690 nm. Much weaker absorption bands below 690 nm can be identified, and using Sierk et al. (2004) allows us to identify the three weak bands between 550 and 690 nm with the molecules causing the absorption features. The very weak depression around 477 nm is caused by O2-O2 (also known as O4) absorption (Michalsky et al., 1999). The feature labeled H2O near 505 nm is a water vapor band that is identified in the HITRAN (2012) database. The Ca II H and K lines short of 400 nm appear as small residuals, which are, perhaps, caused by a slightly imperfect specification of the RSS slit function, but this is a minor issue since these are the two strongest lines in the extraterrestrial spectrum. These residuals can also be seen in Figs. 6, 7, 9, and 10. The downturn at the longest wavelengths is the absorption in the O4 band that is centered near at 1065 nm, although the wings of the H2O bands may be influencing this part of the spectrum as well. Figure 9b shows a similar plot on 24 October 2009 with slightly higher values for the three components. This plot shows a more pronounced Chappuis O3 band centered near 600 nm, which is the broad depression in the continuum. Figure 9c is a spectral irradiance plot from 24 December 2009 for totally overcast skies that has a starkly different appearance (when compared to the earlier plots in Fig. 9a and b) for overcast days. On this day, at the time of this measurement, the radar indicated substantial ice content in the clouds above the site. The attenuation above 1000 nm is consistent with the radiance transmission spectra for ice clouds presented in LeBlanc et al. (2015; compare, e.g., their Fig. 3b). Consequently, there is the potential to use these spectra to recognize ice phase and, more importantly, retrieve quantitative information on ice content and size. There is clearly an incentive to study this further, although it is beyond the current focus of this paper.
Since transmissions have been calculated and are available, it should be straightforward to calculate aerosol optical depths (AODs) for the parts of the spectrum that are free of strong H2O and O2 absorption bands. Since we have determined estimates for extraterrestrial responses V0(λ) and measured responses at the surface V(λ), we can calculate optical depths by solving for τ in the following:
where m is a known, calculated air mass, τ(λ) is the total optical depth, and V0(λ) has been adjusted for the correct solar distance for the time of observation. From the total optical depth τ(λ), we removed the optical depths associated with Rayleigh scattering and Chappuis band O3 absorption, as explained in Michalsky et al. (2001), to retrieve estimates for AODs where there are no strong molecular bands.
While Langley calibrations are ideally performed at high-altitude sites, such as the Mauna Loa Observatory (MLO), we have demonstrated that calibrations can be performed at less-than-ideal sites using a sufficient number of Langley analyses. Perhaps the best example of this is from Michalsky and LeBaron (2013). Using the same multifilter rotating shadow band radiometer (MFRSR) at MLO and in Boulder, Colorado, we obtained the same calibration in the five aerosol channels of the MFRSR to within 0.006, which represents the worst case. Granted, the signal-to-noise ratio was much better at MLO, even with fewer Langley events, but the medians at both places agreed (see Fig. 1 in Michalsky and LeBaron, 2013). Note that the MFRSR and the RSS use the same shadowing procedure in every respect; therefore, we expect similar results from either instrument.
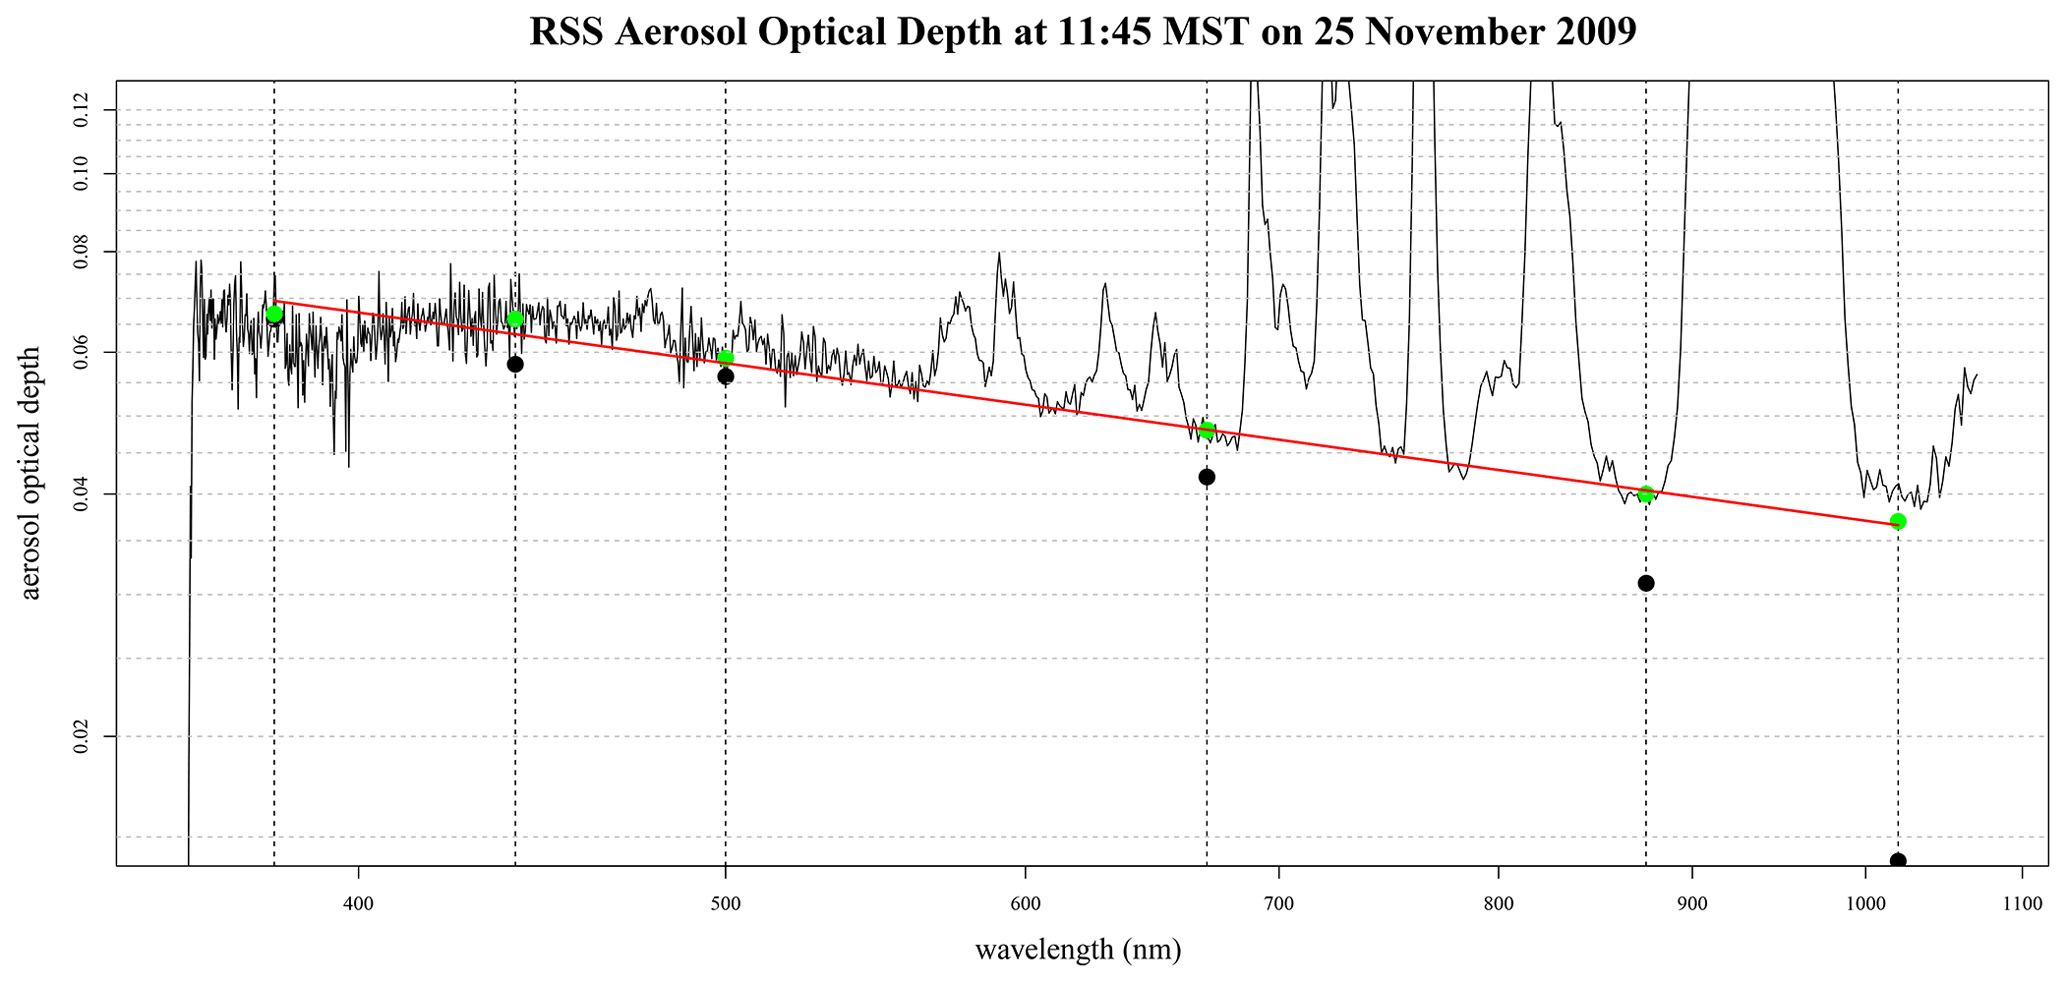
Figure 10RSS aerosol optical depth versus wavelength at 11:45 LST (local standard time) at the ARM central facility in northern Oklahoma. The vertical lines are drawn at the wavelengths used in the Cimel Sun photometers employed by AERONET (AErosol RObotic NETwork) for measuring AODs in this part of the spectrum. The O2 and H2O bands have been truncated at 0.12 optical depth to better see the aerosol wavelength dependence. The approximated RSS AOD (green dots) versus the wavelength for pixels at AERONET wavelengths are shown. The least squares fit to the RSS points yields an Ångström exponent equal to 0.52. The filled black dots are the AERONET points taken 2.5 min after the RSS data. Except for 1020 nm, the agreement is within 0.01 AOD. The 1020 nm (green) point for the RSS is lower by 0.003 because an additional correction was made for water vapor at that wavelength.
Figure 10 is a log–log plot of RSS optical depth versus wavelength at 11:45 LST (local standard time) for 25 November 2009 at the central ARM site in Oklahoma, with Rayleigh scattering and ozone optical depth removed. The vertical lines are positioned at the Cimel Sun photometer wavelengths used by AERONET in this wavelength range (https://aeronet.gsfc.nasa.gov/, last access: 21 December 2021; Holben et al., 2001) to measure AOD. All of these are in windows not affected by the strong O2 and H2O bands. As an aside, note that if we examine this and any of our similar transmission figures then the weak water band centered near 505 nm could have a small influence on the AOD assigned to this wavelength, even though it has long been a standard wavelength for AOD measurements (WMO/GAW, 2016).
The shorter wavelengths appear noisier because the wavelength alignment is to the nearest 0.1 pixels, where the spectral resolution is the highest for this instrument, the signal-to-noise ratio is lowest at these wavelengths, and the extraterrestrial spectrum is inherently more structured at these wavelengths for a prism spectrograph. In Fig. 10, the black dots are the AERONET-measured AOD for the nearest sampling to this time, which is about 2.5 min later. From the AERONET data, it appears that the AODs were stable around this time. The only wavelength where there is more than 0.01 difference is at 1020 nm. For the 1020 nm RSS pixel, an additional minor correction for water vapor, based on the work presented by Alexander Smirnov (2004, unpublished), brings the wavelength dependence more in line with the shorter wavelength points, based on the linear least squares fit to the RSS data presented as green dots. The slope (Ångström exponent) determined by a linear fit to these RSS data is 0.52, which is not uncommon for late autumn aerosols. Below 400 nm the determination of extraterrestrial responses is less certain because of the higher spectral resolution and the falloff in the detector response. This is likely responsible for the greater noise and non-monotonic behavior in the aerosol optical depth below these wavelengths.
Of course, many more comparisons of RSS and AERONET data could be done, but the MFRSR aerosol optical depth data, which use the shadow-banding method used in the RSS, have been compared to AERONET data often and with very good agreement (for example, see Fig. 7 in Michalsky et al., 2010).
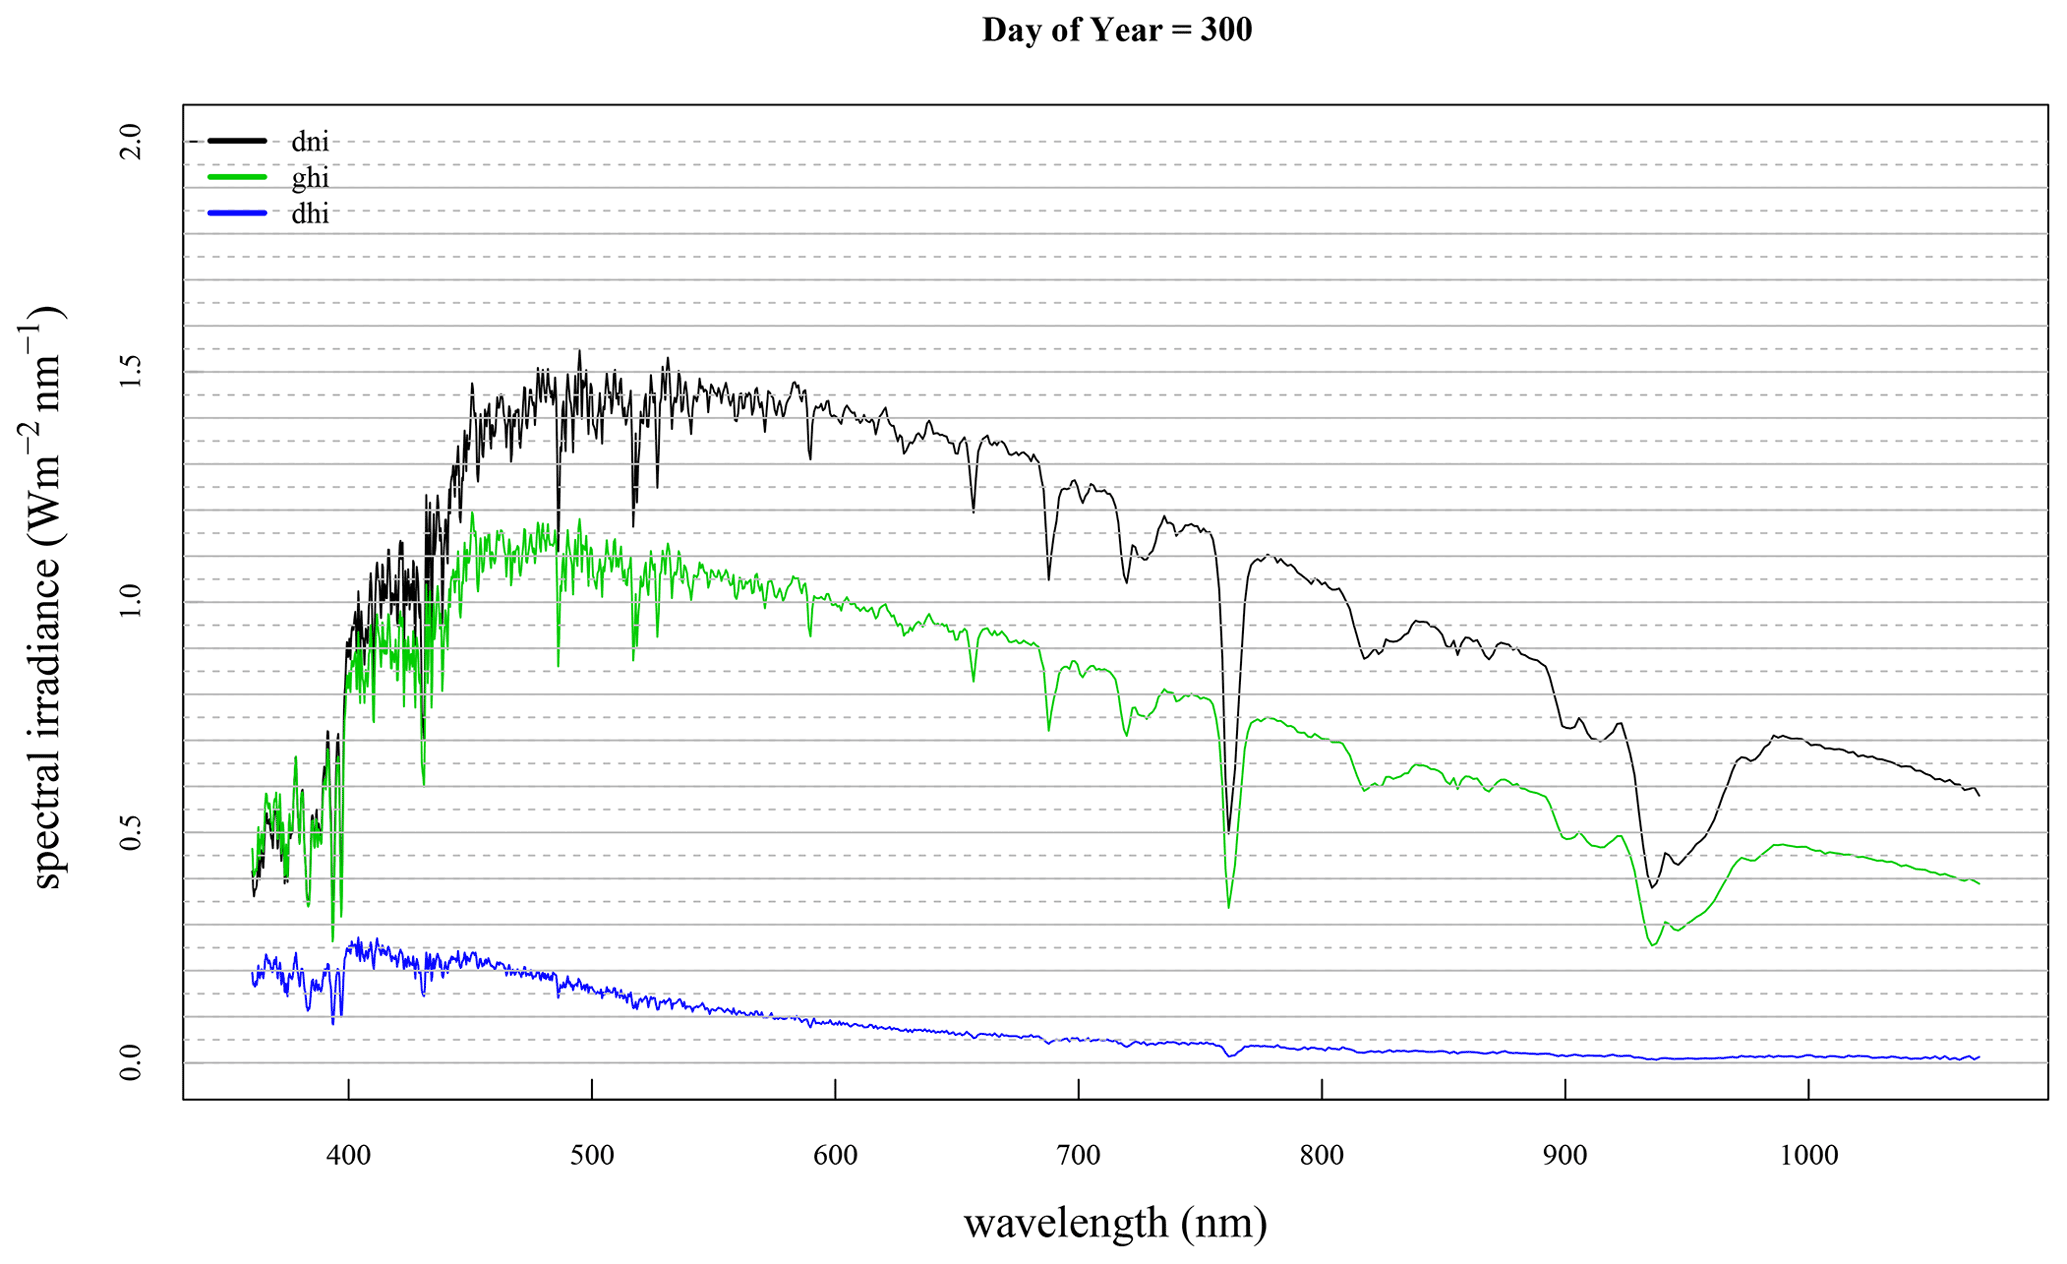
Figure 11Spectral irradiance calculated using RSS measurements for three solar components near solar noon at the ARM site in northern Oklahoma on 27 October 2009.
Just as for the aerosol optical depth calculations, if we are given the transmission, then it is straightforward to calculate the spectral irradiance for all three components. All that is required is to use the ET spectral irradiance at the spectral resolution of the RSS (see Fig. 3) and adjust for the solar distance at the time of the measurements. Multiplying each component (ghi, dni, and dhi) by this distance-corrected ET spectral irradiance for each of the pixels yields the estimated spectral irradiance for each component at the surface.
Figure 11 is the calculated spectral irradiance for the same day as in Fig. 3, namely 27 October 2009, at the ARM site in northern Oklahoma. Most of the uncertainty associated with the irradiance data arises from the uncertainty in the ET spectral irradiance. Transmission uncertainty in the continuum sections of the spectrum is estimated at 1 %, based on the analysis in Michalsky et al. (2001), but the interpolation used in the strong absorption bands results in larger uncertainties, although those uncertainties are not estimated here. However, the ET uncertainty is 2 % or higher, as indicated by Christian Gueymard (personal communication, 2018), depending on what portion of the 360–1070 nm spectral range is under study, resulting in even higher (perhaps ∼ 3 % or greater) uncertainties in irradiances. Of course, for cloudy periods, the dni will be zero and the ghi and dhi will be the same, as can be inferred from Fig. 9. In Fig. 11, note that the ghi is not the sum of dhi and dni because dni is not directly projected onto a horizontal surface, which would be dni ⋅ cos (sza).
This paper describes a vacuum system for the CCD detector that was implemented to remove issues with contamination in the first commercial version of the rotating shadow band spectroradiometer (RSS). The RSS data are used to calculate spectrally continuous global and diffuse horizontal plus direct normal irradiances, ET-normalized direct, diffuse horizontal, and global horizontal irradiances, and AOD outside strong terrestrial absorption bands at many of the 1002 wavelengths between 360 and 1070 nm. The prism-dispersed spectral data are from the ARM Southern Great Plains site in north-central Oklahoma (36.605∘ N, 97.486∘ W) and include dates between August 2009 and February 2014. Methods for (1) ensuring the correct spectral registration of the data and for (2) deriving extraterrestrial responses over the entire spectrum, including throughout strong water vapor and oxygen bands, are described. Examples of ET-normalized direct irradiance plus normalized global and diffuse horizontal irradiances are presented for clear, partly cloudy, and overcast conditions. A continuous AOD example is shown and compared to the AERONET data. Finally, a clear-sky example for global and diffuse horizontal and direct normal irradiance is provided.
After this paper was submitted, a referee made us aware of a newly published and improved extraterrestrial irradiance (Coddington et al., 2021; with 1 % uncertainties) that should improve the calculated irradiances, but the figures for this paper were not changed.
The software used to arrive at the data consists of several “R” functions. If there is any interest in obtaining and understanding the functions, please contact joseph.michalsky@noaa.gov.
All quality-controlled data produced are archived as ARM data records and include cloud-screened aerosol optical depths, all three spectral irradiances, plus direct normal solar transmission, and normalized diffuse and global irradiances. For those interested, the data are freely available and are archived with the ARM program and can be downloaded using https://iop.archive.arm.gov/arm-iop/0pi-data/michalsky/RSS/ (last access: 20 December 2021, Michalsky, 2021b). Some additional notes on the data quality are at https://gml.noaa.gov/aftp/user/michalsky/asked_for_stuff/ (last access: 20 December 2021, Michalsky, 2021a).
The contact author has declared that neither they nor their co-author have any competing interests.
Publisher's note: Copernicus Publications remains neutral with regard to jurisdictional claims in published maps and institutional affiliations.
The authors are indebted to Jerry Berndt, for designing, building, and assembling the vacuum chamber and mount for the refurbished detector and for his tenacity in making the system function. Scott Stierle not only developed software to ingest the data and provide a clean documented file for each day of the 4.5 years of RSS data but helped in the deployment and performed field repairs during the deployment. Patrick Disterhoft provided laboratory facilities and technical direction in the refurbishment of the RSS. This research has been funded by the United States Department of Energy, Office of Science's Atmospheric Radiation Measurement (ARM) program. We thank the staff at NASA AERONET and the ARM program staff, especially Rick Wagener, for establishing and maintaining the AERONET site data used in this investigation. The authors are indebted to the referees of this paper, who made many insightful comments that strengthened the final version.
This research has been funded by the United States Department of Energy, Office of Science's Atmospheric Radiation Measurement (ARM) program. The grant was administered by the Pacific Northwest National Laboratory (grant no. 327038).
This paper was edited by Daniel Perez-Ramirez and reviewed by three anonymous referees.
Alexandrov, M. D., Kiedron, P., Michalsky, J. J., Hodges, G., Flynn, C. J., and Lacis, A. A.: Optical depth measurements by shadow-band radiometers and their uncertainties, Appl. Optics, 46, 8027–8038, https://doi.org/10.1364/AO.46.008027, 2007.
Bruegge, C. J., Conel, J. E., Green, R. O., Margolis, J. S., Holm, R. G., and Toon, G.: Water vapor column abundance retrievals during FIFE, J. Geophys. Res., 97, 18759–18768, https://doi.org/10.1029/92JD01050, 1992.
Coddington, O. M., Richard, E. C., Harber, D., Pilewskie, P., Woods, T. N., Chance, K., Lu, X., and Sun, K.: The TSIS-1 hybrid solar reference spectrum, Geophys. Res. Lett., 48, e2020GL091709, https://doi.org/10.1029/2020GL091709, 2021.
Gianelli, S. M., Carlson, B. E., and Lacis, A. A.: Aerosol retrievals using rotating shadowband spectroradiometer data, J. Geophys. Res., 110, D05203, https://doi.org/10.1029/2004JD005329, 2005.
Gueymard, C. A.: Reference solar spectra: Their evolution, standardization issues, and comparison to recent measurements, Adv, Space Res., 37, 323–340, https://doi.org/10.1016/j.asr.2005.03.104, 2006.
Gueymard, C. A.: Revised composite extraterrestrial spectrum based on recent solar irradiance observations, Sol. Energy, 169, 434–440, https://doi.org/10.1016/j.solener.2018.04.067, 2018.
Harrison, L., Beauharnois, M., Berndt, J., Kiedron, P., Michalsky, J., and Min, Q-L.: The Rotating Shadowband Spectroradiometer (RSS) at SGP, Geophys. Res. Lett., 26, 1715–1718, https://doi.org/10.1029/1999GL900328, 1999.
HITRAN Database: HITRAN is a compilation of spectroscopic parameters that a variety of computer codes use to predict and simulate the transmission and emission of light in the atmosphere, Atomic and Molecular Physics Division, Harvard-Smithsonian Center for Astrophysics, available at: https://hitran.org/about/, last access: August 2012.
Holben, B. N., Tanre, D., Smirnov, A., Eck, T. F., Slutsker, I., Abuhassan, N., Newcomb, W. W., Schafer, J., Chatenet, B., Lavenue, F., Kaufman, Y. J., Vande Castle, J., Setzer, A., Markham, B., Clark, D., Frouin, R., Halthore, R., Karnieli, A., O'Neill, N. T., Pietras, C., Pinker, R. T., Voss, K., and Zibordi, G.: An emerging ground-based aerosol climatology: Aerosol Optical Depth from AERONET, J. Geophys. Res., 106, 12067–12097, https://doi.org/10.1029/2001JD900014, 2001.
Kiedron, P., Michalsky, J., Schmid, B., Slater, D., Berndt, J., Harrison, L., Racette, P., Westwater, E., and Han, Y.: A robust retrieval of water vapor column in dry Arctic conditions using the Rotating Shadowband Spectroradiometer, J. Geophys. Res., 106, 24007–24016, https://doi.org/10.1029/2000JD000130, 2001.
Kiedron, P. W., Harrison, L., Berndt, J. L., Michalsky, J. J., and Beaubien, A. F.: Specifications and performance of UV rotating shadowband spectroradiometer (UV-RSS), Proc. SPIE, 4482, Ultraviolet Ground- and Space-based Measurements, Models, and Effects, https://doi.org/10.1117/12.452925, 2002.
Kiedron, P., Berndt, J., Michalsky, J., and Harrison, L.: Column water vapor from diffuse irradiance, Geophys. Res. Lett., 30, 1565, https://doi.org/10.1029/2003GL016874, 2003.
Kindel, B. C., Qu, Z., and Goetz, A. F. H.: Direct spectral irradiance and transmittance measurements from 350 to 2500 nm, Appl. Optics, 40, 3483–3494, https://doi.org/10.1364/AO.40.003483, 2001.
LeBlanc, S. E., Pilewskie, P., Schmidt, K. S., and Coddington, O.: A spectral method for discriminating thermodynamic phase and retrieving cloud optical thickness and effective radius using transmitted solar radiance spectra, Atmos. Meas. Tech., 8, 1361–1383, https://doi.org/10.5194/amt-8-1361-2015, 2015.
McFarlane, S. A., Gaustad, K. L., Mlawer, E. J., Long, C. N., and Delamere, J.: Development of a high spectral resolution surface albedo product for the ARM Southern Great Plains central facility, Atmos. Meas. Tech., 4, 1713–1733, https://doi.org/10.5194/amt-4-1713-2011, 2011.
Michalsky, J. and LeBaron, B.: Fifteen-year aerosol optical depth climatology for Salt Lake City, J. Geophys. Res., 118, 3271–3277, https://doi.org/10.1002/jgrd.50329, 2013.
Michalsky, J., Beauharnois, M., Berndt, J., Harrison, L., Kiedron, P., and Min, Q.: O2-O2 absorption band identification based on optical depth spectra of the visible and near-infrared, Geophys. Res. Lett., 26, 1581–1584, https://doi.org/10.1029/1999GL900267, 1999.
Michalsky, J., Denn, F., Flynn, C., Hodges, G., Kiedron, P., Koontz, A., Schlemmer, J., and Schwartz, S. E.: J. Geophys. Res., 115, D07203, https://doi.org/10.1029/2009JD012197, 2010.
Michalsky, J. J.: Index of /aftp/user/michalsky/asked_for_stuff/, NOAA GML, available at: https://gml.noaa.gov/aftp/user/michalsky/asked_for_stuff/, last access: 20 December 2021a.
Michalsky, J. J.: Quality-controlled data, ARM Archive [data set], available at: https://iop.archive.arm.gov/arm-iop/0pi-data/michalsky/RSS/, last access: 20 December 2021b.
Michalsky, J. J., Liljegren, J. C., and Harrison, L. C.: A comparison of sun photometer derivations of total column water vapor and ozone to standard measures of same at the Southern Great Plains atmospheric radiation measurement site, J. Geophys. Res., 100, 25995–26003, https://doi.org/10.1029/95JD02706, 1995.
Michalsky, J. J., Schlemmer, J. A., Berkheiser, W. E., Berndt, J. L., and Harrison, L. C.: Multi-year measurements of aerosol optical depth in the Atmospheric Radiation Measurement and Quantitative Links, programs, J. Geophys. Res., 106, 12099–12107, https://doi.org/10.1029/2001JD900096, 2001.
Min, Q. and Clothiaux, E. E.: Photon path length distributions inferred from rotating shadowband spectrometer measurements at the Atmospheric Radiation Measurements Program Southern Great Plains site, J. Geophys. Res., 108, 4465–4474, https://doi.org/10.1029/2002JD002963, 2003.
Min, Q.-L. and Harrison, L. C.: Joint statistics of photon path length and cloud optical depth, Geophys. Res. Lett., 26, 1425–1428, https://doi.org/10.1029/1999GL900246, 1999.
Min, Q.-L., Harrison, L. C., and Clothiaux, E.: Joint statistics of photon pathlength and cloud optical depth: Case studies, J. Geophys. Res., 106, 7375–7386, https://doi.org/10.1029/2000JD900490, 2001.
Reagan, J. A., Thome, K., Herman, B., and Gall, R.: Water vapor measurements in the 0.94 micron absorption band: Calibration, measurements and data applications, Proc. Int. Geosci. Remote Sens. Symp., Ann Arbor, Michigan, 18–21 May 1987, IEEE 87CH2434-9, 63–67, available at: https://arizona.pure.elsevier.com/en/publications/water-vapor-measurements-in-the-0-94-micron-absorption-band-calib (last access: 21 December 2012), 1987.
Sierk, B., Solomon, S., Daniel, J. S., Portmann, R. W., Gutman, S. I., Langford, A. O., Eubank, C. S., Dutton, E. G., and Holub, K. H.: Field measurements of water vapor continuum absorption in the visible and near-infrared, J. Geophys. Res., 109, D08307, https://doi.org/10.1029/2003JD003586, 2004.
Smirnov, A, Holben, B. N., Lyapustin A., Slutsker, I., and Eck, T. F.: AERONET processing algorithms refinement, AERONET 2004 Workshop, 10–14 May 2004, El Arenosillo, Spain, available at: https://www.researchgate.net/publication/291795812_AERONET_processing_algorithms_refinement (last access: 21 December 2012), 2004.
Stokes, G. M. and Schwartz, S. E.: The Atmospheric Radiation Measurement (ARM) Program: Programmatic background and design of the cloud and radiation test bed, B. Am. Meteorol. Soc., 75, 1201–1221, https://doi.org/10.1175/1520-0477(1994)075<1201:TARMPP>2.0.CO;2, 1994.
Vignola, F., Michalsky, J., and Stoffel, T.: Solar and Infrared Radiation Measurements, CRC Press, Boca Raton, Florida, https://doi.org/10.1201/b22306, 2020.
WMO/GAW: Aerosol Measurement Procedures, Guidelines and Recommendations, World Meteorological Organization, WMO-No. 1177, Global Atmospheric Watch, GAW Report No. 227, available at: https://library.wmo.int/doc_num.php?explnum_id=3073 (last access: 20 December 2021), 2016.
- Abstract
- Introduction
- Fundamental instrument details
- Operational details
- Direct solar transmission and normalized irradiance calculations and examples
- Aerosol optical depths
- Irradiance calculations
- Summary
- Code availability
- Data availability
- Competing interests
- Disclaimer
- Acknowledgements
- Financial support
- Review statement
- References