the Creative Commons Attribution 4.0 License.
the Creative Commons Attribution 4.0 License.
 | 12 Jul 2022
Contactless optical hygrometry in LACIS-T
Jakub L. Nowak
Robert Grosz
Wiebke Frey
Dennis Niedermeier
Jędrzej Mijas
Szymon P. Malinowski
Linda Ort
Silvio Schmalfuß
Frank Stratmann
Jens Voigtländer
Tadeusz Stacewicz
The Fast Infrared Hygrometer (FIRH), employing open-path tunable diode laser absorption spectroscopy at the wavelengths near the 1364.6896 nm line, was adapted to perform contactless humidity measurements at the Turbulent Leipzig Aerosol Cloud Interaction Simulator (LACIS-T), a unique turbulent moist-air wind tunnel. The configuration of the setup allows for scanning from outside the walls of the wind tunnel and at various positions without the need for repeated optics adjustments.
We identified three factors which significantly influence the measurement – self-broadening of the absorption line, interference in the glass windows and parasitic absorption in the ambient air outside the wind tunnel – and developed correction methods which satisfactorily account for these effects. The comparison between FIRH and a reference hygrometer (dew-point mirror MBW 973) indicated a good agreement within the expected errors across the wide range of water vapour concentration 1.0–6.1×1017 cm−3 (equivalent to dew-point temperature of −5.4 to +21 ∘C at the temperature of 23 ∘C).
High temporal resolution (∼2 kHz) allowed for studying turbulent fluctuations in the course of intensive mixing of two air streams which had the same mean velocity but differed in temperature and humidity, also including the settings for which the mixture can be supersaturated. The obtained results contribute to improved understanding and interpretation of cloud formation studies conducted in LACIS-T by complementing the previous characterizations of turbulent velocity and temperature fields inside the wind tunnel.
- Article
(6117 KB) - Full-text XML
- BibTeX
- EndNote


Water vapour is the component of the atmosphere which is of particular importance for shaping weather and climate. The efficient absorption of terrestrial radiation makes it the most potent greenhouse gas, and its phase transitions result in the formation of clouds and precipitation as well as latent heat transport.
The distribution of water vapour in the atmosphere is highly inhomogeneous across the range of scales. At the largest scales, typical conditions differ from a relatively moist atmospheric boundary layer to rather dry upper troposphere–lower stratosphere and from moist tropics to dry polar regions. In addition, substantial gradients of humidity often occur at the surface and top of the boundary layer or at cloud edges (Matthews et al., 2014; Haman et al., 2007; Malinowski et al., 2013). At the smallest scales, turbulent fluctuations of humidity and temperature determine local supersaturation in which individual aerosol particles can be activated to form cloud droplets or ice crystals and further grow through condensation or deposition (Chandrakar et al., 2016, 2017, 2018; Desai et al., 2018).
Highly accurate and high-resolution (spatial or temporal) measurements of water vapour concentration, in both field and laboratory experiments, are increasingly demanded to address contemporary research questions regarding cloud microphysics and cloud–turbulence interactions. High accuracy is essential to investigate the nucleation and growth of ice crystals in ice and mixed-phase clouds (Spichtinger et al., 2004; Peter et al., 2006; Krämer et al., 2009), whereas high resolution is crucial to obtain reliable statistics of local supersaturation which control stochastic condensation under turbulent conditions (Prabhakaran et al., 2020; Thomas et al., 2021).
Despite considerable progress in the development of hygrometers for airborne, ground-based and laboratory applications (e.g. May, 1998; Diskin et al., 2002; Podolske et al., 2003; Zondlo et al., 2010; Beaton and Spowart, 2012; Meyer et al., 2015; Neis et al., 2015a, b; Tátrai et al., 2015; Thornberry et al., 2015; Metzger et al., 2016; Nowak et al., 2016; Buchholz et al., 2017; Stacewicz et al., 2018; Szakáll et al., 2020), the comparability between different instruments remains insufficient. Large discrepancies of up to 20 % are observed even under controlled laboratory conditions (Fahey et al., 2014). Furthermore, the quality of humidity measurements often lags in accuracy and resolution behind the state-of-the-art measurement techniques relevant for other atmospheric parameters, e.g. temperature. As a result, the limitations of humidity measurements prevent an improved understanding of some important physical processes. This fact can be illustrated by the examples from field and laboratory studies. In the observations of mixing at stratocumulus top performed by Siebert et al. (2021), see Fig. 14 therein, the small-scale features of the mixing process are clearly indicated by the temperature records, but the same structures cannot be identified in the simultaneous humidity records due to insufficient resolution. Furthermore, the recent International Cloud Modeling Workshop considered the case of turbulent moist convection inside the Michigan Tech Pi Chamber (Chang et al., 2016) and revealed many differences between the numerical models participating in the comparison (Chen and Krueger, 2021). It was concluded that each model exhibits different statistics of supersaturation (mean and variance), and it is highly desirable to know which values are relevant for the convection in the chamber. However, this cannot be discerned without appropriate accurate and high-resolution measurements of humidity.
Similarly, Niedermeier et al. (2020) provided statistics of turbulent temperature fluctuations (see Fig. 6 therein) in the Turbulent Leipzig Aerosol Cloud Interaction Simulator (LACIS-T), a unique turbulent moist-air wind tunnel designed to investigate the interactions between cloud microphysics and small-scale turbulence. However, with the available instrumentation they could not obtain analogous results for humidity fluctuations.
Within the present study, we adapted the Fast Infrared Hygrometer (FIRH), an instrument employing tunable diode laser absorption spectroscopy (Nowak et al., 2016), to perform humidity measurements at LACIS-T. The goal of the series of experiments was two-fold: (1) to evaluate the properties of FIRH under a wide range of well-defined reproducible conditions resembling those in the real atmosphere and (2) to characterize the humidity field and turbulent fluctuations of humidity inside LACIS-T for different settings of the wind tunnel.
LACIS-T is an ideal facility to test FIRH because temperature and humidity in each of the two streams entering the measurement volume can be precisely controlled, while the turbulent mixing of the streams produces fast fluctuations of temperature and humidity (Niedermeier et al., 2020). On the other hand, FIRH is well-suited to resolve small-scale and quickly changing features of the humidity field inside LACIS-T because it provides high temporal resolution and its typical optical path roughly corresponds to the width of the LACIS-T measurement section (Nowak et al., 2016). This enables contactless optical sampling from outside the wind tunnel, which eliminates the influence of the instrument on the investigated processes. Such a need for a contactless sampling was recognized following the reports from other laboratory experiments (e.g. Anderson et al., 2021, observed that the position of sensor holders inside the Pi chamber affects the orientation of the principal circulation) and taking into account the relatively small size of the central section of LACIS-T.
The present paper is structured in the following way. Section 2 introduces the LACIS-T facility as well as the FIRH instrument and explains the adaptations applied to the hygrometer with respect to its original version. Section 3 outlines the specific physical factors which strongly influence the measurement and need to be corrected for in order to retrieve the true value of humidity: self-broadening of the absorption line, interference in the glass windows and parasitic absorption in the ambient air outside the wind tunnel. Section 4 evaluates the accuracy of FIRH employing two approaches: a priori and with respect to a slow-response reference hygrometer. Section 5 presents and interprets the results of the measurements of mean humidity and turbulent fluctuations in the course of mixing of two streams inside LACIS-T for various selected stream settings. Eventually, Sect. 6 summarizes and discusses the findings.
2.1 LACIS-T facility
LACIS-T is a unique turbulent moist-air vertical wind tunnel established to study cloud physical processes and the interactions between cloud microphysics and turbulence under a wide range of well-defined reproducible conditions resembling warm, mixed-phase and cold clouds. The design and capabilities of LACIS-T were described in detail by Niedermeier et al. (2020).
The wind tunnel works in a closed loop. Two air streams with separately controlled temperatures, humidities and velocities between 0.5 and 2 m s−1 are turbulently mixed inside the measurement section. The measurement section is oriented vertically (Fig. 1). For the current study, a fixed velocity of 1.5 m s−1 was used. The turbulence is generated by the passive square-mesh grids. Aerosol seeding can be additionally applied by isokinetically injecting aerosol particles directly into the mixing zone. The mixing of the two streams can be observed in the measurement section with the dimensions 80 cm ×20 cm ×200 cm through the windows of borosilicate glass. The measurement section is surrounded by a construction of rails (RK Rose & Krieger GmbH) allowing for the installation of various measurement apparatuses and its displacement to selected positions.
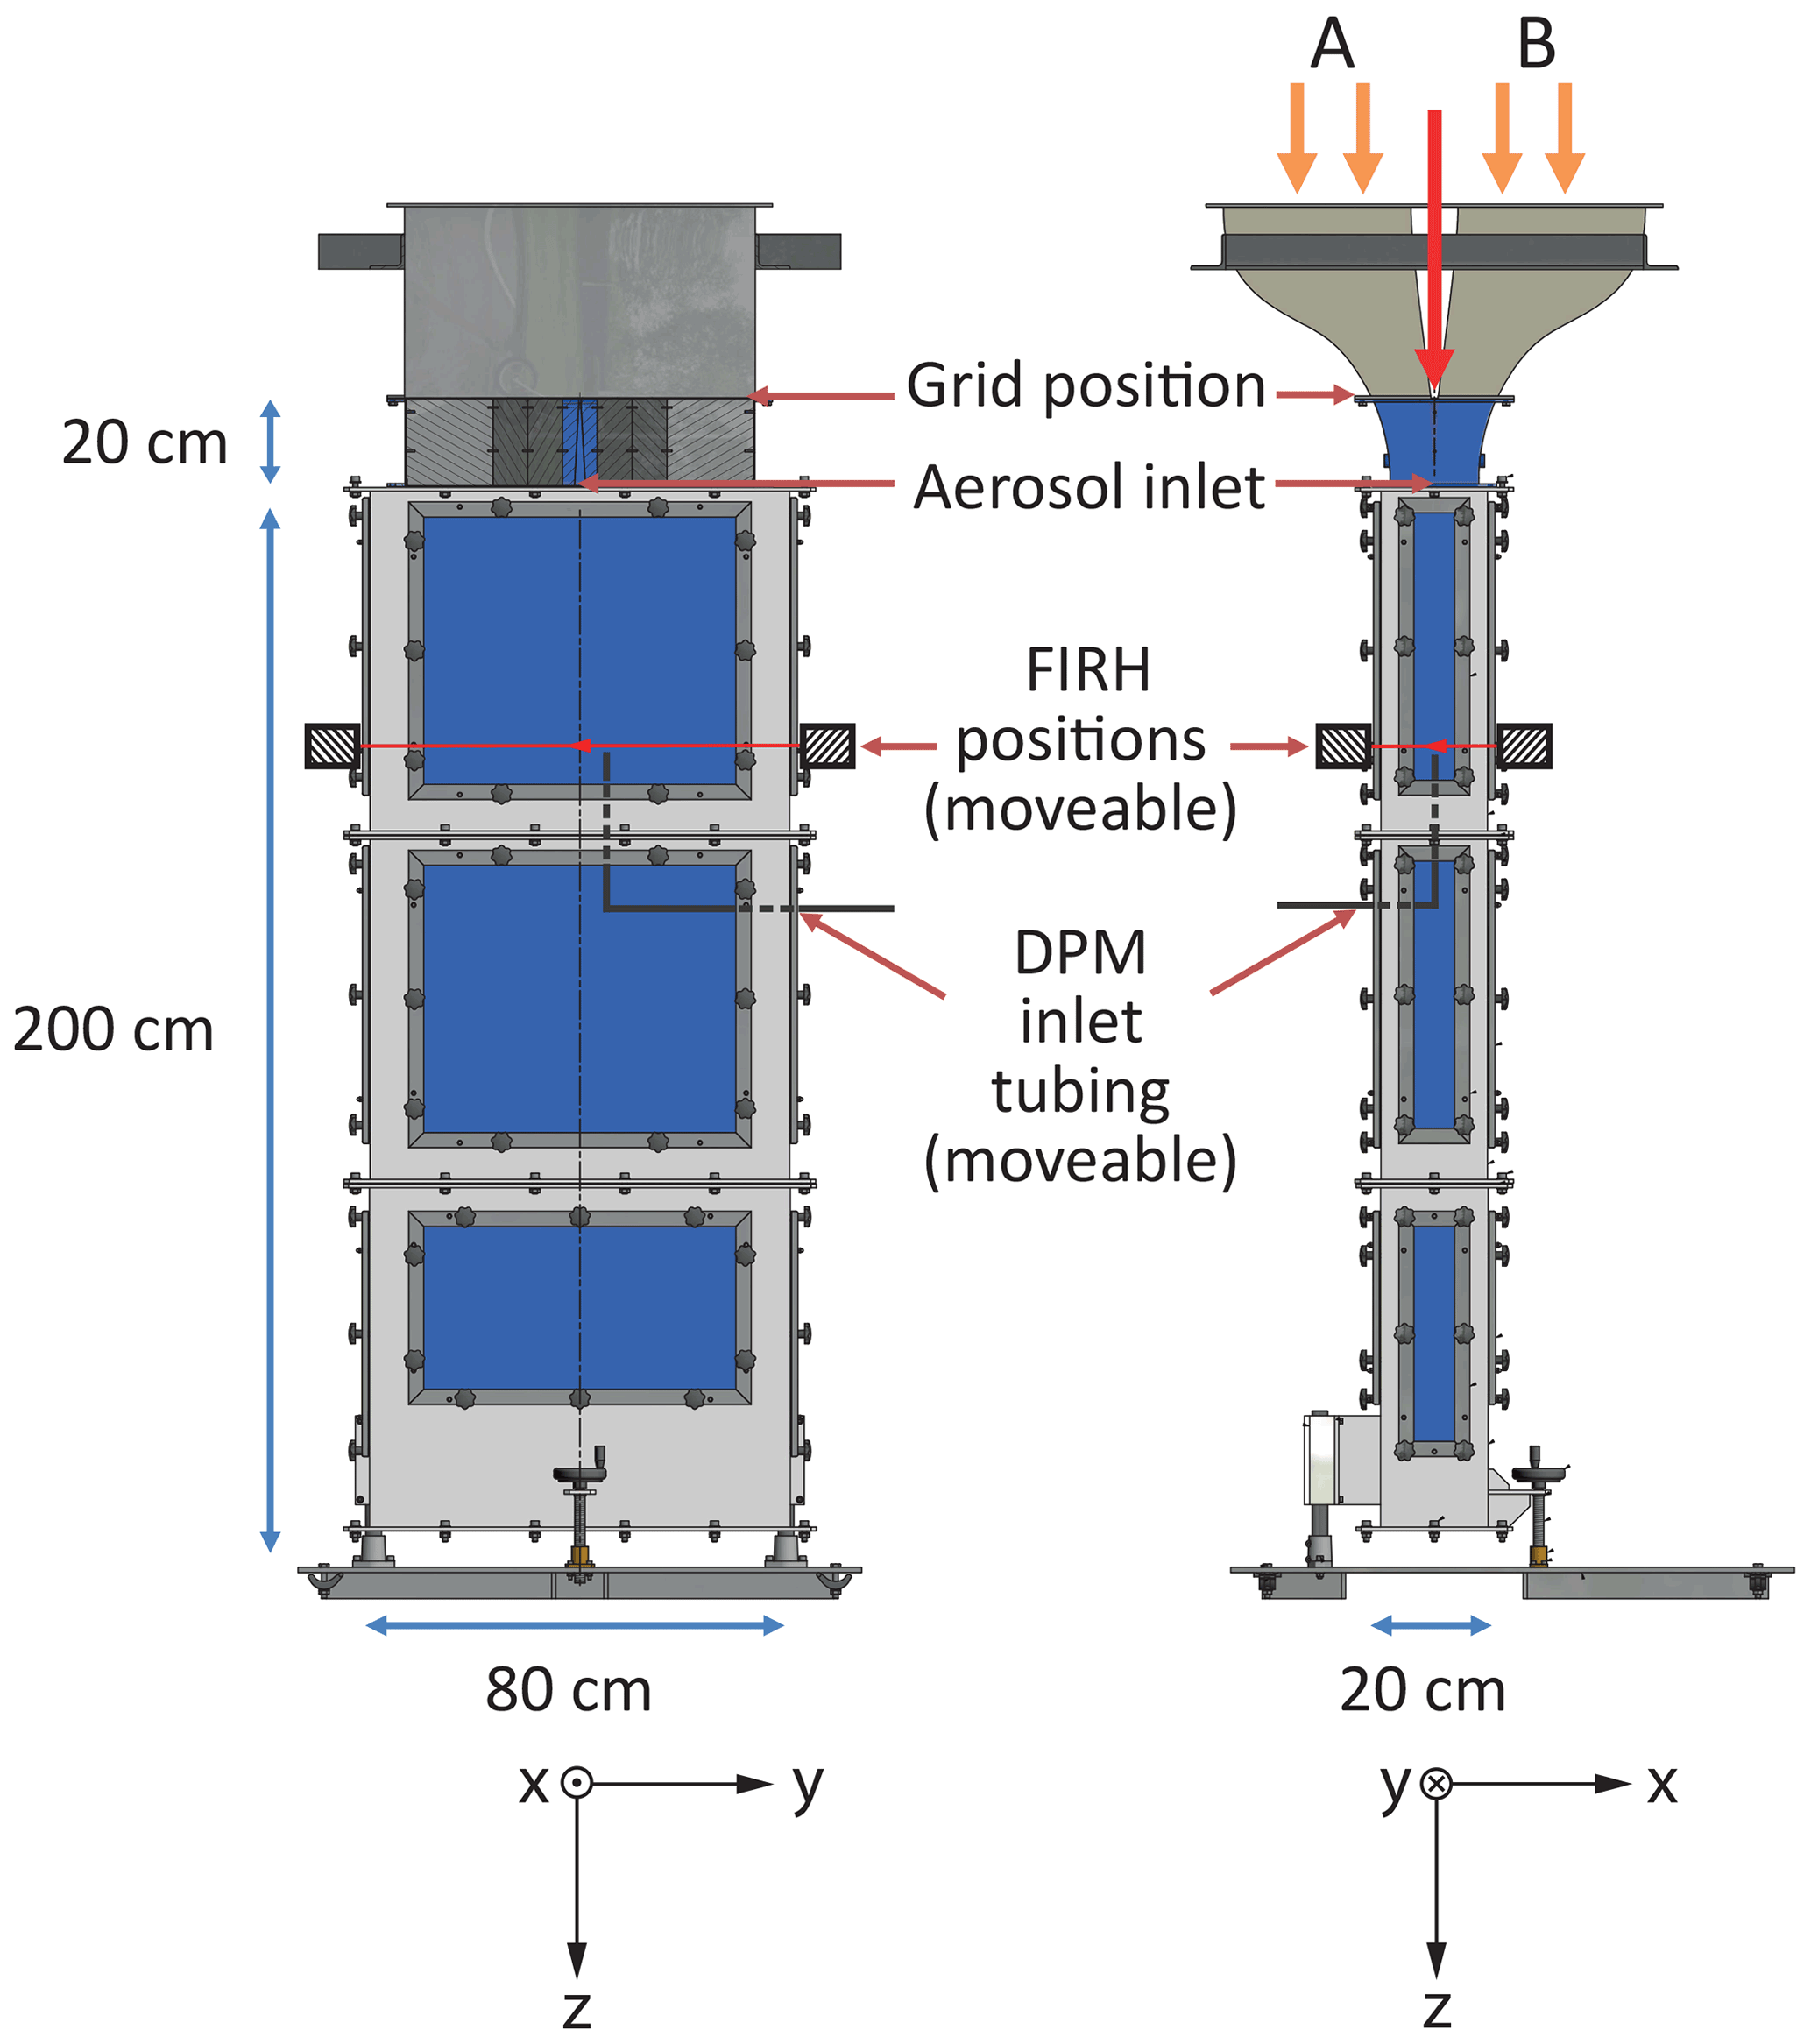
Figure 1Schematic of the measurement section of LACIS-T. A and B mark the two air streams which are mixed in the measurement section. The red arrow marks the location where aerosol particles can be injected. Axes are included in order to display the geometry where z=0 is the tip of the aerosol inlet, and x=0 and y=0 are the centrelines of the two transverse dimensions of the measurement section. The red lines denote the position of the Fast Infrared Hygrometer (FIRH) optical paths. The thick grey lines denote the inlet tubing of the dew-point mirror (DPM) hygrometer. Adapted from Niedermeier et al. (2020).
LACIS-T is equipped with a set of instruments for aerosol particle generation, cloud particle sizing and monitoring the flow and thermodynamic conditions (Niedermeier et al., 2020, Table 1). In this study, we employed the dew-point mirror (DPM, model 973 by MBW Calibration AG) as a slow-response reference hygrometer. It allows for the measurements of dew/frost-point temperature Td in the range of −50 to +20 ∘C with accuracy of ∘C and reproducibility of ∘C as well as temperature T in the range of −50 to +100 ∘C with accuracy of ∘C and reproducibility of ∘C at the rate of 1 Hz. Throughout the experiments described further in Sects. 4 and 5, the air was sampled by the DPM through a stainless-steel tubing with its inlet facing the flow and positioned manually so that it is always downstream (∼1 cm) of the optical path of FIRH (see Sect. 2.2). Although there is a possibility of developing an upstream disturbance of the flow due to the inlet, the influence on FIRH measurements is expected to be negligible due to the small size of the inlet (diameter of 6 mm) in relation to the length of the FIRH optical path. The air in the laboratory outside the wind tunnel is dried by a dedicated conditioning system to about ∘C. The ambient conditions are monitored with digital sensors (Si7021 and MPL3115A2) capable of measuring T and Td with accuracy of ±0.4 ∘C and ±0.8 ∘C, respectively. With those values, one can calculate water vapour concentration n according to
where es is saturation vapour pressure, and NA denotes the Avogadro number and R the universal gas constant. The dependence of es on temperature results from the Clausius–Clapeyron relation. In the numerical calculations involved in this study, we employed the polynomial approximations given by Flatau et al. (1992).
2.2 FIRH instrument
FIRH is an open-path optical sensor developed for quick measurements of small-scale humidity fluctuations in turbulent atmospheric flows. The design, operation, properties and comparison of this instrument with selected other meteorological hygrometers were described in detail by Nowak et al. (2016).
The basic measurement principle is the quenching of infrared laser light whose wavelength is precisely tuned to a specific absorption line of H2O molecule. In fact, the attenuation at two different wavelengths λM, λR corresponding to the neighbouring maximum σM and minimum σR of the absorption cross section is compared. For such close wavelengths, the absorption by glass optical elements, scattering by dust or water droplets, and sensitivity of detectors are practically the same while the difference in absorption by water vapour molecules is substantial (see absorption spectrum in Fig. 2). The choice of the absorption feature in combination with the exact tuning of the wavelength prevents any interferences by other absorbing compounds present in the atmosphere, e.g. CO2. Therefore, such differential measurement is sensitive only to the mean concentration of water vapour molecules n along the optical path of length L between the emitter and the detector. This concentration can be determined with the equation resulting from the Lambert–Beer law:
where ℐ1 and ℐ2 are the intensities of the light beam entering and leaving the sampled volume, respectively. The concentration can be converted into other humidity units (e.g. water vapour partial pressure e, specific humidity q or Td) with standard thermodynamic formulas.
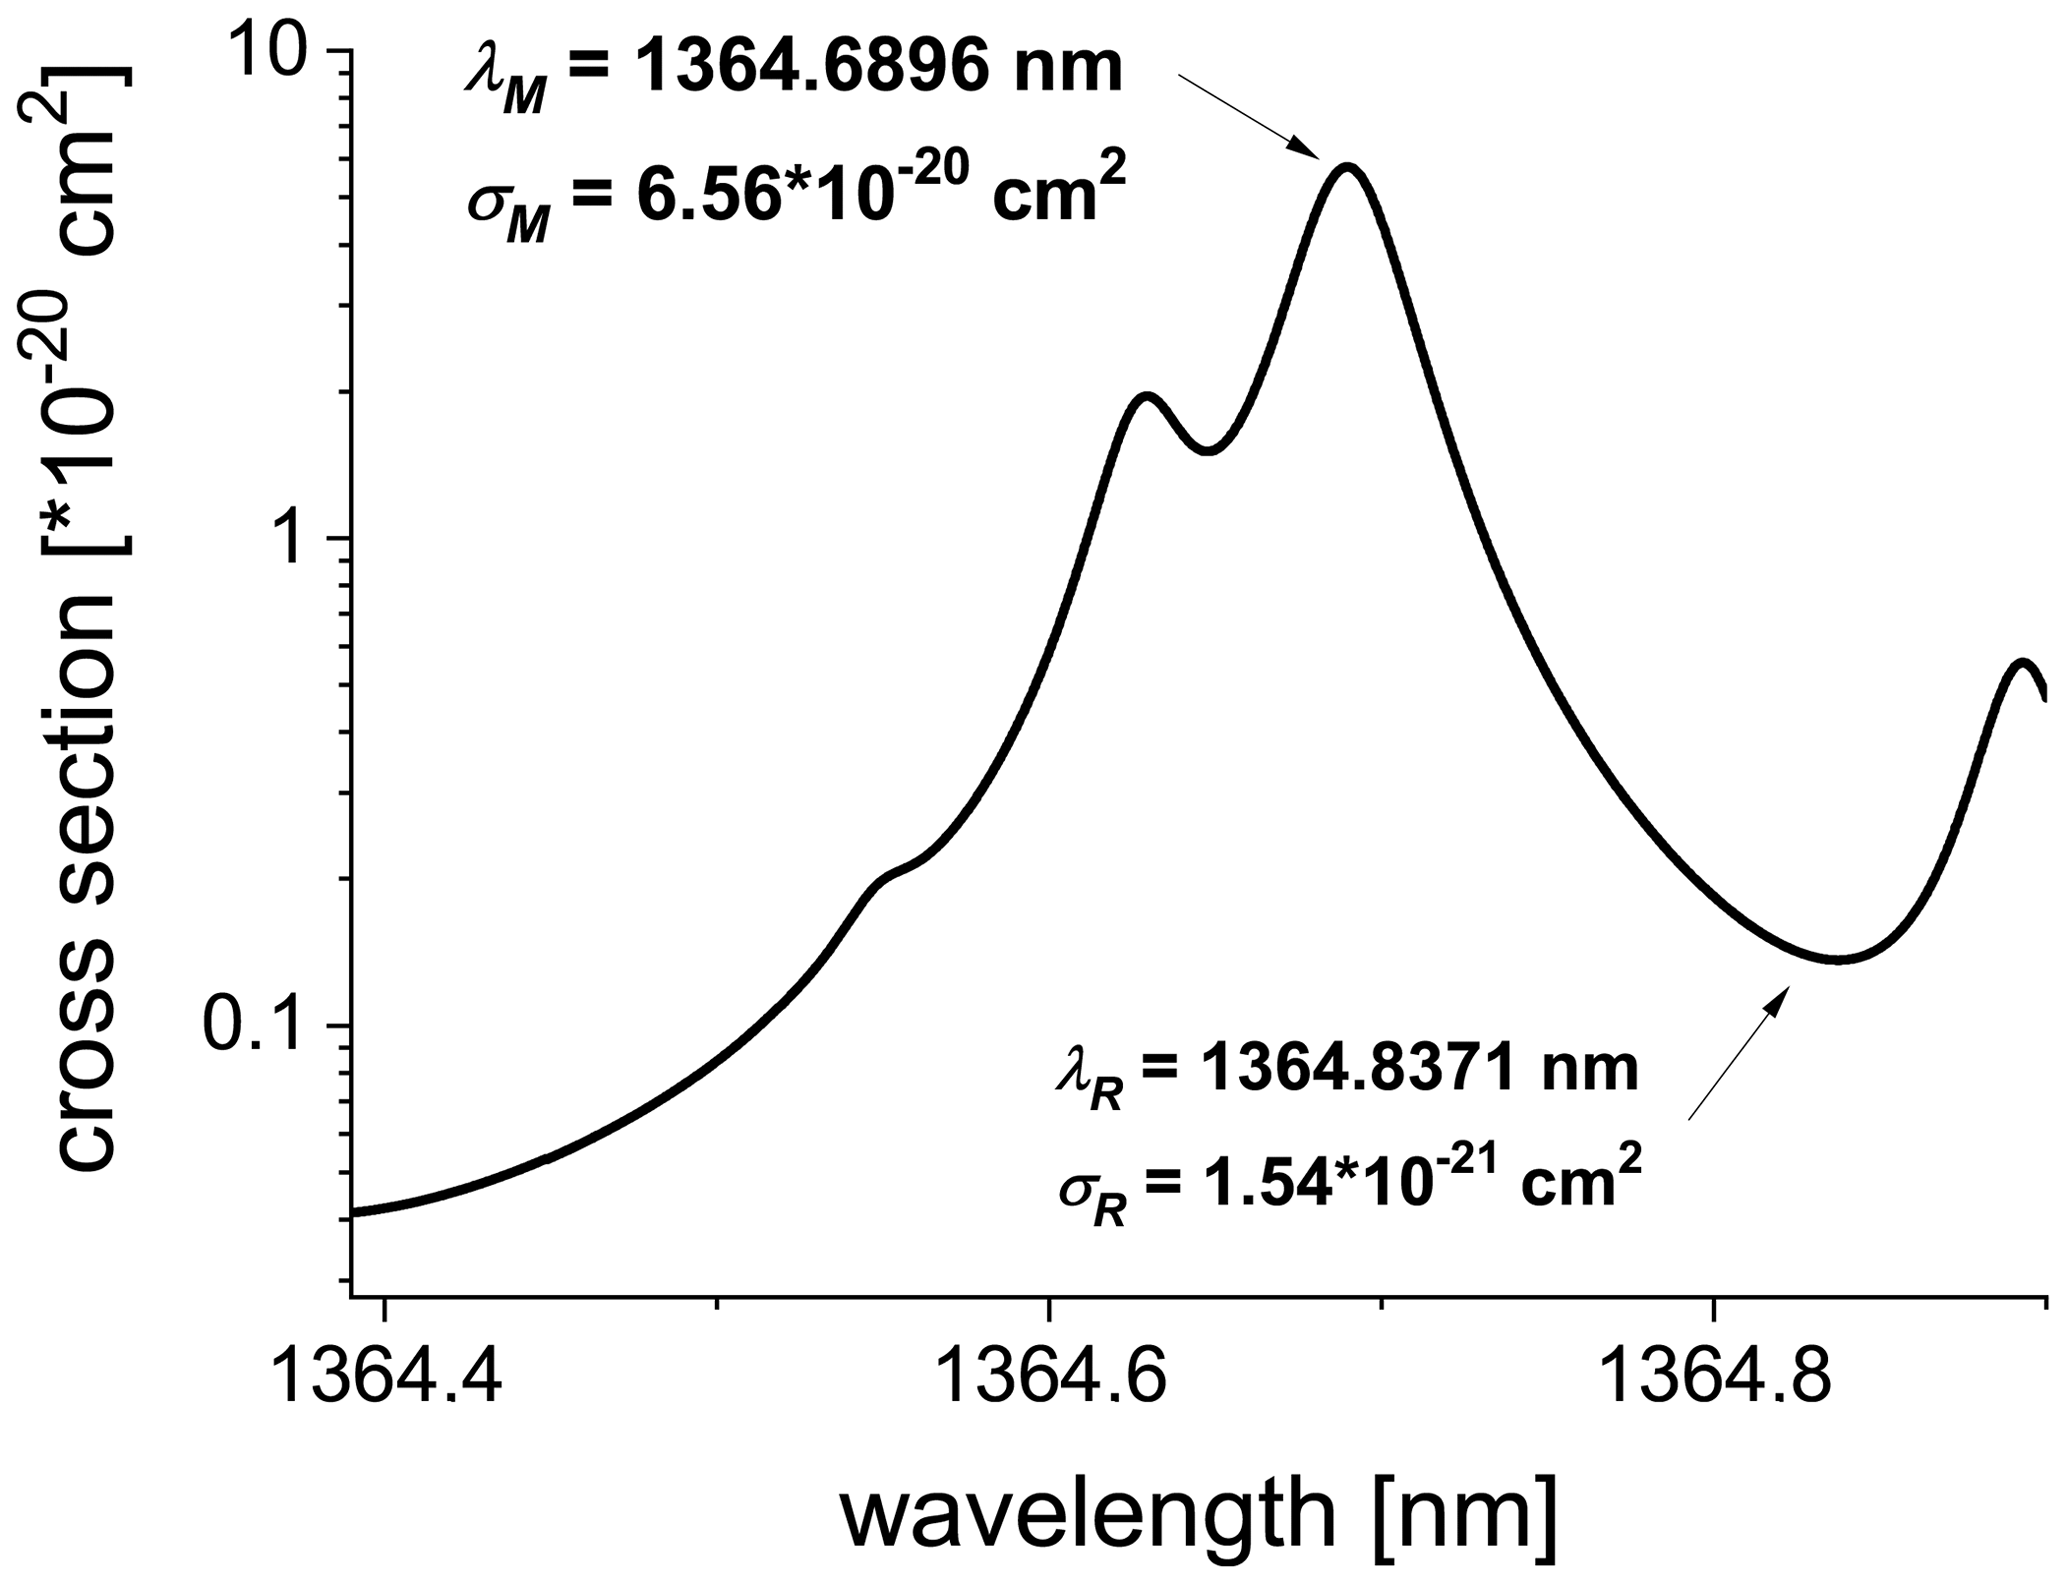
Figure 2Absorption spectrum of the H2O molecule in the wavelength range relevant for the current study obtained using the HITRAN database (p=1000 hPa, T=23 ∘C, n=1016 cm−3). The marked extrema are the wavelengths selected for laser tuning.
The same absorption line as in the earlier version of FIRH was used: λM=1364.6896 nm. However, a different reference wavelength λR=1364.8371 nm was selected in order to ease the frequent switching between the two wavelengths, which can then be achieved by changing the laser current only while keeping the laser temperature fixed. According to the HITRAN database of absorption spectra (Rothman et al., 2013), for relatively dry atmospheric conditions (p=1000 hPa, T=23 ∘C, n=1016 cm−3), the respective absorption cross sections equal cm2 and cm2 (see Fig. 2).

Figure 3Schematic of the FIRH implementation at LACIS-T. The emitter and the photodetector PD2 are mounted on the movable sleigh, which allows for the convenient scanning of the measurement volume at both transverse orientations: across the short (as marked in this scheme) and long (perpendicular to what is depicted in this scheme) dimensions of the measurement section of the wind tunnel.
The implementation of FIRH in LACIS-T is schematically presented in Fig. 3. A single mode semiconductor laser (DL100, Toptica Photonics AG) serves as a source of monochromatic light of a desired wavelength. Precise tuning of the laser to λM or λR is achieved with temperature and current controllers. The laser beam is conducted with a fibre and splits twice in the couplers (10202A-90-APC, Thorlabs). Coupler 1 directs a portion of the beam (about 10 % in intensity) into the wavelength meter (WS6-200, HighFinesse GmbH), which is used instead of a high-humidity reference cell applied by Nowak et al. (2016). Feedback current signal from this instrument stabilizes the laser wavelength with the accuracy of ≤0.001 nm and the precision of ≤0.0001 nm.
The main beam leaving coupler 1 is sent to an electrooptic amplitude modulator (AM1550, JENOPTIK Optical Systems GmbH) driven by a waveform generator (Handyscope HS5, TiePie engineering). Coupler 2 sends a portion of the beam (about 10 % in intensity) to the photodetector PD1 (FGA21, Thorlabs) that monitors the laser power. The dominant beam is further guided to an emitter that directs it to the measurement volume. The intensity of the light transmitted through the sample is measured with another photodetector (PD2) of the same kind at the opposite side of the wind tunnel. Signal digitization rate of 2 MHz was applied using a two-channel 16-bit AD converter (Handyscope HS5, TiePie engineering) connected to a computer. The custom-developed software yields the final data rate of 2 kHz and handles two alternative methods of signal acquisition: (1) numerical lock-in demodulation if the amplitude modulator is active or (2) averaging of the direct high-rate records if the modulator is deactivated. Coupler 2 is also used to merge an auxiliary small-power 532 nm beam into the fibre. This beam is used only for system adjustments and not during the measurement.
The sampling of the air inside LACIS-T was achieved across the glass windows at the height z=39 cm, i.e. downstream of the aerosol inlet where z is the longitudinal position with z=0 being the tip of the aerosol inlet; see Fig. 1. This height was selected because previous measurements related to cloud formation studies were performed at the same position by Niedermeier et al. (2020). The emitter and the photodetector PD2 were mounted on a rigid aluminium sleigh at the opposite sides of the wind tunnel (see Fig. 3) as close to the glass windows as was possible (while maintaining the flexibility of easy changes of the scanning position) in order to minimize the optical path outside the wind tunnel. Nevertheless, even despite drying the ambient air in the laboratory, parasitic absorption could not be entirely avoided (see Sect. 3.3). The sleigh enables scanning the spatial variability of humidity statistics by moving the sensor horizontally along the walls of the wind tunnel. Two separate sleighs were prepared to allow measurement at both transverse orientations: across the long ( cm) and short ( cm) dimensions of the rectangular measurement section of LACIS-T, denoted hereafter with letters L and S, respectively. The sampling across the long dimension was possible at the positions –2.75 cm due to the thickness of the window frame. In the case of the sampling across the short dimension, the positions y=0, −10 and −20 cm were selected in this study. The coordinates x and y denote two transverse dimensions, with the origin of the coordinate system located in the centre of the measurement section as shown in Fig. 3.
At each position the measurement is accomplished in two steps. The laser wavelength is tuned once to λM and once to λR, and data records are stored for each wavelength. Because Eq. (2) involves the ratio of four intensities and the electric signals generated by the photodetectors PD1 and PD2 feature voltages I1, I2 proportional to the incoming light intensities ℐ1, ℐ2 regardless of the wavelength, the recorded values I1(λM), I2(λM), I1(λR) and I2(λR) can be directly inserted into the equation. Mean values of the record at λR are used in the case of I1(λR) and I2(λR) while the time series recorded at λM are inserted in the case of I1(λM) and I2(λM) in order to obtain a relevant time series of n.
3.1 Absorption line properties
The shapes of spectral lines are mainly determined by collisions of the absorbing molecules with air particles (Demtroder, 2003). In rough approximation, the line profiles are described by Voigt functions; however they are still a matter of investigation (Lisak and Hodges, 2007; Lisak et al., 2009; Regalia et al., 2014; Conway et al., 2020). Their parameters enabling the calculation of spectra at various circumstances are summarized in databases such as HITRAN (Rothman et al., 2013). The shapes weakly depend on the air pressure and temperature within the typical range of those parameters in the atmosphere. Stronger dependence occurs for water vapour concentration due to self-broadening (Stacewicz et al., 2018). For the conditions relevant for our experiment, the variations in the line shape due to pressure and temperature changes can be considered negligible. However, water vapour concentration in LACIS-T can vary from ∼1016 to ∼1018 cm−3. In such a broad range, self-broadening leads to the considerable changes of σM and σR, which are illustrated in Fig. 4. Therefore, the correct determination of n by means of Eq. (2) has to involve the proper representation of those relationships.

Figure 4Dependence of σM and σR on water vapour concentration. Data extracted from the HITRAN database (p=1000 hPa, T=23 ∘C).
In the data evaluation, we apply the values of absorption cross section obtained with the use of the HITRAN database for p=1000 hPa, T=23 ∘C (which is HITRAN reference temperature) and various levels of water vapour concentration (see Fig. 4). Following Buchholz et al. (2017) and Wunderle et al. (2006), we assume the conservative estimation of 3.5 % as the accuracy of σ.
The dependencies σM(n) and σR(n) were parameterized with smooth functions. The accuracy of such parametrization with respect to the data points extracted from HITRAN is <0.1 %; hence its effect on the accuracy of σ is negligible. The parameterized functions σM(n) and σR(n) were used in Eq. (2), which then becomes an implicit relation to be solved numerically in order to calculate n.
3.2 Interference in the glass windows
The absorption spectrum of the glass is flat in the spectral range relevant for this study. Therefore, its influence on the measurement is negligible. However, multiple reflections of the light beam between the surfaces and the interference between the reflected beams lead to periodic oscillations in the transmission spectrum 𝒯(λ). For a single window, those fringes can be described by the formula (Demtroder, 2003)
where is the finesse coefficient and is the phase difference while ℛ, η and d denote the reflection coefficient, refractive index and thickness of the glass, respectively. If the incident light beam is perpendicular to the glass surface, then . Additional phase shift Δφ follows from the uncertainty of the glass thickness.
For typical floated borosilicate 3.3 glass (η=1.47), which was used in the LACIS-T windows, one can evaluate that the surface reflection coefficient equals ℛ=3.6 % and the finesse is about ℱ=0.16. The transmission of a single window oscillates with λ within quite a large range of around the mean value of . The period of the oscillation (i.e. wavelength difference between two neighbouring maxima) can be estimated according to an approximate formula: . The windows in LACIS-T are either 8 mm or 6 mm thick, which results in the oscillation period of Δλ=0.08 nm and Δλ=0.105 nm, respectively.
In the case of two windows (marked a and b), e.g. the two opposite windows of LACIS-T, the effective transmission coefficient is equal to
where and . The transmission 𝒯2(λ) oscillates around the mean value . The oscillation period is the same as for a single window. However, the range of oscillations depends on the relative phase shift . The largest range corresponds to Δφ2=0. The examples of 𝒯2(λ) for two different Δφ2 values are shown in Fig. 5.

Figure 5Examples of the optical interference in the glass windows of LACIS-T (d=8 mm) for n=1017 cm−3 and two different values of Δφ2.
Commonly, the described interference in the glass windows can be reduced with anti-reflection coatings applied on the glass surfaces or using thick or wedge optical windows. Exploiting Brewster angle of incidence and the light polarized parallel to the incidence plane also belongs to the possible solutions. However, all these approaches were not applicable in the case of LACIS-T due to the size of the windows (tens of square decimetres in surface) and the desire to maintain their universal purpose.
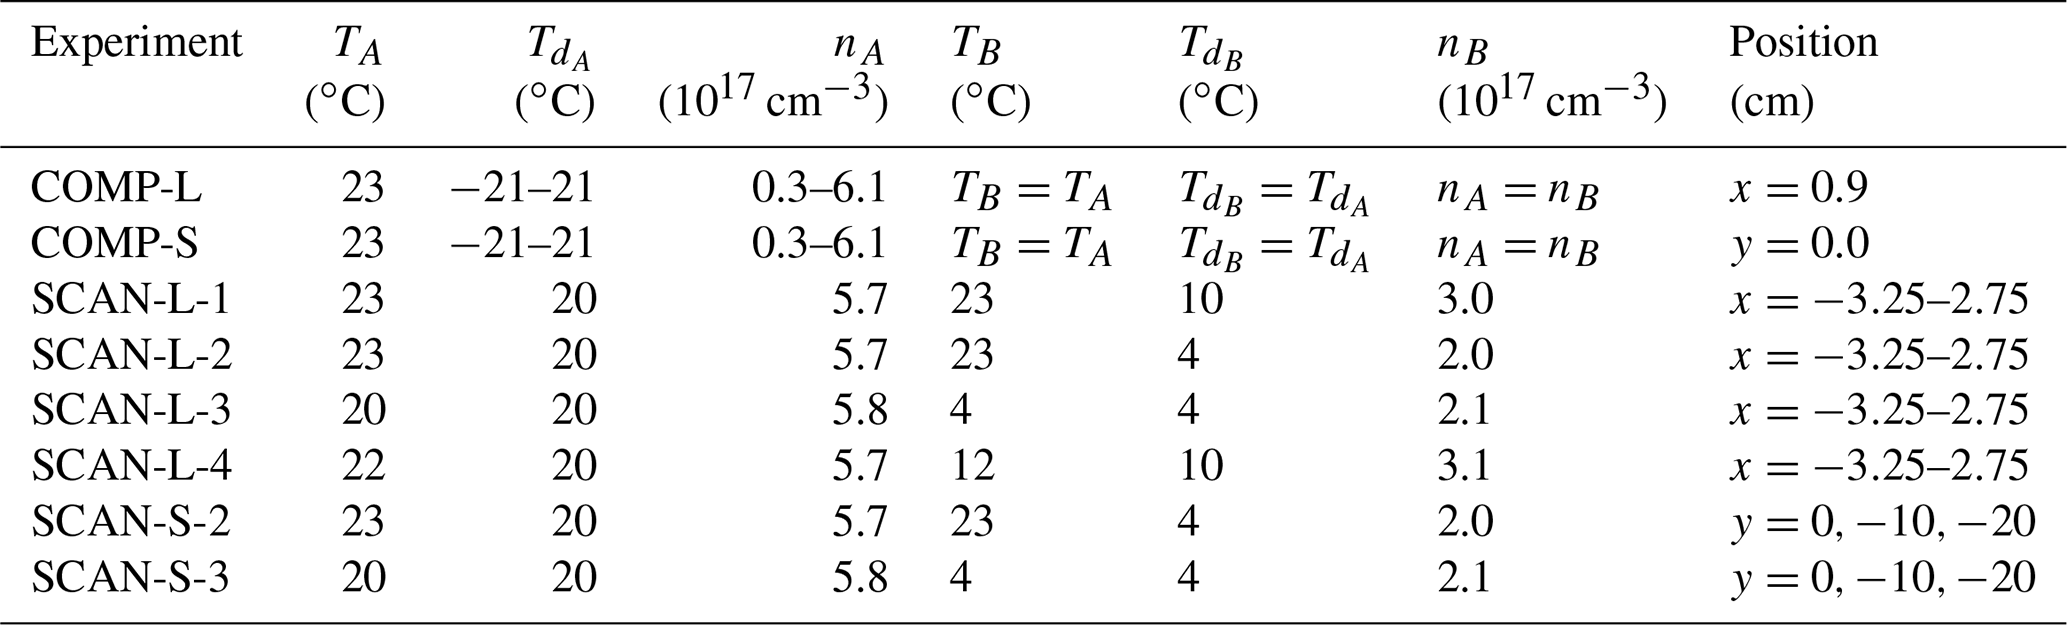
Table 1List of experiments together with the corresponding wind tunnel and FIRH settings.
In order to correct for the influence of the glass windows on the measurements with FIRH, we experimentally characterized this effect with a series of transmission scans. The wind tunnel flow was turned off, and the windows lateral to the FIRH optical path were removed so that the thermodynamic conditions inside and outside the wind tunnel were the same. At each position (see Fig. 3) used in the subsequent humidity measurements (see Table 1), the effective transmission coefficients or through the glass windows and the laboratory air were determined for the wavelengths in the range of 1364.46–1365.85 nm. The wavelength was varied with the step of 0.001 nm by adjusting the settings of the wavemeter–laser-controller stabilization loop. Analogous measurement was performed for the same path length but without the windows to obtain the transmission coefficients and through the laboratory air only. The results corresponding to sampling across the long dimension are presented in Fig. 6.
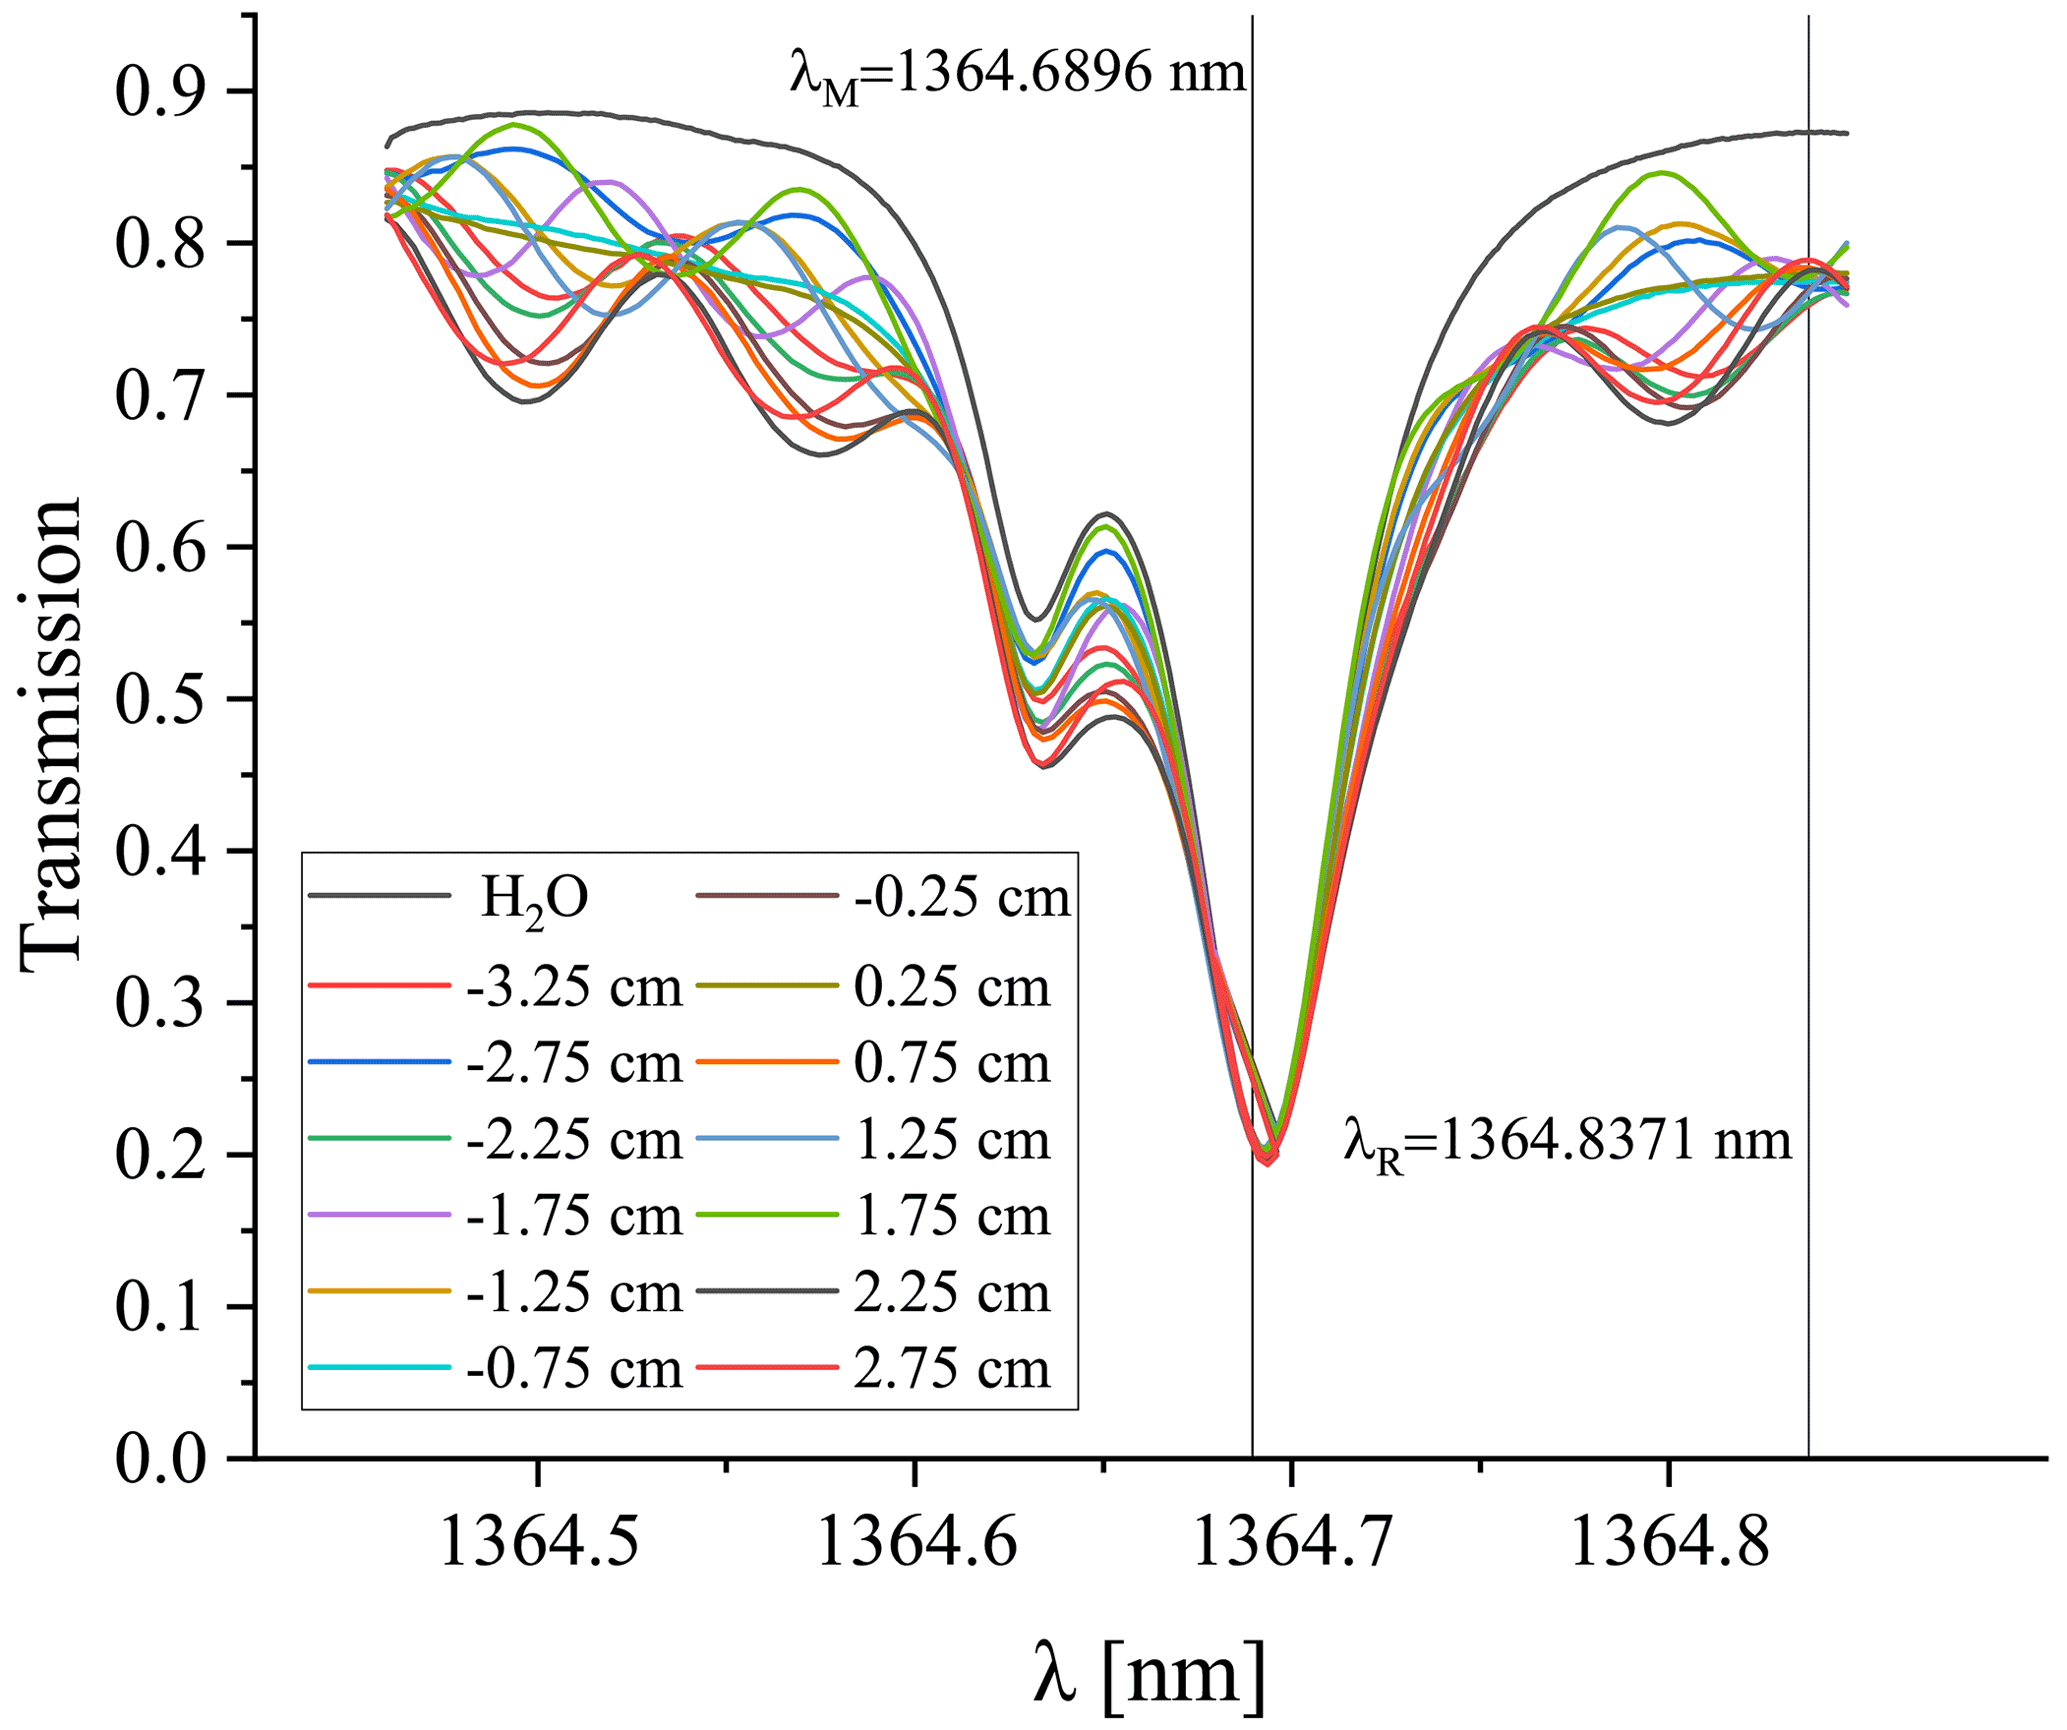
Figure 6Effective transmission spectra of the windows and laboratory air ( cm−3) for the measurements across the long dimension at various positions x compared with the transmission spectrum of the laboratory air only. Node-like features are observed on both sides of the transmission minimum. One of them is located close to λR.
Periodic oscillations due to the interference in the windows can be observed in the entire investigated range. Their phases depend on the exact position x, probably due to the imperfections of the flatness of the glass surfaces and nonuniformity of the glass plate thickness. However, the curves exhibit node-like structure, i.e. the dependence of on position becomes weak at some particular wavelengths. This is the case for λM and λR. For this reason, we decided to neglect the dependence of the interference effect on the exact position. Such a simplification is reasonable taking into account the limited accuracy of the position adjustment ( ±0.5 mm). In the case of the sampling across the short dimension of the wind tunnel, the node-like structure is not as clear, but the amplitude of the oscillations is substantially smaller (not shown), which justifies the same approach.
The transmission due to the glass windows only can be estimated as the ratio . For the wavelengths exploited in FIRH, we derived and for sampling across the long dimension and and for sampling across the short dimension. Those values can be applied as correction coefficients in order to compensate for the impact of window interference on humidity measurements. Hence, the measured PD2 signals I2 involved in Eq. (2) were replaced with to complete the correction.
3.3 Ambient conditions in the lab
As it was stated above, the emitter of the laser beam and the photodetector PD2 were mounted on the opposite sides of the wind tunnel in a way allowing for flexible scanning at different positions x or y without repeating laborious optical alignment (see Fig. 3). Unfortunately, such a solution involves a portion of the optical path outside of the wind tunnel. The absorption over the total path of cm in the laboratory air can be important in comparison with the absorption over the path L inside, in particular for low humidity in the wind tunnel. Therefore, the conditions in the lab were monitored (see Sect. 2.1) in order to account for the effect of parasitic absorption by invoking the Lambert–Beer law. It can be estimated that the ratio of parasitic absorption in the laboratory to the absorption in the wind tunnel exceeds 10 % of for about ∘C in the case of sampling across the long dimension and for about Td<3.7 ∘C in the case of sampling across the short dimension.
After including all the discussed corrections, the final formula for water vapour concentration in the wind tunnel takes the form
where the terms on the right-hand side are given by the measurements and the terms on the left-hand side are functions of n only. This equation is solved numerically to get n.
The accuracy of the measurement of water vapour concentration with FIRH was assessed with two approaches: (1) a priori – by considering the maximum potential error introduced by the factors influencing the measurement (see Sect. 3) and (2) experimental – by comparing FIRH with a reference hygrometer (MBW973) under a range of conditions.
In the first approach, we neglected the inaccuracies related to the numerical solution of Eq. (5) and the parameterization σ(n). Those are expected to contribute negligibly in comparison with the errors related to other factors: σ, L, I, 𝒯(g), Ll and nl. Considering them, we derived an approximate formula for the expected maximum measurement error by applying a common linearized approximation to the function of many variables given by Eq. (5). The resulting formula involves two terms expressing errors: relative (i.e. proportional to the value of n) and absolute (i.e. independent of n). For sampling across the long dimension, the relative error is ∼7.4 % and the absolute error is cm−3. For sampling across the short dimension, the relative error is ∼8.5 % and the absolute error is cm−3. The dominant contribution to the relative error comes from σ (followed by a smaller contribution of L) while the dominant contribution to the absolute error results from 𝒯(g) (followed by smaller contributions of I, Ll and nl). Importantly, most of the observables (σ, L, 𝒯(g), Ll, nl) can be considered fixed during a single measurement series, yet known only with limited accuracy. As a consequence, the uncertainty of n cannot be reduced by averaging many individual measurements. On the other hand, such systematic errors which are fixed over time do not affect derived turbulent fluctuations n′. Considering only the random error related to I, one would arrive at the absolute errors of ∼1015 and cm−3 for sampling across the long and short dimensions, respectively.
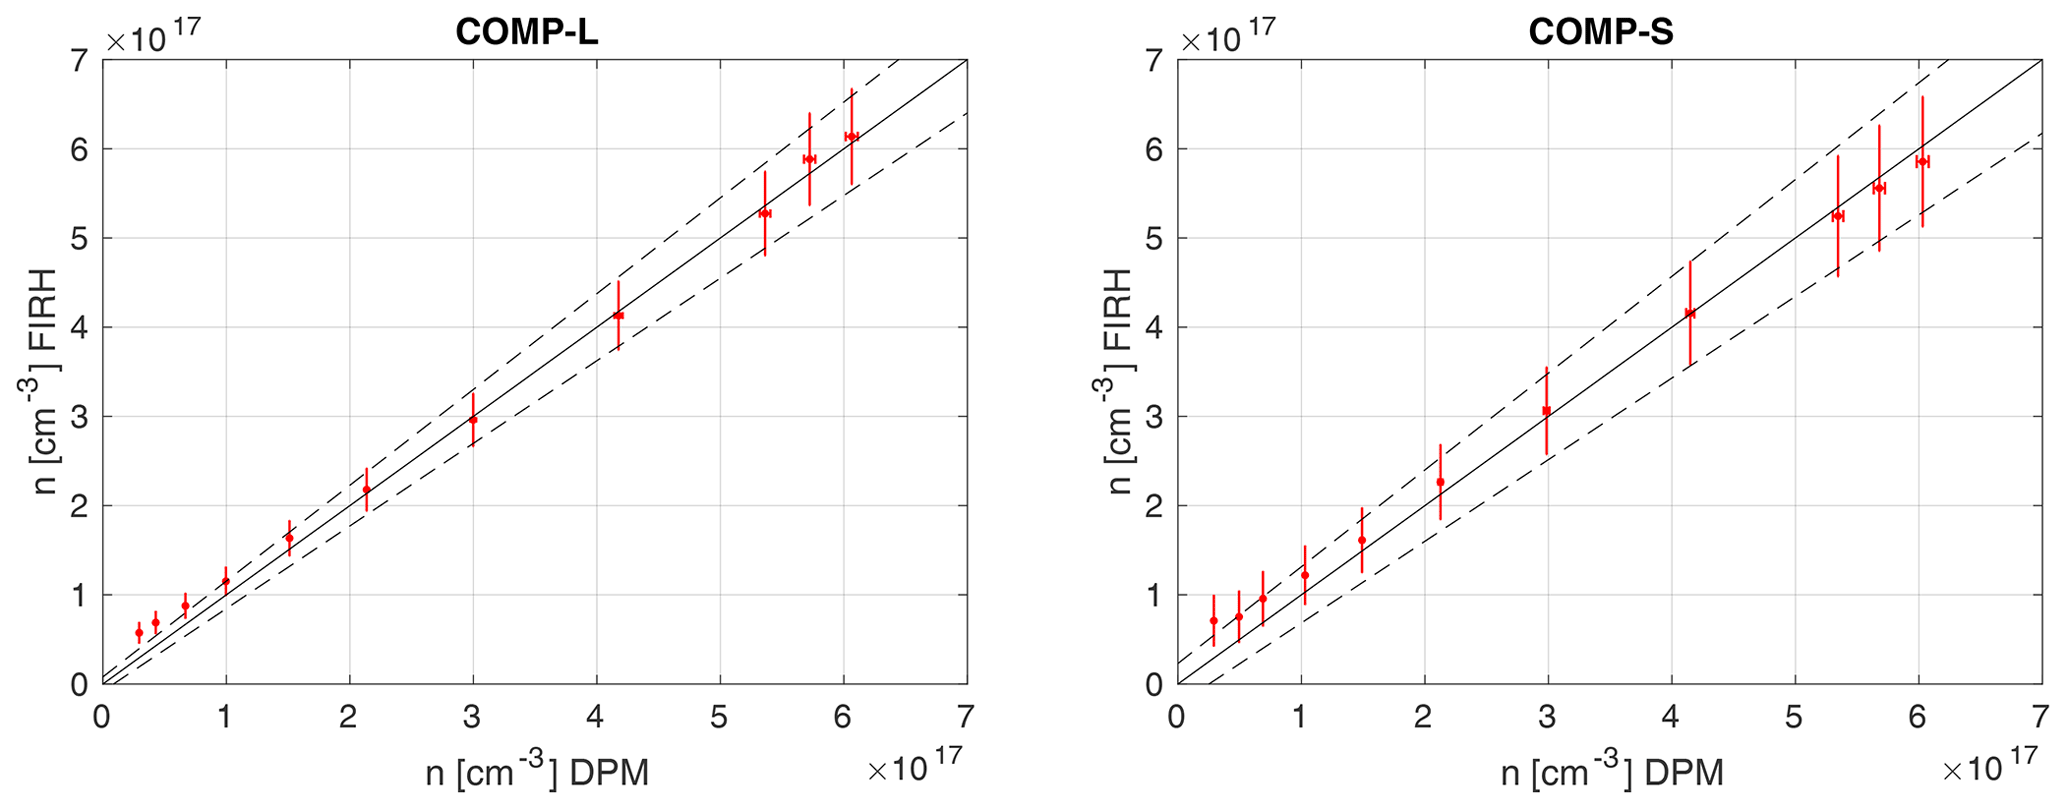
Figure 7Comparison of FIRH with DPM (MBW973). Error bars represent the estimated errors, the solid black line is the 1:1 ratio and dashed lines denote the error range expected for FIRH (see text for details).
In the second approach, we performed two comparison experiments consisting of a series of simultaneous measurements with FIRH and the dew-point mirror: across the long dimension at fixed x=0.9 cm (COMP-L) and across the short dimension at fixed y=0 cm (COMP-S); see Table 1 and Fig. 3. The inlet of the DPM tubing was located beneath the optical path of FIRH, i.e. at x=0.9 cm, y=0 cm in the experiment COMP-L and at x=0 cm, y=0 cm in the experiment COMP-S. The measurements were performed at various humidities inside the wind tunnel ( to +21 ∘C) while keeping the temperature (23 ∘C) and velocity (1.5 m s−1) fixed. The thermodynamic conditions of the two streams were set the same (TA=TB, ) to avoid the effects of mixing. For each humidity value, the records of 100 s were taken with the two instruments, and their mean values served for the comparison. The results are presented in Fig. 7. For the dew-point mirror, water vapour concentration was calculated according to Eq. (1), which leads to the accuracy of ≤0.8 % based on the instrument specifications.
In general, the measurements with the two instruments agree with each other within the estimated error range across most of the investigated humidity range. The dependence is highly linear (coefficient of determination R2>0.998) for both data series. Root-mean-squared errors are 1.6×10¹⁶ and 2.0×1016 cm−3 for COMP-L and COMP-S, respectively.
At low humidity (n<1017 cm−3, equivalent to ∘C) the values of n are overestimated by FIRH in comparison to DPM. For the case of very low humidity inside the wind tunnel, the three terms on the right-hand side of Eq. (5) representing wind tunnel absorption , window transmission and ambient air absorption (σM−σR)nlLl are of comparable magnitudes. Hence, the biases in the estimations of window transmission and ambient air absorption become particularly important for the outcome. This effect is more pronounced for COMP-L than for COMP-S due to the significantly higher (about 13 times) window transmission term (see also Sect. 3.2).
In this section, we intend to reach our second goal formulated at the beginning: characterize the humidity field and turbulent fluctuations of humidity inside LACIS-T for different settings of the wind tunnel. The previous cloud formation studies conducted at this facility included the measurements of droplet spectra as well as turbulent fluctuations of velocity and temperature (Niedermeier et al., 2020), but the properties of the humidity field, specifically its turbulent fluctuations, could not be evaluated so far. The knowledge about these fluctuations is of great importance for the understanding and interpretation of past and future cloud formation studies at LACIS-T. Therefore, we performed several measurement series named scans in order to investigate the mixing of the two air streams differing in thermodynamic properties. We selected the conditions which have already been used in former studies (Niedermeier et al., 2020).
Each scan consisted of a number of 300 s long records collected at various FIRH positions under fixed wind tunnel settings given in Table 1. The DPM tubing was displaced in steps alongside the laser beam of FIRH so that the tubing inlet was beneath the FIRH optical path. Two scans across the long dimension of the measurement section, i.e. at different x positions (see Sect. 2.2), explored the mixing of the streams under isothermal conditions (TA=TB) but different humidity (SCAN-L-1 and SCAN-L-2). Another two scans across the long dimension investigated the mixing of the streams differing in both temperature and humidity (SCAN-L-3 and SCAN-L-4). The conditions in SCAN-L-3 allowed for creating a supersaturated mixture. Those four scans across the long dimension, each consisting of 13 positions x, were followed by two scans across the short dimension, i.e. at different y positions (see Sect. 2.2), each consisting of three positions y only, as no significant differences for the measurements with the laser beam averaging along the humidity gradient were expected. SCAN-S-2 and SCAN-S-3 were performed under the same settings of the wind tunnel as SCAN-L-2 and SCAN-L-3.
5.1 Mean conditions
The results of the scans across the long dimension – mean n and its variance – are presented in Fig. 8. The mean n exhibits a significant systematic offset (shift) between FIRH and DPM in all four experiments. Several factors could contribute to the observed offset: (1) the limited accuracy of FIRH (see Sect. 4), (2) displacements and misalignments between the FIRH optical path and the DPM inlet (i.e. inaccuracy in setting x position, angular deviation of the FIRH path from the desired direction in the plane , deliberate shift in z between the sensors), and (3) difference in sampling regime between the instruments (in fact FIRH involves spatial low-pass filtering, i.e. averaging along the optical path, but provides high temporal resolution while DPM involves temporal low-pass filtering of complex characteristics but collects air from a relatively small volume). The offset is higher than observed in the comparison experiments COMP-L and COMP-S, likely due to the significant spatial gradient of humidity (up to 2×1017 cm−4). Such a gradient was absent in those comparison experiments, but here, due to factors (2) and (3), it affects the outcome. For scans across the short dimension, FIRH averages along the humidity gradient. Therefore, direct comparison of the measurement results is not justified.
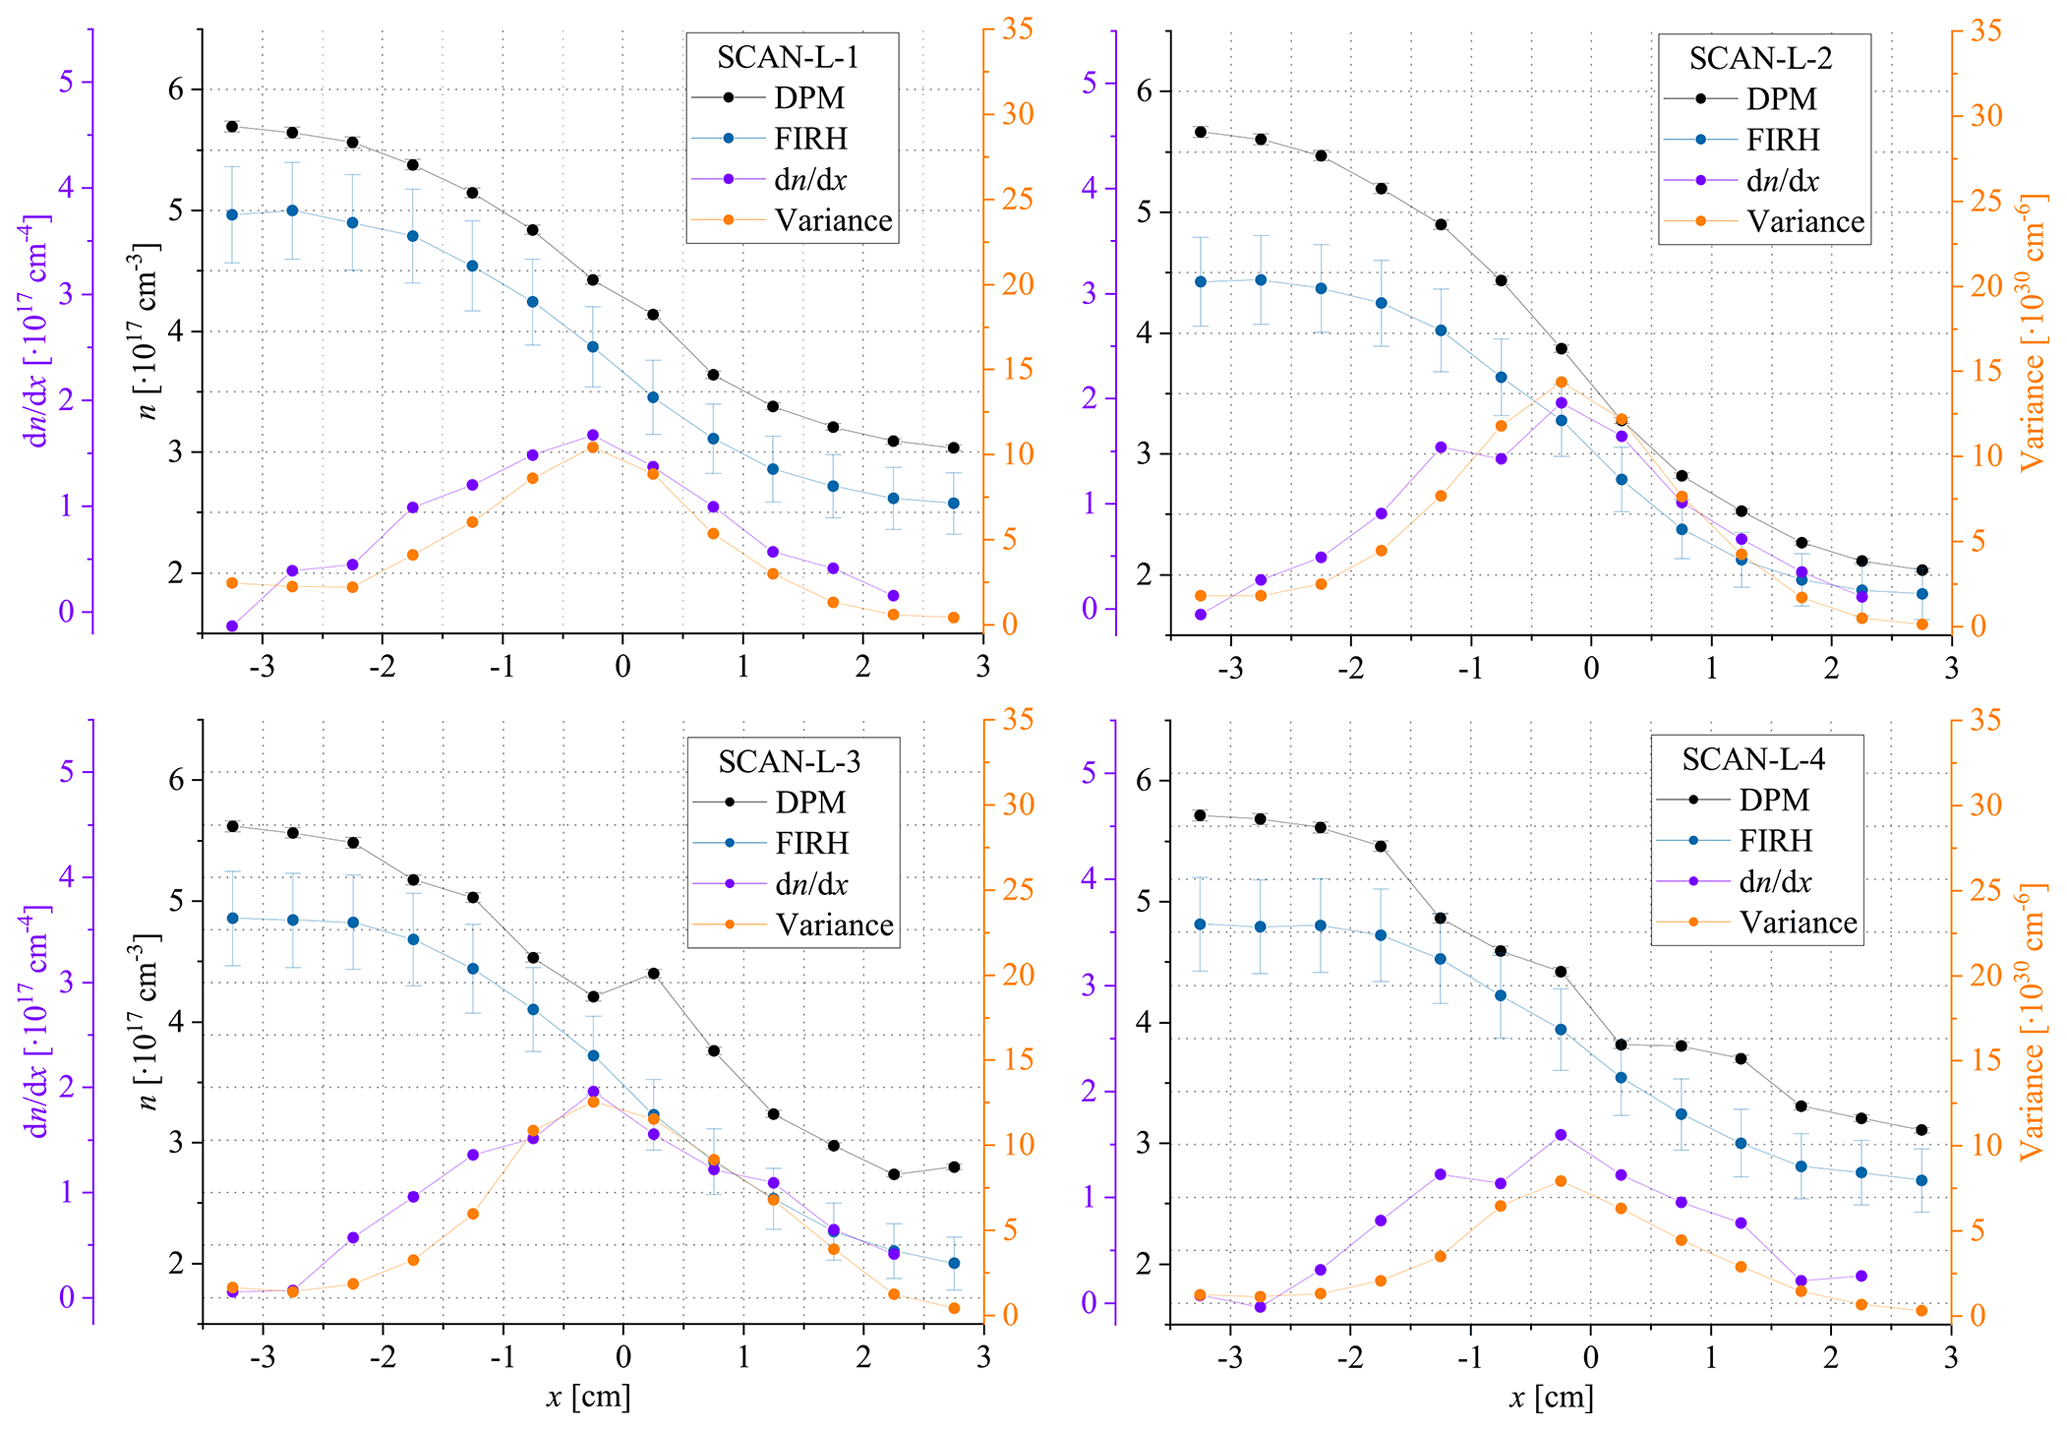
Figure 8Turbulent mixing of the two streams differing in thermodynamic properties (given in Table 1) observed in the course of the four experiments: the profiles of mean n and its variance and gradient with respect to the position x.
In the course of SCAN-L-3, SCAN-L-4 and SCAN-S-3, water vapour was observed to condense on the DPM inlet and cause malfunctions of this instrument, which explains irregularities in the DPM profiles in Fig. 8. This observation underlines an advantage of the contactless measurements with FIRH performed from outside the measurement section of the wind tunnel.
5.2 Turbulent fluctuations
High temporal resolution provided by FIRH allows the characterization of not only the profile of the mean humidity across the measurement volume but also the properties of turbulent fluctuations in the course of mixing of the two streams. It should be noted, however, that the measured fluctuations represent instantaneous, yet spatially averaged (along the optical path), humidities.
As expected, the variance is highest in the central part of the wind tunnel. Maximum variance coincides with the steepest gradient of the mean humidity. Variance reaches higher values for the experiments with a larger difference in n between the streams (i.e. SCAN-L-2 and SCAN-L-3; see Table 1). Based on the variance profile, the width of the turbulent mixing zone at the height of our measurement is ∼5 cm, in agreement with Fig. 6 in Niedermeier et al. (2020).
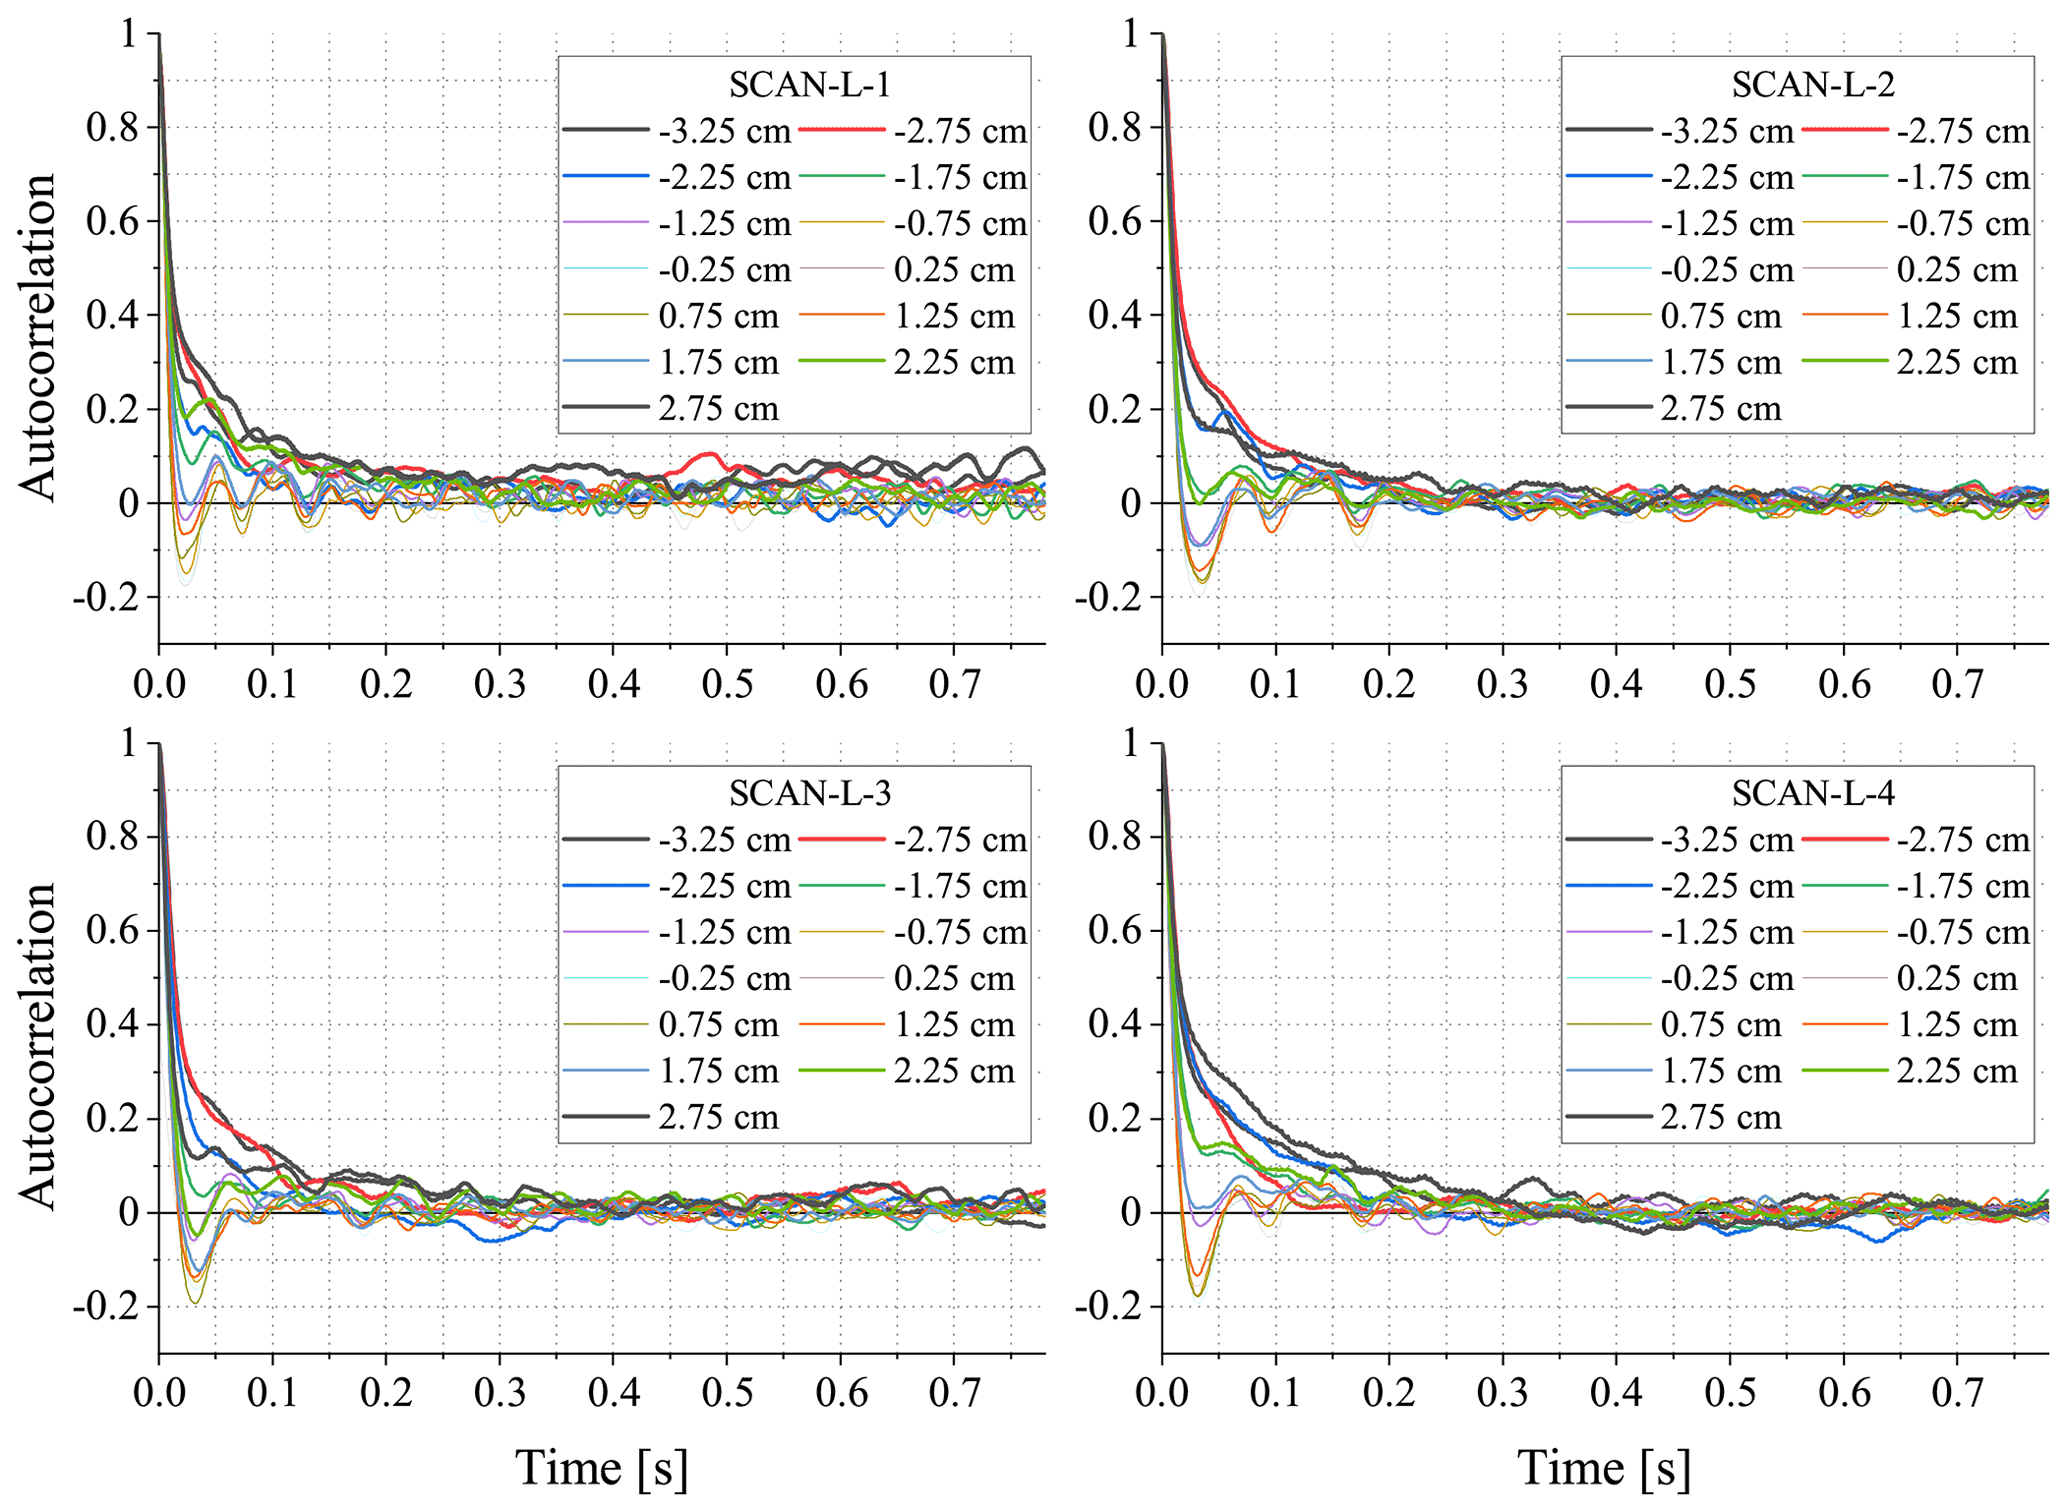
Figure 9Autocorrelation functions of the time series n(t) recorded at various positions x during the four scans differing in the thermodynamic properties of the input streams (see Table 1 for wind tunnel settings). Thinner lines correspond to the positions close to the centre while thicker lines represent the distant ones.
Recorded humidity fluctuations were further analysed with the use of autocorrelation functions (ACFs) and power spectral densities (PSDs) derived for individual time series n(t). ACFs for the four experiments from SCAN-L-1 to SCAN-L-4 are given in Fig. 9. The plots clearly indicate the dependence of the fluctuation on the position in the wind tunnel. Close to the centre ( cm), ACFs decrease rapidly to cross zero at ∼0.018 s, reach maximum negative autocorrelation at ∼0.03 s and vary around zero for larger time lags, suggesting the presence of oscillations in the flow which are coherent enough along the y direction to be detected in averaged signals. The oscillations are weak and vanish at a distance from the central plane ( cm). Outside the central part, ACFs decrease more slowly, almost monotonically, and reach zero at ∼0.25 s. This behaviour is subject to some variability with respect to the experiment, the side of the wind tunnel and the distance from the central plane.
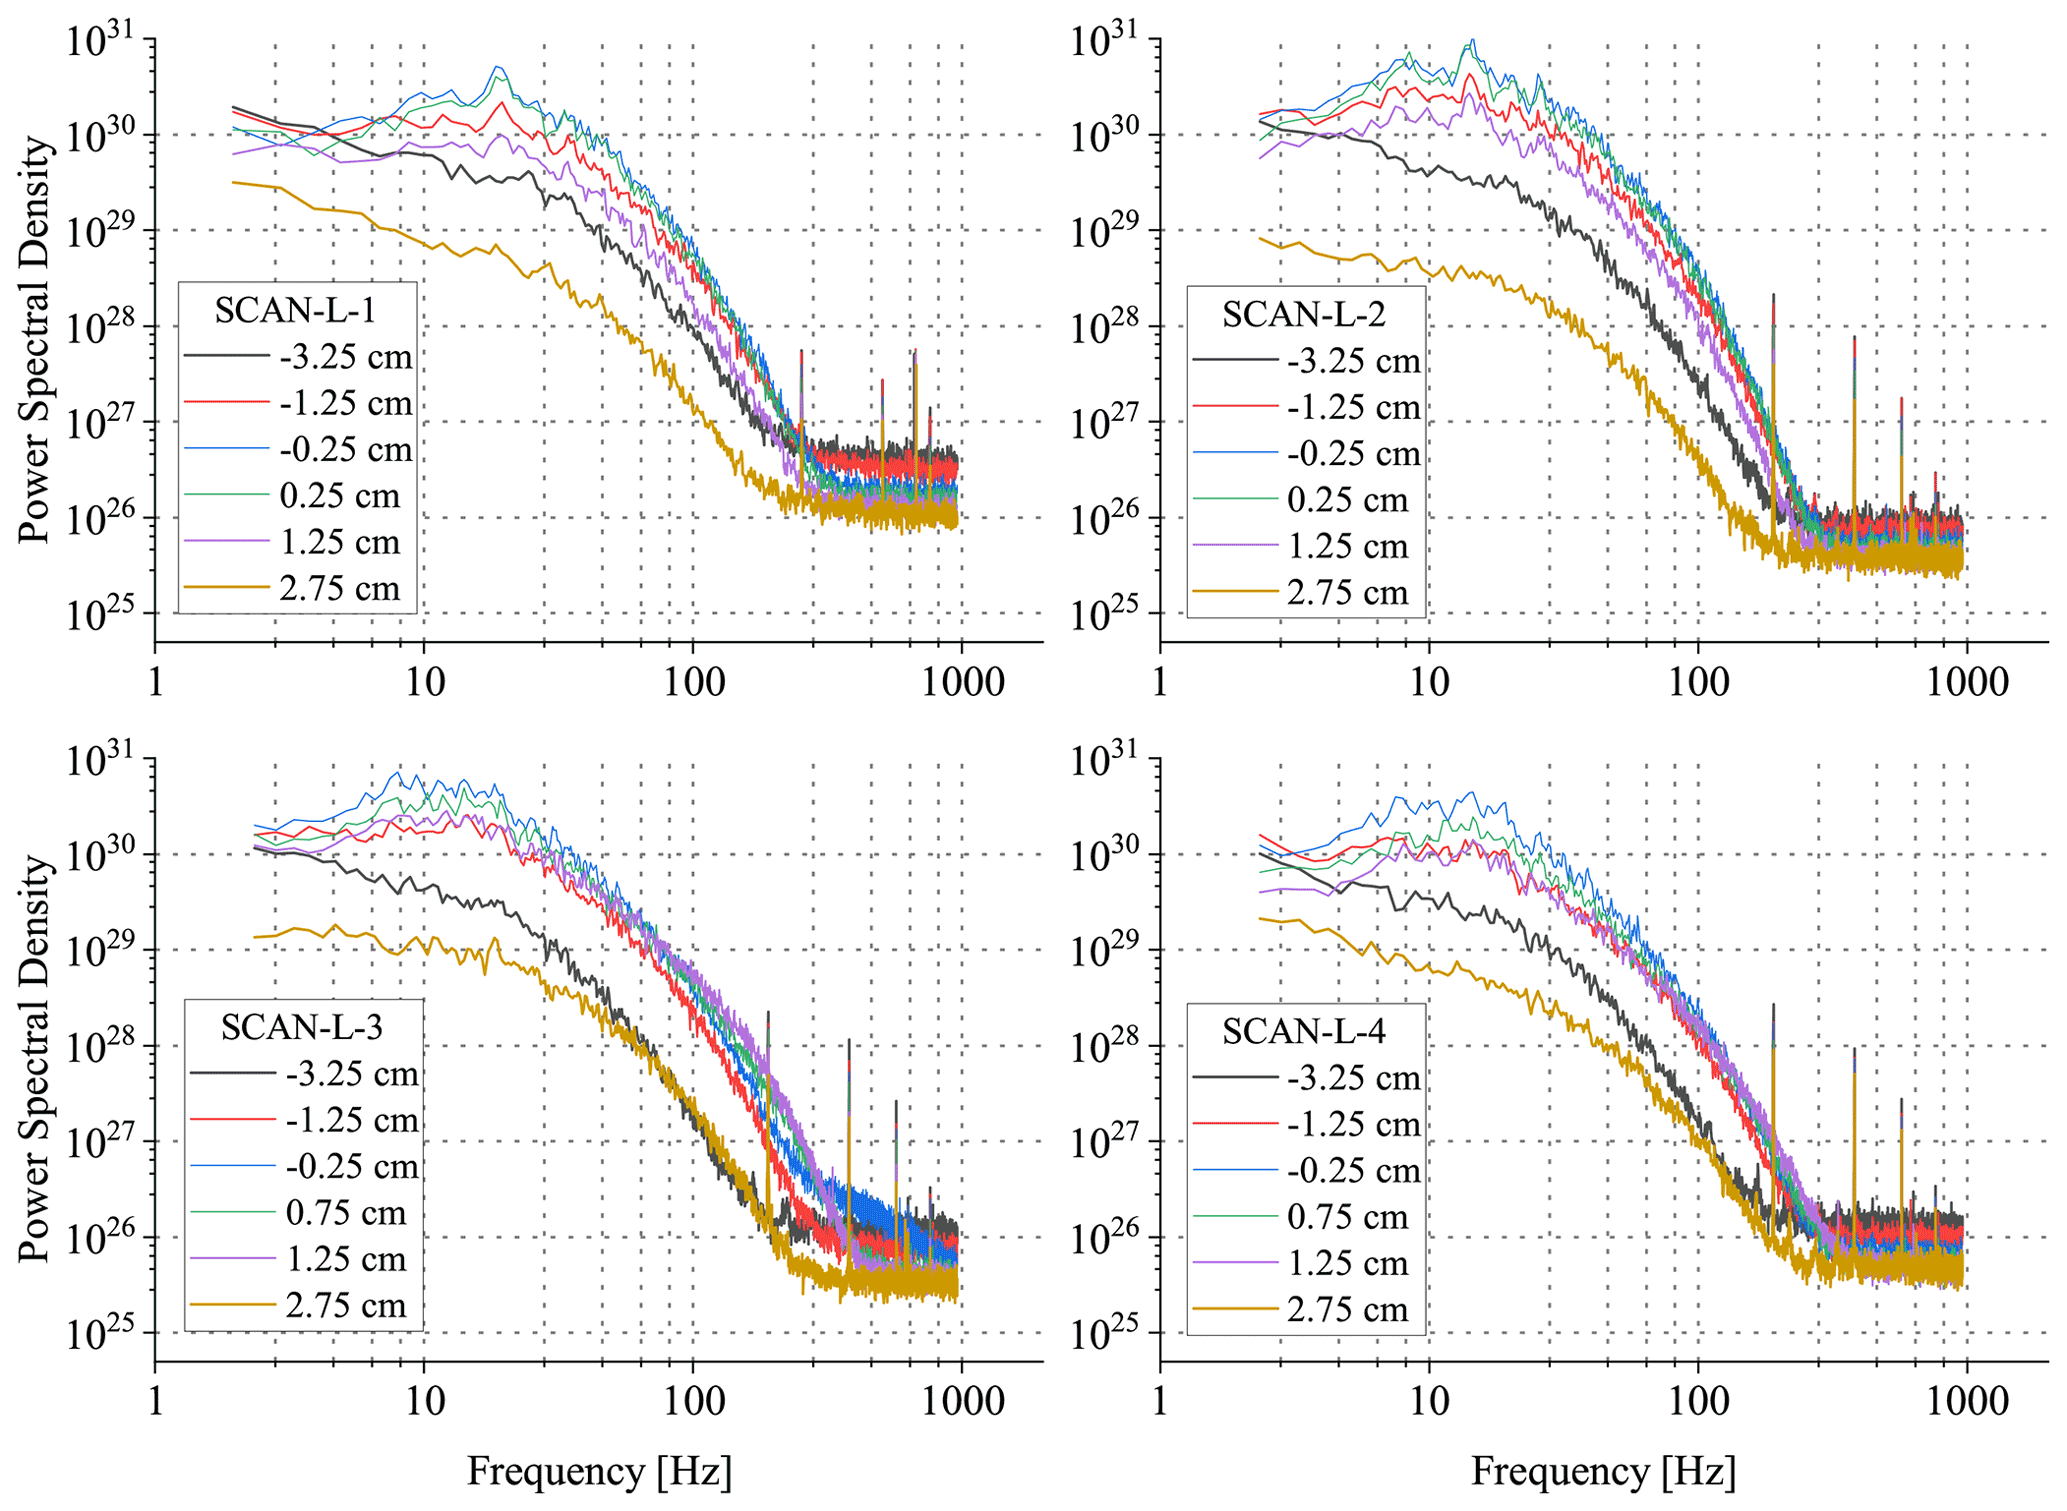
Figure 10Power spectral densities of the selected time series n(t) recorded at various positions x during the four scans.
PSDs of the same time series are presented in Fig. 10. Close to the centre ( cm), the PSDs exhibit a maximum at ∼14 Hz, which is more pronounced in the case of isothermal conditions (SCAN-L-1 and SCAN-L-2) in comparison with non-isothermal ones (SCAN-L-3 and SCANLX-4), which stays in accordance with the more regular fluctuations in the corresponding ACFs. Assuming Taylor frozen flow hypothesis and using the mean flow velocity 1.5 m s−1, this frequency corresponds to the wavelength of ∼11 cm.
The characteristic frequency of ∼14 Hz identified in the signals might be related either to the effect of humidity changes inside air volumes or to flow velocity variations. We suppose the latter is more likely because when the aerosol flow in between the two streams is disabled (which is the case for our study), the profile of mean velocity in the central part of the wind tunnel becomes inhomogeneous; see Sect. 4.1 in Niedermeier et al. (2020). The spatial extent of this inhomogeneity presented there is ≤4 cm (along the x direction). In order to investigate how such local mean velocity gradients in the central part affect the statistics averaged across the entire width, a separate experiment needs to be designed which would then explain the mechanism responsible for the observed PSDs and ACFs. Importantly, the cloud formation studies at LACIS-T are unaffected by the mean velocity gradients because the configuration for cloud measurements involves enabled aerosol flow, which provides homogeneous mean velocity profile in the central part (Niedermeier et al., 2020).
The results of SCAN-S-3 are given in Figs. 11 and 12. They are similar to SCAN-S-2, which is therefore not shown here. As noted before, the fluctuations recorded for this orientation are difficult to interpret due to the effective averaging along the humidity gradient. At y=0 cm and cm, the ACFs and PSDs indicate a significant contribution of the mode of the frequency of ∼47 Hz and several others of higher frequencies. This mode is the strongest for cm while the further ones (e.g. at ∼111 Hz) are the strongest in the case of y=0 cm. The observed complicated spectra might result from the combination of two effects. First, during the experiments, an additional inlet tubing for a second DPM (also MBW 973) was installed close behind the turbulence grid, at the position of cm. This tubing, being right in between the two measurement positions y=0 and −10 cm, most likely caused flow disturbances, which in the environment of strong gradient led to increased humidity fluctuations. This is an important finding, so the tubing will be removed in future studies to avoid its influence on the flow. On the other hand, the minor vibrations of the windows (either 339 mm ×1148 mm ×6 mm or 584 mm ×1148 mm ×8 mm were used) can affect, in a complicated manner, the instantaneous net transmission discussed in Sect. 3.2. Because we do not consider such transient effects in our correction method, the vibrations of the windows can influence the signal recorded by FIRH to a minor extent. Yet, it is unlikely that those vibrations change the humidity patterns inside the chamber.
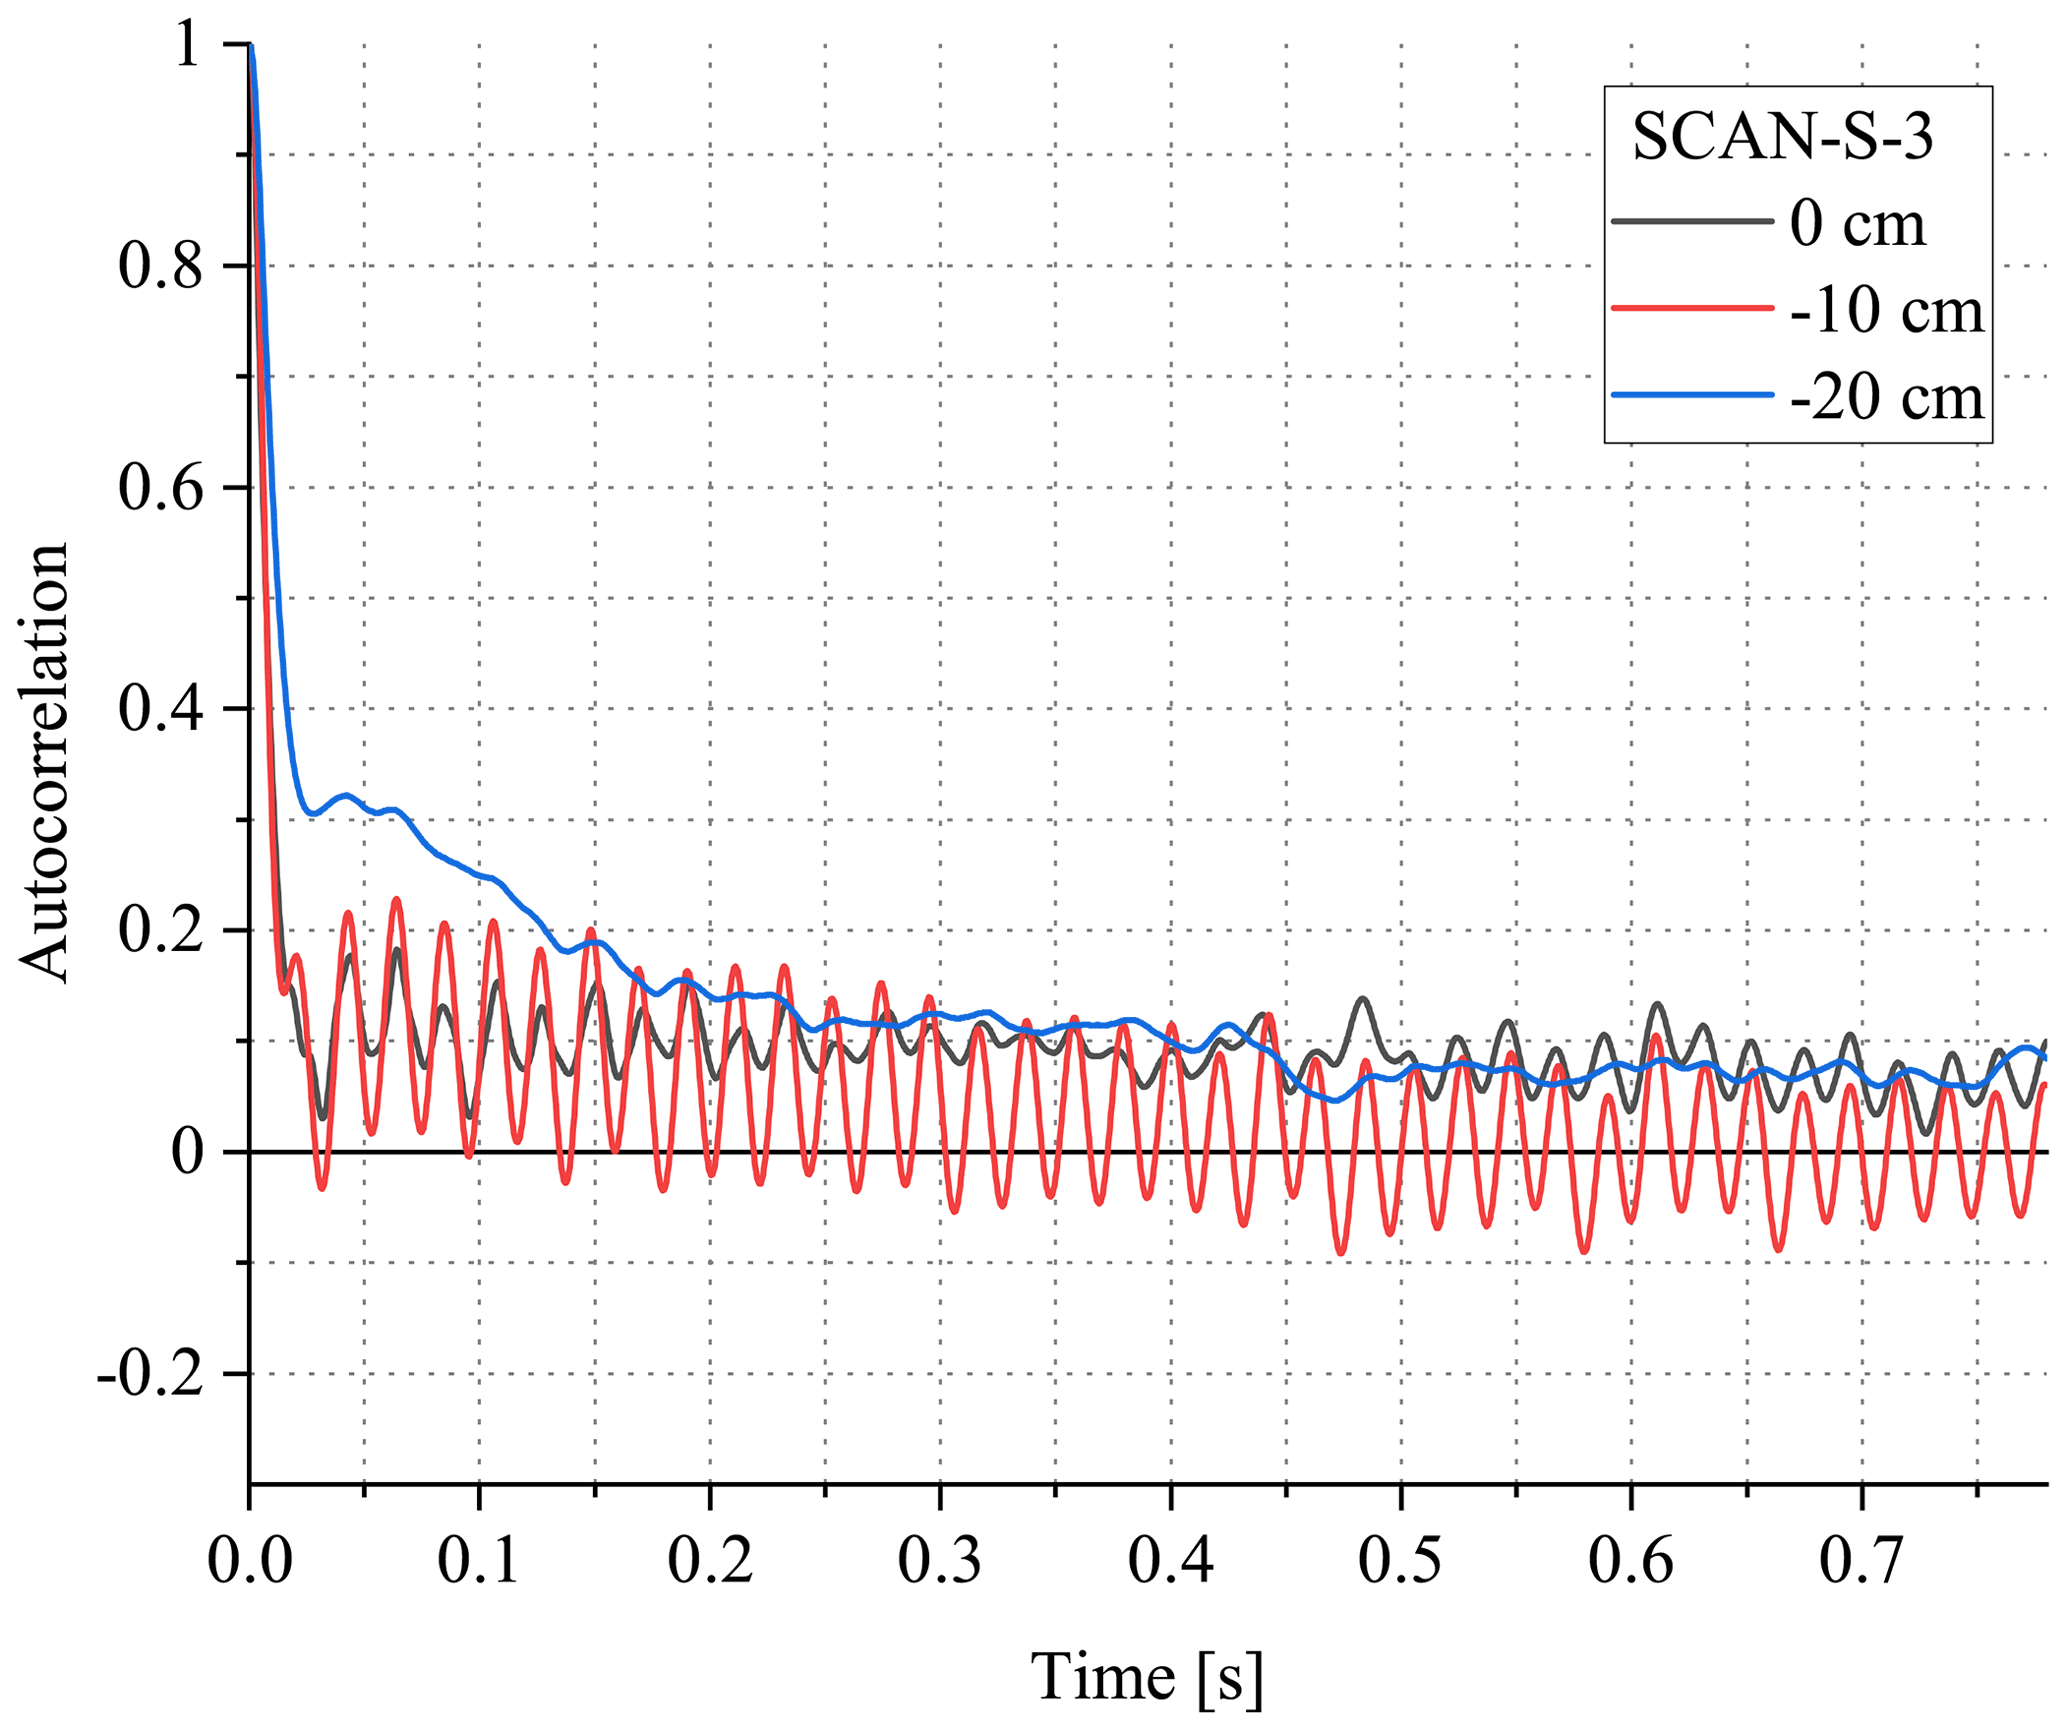
Figure 11Autocorrelation functions of the time series n(t) recorded at various positions y during SCAN-S-3.
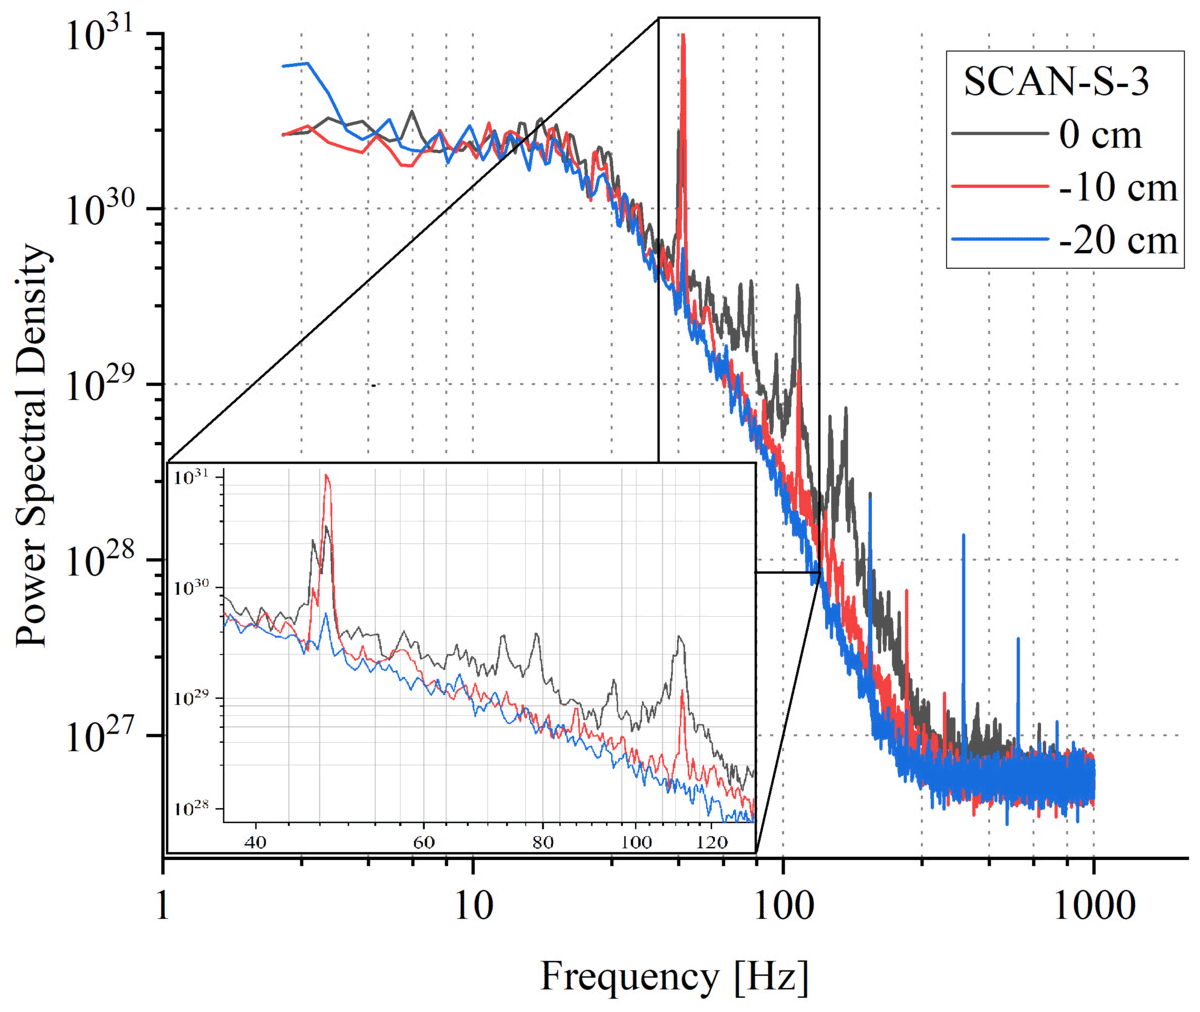
Figure 12Power spectral densities of the time series n(t) recorded at various positions y during SCAN-S-3. The insert shows the peaks in the spectrum described in the text.
At the frequency of ∼150 Hz, the PSDs reach the noise floor. For the scans across the long dimension, floor level slightly increases with increasing mean humidity, probably due to the combination of two effects: a decrease in the mean signal at the photodetector with increasing mean humidity (stronger absorption along the path) and different influence on the signal of dry intrusion into the humid environment at negative x (small change in total absorption) versus humid intrusion into the dry environment at positive x (significant change in total absorption). At the extreme positions, the noise floor is reached at lower frequencies than for the positions in the middle because there is only a minor humidity gradient outside the mixing zone (see Fig. 8). For the scans across the short dimension, the noise floor is higher than for the scans across the long dimension due to the weaker sensitivity related to a shorter optical path. The estimated standard deviations due to uncorrelated noise are in the range of 0.3–1×1015 cm−3, which is close to our prediction of the random error given in Sect. 4. Several distinct peaks visible at the higher end of the spectra are probably related to electrical interferences.
We adapted FIRH, an instrument employing open-path tunable diode laser absorption spectroscopy, to perform humidity measurements in the LACIS-T wind tunnel. This application realizes a contactless optical sampling from outside the measurement volume which eliminates the influence of the sensor on the investigated processes. The configuration of the setup allows for scanning at both transverse orientations: across the long and short dimensions of the rectangular measurement section of LACIS-T.
Three major physical factors which strongly influence the measurement were identified: self-broadening of the absorption line, interference in the glass windows and parasitic absorption in the ambient air outside the measurement volume. We developed correction methods which satisfactorily account for these effects.
The accuracy of the measurement of water vapour concentration was assessed with the two approaches: a priori – taking into account the errors introduced by instrumental and external factors, and experimental – comparing FIRH with a reference hygrometer. For sampling across the long dimension, the expected relative and absolute errors are 7.4 % and 8×1015 cm−3. For sampling across the short dimension, those errors are 8.5 % and 2.3×1016 cm−3, respectively. The dominant contribution to the relative error comes from the inaccuracy of the absorption cross section. The dominant contribution to the absolute error results from the uncertain window transmission. The comparison between FIRH and DPM indicated that the two instruments agree well within the expected error range across the most of the investigated humidity range n=0.3–6.1×1017 cm−3, which is equivalent to to +21 ∘C at T=23 ∘C. Only at low humidity (n<1017 cm−3, equivalent to ∘C) are the values overestimated by FIRH due to the decisive impact of window transmission and ambient air absorption.
The properties of the humidity field in the course of the turbulent mixing of the two air streams differing in temperature and humidity were studied with FIRH and DPM for different settings of the wind tunnel which have been used in former cloud formation studies at this facility (Niedermeier et al., 2020). Thanks to the high temporal resolution of FIRH (∼2 kHz), we analysed the statistics of the turbulent humidity fluctuations in the mixing zone, which was not possible with the instruments available in the previous studies. The results on humidity fluctuations complement the previous characterizations of turbulent velocity and temperature fields as well as droplet spectra (Niedermeier et al., 2020), which is of importance for past and future cloud formation studies at LACIS-T. However, the interpretation of FIRH measurements in the context of the processes studied at LACIS-T is not straightforward because it yields the values averaged over the length of the optical path, in contrast to the localized measurements of velocity or temperature (e.g. with hot- and cold-wire devices).
The profiles of mean n across the mixing zone measured with the two instruments exhibit a similar shape; however there is a systematic offset between them. We attributed it to the limited accuracy of FIRH, the displacement of the DPM inlet with respect to the FIRH optical path and the inherent difference in sampling regimes relevant for those instruments. Those factors gain particular importance in the environment of a strong humidity gradient. In the experiments where conditions allowed for the mixture of the two streams to become close to saturation or even reach supersaturation, water vapour was observed to condense on the DPM inlet and cause malfunctions of this instrument. The contactless measurement with FIRH performed from outside the wind tunnel is not affected by such an issue as long as there is no condensate already suspended in the air. The variance of n(t) reaches a maximum in the central part, which coincides with the strongest humidity gradient. It is higher for larger differences of initial n between the two input streams. The width of the mixing zone is ∼5 cm, in agreement with temperature fluctuation measurements performed by Niedermeier et al. (2020).
Flexible contactless sampling was achieved at the cost of non-negligible parasitic absorption and window transmission effects. These factors limit the accuracy and complicate the measurement and data evaluation procedures. It would be desirable to reduce their influence in future application, e.g. with anti-reflective coatings or the integration of an emitter and detector into the windows.
The inherent limitation for the application of FIRH is the requirement of stationary conditions, because in the present configuration the records for the absorbing λM and reference λR wavelengths need to be collected consecutively. LACIS-T ensures such stationarity; however this might not be the case for other laboratory facilities or field measurements. Another advancement which would come along with simultaneous differential sampling is the capability of a reliable measurement of air humidity despite cloud droplets present in the optical path. Currently, we are working on improvements to overcome this limitation and examining the signatures of droplets penetrating the optical path.
The data corresponding to the figures are available in the repository (https://doi.org/10.18150/08X1HO, Nowak et al., 2022). The measurement records collected within this study are available from the authors upon request.
JLN, DN, TS, SPM and FS designed the study. TS, JM and RG adapted and prepared the FIRH instrument for the application at LACIS-T. JLN, DN, TS, JM, RG, LO, SS, JV and WF performed the measurements. RG and JLN processed and analysed the collected data with advice from TS and SPM. JLN, TS and RG wrote the manuscript with contributions from SPM and DN. All authors critically proofread and revised the manuscript.
At least one of the (co-)authors is a member of the editorial board of Atmospheric Measurement Techniques. The peer-review process was guided by an independent editor, and the authors also have no other competing interests to declare.
Publisher's note: Copernicus Publications remains neutral with regard to jurisdictional claims in published maps and institutional affiliations.
This project has received funding from the European Union's Horizon 2020 research and innovation programme through the EUROCHAMP-2020 Infrastructure Activity under grant agreement no. 730997. The development of the FIRH instrument was supported by the Polish National Science Center (NCN) under grant agreement no. 2016/23/B/ST7/03441.
This paper was edited by Mingjin Tang and reviewed by two anonymous referees.
Anderson, J. C., Thomas, S., Prabhakaran, P., Shaw, R. A., and Cantrell, W.: Effects of the large-scale circulation on temperature and water vapor distributions in the Π Chamber, Atmos. Meas. Tech., 14, 5473–5485, https://doi.org/10.5194/amt-14-5473-2021, 2021. a
Beaton, S. P. and Spowart, M.: UV Absorption Hygrometer for Fast-Response Airborne Water Vapor Measurements, J. Atmos. Ocean. Tech., 29, 1295–1303, https://doi.org/10.1175/JTECH-D-11-00141.1, 2012. a
Buchholz, B., Afchine, A., Klein, A., Schiller, C., Krämer, M., and Ebert, V.: HAI, a new airborne, absolute, twin dual-channel, multi-phase TDLAS-hygrometer: background, design, setup, and first flight data, Atmos. Meas. Tech., 10, 35–57, https://doi.org/10.5194/amt-10-35-2017, 2017. a, b
Chandrakar, K. K., Cantrell, W., Chang, K., Ciochetto, D., Niedermeier, D., Ovchinnikov, M., Shaw, R. A., and Yang, F.: Aerosol indirect effect from turbulence-induced broadening of cloud-droplet size distributions, P. Natl. Acad. Sci. USA, 113, 14243–14248, https://doi.org/10.1073/PNAS.1612686113, 2016. a
Chandrakar, K. K., Cantrell, W., Ciochetto, D., Karki, S., Kinney, G., and Shaw, R. A.: Aerosol removal and cloud collapse accelerated by supersaturation fluctuations in turbulence, Geophys. Res. Lett., 44, 4359–4367, https://doi.org/10.1002/2017GL072762, 2017. a
Chandrakar, K. K., Cantrell, W., and Shaw, R. A.: Influence of Turbulent Fluctuations on Cloud Droplet Size Dispersion and Aerosol Indirect Effects, J. Atmos. Sci., 75, 3191–3209, https://doi.org/10.1175/JAS-D-18-0006.1, 2018. a
Chang, K., Bench, J., Brege, M., Cantrell, W., Chandrakar, K., Ciochetto, D., Mazzoleni, C., Mazzoleni, L. R., Niedermeier, D., and Shaw, R. A.: A Laboratory Facility to Study Gas–Aerosol–Cloud Interactions in a Turbulent Environment: The Π Chamber, B. Am. Meteorol. Soc., 97, 2343–2358, https://doi.org/10.1175/BAMS-D-15-00203.1, 2016. a
Chen, S. and Krueger, S.: Cloud Chamber Simulation Case for the International Cloud Modeling Workshop: Modeling Aerosol-Cloud-turbulence Interactions in the Pi Chamber, International Conference on Clouds and Precipitation 2021, 26–30 July 2021, Online, 2021. a
Conway, E. K., Gordon, I. E., Kyuberis, A. A., Polyansky, O. L., Tennyson, J., and Zobov, N. F.: Calculated line lists for and with extensive comparisons to theoretical and experimental sources including the HITRAN2016 database, J. Quant. Spectrosc. Ra., 241, 106711, https://doi.org/10.1016/J.JQSRT.2019.106711, 2020. a
Demtroder, W.: Laser spectroscopy: basic concepts and instrumentation, 3rd edn., Springer, https://doi.org/10.1007/978-3-662-05155-9, 2003. a, b
Desai, N., Chandrakar, K. K., Chang, K., Cantrell, W., and Shaw, R. A.: Influence of Microphysical Variability on Stochastic Condensation in a Turbulent Laboratory Cloud, J. Atmos. Sci., 75, 189–201, https://doi.org/10.1175/JAS-D-17-0158.1, 2018. a
Diskin, G. S., Podolske, J. R., Sachse, G. W., and Slate, T. A.: Open-path airborne tunable diode laser hygrometer, in: Diode Lasers and Applications in Atmospheric Sensing, vol. 4817, edited by: Fried, A., SPIE, 196–204, https://doi.org/10.1117/12.453736, 2002. a
Fahey, D. W., Gao, R.-S., Möhler, O., Saathoff, H., Schiller, C., Ebert, V., Krämer, M., Peter, T., Amarouche, N., Avallone, L. M., Bauer, R., Bozóki, Z., Christensen, L. E., Davis, S. M., Durry, G., Dyroff, C., Herman, R. L., Hunsmann, S., Khaykin, S. M., Mackrodt, P., Meyer, J., Smith, J. B., Spelten, N., Troy, R. F., Vömel, H., Wagner, S., and Wienhold, F. G.: The AquaVIT-1 intercomparison of atmospheric water vapor measurement techniques, Atmos. Meas. Tech., 7, 3177–3213, https://doi.org/10.5194/amt-7-3177-2014, 2014. a
Flatau, P., Walko, R., and Cotton, W.: Polynomial fits to saturation vapor pressure, J. Appl. Meteorol., 31, 1507–1513, https://doi.org/10.1175/1520-0450(1992)031<1507:PFTSVP>2.0.CO;2, 1992. a
Haman, K. E., Malinowski, S. P., Kurowski, M. J., Gerber, H., and Brenguier, J.-L.: Small scale mixing processes at the top of a marine stratocumulus – a case study, Q. J. Roy. Meteor. Soc., 133, 213–226, https://doi.org/10.1002/qj.5, 2007. a
Krämer, M., Schiller, C., Afchine, A., Bauer, R., Gensch, I., Mangold, A., Schlicht, S., Spelten, N., Sitnikov, N., Borrmann, S., de Reus, M., and Spichtinger, P.: Ice supersaturations and cirrus cloud crystal numbers, Atmos. Chem. Phys., 9, 3505–3522, https://doi.org/10.5194/acp-9-3505-2009, 2009. a
Lisak, D. and Hodges, J.: High-resolution cavity ring-down spectroscopy measurements of blended H2O transitions, Appl. Phys. B, 88, 317–325, https://doi.org/10.1007/S00340-007-2691-X, 2007. a
Lisak, D., Havey, D. K., and Hodges, J. T.: Spectroscopic line parameters of water vapor for rotation-vibration transitions near 7180 cm−1, Phys. Rev. A, 79, 052507, https://doi.org/10.1103/PhysRevA.79.052507, 2009. a
Malinowski, S. P., Gerber, H., Jen-La Plante, I., Kopec, M. K., Kumala, W., Nurowska, K., Chuang, P. Y., Khelif, D., and Haman, K. E.: Physics of Stratocumulus Top (POST): turbulent mixing across capping inversion, Atmos. Chem. Phys., 13, 12171–12186, https://doi.org/10.5194/acp-13-12171-2013, 2013. a
Matthews, A. J., Baranowski, D. B., Heywood, K. J., Flatau, P. J., and Schmidtko, S.: The Surface Diurnal Warm Layer in the Indian Ocean during CINDY/DYNAMO, J. Climate, 27, 9101–9122, https://doi.org/10.1175/JCLI-D-14-00222.1, 2014. a
May, R. D.: Open-path, near-infrared tunable diode laser spectrometer for atmospheric measurements of H2O, J. Geophys. Res.-Atmos., 103, 19161–19172, https://doi.org/10.1029/98JD01678, 1998. a
Metzger, S., Burba, G., Burns, S. P., Blanken, P. D., Li, J., Luo, H., and Zulueta, R. C.: Optimization of an enclosed gas analyzer sampling system for measuring eddy covariance fluxes of H2O and CO2, Atmos. Meas. Tech., 9, 1341–1359, https://doi.org/10.5194/amt-9-1341-2016, 2016. a
Meyer, J., Rolf, C., Schiller, C., Rohs, S., Spelten, N., Afchine, A., Zöger, M., Sitnikov, N., Thornberry, T. D., Rollins, A. W., Bozóki, Z., Tátrai, D., Ebert, V., Kühnreich, B., Mackrodt, P., Möhler, O., Saathoff, H., Rosenlof, K. H., and Krämer, M.: Two decades of water vapor measurements with the FISH fluorescence hygrometer: a review, Atmos. Chem. Phys., 15, 8521–8538, https://doi.org/10.5194/acp-15-8521-2015, 2015. a
Neis, P., Smit, H. G. J., Krämer, M., Spelten, N., and Petzold, A.: Evaluation of the MOZAIC Capacitive Hygrometer during the airborne field study CIRRUS-III, Atmos. Meas. Tech., 8, 1233–1243, https://doi.org/10.5194/amt-8-1233-2015, 2015a. a
Neis, P., Smit, H. G. J., Rohs, S., Bundke, U., Krämer, M., Spelten, N., Ebert, V., Buchholz, B., Thomas, K., and Petzold, A.: Quality assessment of MOZAIC and IAGOS capacitive hygrometers: insights from airborne field studies, Tellus B, 67, 28320, https://doi.org/10.3402/TELLUSB.V67.28320, 2015b. a
Niedermeier, D., Voigtländer, J., Schmalfuß, S., Busch, D., Schumacher, J., Shaw, R. A., and Stratmann, F.: Characterization and first results from LACIS-T: a moist-air wind tunnel to study aerosol–cloud–turbulence interactions, Atmos. Meas. Tech., 13, 2015–2033, https://doi.org/10.5194/amt-13-2015-2020, 2020. a, b, c, d, e, f, g, h, i, j, k, l, m, n
Nowak, J. L., Magryta, P., Stacewicz, T., Kumala, W., and Malinowski, S. P.: Fast optoelectronic sensor of water concentration, Opt. Appl., 46, 607–618, https://opticaapplicata.pwr.edu.pl/article.php?id=2016400607 (last access: 12 July 2022), 2016. a, b, c, d, e
Nowak, J. L., Grosz, R., Frey, W., Niedermeier, D., Mijas, J., Malinowski, S. P., Ort, L., Schmalfuß, S., Stratmann, F., Voigtländer, J., and Stacewicz, T.: Contactless optical hygrometry in LACIS-T: supplementary data, Repository for Open Data [data set], https://doi.org/10.18150/08X1HO, 2022. a
Peter, T., Marcolli, C., Spichtinger, P., Corti, T., Baker, M. B., and Koop, T.: When dry air is too humid, Science, 314, 1399–1402, https://doi.org/10.1126/SCIENCE.1135199, 2006. a
Podolske, J. R., Sachse, G. W., and Diskin, G. S.: Calibration and data retrieval algorithms for the NASA Langley/Ames Diode Laser Hygrometer for the NASA Transport and Chemical Evolution Over the Pacific (TRACE-P) mission, J. Geophys. Res.-Atmos., 108, 8792, https://doi.org/10.1029/2002JD003156, 2003. a
Prabhakaran, P., Shawon, A. S. M., Kinney, G., Thomas, S., Cantrell, W., and Shaw, R. A.: The role of turbulent fluctuations in aerosol activation and cloud formation, P. Natl. Acad. Sci. USA, 117, 16831–16838, https://doi.org/10.1073/PNAS.2006426117, 2020. a
Regalia, L., Oudot, C., Mikhailenko, S., Wang, L., Thomas, X., Jenouvrier, A., and Von der Heyden, P.: Water vapor line parameters from 6450 to 9400 cm−1, J. Quant. Spectrosc. Ra., 136, 119–136, https://doi.org/10.1016/J.JQSRT.2013.11.019, 2014. a
Rothman, L. S., Gordon, I. E., Babikov, Y., Barbe, A., Chris Benner, D., Bernath, P. F., Birk, M., Bizzocchi, L., Boudon, V., Brown, L. R., Campargue, A., Chance, K., Cohen, E. A., Coudert, L. H., Devi, V. M., Drouin, B. J., Fayt, A., Flaud, J. M., Gamache, R. R., Harrison, J. J., Hartmann, J. M., Hill, C., Hodges, J. T., Jacquemart, D., Jolly, A., Lamouroux, J., Le Roy, R. J., Li, G., Long, D. A., Lyulin, O. M., Mackie, C. J., Massie, S. T., Mikhailenko, S., Müller, H. S., Naumenko, O. V., Nikitin, A. V., Orphal, J., Perevalov, V., Perrin, A., Polovtseva, E. R., Richard, C., Smith, M. A., Starikova, E., Sung, K., Tashkun, S., Tennyson, J., Toon, G. C., Tyuterev, V. G., and Wagner, G.: The HITRAN2012 molecular spectroscopic database, J. Quant. Spectrosc. Ra., 130, 4–50, https://doi.org/10.1016/J.JQSRT.2013.07.002, 2013. a, b
Siebert, H., Szodry, K. E., Egerer, U., Wehner, B., Henning, S., Chevalier, K., Lückerath, J., Welz, O., Weinhold, K., Lauermann, F., Gottschalk, M., Ehrlich, A., Wendisch, M., Fialho, P., Roberts, G., Allwayin, N., Schum, S., Shaw, R. A., Mazzoleni, C., Mazzoleni, L., Nowak, J. L., Malinowski, S. P., Karpinska, K., Kumala, W., Czyzewska, D., Luke, E. P., Kollias, P., Wood, R., and Mellado, J. P.: Observations of aerosol, cloud, turbulence, and radiation properties at the top of the Marine Boundary Layer over the Eastern North Atlantic Ocean: The ACORES Campaign, B. Am. Meteorol. Soc., 102, E123–E147, https://doi.org/10.1175/BAMS-D-19-0191.1, 2021. a
Spichtinger, P., Gierens, K., Smit, H. G. J., Ovarlez, J., and Gayet, J.-F.: On the distribution of relative humidity in cirrus clouds, Atmos. Chem. Phys., 4, 639–647, https://doi.org/10.5194/acp-4-639-2004, 2004. a
Stacewicz, T., Magryta, P., Petersen, B., Nowak, J. L., Kwiatkowski, K., and Malinowski, S. P.: Highly sensitive airborne open path optical hygrometer for upper air measurements – Proof of concept, Metrol. Meas. Syst., 25, 793–805, https://doi.org/10.24425/MMS.2018.124877, 2018. a, b
Szakáll, M., Mohácsi, Á., Tátrai, D., Szabó, A., Huszár, H., Ajtai, T., Szabó, G., and Bozóki, Z.: Twenty Years of Airborne Water Vapor and Total Water Measurements of a Diode Laser Based Photoacoustic Instruments, Frontiers in Physics, 8, 384, https://doi.org/10.3389/FPHY.2020.00384, 2020. a
Tátrai, D., Bozóki, Z., Smit, H., Rolf, C., Spelten, N., Krämer, M., Filges, A., Gerbig, C., Gulyás, G., and Szabó, G.: Dual-channel photoacoustic hygrometer for airborne measurements: background, calibration, laboratory and in-flight intercomparison tests, Atmos. Meas. Tech., 8, 33–42, https://doi.org/10.5194/amt-8-33-2015, 2015. a
Thomas, S., Prabhakaran, P., Cantrell, W., and Shaw, R. A.: Is the Water Vapor Supersaturation Distribution Gaussian?, J. Atmos. Sci., 78, 2385–2395, https://doi.org/10.1175/JAS-D-20-0388.1, 2021. a
Thornberry, T. D., Rollins, A. W., Gao, R. S., Watts, L. A., Ciciora, S. J., McLaughlin, R. J., and Fahey, D. W.: A two-channel, tunable diode laser-based hygrometer for measurement of water vapor and cirrus cloud ice water content in the upper troposphere and lower stratosphere, Atmos. Meas. Tech., 8, 211–224, https://doi.org/10.5194/amt-8-211-2015, 2015. a
Wunderle, K., Fernholz, T., and Ebert, V.: Selection of optimal ab-sorption lines for tunable laser absorption spectrometers, in: VDI Berichte (1959), VDI Verlag, Düsseldorf, 137–148, 2006. a
Zondlo, M. A., Paige, M. E., Massick, S. M., and Silver, J. A.: Vertical cavity laser hygrometer for the National Science Foundation Gulfstream-V aircraft, J. Geophys. Res.-Atmos., 115, 20309, https://doi.org/10.1029/2010JD014445, 2010. a