the Creative Commons Attribution 4.0 License.
the Creative Commons Attribution 4.0 License.
 | 27 Jul 2022
A quadcopter unmanned aerial system (UAS)-based methodology for measuring biomass burning emission factors
Patrik Winiger
Martin Wooster
Tercia Strydom
Laurent Poulain
Ulrike Dusek
Mark Grosvenor
Gareth J. Roberts
Nick Schutgens
Guido R. van der Werf
Biomass burning (BB) emits large quantities of greenhouse gases (GHG) and aerosols that impact the climate and adversely affect human health. Although much research has focused on quantifying BB emissions on regional to global scales, field measurements of BB emission factors (EFs) are sparse, clustered and indicate high spatio-temporal variability. EFs are generally calculated from ground or aeroplane measurements with respective potential biases towards smouldering or flaming combustion products. Unmanned aerial systems (UAS) have the potential to measure BB EFs in fresh smoke, targeting different parts of the plume at relatively low cost. We propose a light-weight UAS-based method to measure EFs for carbon monoxide (CO), carbon dioxide (CO2), methane (CH4), and nitrous oxide (N2O) as well as PM2.5 (TSI Sidepak AM520) and equivalent black carbon (eBC, microAeth AE51) using a combination of a sampling system with Tedlar bags which can be analysed on the ground and with airborne aerosol sensors. In this study, we address the main challenges associated with this approach: (1) the degree to which a limited number of samples is representative for the integral smoke plume and (2) the performance of the lightweight aerosol sensors. While aerosol measurements can be made continuously in a UAS set-up thanks to the lightweight analysers, the representativeness of our Tedlar bag filling approach was tested during prescribed burning experiments in the Kruger National Park, South Africa. We compared fire-averaged EFs from UAS-sampled bags for savanna fires with integrated EFs from co-located mast measurements. Both measurements matched reasonably well with linear R2 ranging from 0.81 to 0.94. Both aerosol sensors are not factory calibrated for BB particles and therefore require additional calibration. In a series of smoke chamber experiments, we compared the lightweight sensors with high-fidelity equipment to empirically determine specific calibration factors (CF) for measuring BB particles. For the PM mass concentration from a TSI Sidepak AM520, we found an optimal CF of 0.27, using a scanning mobility particle sizer and gravimetric reference methods, although the CF varied for different vegetation fuel types. Measurements of eBC from the Aethlabs AE51 aethalometer agreed well with the multi-wavelength aethalometer (AE33) (linear R2 of 0.95 at λ=880 nm) and the wavelength corrected multi-angle absorption photometer (MAAP, R2 of 0.83 measuring at λ=637 nm). However, the high variability in observed BB mass absorption cross-section (MAC) values (5.2±5.1 m2 g−1) suggested re-calibration may be required for individual fires. Overall, our results indicate that the proposed UAS set-up can obtain representative BB EFs for individual savanna fires if proper correction factors are applied and operating limitations are well understood.
- Article
(3380 KB) - Full-text XML
- BibTeX
- EndNote


Landscape fires, also referred to as “biomass burning´” (BB), are a substantial source of greenhouse gases (GHG) and aerosol emissions to the atmosphere (Akagi et al., 2011; Klimont et al., 2017), the latter being responsible for large uncertainties in radiative forcing (Myhre et al., 2013; Saleh et al., 2014). In stable ecosystems, biogenic carbon stocks lost in the fire are replenished through photosynthetic carbon dioxide (CO2) sequestration upon regrowth (Beringer et al., 2007; Landry and Matthews, 2016). This re-uptake is thought to neutralize the long-term climate impact of CO2 emissions, whereas methane (CH4), nitrous oxide (N2O), and BB aerosols are potent net climate forcers. Carbon monoxide (CO) emissions affect radiative forcing indirectly through increasing the lifetime of CH4 and as precursors for O3 (Myhre et al., 2013). Largely due to the fact that landscape fires emit a mixture of net warming black carbon (BC) and net cooling aerosols (i.e. organic carbon, OC, and SO4), their role in the aerosol-induced radiative forcing is not yet fully understood. BB accounts for about half of the global BC emissions (Lu et al., 2015), and savanna fires alone are responsible for roughly 40 % of this BB-emitted BC (Bond et al., 2013). Although BB emissions are becoming better constrained for some trace gases, estimating fire-related aerosol emissions proves to be more difficult due to the high variability in their chemical composition (Carter et al., 2020). Combined with a limited understanding of the atmospheric oxidation and secondary aerosol formation (Vakkari et al., 2014), this results in high uncertainties in global estimates of aerosol-induced radiative forcing from BB (Bellouin et al., 2020; Bond et al., 2013; Brown et al., 2021; Carter et al., 2020).
In situ measurements of aerosol scattering and absorption in BB smoke indicate considerable variability in single-scattering albedo (SSA) (Brown et al., 2021; Liu et al., 2014), which is a key parameter governing aerosol radiative forcing (Moosmüller and Sorensen, 2018a; Penner et al., 1992). This variability in the SSA is in part associated with different fuel types and burning conditions, and is a major uncertainty regarding the treatment of BB aerosols in climate models (Cappa et al., 2020; Saleh et al., 2014). In BB plumes, the SSA is linearly dependent on the ratio between highly light-absorbing BC and brown carbon (BrC) on the one hand, and the non-absorbing fraction of OC on the other (Brown et al., 2021; Cappa et al., 2020; Pokhrel et al., 2016). BC absorbs uniformly across the visible spectrum, with a linear dependence on the wavelength (Ran et al., 2016). BrC, on the other hand, is light-absorbing OC, which is optically distinguished from BC through an increased absorption at shorter wavelength. BrC is either directly emitted during smouldering combustion or formed as secondary organic aerosol (SOA) through oligomerization and polymerization inside the plume (Moosmüller et al., 2009).
BB emission inventories are used to study the impact of fires on regional and global biogeochemical cycles. In these inventories, emissions are generally calculated based on the consumed fuel (either calculated through a modelled fuel load and satellite-derived burned area, or through satellite measurements of fire radiative power integrated over time) and field measurements of emission factors (EFs) (Seiler and Crutzen, 1980). These EFs, presented in gram per kilogram of dry biomass consumed, describe the chemical break-up of fuel into gases and aerosols during a fire. If the combustion process is incomplete, a larger portion of the biomass is emitted as CH4, CO, and organic particles, rather than CO2 which results from complete oxidation. The modified combustion efficiency (MCE), defined as the molar CO2 emissions divided by the sum of the molar CO2 and CO emissions (Ward and Radke, 1993), is often used as an indication of the relative contributions of flaming (high MCE) and smouldering (low MCE) combustion (Christian et al., 2003; Yokelson et al., 2013). It is usually calculated from the excess CO2 and CO concentrations in the biomass burning plume compared to the ambient background (Ward and Radke, 1993). The ratio between complete and incomplete combustion, and thus the MCE, is dependent on fuel characteristics, weather conditions, and the direction of burning compared to the wind, making it both spatially and temporally variable (Korontzi, 2005; Surawski et al., 2015; Vernooij et al., 2021). Although biome-specific BB EFs (derived from laboratory, ground-based, and aircraft in situ or remotely sensed trace gas and aerosol concentration measures) have been reported for a large number of chemical species (Akagi et al., 2011; Andreae, 2019; Andreae and Merlet, 2001), field measurements are typically quite sparse, clustered, and show substantial intra-biome variability (Andreae, 2019; van Leeuwen and van der Werf, 2011). A better understanding of this BB EF variability would improve our quantification of fire emissions by replacing static biome-average EFs in global models, and would help to predict the effects of future climate- and human-induced changes in fire regimes. However, gaining this understanding and being able to quantify it typically requires a large number of in situ measurements.
Field measurements of BB EF have been derived for a wide variety of vegetation types and species using data from in situ sensors on the ground (e.g. Zhang et al., 2015; Wooster et al., 2018; Reisen et al., 2018) or mounted on masts (e.g. Korontzi et al., 2003; Wiggins et al., 2021) or aircraft (e.g. Liu et al., 2017; May et al., 2014; Yokelson et al., 2007; Barker et al., 2020; Thompson et al., 2020), as well as through ground-based remote sensing (e.g. Meyer et al., 2012; Wooster et al., 2011). Many laboratory studies have examined EFs during enclosed experiments including those looking at the characterization of BB particulate emissions (Reid et al., 2005a, Yokelson et al., 2013). However, the representativeness of these measurements to natural fires is uncertain, considering that important field conditions affecting EFs, e.g. wind, fuel moisture content, fuel structure, and temperature, are difficult to include in the experiments. This generally leads to higher combustion efficiency in a laboratory setting (May et al., 2014; Yokelson et al., 2013; Thompson et al., 2020). Particularly for aerosols, aeroplane measurements can also be troublesome considering that the optical and chemical properties of BB aerosols change with the ageing of the smoke (Cappa et al., 2020; Pokhrel et al., 2016; Vakkari et al., 2014). Differences in atmospheric lifetime, hygroscopic growth, coating of soot by OC, and susceptibility to vertical and lateral transport all complicate EF comparisons made at different points downwind (Adachi et al., 2010).
Most atmospheric models account for photochemical processing (e.g. oxidation of CO and CH4) but not for the chemical changes associated with the initial cooling of the smoke to ambient temperature (e.g. condensation of volatile species). EFs are therefore ideally measured in smoke that has already cooled to ambient temperature, but not yet undergone significant photochemical processing (Akagi et al., 2011). EFs should represent a mixture of emissions from the smouldering and flaming phases (Akagi et al., 2013; Ward and Radke, 1993). Aircraft measurements may be biased towards flaming emissions, since they sample lofted emissions that typically result from higher-intensity combustion, whereas ground measurements may be biased towards residual smouldering combustion (RSC) emitted species since the smoke from higher-intensity burns is lofted out of reach. UAS offer a low-cost and versatile solution for sampling a mixture of flaming and RSC emissions within a freshly emitted, dense smoke plume (Aurell et al., 2021; Vernooij et al., 2021), avoiding the aforementioned biases. The flexibility of UAS tackles some of the major weaknesses of ground and mast measurements. The system can be quickly deployed when a fire is sighted, eliminating the bias towards small “experimental plot” fires. Also, by measuring a fire for hours burning through large swaths of vegetation, the UAS provides much better spatio-temporal coverage of the fire. While high-precision GHG analysers are too heavy to be deployed on a UAS, Tedlar bag samples have been successfully used to sample BB emissions (Meyer et al., 2012; Vicente et al., 2011). UAS-compatible (i.e. lightweight and energy efficient) aerosol measurement equipment, like the MicroAeth® AE51, which measures equivalent black carbon (eBC), and the TSI SidePak® AM520, which measures PM2.5 mass concentrations, have proven useful for measuring a large variety of atmospheric pollution sources (e.g. Alas et al., 2019; Pikridas et al., 2019; Zhao et al., 2019), including for landscape fire smoke EF derivation (e.g. Zhang et al., 2015; Wooster et al., 2018). However, as these instruments are not initially calibrated for BB aerosols, additional recalibration is required.
Measurements of multiple carbonaceous species are required to calculate GHG and aerosol EFs through the carbon mass balance method (Yokelson et al., 2011, 2013). In this paper we describe the development of a UAS-based system to measure in situ mass concentrations of BC and PM2.5 and collect bag samples to measure mixing ratios of CO2, CO, CH4, and N2O. We focused on gases in a series of measurements of prescribed fires in the Kruger National Park (KNP), South Africa, in which we compare UAS measurements with continuous stationary measurements on top of a mast. We then compare aerosol analysers against high-fidelity laboratory equipment to understand their limitations and calculate the specific calibration factors (CFs) for the measurement of fresh BB particles. Using the CFs from the laboratory experiments, we finally calculate the EFs for CO2, CO, CH4, N2O, BC, and PM2.5 for the fires sampled in the KNP.
Figure 1 shows a schematic overview of the proposed measurement systems installed on the UAS (DJI Matrice 200). To prevent rotor-induced pressure alterations affecting aerosol mass concentrations, the inlets were extended using a carbon-fibre tube outside the rotor affected area. The gas-sampling system (530 g) consists of an Arduino operated remote control and logging module, a 1.6 L min−1 diaphragm gas pump (NMP 015, KNF), a four-way manifold connected to four 1 L Tedlar bags, and a carbon-fibre cage (Fig. 1, schematics in blue). This set-up was based on an earlier set-up deployed on a DJI Matrice 100 UAS described by Vernooij et al. (2021), but included a flushing mechanism to flush the extended inlet before sampling. The aerosol sampling system (Fig. 1, schematics in black) contains two inlets. The first inlet is fitted with an inertial impactor (Personal Modular Impactor, SKC) followed by a 37 mm quartz-fibre filter (Tissuquartz 2500QAT-UP, Merck) and a flow-controlled pump. The filtered air is used to dilute the stream coming from the second inlet using a 1:1 ratio to prevent saturation of the AM520 and to limit the filter loading effect in the AE51. All tubing is polyurethane and kept as short as possible, whilst avoiding sharp corners. PM2.5 and eBC are continually logged in the AM520 and AE51 respectively. For each sample, the start time, end time, temperature, pressure, and relative humidity at the UAS are logged. The transport time from the inlet to the measurement equipment is corrected for when computing EFs. The overall flight time of the system is roughly 15 min for each set of TB50 batteries, which is enough to fill 12–16 bags. The combined set-up equipped on a Matrice 200 takes collocated measurements of the CO2, CO, CH4, and N2O mixing ratio, as well as the PM2.5 and eBC mass concentration, and computes the BB EFs of these species. While an earlier version of the UAS in Fig. 1 (the DJI Matrice 100) was used for some of the experiments described in this study, it has insufficient payload capability for the combined system.

Figure 1Photo and schematic representation of the gas sampling system (blue) and aerosol measurement system (black) as installed on the DJI Matrice 200 UAS.
We assessed the performance of the measurement system in two phases. In the first phase, we compared the UAS gas samples with mast measurements (an established methodology) during a series of prescribed burning experiments. In the second phase, we tested the performance of the individual instruments in a series of laboratory fire experiments, using the reference methods listed in Table 1. The GHG were measured using cavity ring-down spectroscopy (CRDS), with the analysers calibrated using certified standard gases at dense plume concentrations (listed in Table 1). Since the stability of GHG sampling in Tedlar® bags has been demonstrated (Alves et al., 2010; Meyer et al., 2012; Silva et al., 2016) and CRDS is well-established, our focus in the second phase was on the measurement of PM2.5 and eBC using UAS-compatible equipment.
Table 1Description of analysis equipment used for UAS measurements of EFs in biomass burning plumes.
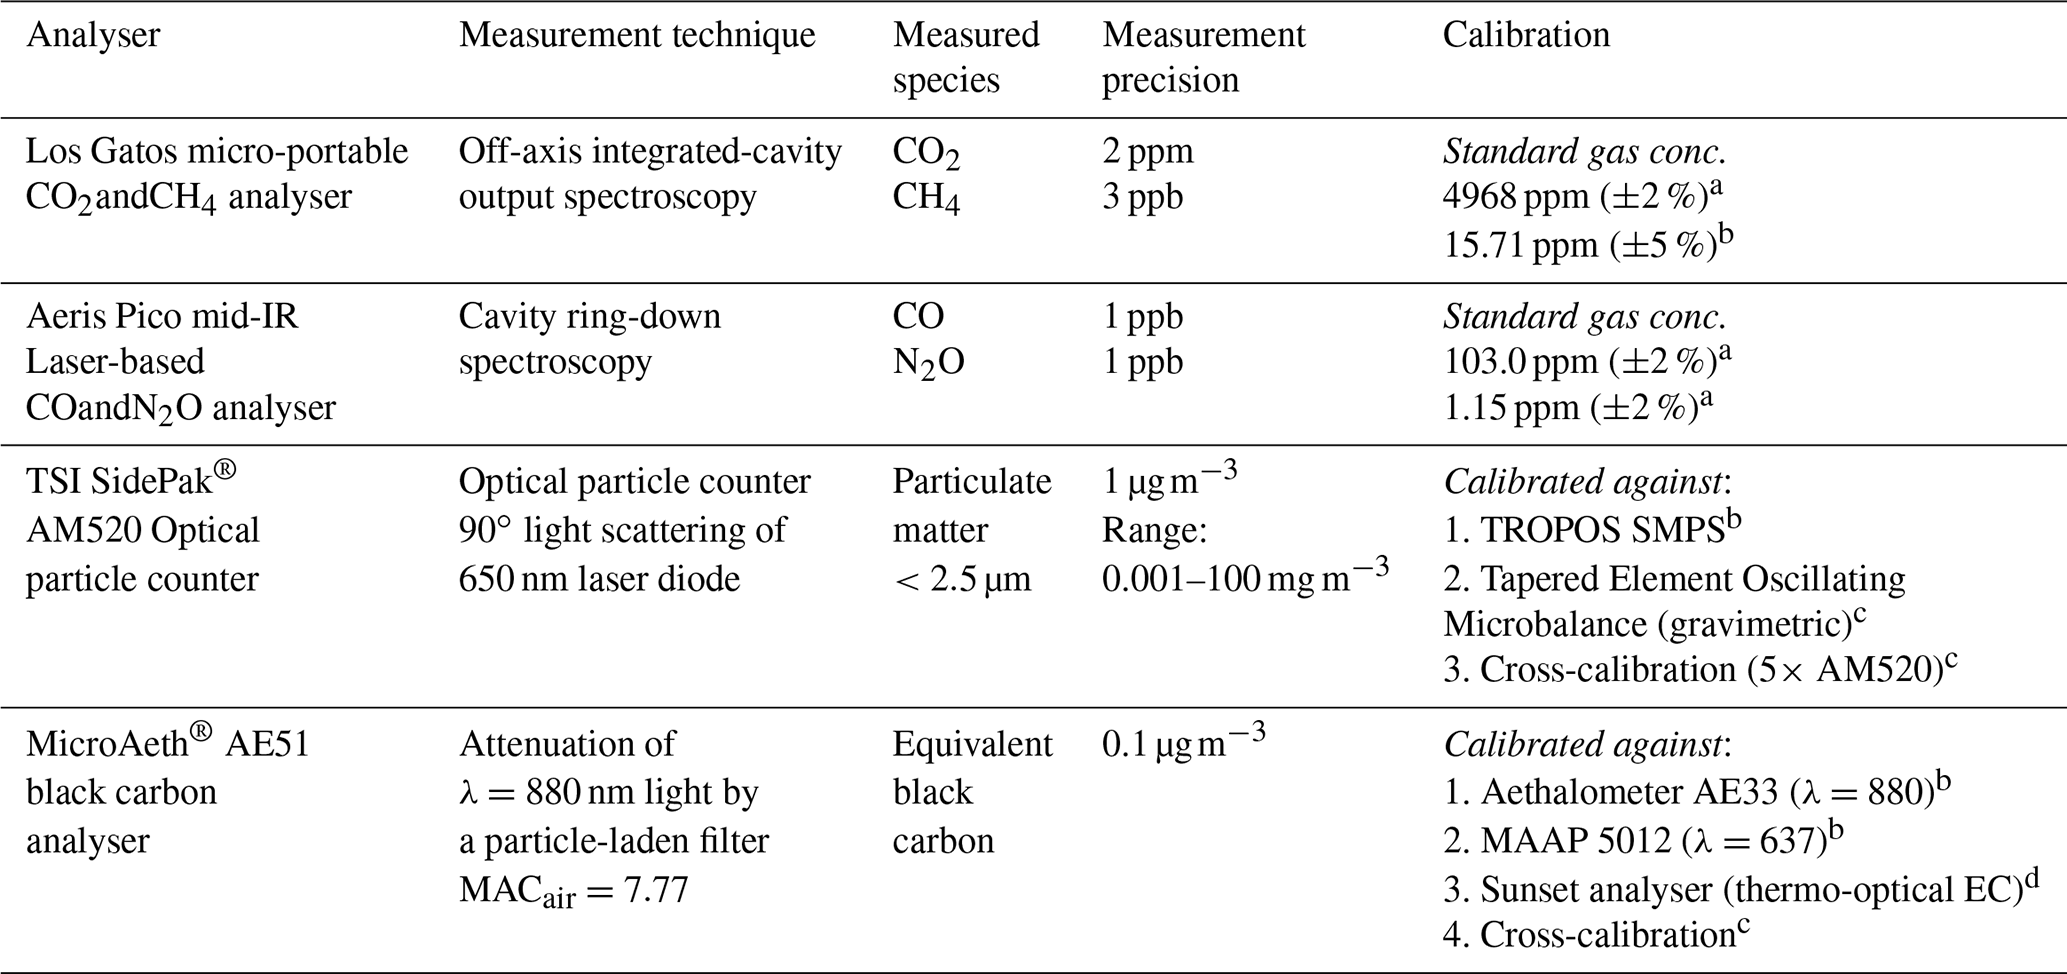
a Fire Laboratory of Amsterdam for Research in Ecology (FLARE), Amsterdam. b Leibniz Institute for Tropospheric Research (TROPOS), Leipzig. c Kings Wildfire Testing Chamber (KWTC), London. d Centre for Isotope Research (CIO), Groningen.
2.1 Field measurements of GHG emission factors
2.1.1 Fire experiments in the Kruger National Park
We performed prescribed burning experiments throughout four fieldwork campaigns in the KNP in South Africa. The mean annual rainfall in the KNP varies from around 350 mm yr−1 in the north to approximately 750 mm yr−1 in the south and is mostly concentrated in the months November–April (Venter and Gertenbach, 1986). Although some fires start as early as March, the peak of the fire season occurs between August and October. Prescribed experimental fires on the roughly 100 by 200 m experimental burn plots (EBPs) spread over four major vegetation types of the KNP, started over 65 years ago (Van der Schijff, 1954), and the experiments spanning this period are elaborately described by Biggs et al. (2003). The KNP has an average fire interval ranging from 2 to 5 years, with more frequent burning towards the high-rainfall areas. The EBPs themselves are protected by fire breaks and managed at fire frequencies ranging from 1 to 6 years. Besides the burning frequency, the time of treatment is varied; i.e. different plots are burned in February, April, August, October, or December. Table 2 lists the total number of experiments and the spread over the different vegetation types and burn months.
Table 2Description of the dominant vegetation and relevant characteristics for the experimental sites.
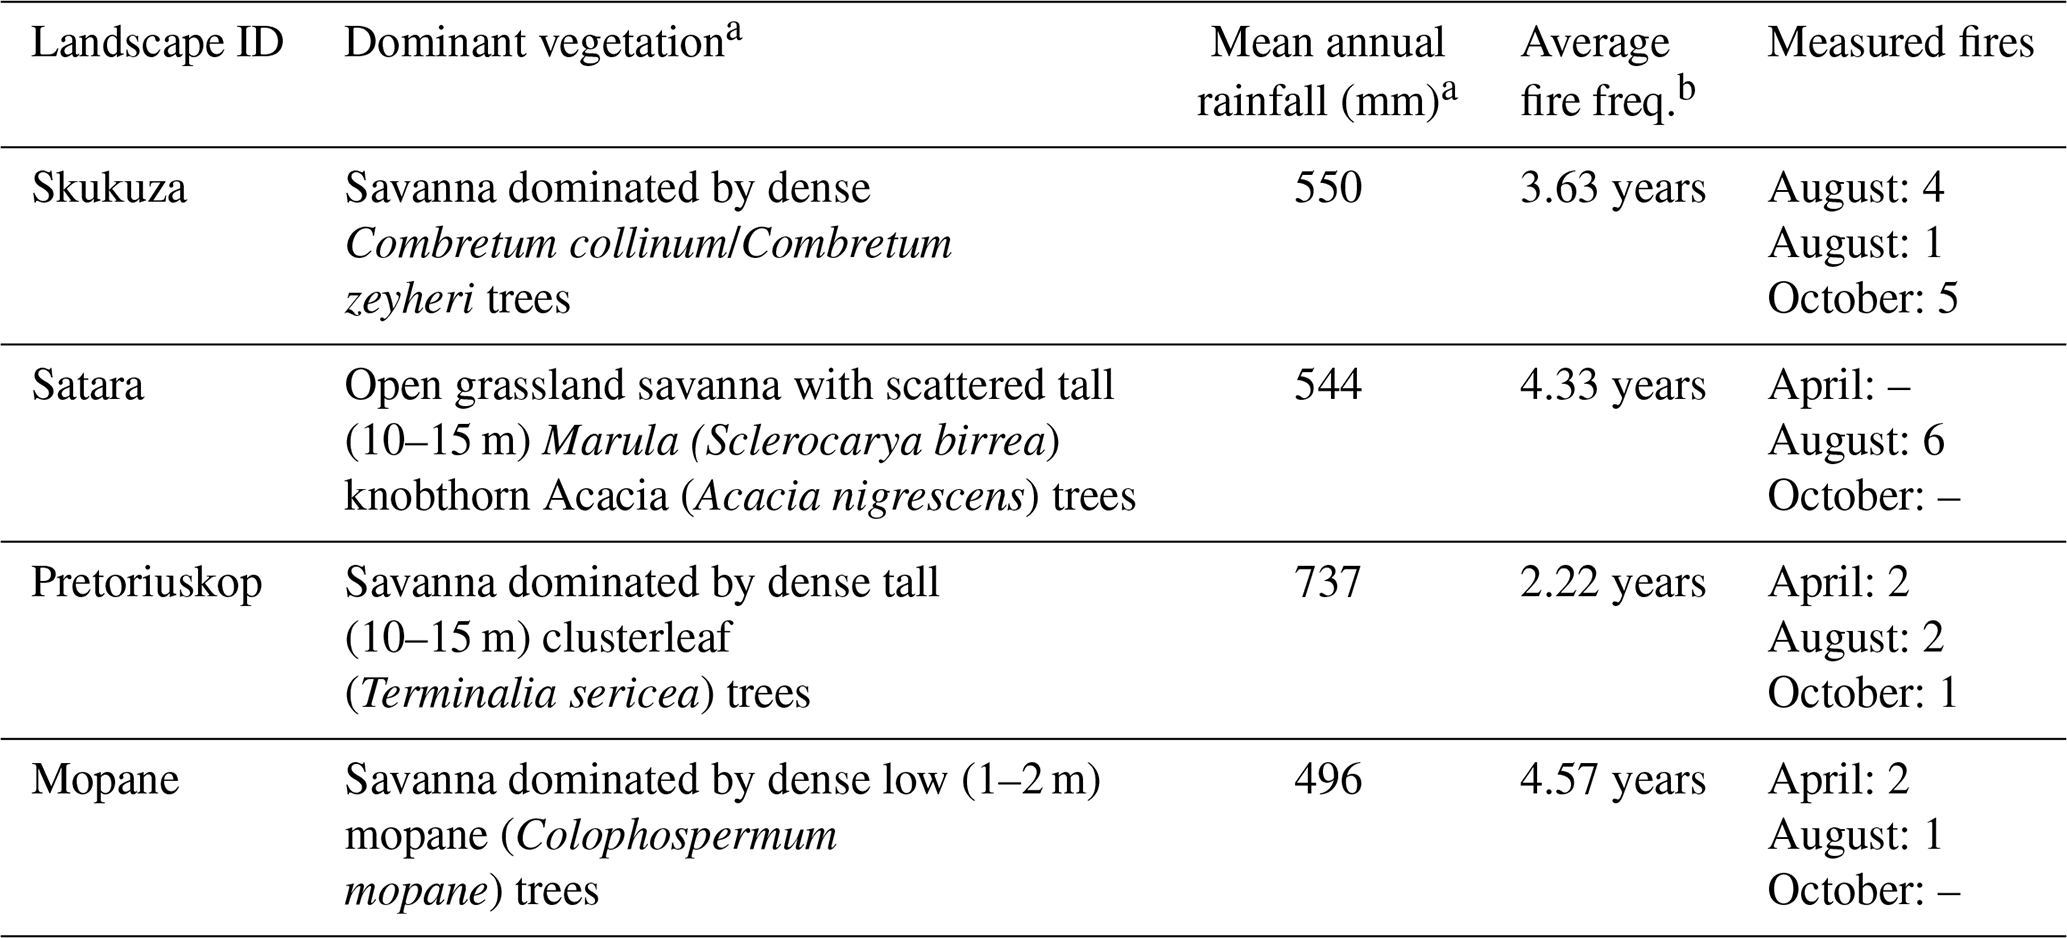
a Based on Table 1 of Govender et al. (2006). b Based on the average Landsat-derived continuous fields of tree cover in 2015 (Sexton et al., 2013) and MODIS-based vegetation continuous fields dataset (MCD44Bv6, DiMiceli et al., 2015) in the mapped area of the vegetation types (Gertenbach, 1983).
2.1.2 Mast and UAS measurement set-up in the KNP experiments
We measured BB smoke mixing ratios of different compounds using a 15 m telescopic mast which was located inside the EBP during passage of a fire front. A box containing the CRDS gas analysers (equipment listed in Table 1) was dug into the ground on the leeward side of the mast. The gas inlet at the top of the mast was fitted with a sintered 60 µm filter and a continuous flow (4 L min−1) of smoke was transported through a polyurethane tube to the gas analysers. Using a Nafion gas-dryer (MD Series™, Perma Pure), H2O(g) was stripped from the sample stream to prevent condensation. We used a TSI SidePak™ AM520 optical particle counter (OPC) (hereafter called “AM520”) to measure aerosol mass concentrations (<2.5 µm) and a lightweight aethalometer (MicroAeth® AE51, Magee Scientific hereafter called “AE51”) to measure the eBC fraction of the PM mass concentration. A platform mounted at the top of the mast held the AM520, AE51, and inlet of the gas-sampling tube. The flow rate of the AE51 was set to 50 mL min−1, and new filter strips were installed before every fire to minimize the effect of nonlinearity in the filter-loading. Mast measurements were started about 15 min before fire ignition on the upwind side. The average atmospheric mixing ratio of the 15 min was used as the background.
For UAS sampling, we used a Matrice 100 (DJI) as in our earlier work that filled single-polypropylene fitted bags (Tedlar® type 232-01, SKC) with smoke. For each flight, four bags are filled for 35 s each (1.6 L min−1), at an altitude of roughly 15 m. We chose 15 m because it is an altitude which is often high enough to safely fly the drone over the fire during intense late-dry seasons, but also low enough to still get elevated concentrations during weaker fires making for a better signal-to-noise ratio. The methodology for the bag sampling and subsequent measurement is described in detail by Vernooij et al. (2021). Samples were taken within 3 m of the mast, while preventing the disturbance of the airflow around the mast by the propellers. Bag samples were kept away from UV radiation and analysed within 12 h of sampling. The gas analysers were calibrated between the campaigns and we included sample bags of standard gas in each analysis session to determine analyser drift.
2.2 EF calculations
The excess mixing ratios (EMR, sample minus background concentrations) of the GHG and aerosols were converted to EFs using the carbon mass balance method (Yokelson et al., 1999):
where EFi is the emission factor of species i (usually reported in g kg−1) and Fc is the fractional carbon content of the fuel by weight (estimated at 50 % following Akagi et al., 2011). MWi is the molecular weight of species i which is divided by the atomic mass of carbon, AMc. Ci is the moles of carbon per mole of species i multiplied by the EMR of species i. Ctotal is the total number of moles of emitted carbon in all carbonaceous species. Because we did not measure the non-methane hydrocarbons (NMHC) and the chemical composition of carbonaceous particulates, the NMHC and the carbon content of the particulates were estimated based on literature values in order to estimate Ctotal; The total amount of carbon in NMHC was estimated to be 3.5 times the ER() based on common ratios for savanna fires (Andreae, 2019; Yokelson et al., 2011, 2013). For the bag and mast measurements, we used the PM : CO ratio based on AM520 and CRDS measurements, with carbon accounting for 68 % of the PM mass (Reid et al., 2005a). Overall, the carbon in PM and NMHC constitute respectively 0.5 %–2 % and 0.4 %–3 % of the total emitted carbon. Therefore, the uncertainty from the effect of this assumption on the EFs of gaseous species is limited. On average, the PM : CO ratio in our measurements was 0.0946±0.0218 which corresponds well with the 0.0969±0.0403 average for savanna fires (Andreae, 2019).
We calculated the EFs for eBC and PM2.5 based on the emission ratio of the species i to a relatively inert, co-emitted carbon-containing species y following Eq. (2).
To convert parts per million to mg m−3, the reference gas emissions were multiplied by the molar volume (MVy) divided by the molecular weight of the reference species (MWy). For both eBC and PM2.5, we used CO as a reference gas. We calculated fire-averaged EFs based on the cumulative EMR of the respective trace gas species in all the fire samples, causing samples with low overall trace gas concentrations to have lower impact on the fire-averaged EF.
2.3 Aerosol calibration experiments
For the second phase, we performed BB experiments in the Leipzig aerosol chamber at the Leibniz Institute for Tropospheric Research (TROPOS), the Kings Wildfire Testing Chamber (KWTC) in London, and the Fire Laboratory of Amsterdam for Research in Ecology (FLARE) where we calibrated the mobile aerosol analysers against different types of high-fidelity laboratory equipment. At TROPOS and FLARE, wooden logs, wood chips, and hay were burned in an actively vented combustion chamber connected to the measurement equipment. The experiments conducted at FLARE served to compare the AE51 and AM520 BC : PM ratios with the ratios determined by the Sunset analyser and to perform a recalibration of the MAC value. The experiments at TROPOS served to compare the AE51 with the AE33 and the MAAP during biomass burning experiments as well as to compare the AM520 with scanning mobility particle sizer (SMPS) particle counts. At the KWTC, smoke from peat fires and straw was allowed to stabilize around predetermined levels in a smoke chamber which was connected to a series of analysers. The experiments at the KWTC served as a direct comparison of the mass concentration obtained by the AM520 (which uses assumptions for density and particle size) with gravimetrically obtained mass concentrations. Additionally, we performed an inter-comparison between six AM520 modules.
Although many studies have measured BC EFs (Andreae, 2019), there is still much inconsistency in the precise terminology and symbology used concerning BC measurements. In this study we follow terminology recommendations by Petzold et al. (2013), i.e. equivalent black carbon (eBC) refers to BC measured by optical absorption methods (e.g. aethalometers and MAAP), whereas elemental carbon (EC) refers to the thermally derived BC fraction, with optical correction for OC pyrolysis. Symbology may therefore be different from other papers (e.g. in this paper, σ refers to the absorption coefficient rather than mass absorption cross-section, MAC).
2.3.1 eBC measurements
The AE51 measures the rate of change in the absorption of transmitted light (λ=880 nm) due to the continuous collection of aerosol deposits on a Teflon-coated T60 borosilicate glass-fibre filter. The measured spot is compared with a reference spot on the filter, and the eBC mass concentration is calculated through the attenuation (ATN) of the laser transmittance. The main uncertainties regarding filter-absorption eBC measurements like this are related to the calibration factor (C), which is applied because, compared to the airborne state, the path of light is increased in the filter material by multiple scattering, resulting in enhanced optical absorption of the deposited particles and the assumed MAC (Drinovec et al., 2015; Kumar et al., 2018). C can be determined through cross-calibration with other absorptivity measurements, whereas the MAC value can be derived using co-located thermo-optical EC analysis (Gundel et al., 1984; Kumar et al., 2018). Absorptivity measurements were compared with the multi-angle absorption photometer (MAAP; type 5012, Thermo-Fisher Scientific) and a multi-wavelength aethalometer (AE33, Magee Scientific). The latter uses the same operating principle as the AE51, but has a much higher flow rate of 6 L min−1 and uses a real-time loading-effect (i.e. the non-linear increase in light absorption with increased loading) compensation algorithm (Drinovec et al., 2015). Its quartz-fibre filter tape automatically advances when ATN at 370 nm exceeds a threshold, further minimizing the aforementioned loading effect. The MAAP measures the transmittance and reflectance at multiple angles using the two-stream approximation in the radiative transfer scheme (Petzold et al., 2013). During the high-concentration measurements in BB smoke, we set the AE51 flow rate to 50 mL min−1. Although the aethalometers and the MAAP respectively measure attenuation coefficient and absorption coefficient at different wavelengths, both instruments report a mass concentration of eBC (µg m−3). Understanding the nuances in this conversion is crucial for the interpretation of the data.
2.3.2 Absorption comparison at multiple wavelengths
To determine the significance of the non-linearity effect of the filter loading, the C value, and the light absorption due to BrC, we compared the AE51 with the AE33 and the MAAP. For absorption intercomparison at different measurement wavelengths (λ), the mass concentration of BC presented by the aethalometers was converted to the absorption coefficient (σAP) through the attenuation coefficient (σATN) using Eqs. (3) and (4).
where MACfilter is the spectral mass-specific attenuation cross-section for particles loaded on a filter (Müller et al., 2011) and RATN stands for the Weingartner correction factor (Weingartner et al., 2003) and is explained in more detail in Eqs. (5)–(7). The MACfilter values of 12.2 m2 g−1 for the AE51 and m2 g−1 for the AE33 (Drinovec et al., 2015; Gundel et al., 1984) were used to convert absorption into BC mass concentrations and are fixed in the analyser firmware. In Eq. (4) the optical enhancement factor C has pre-determined values of 1.56 (for AE51 Teflon-coated glass-fibre filters) and 2.14 (for AE33 quartz-fibre filter tape). Aside from the filter material used, the C value also depends on the particle type. Through comparison with different absorptivity analysers, we determined whether the assumed C value of the AE51 should be adjusted for BB measurements. The Weingartner correction factor is calculated as follows:
where RATN is a factor to compensate for increasing filter load, also known as the loading or shadowing effect, and f is a fit parameter proportional to the absorptivity of the particulate matter (Petzold et al., 1997):
In Eq. (6), a is an empirically determined parameter. Based on extrapolation of measurements by Weingartner et al. (2003) we assumed a to be equal to 0.83 at 880 nm. ω0 is the SSA. As we did not measure the scattering coefficient, we estimated ω0 using the empirically determined relation described by Pokhrel et al. (2016):
where BC is the experiment-averaged eBC mass concentration measured by the AE51 and TC is the experiment-averaged PM from the AM520 multiplied by the average carbon mass percentage of BB particles (68 %, Reid et al., 2005a). Using this method, we found a mean ω0 of 0.84±0.08, closely matching ω0 values measured for biomass burning in field experiments (Eck et al., 2013; Reid et al., 2005b). We used Eq. (8) to calculate from the reported eBC mass concentration measured by the MAAP:
where MACair is the mass absorption coefficient of 6.6 m2 g−1 used in the MAAP firmware and 1.05 is a factor to correct for the actual wavelength of the MAAP light source, which is 637 nm instead of the 670 nm assumed by the MAAP firmware (Müller et al., 2011). The spectral dependence of aerosol absorption is usually described by a power–law relationship and parameterized as , where λ is the wavelength and ÅAP is the absorption Ångström exponent. The AE51 only measures ATN at a single wavelength in the near-infrared at λ=880 nm, which is often used to detect absorption by BC (Drinovec et al., 2015). At this wavelength, BrC has a MAC value in the range of 0.4–0.6 m2 g−1 versus 7.8 m2 g−1 for BC (Sandradewi et al., 2008; Yang et al., 2009). The AE51 therefore assumes absorption by non-BC aerosols to be negligible at this wavelength (Ran et al., 2016), meaning the signal ATN is attributed to BC absorption alone. For comparison between the MAAP and the AE51, we used Eq. (9) to calculate the AE51 absorption coefficient at 637 nm:
In Eq. (9), the ÅAP was determined following Eq. (10) using the 660 and 880 nm channels of the AE33 aethalometer:
For BC, ÅAP is at unity, meaning absorption dependence on wavelength is linear. Any relationship with ÅAP>1.0 is interpreted as BrC. ÅAP(660, 880) was used to correct for the absorption contribution of BrC to the MAAP absorption coefficient (Kumar et al., 2018). Using the different wavelengths of the AE33 aethalometer, we calculated the contribution of BrC light-absorbing species. ÅAPfor the total PM was determined for each fire experiment by fitting an exponential curve through the fire-integrated, wavelength-specific absorption coefficients, derived from the multi-wavelength AE33 aethalometer. The separate Ångström exponent for BrC absorption (ÅAP,Brc) was calculated using Eq. (11) (Ran et al., 2016):
where σAP(λ) is the measured absorption coefficient at wavelength (λ), λ0 is the reference wavelength (880 nm) and σAP, BC(λ0), and σAP, BrC(λ0) are the black and brown carbon absorption coefficient respectively, at the reference wavelength (λ0).
2.3.3 analysis using Sunset analyser
Unlike BC measurements, thermal-optical measurements of EC are not susceptible to uncertainties related to a fixed MAC value and are therefore used for aethalometer calibration (Gundel et al., 1984; Kumar et al., 2018; Salako et al., 2012). By equating EC filter measurements to eBC absorption coefficients from the AE51 we determined the “actual” MAC values in the measured BB smoke, and compared this with the MAC value of 7.8 m2 g−1 assumed by the firmware. The MAC can be calculated based on the EC value of the filter and integration of the collocated absorption coefficient measured by the AE51 following Eq. (12) (Kumar et al., 2018; McClure et al., 2020) over the time it took to load the filter:
During the experiments made at KNP and TROPOS and the experiments performed at the FLARE laboratory, we loaded pre-fired (800 ∘C, 48 h) 37 mm quartz-fibre filters with smoke at a flow rate of 3 L min−1 for the duration of the fire. The filters were analysed at the Centre for Isotope Research, Groningen University using an OC-EC Aerosol Analyzer (Sunset Laboratory Inc.) using non-dispersive infrared spectroscopy. The distinction between OC and EC was based on the EUSAAR_2 protocol (Cavalli et al., 2010) using the transmittance of a laser beam (λ=630 nm) through the filter to determine the relative contribution of OC and EC of the measured filter (Bauer et al., 2009). The measurement set-up and measurement protocol are described in detail by Zenker et al. (2020).
2.3.4 PM mass concentration and size distribution
The AM520 is an optical particle counter (OPC) that uses 90∘ light scattering of a laser diode at a wavelength of 650 nm and has a size measurement range of 100 nm to 10 µm. It is factory-calibrated against the respirable fraction (<4.0 µm) of standard ISO12103-1 (Arizona Road Dust) aerosols with a density of 2.65 mg m−3 and a volumetric mean diameter (VMD) of 2.12 µm (Jiang et al., 2011). Additional (re)calibration is therefore needed to account for the different characteristics (e.g. particle density and size distribution) of BB aerosols. The AM520 uses a linear calibration factor (CF) to convert the Arizona Road Dust (CF =1.0) mass concentration to the desired aerosol type, which is empirically determined using Eq. (13):
where PM AM520 is the concentration measured by the AM520, and PM ref is the reference concentration. At TROPOS, we simultaneously measured diluted smoke with the AM520 using an inertial impactor with a cut-off of 1.0 µm, and a Mobility Particle Size Spectrometer (TROPOS-Type MPSS, Wiedensohler et al., 2012) with an electrical mobility size range of 0.03–0.80 µm. To match the range of the AM520, we assumed a log-normal particle size distribution and extrapolated the particle number concentration from the SMPS, as described by Heintzenberg (1994). We used Eq. (14) to calculate the particle volume of each electrical mobility diameter bin from the size distribution. Assuming spherical particles with a dynamic shape factor of unity, the electrical mobility diameter equals the geometrical diameter:
where Dbin is the mean mobility diameter of the bin and ρeff is the effective density of the particles. The sum of all masses for classes in the range 0.1–1 µm was then compared with the measured <1 µm fraction from the AM520. We converted the total volume of particles for each size class to mg m−3 assuming an effective density of ρeff=1.50 g cm−3, which is typical for wood burning (Kumar et al., 2018; Moosmüller et al., 2009).
2.3.5 Gravimetric analysis
At the KWTC, London, we performed calibrations of a set of co-located measurement equipment using tropical peat (from Kalimantan) and straw fuels. Smoke from the fires was collected in an approximately 27 m3 size sampling chamber into which the co-located measurement equipment was placed. To generate a gravimetric calibration curve, the smoke concentration was kept stable for roughly 1 h at 100 µg m−3 intervals ranging from 200 to 600 µg m−3. The co-located equipment included six AM520s and two EA51s. Reference equipment which had their inlets sampling from the same smoke chamber were a Tapered Element Oscillating Microbalance (TEOM1400, ThermoFisher scientific), a particulate sampler (Partisol 2000i, ThermoFisher scientific), and a 37 mm filter (Tissuquartz 2500QAT-UP, Merck) sampler (Personal Modular Impactor, SKC) for EC and OC analysis.
We first discuss how lightweight UAS-based measurements and those from a mast set-up compared, and how the UAS measurements can be used to compute fire-averaged EFs in fresh smoke from landscape fires. Then we address the accuracy of mass concentration measurements for PM2.5 and eBC from the AM520 and the AE51 respectively.
3.1 Emission factor measurements
During 24 prescribed experimental fires in the KNP, we measured mixing ratios of CO, CO2, CH4, N2O, PM2.5,, and eBC at the top of a 15 m mast. Figure 2 is an example of a temporal concentration profile from a prescribed fire experiment at the Skukuza EBPs in August 2017. The horizontal red line represents the mixing ratio of and the sample time in the bag sample. CO2 concentration enhancements dominated the passing of the fire front but diminished as RSC took over. After the emissions from the flaming front had passed the mast (∼ 2–3 min), EFs (green lines) for CO, CH4, and PM2.5 rose sharply. Although the absolute emissions diminished, some emissions for these species persisted for the entire duration of the measurement.
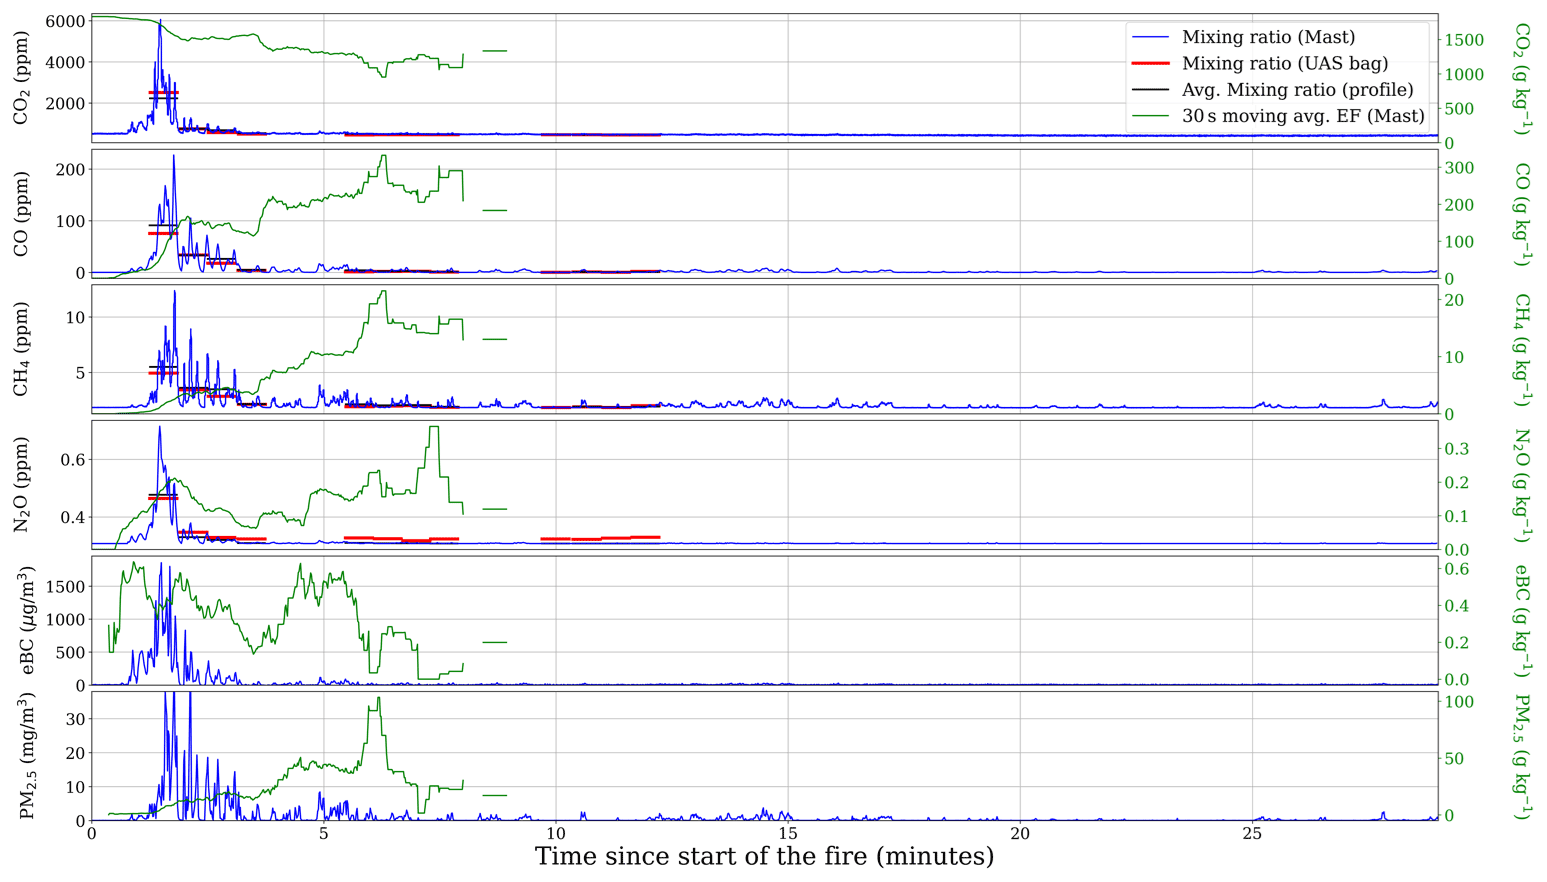
Figure 2Example of a mast measurement profile (blue, left y axis represents the absolute concentration) for a prescribed burn near Skukuza at the KNP in August and the corresponding emission factors (green, right y axis). The red stripes represent the timing and measurement of the UAS sampled bags. The UAS was positioned close to the measurement inlet on the mast.
Comparing EFs based on the integrated mast measurements with averages of UAS-filled bags indicated a good agreement with R2 values ranging from 0.81 to 0.95. Figure 3 represents the WA EF from the UAS-sampled bags, calculated based on the sum of the emissions across all sampled bags in a single fire, plotted against EFs calculated from the cumulative emissions that passed the mast with each point representing a single fire (11 fires in total).
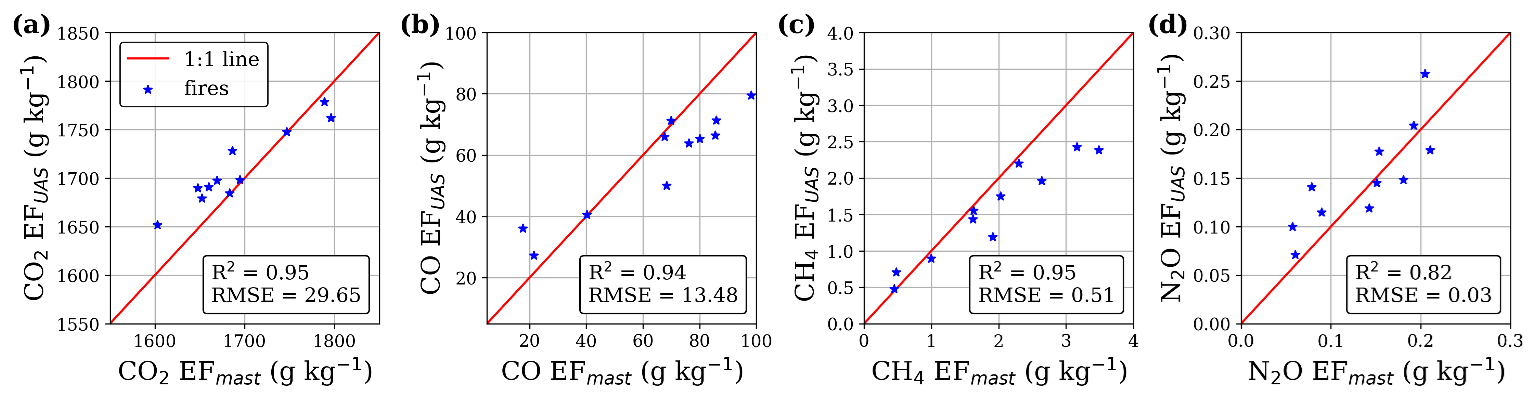
Figure 3Correlation between the UAS-derived EF and the EF derived from the mast at the same time window for prescribed fire experiments in the KNP. Each marker represents the EF calculated over the integrated measurements of a fire by the mast and UAS-sampled bags respectively. The 1:1 line is shown in red.
3.2 PM mass concentration in BB smoke
To determine the AM520 CF for BB particles, we compared the PM mass concentrations measured by the AM520 with the mass concentration derived from the particle size distribution measured by the SMPS (Fig. 4a) and the gravimetrical measurement of mass concentration from TEOM and filters (Fig. 4b). Average PM mass concentrations during the TROPOS experiments, derived from the SMPS, were 0.35 mg m−3 for hay, 0.14 mg m−3 for wood, and 0.08 mg m−3 for wood chip emissions. Fuel-specific AM520 CFs calculated using the SMPS as a reference were 0.23 for hay, 0.26 for wood, 0.29, and for wood chip, emissions. Using an averaged CF of 0.27, the linear correlation of PM1 mass concentrations had an R2 of 0.85; the average CF for peat fires calculated using the TEOM as a reference for five AM520s was 0.17.
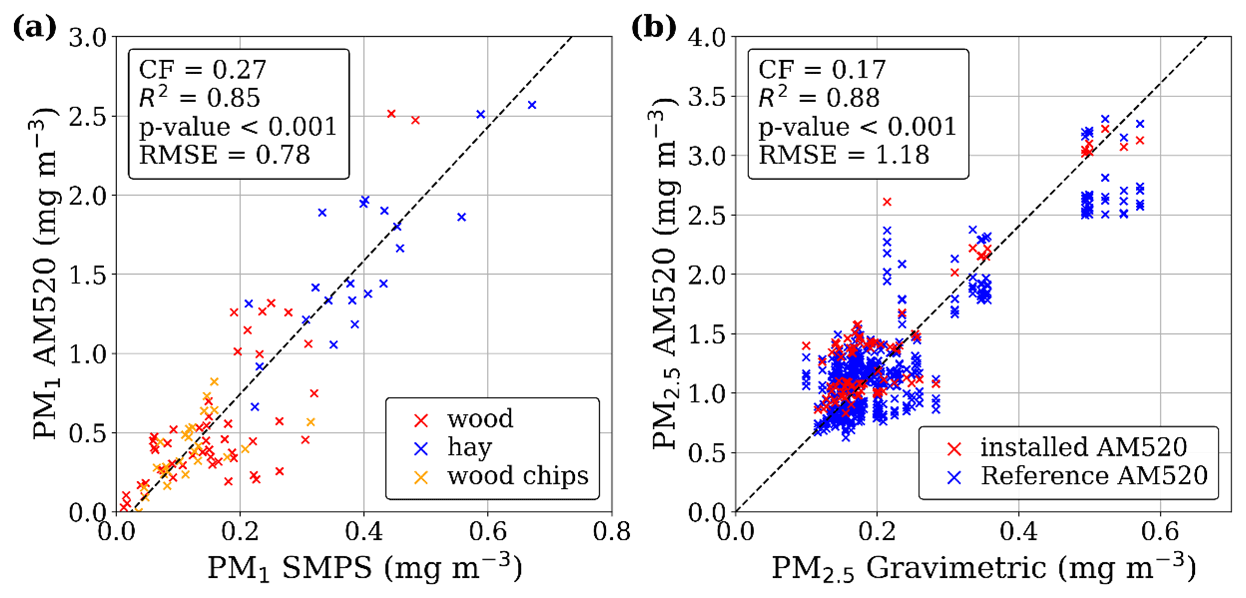
Figure 4PM1 concentrations from the AM520 averaged over 160 s plotted against the SMPS-derived PM1 measurements for 14 fires in different fuel types (a). Fire-averaged PM2.5 concentrations from five different AM520 modules during 10 experiments burning peat and straw, plotted against the gravimetric measurement from the Tapered Element Oscillating Microbalance (b). The dashed line represents the linear regression line. The VU AM520, shown in red in panel (b), is used for the other analysis in this study.
Particles were small with volumetric median particle diameters (VMDs) of 183, 162, and 184 nm respectively for wood chip, wood, and hay fires. We did not find significant correlations of the CF with the VMD, the eBC and BrC concentrations, or the absolute PM2.5 mass concentration measured by either instrument. During the chamber experiments at the KWTC, cross-correlation of the AM520 with five co-located AM520 modules revealed deviations ranging from −20 % to +12 % (Fig. 4b). The relative errors for the respective AM520 reference modules were constant, and could therefore be corrected for by applying unit-specific CFs for the different AM520s.
3.3 Black carbon mass concentration in BB smoke
Black carbon was measured using the three absorption-based measurement techniques (eBC) described in Sect. 2.3 as well as through thermal-optical analysis of filter samples (EC). During the experiments at TROPOS, the average eBC concentrations measured by AE33 at 880 nm were 30.92 µg m−3 for hay, 19.64 µg m−3 for wood, and 18.65 µg m−3 for wood chip emissions. We found a strong agreement (R2=0.93) for the Weingartner-corrected eBC (λ=880 nm) measured by the AE51 and AE33 aethalometers (Fig. 5a). However, at low concentrations, AE33 measurements were 30 %–70 % higher than AE51 measurements. While closer to unity, linear correlation of the wavelength-adjusted absorption coefficient with the MAAP absorption coefficient was less robust with an R2 value of 0.77 (Fig. 5b).
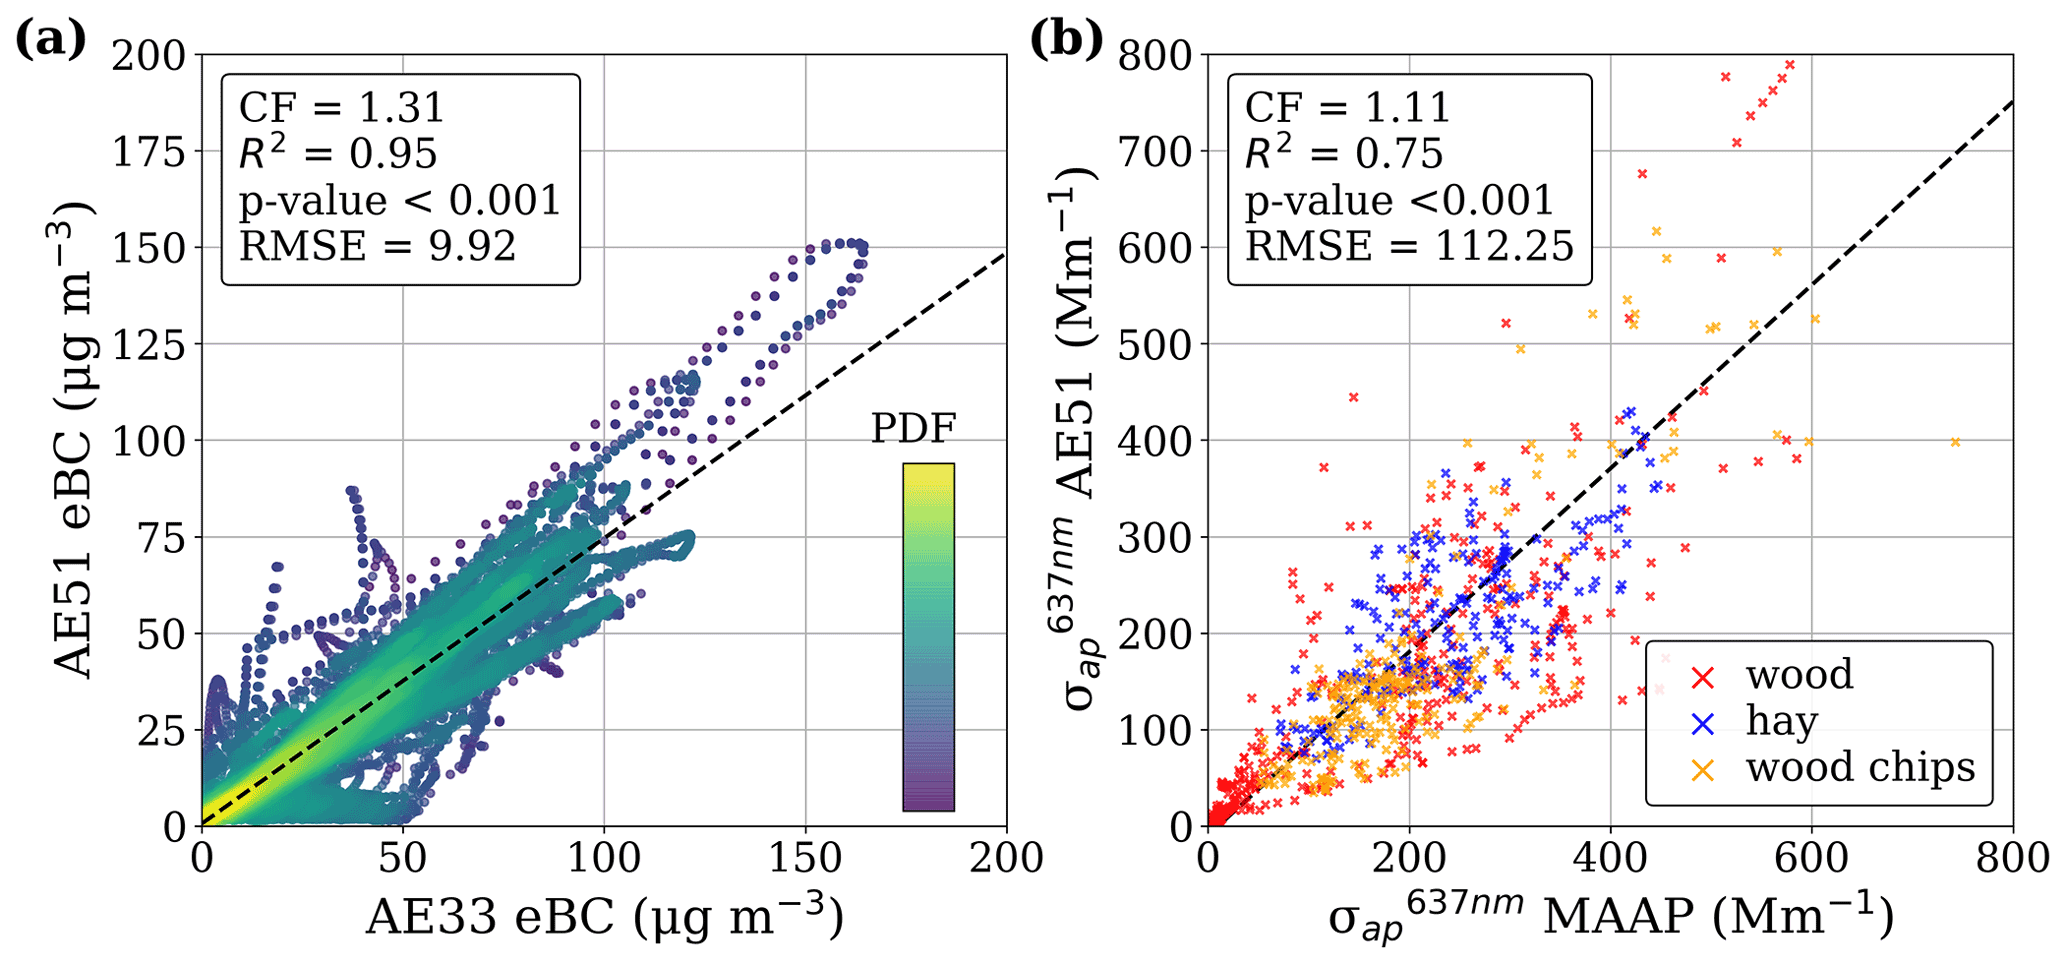
Figure 5(a) Correlation between the AE51 aethalometer and the AE33 multi-wavelength aethalometer at λ=880 nm. Colours describe the point density formula (PDF) with lighter shades representing more common values. (b) Correlation between the absorption coefficient from the AE51 aethalometer (averaged over 10 s) and the wavelength-corrected absorption coefficient from the MAAP. Both figures indicate a bias, represented by the calibration factor (CF) where the AE51 slightly underestimates the absorption compared with the reference.
To assess the importance of BrC absorption and whether its effect can be neglected at a wavelength of 880 nm, we calculated ÅAP for the total fit of the AE33 wavelength and the separate BC and BrC fractions in the TROPOS experiments. At wavelengths over 750 nm, absorption almost completely follows the BC curve (Fig. 6) indicating that the contribution of BrC absorption was small (difference in absorption of <10 %), whereas absorption in the ultra-violet was dominated by BrC. The absorptive Ångström exponents ranging from 1.2 to 5.5 indicated high BrC concentrations. This indicates that in the case of BB, assuming the absorption at 880 nm is solely due to BC slightly overestimates the BC concentration.
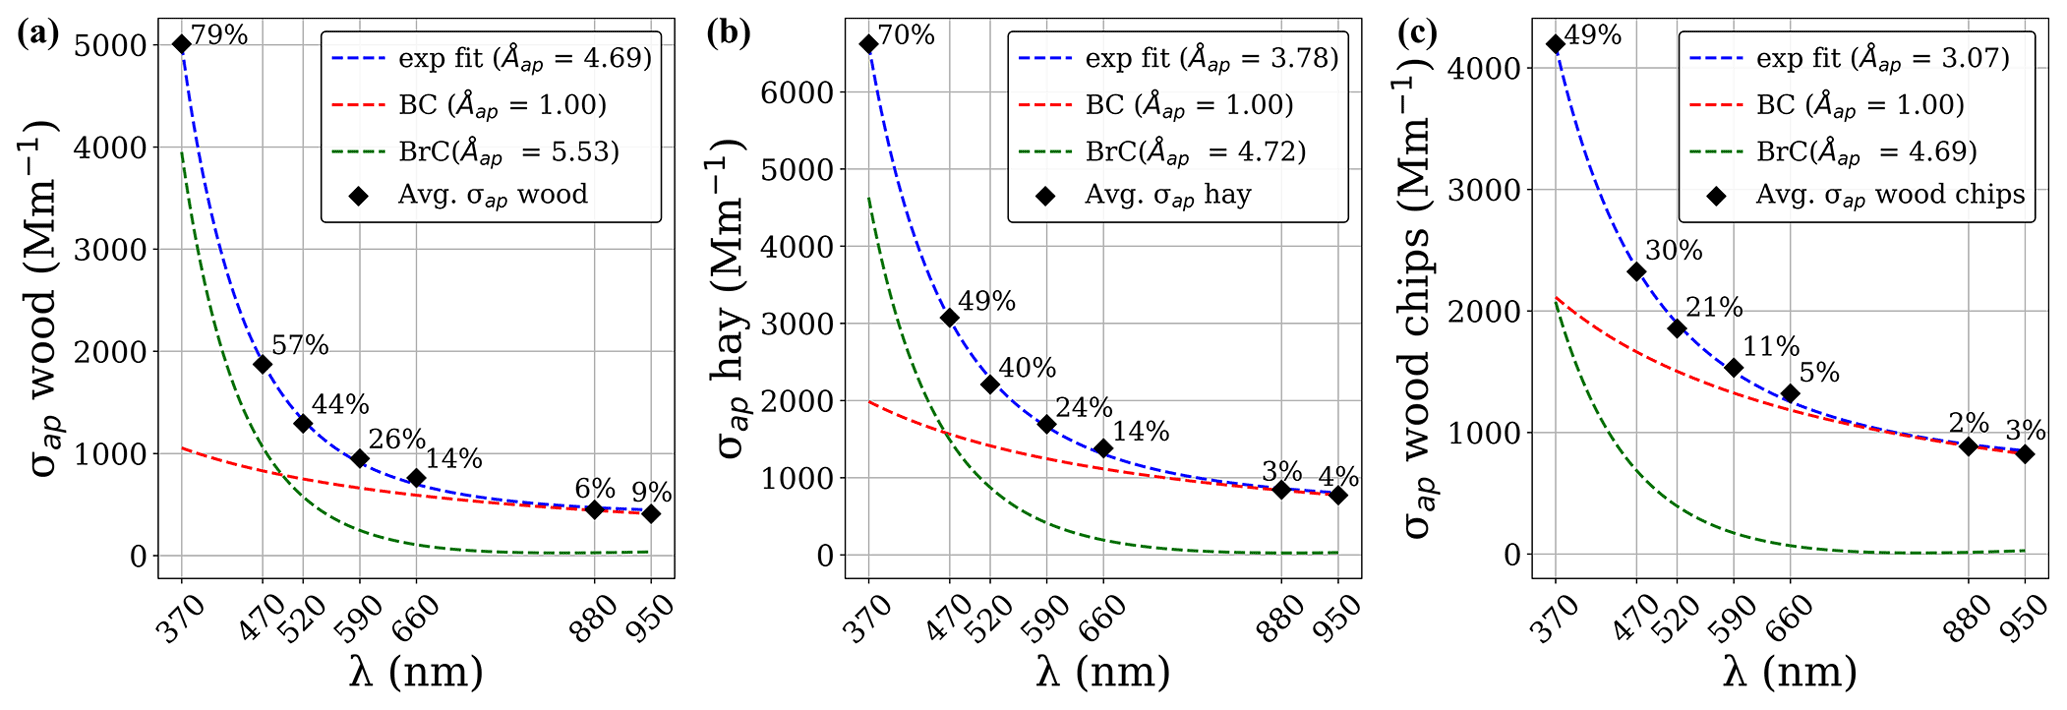
Figure 6Ångström coefficients based on the exponential fit through the absorption coefficients for wood (a), hay (b), and wood chips (c). The labels represent the relative contribution of BrC absorbers to the total absorption at that wavelength.
Figure 7 shows the empirically derived MAC values for the different experiments. These MAC values, derived from the relation between the AE51 absorption coefficient and the Sunset EC mass concentration, were highly variable, ranging from 1 to 17 m2 g−1 with an average of 5.56±5.05 m2 g−1. BB studies suggest a MAC of 4.7 m2 g−1 at 880 nm for fresh uncoated BC (Bond and Bergstrom, 2006; Kumar et al., 2018). In comparison, the static MAC value assumed by the AE51 is 7.8 m2 g−1. If no fire-specific MAC value can be determined, we propose a correction factor (CFMAC) of 0.72 to compensate for the difference between the MAC value assumed by the firmware (7.8 m2 g−1) and the empirically derived MAC value for fresh BB particles (5.6 m2 g−1). Note that the axes in Fig. 7 are on a logarithmic scale and the average MAC value from the landscape fires in the KNP was more than double the value we found in the laboratory measurements. Moreover, MAC values for individual KNP fires ranged from 3.3 to 16.8 m2 g−1.
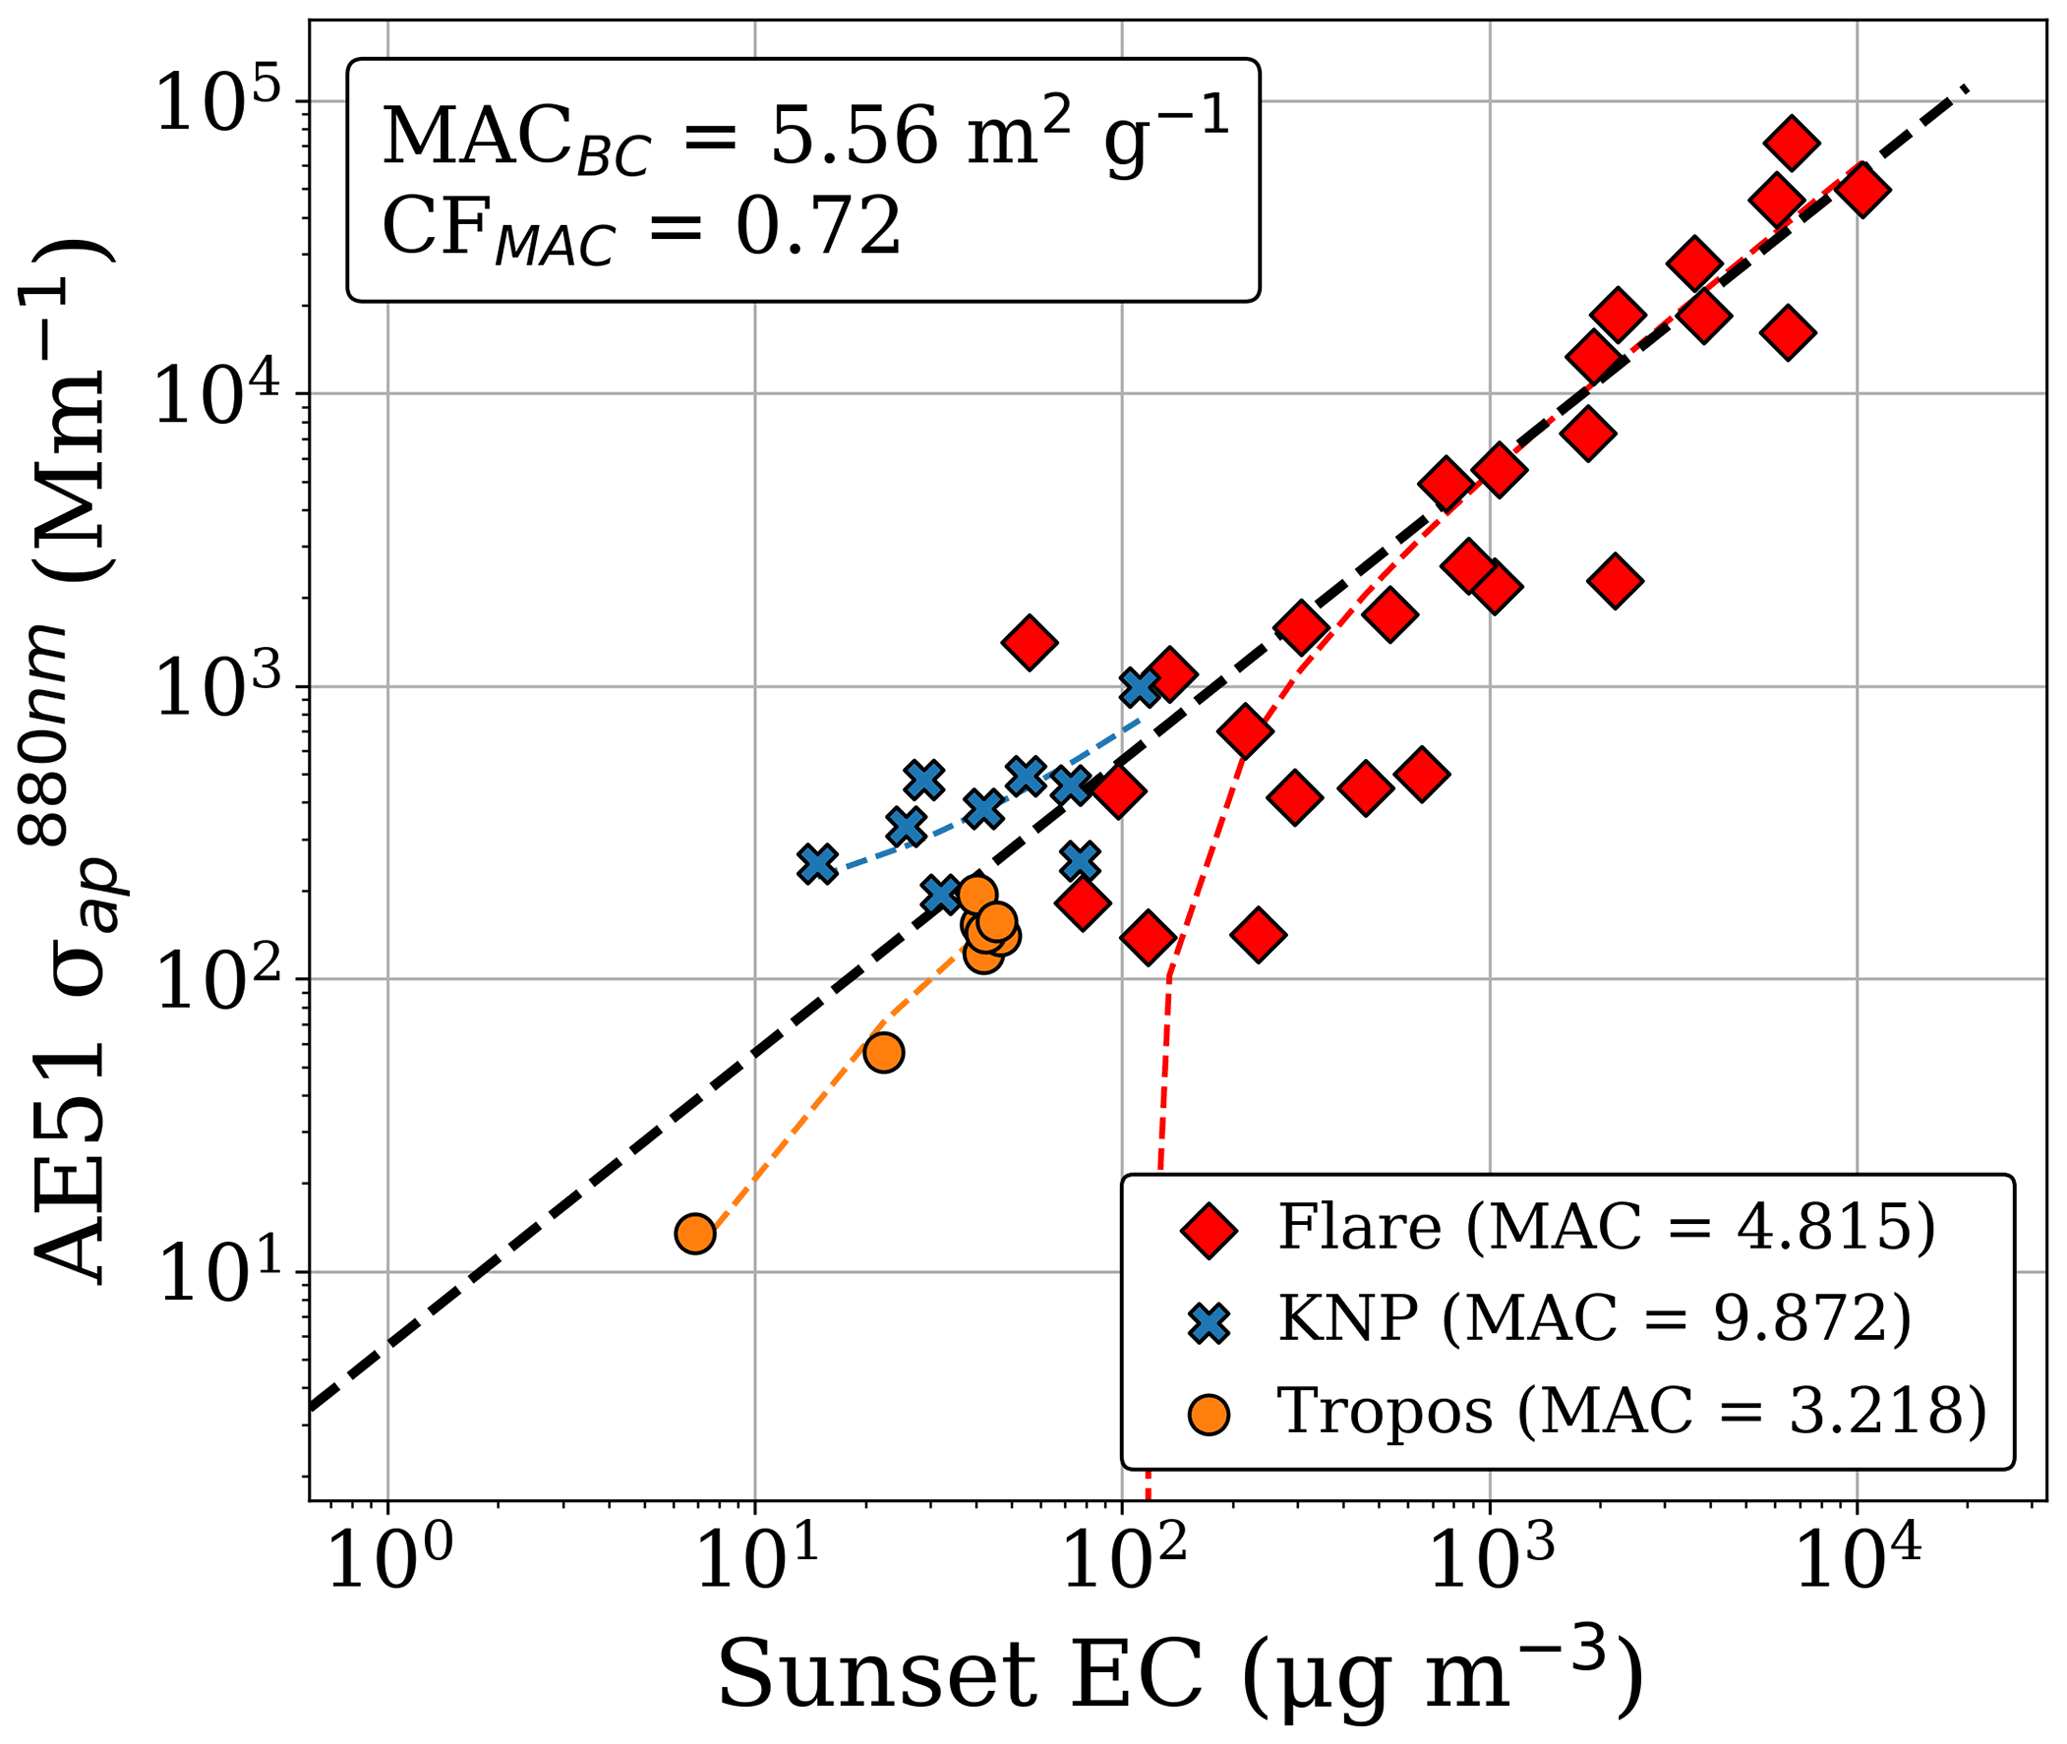
Figure 7Determination of the MAC value as the slope of the absorption coefficient at 880 nm from the AE51 and the EC desorbed from the quartz-fibre filters, determined by the Sunset analyser.
We used the empirically determined BB correction factors from the laboratory fires (AM520 CF=0.27 and CFMAC=1.28) to calculate aerosol EFs from the KNP fires. Figure 8 presents the EFs for PM2.5 and BC plotted against MCE. Since BC, PM2.5, and carbonaceous trace gasses were measured at 1 s frequency, we can calculate the EF for every second of the mast measurements (small dots) as well as the fire averages (crosses). While we found a clear negative correlation of the PM2.5 EF with MCE, our results did not indicate a significant MCE correlation with the eBC EF. The PM MCE regression line crossed 0 when MCE reached unity, whereas BC measurements from the aethalometer were still significant. This meant that during high-MCE combustion, the EF for OC diminished, causing the BC contribution to PM2.5 to increase exponentially.
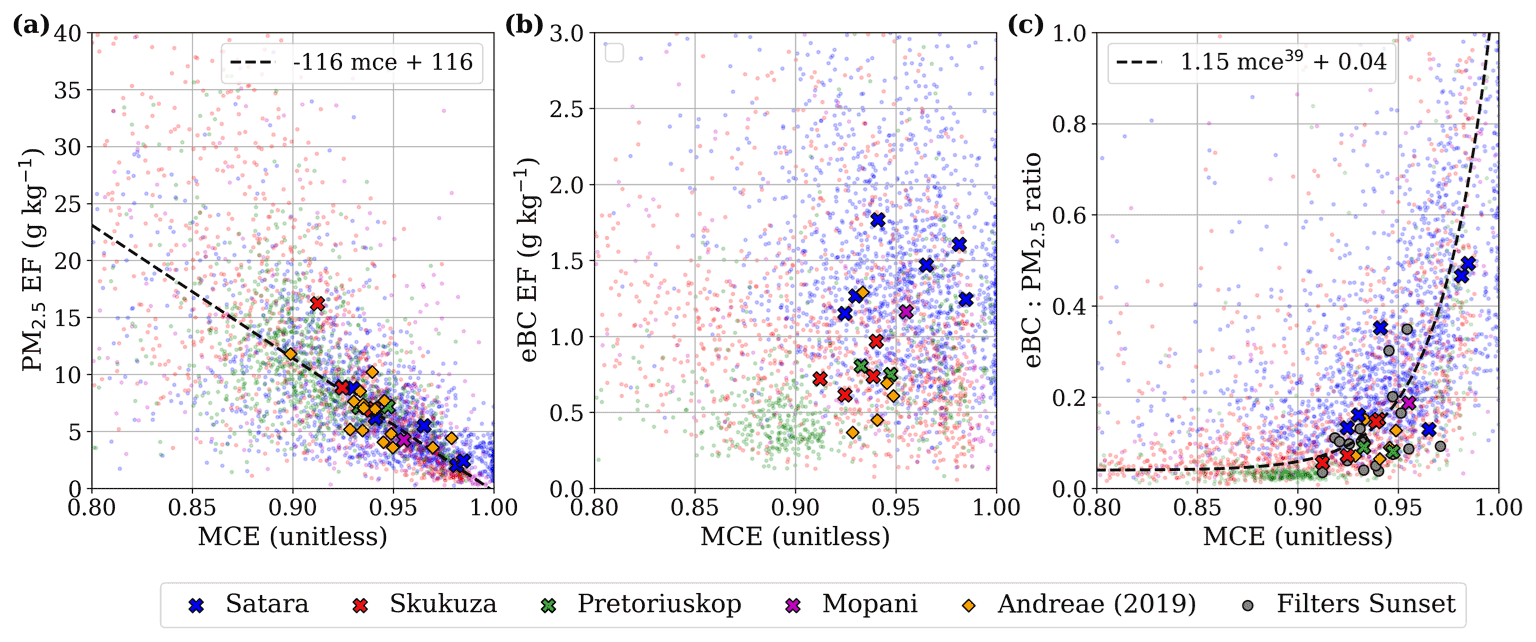
Figure 8Relation between the PM2.5 EF (a) the BC EF (b) and the eBC : PM2.5 ratio (c) with the modified combustion efficiency (MCE) in the different KNP vegetation types. Each small dot represents a 1 s measurement at the top of the mast. The large crosses represent the fire-average EF and the orange diamonds represent the study-average EF from previous savanna measurements listed by Andreae (2019). We found no significant correlation of eBC EF with the MCE.
The comparison of UAS-based and mast-based measurement was encouraging and straightforward. The results indicated that while giving similar results, the UAS can be redeployed for a multitude of times whilst repeating the measurement, following larger fires through the landscape. We focus the discussion on the implications for the calculated EFs in the KNP. Then we address the performance of the individual measurements and the empirically derived correction factors for BB particles based on the laboratory experiments. Finally, we elaborate on the uncertainties associated with these measurements.
4.1 Field-derived emission factors
Due to the large spatio-temporal variability in vegetation and weather conditions and the unpredictable nature of landscape fires, comparing and extrapolating BB EFs is challenging. Using the empirically derived correction factors from the laboratory BB experiments and the KNP field measurements (AM520 CF=0.27, CFMAC=1.28), EFs from our KNP measurements were in line with previous savanna burning studies, albeit that MCE was relatively high compared to earlier measurements using FTIR (Table 3, Andreae, 2019; Wooster et al., 2011). For aerosol emissions, the literature studies listed by Andreae (2019) include a variety of different methods; PM2.5 measurements were performed using OPCs (McMeeking et al., 2006), nephelometers (Burling et al., 2011; Cachier et al., 1995; McMeeking et al., 2006), SMPS (Desservettaz et al., 2017), or gravimetric filter analysis (e.g. Alves et al., 2010; Cachier et al., 1995; Korontzi et al., 2003; Ward and Radke, 1993; Yokelson et al., 2013), whereas BC and EC measurement studies were performed using thermal optical reflectance (TOR) (Alves et al., 2010; McMeeking et al., 2006; Yokelson et al., 2013), Aethalometer measurements (McMeeking et al., 2006) or coulometric titration (Cachier et al., 1995).
Table 3Emission factors (g kg−1) measured using the UAS method as well as those listed by Andreae (2019).

* Landsat-derived continuous fields of tree cover in 2015 (Sexton et al., 2013).
The PM2.5 EF showed a clear MCE dependence which corresponded with previous literature findings (Collier et al., 2016; Yokelson et al., 1996). Contrary to the total PM2.5 EF, we found significant BC emissions, even when the MCE approached unity. Liu et al. (2014) and Pokhrel et al. (2016) found a similar exponential relation for the BC:TC ratio with the MCE for both laboratory and landscape fires. This resulted from a diminishing OC EF, rather than an increase of the BC EF. While we did not find a significant correlation between BC EF and MCE, the fuel type appeared to be significant for the BC EF since grass-dominated Satara plots emitted up to 3 times more BC – per unit of fuel at the same fire-average MCE – than more tree-covered Pretoriuskop plots (Table 3).
4.2 Performance of the individual measurements
4.2.1 Gas measurements
The stability of GHG samples in Tedlar® bags has been previously demonstrated (Meyer et al., 2012; Silva et al., 2016) and cavity ring-down spectroscopy has been shown to be a stable and accurate method for GHG measurements under both laboratory- and field conditions (Yver Kwok et al., 2015). We frequently calibrated the CRDS analysers, and Tedlar® bags with calibration gas were measured interspersed with the smoke samples to determine the CRDS stability. Field measurements of 35 sample bags with calibration gas, spread out over 4 measurement campaigns, showed an average underestimation of −4.57 % for CO2, −1.73 % for CO, −3.59 % for CH4 and −1.36 % for N2O compared to the known reference gas composition. As calibration schemes for both analysers are linear, these underestimations were linearly transferred to the sample measurements.
4.2.2 eBC mass concentration measurements
We found that the lightweight AE51 aethalometer agreed well with both the MAAP and the AE33 multiwavelength aethalometer. This was consistent with previous measurements for city pollution (Alas et al., 2019; Pikridas et al., 2019), personal BC exposure (Cai et al., 2013), vertical atmospheric profiles (Ferrero et al., 2011), seasonal background fluctuations (Zhao et al., 2019), and crop burning emissions (Zhang et al., 2015). Pikridas et al. (2019) tested the use of UAS-fixed aerosol absorption sensors including the AE51 in ambient and diluted city pollution and found a similar correlation with BC measured by the MAAP with an R2=0.76 for a slope of 0.94. We did not find the same relation between the MAAP and the AE51 eBC measurements found by Alas et al. (2019) and Pikridas et al. (2019) for city pollution. A possible explanation for this is that biomass combustion is typically associated with higher emission levels of BrC compared to other BC sources, which would disproportionately affect the MAAP and AE51 measurements. The MAAP operates at a lower wavelength (631 nm) than the AE51 (880 nm), meaning that the absorption coefficient of the MAAP is more sensitive to BrC. We found average absorptive Ångström exponents of 4.55, 4.67, and 5.55 for the BrC fraction from wood chips, hay, and wood combustion emissions respectively. The measured absorptive Ångström exponents were high compared to field measurements for BB smoke in Africa and Brazil, ranging from 0.8 to 2.1 (Reid et al., 2005b), but were in line with BrC absorptive Ångström exponents from BB studies listed by Pokhrel et al. (2016), ranging from 3 to 19.
Although our results show a strong correlation between the AE51 and the AE33 aethalometer at the same wavelength, the AE51 underestimated eBC at low concentrations. At mass concentrations over 50 µg m−3, accuracy improved. The lower accuracy at low concentrations may in part be related to the reduced sensitivity caused by the low flow rate at which we operate the AE51 rather than by the C value. Nonetheless, the agreement between both aethalometers, considering corrections for wavelength, temporal resolution, and sensitivity, was robust. Our measurements suggest C values in the 2.14–2.78 range. In comparison, Ferrero et al. (2011) found an optimal C-value of 2.05±0.03, whereas C values found by Weingartner et al. (2003) were in the 2.13–3.90 range.
There is no “gold standard” for measuring BC concentrations, thus the use of different wavelengths, filter material, illumination angles, etc. makes comparing methods challenging. Discrepancies in filter changes, filter loading effect, and differences in temporal resolution could cause some of the variability found in the MAAP and AE51 measurements. Although the MAAP and AE33 aethalometer are often used as reference equipment, both are filter-based methods that assume a fixed MAC just like the AE51 and are therefore sensitive to scattering (Müller et al., 2011).
The ambiguous use of terms such as soot, EC, and eBC is often problematic when comparing studies. Although eBC and EC measure different properties, they are thought to be largely overlapping and EF compilations, and therefore Akagi et al. (2011) and Andreae (2019) list them in the same column without conversion. Moreover, EC measurements are used to calibrate the MAC value that aethalometers use to derive BC mass from the absorption coefficient. Even though BC is equated to EC for the purpose of calibration, EC : BC ratio measurements in the BB literature are highly variable ranging from 0.3 to 1.6 and appear to be strongly related to the aerosol type, the degree of atmospheric processing (Rigler et al., 2020; Salako et al., 2012), and the MCE of the fire (Aurell et al., 2017). Using the manufacturer-defined MAC of 7.8 m2 g−1, the BC concentrations and the difference compared to the EC concentrations were 223 µg m−3 (−71 %), 16 µg m−3 (−56 %), and 57 µg m−3 (+20 %), for the experiments at FLARE, TROPOS, and KNP respectively. Even if we apply our empirically derived MAC of 5.2 m2 g−1 for all measurements, BC concentrations and the difference with the EC concentrations were still 335 µg m−3 (−56 %), 24 µg m−3 (−34 %), and 82 µg m−3 (+76 %). The large uncertainty in the MAC value is possibly related to the fact that EC and eBC measure different properties and are susceptible to different types of measurement errors (Schmid et al., 2001). While the AE51 agrees well with high-fidelity filter-based methods, the high variability in MAC values in BB smoke remains a weak point for BC mass derivation from absorption-based measurements.
4.2.3 PM2.5 mass concentration
We found an overall AM520 CF of 0.27 for an optimal correlation of PM1 concentrations from the AM520- and the SMPS-derived PM1.0 with an R2 of 0.85. The AM520 CF ranges for individual fuel types were 0.14–0.42 for wood, 0.22–0.24 for hay, and 0.27–0.31 for wood chips. These CFs are low compared to those found by previous BB studies (Table 4).
Table 4AM520 CF results compared to previous studies.
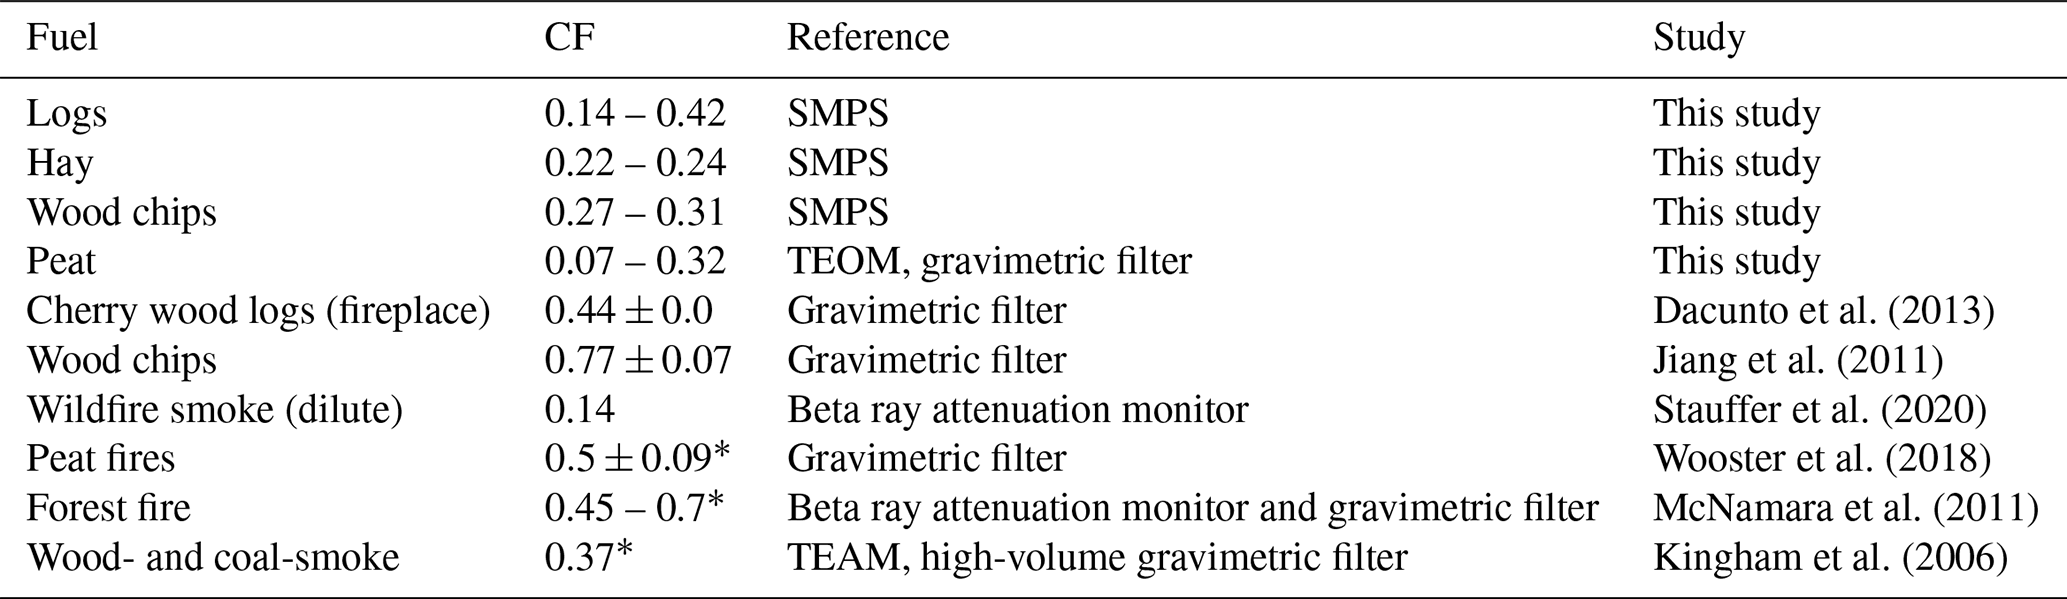
* Calibration factor determined for DustTrak™ (same initial reference: ISO 12103-1 A1).
Our CF was closer to that of Stauffer et al. (2020), who calibrated the AM520 against a beta ray attenuation monitor for diluted wildfire smoke and found a CF of 0.14. Using the gravimetric TEOM and filter measurements in PM2.5, from peat smoke, we found an average AM520 CF of 0.17 with a range of 0.07–0.32 – somewhat lower than previous field measurements in tropical peat fires by Wooster et al. (2018) using the TSI DustTrak. This may indicate substantial differences in the laboratory compared to field analyses for PM2.5 mass concentration. Cross-correlation of the UAS-mounted AM520 to five co-located AM520 modules revealed measurement errors of up to 20 %. The error margins between individual units were constant and could be compensated for by unit-specific CFs. While the UAS-mounted unit was freshly factory-calibrated, the reference units were not, after 1 year of intensive use. This could be a potential explanation for drift which could be remedied by recalibrating.
Like all OPCs, the AM520 computes particle mass concentration from particle counts based on the scattering of light by individual particles. The mass scattering efficiency (MSE) is dependent on particle size and the refractive index of the particles. For particles in the Rayleigh regime with a size parameter (the ratio of particle circumference πD to wavelength of the light λ) smaller than unity, MCE is proportional to the particle diameter cubed, whereas for larger particles MSE becomes inversely proportional to particle diameter (Moosmüller and Sorensen, 2018b). At the measurement wavelength of the AM520, a size parameter of 1 corresponds to a particle size of approximately 200 nm. Figure 9a and b show that a large portion of the BB particles measured in our laboratory experiments fall within the Rayleigh scattering regime. This indicates scattering by BB particles in the AM520 is strongly size-dependent. As the AM520 does not measure different size bins, it is not possible to use a size-resolved MSE to compute the mass concentration. The median diameter of Arizona roadside dust used for the AM520 factory calibration is 2.12 µm. Therefore, Mie scattering rather than Rayleigh scattering is the dominant scattering regime for these particles. Particle MSE at this diameter corresponds to roughly 1 m2 g−1 while at the VMD of the measured BB particles, MSE is likely to be higher (Moosmüller and Sorensen, 2018a; Rogers et al., 2005).
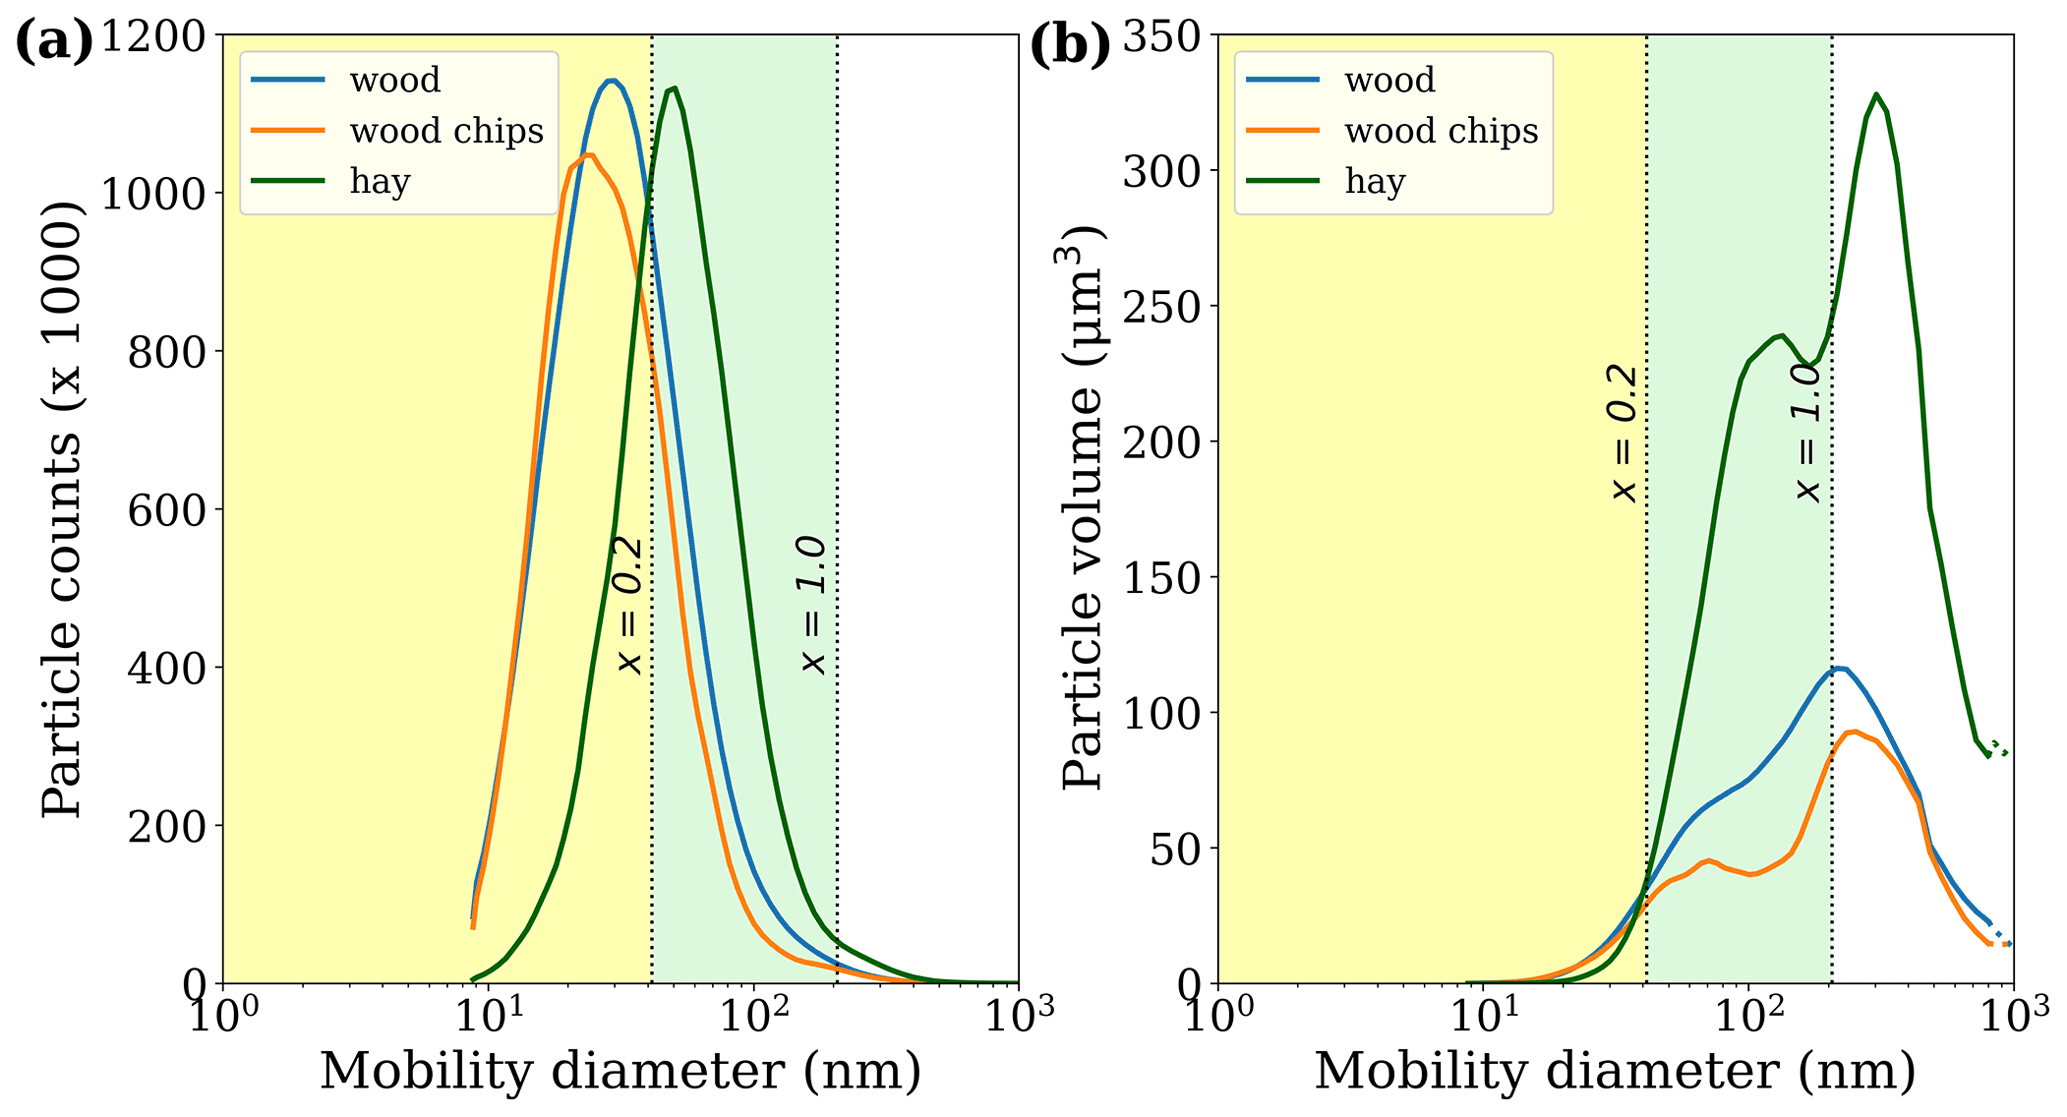
Figure 9Particle size distribution of the different fuel types. (a) Absolute particle counts in the respective mobility diameter bins. (b) The particle volume represented by the particles counted in the mobility diameter bins.
We did not observe a significant correlation between the AM520 CF and VMD or BC : PM ratio, albeit that the overall difference in particle size distribution between experiments was low (Fig. 9). With respective VMD for particles from wood chips, wood, and hay of 183, 162, and 184 nm, the average particle size was small compared to savanna and grassland fire studies in fresh smoke with VMD ranging from 230 to 300 nm (May et al., 2014; McClure et al., 2020; Reid et al., 2005a). Wildfires typically burn less efficiently compared to controlled BB under laboratory conditions (Park et al., 2013). In contrast to our findings, Dacunto et al. (2013) found the AM520 CF to be dependent on the VMD of the emitted particles, indicating that the laboratory-derived CFs may not be representative for the field measurements.
4.3 Assumptions and uncertainty analysis
There are various caveats associated with the methodology that are important for our results and further application. Here we will discuss the nature of the uncertainties and how we address them in our measurements.
4.3.1 Variability in the mass absorption cross-section for airborne BC particles
For BC measurements, the largest uncertainty originates from the mass absorption cross-section for airborne BC particles (MACair) which is used to convert absorption of airborne particles to mass concentration. In general, the MACfilter (used to convert light attenuation by a loaded filter) equals the MACair multiplied by the empirically determined multiple scattering parameter (C) (Liousse et al., 1993; Pikridas et al., 2019; Weingartner et al., 2003). The C value typically ranges from 1.5 to 2.5 and depends on the particle type as well as the filter material used and is therefore instrument dependent.
For the conversion of attenuation of light to airborne BC mass concentrations, the standard MACair values used by our analysers are m2 g−1 (7.8 m2 g−1 at 880 nm) for the aethalometers (Drinovec et al., 2015) and 6.6 m2 g−1 at 637 nm (which corresponds to 4.7 m2 g−1 at 880 nm) for the MAAP (Müller et al., 2011). Although the instruments assume fixed MAC values, the MAC in itself is dependent on the BC : OC mixing ratio (Cappa et al., 2020; Sandradewi et al., 2008), the particle size distribution, the structure of the measured BC (Conrad and Johnson, 2019; Petzold et al., 1997; Zhao et al., 2019), and the coating of soot particles by organic particles (Adachi et al., 2010; Cappa et al., 2020). MAC has an inverse linear wavelength-dependency (Zhao et al., 2019):
For BC within the Rayleigh regime, ÅAP is close to unity (Conrad and Johnson, 2019). If we assume BC in fresh smoke to exist as uncoated particles, a MACair of 7.5 m2 g−1 at a wavelength of 550 nm is advised (Bond and Bergstrom, 2006; Cheng et al., 2016). Following Eq. (15), this translates to a MACair of 4.7 m2 g−1 at a wavelength of 880 nm, which is consistent with the MAC found by Kumar et al. (2018) and the MAC used by the MAAP. However, rapid coating of BC with non-absorbing liquid organic compounds once emitted may lead to much higher values. Liousse et al. (1993, 1995) found a high MACair of 15±5 m2 g−1 for BB smoke from savannas. Aircraft measurements from Brazilian wildfires during the SCAR-B campaign also found high MACair values ranging from 5.2 to 19.3 m2 g−1 with an average value of 12.1 m2 g−1 (Martins et al., 1998) at 550 nm. This may in part explain why we found MAC values for the laboratory studies to be much lower than those measured in the KNP landscape fires.
At the AE51 measurement wavelength of 880 nm, the MAC is thought to be relatively stable (Cappa et al., 2020), whereas at shorter wavelengths BrC causes larger fluctuations. However, also at the 880 nm wavelength we found highly variable MAC values for different fires with an average of 5.2±5.1 m2 g−1. This confirms earlier findings by Salako et al. (2012) that universally applying MAC values to aerosols with different optical properties thus possibly results in large measurement errors. On the UAS, we deployed co-located EC measurements allowing for fire-averaged MAC values. We found that accounting for variability within individual fires was difficult since separate filters for smaller periods of the fire (e.g. the flaming and smouldering phase) resulted in insufficient filter loading.
4.3.2 Filter loading effect
The filter loading effect is considered one of the major weaknesses of the AE51 measurement (Drinovec et al., 2015; Good et al., 2017; Weingartner et al., 2003). Although loading correction is not required below a threshold value of 10 %–20 % (Weingartner et al., 2003), we corrected all AE51 measurements using the Weingartner correction (Sect 2.3.2). For the observed attenuation range of 0 %–35 % (compared to the initial laser transmittance), we found a slight average decrease in Weingartner-corrected AE51 eBC compared to the AE33 eBC measurements of 0.21 % per % of attenuation (Fig. 10). This is consistent with findings by Good et al. (2017), who noted that the Weingartner correction tends to undercompensate while the method used by the AE33 tends to overcompensate at this interval. In the field, filters are changed every fire and the flow rate is set to 50 mL min−1. Therefore, although we expect high BC concentrations, we expect performance loss due to filter loading to be limited. However, if attenuation is higher than 35 %, we may revert to other load-compensation methods described by Good et al. (2017).
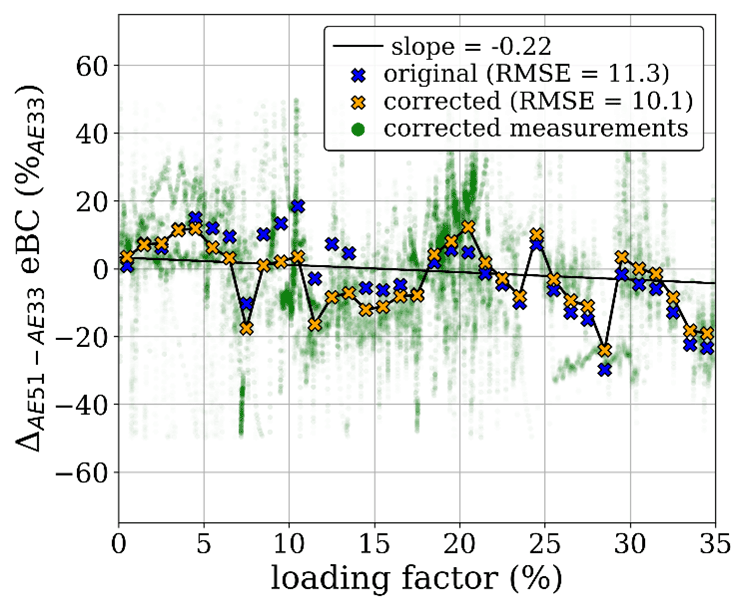
Figure 10Dependence of the difference between the Weingartner-corrected eBC from the AE51 and the Drinovec-corrected AE33 versus the loading factor of the AE51 filter (green dots). The blue and orange crosses represent the uncorrected and Weingartner-corrected 1 % averaged differences respectively.
4.3.3 Relative humidity and temperature
At high environmental humidity levels, the density, refractive index, and morphology of aerosol particles change as a result of H2O condensation. If not accounted for, hygroscopic growth may affect the MSE and therefore reduce measurement accuracy of OPCs (Gu et al., 2016; Jayaratne et al., 2018; Li et al., 2018; Mehadi et al., 2020). For relative humidity (RH) between 60 % and 95 %, Gu et al. (2016) found an exponential increase in the diameter of spherical particles leading to a linear decrease in the refractive index. Aethalometer measurements are also sensitive to sudden changes in RH and temperature (Cai et al., 2013; Düsing et al., 2019). Water entering the filter may cause the fibres in the filter to swell leading to an increase in light scattering. To our knowledge, RH is not adjusted for by either the AM520 or the AE51. Adding a diffusion dryer can eliminate these problems; however, it may also affect measurements due to losses and discrepancies between the measurement and reference conditions.
Hygroscopic growth occurs when the RH exceeds the deliquescence point of a chemical substance (Jayaratne et al., 2018). Semeniuk et al. (2007) studied the hygroscopic behaviour of BB aerosols under an environmental transmission electron microscope. They found that ambient particles from biomass burning smoke had a relatively high deliquescence point and typically took up water in the range 80 %–100 % RH. Our own unpublished RH measurements, covering over 2400 UAS bag sample EF measurements in dry-season savannas, show an RH range of 1.5 %–47.3 % with an average of 17 % and an SD of 6.8 %. The average variation within a single fire was 10 %, which resulted from the diurnal temperature cycle rather than the sudden change that would affect BC measurements. The high BC concentrations found in BB plumes enable a very low flow rate (50 mL min−1) and we did not find the distinctive negative spikes in BC associated with humidity drops. Therefore, we do not expect significant condensation-induced effects on either the PM or the BC measurement.
4.3.4 Effect of BC on PM measurement performance
The large differences in particle characteristics from smouldering and flaming combustion products result in an inhomogeneous composition of BB aerosols (Moosmüller et al., 2009). One of the greatest uncertainties in OPCs originates from the poorly understood, complex refraction index of soot particles (Sorensen, 2001). Increased concentrations of BC and BrC lead to a decrease in scattering efficiency of the total aerosol mass. OPCs that rely on fixed scattering indices for the conversion to aerosol mass may underestimate the total mass concentration due to reduced scattering in BB particles. Also, BC particles tend to have a non-spherical morphology (Chakrabarty et al., 2006). The assumption of sphericity made by OPCs is therefore incorrect and light scattering becomes much more complex (Sorensen, 2001). Mehadi et al. (2020) found that for several low-cost OPCs, the ratio had a significant impact on the measurement accuracy, with higher ratios leading to lower OPC readings compared with a BAM 1020 reference instrument. BC exists as agglomerates which are built up of spherules with individual diameters as small as 30–50 nm (Chakrabarty et al., 2006). Combined with their low SSA of 0.46 (Müller et al., 2011), this may lead to insufficient scattering by some BC particles to be detected by the AM520. This may explain why the PM MCE regression line crossed 0 when MCE reached unity, whereas BC measurements from the aethalometer were still significant. Since the SMPS uses impaction rather than light scattering to count aerosols, SMPS measurements should not be affected by optical properties of particles. We did not find a significant dependence of the AM520 CF on the eBC : PM1 ratio.
4.3.5 Calculation through density
Carbonaceous particles, in particular BC, have lower density compared to mineral dust. Zhai et al. (2017) calculated the effective density of BB particles in the size range of 50–400 nm. They used an aerosol particle mass analyser to measure the mass of particles that had been classified according to electrical mobility by a differential mobility analyser DMA. They found dominant density modes in the effective density distributions of 200 and 400 nm mobility-selected particles of 1.40 and 1.35 g cm−3 respectively. In this study, particle density for the SMPS was assumed to be constant at 1.5 g cm−3, which is a typical density for wood-burning primary organic aerosols based on Kumar et al. (2018) and Moosmüller et al. (2009).
4.4 Caveats of a UAS-based approach
According to Ward and Radke (1993), to evaluate an “average” EF or emission ratio that is representative of the overall flaming and smouldering combustion phases, the emissions must be sampled at a rate proportional to the rate of carbon release in each phase over the duration of the fire. This was done by Wooster et al. (2011) using airborne fire radiative power (FRP) measurements made concurrently with the trace gas observations over the KNP fires. Such FRP measurements were not available here, and although we measured the atmospheric concentrations continuously as the different stages of combustion products passed the mast, we did not measure the fluxes. During the flaming phase, updraft of the hot reaction products is much more rapid than during the residual smouldering phase (Ward and Radke, 1993). We let the mast measurement run for as long as possible but were limited by analyser battery capacity. In some experiments, including the example in Fig. 2, small peaks of RSC emissions like CH4, CO and PM2.5 were still recorded upon shutting down the measurement. This indicates a slight underestimation of the significance of RSC for these plots. Nonetheless, the low contribution of RSC was consistent with previous mast measurements in Brazilian savanna from Ward et al. (1992) as well as previous studies in the KNP (Cofer et al., 1996; Wooster et al., 2011). In savanna vegetation, grass and fine fuels dominate the fuel mixture and the contribution of RSC-prone fuels is limited. Vegetation types where the portion of fuel combusted in RSC is more substantial (e.g. forests and peatlands) may call for a different measurement approach.
While the proposed UAS-based sampling method lacks the high temporal resolution of continuous EF measurement from the mast, the ability to follow the fire front as it passes through the landscape makes it much easier to obtain large amounts of measurements. Erecting a mast is tedious and time-consuming. Many attempts led to non-ideal measurements, e.g. when the wind direction changed and blew the smoke away from the top of the mast, or when the fire front did not spread and burn the vegetation surrounding the mast, or the “backfire” did. UAS measurements like those described by Vernooij et al. (2021) are more versatile, e.g. allowing 60–80 gas samples for a single fire over the course of several hours. This results in a much higher coverage of the spatial variability in the fuel and the temporal variability in fire characteristics as weather conditions change.
4.5 Recommendations and future improvements
UAS payloads and lightweight sensors are continuously improving, which means the UAS can in future be equipped with more sophisticated sensors. The conversion of scattering parameters to particle mass may benefit from size-dependent CF. Although high concentration measurements may require some additional dilution, lightweight sensors like the Portable Optical Particle Spectrometer (POPS) (Mei et al., 2020) can measure particle size distribution. We also found that in fresh smoke, the contribution of BrC to the total absorption of BB particles was significant. Measurements at an additional short-wavelength band may therefore benefit absorption measurements. In the future, further tests of the set-up could be performed using additional inter-comparisons of both aerosol and GHG EFs with mast measurements that include vertical velocity (e.g. FASS tower; Hao et al., 1996) as well as top–down approaches (e.g. van der Velde et al., 2020).
We propose a UAS-based methodology for measuring GHG and aerosol EFs in fresh smoke from landscape fires. In a series of laboratory and field experiments we addressed the main uncertainties considered with the methodology and calculated correction factors for the measurement of fresh BB particles. We tested our UAS set-up against a continuous measuring mast and calculated fire-averaged EFs using both set-ups. Overall, fire-averaged EFs from the UAS agreed well with measurements from the mast and were in line with the BB literature. While variability in the PM2.5 EF was well-explained by the MCE, we found no significant correlation between MCE and BC EF. The UAS offers flexibility as fire behaviour and weather conditions change and enables sampling at different heights within the plume.
Although our results highlight the potential of UAS-based EF measurements, aerosol EF measurements remain prone to several uncertainties related to atmospheric processes. Particle mass concentration measured by the lightweight AM520 was compared with SMPS and gravimetric filter measurements. We found the optimal calibration factors to be used for the AM520 in BB smoke to be 0.27. However, with calibration factor ranges of 0.14–0.42 for wood, 0.22–0.24 for hay, 0.27–0.31 for wood chips, and 0.07–0.32 for peat samples, there was significant variability between fires. Equivalent black carbon (eBC) mass concentrations from the AE51 aethalometer agreed well with eBC measurements from the AE33 at a wavelength of 880 nm and absorption coefficient measurements from the MAAP. Optimal agreement was achieved using a correction factor of 1.3, although this may be related to low overall concentrations (<50 µg m−3 eBC). A caveat for eBC measurements, indicated by both our own findings and the literature, is that a pre-set manufacturer MAC cannot be universally applied to BB measurements. BB particle properties and atmospheric conditions are highly variable, which resulted in a wide range of MAC values (2.1–25.4 m2 g−1) for the individual fires we measured. This indicates that MAC correction with EC remains a continuous necessity in order to reduce this uncertainty. This is not unique to light-weight aethalometers but affects all methods that use fixed MAC values to calculate eBC mass concentrations from absorption coefficients. While significant uncertainty remains for both the eBC from the AE51 aethalometer and PM2.5 from the AM520 optical particle counter, much of this uncertainty is inherently associated with aerosol mass derivations from optical properties, and thus similarly applicable to high-fidelity analysers. Overall, we found that the quality of the data is sufficient to measure EFs in fresh biomass smoke if proper corrections are applied and the described caveats are avoided.
| (e)BC | (Equivalent) black carbon |
| EC | Elemental carbon |
| σATN | Attenuation coefficient |
| σAP | Absorption coefficient |
| C | Optical enhancement factor |
| ω0 | Single-scattering albedo |
| MACair | Mass absorption coefficient of particles |
| suspended in air | |
| MACfilter | Mass absorption coefficient of particles on |
| loaded on a filter | |
| ÅAP | Ångström exponent |
| EFi | Emission factor of species (i) |
All the data presented in this study are available from the authors upon request.
RV, GRvdW, PW, and NS designed the study; RV, PW, MW, LP, and MG conducted the experiments in the laboratory; RV, PW, MW, GR, and TS conducted the field measurements; RV and UD conducted the aerosol analyses on the samples. RV wrote the manuscript with help from PW, MW, NS, and GRvdW.
The contact author has declared that none of the authors has any competing interests.
Publisher's note: Copernicus Publications remains neutral with regard to jurisdictional claims in published maps and institutional affiliations.
This research has been supported by the Netherlands Organization for Scientific Research (NWO) through the Vici scheme research programme, no. 016.160.324. This work has also received funding from the European Union's Horizon 2020 research and innovation programme through the EUROCHAMP-2020 Infrastructure Activity under grant agreement no. 730997. Part of this work was supported by the COST Action CA16109 COLOSSAL Chemical On-Line composition and source apportionment of fine aerosol.
This research has been supported by the Aard- en Levenswetenschappen, Nederlandse Organisatie voor Wetenschappelijk Onderzoek (grant no. 016.160.324) and the Horizon 2020 Framework Programme, H2020 European Institute of Innovation and Technology (EUROCHAMP-2020 (grant no. 730997)).
This paper was edited by Glenn Wolfe and reviewed by two anonymous referees.
Adachi, K., Chung, S. H., and Buseck, P. R.: Shapes of soot aerosol particles and implications for their effects on climate, J. Geophys. Res., 115, D15206, https://doi.org/10.1029/2009JD012868, 2010.
Akagi, S. K., Yokelson, R. J., Wiedinmyer, C., Alvarado, M. J., Reid, J. S., Karl, T., Crounse, J. D., and Wennberg, P. O.: Emission factors for open and domestic biomass burning for use in atmospheric models, Atmos. Chem. Phys., 11, 4039–4072, https://doi.org/10.5194/acp-11-4039-2011, 2011.
Akagi, S. K., Yokelson, R. J., Burling, I. R., Meinardi, S., Simpson, I., Blake, D. R., McMeeking, G. R., Sullivan, A., Lee, T., Kreidenweis, S., Urbanski, S., Reardon, J., Griffith, D. W. T., Johnson, T. J., and Weise, D. R.: Measurements of reactive trace gases and variable O3 formation rates in some South Carolina biomass burning plumes, Atmos. Chem. Phys., 13, 1141–1165, https://doi.org/10.5194/acp-13-1141-2013, 2013.
Alas, H. D. C., Weinhold, K., Costabile, F., Di Ianni, A., Müller, T., Pfeifer, S., Di Liberto, L., Turner, J. R., and Wiedensohler, A.: Methodology for high-quality mobile measurement with focus on black carbon and particle mass concentrations, Atmos. Meas. Tech., 12, 4697–4712, https://doi.org/10.5194/amt-12-4697-2019, 2019.
Alves, C. A., Gonçalves, C., Pio, C. A., Mirante, F., Caseiro, A., Tarelho, L., Freitas, M. C., and Viegas, D. X.: Smoke emissions from biomass burning in a Mediterranean shrubland, Atmos. Environ., 44, 3024–3033, https://doi.org/10.1016/j.atmosenv.2010.05.010, 2010.
Andreae, M. O.: Emission of trace gases and aerosols from biomass burning – an updated assessment, Atmos. Chem. Phys., 19, 8523–8546, https://doi.org/10.5194/acp-19-8523-2019, 2019.
Andreae, M. O. and Merlet, P.: Emission of trace gases and aerosols from biomass burning, Biogeochemistry, 15, 955–966, https://doi.org/10.1029/2000GB001382, 2001.
Aurell, J., Gullett, B. K., Tabor, D., and Yonker, N.: Emissions from prescribed burning of timber slash piles in Oregon, Atmos. Environ., 150, 395–406, https://doi.org/10.1016/j.atmosenv.2016.11.034, 2017.
Aurell, J., Gullett, B., Holder, A., Kiros, F., Mitchell, W., Watts, A., and Ottmar, R.: Wildland fire emission sampling at Fishlake National Forest, Utah using an unmanned aircraft system, Atmos. Environ., 247, 118193, https://doi.org/10.1016/j.atmosenv.2021.118193, 2021.
Barker, P. A., Allen, G., Gallagher, M., Pitt, J. R., Fisher, R. E., Bannan, T., Nisbet, E. G., Bauguitte, S. J.-B., Pasternak, D., Cliff, S., Schimpf, M. B., Mehra, A., Bower, K. N., Lee, J. D., Coe, H., and Percival, C. J.: Airborne measurements of fire emission factors for African biomass burning sampled during the MOYA campaign, Atmos. Chem. Phys., 20, 15443–15459, https://doi.org/10.5194/acp-20-15443-2020, 2020.
Bauer, J. J., Yu, X. Y., Cary, R., Laulainen, N., and Berkowitz, C.: Characterization of the sunset semi-continuous carbon aerosol analyzer, J. Air Waste Manag. Assoc., 59, 826–833, https://doi.org/10.3155/1047-3289.59.7.826, 2009.
Bellouin, N., Quaas, J., Gryspeerdt, E., Kinne, S., Stier, P., Watson-Parris, D., Boucher, O., Carslaw, K. S., Christensen, M., Daniau, A. L., Dufresne, J. L., Feingold, G., Fiedler, S., Forster, P., Gettelman, A., Haywood, J. M., Lohmann, U., Malavelle, F., Mauritsen, T., McCoy, D. T., Myhre, G., Mülmenstädt, J., Neubauer, D., Possner, A., Rugenstein, M., Sato, Y., Schulz, M., Schwartz, S. E., Sourdeval, O., Storelvmo, T., Toll, V., Winker, D., and Stevens, B.: Bounding Global Aerosol Radiative Forcing of Climate Change, Rev. Geophys., 58, e2019RG000660, https://doi.org/10.1029/2019RG000660, 2020.
Beringer, J., Hutley, L. B., Tapper, N. J., and Cernusak, L. A.: Savanna fires and their impact on net ecosystem productivity in North Australia, Glob. Change Biol., 13, 990–1004, https://doi.org/10.1111/j.1365-2486.2007.01334.x, 2007.
Biggs, H. C., Dunne, T. T., Govender, N., and Potgieter, A. L. F.: Experimental burn plot trial in the Kruger National Park : history, experimental design and suggestions for data analysis, Koedoe, 46, a35, https://doi.org/10.4102/koedoe.v46i1.35, 2003.
Bond, T. C. and Bergstrom, R. W.: Light absorption by carbonaceous particles: An investigative review, Aerosol Sci. Technol., 40, 27–67, https://doi.org/10.1080/02786820500421521, 2006.
Bond, T. C., Doherty, S. J., Fahey, D. W., Forster, P. M., Berntsen, T., Deangelo, B. J., Flanner, M. G., Ghan, S., Kärcher, B., Koch, D., Kinne, S., Kondo, Y., Quinn, P. K., Sarofim, M. C., Schultz, M. G., Schulz, M., Venkataraman, C., Zhang, H., Zhang, S., Bellouin, N., Guttikunda, S. K., Hopke, P. K., Jacobson, M. Z., Kaiser, J. W., Klimont, Z., Lohmann, U., Schwarz, J. P., Shindell, D., Storelvmo, T., Warren, S. G., and Zender, C. S.: Bounding the role of black carbon in the climate system: A scientific assessment, J. Geophys. Res.-Atmos., 118, 5380–5552, https://doi.org/10.1002/jgrd.50171, 2013.
Brown, H., Liu, X., Pokhrel, R., Murphy, S., Lu, Z., Saleh, R., Mielonen, T., Kokkola, H., Bergman, T., Myhre, G., Skeie, R. B., Watson-Paris, D., Stier, P., Johnson, B., Bellouin, N., Schulz, M., Vakkari, V., Beukes, J. P., van Zyl, P. G., Liu, S., and Chand, D.: Biomass burning aerosols in most climate models are too absorbing, Nat. Commun., 12, 1–15, https://doi.org/10.1038/s41467-020-20482-9, 2021.
Burling, I. R., Yokelson, R. J., Akagi, S. K., Urbanski, S. P., Wold, C. E., Griffith, D. W. T., Johnson, T. J., Reardon, J., and Weise, D. R.: Airborne and ground-based measurements of the trace gases and particles emitted by prescribed fires in the United States, Atmos. Chem. Phys., 11, 12197–12216, https://doi.org/10.5194/acp-11-12197-2011, 2011.
Cachier, H., Liousse, C., Buat-Menard, P., and Gaudichet, A.: Particulate content of savanna fire emissions, J. Atmos. Chem., 22, 123–148, https://doi.org/10.1007/BF00708185, 1995.
Cai, J., Yan, B., Kinney, P. L., Perzanowski, M. S., Jung, K. H., Li, T., Xiu, G., Zhang, D., Olivo, C., Ross, J., Miller, R. L., and Chillrud, S. N.: Optimization approaches to ameliorate humidity and vibration related issues using the MicroAeth black carbon monitor for personal exposure measurement, Aerosol Sci. Tech., 47, 1196–1204, https://doi.org/10.1080/02786826.2013.829551, 2013.
Cappa, C. D., Lim, C. Y., Hagan, D. H., Coggon, M., Koss, A., Sekimoto, K., de Gouw, J., Onasch, T. B., Warneke, C., and Kroll, J. H.: Biomass-burning-derived particles from a wide variety of fuels – Part 2: Effects of photochemical aging on particle optical and chemical properties, Atmos. Chem. Phys., 20, 8511–8532, https://doi.org/10.5194/acp-20-8511-2020, 2020.
Carter, T. S., Heald, C. L., Jimenez, J. L., Campuzano-Jost, P., Kondo, Y., Moteki, N., Schwarz, J. P., Wiedinmyer, C., Darmenov, A. S., da Silva, A. M., and Kaiser, J. W.: How emissions uncertainty influences the distribution and radiative impacts of smoke from fires in North America, Atmos. Chem. Phys., 20, 2073–2097, https://doi.org/10.5194/acp-20-2073-2020, 2020.
Cavalli, F., Viana, M., Yttri, K. E., Genberg, J., and Putaud, J.-P.: Toward a standardised thermal-optical protocol for measuring atmospheric organic and elemental carbon: the EUSAAR protocol, Atmos. Meas. Tech., 3, 79–89, https://doi.org/10.5194/amt-3-79-2010, 2010.
Chakrabarty, R. K., Moosmüller, H., Garro, M. A., Arnott, W. P., Walker, J., Susott, R. A., Babbitt, R. E., Wold, C. E., Lincoln, E. N., and Hao, W. M.: Emissions from the laboratory combustion of widland fuels: Particle morphology and size, J. Geophys. Res., 111, D07204, https://doi.org/10.1029/2005JD006659, 2006.
Cheng, Y., Engling, G., Moosmüller, H., Arnott, W. P., Chen, A. L. W., Wold, C. E., Hao, W. M., and He, K. bin: Light absorption by biomass burning source emissions, Atmos. Environ., 127, 347–354, https://doi.org/10.1016/j.atmosenv.2015.12.045, 2016.
Christian, T. J., Kleiss, B., Yokelson, R. J., Holzinger, R., Crutzen, P. J., Hao, W. M., Saharjo, B. H., and Ward, D. E.: Comprehensive laboratory measurements of biomass-burning emissions: 1. Emissions from Indonesian, African, and other fuels, J. Geophys. Res., 108, 4719, https://doi.org/10.1029/2003jd003704, 2003.
Cofer, W. R., Levine, J. S., Winstead, E. L., Cahoon, D. R., Sebacher, D. I., Pinto, P., and Stocks, B. J.: Source compositions of trace gases released during African savanna fires, J. Geophys. Res., 101, 23597–23602, 1996.
Collier, S., Zhou, S., Onasch, T. B., Jaffe, D. A., Kleinman, L., Sedlacek, A. J., Briggs, N. L., Hee, J., Fortner, E., Shilling, J. E., Worsnop, D., Yokelson, R. J., Parworth, C., Ge, X., Xu, J., Butterfield, Z., Chand, D., Dubey, M. K., Pekour, M. S., Springston, S., and Zhang, Q.: Regional Influence of Aerosol Emissions from Wildfires Driven by Combustion Efficiency: Insights from the BBOP Campaign, Environ. Sci. Technol., 50, 8613–8622, https://doi.org/10.1021/acs.est.6b01617, 2016.
Conrad, B. M. and Johnson, M. R.: Mass absorption cross-section of flare-generated black carbon: Variability, predictive model, and implications, Carbon, 149, 760–771, https://doi.org/10.1016/j.carbon.2019.04.086, 2019.
Dacunto, P. J., Cheng, K. C., Acevedo-Bolton, V., Jiang, R. T., Klepeis, N. E., Repace, J. L., Ott, W. R., and Hildemann, L. M.: Real-time particle monitor calibration factors and PM2.5 emission factors for multiple indoor sources, Environ. Sci.-Proc. Imp., 15, 1511–1519, https://doi.org/10.1039/c3em00209h, 2013.
Desservettaz, M., Paton-Walsh, C., Griffith, D. W. T., Kettlewell, G., Keywood, M. D., Vanderschoot, M. V., Ward, J., Mallet, M. D., Milic, A., Miljevic, B., Ristovski, Z. D., Howard, D., Edwards, G. C., and Atkinson, B.: Emission factors of trace gases and particles from tropical savanna fires in Australia, J. Geophys. Res.-Atmos., 122, 6059–6074, https://doi.org/10.1002/2016JD025925, 2017.
DiMiceli, C., Carroll, M., Sohlberg, R., Kim, D., Kelly, M., and Townshend, J.: MOD44B MODIS/Terra Vegetation Continuous Fields Yearly L3 Global 250m SIN Grid V006, NASA EOSDIS Land Processes DAAC [data set], https://doi.org/10.5067/MODIS/MOD44B.006, 2015.
Drinovec, L., Močnik, G., Zotter, P., Prévôt, A. S. H., Ruckstuhl, C., Coz, E., Rupakheti, M., Sciare, J., Müller, T., Wiedensohler, A., and Hansen, A. D. A.: The “dual-spot” Aethalometer: an improved measurement of aerosol black carbon with real-time loading compensation, Atmos. Meas. Tech., 8, 1965–1979, https://doi.org/10.5194/amt-8-1965-2015, 2015.
Düsing, S., Wehner, B., Müller, T., Stöcker, A., and Wiedensohler, A.: The effect of rapid relative humidity changes on fast filter-based aerosol-particle light-absorption measurements: uncertainties and correction schemes, Atmos. Meas. Tech., 12, 5879–5895, https://doi.org/10.5194/amt-12-5879-2019, 2019.
Eck, T. F., Holben, B. N., Reid, J. S., Mukelabai, M. M., Piketh, S. J., Torres, O., Jethva, H. T., Hyer, E. J., Ward, D. E., Dubovik, O., Sinyuk, A., Schafer, J. S., Giles, D. M., Sorokin, M., Smirnov, A., and Slutsker, I.: A seasonal trend of single scattering albedo in southern African biomass-burning particles: Implications for satellite products and estimates of emissions for the world's largest biomass-burning source, J. Geophys. Res.-Atmos., 118, 6414–6432, https://doi.org/10.1002/jgrd.50500, 2013.
Ferrero, L., Mocnik, G., Ferrini, B. S., Perrone, M. G., Sangiorgi, G., and Bolzacchini, E.: Vertical profiles of aerosol absorption coefficient from micro-Aethalometer data and Mie calculation over Milan, Sci. Total Environ., 409, 2824–2837, https://doi.org/10.1016/j.scitotenv.2011.04.022, 2011.
Gertenbach, W. P. D.: Landscapes of the Kruger National Park, Koedoe, 26, 9–121, https://doi.org/10.4102/koedoe.v26i1.591, 1983.
Good, N., Mölter, A., Peel, J. L., and Volckens, J.: An accurate filter loading correction is essential for assessing personal exposure to black carbon using an Aethalometer, J. Expo. Sci. Env. Epid., 27, 409–416, https://doi.org/10.1038/jes.2016.71, 2017.
Govender, N., Trollope, W. S. W., and Van Wilgen, B. W.: The effect of fire season, fire frequency, rainfall and management on fire intensity in savanna vegetation in South Africa, J. Appl. Ecol., 43, 748–758, https://doi.org/10.1111/j.1365-2664.2006.01184.x, 2006.
Gu, F., Zhang, J., Chen, Y., Cui, F., Liu, Y., Wei, Y., and Shen, L.: The influence of relative humidity on the scattered light signal of aerosol concentration measurement system, edited by: Zhang, Y., Wu, F., Xu, M., and To, S., SPIE, p. 968404, https://doi.org/10.1117/12.2243535, 2016.
Gundel, L. A., Dod, R. L., Rosen, H.. and Novakov, T.: The relationship between optical attenuation and black carbon concentration for ambient and source particles, Sci. Total Environ., 36, 197–202, https://doi.org/10.1016/0048-9697(84)90266-3, 1984.
Heintzenberg, J.: Properties of the log-normal particle size distribution, Aerosol Sci. Tech., 21, 46–48, https://doi.org/10.1080/02786829408959695, 1994.
Jayaratne, R., Liu, X., Thai, P., Dunbabin, M., and Morawska, L.: The influence of humidity on the performance of a low-cost air particle mass sensor and the effect of atmospheric fog, Atmos. Meas. Tech., 11, 4883–4890, https://doi.org/10.5194/amt-11-4883-2018, 2018.
Jiang, R. T., Acevedo-Bolton, V., Cheng, K. C., Klepeis, N. E., Ott, W. R., and Hildemann, L. M.: Determination of response of real-time SidePak AM510 monitor to secondhand smoke, other common indoor aerosols, and outdoor aerosol, J. Environ. Monitor., 13, 1695–1702, https://doi.org/10.1039/c0em00732c, 2011.
Kingham, S., Durand, M., Aberkane, T., Harrison, J., Gaines Wilson, J., and Epton, M.: Winter comparison of TEOM, MiniVol and DustTrak PM10 monitors in a woodsmoke environment, Atmos. Environ., 40, 338–347, https://doi.org/10.1016/j.atmosenv.2005.09.042, 2006.
Klimont, Z., Kupiainen, K., Heyes, C., Purohit, P., Cofala, J., Rafaj, P., Borken-Kleefeld, J., and Schöpp, W.: Global anthropogenic emissions of particulate matter including black carbon, Atmos. Chem. Phys., 17, 8681–8723, https://doi.org/10.5194/acp-17-8681-2017, 2017.
Korontzi, S.: Seasonal patterns in biomass burning emissions from southern African vegetation fires for the year 2000, Glob. Change Biol., 11, 1680–1700, https://doi.org/10.1111/j.1365-2486.2005.001024.x, 2005.
Korontzi, S., Ward, D. E., Susott, R. A., Yokelson, R. J., Justice, C. O., Hobbs, P. V., Smithwick, E. A. H., and Hao, W. M.: Seasonal variation and ecosystem dependence of emission factors for selected trace gases and PM2.5 for southern African savanna fires, J. Geophys. Res., 108, 4758, https://doi.org/10.1029/2003JD003730, 2003.
Kumar, N. K., Corbin, J. C., Bruns, E. A., Massabó, D., Slowik, J. G., Drinovec, L., Močnik, G., Prati, P., Vlachou, A., Baltensperger, U., Gysel, M., El-Haddad, I., and Prévôt, A. S. H.: Production of particulate brown carbon during atmospheric aging of residential wood-burning emissions, Atmos. Chem. Phys., 18, 17843–17861, https://doi.org/10.5194/acp-18-17843-2018, 2018.
Landry, J.-S. and Matthews, H. D.: Non-deforestation fire vs. fossil fuel combustion: the source of CO2 emissions affects the global carbon cycle and climate responses, Biogeosciences, 13, 2137–2149, https://doi.org/10.5194/bg-13-2137-2016, 2016.
Li, C.-R., Chih-Ning, Hsu, Lin, Y.-C., Hung, M.-W., Yang, C.-C., Tsai, H.-Y., Chang, Y.-J., Huang, K.-C., and Hsiao, W.-T.: Integrating temperature, humidity, and optical aerosol sensors for a wireless module for three-dimensional space monitoring, in 2018 IEEE Sensors Applications Symposium (SAS), 12–14 March 2018, IEEE, 1–4, https://doi.org/10.1109/SAS.2018.8336731, 2018.
Liousse, C., Cachier, H., and Jennings, S. G.: Optical and thermal measurements of black carbon aerosol content in different environments: Variation of the specific attenuation cross-section, sigma (σ), Atmos. Environ. A-Gen., 27, 1203–1211, https://doi.org/10.1016/0960-1686(93)90246-U, 1993.
Liousse, C., Devaux, C., Dulac, F., and Cachier, H.: Aging of savanna biomass burning aerosols: Consequences on their optical properties, J. Atmos. Chem., 22, 1–17, https://doi.org/10.1007/BF00708178, 1995.
Liu, S., Aiken, A. C., Arata, C., Dubey, M. K., Stockwell, C. E., Yokelson, R. J., Stone, E. A., Jayarathne, T., Robinson, A. L., DeMott, P. J., and Kreidenweis, S. M.: Aerosol single scattering albedo dependence on biomass combustion efficiency: Laboratory and field studies, Geophys. Res. Lett., 41, 742–748, https://doi.org/10.1002/2013GL058392, 2014.
Liu, X., Huey, L. G., Yokelson, R. J., Selimovic, V., Simpson, I. J., Müller, M., Jimenez, J. L., Campuzano-Jost, P., Beyersdorf, A. J., Blake, D. R., Butterfield, Z., Choi, Y., Crounse, J. D., Day, D. A., Diskin, G. S., Dubey, M. K., Fortner, E., Hanisco, T. F., Hu, W., King, L. E., Kleinman, L., Meinardi, S., Mikoviny, T., Onasch, T. B., Palm, B. B., Peischl, J., Pollack, I. B., Ryerson, T. B., Sachse, G. W., Sedlacek, A. J., Shilling, J. E., Springston, S., St. Clair, J. M., Tanner, D. J., Teng, A. P., Wennberg, P. O., Wisthaler, A., and Wolfe, G. M.: Airborne measurements of western U.S. wildfire emissions: Comparison with prescribed burning and air quality implications, J. Geophys. Res., 122, 6108–6129, https://doi.org/10.1002/2016JD026315, 2017.
Lu, Z., Streets, D. G., Winijkul, E., Yan, F., Chen, Y., Bond, T. C., Feng, Y., Dubey, M. K., Liu, S., Pinto, J. P., and Carmichael, G. R.: Light absorption properties and radiative effects of primary organic aerosol emissions, Environ. Sci. Technol., 49, 4868–4877, https://doi.org/10.1021/acs.est.5b00211, 2015.
Martins, J. V., Artaxo, P., Liousse, C., Reid, J. S., Hobbs, P. V., and Kaufman, Y. J.: Effects of black carbon content, particle size, and mixing on light absorption by aerosols from biomass burning in Brazil, J. Geophys. Res.-Atmos., 103, 32041–32050, https://doi.org/10.1029/98JD02593, 1998.
May, A. A., McMeeking, G. R., Lee, T., Taylor, J. W., Craven, J. S., Burling, I., Sullivan, A. P., Akagi, S., Collett, J. L., Flynn, M., Coe, H., Urbanski, S. P., Seinfeld, J. H., Yokelson, R. J., and Kreidenweis, S. M.: Aerosol emissions from prescribed fires in the United States: A synthesis of laboratory and aircraft measurements, J. Geophys. Res.-Atmos., 119, 11826–11849, https://doi.org/10.1002/2014JD021848, 2014.
McClure, C. D., Lim, C. Y., Hagan, D. H., Kroll, J. H., and Cappa, C. D.: Biomass-burning-derived particles from a wide variety of fuels – Part 1: Properties of primary particles, Atmos. Chem. Phys., 20, 1531–1547, https://doi.org/10.5194/acp-20-1531-2020, 2020.
McMeeking, G. R., Kreidenweis, S. M., Lunden, M., Carrillo, J., Carrico, C. M., Lee, T., Herckes, P., Engling, G., Day, D. E., Hand, J., Brown, N., Malm, W. C., and Collett, J. L.: Smoke-impacted regional haze in California during the summer of 2002, Agr. Forest Meteorol., 137, 25–42, https://doi.org/10.1016/j.agrformet.2006.01.011, 2006.
McNamara, M. L., Noonan, C. W., and Ward, T. J.: Correction factor for continuous monitoring of wood smoke fine particulate matter, Aerosol Air Qual. Res., 11, 316–323, https://doi.org/10.4209/aaqr.2010.08.0072, 2011.
Mehadi, A., Moosmüller, H., Campbell, D. E., Ham, W., Schweizer, D., Tarnay, L., and Hunter, J.: Laboratory and field evaluation of real-time and near real-time PM2.5 smoke monitors, J. Air Waste Manag. Assoc., 70, 158–179, https://doi.org/10.1080/10962247.2019.1654036, 2020.
Meyer, C. P., Cook, G. D., Reisen, F., Smith, T. E. L., Tattaris, M., Russell-Smith, J., Maier, S. W., Yates, C. P., and Wooster, M. J.: Direct measurements of the seasonality of emission factors from savanna fires in northern Australia, J. Geophys. Res., 117, D20305, https://doi.org/10.1029/2012JD017671, 2012.
Moosmüller, H. and Sorensen, C. M.: Single scattering albedo of homogeneous, spherical particles in the transition regime, J. Quant. Spectrosc. Ra., 219, 333–338, https://doi.org/10.1016/j.jqsrt.2018.08.015, 2018a.
Moosmüller, H. and Sorensen, C. M.: Small and large particle limits of single scattering albedo for homogeneous, spherical particles, J. Quant. Spectrosc. Ra., 204, 250–255, https://doi.org/10.1016/j.jqsrt.2017.09.029, 2018b.
Moosmüller, H., Chakrabarty, R. K., and Arnott, W. P.: Aerosol light absorption and its measurement: A review, J. Quant. Spectrosc. Ra., 110, 844–878, https://doi.org/10.1016/j.jqsrt.2009.02.035, 2009.
Müller, T., Henzing, J. S., de Leeuw, G., Wiedensohler, A., Alastuey, A., Angelov, H., Bizjak, M., Collaud Coen, M., Engström, J. E., Gruening, C., Hillamo, R., Hoffer, A., Imre, K., Ivanow, P., Jennings, G., Sun, J. Y., Kalivitis, N., Karlsson, H., Komppula, M., Laj, P., Li, S.-M., Lunder, C., Marinoni, A., Martins dos Santos, S., Moerman, M., Nowak, A., Ogren, J. A., Petzold, A., Pichon, J. M., Rodriquez, S., Sharma, S., Sheridan, P. J., Teinilä, K., Tuch, T., Viana, M., Virkkula, A., Weingartner, E., Wilhelm, R., and Wang, Y. Q.: Characterization and intercomparison of aerosol absorption photometers: result of two intercomparison workshops, Atmos. Meas. Tech., 4, 245–268, https://doi.org/10.5194/amt-4-245-2011, 2011.
Myhre, G., Shindell, D. T., Breon, F.-M., Collins, W. J., Fluglestvedt, J., Huang, J., Koch, D., Lamarque, J.-F., Lee, D., Mendoza, B., Nakajima, T., Robock, A., Stephens, G., Takemura, T., and Zhang, H.: Anthropogenic and Natural Radiative Forcing, in Climate Change 2013: The Physical Science Basis. Contribution of Working Group I to the Fifth Assessment Report of the Intergovernmental Panel on Climate Change, edited by: Jacob, D., Ravishankara, A. R., and Shine, K., Cambridge University Press, vol. 6, 659 pp., https://doi.org/10.1017/CBO9781107415324.018, 2013.
Park, S. S., Sim, S. Y., Bae, M. S., and Schauer, J. J.: Size distribution of water-soluble components in particulate matter emitted from biomass burning, Atmos. Environ., 73, 62–72, https://doi.org/10.1016/j.atmosenv.2013.03.025, 2013.
Penner, J. E., Dickinson, R. E., and Neill, C. A. O.: Effects of Aerosol from Biomass Burning on the Global Radiation Budget, Science, 256, 1432–1434, 1992.
Petzold, A., Kopp, C., and Niessner, R.: The dependence of the specific attenuation cross-section on black carbon mass fraction and particle size, Atmos. Environ., 31, 661–672, https://doi.org/10.1016/S1352-2310(96)00245-2, 1997.
Petzold, A., Ogren, J. A., Fiebig, M., Laj, P., Li, S.-M., Baltensperger, U., Holzer-Popp, T., Kinne, S., Pappalardo, G., Sugimoto, N., Wehrli, C., Wiedensohler, A., and Zhang, X.-Y.: Recommendations for reporting “black carbon” measurements, Atmos. Chem. Phys., 13, 8365–8379, https://doi.org/10.5194/acp-13-8365-2013, 2013.
Pikridas, M., Bezantakos, S., Močnik, G., Keleshis, C., Brechtel, F., Stavroulas, I., Demetriades, G., Antoniou, P., Vouterakos, P., Argyrides, M., Liakakou, E., Drinovec, L., Marinou, E., Amiridis, V., Vrekoussis, M., Mihalopoulos, N., and Sciare, J.: On-flight intercomparison of three miniature aerosol absorption sensors using unmanned aerial systems (UASs), Atmos. Meas. Tech., 12, 6425–6447, https://doi.org/10.5194/amt-12-6425-2019, 2019.
Pokhrel, R. P., Wagner, N. L., Langridge, J. M., Lack, D. A., Jayarathne, T., Stone, E. A., Stockwell, C. E., Yokelson, R. J., and Murphy, S. M.: Parameterization of single-scattering albedo (SSA) and absorption Ångström exponent (AAE) with for aerosol emissions from biomass burning, Atmos. Chem. Phys., 16, 9549–9561, https://doi.org/10.5194/acp-16-9549-2016, 2016.
Ran, L., Deng, Z. Z., Wang, P. C. and Xia, X. A.: Black carbon and wavelength-dependent aerosol absorption in the North China Plain based on two-year aethalometer measurements, Atmos. Environ., 142, 132–144, https://doi.org/10.1016/j.atmosenv.2016.07.014, 2016.
Reid, J. S., Koppmann, R., Eck, T. F., and Eleuterio, D. P.: A review of biomass burning emissions part II: intensive physical properties of biomass burning particles, Atmos. Chem. Phys., 5, 799–825, https://doi.org/10.5194/acp-5-799-2005, 2005a.
Reid, J. S., Eck, T. F., Christopher, S. A., Koppmann, R., Dubovik, O., Eleuterio, D. P., Holben, B. N., Reid, E. A., and Zhang, J.: A review of biomass burning emissions part III: intensive optical properties of biomass burning particles, Atmos. Chem. Phys., 5, 827–849, https://doi.org/10.5194/acp-5-827-2005, 2005b.
Reisen, F., Meyer, C. P., Weston, C. J., and Volkova, L.: Ground-Based Field Measurements of PM2.5 Emission Factors From Flaming and Smoldering Combustion in Eucalypt Forests, J. Geophys. Res.-Atmos., 123, 8301–8314, https://doi.org/10.1029/2018JD028488, 2018.
Rigler, M., Drinovec, L., Lavrič, G., Vlachou, A., Prévôt, A. S. H., Jaffrezo, J. L., Stavroulas, I., Sciare, J., Burger, J., Kranjc, I., Turšič, J., Hansen, A. D. A., and Močnik, G.: The new instrument using a TC–BC (total carbon–black carbon) method for the online measurement of carbonaceous aerosols, Atmos. Meas. Tech., 13, 4333–4351, https://doi.org/10.5194/amt-13-4333-2020, 2020.
Rogers, F., Arnott, P., Zielinska, B., Sagebiel, J., Kelly, K. E., Wagner, D., Lighty, J. S., and Sarofim, A. F.: Real-Time Measurements of Jet Aircraft Engine Exhaust, J. Air Waste Manage. Assoc., 55, 583–593, https://doi.org/10.1080/10473289.2005.10464651, 2005.
Salako, G. O., Hopke, P. K., Cohen, D. D., Begum, B. A., Biswas, S. K., Pandit, G. G., Chung, Y. S., Rahman, S. A., Hamzah, M. S., Davy, P., Markwitz, A., Shagjjamba, D., Lodoysamba, S., Wimolwattanapun, W., and Bunprapob, S.: Exploring the variation between EC and BC in a variety of locations, Aerosol Air Qual. Res., 12, 1–7, https://doi.org/10.4209/aaqr.2011.09.0150, 2012.
Saleh, R., Robinson, E. S., Tkacik, D. S., Ahern, A. T., Liu, S., Aiken, A. C., Sullivan, R. C., Presto, A. A., Dubey, M. K., Yokelson, R. J., Donahue, N. M., and Robinson, A. L.: Brownness of organics in aerosols from biomass burning linked to their black carbon content, Nat. Geosci., 7, 647–650, https://doi.org/10.1038/ngeo2220, 2014.
Sandradewi, J., Prévôt, A. S. H., Szidat, S., Perron, N., Alfarra, M. R., Lanz, V. A., Weingartner, E., and Baltensperger, U.: Using Aerosol Light Absorption Measurements for the Quantitative Determination of Wood Burning and Traffic Emission Contributions to Particulate Matter, Environ. Sci. Technol., 42, 3316–3323, https://doi.org/10.1021/es702253m, 2008.
Schmid, H., Laskus, L., Jürgen Abraham, H., Baltensperger, U., Lavanchy, V., Bizjak, M., Burba, P., Cachier, H., Crow, D., Chow, J., Gnauk, T., Even, A., Ten Brink, H. M., Giesen, K. P., Hitzenberger, R., Hueglin, C., Maenhaut, W., Pio, C., Carvalho, A., Putaud, J. P., Toom-Sauntry, D., and Puxbaum, H.: Results of the “carbon conference” international aerosol carbon round robin test stage I, Atmos. Environ., 35, 2111–2121, https://doi.org/10.1016/S1352-2310(00)00493-3, 2001.
Seiler, W. and Crutzen, P. J.: Estimates of Gross and Net Fluxes of Carbon Between the biosphere and the athmosphere from biomass burning, Clim. Change, 2, 207–247, 1980.
Semeniuk, T. A., Wise, M. E., Martin, S. T., Russell, L. M., and Buseck, P. R.: Hygroscopic behavior of aerosol particles from biomass fires using environmental transmission electron microscopy, J. Atmos. Chem., 56, 259–273, https://doi.org/10.1007/s10874-006-9055-5, 2007.
Sexton, J. O., Song, X. P., Feng, M., Noojipady, P., Anand, A., Huang, C., Kim, D. H., Collins, K. M., Channan, S., DiMiceli, C., and Townshend, J. R. G.: Global, 30-m resolution continuous fields of tree cover: Landsat-based rescaling of MODIS Vegetation Continuous Fields with lidar-based estimates of error, Int. J. Digit. Earth, 6, 427-448, https://doi.org/10.1080/17538947.2013.786146, 2013.
Silva, C. M., Corrêa, S. M., and Arbilla, G.: Determination of CO2, CH4 and N2O: A case study for the city of rio de janeiro using a new sampling method, J. Brazil Chem. Soc., 27, 778–786, https://doi.org/10.5935/0103-5053.20150331, 2016.
Sorensen, C. M.: Light scattering by fractal aggregates: A review, Aerosol Sci. Tech., 35, 648–687, https://doi.org/10.1080/02786820117868, 2001.
Stauffer, D. A., Autenrieth, D. A., Hart, J. F., and Capoccia, S.: Control of wildfire-sourced PM2.5 in an office setting using a commercially available portable air cleaner, J. Occup. Environ. Hyg., 17, 109–120, https://doi.org/10.1080/15459624.2020.1722314, 2020.
Surawski, N. C., Sullivan, A. L., Meyer, C. P., Roxburgh, S. H., and Polglase, P. J.: Greenhouse gas emissions from laboratory-scale fires in wildland fuels depend on fire spread mode and phase of combustion, Atmos. Chem. Phys., 15, 5259–5273, https://doi.org/10.5194/acp-15-5259-2015, 2015.
Thompson, C., Pokhrel, R. P., Fiddler, M. N., Herndon, S. C., Daube, C., Yacovitch, T. I., Majluf, F., Krechmer, J. E., Fortner, E., Onasch, T. B., Coggon, M. M., and Bililign, S.: Emission Factors of Volatile Organic Compounds and Particulate Matter During FIREX-AQ 2019 : A Comparative Study of Mobile Platform and Aircraft Measurements, in: Fall Meeting 2020, American Geophysical Union, 2020.
Vakkari, V., Kerminen, V.-M., Beukes, J. P., Tiitta, P., van Zyl, P. G., Josipovic, M., Venter, A. D., Jaars, K., Worsnop, D. R., Kulmala, M., and Laakso, L.: Rapid changes in biomass burning aerosols by atmospheric oxidation, Geophys. Res. Lett., 41, 2644–2651, https://doi.org/10.1002/2014GL059396, 2014.
Van der Schijff, H. P.: Inleidende verslag oor veldbrandnavorsing in die Nasionale Krugerwildtuin, Koedoe, 1, 78–94, https://doi.org/10.4102/koedoe.v1i1.865, 1954.
van Leeuwen, T. T. and van der Werf, G. R.: Spatial and temporal variability in the ratio of trace gases emitted from biomass burning, Atmos. Chem. Phys., 11, 3611–3629, https://doi.org/10.5194/acp-11-3611-2011, 2011.
Venter, F. J. and Gertenbach, W. P. D.: A Cursory Review of the Climate and Vegetation of the Kruger National Park, Koedoe, 29, 139–148, https://doi.org/10.4102/koedoe.v29i1.526, 1986.
Vernooij, R., Giongo, M., Borges, M. A., Costa, M. M., Barradas, A. C. S., and van der Werf, G. R.: Intraseasonal variability of greenhouse gas emission factors from biomass burning in the Brazilian Cerrado, Biogeosciences, 18, 1375–1393, https://doi.org/10.5194/bg-18-1375-2021, 2021.
Vicente, A., Alves, C., Monteiro, C., Nunes, T., Mirante, F., Evtyugina, M., Cerqueira, M., and Pio, C.: Measurement of trace gases and organic compounds in the smoke plume from a wildfire in Penedono (central Portugal), Atmos. Environ., 45, 5172–5182, https://doi.org/10.1016/j.atmosenv.2011.06.021, 2011.
Ward, D. E. and Radke, L. F.: Emissions Measurements from Vegetation Fires: A Comparative Evaluation of Methods and Results, in: Fire in the Environment: The Ecological, Atmospheric, and Climatic Importance of Vegetation Fires. Dahlem Workshop Reports: Environmental Sciences Research Report 13, edited by: Crutzen, P. J. and Goldammer, J. G., John Wiley & Sons, 53–76, 1993.
Ward, D. E., Susott, R. A., Kauffman, J. B., Babbitt, R. E., Cummings, D. L., Dias, B., Holben, B. N., Kaufman, Y. J., Rasmussen, R. A., and Setzer, A. W.: Smoke and fire characteristics for cerrado and deforestation burns in Brazil: BASE-B Experiment, J. Geophys. Res., 97, 14601–14619, https://doi.org/10.1029/92JD01218, 1992.
Weingartner, E., Saathoff, H., Schnaiter, M., Streit, N., Bitnarc, B., and Baltensperger, U.: Absorption of light by soot particles: determination of the absorption coefficient by means of aethalometers, J. Aerosol Sci., 34, 1445–1463, https://doi.org/10.1016/S0021-8502(03)00359-8, 2003.
Wiedensohler, A., Birmili, W., Nowak, A., Sonntag, A., Weinhold, K., Merkel, M., Wehner, B., Tuch, T., Pfeifer, S., Fiebig, M., Fjäraa, A. M., Asmi, E., Sellegri, K., Depuy, R., Venzac, H., Villani, P., Laj, P., Aalto, P., Ogren, J. A., Swietlicki, E., Williams, P., Roldin, P., Quincey, P., Hüglin, C., Fierz-Schmidhauser, R., Gysel, M., Weingartner, E., Riccobono, F., Santos, S., Grüning, C., Faloon, K., Beddows, D., Harrison, R., Monahan, C., Jennings, S. G., O'Dowd, C. D., Marinoni, A., Horn, H.-G., Keck, L., Jiang, J., Scheckman, J., McMurry, P. H., Deng, Z., Zhao, C. S., Moerman, M., Henzing, B., de Leeuw, G., Löschau, G., and Bastian, S.: Mobility particle size spectrometers: harmonization of technical standards and data structure to facilitate high quality long-term observations of atmospheric particle number size distributions, Atmos. Meas. Tech., 5, 657–685, https://doi.org/10.5194/amt-5-657-2012, 2012.
Wiggins, E. B., Andrews, A., Sweeney, C., Miller, J. B., Miller, C. E., Veraverbeke, S., Commane, R., Wofsy, S., Henderson, J. M., and Randerson, J. T.: Boreal forest fire CO and CH4 emission factors derived from tower observations in Alaska during the extreme fire season of 2015, Atmos. Chem. Phys., 21, 8557–8574, https://doi.org/10.5194/acp-21-8557-2021, 2021.
Wooster, M. J., Freeborn, P. H., Archibald, S., Oppenheimer, C., Roberts, G. J., Smith, T. E. L., Govender, N., Burton, M., and Palumbo, I.: Field determination of biomass burning emission ratios and factors via open-path FTIR spectroscopy and fire radiative power assessment: headfire, backfire and residual smouldering combustion in African savannahs, Atmos. Chem. Phys., 11, 11591–11615, https://doi.org/10.5194/acp-11-11591-2011, 2011.
Wooster, M. J., Gaveau, D. L. A., Salim, M. A., Zhang, T., Xu, W., Green, D. C., Huijnen, V., Murdiyarso, D., Gunawan, D., Borchard, N., Schirrmann, M., Main, B., and Sepriando, A.: New tropical peatland gas and particulate emissions factors indicate 2015 Indonesian fires released far more particulate matter (but Less Methane) than current inventories imply, Remote Sens., 10, 1–31, https://doi.org/10.3390/rs10040495, 2018.
Yang, M., Howell, S. G., Zhuang, J., and Huebert, B. J.: Attribution of aerosol light absorption to black carbon, brown carbon, and dust in China – interpretations of atmospheric measurements during EAST-AIRE, Atmos. Chem. Phys., 9, 2035–2050, https://doi.org/10.5194/acp-9-2035-2009, 2009.
Yokelson, R. J., Griffith, D. W. T., and Ward, D. E.: Open-path Fourier transform infrared studies of large-scale laboratory biomass fires, J. Geophys. Res., 101, 21067–21080, https://doi.org/10.1029/96JD01800, 1996.
Yokelson, R. J., Goode, J. G., Ward, D. E., Susott, R. A., Babbitt, R. E., Wade, D. D., Bertschi, I., Griffith, D. W. T., and Hao, W. M.: Emissions of formaldehyde, acetic acid, methanol, and other trace gases from biomass fires in North Carolina measured by airborne Fourier transform infrared spectroscopy, J. Geophys. Res., 104, 30109–30125, https://doi.org/10.1029/1999JD900817, 1999.
Yokelson, R. J., Karl, T., Artaxo, P., Blake, D. R., Christian, T. J., Griffith, D. W. T., Guenther, A., and Hao, W. M.: The Tropical Forest and Fire Emissions Experiment: overview and airborne fire emission factor measurements, Atmos. Chem. Phys., 7, 5175–5196, https://doi.org/10.5194/acp-7-5175-2007, 2007.
Yokelson, R. J., Burling, I. R., Urbanski, S. P., Atlas, E. L., Adachi, K., Buseck, P. R., Wiedinmyer, C., Akagi, S. K., Toohey, D. W., and Wold, C. E.: Trace gas and particle emissions from open biomass burning in Mexico, Atmos. Chem. Phys., 11, 6787–6808, https://doi.org/10.5194/acp-11-6787-2011, 2011.
Yokelson, R. J., Burling, I. R., Gilman, J. B., Warneke, C., Stockwell, C. E., de Gouw, J., Akagi, S. K., Urbanski, S. P., Veres, P., Roberts, J. M., Kuster, W. C., Reardon, J., Griffith, D. W. T., Johnson, T. J., Hosseini, S., Miller, J. W., Cocker III, D. R., Jung, H., and Weise, D. R.: Coupling field and laboratory measurements to estimate the emission factors of identified and unidentified trace gases for prescribed fires, Atmos. Chem. Phys., 13, 89–116, https://doi.org/10.5194/acp-13-89-2013, 2013.
Yver Kwok, C., Laurent, O., Guemri, A., Philippon, C., Wastine, B., Rella, C. W., Vuillemin, C., Truong, F., Delmotte, M., Kazan, V., Darding, M., Lebègue, B., Kaiser, C., Xueref-Rémy, I., and Ramonet, M.: Comprehensive laboratory and field testing of cavity ring-down spectroscopy analyzers measuring H2O, CO2, CH4 and CO, Atmos. Meas. Tech., 8, 3867–3892, https://doi.org/10.5194/amt-8-3867-2015, 2015.
Zenker, K., Sirignano, C., Riccio, A., Chianese, E., Calfapietra, C., Prati, M. V., Masalaite, A., Remeikis, V., Mook, E., Meijer, H. A. J., and Dusek, U.: δ13C signatures of organic aerosols: Measurement method evaluation and application in a source study, J. Aerosol Sci., 145, 105534, https://doi.org/10.1016/j.jaerosci.2020.105534, 2020.
Zhai, J., Lu, X., Li, L., Zhang, Q., Zhang, C., Chen, H., Yang, X., and Chen, J.: Size-resolved chemical composition, effective density, and optical properties of biomass burning particles, Atmos. Chem. Phys., 17, 7481–7493, https://doi.org/10.5194/acp-17-7481-2017, 2017.
Zhang, T., Wooster, M. J., Green, D. C., and Main, B.: New field-based agricultural biomass burning trace gas, PM2.5, and black carbon emission ratios and factors measured in situ at crop residue fires in Eastern China, Atmos. Environ., 121, 22–34, https://doi.org/10.1016/j.atmosenv.2015.05.010, 2015.
Zhao, G., Tao, J., Kuang, Y., Shen, C., Yu, Y., and Zhao, C.: Role of black carbon mass size distribution in the direct aerosol radiative forcing, Atmos. Chem. Phys., 19, 13175–13188, https://doi.org/10.5194/acp-19-13175-2019, 2019.