the Creative Commons Attribution 4.0 License.
the Creative Commons Attribution 4.0 License.
 | 29 Jul 2022
Development and testing of a novel sulfur dioxide sonde
Subin Yoon
Alexander Kotsakis
Sergio L. Alvarez
Mark G. Spychala
Elizabeth Klovenski
Paul Walter
Gary Morris
Ernesto Corrales
Alfredo Alan
Jorge A. Diaz
James H. Flynn
A novel technique has been developed to measure sulfur dioxide (SO2) using a modification of the existing electrochemical concentration cell (ECC) ozonesonde technology. The current sonde-based method to measure SO2 (i.e., the dual-sonde approach) involves launching two ozonesondes together, with one of the sondes having a filter to remove SO2 at the inlet. The SO2 profile is determined by taking the difference between the measurements from the two instruments. The dual-sonde method works well in typical tropospheric conditions when [O3]>[SO2] but saturates when [SO2]>[O3] and has large uncertainties in the upper troposphere and lower stratosphere that would limit its effectiveness in measuring SO2 from an explosive volcanic eruption. Due to these limitations, several modifications were made to create a single-sonde system that would directly measure SO2 (i.e., the SO2 sonde). These modifications included (1) a positively biased ECC current, (2) the addition of an O3 removal filter, and (3) the addition of a sample dryer. The SO2 sonde measures SO2 as a reduction in the cell current. There was a strong correlation (r2>0.94) between the SO2 sonde and a Thermo 43c analyzer during controlled laboratory tests and pre-flight tests. Varying humidity levels affected the SO2 sonde's sensitivity (avg ppbv µA−1, 1σ RSD =37 %) during initial field tests, which was resolved by adding a sample dryer upstream of the O3 removal filter and pump inlet. This modification significantly reduced the variability and increased the sensitivity of the SO2 measurements (avg ppbv µA−1, 1σ RSD =12 %). Field tests included measurements near Kīlauea volcano (before and during the 2018 eruption of the Lower East Rift Zone), Costa Rica's Turrialba volcano, and anthropogenic plumes from the Athabasca oil sands region of Alberta, Canada. This single-SO2-sonde system is an effective, inexpensive instrument for measuring both ground-based and vertical profiles of SO2 from anthropogenic and natural sources (i.e., volcanic eruptions) over a wide range of concentrations.
- Article
(2266 KB) - Full-text XML
-
Supplement
(569 KB) - BibTeX
- EndNote


Sulfur dioxide (SO2) emissions result from anthropogenic activities, such as power generation and crude oil refining processes, and natural sources, such as volcanoes. In gas form, SO2 acts as a respiratory irritant, leading to complications with asthma and cardiovascular conditions (Chen et al., 2007; Sunyer et al., 2003; Tzortziou et al., 2015, 2018). Gaseous SO2 can be converted to sulfate aerosols (Zhang et al., 2015), which are highly scattering, reduce visibility, and can have a cooling effect on the surface climate when injected into the stratosphere (Kiehl and Briegleb, 1993; Schmidt et al., 2010). SO2 acidifies rain, accelerating damage of infrastructure and vegetation, particularly near SO2 sources such as volcanoes (Delmelle et al., 2002; Krug and Frink, 1983; Tortini et al., 2017). Due to these various climate, environmental, and human health-related impacts, anthropogenic SO2 has been heavily monitored (Shannon, 1999; Zhang and Schreifels, 2011), and regulations have been enacted to reduce these emissions (EPA, 2000).
The largest natural sources of SO2 are volcanoes. The eruption of Mt. Pinatubo in the Philippines in June 1991 had global climatic effects and significant impacts on the tropospheric and lower stratospheric composition (Bluth et al., 1992; Parker et al., 1996). Apart from such catastrophic eruptions, SO2 can be continually emitted from volcanoes. SO2 plumes from over 90 volcanoes have been reliably detected by satellites, resulting in the injection of an estimated 23±2 Tg yr−1 of SO2 into the atmosphere (Carn et al., 2017). However, unlike anthropogenic sources of SO2, most volcanoes lack routine ground monitoring (Galle et al., 2010; Pieri et al., 2013), and few opportunities exist for routine validation of satellite retrievals of SO2 with in situ measurements. Small unmanned aerial vehicle (UAV) platforms can measure volcanic plumes at altitudes of 2 km above the take-off altitude (Galle et al., 2010; Diaz et al., 2015) while larger UAVs can measure stratospheric plumes (e.g., Global Hawk). However, the lack and difficulty of monitoring and the possibility of another stratospheric injection of SO2 motivated the development of an inexpensive but reliable balloon-borne instrument that could be deployed quickly after an eruption to validate satellite observations with in situ measurements.
Radiosondes and ozonesondes have been widely used for measurements of various atmospheric parameters (e.g., temperature, air pressure, relative humidity (RH), wind speed and direction, and O3 concentrations). Electrochemical concentration cell (ECC) ozonesondes produce vertical O3 profiles and allow for the validation of satellite-based O3 vertical column density (VCD). A schematic of the ECC is included in Fig. S1 in the Supplement. The current sonde-based method for measuring SO2, the dual-sonde method, uses two En-Sci (Environmental Science Inc., Westminster, CO) ECC ozonesondes in tandem (Morris et al., 2010). For the dual-sonde method, an SO2 removal filter is placed at the pump inlet of one of the ozonesondes, scrubbing SO2 from the sampled air before it enters the ECC. The other sonde samples unfiltered air (i.e., air containing both SO2 and O3). Due to the chemical reactions in the cathode cell, the filtered sonde measures O3, while the unfiltered sonde measures the difference between O3 and SO2 ([O3]−[SO2]) since SO2 has an equal (relative to O3) but negative signal in the ECC (Morris et al., 2010). The SO2 concentrations are then determined from the difference between the two sonde measurements. This method works well in the troposphere when the SO2 concentration is less than the O3 concentration, but not as well in intense plumes, such as those found in eruptive volcanic environments. When the SO2 concentration exceeds the O3 concentration, the cell current in the unfiltered sonde becomes zero. The excess SO2 saturates the dual sonde and distorts the calculated SO2 profile. Additionally, in the stratosphere, where the O3 signal grows much larger than in the troposphere, the combined uncertainty of the measurements of the filtered and unfiltered sondes results in a large lower limit of detection (LLOD), on the order of tens of parts per billion by volume. Thus, a field deployment of the dual-sonde method more than a few days after an explosive, tropical volcanic eruption such as Mt. Pinatubo would result in few useful data in the critical upper troposphere–lower stratosphere region.
This study reports on the development of a single instrument capable of in situ SO2 measurements in the presence or absence of O3. This sonde can measure SO2 at much greater concentrations than O3 without saturating the system and can be configured for a sub-ppbv LLOD (calculated using 3σ) at sea level. Since O3 is removed from the sample stream, this SO2 sonde avoids the compounded uncertainties of the dual-sonde method. Field deployments of the SO2 sonde include sampling of volcanic emissions from Kīlauea on the big island of Hawai'i, US, and Turrialba volcano in Costa Rica and the emissions from petroleum extraction and processing at the Athabasca oil sands in Canada. Results from these field tests, covering a wide range of SO2 concentrations from both natural and anthropogenic emission sources, are described below. The SO2 sonde has been used for tethered and free-release balloons but can also be adapted for UAV platforms.
2.1 Ozonesondes
The standard and modified ECC En-Sci ozonesondes were used for the O3 and SO2 sonde measurements in this study. The basic functioning of the ECC ozonesonde is described in Komhyr (1969) and Morris et al. (2010). The ECC sensor is composed of platinum cathode and anode electrodes, each in its own cell, immersed in a diluted and saturated solution of potassium iodide (KI), respectively. The cells are connected by an ion bridge allowing for the transfer of electrical charges while maintaining the separation of the solutions (Eqs. 1 and 2). When the cells are charged with the solution, a transient potential difference is generated that is dissipated through the redistribution of charge across the ion bridge. The following equilibria are established from these reactions:
Sampled air is pumped into the cathode cell, and the presence of O3 initiates a reaction (Eq. 3) that causes an imbalance in favor of [I2] in the cathode solution.
To rebalance the electrochemical potential of the cell, the iodine and iodide redox reactions in Eqs. (4) and (5) result in a flow of electrons from the anode to the cathode via the ion bridge. This cell current, measured by an external ammeter, is proportional to the O3 concentration.
When SO2 is present in the sample air, an additional reaction (Eq. 6) occurs in the cathode cell of the ECC, supplying the two electrons needed to rebalance the cathode cell after the O3 reaction (Eq. 3) (Komhyr, 1969; Morris et al., 2010).
Thus, each SO2 molecule in the sampled air has the effect of canceling the measurement of one O3 molecule. In effect, the standard ECC ozonesonde reports [O3]−[SO2] for its measurement. In most places and at most times, [SO2]≪[O3], so there is not a significant impact on the O3 measurements, but in places downwind of SO2 sources (e.g., coal-burning power plants or volcanoes), the O3 measurement will be negatively impacted.
2.2 Instrumentation
Several SO2 and O3 instruments were used for validation of the SO2 sonde during laboratory and field testing. A calibration system was used to produce controlled concentrations of SO2 and O3. The calibration system relied on the operation of flow controllers or restrictors, an SO2 ultra-high-purity (UHP) gas cylinder (4.87 ppm; Scott-Marrin, Inc., Riverside, CA) and/or a UV photometric O3 calibrator (49C PS; Thermo Fisher Scientific, Franklin, MA), and zero air to produce desired pre-set concentrations of SO2 and/or O3. The zero-air setup used for the field and laboratory testing was achieved using a dry zero-air UHP gas cylinder or else generated by scrubbing ambient air through activated charcoal and Purafil SP (Purafil, Inc., Doraville, GA) canisters. The Thermo 43i-TL SO2 analyzer (LLOD: 60–90 pptv at 5 min averaging) and the 49i O3 analyzer (LLOD: 1.5 ppbv at 5 min averaging) were also used during laboratory testing, while a Thermo 43c-TL SO2 analyzer was used during field testing in Hawai'i. These instruments were set to report 10 s average measurements.
3.1 SO2 sonde system description
The single-sonde SO2 system included three major modifications to the En-Sci ECC ozonesonde: (1) the application of a positively biased current to the cathode cell, (2) the addition of an O3 removal filter, and (3) a sample dryer (Fig. S1). The first version of the SO2 system (SO2 sonde v1.0) included the first two modifications: the bias current and an O3 removal filter. The bias current sets the upper limit of detection (ULOD) for the SO2 sonde and is set prior to measurement. The O3 removal filter is placed in line with the inlet, allowing O3-free air to be sampled in the SO2 sonde. In the ECC, O3 produces a positive response signal while SO2 produces a negative signal when sufficient O3 is present (i.e., positive signal). With these two modifications, SO2 can be measured directly as the reduction of the cell current from the pre-set biased current (Flynn and Morris, 2021). Unlike the dual-sonde system, this approach allows for direct SO2 measurements rather than an inference by subtraction of signals from two separate instruments. A sample dryer was added to the SO2 sonde in the second version (v1.1) to combat humidity issues discovered after initial field tests. The addition of the dryer corrected the highly varying instrument sensitivity observed in the field. All components of the SO2 sonde fit within a standard ozonesonde foam box (approximately 8 in. ×8 in. ×10 in.) except for the inlet filter. The free-release balloon payload's total mass is approximately 1 kg. The patent publication and Fig. S1 provide a detailed description and schematic of the SO2 sonde (Flynn and Morris, 2021).
3.2 Testing of the bias current
The bias current is supplied by inserting into the cathode cell an additional platinum electrode powered by a 9 V battery (Fig. S1) (Flynn and Morris, 2021). To maintain consistent power, the circuit uses a 5 V regulator. Varying the resistance allows for a range of bias currents to be introduced. The current version of the SO2 sonde uses a fixed resistor which requires a priori knowledge of the desired SO2 concentration range. The desired resistor is installed in series with the battery and the electrode. An earlier laboratory test compared the SO2 sonde measurements (initially configured without an O3 removal filter) to those made by a 43i-TL SO2 analyzer (Fig. 1, Table 1). O3 and SO2 gases were introduced using the laboratory calibration setup and a manifold to allow the sonde and the Thermo trace gas instruments to sample the same air. Results in Fig. 1 show 60 s averaged data. The test included (A) input of O3 without an added bias current; (B) the same input of O3 with the addition of a bias current (equivalent to approximately 90 ppbv of O3); and the addition of SO2 to the O3 with the enhanced bias signal where the SO2 concentration was either (C) smaller or (D and E) larger than the O3 concentration. During (A), measurements made by O3 and SO2 sondes compare well to measurements made by the Thermo instruments (Fig. 1, Table 1). The test included (E) the response of the SO2 sonde to a reduction of the O3 concentration, resulting in an equivalent decrease in signal, followed by (G–I) a reduction in the SO2 concentration, resulting in an equivalent increase in signal. At (F), the SO2 concentration exceeded the bias current (90 ppbv), producing a signal equivalent to 2.9±0.1 ppbv. The sonde successfully measured SO2 both with and without O3 with approximately 97 % efficiency.
Table 1Averaged O3 and SO2 concentration measured by the SO2 sonde version 1.0 and Thermo instruments during different stages of testing indicated in Fig. 1.
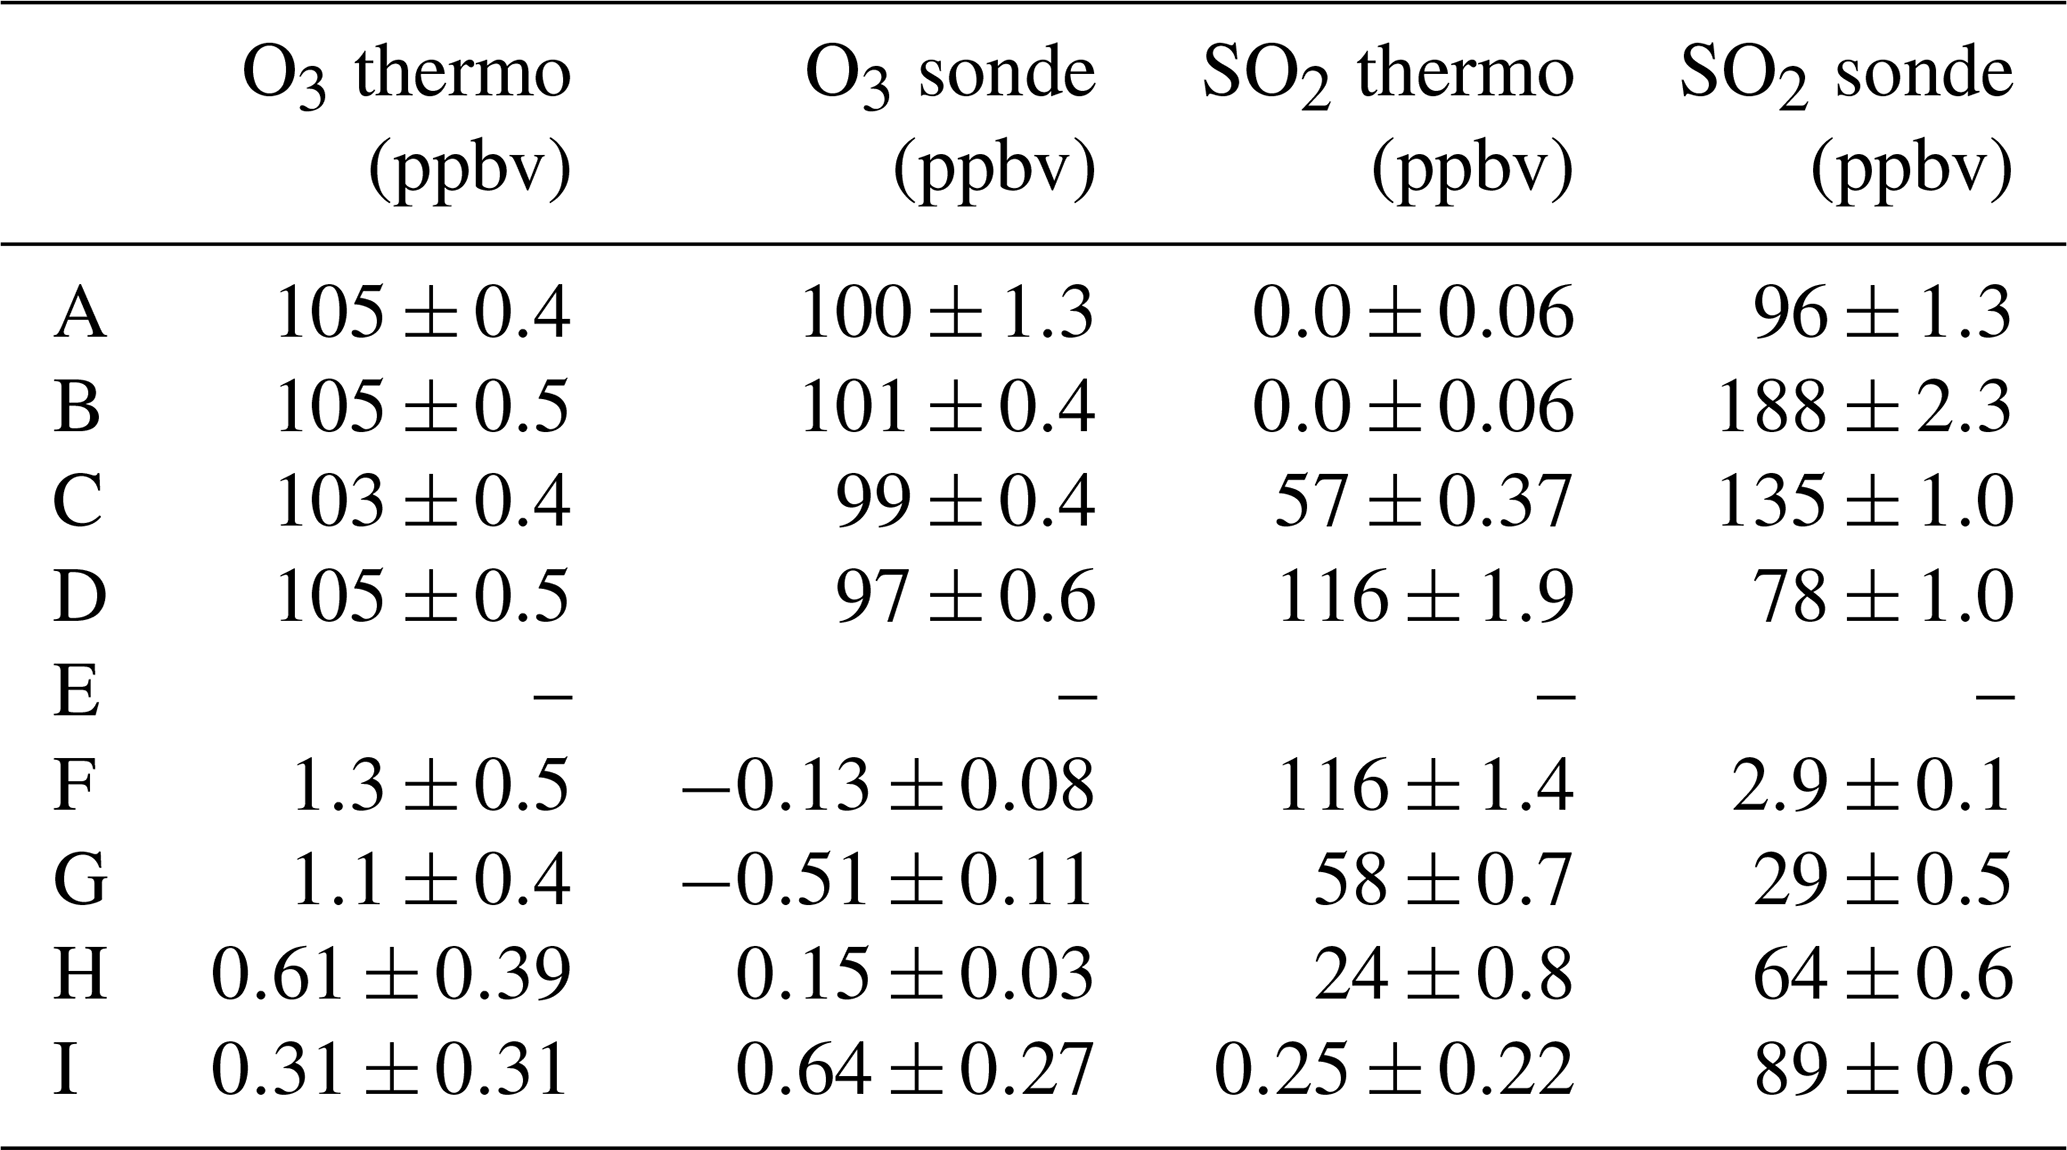
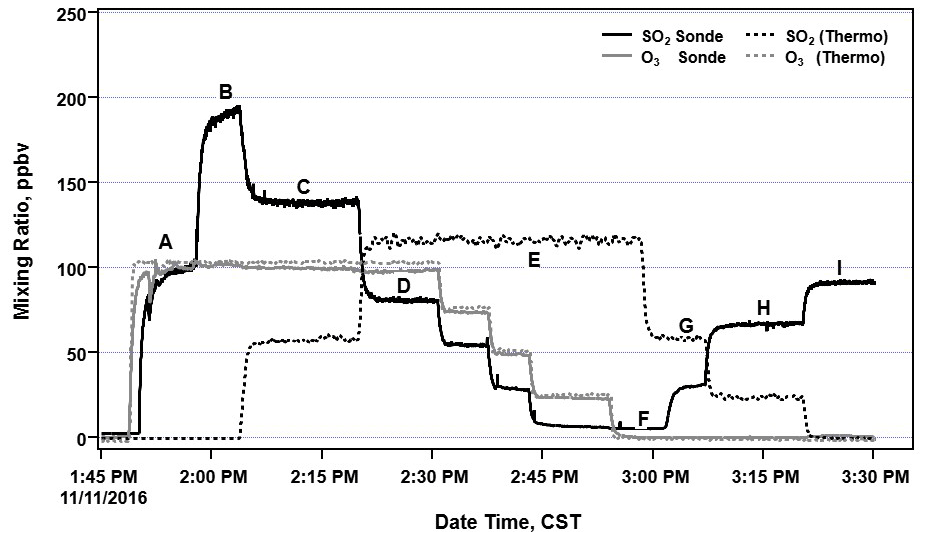
Figure 1Test of the SO2 sonde v1.0 (without an O3 removal filter) with an applied bias current responding to O3 and SO2. See the text for further details.
Examination of the SO2 sonde data showed that noise was proportional to the measured signal, with 1-σ noise at approximately 0.2 %–0.3 % of the measured signal. Because increases in the SO2 concentrations result in decreases in the signal (i.e., lower cell currents), the magnitude of the applied bias current determines the saturation point (i.e., ULOD) of the SO2 sonde; saturation occurs when the measured cell current drops to zero. Applying a higher bias current increases the ULOD but also increases noise and the LLOD. The reported LLODs of bias currents are calculated as 3σ relative to the baseline signal when sampling zero air. During laboratory testing, the LLOD (3σ) was calculated for a range of applied bias currents (0.25 to 10.0 µA). The LLOD for the varying bias current of 0.25 to 10.0 µA ranged from approximately 0.002 to 0.084 µA, respectively. Results of calculated LLOD of a 0.25 µA bias current at varying replicated altitudes are included in Table S1 in the Supplement. At the surface, the LLOD of 20 s averaged measurements is 0.17 ppbv. The final version of the SO2 sonde (v1.1) requires the bias current to be selected prior to measurement. If the bias current is set too low, a measurement of larger-than-expected SO2 concentrations can saturate the sensor while a bias current that is set too high will have higher LLOD due to the increase in noise. The applied magnitude of the bias current can be best determined based on known SO2 sources including volcanic emissions and urban and/or industrial emissions.
3.3 Testing of O3 removal filter
Since the ECC responds to both O3 and SO2, an O3 removal filter was developed to remove interference from O3 in the sample. This proprietary O3 removal filter is placed upstream of the sonde inlet (Flynn and Morris, 2021). During laboratory testing, the O3 removal filter was exposed to a continual concentration of 487±3 ppbv of O3 and a varying concentration of SO2 ranging from 0 to 111±1 ppbv (Fig. 2). The O3 was effectively and consistently removed from the sampled air by the O3 removal filter as SO2 was diluted. The testing included measurements with (gray background) and without (white background) the O3 removal filter. The SO2 and O3 concentrations measured by the Thermo 43i−TL and 49i instruments, respectively, and changes in SO2 dilution levels are also indicated in Fig. 2. The O3 removal filter destroyed the O3 at all SO2 dilution levels to below the detection limit of the O3 instrument. By comparing the Thermo 43i-TL SO2 analyzer measurements with and without the O3 removal filter, SO2 passed through the filter with 88 % efficiency (Fig. 3a). The transmission efficiency was calculated by taking the ratio of SO2 measured by the sonde to that measured by the analyzer. The SO2 transmission efficiency increased to 97 % when testing the O3 removal filter with the dry zero-air UHP gas cylinder (Fig. 3b) instead of the zero-air generator that processes ambient laboratory air (Fig. 3a). Additional testing of the O3 removal filter demonstrated that the filter removed approximately 1 ppm of O3 at sea level with >99.9 % in O3 removal efficiency, concentrations below the detection limit of the Thermo 49i O3 monitor.

Figure 2Time of series of a multipoint test of the O3 filter removal efficiency and impact on SO2 measurements taken by a Thermo 43i-TL SO2 analyzer. Changes in SO2 dilution levels are indicated by the pink lines (diamond markers).
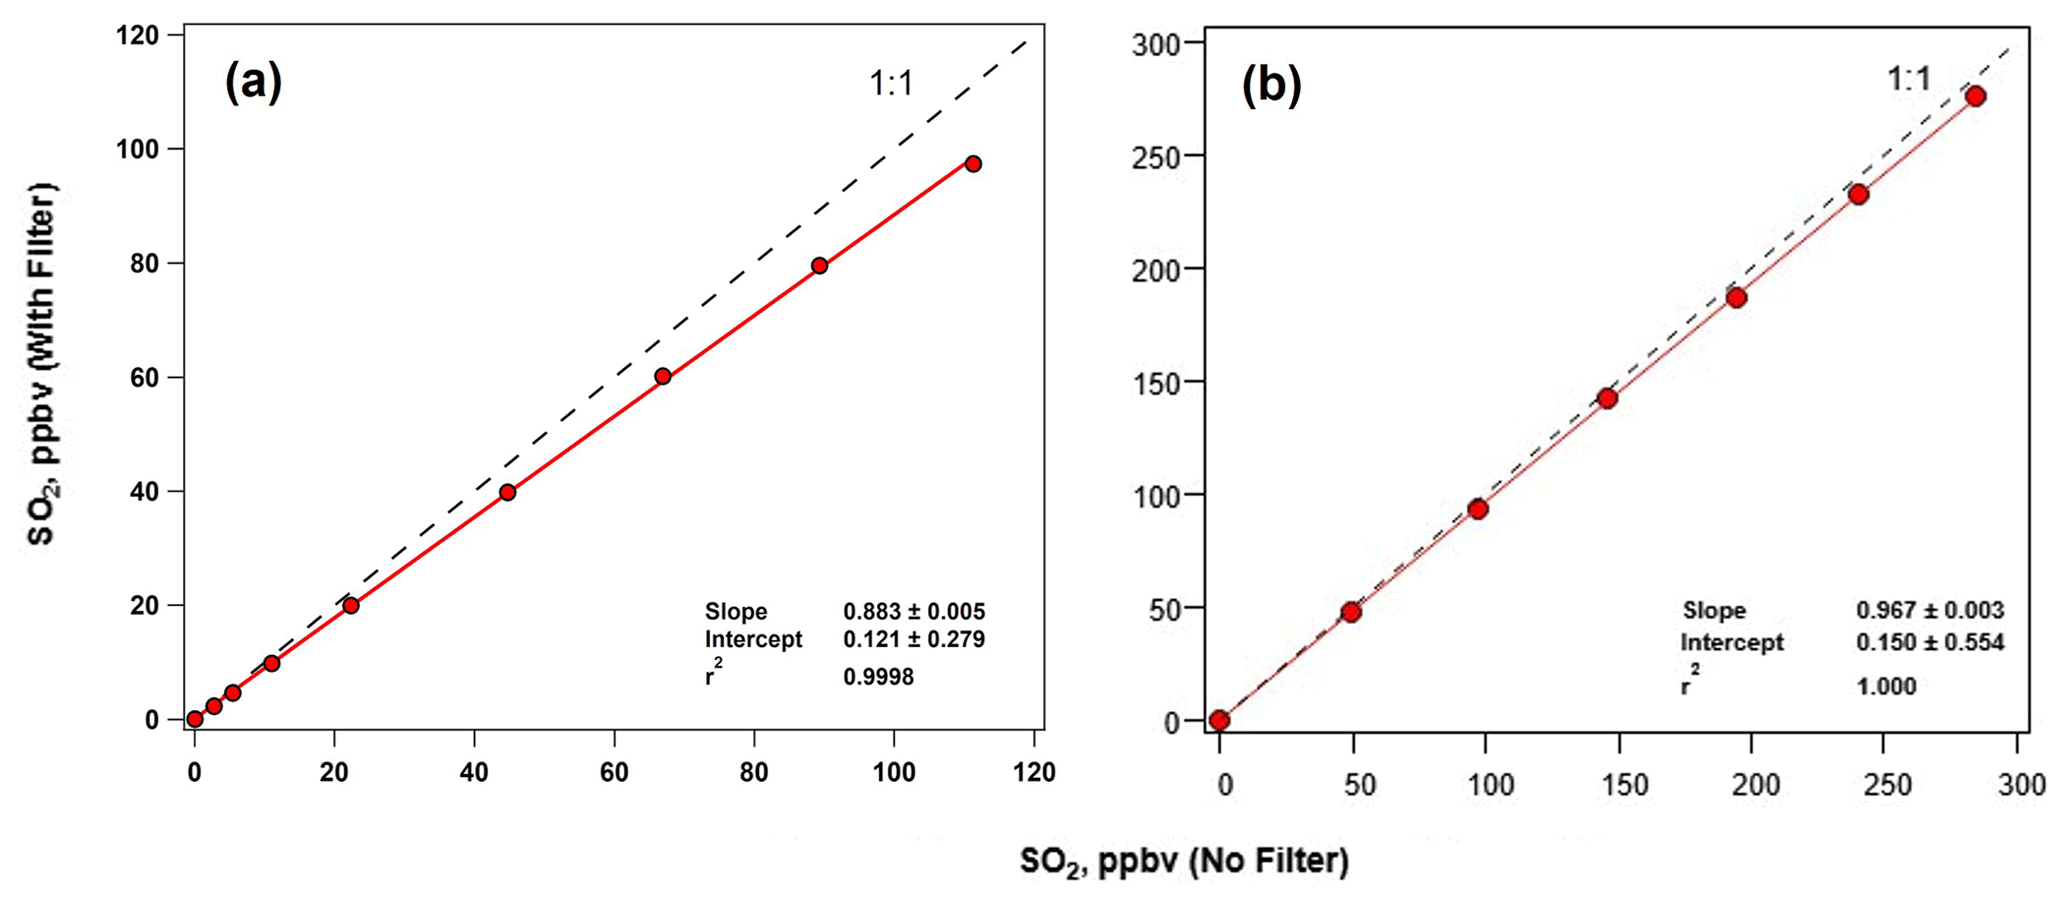
Figure 3Response of Thermo 43i−TL SO2 analyzer with (y axis) and without (x axis) an O3 removal filter using a calibration system with (a) a processed zero-air system and (b) a dry zero-air gas cylinder.
3.4 Sample dryer
The SO2 sonde v1.0 had highly varying sensitivities during the initial field tests. The instrument sensitivity was determined by regression analysis of the sonde's cell current to the SO2 concentration measured by an SO2 analyzer. The variability in the sensitivities was hypothesized to be due to differing levels of humidity during each SO2 sonde launch. SO2 is soluble in water and through multiphase reactions can be oxidized to sulfuric acid in the atmosphere in the presence of water vapor (e.g., precipitation, clouds, fog) (Carmichael and Peters, 1979; Zhang et al., 2013; Terraglio and Manganelli, 1967). Factors including liquid water content, aerosol composition, aerosol loading, and pH of the water are important in determining the adsorption and oxidation rates of SO2 (Liu et al., 2021). When air with elevated humidity is flowing through a filter, SO2 gas is likely adsorbing on the filter, causing lower SO2 transmission efficiency due to the potential uptake of SO2 in water on the filter. Several laboratory tests confirmed the need to remove water from the sample upstream of the O3 removal filter to improve the measurement of SO2. A desiccant membrane dryer (Perma Pure LLC, Lakewood, NJ) composed of a Nafion™ tube in silica gel desiccant was placed in-line upstream of the O3 removal filter. This sample dryer is lightweight, relatively inexpensive, and does not require power.
Laboratory tests included exposing the SO2 sonde, with and without a sample dryer, to controlled levels of humidity and SO2. Without removing water vapor, the SO2 transmission efficiency decreases as humidity increases, particularly above 50 % RH (Fig. 6). As the O3 removal filter is humidified, the SO2 transmission efficiency decreases. With the sample dryer in place, each of the laboratory SO2 transmission efficiency (17–18 and 21 May 2018) tests varied by an average of <1 % across a range of 0 %–85 % RH (Fig. 6).
The dryer's useful lifetime was determined by continuously exposing it to high-humidity (>95 % RH at approximately 23 ∘C) sample stream. The downstream RH climbed from 5 % to 16 % after 2.3 h and to 25 % after 6.3 h. At these downstream RH levels, the SO2 transmission efficiency remained above 95 %. A typical SO2 sonde's measurement time per flight, including pre-flight calibration, is approximately 3 h. The dryer's useful lifetime is likely much longer than required for a balloon flight since exposure to 95 % RH conditions for several hours is highly unusual outside of hurricanes and tropical systems. SO2 sonde and Thermo 43c-TL measurements were strongly correlated (r2=0.99) during a multipoint calibration conducted using the O3 removal filter and the dryer under relatively high humidity levels. During that calibration, the SO2 sonde's sensitivity was 45.43±0.17 ppbv µA−1. By comparison, the average sensitivity during the initial Hawaii deployment was 84.6±31.7 ppbv µA−1 across 10 sondes. The sample dryer, therefore, improved both the sensitivity and stability of the measurements observed. The addition of the sample dryer is necessary for providing accurate ambient SO2 measurements.
The SO2 sonde v1.0, single-SO2 sonde without the sample dryer, was deployed and tested in Hawai'i and Costa Rica (Fig. S2). The field sites were close to active volcanoes, which are significant sources of natural SO2 (Tang et al., 2020; Carn et al., 2017). In Hawai'i, field measurements were made near Kīlauea volcano on the southeastern shore of the island of Hawai'i, the largest of Hawaii's islands. Kīlauea is the youngest volcano on the island and one of Earth's most active volcanoes (Kern et al., 2015; Nadeau et al., 2015). Kīlauea had been in a state of eruption since 1983 (Patrick et al., 2019), with an average SO2 release rate of approximately 5500 T d−1 measured during 2014–2017 (Elias et al., 2018). In Costa Rica, field measurements were made near Turrialba volcano, one of the most active volcanoes in the Central American Volcanic Arc. Studies of emissions from Turrialba prior to 2013 reported SO2 release rates of up to 4000 T d−1 (de Moor et al., 2016; Xi et al., 2016). The activity of Turrialba increased after 2014, raising concerns for air quality and environmental health (de Moor et al., 2016; Tortini et al., 2017).
4.1 Kīlauea, Hawai'i – February 2018
The first deployment of the SO2 sonde v1.0 was during NASA's HyspIRI HyTES Hawaii Campaign (H3C) from 3–10 February 2018, near Kīlauea volcano. The instrument was tested in flights on free-release balloons and a tethered balloon system (TBS) and at ground level with measurements in Hawai'i Volcanoes National Park (HVNP) downwind of Kīlauea's summit crater, Halema'uma'u. During the ground-level testing, an SO2 sonde and a Thermo 43c-TL SO2 analyzer's sample inlet were mounted on the top of a van for co-located sampling.
Figure 4a depicts the measurements taken during the first encounter with an SO2 plume while driving through the HVNP on 3 February 2018. The strongly correlated SO2 sonde and Thermo 43c-TL measurements (r2=0.99) reached upward of ∼940 ppbv. The SO2 sonde had a sensitivity of 118.4±0.4 ppbv µA−1, determined by regression analysis of the sonde's cell current with the Thermo 43c-TL concentrations (Fig. 4a). The SO2 sonde sensitivity varied significantly during the field deployment. During surface measurements on 10 February 2018, earlier zero-air calibrations measured a sensitivity of 86.5±1.5 ppbv µA−1, while measurements during an SO2 plume event, with peak concentrations of up to 400 ppbv, found the SO2 sonde's sensitivity was 73.9±0.6 ppbv µA−1 (Fig. 4b). Although the SO2 sonde sensitivity varied significantly in 10 subsequent calibrations (84.6±31.7 ppbv µA−1), the measurements remained strongly correlated (range: r2= 0.94–0.99). The variability in the sensitivity in the field was due to changes in the ambient RH impacting the SO2 transmission efficiency of the O3 removal filter. This hypothesis was confirmed by laboratory RH testing and discussed in Sect. 3.3 and 3.4.
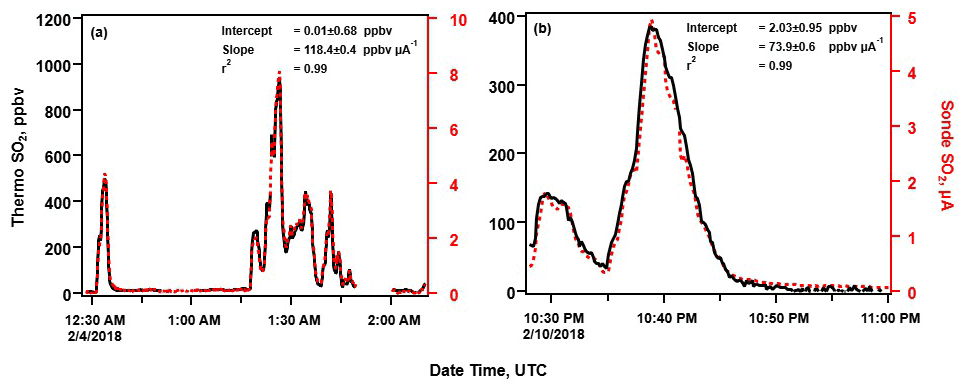
Figure 4SO2 sonde v1.0 and Thermo Environmental SO2 analyzer measurements at Kīlauea, Hawai'i, during H3C for (a) initial SO2 plume encounter on 3 February 2018 and (b) a pre-flight measurement on 10 February 2018, approximately 6 km downwind of Kīlauea's summit crater.
4.2 Turrialba, Costa Rica (dual-sonde versus SO2 sonde comparison)
On 23 March 2018, a traditional SO2 dual-sonde payload (Morris et al., 2010) and the SO2 sonde v1.0 were launched using a free-release balloon flight from the Universidad de Costa Rica's campus in San Jose (approximately 31 km downwind of Turrialba volcano). This flight provided the first direct in situ comparison of the two SO2 sonde methods. Figure 5 shows the response of the SO2 sonde v1.0 and the calculated SO2 dual-sonde profile. The dual-sonde SO2 method can only report concentrations of SO2 up to a maximum of the concentration of O3 present. Furthermore, because the SO2 concentration is determined by subtracting the signals from two instruments, its uncertainty is higher than the uncertainty of a measurement from a single instrument. When [SO2]>[O3], the dual sonde's unfiltered ozonesonde signal goes to zero, as happened for the Turrialba sonde launch between 3 and 5 km (Fig. 5). The SO2 saturates the cathode solution in the unfiltered sonde, not recovering until enough ambient O3 has been processed to rebalance the cell, resulting in a distorted profile (Fig. 5). For this flight, the SO2 sonde was configured to its maximum range (ULOD of approximately 450 ppbv at standard pressure) and was able to capture both the small plume below 2 km above mean sea level (a.m.s.l.) (approximately 18 ppbv) and the primary plume between 3 and 4 km a.m.s.l. (approximately 230 ppbv). The SO2 sonde v1.0 was able to capture the full shape of the profile, including the peak values and structure of the plume. The SO2 sonde v1.0 reports the top of the plume around 4 km a.m.s.l., whereas the dual sonde remains saturated until closer to 5 km a.m.s.l. Thus, the dual-sonde SO2 profiles, when saturated by high concentrations of SO2, erroneously appear to have a greater vertical extent. Further, the SO2 sonde v1.0 showed no interference from O3 at altitudes from the surface to 24.4 km a.m.s.l., with O3 concentrations in the stratospheric O3 layer reaching >4 ppmv (not shown), demonstrating the effectiveness of the O3 filter. The SO2 VCD was 8.3 DU (Dobson units, 1 DU molec. cm−2) for the SO2 sonde but was only 3.4 DU for the dual-sonde measurement. Thus, once saturated, the dual-sonde method is likely to underestimate the SO2 VCD.
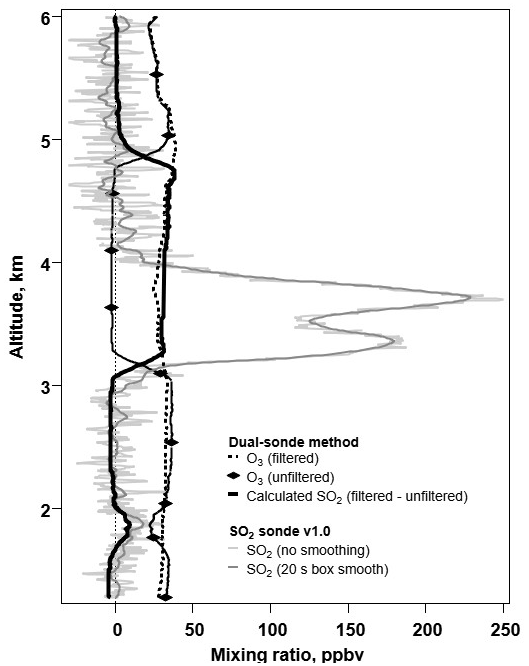
Figure 5The profiles of a triple-sonde payload, which consisted of a dual sonde in tandem with an SO2 sonde v1.0, launched from the Universidad de Costa Rica's campus in San Jose (approximately 31 km downwind of the volcano Turrialba) on 23 March 2018.
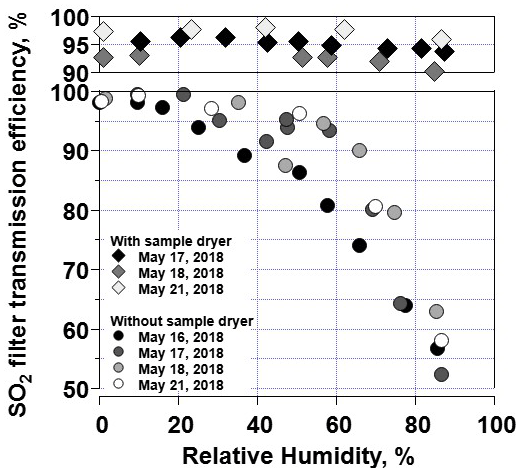
Figure 6Tests of SO2 transmission efficiency as a function of relative humidity without (circles) and with (diamonds) an upstream sample dryer.
The updated SO2 sonde (SO2 sonde v1.1) with the dryer filter was deployed and tested near Ft. Mackay, Canada, and again in Hawai'i in June 2018. Ft. Mackay is in the Alberta province of Canada and is home to the Athabasca oil sands, a large area of bitumen and heavy crude oil surface deposits high in sulfur content. Local processing of these products (e.g., surface mining) and resulting byproducts (e.g., tailing ponds) can release significant amounts of SO2 into the atmosphere (Bari et al., 2020; McLinden et al., 2016; Simpson et al., 2010). A second field deployment to Hawai'i followed immediately after the deployment to Canada. On 3 May 2018, Kīlauea volcano on Hawai'i entered a new eruptive phase with an outbreak of a series of fissures in the lower Puna area (Liu et al., 2021; Anderson et al., 2019; Gansecki et al., 2019; Patrick et al., 2020). The active phase volcanic gas emissions resulted in localized evacuations in the Lower East Rift Zone (LERZ), destroying more than 700 homes and displacing thousands of residents, and resulting in poor air quality for much of the southern and western portions of the island (Tang et al., 2020). The eruption event entered a paused phase in early August and was declared over on 5 December 2018 (Kern et al., 2020).
5.1 Athabasca oil sands, Canada
The SO2 sonde v1.1 was tested in Ft. Mackay (57.1206∘ N, 111.4241∘ W), Alberta, in the Athabasca oil sands from 10–16 June 2018 (Fig. S2c). This field project, conducted in conjunction with Environment Canada and York University, evaluated SO2 emissions from industrial activities in and near the oil sands region using a combination of TBS and ground-based measurements. The SO2 sonde v1.1 was flown on the York TBS payload, recording measurements from the ground to 300 m above ground level (a.g.l.; 650 m a.m.s.l.). This deployment provided a dilute anthropogenic plume to test the SO2 sonde in a high-sensitivity, low-range configuration. The average sensitivity of the SO2 sonde v1.1 during the project was 51±1.2 ppbv µA−1. The SO2 sonde was configured to sample in a range from ∼ 0.5–25 ppbv of SO2. The TBS SO2 sonde's vertical profiles were averaged into 10 m altitude bins that measured SO2 concentration ranges that are more representative of anthropogenically impacted SO2 rather than large volcanic plumes (Fig. 7). This field deployment also demonstrated the performance of the sonde at sub-ppbv levels of ambient SO2.
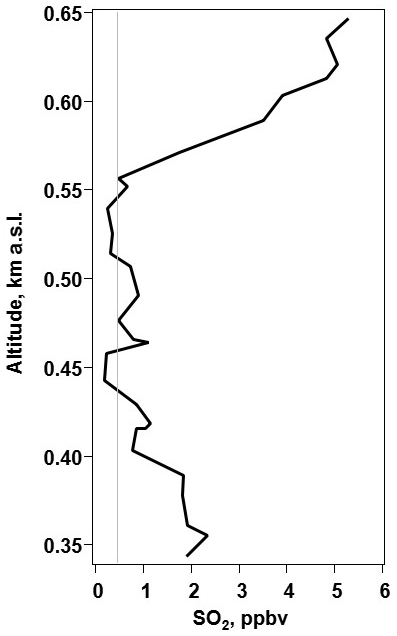
Figure 7The profile, constructed using 20 s average changes in altitude (ranging from 1 to 15 km), is for a tethered SO2 sonde v1.1 in the Athabasca oil sands region of Alberta, Canada. The SO2 sonde bias current was 0.5 µA, and the LLOD was 0.47 ppbv.
5.2 Kīlauea, Hawai'i – June 2018
In response to the larger eruption that started in May 2018, the SO2 sonde v1.1 was deployed to Hawai'i for the NASA-funded Big Island SO2 Survey (BISOS). The SO2 sonde launches occurred from Kahuku Ranch (19.0549∘ N, 155.6934∘ W) and Na'alehu Elementary School (19.0610∘ N, 155.5788∘ W) approximately 90 km downwind of Kīlauea's LERZ (Fig. S2d). The site's distance from the source allowed the plume to disperse and dilute compared with measurements at the vent. An SO2 plume was detected during seven of the nine free-release balloon launches during the June 2018 BISOS campaign. The 10 SO2 sonde v1.1 calibrations performed during BISOS had an SO2 sensitivity of 47.0±5.8 ppbv µA−1 and were similar to the laboratory results (45.43±0.17 ppbv µA−1).
With the anticipated levels of SO2, the sondes were configured to sample in the range of 10–450 ppbv of SO2. Figure 8 shows four distinctive SO2 profiles, and Table 2 includes the VCDs for each flight. No plumes above 5 km a.m.s.l. were detected. All but one of the observed SO2 plumes were below the capping inversion of the planetary boundary layer (PBL). On 22 June (Fig. 8a), the ascent profile shows SO2 below 3 km a.m.s.l. peaking at nearly 100 ppbv and additional features between 3 and 4 km a.m.s.l. peaking at 20–35 ppbv (Tang et al., 2020). The latter peaks were correlated with higher RH, perhaps the result of steam from a vent or the ocean entry points having broken through the inversion. The early afternoon 28 June profile (Fig. 8b) shows the highest concentration (325 ppbv) for a resolved SO2 plume during the BISOS campaign. Typical for the trade winds, NOAA HYSPLIT trajectories (Stein et al., 2015) showed the winds were out of the NE, consistent with the plume's transport from vents in the LERZ or the lava ocean entry points. Although the descent profile from a 29 June early afternoon launch lost the signal at 0.58 km a.m.s.l., Fig. 8c shows an SO2 plume over the ocean with a peak concentration of 188 ppbv at 0.74 km a.m.s.l. HYSPLIT trajectories again showed the winds were out of the NE. Lastly, the SO2 plume detected during the ascent of the 30 June launch (Fig. 8d) exceeded the ULOD between 1 and 3 km a.m.s.l. for the SO2 sonde configuration used. The distorted SO2 enhancement extending above the PBL as determined by the temperature inversion is most likely an artifact of the saturated sonde, similar to what was seen in the dual-sonde profile from Costa Rica (Fig. 5). As the RH remains low above the PBL, it is most likely that the SO2 is contained entirely within the PBL.
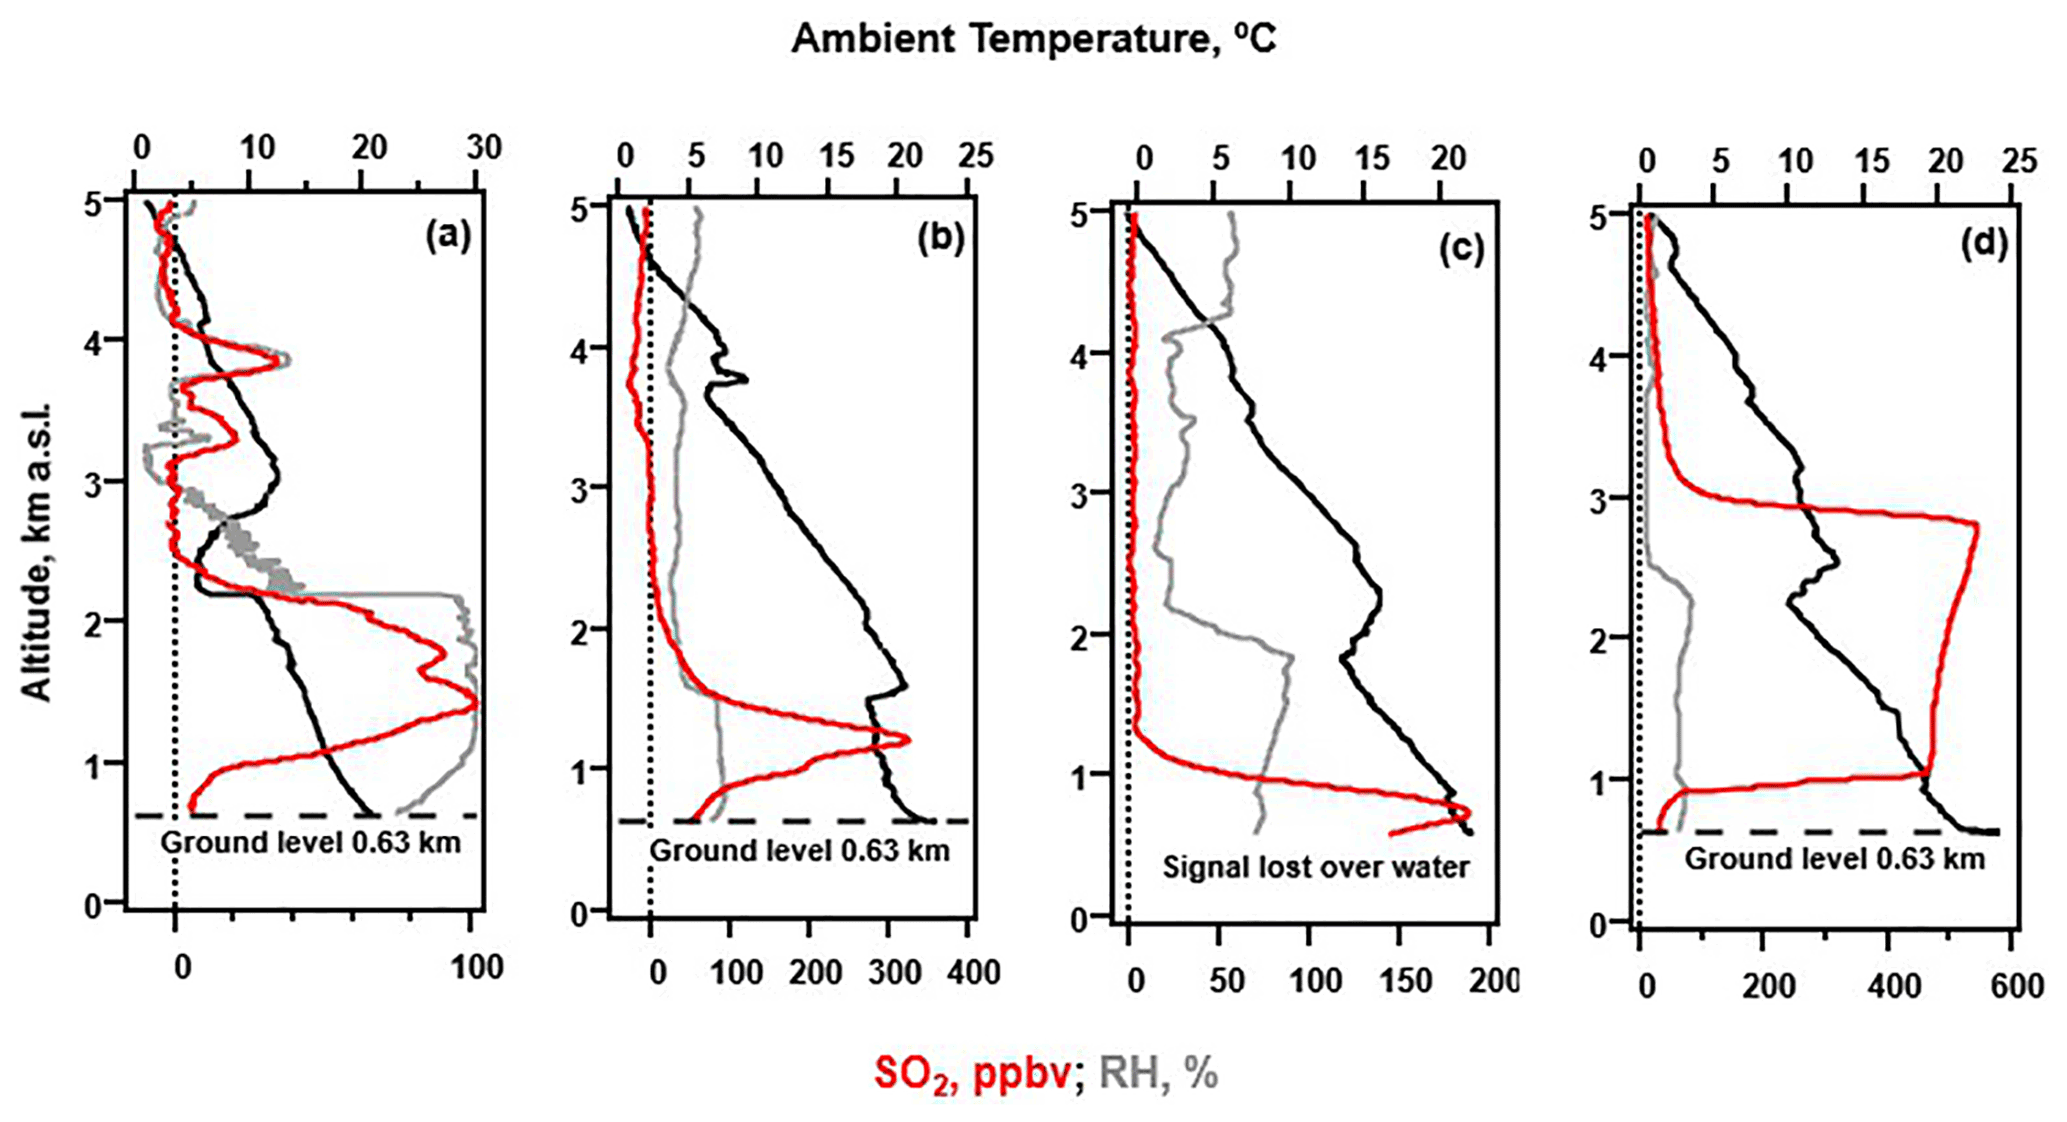
Figure 8Vertical profiles of SO2 (20 s box smoothing) from the SO2 sonde v1.1 during BISOS in June 2018 with free-release balloon launches occurring at the Kahuku Ranch on the big island of Hawai'i. Profiles are from (a) 22 June 2018 00:32, (b) 28 June 2018 20:45, (c) 29 June 2018 21:36, and (d) 30 June 2018 20:48. All times are UTC.
Table 2The SO2 vertical column density (VCD) for profiles shown in Fig. 8 from BISOS in June 2018. For profile c, the descent profile VCD is reported for the flight without extrapolation (shown without parentheses) and using linear extrapolation assuming the SO2 concentration to be 0 ppbv at sea level (shown in parentheses).
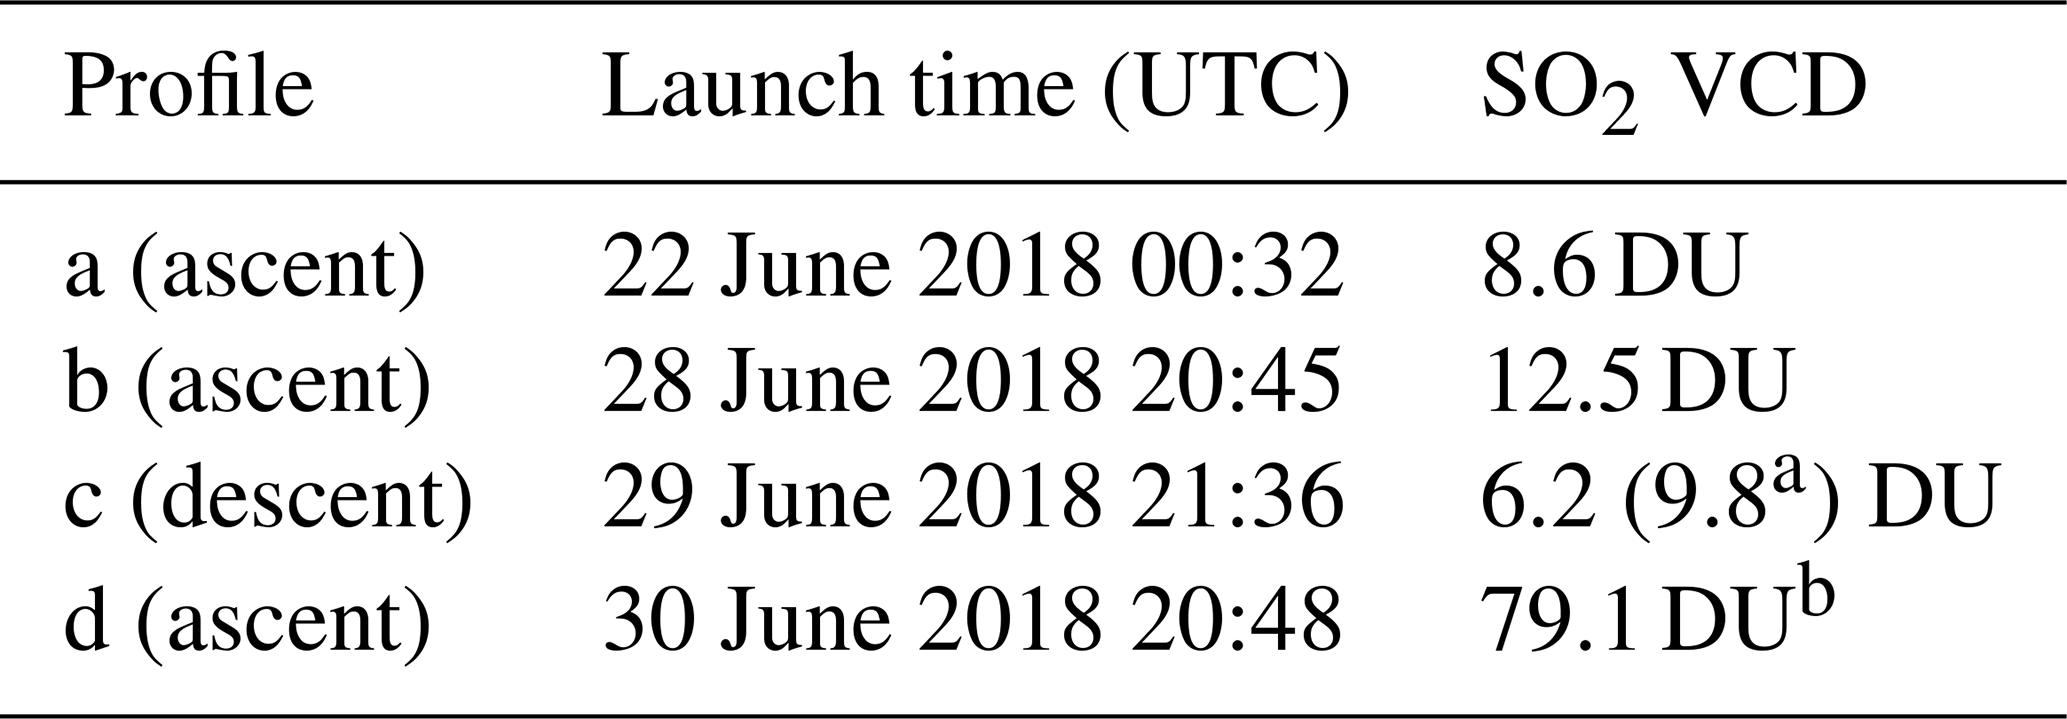
a VCD from extrapolated data. b Saturation of SO2 at altitudes of 1 to 3 km a.m.s.l.
An innovative new method for measuring vertical profiles of SO2 from TBS and free-release balloons was successfully tested and demonstrated in controlled laboratory experiments and during four different field deployments covering SO2 concentrations ranging from 0.5–325 ppbv during flights and up to 940 ppbv during ground measurements. This new method requires three major modifications to the standard ECC ozonesonde: the addition of a positive bias current in the cathode cell, an O3 removal filter, and a sample dryer. Relative to the previous dual-sonde method, the new method measures SO2 using a single-sonde system (i.e., the SO2 sonde). The SO2 sonde and Thermo 43c-TL measurements were strongly correlated during laboratory (r2>0.99) and field-based (r2>0.94) comparisons. Initial field tests and subsequent laboratory testing of SO2 sonde v1.0 highlighted the need to dry the sample upstream of the O3 removal filter to achieve consistent results. Follow-up field measurements in the Athabasca oil sands and Hawai'i clearly demonstrated the improvement in the SO2 sonde v1.1's sensitivity and consistency (51±1.2 and 47±5.8 ppbv µA−1, respectively) as a result of drying the sample.
The SO2 sonde v1.1 offers several advantages over the dual-sonde method, including the ability to measure [SO2] independent of [O3], the capability of sub-ppbv detection limits, faster response and recuperation time when exposed to larger SO2 plumes, and reduced uncertainty. The lighter weight of the payload requires a smaller balloon and less helium to lift, which may prove advantageous for deployment under some field conditions, particularly where helium supplies are limited. Its compactness and weight can also make it a candidate for UAV campaigns. Field deployments revealed specific issues and areas for improvement. The present design requires pre-setting the sonde's bias current prior to the launch. Thus, some a priori estimates of the plume are required to determine the appropriate bias current so that the instrument can measure the full range of SO2 concentrations present. In the current SO2 sonde v1.1, increasing the ULOD by applying a larger bias current also increases the LLOD. Further laboratory experiments are needed to identify the factors that cause the remaining observed variability in the SO2 transmission efficiency in the latest instrument version that includes the sample dryer. Much of the testing and calibration completed to date assessed the complete SO2 sonde system (i.e., sonde, filter, dryer). Building a database of the various individual factors, including pump speeds and filter transmission efficiency, will help us to better characterize the causes of sonde-to-sonde variability and allow future versions of the system to improve performance characteristics so that the system can be made available for operational use. Additionally, future paper topics include intercomparison studies of the SO2 sonde's vertical profile measurements with other column measurements (i.e., Pandora) and satellite measurements and more in-depth analysis of the SO2 sonde measurements at the various field deployments.
Data and code related to this article are available upon request to corresponding author.
The supplement related to this article is available online at: https://doi.org/10.5194/amt-15-4373-2022-supplement.
JHF and GM conceptualized the study. JHF, AK, SLA, MGS, EK, PW, GM, EC, AA, and JAD curated the data. AK, SLA, SY, and PW performed the analysis. JHF acquired funding for the project. AK, SLA, MGS, and EK led the investigation of the study. JHF and GM designed the methodology. SY wrote and prepared the original draft of manuscript. PW, GM, JAD, and JHF reviewed and edited the manuscript. JHF supervised the project.
The contact author has declared that none of the authors has any competing interests.
Publisher’s note: Copernicus Publications remains neutral with regard to jurisdictional claims in published maps and institutional affiliations.
We especially appreciate our collaboration with En-Sci in advancing this work. We would also like to thank Mark Gordon of York University and David Tarasick of Environment Canada for their invitation and assistance with the deployment to Ft. Mackay and Henry Selkrik and Holger Vomel from the TicoSonde project for their support in the Turrialba volcano testing campaign. A special thanks to Principal Darlene Javar of Na'alehu Elementary School and its teachers, staff, and students for letting us install equipment on a roof and helping us with a launch. Also, we thank the two anonymous reviewers for helpful comments on the original draft of this paper.
This research has been supported by the National Aeronautics and Space Administration (grant nos. NNG11HP16A and 80NSSC18K1061).
This paper was edited by Hendrik Fuchs and reviewed by two anonymous referees.
Anderson, K. R., Johanson, I. A., Patrick, M. R., Gu, M., Segall, P., Poland, M. P., Montgomery-Brown, E. K., and Miklius, A.: Magma reservoir failure and the onset of caldera collapse at Kīlauea Volcano in 2018, Science, 366, eaaz1822, https://doi.org/10.1126/science.aaz1822, 2019.
Bari, M. A., Kindzierski, W. B., and Roy, P.: Identification of ambient SO2 sources in industrial areas in the lower Athabasca oil sands region of Alberta, Canada, Atmos. Environ., 231, 117505, https://doi.org/10.1016/j.atmosenv.2020.117505, 2020.
Bluth, G. J., Doiron, S. D., Schnetzler, C. C., Krueger, A. J., and Walter, L. S.: Global tracking of the SO2 clouds from the June, 1991 Mount Pinatubo eruptions, Geophys. Res. Lett., 19, 151–154, 1992.
Carmichael, G. R. and Peters, L. K.: Some aspects of SO2 absorption by water-generalized treatment, Atmos. Environ., 13, 1505–1513, 1979.
Carn, S., Fioletov, V., McLinden, C., Li, C., and Krotkov, N.: A decade of global volcanic SO2 emissions measured from space, Scientific Reports, 7, 44095, https://doi.org/10.1038/srep44095, 2017.
Chen, T.-M., Kuschner, W. G., Gokhale, J., and Shofer, S.: Outdoor air pollution: nitrogen dioxide, sulfur dioxide, and carbon monoxide health effects, Am. J. Med. Sci., 333, 249–256, 2007.
Delmelle, P., Stix, J., Baxter, P., Garcia-Alvarez, J., and Barquero, J.: Atmospheric dispersion, environmental effects and potential health hazard associated with the low-altitude gas plume of Masaya volcano, Nicaragua, B. Volcanol., 64, 423–434, 2002.
de Moor, J. M., Aiuppa, A., Avard, G., Wehrmann, H., Dunbar, N., Muller, C., Tamburello, G., Giudice, G., Liuzzo, M., and Moretti, R.: Turmoil at Turrialba Volcano (Costa Rica): Degassing and eruptive processes inferred from high-frequency gas monitoring, J. Geophys. Res.-Sol. Ea., 121, 5761–5775, 2016.
Diaz, J. A., Pieri, D., Wright, K., Sorensen, P., Kline-Shoder, R., Arkin, C. R., Fladeland, M., Bland, G., Buongiorno, M. F., and Ramirez, C.: Unmanned aerial mass spectrometer systems for in-situ volcanic plume analysis, J. Am. Soc. Mass Spectr., 26, 292–304, 2015.
Elias, T., Kern, C., Horton, K. A., Sutton, A. J., and Garbeil, H.: Measuring SO2 emission rates at Kīlauea Volcano, Hawaii, using an array of upward-looking UV spectrometers, 2014–2017, Front. Earth Sci., 6, 214, https://doi.org/10.3389/feart.2018.00214, 2018.
US EPA: National air quality and emissions trends, 1998, United States Environmental Protection Agency, EPA-454/R-00-003, 2000.
Flynn, J. and Morris, G. A.: A method for directly measuring SO2 and other trace gases by electrochemical cell (ECC) sonde, Patent, United States Patent 11,150,2171, https://patentimages.storage.googleapis.com/4e/b7/eb/6c08e69823abfa/US11150217.pdf (last access: 28 February 2022), 2021.
Galle, B., Johansson, M., Rivera, C., Zhang, Y., Kihlman, M., Kern, C., Lehmann, T., Platt, U., Arellano, S., and Hidalgo, S.: Network for Observation of Volcanic and Atmospheric Change (NOVAC)–A global network for volcanic gas monitoring: Network layout and instrument description, J. Geophys. Res., 115, D05304, https://doi.org/10.1029/2009JD011823, 2010.
Gansecki, C., Lee, R. L., Shea, T., Lundblad, S. P., Hon, K., and Parcheta, C.: The tangled tale of Kīlauea's 2018 eruption as told by geochemical monitoring, Science, 366, eaaz0147, https://doi.org/10.1126/science.aaz0147, 2019.
Kern, C., Sutton, J., Elias, T., Lee, L., Kamibayashi, K., Antolik, L., and Werner, C.: An automated SO2 camera system for continuous, real-time monitoring of gas emissions from Kīlauea Volcano's summit Overlook Crater, J. Volcanol. Geoth. Res., 300, 81–94, 2015.
Kern, C., Lerner, A. H., Elias, T., Nadeau, P. A., Holland, L., Kelly, P. J., Werner, C. A., Clor, L. E., and Cappos, M.: Quantifying gas emissions associated with the 2018 rift eruption of Kīlauea Volcano using ground-based DOAS measurements, B. Volcanol., 82, 1–24, 2020.
Kiehl, J. and Briegleb, B.: The relative roles of sulfate aerosols and greenhouse gases in climate forcing, Science, 260, 311–314, 1993.
Komhyr, W.: Electrical concentration cells for gas analysis, Ann. Geophys., 25, 203–210, 1969.
Krug, E. C. and Frink, C. R.: Acid rain on acid soil: a new perspective, Science, 221, 520–525, 1983.
Liu, T., Chan, A. W., and Abbatt, J. P.: Multiphase Oxidation of Sulfur Dioxide in Aerosol Particles: Implications for Sulfate Formation in Polluted Environments, Environ. Sci. Technol., 55, 4227–4242, 2021.
McLinden, C. A., Fioletov, V., Krotkov, N. A., Li, C., Boersma, K. F., and Adams, C.: A decade of change in NO2 and SO2 over the Canadian oil sands as seen from space, Environ. Sci. Technol., 50, 331–337, 2016.
Morris, G. A., Komhyr, W. D., Hirokawa, J., Flynn, J., Lefer, B., Krotkov, N., and Ngan, F.: A balloon sounding technique for measuring SO2 plumes, J. Atmos. Ocean. Tech., 27, 1318–1330, 2010.
Nadeau, P. A., Werner, C. A., Waite, G. P., Carn, S. A., Brewer, I. D., Elias, T., Sutton, A. J., and Kern, C.: Using SO2 camera imagery and seismicity to examine degassing and gas accumulation at Kīlauea Volcano, May 2010, J. Volcanol. Geoth. Res., 300, 70–80, 2015.
Parker, D. E., Wilson, H., Jones, P. D., Christy, J., and Folland, C. K.: The impact of Mount Pinatubo on world-wide temperatures, Int. J. Climatatol., 16, 487–497, 1996.
Patrick, M., Orr, T., Anderson, K., and Swanson, D.: Eruptions in sync: Improved constraints on Kīlauea Volcano's hydraulic connection, Earth Planet. Sc. Lett., 507, 50–61, 2019.
Patrick, M., Johanson, I., Shea, T., and Waite, G.: The historic events at Kīlauea Volcano in 2018: summit collapse, rift zone eruption, and Mw 6.9 earthquake: preface to the special issue, B. Volcanol., 82, 46, https://doi.org/10.1007/s00445-020-01377-5, 2020.
Pieri, D., Diaz, J. A., Bland, G., Fladeland, M., Madrigal, Y., Corrales, E., Alegria, O., Alan, A., Realmuto, V., and Miles, T.: In situ observations and sampling of volcanic emissions with NASA and UCR unmanned aircraft, including a case study at Turrialba Volcano, Costa Rica, Geological Society, London, Special Publications, 380, 321–352, 2013.
Schmidt, A., Carslaw, K. S., Mann, G. W., Wilson, M., Breider, T. J., Pickering, S. J., and Thordarson, T.: The impact of the 1783–1784 AD Laki eruption on global aerosol formation processes and cloud condensation nuclei, Atmos. Chem. Phys., 10, 6025–6041, https://doi.org/10.5194/acp-10-6025-2010, 2010.
Shannon, J. D.: Regional trends in wet deposition of sulfate in the United States and SO2 emissions from 1980 through 1995, Atmos. Environ., 33, 807–816, 1999.
Simpson, I. J., Blake, N. J., Barletta, B., Diskin, G. S., Fuelberg, H. E., Gorham, K., Huey, L. G., Meinardi, S., Rowland, F. S., Vay, S. A., Weinheimer, A. J., Yang, M., and Blake, D. R.: Characterization of trace gases measured over Alberta oil sands mining operations: 76 speciated C2–C10 volatile organic compounds (VOCs), CO2, CH4, CO, NO, NO2, NOy, O3 and SO2, Atmos. Chem. Phys., 10, 11931–11954, https://doi.org/10.5194/acp-10-11931-2010, 2010.
Stein, A. F., Draxler, R. R., Rolph, G. D., Stunder, B. J., Cohen, M. D., and Ngan, F.: NOAA's HYSPLIT atmospheric transport and dispersion modeling system, B. Am. Meteorol. Soc., 96, 2059–2077, 2015.
Sunyer, J., Atkinson, R., Ballester, F., Le Tertre, A., Ayres, J. G., Forastiere, F., Forsberg, B., Vonk, J., Bisanti, L., and Anderson, R.: Respiratory effects of sulphur dioxide: a hierarchical multicity analysis in the APHEA 2 study, Occup. Environ. Med., 60, e2, https://doi.org/10.1136/oem.60.8.e2, 2003.
Tang, Y., Tong, D. Q., Yang, K., Lee, P., Baker, B., Crawford, A., Luke, W., Stein, A., Campbell, P. C., and Ring, A.: Air quality impacts of the 2018 Mt. Kilauea Volcano eruption in Hawaii: A regional chemical transport model study with satellite-constrained emissions, Atmos. Environ., 237, 117648, https://doi.org/10.1016/j.atmosenv.2020.117648, 2020.
Terraglio, F. P. and Manganelli, R. M.: The absorption of atmospheric sulfur dioxide by water solutions, Journal of the Air Pollution Control Association, 17, 403–406, 1967.
Tortini, R., van Manen, S., Parkes, B., and Carn, S.: The impact of persistent volcanic degassing on vegetation: A case study at Turrialba volcano, Costa Rica, Int. J. Appl. Earth Obs., 59, 92–103, 2017.
Tzortziou, M., Herman, J. R., Cede, A., Loughner, C. P., Abuhassan, N., and Naik, S.: Spatial and temporal variability of ozone and nitrogen dioxide over a major urban estuarine ecosystem, J. Atmos. Chem., 72, 287–309, 2015.
Tzortziou, M., Parker, O., Lamb, B., Herman, J. R., Lamsal, L., Stauffer, R., and Abuhassan, N.: Atmospheric Trace Gas (NO2 and O3) variability in South Korean coastal waters, and implications for remote sensing of coastal ocean color dynamics, Remote Sensing, 10, 1587, https://doi.org/10.3390/rs10101587, 2018.
Xi, X., Johnson, M. S., Jeong, S., Fladeland, M., Pieri, D., Diaz, J. A., and Bland, G. L.: Constraining the sulfur dioxide degassing flux from Turrialba volcano, Costa Rica using unmanned aerial system measurements, J. Volcanol. Geoth. Res., 325, 110–118, 2016.
Zhang, Q., Tie, X., Lin, W., Cao, J., Quan, J., Ran, L., and Xu, W.: Variability of SO2 in an intensive fog in North China Plain: Evidence of high solubility of SO2, Particuology, 11, 41–47, 2013.
Zhang, R., Wang, G., Guo, S., Zamora, M. L., Ying, Q., Lin, Y., Wang, W., Hu, M., and Wang, Y.: Formation of urban fine particulate matter, Chem. Rev., 115, 3803–3855, 2015.
Zhang, X. and Schreifels, J.: Continuous emission monitoring systems at power plants in China: Improving SO2 emission measurement, Energ. Policy, 39, 7432–7438, 2011.
- Abstract
- Introduction
- Instrumentation
- Single-sonde SO2 system and laboratory testing
- Field deployments with SO2 sonde v1.0
- Field deployments with SO2 sonde v1.1
- Conclusion and future work
- Data availability
- Author contributions
- Competing interests
- Disclaimer
- Acknowledgements
- Financial support
- Review statement
- References
- Supplement