the Creative Commons Attribution 4.0 License.
the Creative Commons Attribution 4.0 License.
 | 29 Jul 2022
Combined application of online FIGAERO-CIMS and offline LC-Orbitrap mass spectrometry (MS) to characterize the chemical composition of secondary organic aerosol (SOA) in smog chamber studies
Aristeidis Voliotis
Yunqi Shao
Thomas J. Bannan
Kelly L. Pereira
Jacqueline F. Hamilton
Carl J. Percival
M. Rami Alfarra
Gordon McFiggans
A combination of online and offline mass spectrometric techniques was used to characterize the chemical composition of secondary organic aerosol (SOA) generated from the photooxidation of α-pinene in an atmospheric simulation chamber. The filter inlet for gases and aerosols (FIGAERO) coupled with a high-resolution time-of-flight iodide chemical ionization mass spectrometer (I−-ToF-CIMS) was employed to track the evolution of gaseous and particulate components. Extracts of aerosol particles sampled onto a filter at the end of each experiment were analysed using ultra-performance liquid chromatography ultra-high-resolution tandem mass spectrometry (LC-Orbitrap MS). Each technique was used to investigate the major SOA elemental group contributions in each system. The online CIMS particle-phase measurements show that organic species containing exclusively carbon, hydrogen, and oxygen (CHO group) dominate the contribution to the ion signals from the SOA products, broadly consistent with the LC-Orbitrap MS negative mode analysis, which was better able to identify the sulfur-containing fraction. An increased abundance of high-carbon-number (nC≥16) compounds additionally containing nitrogen (CHON group) was detected in the LC-Orbitrap MS positive ionization mode, indicating a fraction missed by the negative-mode and CIMS measurements. Time series of gas-phase and particle-phase oxidation products provided by online measurements allowed investigation of the gas-phase chemistry of those products by hierarchical clustering analysis to assess the phase partitioning of individual molecular compositions. The particle-phase clustering was used to inform the selection of components for targeted structural analysis of the offline samples. Saturation concentrations derived from nearly simultaneous gaseous and particulate measurements of the same ions by FIGAERO-CIMS were compared with those estimated from the molecular structure based on the LC-Orbitrap MS measurements to interpret the component partitioning behaviour. This paper explores the insight brought to the interpretation of SOA chemical composition by the combined application of online FIGAERO-CIMS and offline LC-Orbitrap MS analytical techniques.
- Article
(3503 KB) - Full-text XML
- Companion paper 1
- Companion paper 2
- Companion paper 4
-
Supplement
(1299 KB) - BibTeX
- EndNote


Secondary organic aerosol (SOA) makes a significant contribution to atmospheric aerosols, which have an important influence on climate and an adverse impact on human health and air quality (Hallquist et al., 2009; Kroll and Seinfeld, 2008; Nel, 2005). It is important to understand the formation, composition, and behaviour of SOA due to its contribution to many important atmospheric processes, such as cloud formation (Hallquist et al., 2009). There are more than 10 000 individual organic species in the atmosphere and those are almost entirely in the vapour phase. Volatile organic compounds (VOCs) are known to be important in tropospheric ozone and SOA formation (Goldstein and Galbally, 2007). Biogenic volatile organic compounds (BVOCs) emitted from plants (such as monoterpenes) and anthropogenic volatile organic compounds (AVOCs) (such as aromatics) undergo atmospheric oxidation processes to generate SOA, leading to the formation of a large number of oxidized products (Goldstein and Galbally, 2007; Guenther et al., 2012; Hoyle et al., 2009; Iinuma et al., 2010; Mcfiggans et al., 2019). As a result of the various VOCs involved and the complexity of the oxidation processes, oxidation products span a wide range of molecular composition and physiochemical properties (Mentel et al., 2015; Ma et al., 2008; Mohr et al., 2019; Mutzel et al., 2015; Laj et al., 2009). Such chemical complexity poses a major challenge in the molecular characterization of SOA.
Atmospheric simulation chambers play a key role in the study of chemical processes that affect the composition of the atmosphere, enhancing mechanistic understanding of atmospheric chemistry at a molecular level (Cocker et al., 2001; Rohrer et al., 2005; Wang et al., 2011; Burkholder et al., 2017; Ren et al., 2017). In recent years, new developments in the techniques and design of laboratory experiments have been made to investigate the chemical composition of SOA generated from biogenic and anthropogenic sources under various well-controlled conditions, exploring the particle properties as well as identifying tracers and SOA formation pathways (Winterhalter et al., 2003; Ng et al., 2006; Nguyen et al., 2010; Chhabra et al., 2011; Zhang et al., 2015; Schwantes et al., 2017; Lopez-Hilfiker et al., 2014). Although some progress has been made in characterizing sources and formation pathways from some biogenic or anthropogenic precursors, significant gaps still remain in our understanding of the chemical properties of SOA.
Since there is currently no perfect instrument capable of providing detailed chemical characterization of SOA (Hallquist et al., 2009; Calvo et al., 2013), various analytical techniques have been established to better characterize SOA chemical composition. Mass spectrometric techniques have been widely employed both online and offline using a wide range of sample introduction techniques, ionization methods, and mass analysers (Hallquist et al., 2009; Nizkorodov et al., 2011; Laskin et al., 2012). Liquid chromatography coupled with electrospray ionization Orbitrap mass spectrometry (LC-Orbitrap MS) can probe the chemical composition of individual polar and non-polar particle-phase products with accurate mass measurement (Perry et al., 2008; Banerjee and Mazumdar, 2012; Mutzel et al., 2021). LC-MS has been extensively used for the chemical characterization of organic aerosols, quantifying targeted tracers, and characterizing using tandem MS to determine the molecular identity of ambient SOA (Samy and Hays, 2013; Iinuma et al., 2007; Parshintsev et al., 2015; Chen et al., 2020; Hamilton et al., 2013) and laboratory-produced SOA (Winterhalter et al., 2003; Pereira et al., 2014; Mutzel et al., 2021; Mehra et al., 2020).
Online collection of aerosol samples followed by fast and automated analysis has more recently been developed to overcome some limitations of offline measurements (such as sampling time integration, evaporation, adsorption, and potential filter contamination during transportation or storage). One such technique, the filter inlet for gases and aerosols combined with a soft chemical ionization method and mass spectrometer (FIGAERO-CIMS; Tofwerk A.G./Aerodyne Research Inc.), collects filter samples for subsequent thermal desorption to investigate the SOA particle-phase chemical composition (Lopez-Hilfiker et al., 2014). FIGAERO-CIMS has been coupled to different reagent ions to study the chemical properties of aerosols such as the evolution of gas- or particle-phase composition and the volatility of components in laboratory studies and fieldwork (Wang and Hildebrandt Ruiz, 2018; Stark et al., 2017; Bannan et al., 2019; Lee et al., 2020; Lopez-Hilfiker et al., 2016b; Hammes et al., 2019; Thornton et al., 2020). Other online instruments such as a particle-into-liquid sampler (PILS) coupled with ion chromatography (Bateman et al., 2010) and a chemical analysis of aerosol online (CHARON) particle inlet coupled to proton-transfer-reaction time-of-flight mass spectrometry (PTR-ToF-MS) (Gkatzelis et al., 2018) can also be employed for collection and near-real-time analysis of chemical compounds in aerosols. Recently, multiple online analytical techniques have been combined to investigate the chemical properties of atmospheric organic carbon, such as the combination of CIMS, PTR-MS, and aerosol mass spectrometer (AMS) (Isaacman-Vanwertz et al., 2017, 2018). There are notable overlaps and differences in the chemical information provided from those online measurements. Nevertheless, few studies have combined offline LC-Orbitrap MS and online FIGAERO-CIMS to study the molecular composition of SOA (Mehra et al., 2020). By combining both techniques, detailed molecular composition can be obtained with time evolution and profiling, offering enhanced mechanistic insights.
The purpose of this paper is to explore the benefits of combined LC-Orbitrap MS and FIGAERO-CIMS analytical techniques to investigate SOA chemical composition, demonstrating the power of this combination from a technical perspective. To show this experimentally, α-pinene (C10H16), as one of the most abundant monoterpenes (emitted in substantial amounts by vegetation, e.g. many coniferous trees, notably pine), was selected to generate SOA in the presence of NOx in the Manchester Aerosol Chamber (MAC). First, both online and offline analyses were used to retrieve the major elemental group contributions to the SOA in the α-pinene system. Second, temporal profiles of individual components in gas and particle phases provided by online measurement enabled observation of the evolution of identified components. Third, hierarchical clustering analysis (HCA) was employed to reduce the dimensionality of the complex composition measurements by grouping compounds with similar chemical properties. Finally, saturation concentrations of targeted compounds derived from the partitioning theory in the FIGAERO-CIMS were compared with those derived from the structural information determined using the LC-Orbitrap MS measurements.
2.1 Chamber description and experimental design
Experiments were performed in the Manchester Aerosol Chamber located at the University of Manchester to investigate SOA formation using a broad suite of instrumentation. A full description of the MAC and its characterization can be found in Shao et al. (2022). Briefly, the chamber has a volume of 18 m3 (3 m (L) ×2 m (W) ×3 m (H)) and consists of a fluorinated ethylene Teflon bag, which is suspended in the enclosure and supported by three rectangular aluminium frames. The central frame is fixed, while the upper and lower ones are allowed to move freely to expand and collapse the chamber when sample airflow is introduced to or extracted from the chamber. Relative humidity (RH) and temperature were controlled by the humidifier and air-conditioning and were measured at a few points throughout the chamber by a dew point hygrometer and a cross-calibrated capacitive sensor. Two 6 kW xenon arc lamps and 112 halogen lamps (Solux 50 W/4700 K, Solux MR16, USA, 16×7 rows) are mounted on the wall of the enclosure to provide uniform illumination. The experiments reported here used two arc lamps with quartz glass filters in front of them and five rows of halogen lamps to simulate the solar spectra over the wavelength range of 290–800 nm (Alfarra et al., 2012). The reported calculated photolysis rate of NO2 (jNO2), investigated from the steady-state actinometry experiments, was ∼ 0.11–0.18 min−1 (Shao et al., 2022).
Purified dry air was supplied to the chamber by laboratory air through a dryer (ML180, Munters) and three filters (Purafil, Purafil Inc., USA; charcoal and HEPA, Donaldson Filtration, filters). The chamber was cleaned by a series of automatic fill–flush cycles with purified air (3 m3 min−1) before each experiment and by overnight oxidation at a high concentration of O3 (∼1 ppm) at the end of each experiment. An extra 4–5 h of harsh cleaning experiment under strong ultraviolet photolysis was performed weekly with a high concentration of O3 (∼1 ppm) to remove the reactive compounds in the chamber. Liquid VOC precursors (α-pinene in this study; Sigma Aldrich, GC grade ≥99.99 % purity) are fed into the chamber via injecting into a heated glass bulb (max: 80 ∘C), vaporized immediately, and flushed into the chamber by continuous high-purity nitrogen (ECD grade, 99.998 % purity N2). The required concentration of NOx (self-made NOx cylinder, 10 % NO2 and 90 % N2) is controlled by the injection of NO2 from a cylinder into the charge line. Seed particles were generated from aqueous solutions using ammonium sulfate (AS, Puratonic, 99.999 % purity) by nebulizing via an aerosol generator (Topaz model ATM 230) and introduced into the chamber. During injections, the seed particles and gases are fed into the chamber with continuous purified air at a flow rate of 3 m3 min−1, ensuring rapid and well-mixed conditions in the chamber. The relative humidity in the chamber was adjusted by the custom-built humidifier, which comprises a 50 L tank fed with ultra-pure water (resistivity ≥18.2 MΩ cm), generating water vapour using an immersion heater that heats the water to ∼80 ∘C.
In this work, we will focus on the application of offline and online techniques for the chemical characterization of gaseous and particulate components formed from the photooxidation of α-pinene in three repeat experiments. To obtain sufficient particulate mass on the filter at the end of each experiment, an initial reference concentration of α-pinene was targeted at 309 ppb for each experiment, with an initial VOC to NOx ratio ranging from 6 to 8 ppb ppb−1. The α-pinene studies were part of a series of experiments investigating SOA formation in mixtures, and the rationale behind the experimental design is detailed elsewhere (Voliotis et al., 2021). The O3 concentration was zero at the beginning of each experiment and no additional O3 was added during experiments. Ammonium sulfate seed aerosol (1 g AS dissolving in 100 mL deionized water, µg m−3) was added to enable more controllable and uniform condensation of the gas-phase products and suppress their nucleation. VOCs, NOx, and seed particles were injected into the clean chamber. All experiments were performed under similar conditions (temperature ∼25 ∘C, relative humidity ∼50 %, 6 h photooxidation reactions). The initial OH source was generated through the photolysis of the injected NO2. During experiments, photolysis of ozone and unsaturated VOC ozonolysis (or potentially via OH recycling) can also generate OH source. The irradiance for photolysis of both NO2 and O3 is provided by two 6 kW xenon arc lamps and five rows of halogen lamps as described in Shao et al. (2022). A 1 h stabilization period was utilized for measurement of the background conditions in the chamber after injection of the precursors and seed particles but before illumination of the chamber and the onset of photooxidation. At the end of each daily experiment, aerosol sample filters were collected through the 47 mm embedded filter holder located at the flushing line of the chamber by pre-processed filters (quartz filter: 2.2 µm pore size) at the flow rate of 3 m3 min−1, before storage in a freezer at −20 ∘C for subsequent extraction and analysis. Filters were pre-baked at 550 ∘C for 5.5 h to remove potential organic contaminants and stored in the freezer (−5 ∘C) until sampling and analysis. The chemical composition of filters was characterized and expressed as peak area through the offline LC-MS analysis. The ratio of peak areas for the contaminant in the blank filter to that in the samples is 188, indicating much lower loading of the blank filters after the pre-treatment. Table 1 summarizes the initial experimental conditions and instrument availability.
Table 1The initial experimental conditions and instrument availability.
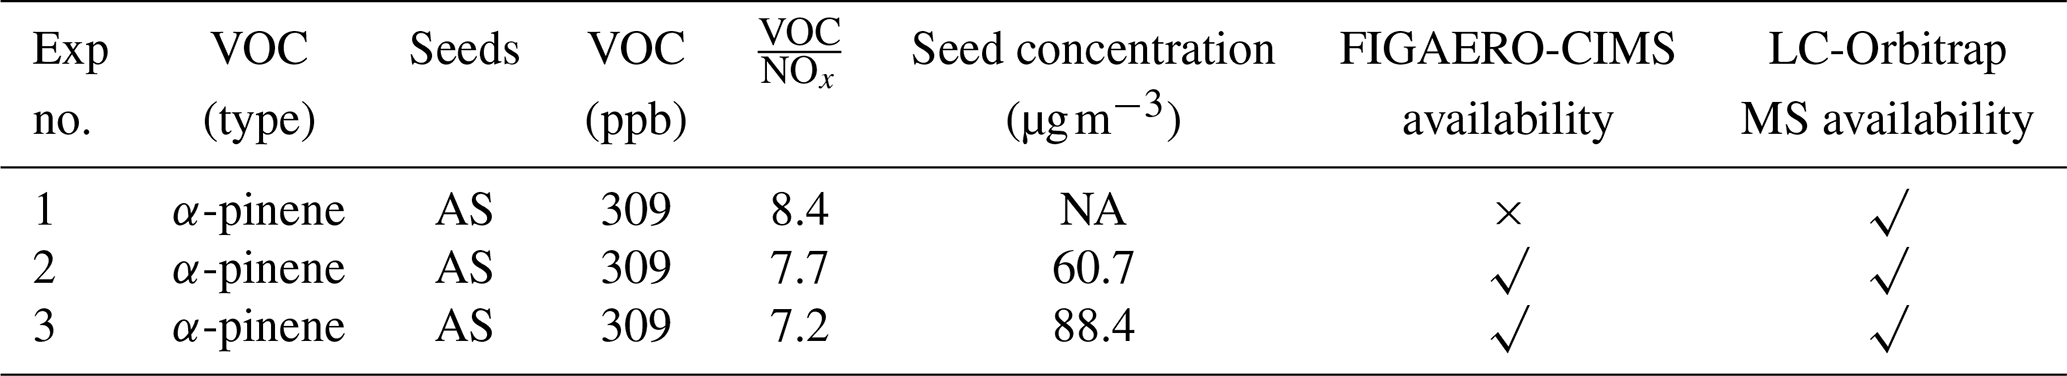
Note: NA represents “no data” due to instrumental issues. The reported initial VOC concentrations in this table have a ±15 % measurement uncertainty.
Repeat experiments were used to evaluate the reproducibility of our experimental system and our data processing as well as to provide a quantification of our confidence in the processes leading to the differences in composition. Data differences can arise from a range of sources: control of experimental conditions, instrumental errors and operational differences, data processing, and error propagation. The treatment of the data from the three experiments for the different measurement techniques is described in their respective data processing sections.
2.2 Online FIGAERO-CIMS
2.2.1 Instrumentation and operation
We employed a FIGAERO-CIMS (Aerodyne Research Inc.) with iodide (I−) as the reagent ion to measure the gas- and particle-phase oxidized species produced from photooxidation reactions of the experiments. This instrument has been described in detail previously (Reyes-Villegas et al., 2018; Bannan et al., 2019) and was operated at a ∼4000 () resolving power. Gas-phase species are sampled via a 0.5 m i.d. PFA tubing at 1 standard litre per minute (SLPM) from the chamber. The gas sampling was performed for 30 min. Meanwhile, particles are collected simultaneously in a separate FIGAERO inlet on a polytetrafluoroethylene (PFTE) filter (Zefluor, 2.0 µm pore size) at the flow rate of 1 SLPM. After 30 min of collection, the filter undergoes thermal desorption (15 min temperature ramp to 200 ∘C, 10 min holding time, and 8 min cooling down to room temperature). Six gas-phase and particle-phase cycles were carried out during each experiment. The sample blanks were collected by two additional gas- and particle-phase cycles before the initiation of photooxidation. The first cycle was conducted in the clean chamber condition before the injection of reactants. This was followed by the second cycle after all species (VOC, seeds, and NOx) had been injected. The gas-phase data collected in the first cycle were employed for the gas-phase “chamber background”. The instrument was flushed with ultra-high-purity nitrogen (UHP, 99.999 % purity, N2) for 0.2 min every 2 min during each gas-phase measurement, which acted as the gas-phase “instrument background”. To remove the influence of the seed particles, the particle-phase data collected in the second cycle were used as the particle-phase background correction.
2.2.2 Data processing
Data analysis was performed on the Tofware package (version 3.1.2) using the Igor Pro 7.0.8 (WaveMetrics, OR, USA) environment (Stark et al., 2015). Mass spectra were mass-calibrated, after which the high-resolution peaks were fit via the multi-peak fitting algorithm. The exact mass of the multiple peaks is then matched with the most likely elemental formula, with mass errors less than ±6 ppm. Assigned peaks were fitted through the iterative peak assignment method outlined in Stark et al. (2015). In this study, the of the ion adducts with I− ranging from 200 to 550 was selected to investigate the oxidation products as signals in this range contribute more than 80 % of the total signal (excluding the reagent ions, I−, IH2O−, I, and I). All identified molecular formulae were thereafter expressed as CxHyOzNm.
Substantial challenges remain in quantifying all identified compounds owing to a lack of standards. The total signal of identified peaks in the range of 200–550 (excluding the reagent ions, I: 253.809492, and I: 380.713964) was used to normalize the ion signal, expressing the relative contribution of each identified compound with an implicit assumption of uniform sensitivity (Isaacman-Vanwertz et al., 2018). The gas- and particle-phase dataset undergoes post-processing in MATLAB (R2017a) code in different ways. For the gas phase, the averaged gas-phase measurement signal of ion i was corrected by subtracting the average clean chamber background value and instrumental background value.
For the particle phase, the signal in the first 60–90 s with relatively low and stable signals was considered the instrumental background, enabling interference between the gas and particle mode switching to be removed (Voliotis et al., 2021). All the measured signals were corrected by subtracting the average background value of each ion, after which the temperature of ion counts i was integrated to estimate the normalized signal. The thermogram desorption of one compound may have more than one maximum desorption temperature or enhanced tailing even during the temperature ramp period. This can be caused by the fragments from higher-molecular-weight compounds or the presence of isomers with different saturation concentrations (Lopez-Hilfiker et al., 2015, 2016a; Lutz et al., 2019; Stark et al., 2017). These complex thermogram desorption features for one compound (e.g. two thermogram profiles or enhanced tailing) can be addressed by a custom non-linear least-squares peak fitting routine (Stark et al., 2017; Lopez-Hilfiker et al., 2016b, 2015). A non-linear iterative curve fitting method was deployed to fit the peaks (O'Haver, 2021). First, the highest signal was found corresponding to the first maximum desorption temperature (Tmax) of the ion. The peak width was set based on the full width at half-maximum (FWHM) and the shape followed by Gaussian distribution. The number of desorption peaks as well as the location and the amplitude of each peak were optimized to fit the total shape of the desorption profile and used to retrieve the total ions for each peak. Figure 1 shows an example of desorption peaks of two compounds, which are consistently measured as major components of the detected α-pinene-derived SOA particles. Typically, the results show that the second peak has a Tmax between 20 and 90 ∘C higher than the first peak, which is caused by the thermally decomposed accretion products from higher molecular weight rather than isomers (Lopez-Hilfiker et al., 2015). Thus, the first desorption peak was considered the monomer generated from the precursor oxidation, and its related integrated ion counts were employed for normalized signal and partitioning calculations.
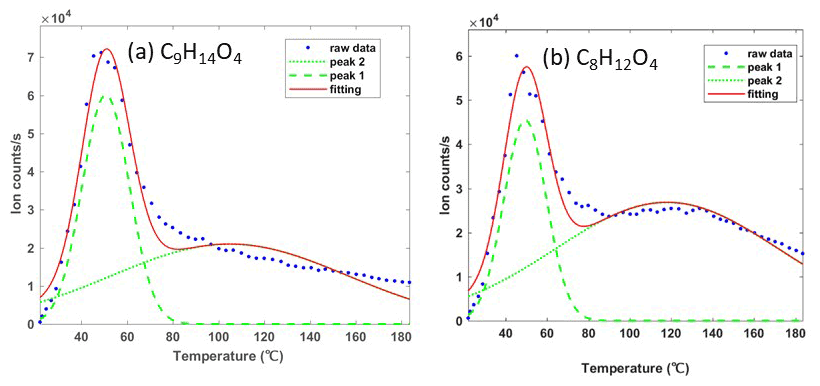
Figure 1Two examples of an ion with more than a single desorption peak in the FIGAERO-CIMS. Here the peaks at the lower desorption temperature were assigned to monomers C9H14O4 (a) and C8H12O4 (b) generated from α-pinene directly, with the broader higher-temperature peaks being a fragment of another ion at the same mass.
Since a common peak list is used for two experiments, the normalized fractional CIMS signal for the repeat experiments can be reported as averages along with the associated variability (as in Figs. 2 and 4) or as values from one representative experiment without variability (e.g. Figs. 3, 5, and 6) associated with figures in the Supplement representing another experiment as appropriate.
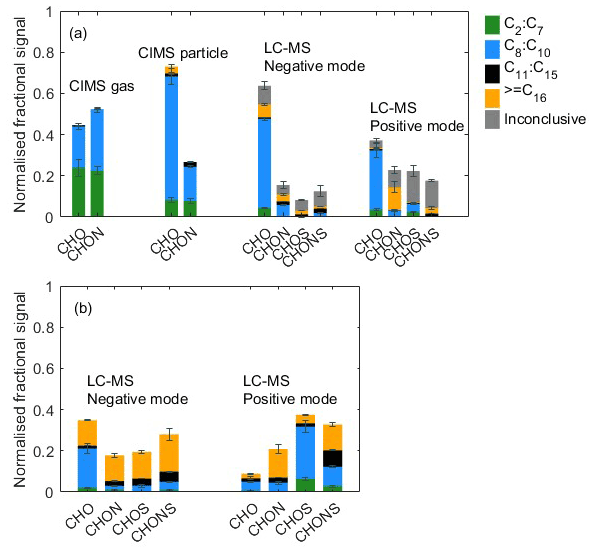
Figure 2(a) Elemental grouping from CIMS gas-phase measurement, CIMS particle-phase measurement, and LC-Orbitrap MS in the α-pinene system. The signal of each compound is normalized to all compounds. (b) Elemental grouping for LC-Orbitrap MS inconclusive compounds. The signal of each compound is normalized to the total inconclusive compounds. The colours correspond to the ones in panel (a). Standard deviations (n=2 for CIMS and n=3 for LC-Orbitrap MS) are indicated by error bars.
2.2.3 Hierarchical clustering analysis
Hierarchical clustering analysis (HCA) is an analytical method that is used to group or cluster datasets with a large number of individual observations based on the similarity of their behaviour over time. It is used here to investigate the time series of gaseous and particulate oxidation products measured by CIMS and FIGAERO-CIMS. Generally, there are two main hierarchical clustering analysis methods: divisive hierarchical clustering (working in a top-down method), which describes if a cluster needs to be split, and agglomerative hierarchical clustering (working from the bottom up), which describes if clusters should be combined (Nielsen, 2016; Bar-Joseph et al., 2001; Müllner, 2011). Compared to divisive hierarchical clustering, agglomerative hierarchical clustering is commonly used to cluster measurements with distinct time series behaviours from mass spectrometry datasets and describe the degree of similarity between any two measurements, reducing the dimensionality of mass spectrometry datasets and improving understanding of bulk properties of the chemical processes (Sánchez-López et al., 2014; Rosati et al., 2019; Koss et al., 2020; Priestley et al., 2021). HCA is independent of calibration or instrumental sensitivity since it relies on the relative differences between time series shapes. The final number of clusters is decided based on the distance between the objects and is decided by the user. In this study, we illustrate how HCA can be implemented to reduce the complexity of a dataset while retaining the chemical information by investigating the oxidation processes or product properties from the photooxidation of α-pinene.
First, to observe the time series trend changes of each ion and remove the effect of the differences caused by the absolute signal intensity, all measurements are normalized to the highest signal in each time series of each ion. Second, the Euclidean distance between each pair of points of ion A and ion B was calculated (Eq. 1). The sum of the distance for each pair of observations was considered the distance metric since this approach is most reproducible and least sensitive to outlier points in the time series (Koss et al., 2020).
Third, the average linkage criterion was selected to determine the distance between sets of measurements as this criterion gave more similar or understandable results. The algorithm starts with the distances between all observations. As a first step, the lowest distance between observations A and B is identified and assigned a new cluster x. The two observations of A and B are removed from the distance dataset and the new cluster x is added to the dataset. Then the distance set between the new cluster x and the remaining observations (named y) was calculated as the average of the distances between each of n individual members of x and m individual members of y over all points i in cluster x and points j in cluster y, as shown in Eq. (2). The smallest distance between those observations is then found and made into a new cluster iteratively until only one cluster remains. Finally, the dendrogram tree is deployed to display the relationships between each measurement and cluster. The whole process is carried out in MATLAB (MathWorks, Inc.).
2.3 Offline LC-Orbitrap MS
2.3.1 Sample preparation
The sample preparation method described in Bryant et al. (2020) was modified for our experimental conditions. Briefly, 4 mL of methanol was added to a cleaned and dried extraction vial containing half a filter cut into small pieces and left at room temperature for 2 h before sonicating for 30 min. The extractant was then filtered through a 0.22 µm filter (Thermo Fisher Scientific) using a syringe (1 mL, BD PLASTIC PAK, STERILE) into another sample vial, which was evaporated to dryness using a vacuum solvent evaporator (Biotage, Sweden). The sample was reconstituted in 1 mL of 10:90 methanol : water (optima LC-MS grade, Thermo Fisher Scientific) for analysis.
2.3.2 LC-Orbitrap MS analysis
The samples were analysed using ultra-performance liquid chromatography ultra-high-resolution mass spectrometry (Dionex 3000, Orbitrap QExactive, Thermo Fisher Scientific). Compound separation was achieved using a reverse-phase C18 column (aQ Accucore, Thermo Fisher Scientific) with the following dimensions: 100 mm (L) × 2.1 mm (W) and 2.6 µm particle size. The column was held at 40 ∘C during analysis and the samples were stored in the autosampler at 4 ∘C. Gradient elution was used starting at 90 % (A) with a 1 min post-injection hold, decreasing to 10 % (A) at 26 min, and returning to the starting mobile phase conditions at 28 min with a 2 min hold to re-equilibrate the column, and the total running time was 30 min for each sample. The flow rate was set to 0.3 mL min−1 with a sample injection volume of 2 µL. Heated electrospray ionization was used, with the following parameters: capillary and auxiliary gas temperature of 320 ∘C, sheath gas flow rate of 70 (arb.), and auxiliary gas flow rate of 3 (arb.). The mass spectrometer was operated in negative and positive ionization mode with a scan range of 85 to 750 and mass resolving power of 70 000 (). Tandem mass spectrometry was performed using higher-energy collision dissociation with a normalized collision energy of 65 and 115.
2.3.3 Data processing
Data were analysed by two complementary approaches. The conventional approach for LC-MS analysis entailed extracting fragments and structural information for targeted compounds using the XCalibur software 4.3. A more recent automated non-targeted approach extracts all detected chromatographic peaks from the sample dataset, removing any compounds which do not satisfy a set criterion (see below). The molecular formula is automatically assigned for each compound via a bespoke method designed in the analysis platform: Compound Discoverer version 2.1 (Thermo Fisher Scientific). Full details of the methodology can be found elsewhere (Pereira et al., 2021). Briefly, molecular formulae assignments were allowed unlimited C, H, and O atoms, up to 2 S atoms, and 5 N atoms, plus >2 Na atoms and 1 K atom in positive ionization mode. Compounds with a mass error <3 ppm, signal-to-noise ratio >3, hydrogen-to-carbon ratio of 0.5 to 3, and oxygen-to-carbon ratio of 0.05 to 2 were included in the dataset. Any compounds detected in the procedural (control sample, i.e. blank pre-conditioned filter subjected to the same extraction procedure) and solvent blanks (instrumental blanks) with the same molecular formula and a retention time difference within 0.1 min were removed from the sample data. Furthermore, any compounds detected in the chamber background filter with the same molecular formula, a retention time difference within 0.1 min, and a ratio of signal intensities between the sample data and chamber background lower than 3 were removed from the sample data. As with online FIGAERO-CIMS, since quantification for all identified compounds using standards is not possible, all compounds were normalized to the total signal to express the relative contributions, implicitly ignoring differential sensitivity in comparison between the two instruments.
The peak list for the LC-Orbitrap MS is not identical for all experiments since some peaks were not detected in all experiments. The uncertainty as to whether such peaks are truly representative of particle-phase oxidation products is captured by classifying the peaks as “common” (common to all repeat experiments) and “inconclusive” (in one specific experiment or common to two of all experiments) and then by expressing their contribution on average across the experiments with the uncertainty across each in Fig. 2. In some cases, the results from one representative experiment are used, such as in Fig. 3.
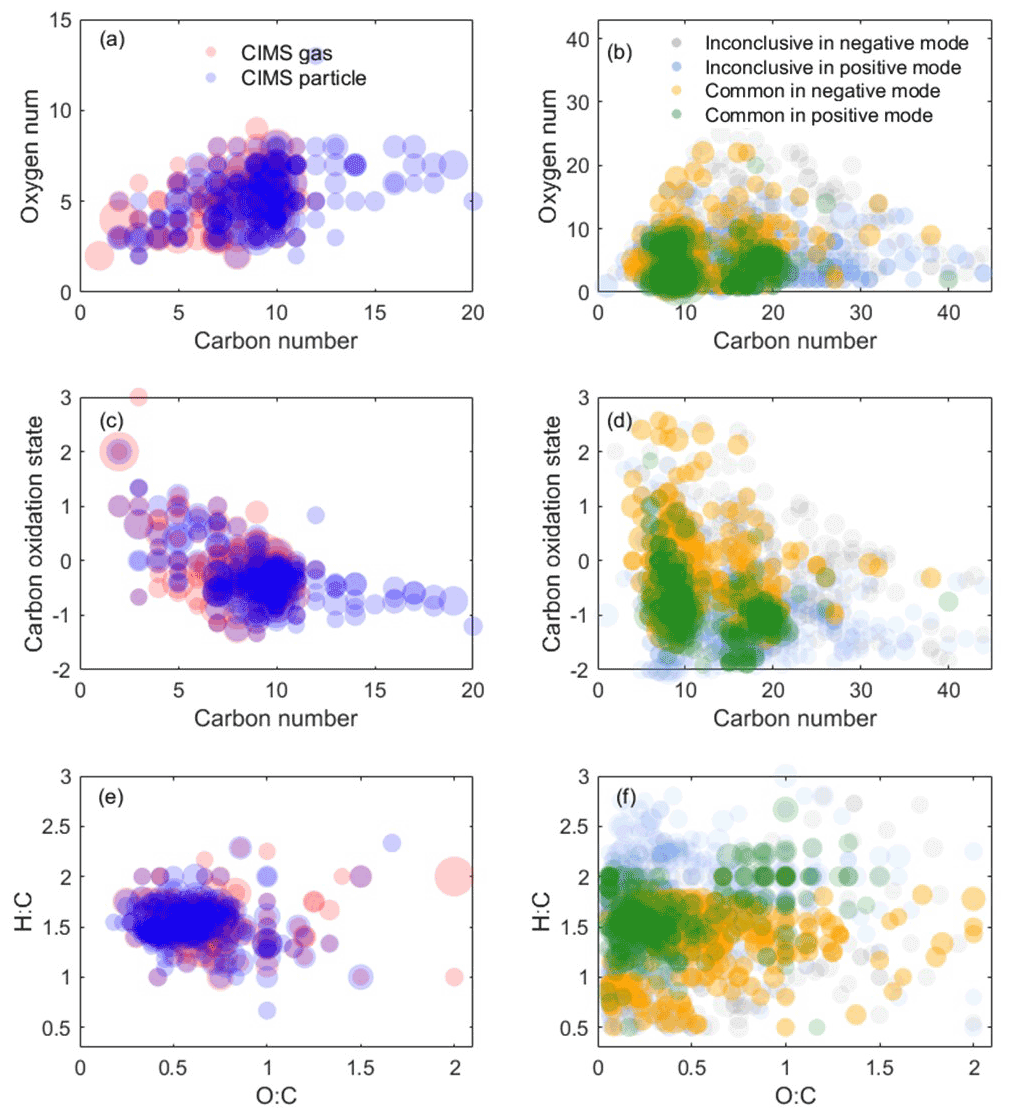
Figure 3Oxidation product distribution from the representative experiment detected by the CIMS measurement and LC-Orbitrap MS negative and positive mode. (a, c, e) The CIMS measurements. (b, d, f) LC-Orbitrap MS measurement. The symbol size is proportional to the square root of the ion's signal intensity.
2.4 Elemental grouping of identified compounds
The identified species from FIGAERO-CIMS mass spectra and from the automated method for LC-Orbitrap MS analysis described above were grouped according to their elements. Compounds containing only carbon, hydrogen, oxygen, and nitrogen were categorized as the CHON subgroup. Components containing only carbon, hydrogen, and oxygen were classed as the CHO subgroup. Similarly, compounds containing carbon, hydrogen, oxygen, and sulfur or containing carbon, hydrogen, oxygen, nitrogen, and sulfur fell into CHOS or CHONS subgroups, respectively. Compounds were additionally classed according to the numbers of carbon atoms in their molecular formulae: C2 to C7, C8 to C10, C11 to C15, ≥ C16. Given the selectivity and sensitivity of the ionization methods, not all ions were equally observed in the two instruments, and thus only the dominant contribution of identified compounds included in the CHO and CHON groups are discussed in this paper. The minor contribution of CHOS and CHONS groups is not attributed in the FIGAERO-CIMS measurement as it is difficult to identify the two species reliably within the trusted error (±6 ppm). Previous studies also unambiguously showed difficulties in the identification of isoprene-derived organosulfate compounds from CIMS measurements due to low mass resolution or thermal desorption of organosulfate compounds (D'Ambro et al., 2019; Xu et al., 2016). Compounds in the two groups may be included in the unassigned category or may misattribute their signals to CHO and CHON for the online measurement. The unassigned fractions in the FIGAERO-CIMS measurements (less than 20 % of total signal) represent the peaks that are difficult to identify, caused by either poor signal-to-noise ratios (, ∼ 40 %–50 %) or inaccessible formulae within the trusted error.
2.5 Calculation of average carbon oxidation state
The average carbon oxidation state is commonly deployed to describe the degree of oxidation within a complex oxidation reaction (Kroll et al., 2011). The elemental ratios of oxygen to carbon (O:C), hydrogen to carbon (H:C), and nitrogen to carbon (N:C) are used to calculate the . For the CHON compounds, we assume nitrogen is in the form of nitrate, with the oxidation state of N (OSN) being +5 if the oxygen number of the molecule is equal to 3 or more than 3. The nitrogen is in the form of nitrite with the OSN being +3 if the oxygen number of the molecule is less than 3. In the FIGAERO-CIMS, the for the CHOS and CHONS compounds is not considered because of the associated challenges in quantifying S-containing compounds (see above). In the LC-Orbitrap MS analysis, the total signal fractions of CHONS and CHOS groups make low contributions to the total signal, accounting for % in the common peak list in both modes and for 12.4±2.7 % and 28.5±2.5 % in the inconclusive peak list for negative mode and positive mode, respectively. It is also impossible to assess if the structure of a compound in CHONS should be assigned as nitrooxy-OSs with both -OSO3H and -ONO2 groups or as other combinations (e.g. -NO2 and -SO3H, -NO2 and -OSO3H). Given the two considerations, the calculation of for the CHOS and CHONS compounds is simplified to the equation of here. The uncertainty of this assumption in the calculated for CHOS and CHONS species is further discussed in the Supplement. The modification of the is shown in Eq. (3):
where OSN=0 if nN=0. This is for CHO compounds and CHOS and CHONS compounds for LC-Orbitrap MS analysis; OS if nO<3; OS if nO≥3.
2.6 Estimation of component properties
Data from both techniques can be used to investigate the gas-to-particle partitioning behaviour of the targeted compounds in the α-pinene precursor system. Saturation concentration (), the concentration at which 50 % of a component, i, is in the vapour phase and 50 % is condensed, can be estimated based on the partitioning method from particle-phase fractions (Fp) from FIGAERO-CIMS. Although homologous series of polyethylene glycol (PEG; (n-OH) for n=3 to n=8) were performed to calibrate the vapour pressures in the FIGAERO-CIMS, useful polyethylene glycol (PEG; (n-OH) for n=3 to n=8) calibrations are not accessible for interpretation of this dataset (see Voliotis et al., 2021, for a full discussion). The thermogram method for the online measurements is therefore not accessible to this study and the partitioning method is applied here. Additionally, the saturation concentration of a component i, (), was estimated based on the structural information independently obtained from LC-Orbitrap MS.
2.6.1 Partitioning method
Fp is calculated for a given species i by Eq. (4) from P and G; the total signals are corrected by the sampling volume in the particle and gas phase, respectively. Some instrumental factors can affect the gas-to-particle partitioning process and thus affect the Fp and C* calculated in this way, such as the deposited mass of the component on the filter (Thornton et al., 2020), gas–particle phase equilibrium on the filter, reactions on the surface or in the bulk, or diffusion of the gas- to particle-phase surface or the bulk (Mai et al., 2015; Huang et al., 2018; Yli-Juuti et al., 2017).
C* can be estimated by applying partitioning theory using the equation
where OA is the suspended particle concentration in the chamber, which is calculated based on AMS measurement (µg m−3).
2.6.2 Molecular structural method
The structure of targeted compounds is identified using the LC-Orbitrap MS, after which vapour pressure is estimated using the EVAPORATION method (Compernolle et al., 2011) in the UManSysProp tool developed by Topping et al. (2016). The EVAPORATION method has been assessed as more accurate than other vapour pressure estimation methods for vapour pressure of individual organic compounds (O'Meara et al., 2014), though significant uncertainties persist, particularly for multifunctional compounds. The C* is calculated using Eq. (4) modified by Donahue et al. (2006) based on the earlier absorptive partitioning theory (Pankow, 1994). Errors in the estimation of C* attributable to the uncertainties of vapour pressure estimation are extensively discussed in the literature (Barley and Mcfiggans, 2010; Bilde et al., 2015) and are not further discussed here. Additional uncertainties related to the activity coefficient in mixtures of components are implicit in the derivation of C* from CIMS and explicitly assumed as unity for the LC-Orbitrap MS:
where Mi is the molecular weight of species i (g mol−1), is the saturation vapour pressure of pure compound i at temperature T (Pa; here T is 298.15 K), and R is the gas constant (8.314 m3 Pa K−1 mol−1).
We used the data processing method described in Sect. 2.2 and 2.3 to generate the full formula list from FIGAERO-CIMS and LC-Orbitrap MS measurements, respectively. Assigned chromatographic and/or mass spectral peaks are used to explore the molecular formulae and broad chemical groupings in the α-pinene photooxidation system. Common capabilities of the two techniques will be illustrated in Sect. 3.1. Additional capabilities of each technique and the strength of their combination are shown in Sect. 3.2, 3.3 and 3.4, respectively.
3.1 Overview of SOA elemental composition
Offline filters characterized by LC-Orbitrap MS are shown in Fig. 2 from negative and positive ionization mode alongside the last cycle of gas- and particle-phase measurements (5.5 h after lights on) by the CIMS. In the LC-Orbitrap MS, the common compounds in all experiments account for % in the negative mode and % in the positive mode, as shown in Fig. 2.
General observations can be drawn from the CIMS analysis, including the fact that (i) there are smaller molecules and fewer larger ones in the gas phase, (ii) compounds in the CHO group dominate the particle phase, and (iii) compounds with between 8 and 10 carbon atoms dominate both gas and particle phases.
From the CIMS particle-phase and the LC-Orbitrap MS common compound data, the results show that (i) the majority of particle-phase signals come from the compounds with 8 to 10 carbon atoms in the CHO group; (ii) a small proportion (4±0.8 %) of high-carbon-number compounds (C11–C20) is observed in the particle phase; (iii) the CHO group is shown to account for around 76±2.7 % of the total contribution in the CIMS particle-phase signal and % of the total contribution in the LC-Orbitrap MS negative mode; (iv) the CIMS particle-phase fractional signal contribution shows high similarity for the C8–C10 and C11–C15 range to the LC-Orbitrap MS negative mode; (v) LC-Orbitrap MS negative and positive mode measure a higher fractional signal from compounds with carbon number greater than 16 than the CIMS particle phase, most likely as a result of the higher mass resolution; and (vi) in contrast, more small molecules with low carbon numbers (C2–C7) are observed from the CIMS particle-phase measurement, which may be due to the thermal decomposition of low-volatility molecules into smaller fragments (Lopez-Hilfiker et al., 2015; Isaacman-Vanwertz et al., 2016; Thornton et al., 2020). The fractional particle-phase contributions to the CHO and CHON groupings were comparable between the techniques, though a higher fraction of larger molecules was particularly observed in the CHON fraction in the LC-MS negative-mode measurement.
From the LC-Orbitrap MS common compounds alone, the results suggest that the positive ionization mode shows that the CHO and CHON groups contribute to around 48±7 % of total sample abundance. A large fraction ( %) of compounds in the CHON group was observed to contain a high carbon number (≥ C16), showing more formulae with high molecular weight in the positive mode. Signals in the CHO group in both the positive and negative modes are dominated by the C8−10 ions.
The inconclusive compounds in all experiments from the LC-Orbitrap MS are distributed in the four groups (grey bar in Fig. 2a), accounting for 26.1±6.6 % and 40.6±6.1 % in both modes. As shown in Fig. 2b, 56±4.8 % of the inconclusive compounds have a high carbon number (≥ C16) in the negative mode, and the compounds with nC= 8–10 and nC≥ C16 make up large fractions in the positive mode, accounting for % and 33±3.4 % of the total inconclusive compounds, respectively. The results suggest that the largest fractions of compounds with high carbon numbers are found in the inconclusive compounds, although the existence of those compounds may result from some uncertain factors, such as control of experimental conditions, instrumental errors and operational differences, or data processing. Irrespective of the consideration of the inconclusive compounds, a higher fraction of the signal is found in compounds with high carbon numbers in the LC-Orbitrap MS measurements than in the CIMS particle measurements.
Measurements of the oxidation products from both techniques in one representative experiment can be represented in terms of three different chemical spaces as shown in Fig. 3. Figure 3a shows that more compounds with higher carbon numbers (>10) are observed in the CIMS particle phase compared to the gas phase. In the particle phase, Fig. 3a and b show that the results from LC-Orbitrap MS in both ionization modes show more molecules with higher carbon numbers (C ≥16) and higher-oxygen-number molecules (O ≥15) than the results from CIMS particle measurement, though some of them are from inconclusive compounds. More compounds with lower carbon numbers (<5) are mostly detected by the CIMS particle measurements, likely owing to high molecules thermally desorbing into small molecules in the online particle-phase measurements or the inability to measure high-volatility compounds using LC-Orbitrap MS.
To explore the chemical properties of those compounds and avoid overlapped formulae with the same carbon number and oxygen number but different hydrogen number, such as C10HxO4, carbon number vs. and O:C vs. H:C are shown in Fig. 3c–f. Figure 3c and d display some molecules with a low carbon number (nC<5) and high () as detected by the CIMS, while molecules with and and molecules with a high carbon number (nC>20) are only measured by the LC-MS techniques, although some of them are inconclusive compounds. Figure 3e and f show that the results from the two instruments are dominated by formulae with and , which are in the centre of the diagram with high density. The majority of compounds in the bottom left of the diagram with a low H:C ratio (<1) and O:C ratio (<0.3) are compounds in the S-containing subgroups, which are only identified by LC-Orbitrap MS. Some highly oxidized (O:C >1) compounds are detected by both techniques.
The results suggest that challenges remain in the identification of SOA products using only one technique owing to different capabilities and preferences of instruments. For example, the electrospray ionization used in the LC-Orbitrap MS has different ionization efficiencies and sensitivity to molecules; i.e. it is more sensitive to carbonyl species in the positive mode and carboxylic acid or other polar species in the negative mode (Mehra et al., 2020). The iodide-adduct ToF-CIMS is more sensitive to polar molecules, and sensitivity increases with the addition of a polar functional group in the order of keto-, hydroxy, and acid groups (Lee et al., 2014). Thus, the benefits of using combined analytical techniques enable different insights into components found in SOA particles.
3.2 Temporal change in elemental composition
The evolution of gas- and particle-phase oxidation products grouped according to their elemental formulae and carbon numbers is shown in Fig. 4. Figure 4a shows that the gas-phase products are initially dominated by CHON species at the beginning, with a decreasing trend in relative contribution over time. In Fig. 4b, CHO species are shown to dominate in the particle phase, increasing over time in relative contribution and plateauing 2.5 h into the experiment. The ratio increases to a maximum value after 1 h and then decreases (Fig. S2a in the Supplement), suggesting the CHON species are mostly generated at the beginning with high NO conditions. In the gas phase, the C8−10 ions dominate the CHO and CHON groups. The fraction of C8−10 ions in the CHO group increases over time, whereas the fraction of C8−10 ions in the CHO group decreases with time. For the particulate oxidation products (Fig. 4b), there is a rapid increase to a constant maximum C8−10 CHO signal (∼42 %) and a smaller and slightly reducing C8−10 CHON (∼15 %) over time. There is a significant early increasing signal contribution from compounds with carbon numbers greater than 15 in the CHO group. The slight increasing fraction of high-carbon-number compounds (C≥16) is investigated in the particle phase over time. It is not possible to confirm whether compounds with high carbon numbers are generated from either gas-phase chemistry reactions or particle-phase reactions in this study.
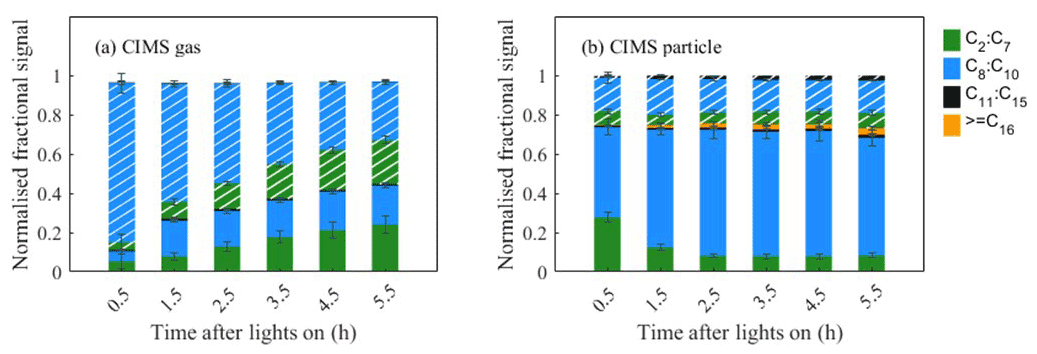
Figure 4Evolution of chemical compounds in the gas phase and particle phase. Unhatched bars are the CHO group species; hatched bars are the CHON group species. (a) CIMS gas phase; (b) CIMS particle phase. Standard deviations (n=2) are indicated by error bars.
3.3 Clustering of the oxidation products from FIGAERO-CIMS
The application of HCA to cluster the top 100 CIMS gas-phase and CIMS particle-phase oxidation products (accounting for more than 96 % of the total assigned peak signals) is shown in Figs. 5 and 6, respectively. Since the data are normalized to the highest intensity of each ion, the results are not sensitive to the intensity of raw ion signals. A dendrogram tree is applied to isolate the clusters. The number of clusters is determined according to whether it already adequately describes the temporal variation and the degree of similarity between clusters. Here, five clusters are chosen for the gas phase and six clusters are chosen for the particle phase according to these criteria. Figures 5a and 6a display the average time series of each cluster calculated by averaging the signals of all ions in every measurement. The time series of ions in each cluster in the gas and particle phase are shown in Figs. S4 and S5, respectively, and formulae information in each cluster is provided in Tables S2 and S3 in the Supplement, respectively. It can be seen that the ions with similar time series trend are mostly clustered together. The matrix showing the relative Euclidean distance between each cluster pair is provided in Figs. 5b and 6b, showing a clear distinction between the clusters, with low similarity and high confidence in the quality of the clusters.
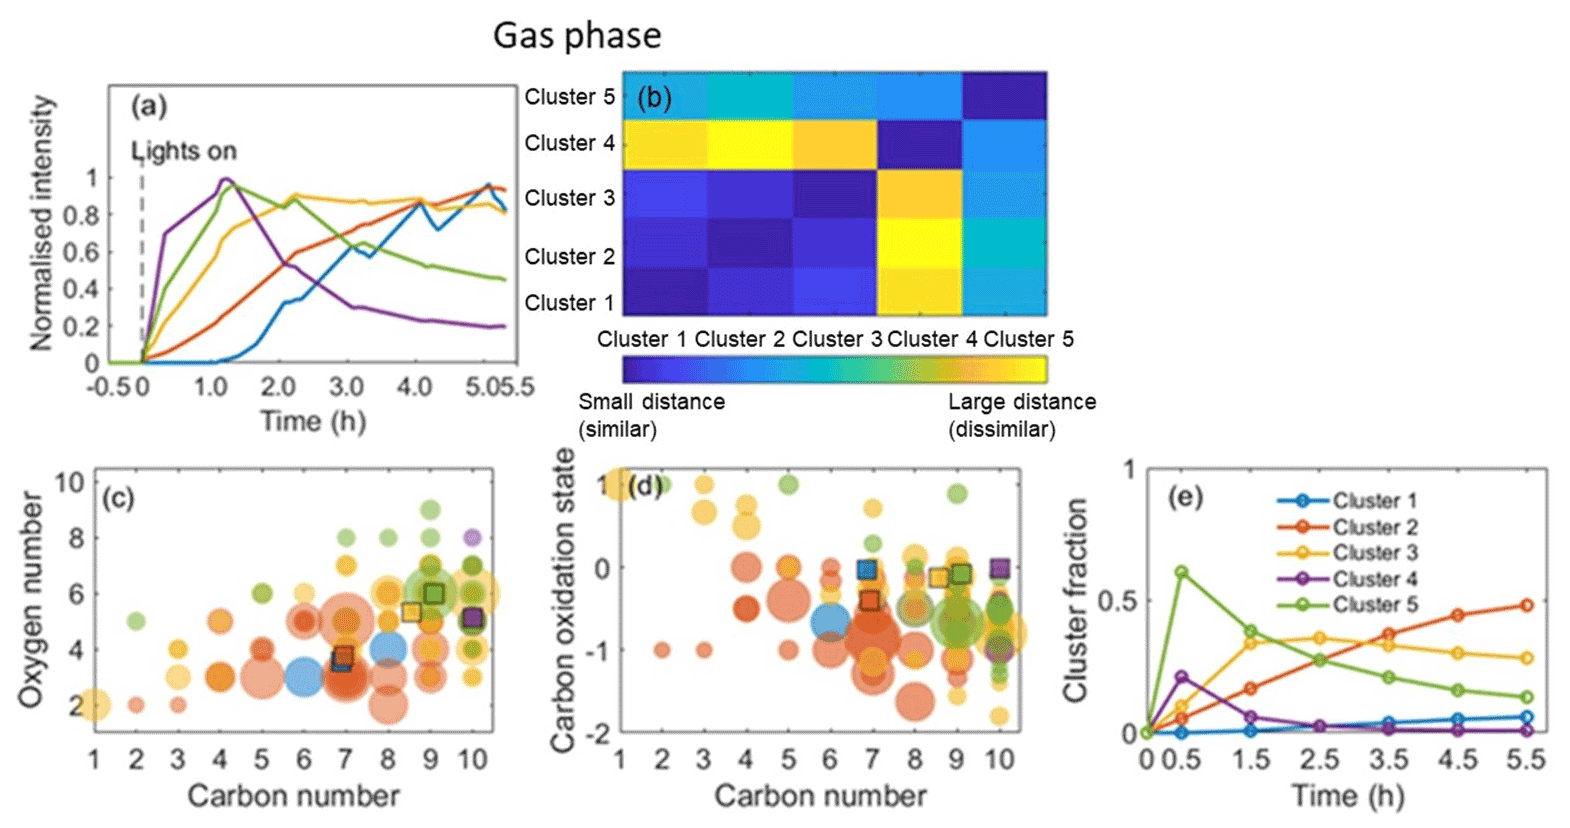
Figure 5Hierarchical clustering of gas-phase oxidation products from the representative α-pinene system. (a) Time series of each cluster normalized to the highest ion intensity between 0 and 1. (b) Matrix showing the relative distance between clusters. (c) Carbon number vs. oxygen number for each cluster. (d) Carbon number vs. oxidation state for each cluster. (e) Time series of the sum of ions' normalized signal fractions to the total signal in each cluster. Note that the square symbols represent the contribution of weighted-average carbon numbers, oxygen numbers, and/or in each cluster. The colours correspond to the ones in panel (a).
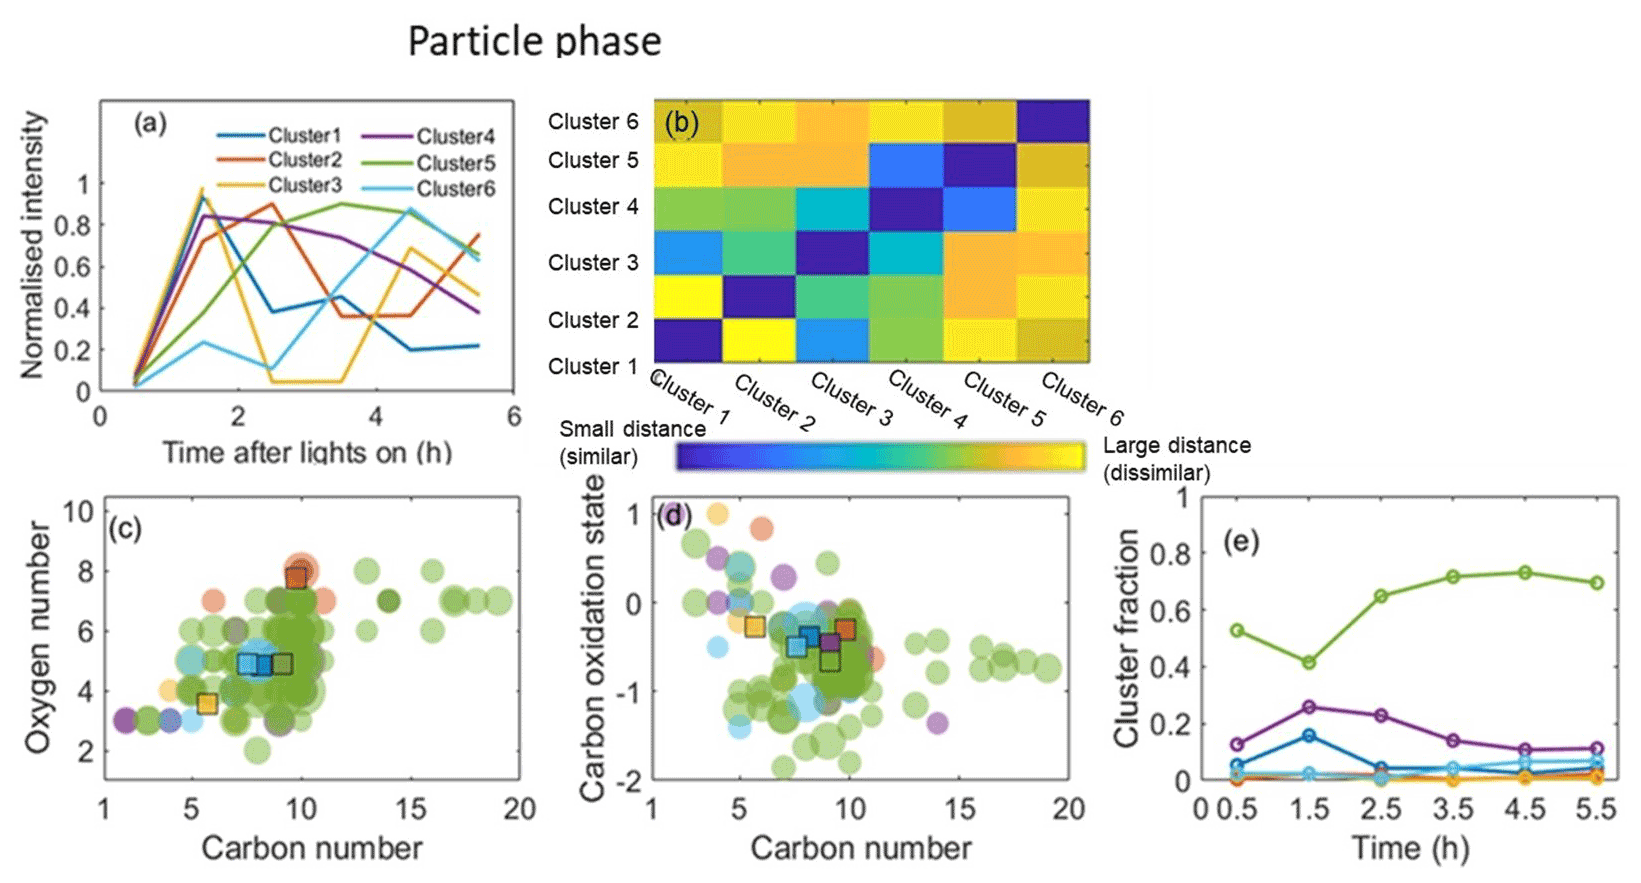
Figure 6Hierarchical clustering of particle-phase oxidation products for the representative α-pinene system. (a) Average time series of each cluster normalized to the highest ion intensity between 0 and 1. (b) Matrix showing the relative distance between clusters. (c) Carbon number vs. oxygen number for each cluster. (d) Carbon number vs. oxidation state for each cluster. (e) Time series of the sum of ions' normalized signal fractions to the total signal in each cluster. Note that the square symbols represent the contribution of weighted-average carbon numbers, oxygen numbers, and/or in each cluster. The colours correspond to the ones in panel (a).
In the gas-phase HCA, cluster 5 with the highest cluster contribution peaks at the beginning of the experiments (around 1 h) before reaching a sharp maximum followed by a more gradual decrease until the end of the experiment. The majority of the ions in this cluster are nitrogen-containing. Cluster 4 (containing C10H15NO5 and C10H15NO8) and cluster 5 display rates similar to their peak values but different rates of decrease after 1 h. The temporal profiles of clusters 5 and 4 show similar temporal profiles as the ratio in Fig. S2a. This suggests that these early-generation products are likely formed from the reaction of the OH- or O3-initiated peroxy radical with NO rather than with RO2 or HO2 (Eddingsaas et al., 2012a). As shown in Fig. 5c and d, clusters 4 and 5 have higher weighted-average oxygen numbers, weighted-average carbon numbers, and carbon oxidation states than other clusters. The high number of oxygen atoms indicates that these species may have formed via isomerization of the peroxy radical or secondary OH or O3 chemistry.
Cluster 3 is the second to peak and is dominated by the CHO species, suggesting significant termination by RO2 with HO2 or RO2 at this stage. The lower nC and nO might be caused by C–C bond scission during secondary photooxidation reactions over time (e.g. C9H14O5, C8H12O5), while the higher in cluster 3 is likely caused by the dominant non-nitrogen-containing compounds (or by fragmentation, leading to a lower carbon number whilst retaining oxygen). Cluster 2 is the third cluster to peak and increase over time, consistent with a later generation of products (Eddingsaas et al., 2012b). The weighted-average nC, nO, and values exhibit the lowest nC and nO, as shown in Fig. 5c and d. Some carbon–hydrogen species (CHO) appear in this cluster, as shown in Table S2, likely produced from the reactions of RO2 with HO2 or RO2. Some nitrogen-containing ions (CHON) with nC≤8 are in this cluster, suggesting they have undergone a higher degree of fragmentation. Cluster 1 shows the slowest formation rate and lowest cluster contribution, suggesting they are likely later-generation products.
Particle-phase HCA results are shown in Fig. 6, and the formulae in each cluster are listed in Table S3. Cluster 5 exhibits the highest contribution to the total identified peak signals. It shows a continuous increase and slight decrease at the end of experiments, suggesting its constituent ions continuously increase in concentration in the particle phase. The majority of ions in cluster 5 are non-nitrogen-containing with 7 or 10 carbon atoms, which may partition from the gas phase directly (Zhang et al., 2015). Several dimers (e.g. ion C19H28O7, ion C18H26O7, ion C17H26O7) contribute to cluster 5, which is expected from further accretion reactions (Kristensen et al., 2014; Zhang et al., 2015). The similar temporal profiles between cluster 5 and SOA mass (Fig. S2b) indicate cluster 5 contains the most species with SOA mass. Cluster 4 has the second-highest contribution to the total identified peak signals. The majority of the ions in this cluster are C9−10, suggesting that less C–C bond cleavage happened in this cluster. The remaining clusters (clusters 1–3 and 4) show sufficiently different temporal profiles to warrant distinct clusters, but each contains few ions and their cluster contributions to the total signals of identified peaks are lower than 5 %.
Many of the top 100 gas-phase oxidation products are also found in the top 100 particle-phase ions. Some ions in the same gas-phase HCA cluster may be distributed into different clusters in the particle phase. For example, ions C10H16O3 and C10H16O4 in the gas-phase cluster 5 are in the particle-phase clusters 2 and 3, respectively. Different clustering between gas and particle phases indicates that the particle component time series trend does not unambiguously relate to the time trend of the corresponding gas-phase ion. Additionally, some ions with high carbon numbers (nC≥16, e.g. ion C19H28O7, ion C18H26O7, ion C17H26O7) in the particle phase are not included in the top 100 gas-phase ions.
Whilst a common peak list is used for CIMS data, the HCA is conducted for individual experiments. It is not straightforward to express the uncertainty of experimental variability in the clustering analysis, and therefore a single experiment is presented here. More than 85 ions are the same in the top 100 for the repeat experiment in both gas and particle phases, accounting for 92 %–99 % of the top 100 ions. Gas- and particle-phase HCA results for the repeat experiment are provided in Figs. S6–S9 and Tables S4–S5. The generated cluster name from the MATLAB code differs between experiments (e.g. gas-phase cluster 4 in the representative experiment corresponding to cluster 3 in the repeat experiment), even though their time series trends and chemical properties are highly similar. In order to easily compare the two experiments, the time series trends and cluster fractions in the representative experiment were considered the benchmark to adjust the cluster name in the repeat experiment for the gas and particle phase, respectively. The cluster fraction was taken as the particle-phase HCA reference since only six values (peak areas from six particle-phase desorptions) were used to do the particle-phase HCA, and the particle-phase temporal profiles will therefore exhibit greater uncertainties than those in the gas phase owing to their lower temporal resolution.
Comparing Figs. S6 to 5, it can be seen in the gas phase that cluster 3 in the repeat experiment contains fewer ions than that in the representative experiment, while cluster 1 in the repeat experiment contains more ions. Figure S6c and d show different average nC (9.23 vs. 8.55) but comparable nO (5.54 vs. 5.31) and (−0.12 vs. −0.13) in cluster 3 and different average nC (6.87 vs. 7.18) but comparable nO (3.57 vs. 3.34) and (−0.03 vs. −0.1) in cluster 1 for the repeat and representative experiments, respectively. In the particle phase (see in Fig. S8), the chemical characteristics (, , and ) are comparable for clusters with the highest and second-highest contributions between the two experiments, while the time series profiles for the second-highest contribution clusters are slightly different, decreasing after 1 h and after 2.5 h, respectively. The different clustering results for some ions with low normalized signal contributions between the two experiments may indicate that those ions are likely sensitive to the experimental conditions (e.g. injected α-pinene concentration or seed concentrations), leading to different time series trends in different experiments. The results suggest that the HCA is a powerful approach to separate ion time series behaviour. The chemical characteristics for clusters between the two experiments are comparable, although some individual ions differ in the time series trend between the two experiments, resulting in different numbers of compounds in clusters. The differences do not affect the conclusions from the representative experiment due to the low contribution of those ions.
3.4 Major contributing ions and their properties
3.4.1 Isomeric contributions and evolution in gas and particle phase
The representative oxidation products with relatively high contributions (normalized fractional signal >0.5 %) from the above HCA particle-phase results were selected to investigate their isomeric contributions, evolution, and saturation concentrations in order to elucidate the mechanisms of their potential partitioning to the particle phase during SOA formation from α-pinene photochemistry.
A specific capability of the LC-Orbitrap MS is the ability to separate isomers and quantify their contributions, which is not possible with the current CIMS technique. Figure 7a shows all molecular formulae with a relative contribution more than 1 %, demonstrating the separation of isomers with different retention times by LC-Orbitrap MS. Commonly, one isomer dominates the relative contribution at a particular mass, most likely due to the limited formation routes when a single VOC is oxidized. For example, the contribution of formula C9H14O4 at RT=5.977 min is much higher than the isomer at RT=13.126 min (21.6 % vs. 0.5 %). In the α-pinene system, the dominant contribution of only one isomer in one in offline measurement can support the FIGAERO-CIMS molecular assignment, although the isomers cannot be separated by the FIGAERO-CIMS.
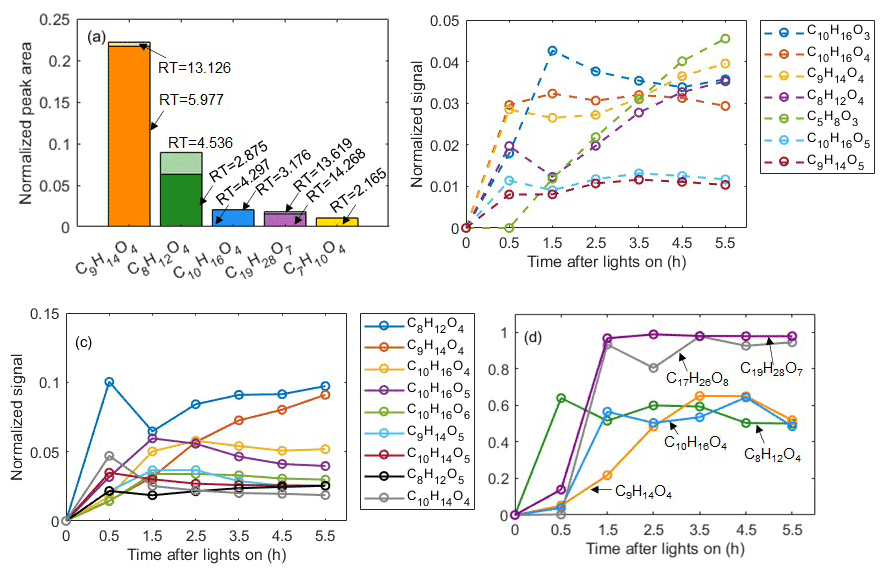
Figure 7(a) Isomeric fractions of ions from LC-Orbitrap MS analysis. (b) Time series of compounds in the gas phase from CIMS gas-phase measurements. (c) Time series of compounds in the particle phase from CIMS particle-phase measurements. (d) Temporal profiles of particle fractions for a few identified organic molecules generated from α-pinene photooxidation reactions.
The FIGAERO-CIMS can semi-simultaneously quantify the evolution of the molecular composition of compounds in the vapour and condensed phase as shown in Fig. 7b and c, allowing investigation of gas-to-particle conversion processes. The partitioning behaviour of these compounds was explored by investigating their time series of particle fractions, Fp, as shown in Figs. 7d and S10. Distinct temporal profiles were observed in each case. For example, Fp increases to maximum stable values for C9H14O4 after 3.5 h following initiation of photochemistry and for C19H28O7 and C17H26O8 after 1.5 h, but with C8H12O4 reducing after a rise in the initial 1.5 h of photochemistry. As expected, the two compounds in the “dimer” range (C19H28O7 and C17H26O8) have higher particle-phase fractions (almost 1) than those of the “monomer” range oxidation products (C8H12O4 and C9H14O4) as shown in Fig. 7.
3.4.2 Saturation concentrations
The final Fp values from the online measurements were used to calculate the C* as shown in Table 2. The LC-Orbitrap MS chromatography and mass spectrum of compounds are shown in Fig. S11. The structural information and estimated based on the LC-Orbitrap MS data are also displayed in Table 2.
Table 2Molecular information ordered by carbon number and estimated C* of compounds obtained from the partitioning theory method and structural information method. The uncertainty of the LogC* from the partitioning theory method was from the uncertainty of measured Fp and was propagated 1 standard deviation.
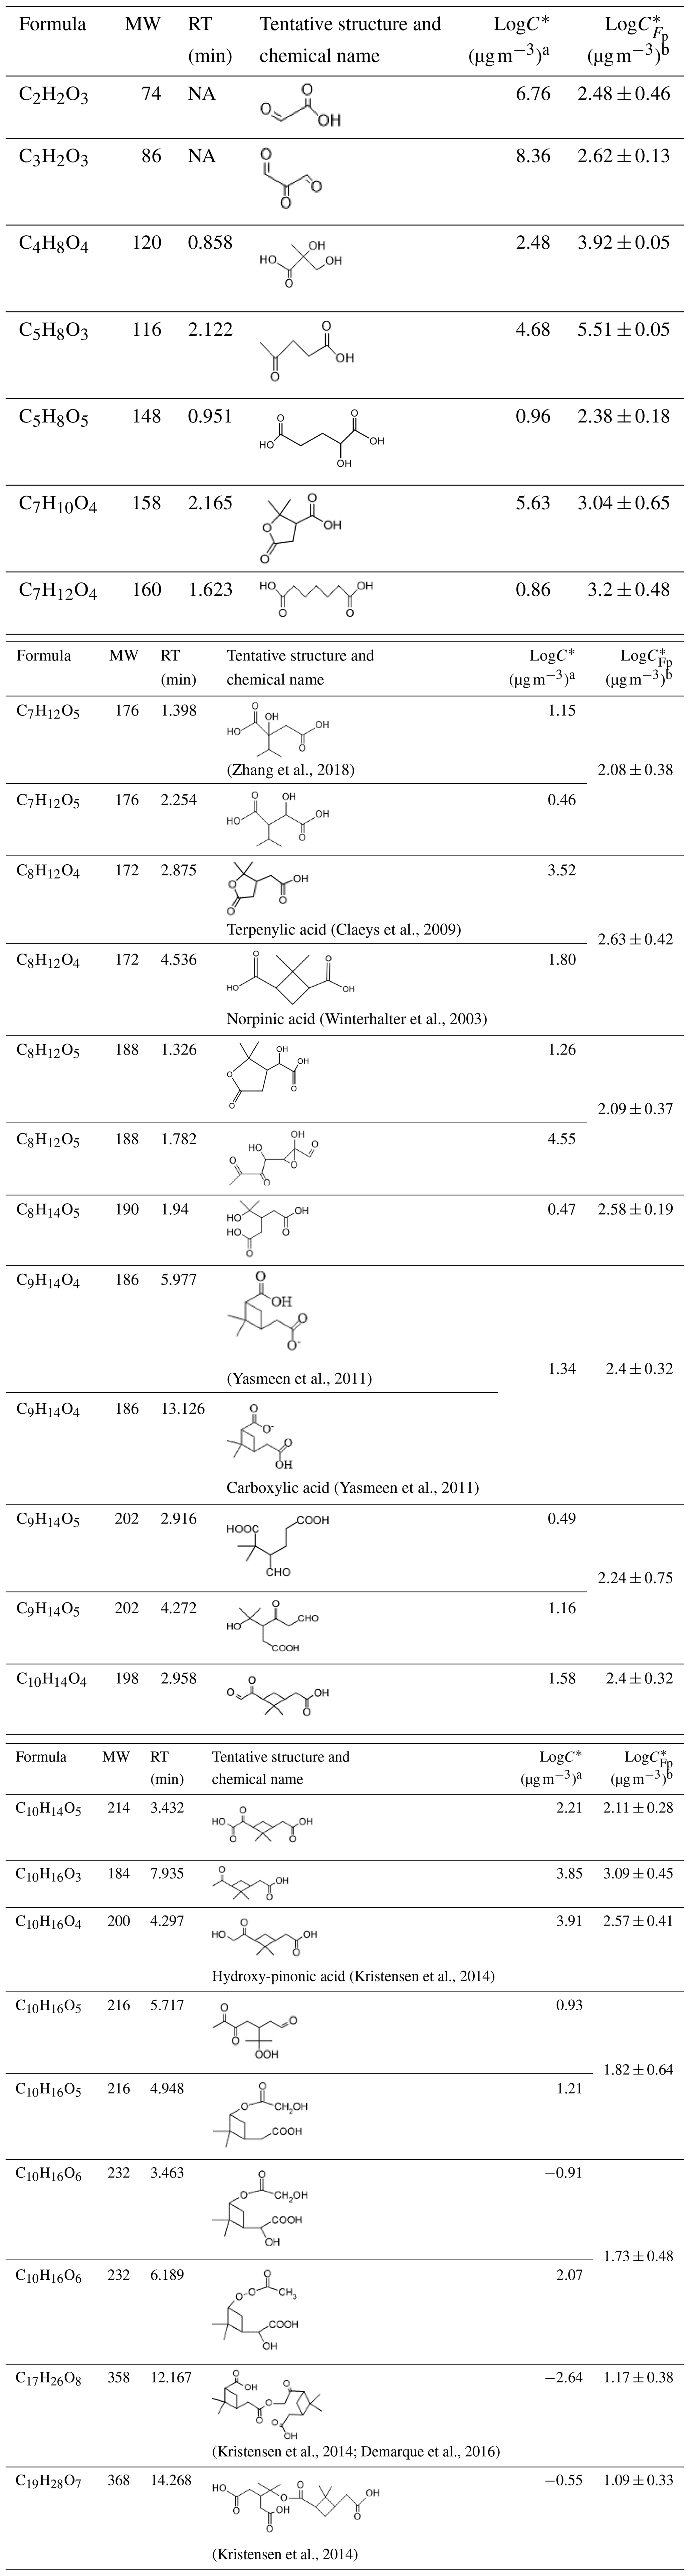
Note: a LogC* estimated from the approach based on molecular structural information. b LogC* estimated from the partitioning theory approach. NA: not available.
The C* calculated from the FIGAERO-CIMS measured Fp was generally within around 2 orders of magnitude of that estimated from the LC-Orbitrap MS-derived molecular structure for most compounds and sometimes much closer. Such agreement could be used to assign classification into the somewhat broad and arbitrarily defined volatility categories (such as semi-volatile, low volatility, intermediate volatility), but such utility is questionable. Moreover, clear discrepancies were noticed for the lowest- and highest-volatility compounds, as shown in Table 2. It appears that the structural assignment of C2H2O3 and C3H2O3 using the Master Chemical Mechanism (MCM) provides unreasonable estimates of high volatility such that such components could not reasonably be expected to be found in the particle phase. The ions detected at this in the FIGAERO-CIMS are likely from desorption fragments of larger ions as their desorption Tmax values are around 83 and 105 ∘C for C2H2O3 and C3H2O3, respectively. In any case, the physical meaning of their existence in the particle sample is questionable. It is possible that the accurate determination of the Fp for compounds with a large number of carbon atoms (C17H26O8 and C19H28O7) is limited by the detection limit and signal-to-noise ratio in the gas-phase measurements (Stark et al., 2017; Lopez-Hilfiker et al., 2016b). In addition to the difficulties in measuring partitioning behaviour, challenges remain in its prediction from molecular structure owing to the acknowledged problems with vapour pressure (and hence C*) estimation, particularly for multifunctional compounds.
Although the C* estimation from the two instruments provides valuable cross-confirmation for C* of the targeted compounds, the results suggest that accurate measurement for C* of compounds remains challenging. The differences in the estimation C* of a compound between the two instruments may be attributable to the different estimation methods. The structural-information-based method relies on knowledge of the input of the molecular structure to the vapour pressure estimation model, while the partitioning method is dependent on accurate experimental measurements in the gas-to-particle partitioning process. For the partitioning approach, the measured particle fraction is likely biased owing to the thermal desorption of larger ions from the filter (Lopez-Hilfiker et al., 2015), or the gas-phase signals of compounds can be over-measured owing to the signal-to-noise limitations (Stark et al., 2017; Lopez-Hilfiker et al., 2016b). The current gaps between the two methods require much work to further investigate the C* of compounds in aerosol particles.
The characterization of SOA chemical composition in the gas and particle phases is an important but complex process potentially containing thousands of oxidation products. This study demonstrates the capabilities of the combination of FIGAERO-CIMS and LC-Orbitrap MS in the investigation of SOA chemical compositions and their properties in α-pinene photooxidation reactions.
The distribution of particle-phase products is broadly similar between the FIGAERO-CIMS and LC-Orbitrap MS negative ionization mode for the α-pinene SOA products. The LC-Orbitrap MS positive ionization mode provides additional information, with more detected molecular formulae with higher carbon and oxygen numbers. Different insights into components in SOA particles can be gained from the combination of the two techniques.
The gas and particle time series data from the FIGAERO-CIMS measurement time series were separated by hierarchical clustering analysis (HCA), an approach that does not rely on mass calibration. HCA was able to derive cluster properties in terms of average carbon number, oxygen number, and oxidation states, for example, enabling interpretation in terms of possible termination pathways of peroxy radicals in α-pinene photooxidation reactions.
There is substantial uncertainty in the accurate estimation of the saturation concentration of compounds. C* estimation from the partitioning method using FIGAERO-CIMS measurements and the molecular-structure-based method from LC-Orbitrap MS enables comparison of the volatility of the targeted compounds. The differences resulting from the two approaches indicates that further work is required to investigate whether the C* determined for the compounds is consistent with our understanding of the processes determining the time evolution of phase partitioning.
The selectivity and instrumental sensitivity make it impossible to use one instrument to capture all oxidation products; thus, the combination of instruments in order to better explore the evolution of SOA chemical composition is strongly recommended. Additionally, future work will report SOA oxidation products and their chemical properties from more complex systems utilizing the analytical approaches from the two instruments, such as the chamber photooxidation of anthropogenic VOCs or biogenic and anthropogenic mixtures of VOCs (Voliotis et al., 2022). As this study only assessed a single α-pinene photooxidation system, more work is needed to evaluate how those analytical methods from the two instruments perform with other systems.
The observational dataset of this study is available upon request from corresponding authors.
The supplement related to this article is available online at: https://doi.org/10.5194/amt-15-4385-2022-supplement.
GM, MRA, MD, AV, YW, and YS conceived the study. MD, AV, YW, and YS conducted the experiments. TJB provided on-site help deploying the FIGAERO-CIMS. KLP and JFH offered help with the LC-Orbitrap MS analysis. MD conducted the data analysis and wrote the paper with inputs from all co-authors.
The contact author has declared that none of the authors has any competing interests.
Publisher's note: Copernicus Publications remains neutral with regard to jurisdictional claims in published maps and institutional affiliations.
We acknowledge support from the NERC Atmospheric Measurement and Observational Facility (AMOF) in providing the SMPS instrument. The financial support received by Mao Du in the form of a President Doctoral Scholarship award (PDS award) by the University of Manchester is gratefully acknowledged. M. Rami Alfarra acknowledges support from the UK National Centre for Atmospheric Sciences (NACS).
This research has been supported by the Natural Environment Research Council (NERC; grant no. NE/S010467/1). The Manchester Aerosol Chamber received funding from the European Union's Horizon 2020 research and innovation programme under grant agreement no. 730997, which supports the EUROCHAMP2020 research programme. Support with instrumentation was funded through the NERC Atmospheric Measurement and Observational Facility (AMOF). The Orbitrap MS was funded by a capital grant from NERC (grant no. CC090).
This paper was edited by Albert Presto and reviewed by two anonymous referees.
Alfarra, M. R., Hamilton, J. F., Wyche, K. P., Good, N., Ward, M. W., Carr, T., Barley, M. H., Monks, P. S., Jenkin, M. E., Lewis, A. C., and McFiggans, G. B.: The effect of photochemical ageing and initial precursor concentration on the composition and hygroscopic properties of β-caryophyllene secondary organic aerosol, Atmos. Chem. Phys., 12, 6417–6436, https://doi.org/10.5194/acp-12-6417-2012, 2012.
Banerjee, S. and Mazumdar, S.: Electrospray ionization mass spectrometry: a technique to access the information beyond the molecular weight of the analyte, Int. J. Anal. Chem., 2012, 282574, https://doi.org/10.1155/2012/282574, 2012.
Bannan, T. J., Le Breton, M., Priestley, M., Worrall, S. D., Bacak, A., Marsden, N. A., Mehra, A., Hammes, J., Hallquist, M., Alfarra, M. R., Krieger, U. K., Reid, J. P., Jayne, J., Robinson, W., McFiggans, G., Coe, H., Percival, C. J., and Topping, D.: A method for extracting calibrated volatility information from the FIGAERO-HR-ToF-CIMS and its experimental application, Atmos. Meas. Tech., 12, 1429–1439, https://doi.org/10.5194/amt-12-1429-2019, 2019.
Bar-Joseph, Z., Gifford, D. K., and Jaakkola, T. S.: Fast optimal leaf ordering for hierarchical clustering, Bioinformatics, 17(suppl_1), S22–S29, https://doi.org/10.1093/bioinformatics/17.suppl_1.S22, 2001.
Barley, M. H. and McFiggans, G.: The critical assessment of vapour pressure estimation methods for use in modelling the formation of atmospheric organic aerosol, Atmos. Chem. Phys., 10, 749–767, https://doi.org/10.5194/acp-10-749-2010, 2010.
Bateman, A. P., Nizkorodov, S. A., Laskin, J., and Laskin, A.: High-resolution electrospray ionization mass spectrometry analysis of water-soluble organic aerosols collected with a particle into liquid sampler, Anal. Chem., 82, 8010–8016, https://doi.org/10.1021/ac1014386, 2010.
Bilde, M., Barsanti, K., Booth, M., Cappa, C. D., Donahue, N. M., Emanuelsson, E. U., McFiggans, G., Krieger, U. K., Marcolli, C., Topping, D., Ziemann, P., Barley, M., Clegg, S., Dennis-Smither, B., Hallquist, M., Hallquist, A. M., Khlystov, A., Kulmala, M., Mogensen, D., Percival, C. J., Pope, F., Reid, J. P., Ribeiro da Silva, M. A., Rosenoern, T., Salo, K., Soonsin, V. P., Yli-Juuti, T., Prisle, N. L., Pagels, J., Rarey, J., Zardini, A. A., and Riipinen, I.: Saturation vapor pressures and transition enthalpies of low-volatility organic molecules of atmospheric relevance: from dicarboxylic acids to complex mixtures, Chem. Rev., 115, 4115–4156, https://doi.org/10.1021/cr5005502, 2015.
Bryant, D. J., Dixon, W. J., Hopkins, J. R., Dunmore, R. E., Pereira, K. L., Shaw, M., Squires, F. A., Bannan, T. J., Mehra, A., Worrall, S. D., Bacak, A., Coe, H., Percival, C. J., Whalley, L. K., Heard, D. E., Slater, E. J., Ouyang, B., Cui, T., Surratt, J. D., Liu, D., Shi, Z., Harrison, R., Sun, Y., Xu, W., Lewis, A. C., Lee, J. D., Rickard, A. R., and Hamilton, J. F.: Strong anthropogenic control of secondary organic aerosol formation from isoprene in Beijing, Atmos. Chem. Phys., 20, 7531–7552, https://doi.org/10.5194/acp-20-7531-2020, 2020.
Burkholder, J. B., Abbatt, J. P., Barnes, I., Roberts, J. M., Melamed, M. L., Ammann, M., Bertram, A. K., Cappa, C. D., Carlton, A. G., Carpenter, L. J., Crowley, J. N., Dubowski, Y., George, C., Heard, D. E., Herrmann, H., Keutsch, F. N., Kroll, J. H., McNeill, V. F., Ng, N. L., Nizkorodov, S. A., Orlando, J. J., Percival, C. J., Picquet-Varrault, B., Rudich, Y., Seakins, P. W., Surratt, J. D., Tanimoto, H., Thornton, J. A., Tong, Z., Tyndall, G. S., Wahner, A., Weschler, C. J., Wilson, K. R., and Ziemann, P. J.: The Essential Role for Laboratory Studies in Atmospheric Chemistry, Environ. Sci. Technol., 51, 2519–2528, https://doi.org/10.1021/acs.est.6b04947, 2017.
Calvo, A. I., Alves, C., Castro, A., Pont, V., Vicente, A. M., and Fraile, R.: Research on aerosol sources and chemical composition: Past, current and emerging issues, Atmos. Res., 120–121, 1–28, https://doi.org/10.1016/j.atmosres.2012.09.021, 2013.
Chen, Y., Zhang, Y., Lambe, A. T., Xu, R., Lei, Z., Olson, N. E., Zhang, Z., Szalkowski, T., Cui, T., Vizuete, W., Gold, A., Turpin, B. J., Ault, A. P., Chan, M. N., and Surratt, J. D.: Heterogeneous Hydroxyl Radical Oxidation of Isoprene-Epoxydiol-Derived Methyltetrol Sulfates: Plausible Formation Mechanisms of Previously Unexplained Organosulfates in Ambient Fine Aerosols, Environ. Sci. Tech. Let., 7, 460–468, https://doi.org/10.1021/acs.estlett.0c00276, 2020.
Chhabra, P. S., Ng, N. L., Canagaratna, M. R., Corrigan, A. L., Russell, L. M., Worsnop, D. R., Flagan, R. C., and Seinfeld, J. H.: Elemental composition and oxidation of chamber organic aerosol, Atmos. Chem. Phys., 11, 8827–8845, https://doi.org/10.5194/acp-11-8827-2011, 2011.
Claeys, M., Iinuma, Y., Szmigielski, R., Surratt, J. D., Blockhuys, F., Van Alsenoy, C., Boge, O., Sierau, B., Gomez-Gonzalez, Y., Vermeylen, R., Van der Veken, P., Shahgholi, M., Chan, A. W., Herrmann, H., Seinfeld, J. H., and Maenhaut, W.: Terpenylic acid and related compounds from the oxidation of α-pinene: implications for new particle formation and growth above forests, Environ. Sci. Technol., 43, 6976–6982, https://doi.org/10.1021/es9007596, 2009.
Cocker, D. R., Flagan, R. C., and Seinfeld, J. H.: State-of-the-art chamber facility for studying atmospheric aerosol chemistry, Environ. Sci. Technol., 35, 2594–2601, https://doi.org/10.1021/es0019169, 2001.
Compernolle, S., Ceulemans, K., and Müller, J.-F.: EVAPORATION: a new vapour pressure estimation methodfor organic molecules including non-additivity and intramolecular interactions, Atmos. Chem. Phys., 11, 9431–9450, https://doi.org/10.5194/acp-11-9431-2011, 2011.
D'Ambro, E. L., Schobesberger, S., Gaston, C. J., Lopez-Hilfiker, F. D., Lee, B. H., Liu, J., Zelenyuk, A., Bell, D., Cappa, C. D., Helgestad, T., Li, Z., Guenther, A., Wang, J., Wise, M., Caylor, R., Surratt, J. D., Riedel, T., Hyttinen, N., Salo, V.-T., Hasan, G., Kurtén, T., Shilling, J. E., and Thornton, J. A.: Chamber-based insights into the factors controlling epoxydiol (IEPOX) secondary organic aerosol (SOA) yield, composition, and volatility, Atmos. Chem. Phys., 19, 11253–11265, https://doi.org/10.5194/acp-19-11253-2019, 2019.
Demarque, D. P., Crotti, A. E., Vessecchi, R., Lopes, J. L., and Lopes, N. P.: Fragmentation reactions using electrospray ionization mass spectrometry: an important tool for the structural elucidation and characterization of synthetic and natural products, Nat. Prod. Rep., 33, 432–455, https://doi.org/10.1039/c5np00073d, 2016.
Donahue, N. M., Robinson, A. L., Stanier, C. O., and Pandis, S. N.: Coupled partitioning, dilution, and chemical aging of semivolatile organics, Environ. Sci. Technol., 40, 2635–2643, https://doi.org/10.1021/es052297c, 2006.
Eddingsaas, N. C., Loza, C. L., Yee, L. D., Seinfeld, J. H., and Wennberg, P. O.: α-pinene photooxidation under controlled chemical conditions – Part 1: Gas-phase composition in low- and high-NOx environments, Atmos. Chem. Phys., 12, 6489–6504, https://doi.org/10.5194/acp-12-6489-2012, 2012a.
Eddingsaas, N. C., Loza, C. L., Yee, L. D., Chan, M., Schilling, K. A., Chhabra, P. S., Seinfeld, J. H., and Wennberg, P. O.: α-pinene photooxidation under controlled chemical conditions – Part 2: SOA yield and composition in low- and high-NOx environments, Atmos. Chem. Phys., 12, 7413–7427, https://doi.org/10.5194/acp-12-7413-2012, 2012b.
Gkatzelis, G. I., Hohaus, T., Tillmann, R., Gensch, I., Müller, M., Eichler, P., Xu, K.-M., Schlag, P., Schmitt, S. H., Yu, Z., Wegener, R., Kaminski, M., Holzinger, R., Wisthaler, A., and Kiendler-Scharr, A.: Gas-to-particle partitioning of major biogenic oxidation products: a study on freshly formed and aged biogenic SOA, Atmos. Chem. Phys., 18, 12969–12989, https://doi.org/10.5194/acp-18-12969-2018, 2018.
Goldstein, A. H. and Galbally, I. E.: Known and unknown organic constituents in the Earth' s atmosphere, Environ. Sci. Technol., 41, 1514–1521, https://doi.org/10.1021/es072476p, 2007.
Guenther, A. B., Jiang, X., Heald, C. L., Sakulyanontvittaya, T., Duhl, T., Emmons, L. K., and Wang, X.: The Model of Emissions of Gases and Aerosols from Nature version 2.1 (MEGAN2.1): an extended and updated framework for modeling biogenic emissions, Geosci. Model Dev., 5, 1471–1492, https://doi.org/10.5194/gmd-5-1471-2012, 2012.
Hallquist, M., Wenger, J. C., Baltensperger, U., Rudich, Y., Simpson, D., Claeys, M., Dommen, J., Donahue, N. M., George, C., Goldstein, A. H., Hamilton, J. F., Herrmann, H., Hoffmann, T., Iinuma, Y., Jang, M., Jenkin, M. E., Jimenez, J. L., Kiendler-Scharr, A., Maenhaut, W., McFiggans, G., Mentel, Th. F., Monod, A., Prévôt, A. S. H., Seinfeld, J. H., Surratt, J. D., Szmigielski, R., and Wildt, J.: The formation, properties and impact of secondary organic aerosol: current and emerging issues, Atmos. Chem. Phys., 9, 5155–5236, https://doi.org/10.5194/acp-9-5155-2009, 2009.
Hamilton, J. F., Alfarra, M. R., Robinson, N., Ward, M. W., Lewis, A. C., McFiggans, G. B., Coe, H., and Allan, J. D.: Linking biogenic hydrocarbons to biogenic aerosol in the Borneo rainforest, Atmos. Chem. Phys., 13, 11295–11305, https://doi.org/10.5194/acp-13-11295-2013, 2013.
Hammes, J., Lutz, A., Mentel, T., Faxon, C., and Hallquist, M.: Carboxylic acids from limonene oxidation by ozone and hydroxyl radicals: insights into mechanisms derived using a FIGAERO-CIMS, Atmos. Chem. Phys., 19, 13037–13052, https://doi.org/10.5194/acp-19-13037-2019, 2019.
Hoyle, C. R., Myhre, G., Berntsen, T. K., and Isaksen, I. S. A.: Anthropogenic influence on SOA and the resulting radiative forcing, Atmos. Chem. Phys., 9, 2715–2728, https://doi.org/10.5194/acp-9-2715-2009, 2009.
Huang, W., Saathoff, H., Pajunoja, A., Shen, X., Naumann, K.-H., Wagner, R., Virtanen, A., Leisner, T., and Mohr, C.: α-Pinene secondary organic aerosol at low temperature: chemical composition and implications for particle viscosity, Atmos. Chem. Phys., 18, 2883–2898, https://doi.org/10.5194/acp-18-2883-2018, 2018.
Iinuma, Y., Muller, C., Berndt, T., Boge, O., Claeys, M., and Herrmann, H.: Evidence for the existence of organosulfates from β-pinene ozonolysis in ambient secondary organic aerosol, Environ. Sci. Technol., 41, 6678–6683, https://doi.org/10.1021/es070938t, 2007.
Iinuma, Y., Boge, O., Grafe, R., and Herrmann, H.: Methyl-nitrocatechols: atmospheric tracer compounds for biomass burning secondary organic aerosols, Environ. Sci. Technol., 44, 8453–8459, https://doi.org/10.1021/es102938a, 2010.
Isaacman-VanWertz, G., Yee, L. D., Kreisberg, N. M., Wernis, R., Moss, J. A., Hering, S. V., de Sa, S. S., Martin, S. T., Alexander, M. L., Palm, B. B., Hu, W., Campuzano-Jost, P., Day, D. A., Jimenez, J. L., Riva, M., Surratt, J. D., Viegas, J., Manzi, A., Edgerton, E., Baumann, K., Souza, R., Artaxo, P., and Goldstein, A. H.: Ambient Gas-Particle Partitioning of Tracers for Biogenic Oxidation, Environ. Sci. Technol., 50, 9952–9962, https://doi.org/10.1021/acs.est.6b01674, 2016.
Isaacman-VanWertz, G., Massoli, P., O'Brien, R. E., Nowak, J. B., Canagaratna, M. R., Jayne, J. T., Worsnop, D. R., Su, L., Knopf, D. A., Misztal, P. K., Arata, C., Goldstein, A. H., and Kroll, J. H.: Using advanced mass spectrometry techniques to fully characterize atmospheric organic carbon: current capabilities and remaining gaps, Faraday Discuss., 200, 579–598, https://doi.org/10.1039/c7fd00021a, 2017.
Isaacman-VanWertz, G., Massoli, P., O'Brien, R., Lim, C., Franklin, J. P., Moss, J. A., Hunter, J. F., Nowak, J. B., Canagaratna, M. R., Misztal, P. K., Arata, C., Roscioli, J. R., Herndon, S. T., Onasch, T. B., Lambe, A. T., Jayne, J. T., Su, L., Knopf, D. A., Goldstein, A. H., Worsnop, D. R., and Kroll, J. H.: Chemical evolution of atmospheric organic carbon over multiple generations of oxidation, Nat. Chem., 10, 462–468, https://doi.org/10.1038/s41557-018-0002-2, 2018.
Koss, A. R., Canagaratna, M. R., Zaytsev, A., Krechmer, J. E., Breitenlechner, M., Nihill, K. J., Lim, C. Y., Rowe, J. C., Roscioli, J. R., Keutsch, F. N., and Kroll, J. H.: Dimensionality-reduction techniques for complex mass spectrometric datasets: application to laboratory atmospheric organic oxidation experiments, Atmos. Chem. Phys., 20, 1021–1041, https://doi.org/10.5194/acp-20-1021-2020, 2020.
Kristensen, K., Cui, T., Zhang, H., Gold, A., Glasius, M., and Surratt, J. D.: Dimers in α-pinene secondary organic aerosol: effect of hydroxyl radical, ozone, relative humidity and aerosol acidity, Atmos. Chem. Phys., 14, 4201–4218, https://doi.org/10.5194/acp-14-4201-2014, 2014.
Kroll, J. H. and Seinfeld, J. H.: Chemistry of secondary organic aerosol: Formation and evolution of low-volatility organics in the atmosphere, Atmos. Environ., 42, 3593–3624, https://doi.org/10.1016/j.atmosenv.2008.01.003, 2008.
Kroll, J. H., Donahue, N. M., Jimenez, J. L., Kessler, S. H., Canagaratna, M. R., Wilson, K. R., Altieri, K. E., Mazzoleni, L. R., Wozniak, A. S., Bluhm, H., Mysak, E. R., Smith, J. D., Kolb, C. E., and Worsnop, D. R.: Carbon oxidation state as a metric for describing the chemistry of atmospheric organic aerosol, Nat. Chem., 3, 133–139, https://doi.org/10.1038/nchem.948, 2011.
Laj, P., Klausen, J., Bilde, M., Plaß-Duelmer, C., Pappalardo, G., Clerbaux, C., Baltensperger, U., Hjorth, J., Simpson, D., Reimann, S., Coheur, P. F., Richter, A., De Mazière, M., Rudich, Y., McFiggans, G., Torseth, K., Wiedensohler, A., Morin, S., Schulz, M., Allan, J. D., Attié, J. L., Barnes, I., Birmili, W., Cammas, J. P., Dommen, J., Dorn, H. P., Fowler, D., Fuzzi, S., Glasius, M., Granier, C., Hermann, M., Isaksen, I. S. A., Kinne, S., Koren, I., Madonna, F., Maione, M., Massling, A., Moehler, O., Mona, L., Monks, P. S., Müller, D., Müller, T., Orphal, J., Peuch, V. H., Stratmann, F., Tanré, D., Tyndall, G., Abo Riziq, A., Van Roozendael, M., Villani, P., Wehner, B., Wex, H., and Zardini, A. A.: Measuring atmospheric composition change, Atmos. Environ., 43, 5351–5414, https://doi.org/10.1016/j.atmosenv.2009.08.020, 2009.
Laskin, A., Laskin, J., and Nizkorodov, S. A.: Mass spectrometric approaches for chemical characterisation of atmospheric aerosols: critical review of the most recent advances, Environ. Chem., 9, 163–189, https://doi.org/10.1071/en12052, 2012.
Lee, B. H., Lopez-Hilfiker, F. D., Mohr, C., Kurten, T., Worsnop, D. R., and Thornton, J. A.: An iodide-adduct high-resolution time-of-flight chemical-ionization mass spectrometer: application to atmospheric inorganic and organic compounds, Environ. Sci. Technol., 48, 6309–6317, https://doi.org/10.1021/es500362a, 2014.
Lee, B. H., D'Ambro, E. L., Lopez-Hilfiker, F. D., Schobesberger, S., Mohr, C., Zawadowicz, M. A., Liu, J., Shilling, J. E., Hu, W., Palm, B. B., Jimenez, J. L., Hao, L., Virtanen, A., Zhang, H., Goldstein, A. H., Pye, H. O. T., and Thornton, J. A.: Resolving ambient organic aerosol formation and aging pathways with simultaneous molecular composition and volatility observations, ACS Earth Space Chem., 4, 391–402, https://doi.org/10.1021/acsearthspacechem.9b00302, 2020.
Lopez-Hilfiker, F. D., Mohr, C., Ehn, M., Rubach, F., Kleist, E., Wildt, J., Mentel, Th. F., Lutz, A., Hallquist, M., Worsnop, D., and Thornton, J. A.: A novel method for online analysis of gas and particle composition: description and evaluation of a Filter Inlet for Gases and AEROsols (FIGAERO), Atmos. Meas. Tech., 7, 983–1001, https://doi.org/10.5194/amt-7-983-2014, 2014.
Lopez-Hilfiker, F. D., Mohr, C., Ehn, M., Rubach, F., Kleist, E., Wildt, J., Mentel, Th. F., Carrasquillo, A. J., Daumit, K. E., Hunter, J. F., Kroll, J. H., Worsnop, D. R., and Thornton, J. A.: Phase partitioning and volatility of secondary organic aerosol components formed from α-pinene ozonolysis and OH oxidation: the importance of accretion products and other low volatility compounds, Atmos. Chem. Phys., 15, 7765–7776, https://doi.org/10.5194/acp-15-7765-2015, 2015.
Lopez-Hilfiker, F. D., Iyer, S., Mohr, C., Lee, B. H., D'Ambro, E. L., Kurtén, T., and Thornton, J. A.: Constraining the sensitivity of iodide adduct chemical ionization mass spectrometry to multifunctional organic molecules using the collision limit and thermodynamic stability of iodide ion adducts, Atmos. Meas. Tech., 9, 1505–1512, https://doi.org/10.5194/amt-9-1505-2016, 2016a.
Lopez-Hilfiker, F. D., Mohr, C., D'Ambro, E. L., Lutz, A., Riedel, T. P., Gaston, C. J., Iyer, S., Zhang, Z., Gold, A., Surratt, J. D., Lee, B. H., Kurten, T., Hu, W. W., Jimenez, J., Hallquist, M., and Thornton, J. A.: Molecular Composition and Volatility of Organic Aerosol in the Southeastern U.S.: Implications for IEPOX Derived SOA, Environ. Sci. Technol., 50, 2200–2209, https://doi.org/10.1021/acs.est.5b04769, 2016b.
Lutz, A., Mohr, C., Le Breton, M., Lopez-Hilfiker, F. D., Priestley, M., Thornton, J. A., and Hallquist, M.: Gas to Particle Partitioning of Organic Acids in the Boreal Atmosphere, ACS Earth Space Chem., 3, 1279–1287, https://doi.org/10.1021/acsearthspacechem.9b00041, 2019.
Ma, Y., Russell, A. T., and Marston, G.: Mechanisms for the formation of secondary organic aerosol components from the gas-phase ozonolysis of alpha-pinene, Phys. Chem. Chem. Phys., 10, 4294–4312, https://doi.org/10.1039/b803283a, 2008.
Mai, H., Shiraiwa, M., Flagan, R. C., and Seinfeld, J. H.: Under What Conditions Can Equilibrium Gas-Particle Partitioning Be Expected to Hold in the Atmosphere?, Environ. Sci. Technol., 49, 11485–11491, https://doi.org/10.1021/acs.est.5b02587, 2015.
McFiggans, G., Mentel, T. F., Wildt, J., Pullinen, I., Kang, S., Kleist, E., Schmitt, S., Springer, M., Tillmann, R., Wu, C., Zhao, D., Hallquist, M., Faxon, C., Le Breton, M., Hallquist, A. M., Simpson, D., Bergstrom, R., Jenkin, M. E., Ehn, M., Thornton, J. A., Alfarra, M. R., Bannan, T. J., Percival, C. J., Priestley, M., Topping, D., and Kiendler-Scharr, A.: Secondary organic aerosol reduced by mixture of atmospheric vapours, Nature, 565, 587–593, https://doi.org/10.1038/s41586-018-0871-y, 2019.
Mehra, A., Wang, Y., Krechmer, J. E., Lambe, A., Majluf, F., Morris, M. A., Priestley, M., Bannan, T. J., Bryant, D. J., Pereira, K. L., Hamilton, J. F., Rickard, A. R., Newland, M. J., Stark, H., Croteau, P., Jayne, J. T., Worsnop, D. R., Canagaratna, M. R., Wang, L., and Coe, H.: Evaluation of the chemical composition of gas- and particle-phase products of aromatic oxidation, Atmos. Chem. Phys., 20, 9783–9803, https://doi.org/10.5194/acp-20-9783-2020, 2020.
Mentel, T. F., Springer, M., Ehn, M., Kleist, E., Pullinen, I., Kurtén, T., Rissanen, M., Wahner, A., and Wildt, J.: Formation of highly oxidized multifunctional compounds: autoxidation of peroxy radicals formed in the ozonolysis of alkenes – deduced from structure–product relationships, Atmos. Chem. Phys., 15, 6745–6765, https://doi.org/10.5194/acp-15-6745-2015, 2015.
Mohr, C., Thornton, J. A., Heitto, A., Lopez-Hilfiker, F. D., Lutz, A., Riipinen, I., Hong, J., Donahue, N. M., Hallquist, M., Petaja, T., Kulmala, M., and Yli-Juuti, T.: Molecular identification of organic vapors driving atmospheric nanoparticle growth, Nat. Commun., 10, 4442, https://doi.org/10.1038/s41467-019-12473-2, 2019.
Müllner, D.:. Modern hierarchical, agglomerative clustering algorithms, arXiv [preprint], arXiv:1109.2378, https://doi.org/10.48550/arXiv.1109.2378, 2011.
Mutzel, A., Poulain, L., Berndt, T., Iinuma, Y., Rodigast, M., Boge, O., Richters, S., Spindler, G., Sipila, M., Jokinen, T., Kulmala, M., and Herrmann, H.: Highly Oxidized Multifunctional Organic Compounds Observed in Tropospheric Particles: A Field and Laboratory Study, Environ. Sci. Technol., 49, 7754–7761, https://doi.org/10.1021/acs.est.5b00885, 2015.
Mutzel, A., Zhang, Y., Böge, O., Rodigast, M., Kolodziejczyk, A., Wang, X., and Herrmann, H.: Importance of secondary organic aerosol formation of α-pinene, limonene, and m-cresol comparing day- and nighttime radical chemistry, Atmos. Chem. Phys., 21, 8479–8498, https://doi.org/10.5194/acp-21-8479-2021, 2021.
Nel, A.: Atmosphere. Air pollution-related illness: effects of particles, Science, 308, 804–806, https://doi.org/10.1126/science.1108752, 2005.
Ng, N. L., Kroll, J. H., Keywood, M. D., Bahreini, R., Varutbangkul, V., Flagan, R. C., Seinfeld, J. H., Lee, A., and Goldstein, A. H.: Contribution of first- versus second-generation products to secondary organic aerosols formed in the oxidation of biogenic hydrocarbons, Environ. Sci. Technol., 40, 2283–2297, https://doi.org/10.1021/es052269u, 2006.
Nguyen, T. B., Bateman, A. P., Bones, D. L., Nizkorodov, S. A., Laskin, J., and Laskin, A.: High-resolution mass spectrometry analysis of secondary organic aerosol generated by ozonolysis of isoprene, Atmos. Environ., 44, 1032–1042, https://doi.org/10.1016/j.atmosenv.2009.12.019, 2010.
Nielsen, F.: Introduction to HPC with MPI for Data Science, Springer, ISBN: 978-3-319-21902-8, 2016.
Nizkorodov, S. A., Laskin, J., and Laskin, A.: Molecular chemistry of organic aerosols through the application of high resolution mass spectrometry, Phys. Chem. Chem. Phys., 13, 3612–3629, https://doi.org/10.1039/c0cp02032j, 2011.
O'Haver, T.: A Pragmatic Introduction to Signal Processing With applications in scientific measurement, Kindle Direct Publishing, ISBN: 9798611266687, 2021.
O'Meara, S., Booth, A. M., Barley, M. H., Topping, D., and McFiggans, G.: An assessment of vapour pressure estimation methods, Phys. Chem. Chem. Phys., 16, 19453–19469, https://doi.org/10.1039/c4cp00857j, 2014.
Pankow, J. F.: An absorption model of the gas/aerosol partitioning involved in the formation of secondary organic aerosol, Atmos. Environ., 28, 189–193, https://doi.org/10.1016/1352-2310(94)90094-9, 1994.
Parshintsev, J., Vaikkinen, A., Lipponen, K., Vrkoslav, V., Cvacka, J., Kostiainen, R., Kotiaho, T., Hartonen, K., Riekkola, M. L., and Kauppila, T. J.: Desorption atmospheric pressure photoionization high-resolution mass spectrometry: a complementary approach for the chemical analysis of atmospheric aerosols, Rapid Commun. Mass Sp., 29, 1233–1241, https://doi.org/10.1002/rcm.7219, 2015.
Pereira, K. L., Hamilton, J. F., Rickard, A. R., Bloss, W. J., Alam, M. S., Camredon, M., Muñoz, A., Vázquez, M., Borrás, E., and Ródenas, M.: Secondary organic aerosol formation and composition from the photo-oxidation of methyl chavicol (estragole), Atmos. Chem. Phys., 14, 5349–5368, https://doi.org/10.5194/acp-14-5349-2014, 2014.
Pereira, K. L., Ward, M. W., Wilkinson, J. L., Sallach, J. B., Bryant, D. J., Dixon, W. J., Hamilton, J. F., and Lewis, A. C.: An Automated Methodology for Non-targeted Compositional Analysis of Small Molecules in High Complexity Environmental Matrices Using Coupled Ultra Performance Liquid Chromatography Orbitrap Mass Spectrometry, Environ. Sci. Technol., 55, 7365–7375, https://doi.org/10.1021/acs.est.0c08208, 2021.
Perry, R. H., Cooks, R. G., and Noll, R. J.: Orbitrap mass spectrometry: instrumentation, ion motion and applications, Mass Spectrom. Rev., 27, 661–699, https://doi.org/10.1002/mas.20186, 2008.
Priestley, M., Bannan, T. J., Le Breton, M., Worrall, S. D., Kang, S., Pullinen, I., Schmitt, S., Tillmann, R., Kleist, E., Zhao, D., Wildt, J., Garmash, O., Mehra, A., Bacak, A., Shallcross, D. E., Kiendler-Scharr, A., Hallquist, Å. M., Ehn, M., Coe, H., Percival, C. J., Hallquist, M., Mentel, T. F., and McFiggans, G.: Chemical characterisation of benzene oxidation products under high- and low-NOx conditions using chemical ionisation mass spectrometry, Atmos. Chem. Phys., 21, 3473–3490, https://doi.org/10.5194/acp-21-3473-2021, 2021.
Ren, Y., Grosselin, B., Daele, V., and Mellouki, A.: Investigation of the reaction of ozone with isoprene, methacrolein and methyl vinyl ketone using the HELIOS chamber, Faraday Discuss., 200, 289–311, https://doi.org/10.1039/c7fd00014f, 2017.
Reyes-Villegas, E., Bannan, T., Le Breton, M., Mehra, A., Priestley, M., Percival, C., Coe, H., and Allan, J. D.: Online Chemical Characterization of Food-Cooking Organic Aerosols: Implications for Source Apportionment, Environ. Sci. Technol., 52, 5308–5318, https://doi.org/10.1021/acs.est.7b06278, 2018.
Rohrer, F., Bohn, B., Brauers, T., Brüning, D., Johnen, F.-J., Wahner, A., and Kleffmann, J.: Characterisation of the photolytic HONO-source in the atmosphere simulation chamber SAPHIR, Atmos. Chem. Phys., 5, 2189–2201, https://doi.org/10.5194/acp-5-2189-2005, 2005.
Rosati, B., Teiwes, R., Kristensen, K., Bossi, R., Skov, H., Glasius, M., Pedersen, H. B., and Bilde, M.: Factor analysis of chemical ionization experiments: Numerical simulations and an experimental case study of the ozonolysis of α-pinene using a PTR-ToF-MS, Atmos. Environ., 199, 15–31, https://doi.org/10.1016/j.atmosenv.2018.11.012, 2019.
Samy, S. and Hays, M. D.: Quantitative LC–MS for water-soluble heterocyclic amines in fine aerosols (PM2.5) at Duke Forest, USA, Atmos. Environ., 72, 77–80, https://doi.org/10.1016/j.atmosenv.2013.02.032, 2013.
Sánchez-López, J. A., Zimmermann, R., and Yeretzian, C.: Insight into the Time-Resolved Extraction of Aroma Compounds during Espresso Coffee Preparation: Online Monitoring by PTR-ToF-MS, Anal. Chem., 86, 11696–11704, https://doi.org/10.1021/ac502992k, 2014.
Schwantes, R. H., Schilling, K. A., McVay, R. C., Lignell, H., Coggon, M. M., Zhang, X., Wennberg, P. O., and Seinfeld, J. H.: Formation of highly oxygenated low-volatility products from cresol oxidation, Atmos. Chem. Phys., 17, 3453–3474, https://doi.org/10.5194/acp-17-3453-2017, 2017.
Shao, Y., Wang, Y., Du, M., Voliotis, A., Alfarra, M. R., O'Meara, S. P., Turner, S. F., and McFiggans, G.: Characterisation of the Manchester Aerosol Chamber facility, Atmos. Meas. Tech., 15, 539–559, https://doi.org/10.5194/amt-15-539-2022, 2022.
Stark, H., Yatavelli, R. L. N., Thompson, S. L., Kimmel, J. R., Cubison, M. J., Chhabra, P. S., Canagaratna, M. R., Jayne, J. T., Worsnop, D. R., and Jimenez, J. L.: Methods to extract molecular and bulk chemical information from series of complex mass spectra with limited mass resolution, Int. J. Mass Spectrom., 389, 26–38, https://doi.org/10.1016/j.ijms.2015.08.011, 2015.
Stark, H., Yatavelli, R. L. N., Thompson, S. L., Kang, H., Krechmer, J. E., Kimmel, J. R., Palm, B. B., Hu, W., Hayes, P. L., Day, D. A., Campuzano-Jost, P., Canagaratna, M. R., Jayne, J. T., Worsnop, D. R., and Jimenez, J. L.: Impact of Thermal Decomposition on Thermal Desorption Instruments: Advantage of Thermogram Analysis for Quantifying Volatility Distributions of Organic Species, Environ. Sci. Technol., 51, 8491–8500, https://doi.org/10.1021/acs.est.7b00160, 2017.
Thornton, J. A., Mohr, C., Schobesberger, S., D'Ambro, E. L., Lee, B. H., and Lopez-Hilfiker, F. D.: Evaluating Organic Aerosol Sources and Evolution with a Combined Molecular Composition and Volatility Framework Using the Filter Inlet for Gases and Aerosols (FIGAERO), Acc. Chem. Res., 53, 1415–1426, https://doi.org/10.1021/acs.accounts.0c00259, 2020.
Topping, D., Barley, M., Bane, M. K., Higham, N., Aumont, B., Dingle, N., and McFiggans, G.: UManSysProp v1.0: an online and open-source facility for molecular property prediction and atmospheric aerosol calculations, Geosci. Model Dev., 9, 899–914, https://doi.org/10.5194/gmd-9-899-2016, 2016.
Voliotis, A., Wang, Y., Shao, Y., Du, M., Bannan, T. J., Percival, C. J., Pandis, S. N., Alfarra, M. R., and McFiggans, G.: Exploring the composition and volatility of secondary organic aerosols in mixed anthropogenic and biogenic precursor systems, Atmos. Chem. Phys., 21, 14251–14273, https://doi.org/10.5194/acp-21-14251-2021, 2021.
Voliotis, A., Du, M., Wang, Y., Shao, Y., Alfarra, M. R., Bannan, T. J., Hu, D., Pereira, K. L., Hamilton, J. F., Hallquist, M., Mentel, T. F., and McFiggans, G.: Chamber investigation of the formation and transformation of secondary organic aerosol in mixtures of biogenic and anthropogenic volatile organic compounds, Atmos. Chem. Phys. Discuss. [preprint], https://doi.org/10.5194/acp-2021-1080, in review, 2022.
Wang, D. S. and Hildebrandt Ruiz, L.: Chlorine-initiated oxidation of n-alkanes under high-NOx conditions: insights into secondary organic aerosol composition and volatility using a FIGAERO–CIMS, Atmos. Chem. Phys., 18, 15535–15553, https://doi.org/10.5194/acp-18-15535-2018, 2018.
Wang, J., Doussin, J. F., Perrier, S., Perraudin, E., Katrib, Y., Pangui, E., and Picquet-Varrault, B.: Design of a new multi-phase experimental simulation chamber for atmospheric photosmog, aerosol and cloud chemistry research, Atmos. Meas. Tech., 4, 2465–2494, https://doi.org/10.5194/amt-4-2465-2011, 2011.
Winterhalter, R., Van Dingenen, R., Larsen, B. R., Jensen, N. R., and Hjorth, J.: LC-MS analysis of aerosol particles from the oxidation of α-pinene by ozone and OH-radicals, Atmos. Chem. Phys. Discuss., 3, 1–39, https://doi.org/10.5194/acpd-3-1-2003, 2003.
Xu, L., Middlebrook, A. M., Liao, J., de Gouw, J. A., Guo, H., Weber, R. J., Nenes, A., Lopez-Hilfiker, F. D., Lee, B. H., Thornton, J. A., Brock, C. A., Neuman, J. A., Nowak, J. B., Pollack, I. B., Welti, A., Graus, M., Warneke, C., and Ng, N. L.: Enhanced formation of isoprene-derived organic aerosol in sulfur-rich power plant plumes during Southeast Nexus, J. Geophys. Res.-Atmos., 121, 11137–111153, https://doi.org/10.1002/2016jd025156, 2016.
Yasmeen, F., Szmigielski, R., Vermeylen, R., Gomez-Gonzalez, Y., Surratt, J. D., Chan, A. W., Seinfeld, J. H., Maenhaut, W., and Claeys, M.: Mass spectrometric characterization of isomeric terpenoic acids from the oxidation of α-pinene, β-pinene, d-limonene, and Δ3-carene in fine forest aerosol, J. Mass. Spectrom., 46, 425-442, https://doi.org/10.1002/jms.1911, 2011.
Yli-Juuti, T., Pajunoja, A., Tikkanen, O. P., Buchholz, A., Faiola, C., Vaisanen, O., Hao, L., Kari, E., Perakyla, O., Garmash, O., Shiraiwa, M., Ehn, M., Lehtinen, K., and Virtanen, A.: Factors controlling the evaporation of secondary organic aerosol from alpha-pinene ozonolysis, Geophys. Res. Lett., 44, 2562–2570, https://doi.org/10.1002/2016GL072364, 2017.
Zhang, H., Yee, L. D., Lee, B. H., Curtis, M. P., Worton, D. R., Isaacman-VanWertz, G., Offenberg, J. H., Lewandowski, M., Kleindienst, T. E., Beaver, M. R., Holder, A. L., Lonneman, W. A., Docherty, K. S., Jaoui, M., Pye, H. O. T., Hu, W., Day, D. A., Campuzano-Jost, P., Jimenez, J. L., Guo, H., Weber, R. J., de Gouw, J., Koss, A. R., Edgerton, E. S., Brune, W., Mohr, C., Lopez-Hilfiker, F. D., Lutz, A., Kreisberg, N. M., Spielman, S. R., Hering, S. V., Wilson, K. R., Thornton, J. A., and Goldstein, A. H.: Monoterpenes are the largest source of summertime organic aerosol in the southeastern United States, P. Natl. Acad. Sci. USA, 115, 2038–2043, https://doi.org/10.1073/pnas.1717513115, 2018.
Zhang, X., McVay, R. C., Huang, D. D., Dalleska, N. F., Aumont, B., Flagan, R. C., and Seinfeld, J. H.: Formation and evolution of molecular products in alpha-pinene secondary organic aerosol, P. Natl. Acad. Sci. USA, 112, 14168–14173, https://doi.org/10.1073/pnas.1517742112, 2015.
- Article
(3503 KB) - Full-text XML