the Creative Commons Attribution 4.0 License.
the Creative Commons Attribution 4.0 License.
 | 02 Aug 2022
Cavity ring-down spectroscopy of water vapor in the deep-blue region
Qing-Ying Yang
Eamon K. Conway
Hui Liang
Iouli E. Gordon
Shui-Ming Hu
Water vapor absorption in the near-ultraviolet region is essential to describe the energy budget of Earth, but little spectroscopic information is available since it is a challenging spectral region for both experimental and theoretical studies. A continuous-wave cavity ring-down spectroscopic experiment was built to record absorption lines of water vapor around 415 nm. With a precision of cm−1, 40 rovibrational transitions of HO were observed in this work, and 27 of them were assigned to the (224), (205), (710), (304), (093), (125) and (531) vibrational bands. A comparison of line positions and intensities determined in this work to the most recent HITRAN database is presented. Water vapor absorption cross-sections near 415 nm were calculated based on our measurements, which vary between and cm2 molec.−1. These data will also significantly impact the spectroscopy detection of trace gas species in the near-UV region.
- Article
(2651 KB) - Full-text XML
- BibTeX
- EndNote


While water is a central key for terrestrial life, it is also the most abundant greenhouse gas on Earth and plays an immense role in climate evolution. Understanding the water vapor rovibrational spectrum is the cornerstone to constructing a reliable water transmittance model in solar radiation. However, the water vapor absorption in the near-ultraviolet (near-UV) region is still poorly understood, which has become the remaining problem of missing absorption in the model of the earth–atmosphere energy balance (Learner et al., 1999; Callegari et al., 2002; Tennyson et al., 2013). Accurate spectral information of near-UV water absorption is also required in both ground-based observations and satellite missions when retrieving other atmospheric absorbers based on spectroscopy in the UV–Vis region (Yin et al., 2021; Lampel et al., 2015, 2017; Chance, 2005; Orphal and Chance, 2003). For instance, the peak of NO2 absorption cross-sections is located at 400–420 nm, and the remote sensing of ozone relies on its absorption/emission in the near-UV as well (Chance, 2005; Orphal and Chance, 2003) and other trace gases (Finkenzeller and Volkamer, 2022).
Recent theoretical calculations and experimental measurements have improved the quality of the spectroscopic data set of the water molecule in the visible and near-UV. Tremendous efforts have been made both theoretically and experimentally to construct the database of water transitions (Rothman et al., 2010; Bernath et al., 2010; Tennyson et al., 2009, 2013, 2016; Polyansky et al., 2018). However, the water absorption in the near-UV region is extremely weak compared to that in the infrared region (Gordon et al., 2017), which makes it more difficult to measure or model. Several earlier studies were carried out using high-resolution Fourier-transform spectroscopy (FTS; Carleer et al., 1999; Coheur et al., 2002; Fally et al., 2003; Coheur et al., 2003). However, it is still challenging to measure those weak transitions located in the near-UV region with FTS instruments. Cavity ring-down spectroscopy (CRDS) offers both high-sensitivity and high-frequency precision, and the absorption coefficient can be determined directly without calibrating the optical path length. To the best of our knowledge, the only high-resolution near-UV CRDS measurement of water was reported by Dupré et al. (2005) in the 393 to 397 nm region. Meanwhile, a few laboratory measurements of cross-sections of water vapor in the near-UV region have been reported by different groups (Pei et al., 2019; Wilson et al., 2016; Du et al., 2013), and several remote sensing studies (Lampel et al., 2015, 2017) have also been carried out to detect near-UV water absorption, but large discrepancies exist in these results. In the earlier work by Du et al. (2013), strong water vapor absorption cross-section values ranging from to cm2 molec.−1 were observed with CRDS in the 290–350 nm region. Recent work from the same group (Pei et al., 2019) presented quite different results, where water absorption cross-sections over this range were reported to be approximately to cm2 molec.−1 by near-UV broadband CRDS. This work concluded that water vapor absorption significantly affects ozone retrievals and contributes 0.26–0.76 Wm−2 to the Earth's energy budget when incorporating the water cross-sections into a radiative transfer model (Pei et al., 2019). The strong absorption of water vapor in the UV region reported in these two studies (Du et al., 2013; Pei et al., 2019) has been taken into account in ground-based measurements monitoring atmospheric trace gases of O3, SO2, and NO2 (Yin et al., 2021). It was found that the residual optical depth in the observed UV spectra is sensitive to the amount of atmospheric water vapor (Yin et al., 2021). Wilson et al. (2016) gave an upper limit for the water vapor absorption cross-sections of approximately cm2 molec.−1 between 325 and 420 nm, which is different from the other two studies by Du et al. (2013) and Pei et al. (2019). Lampel et al. (2015, 2017) also evaluated the water vapor absorption in the near-UV region using multi-axis differential optical absorption spectroscopy (MAX-DOAS) and long-path (LP)-DOAS measurements, and a maximum cross-section value of cm2 molec.−1 at 362.3 nm was demonstrated (Lampel et al., 2017).
Generating a reliable water line list from the theoretical approach is also very challenging. A new water line list extending into the near-ultraviolet region (42 000 cm−1) based on a semi-empirical potential energy surface (PES) and ab initio dipole moment surface (DMS) was recently presented by Conway et al. (2020). In particular, significant improvements in the near-UV region have been achieved for this line list, showing good agreement with recent atmospheric retrievals. The line list from Conway et al. (2020) (supplemented with validated experimental results where possible) was used to update the HITRAN2020 database (Gordon et al., 2022). The calculated line list was also added to the ExoMol database (Tennyson et al., 2016) as well. Recently, by evaluating experimental rovibrational transitions, a new database of the empirical energy levels, called W2020 (Furtenbacher et al., 2020), has been constructed. This database allowed some unobserved transitions to be predicted with experimental accuracy. For HITRAN2020, the W2020-derived line positions were used in place of ab initio results of Conway et al. (2020) where possible. With that being said, very few transitions can be predicted in the region around 415 nm. This is because only one line at 24 093.38 cm−1 was assigned (Tolchenov et al., 2005) in previous experimental studies in this region, and none of the measurements in other regions allow for access to corresponding upper-state energy levels. Therefore, the majority of the line positions in HITRAN2020 in this region is still of ab initio origin.
Here, we report the high-resolution absorption spectroscopy of water vapor in the deep-blue region measured by continuous-wave cavity ring-down spectroscopy at room temperature. A sensitivity of cm−1 was demonstrated, and the rovibrational transitions of water vapor were observed with intensities as weak as 10−28 cm molec.−1. Assignments of these observed lines are performed by comparing observed lines with the new ab initio water vapor line list from Conway et al. (2020). By comparing the observed spectra with simulated spectra from databases, the water vapor line lists in the deep-blue region from HITRAN2016 (Gordon et al., 2017) and HITRAN2020 are evaluated. The recently updated HITRAN2020 line list shows better agreement with the observed spectra in comparison with HITRAN2016. The water vapor absorption cross-sections measured at room temperature around 415 nm are then convoluted to the same spectral resolution and compared with references from previous observations and simulations.
Water vapor absorption in the deep-blue region was recorded by a continuous-wave cavity ring-down spectrometer. The configuration of our experimental setup is shown in Fig. 1 and briefly described as follows. An external cavity diode laser (ECDL; Toptica DL Pro) was used as the light source with a linewidth of around 100 kHz. A small fraction of the laser beam is directly sent into a wavelength meter (High-Finesse WS-7), with an absolute accuracy of 0.002 cm−1. Another beam of about 10 mW is then coupled into a 0.74 m long ring-down cavity after an acousto-optical modulator (AOM). The ring-down cavity is composed of two high-reflectivity (HR) mirrors (R≈99.992 %) with a piezoelectric actuator (PZT), which enables the control of the cavity length through a function generator. The whole ring-down cavity is placed in a vacuum stainless chamber, which is temperature-stabilized to 296.44 K with a fluctuation of about 0.03 K. The ring-down event is initiated by a homemade trigger box that drives the AOM to switch the laser beam, when the laser frequency matches the cavity mode, and the transmitted laser power reaches a preset threshold. The ring-down signal is detected by a photodiode and recorded through the data acquisition system. A nonlinear least-squares fitting algorithm is applied to derive the decay time τ0. Typically, about 200 decays for about 5 s are acquired to derive the decay time τ at a certain laser frequency. Therefore, the frequency for acquisition between individual ring-down measurements is about 40 Hz. A single spectrum covering a range of 5 GHz can be recorded within 3 min. The resulting noise-equivalent absorption coefficient is about cm−1.
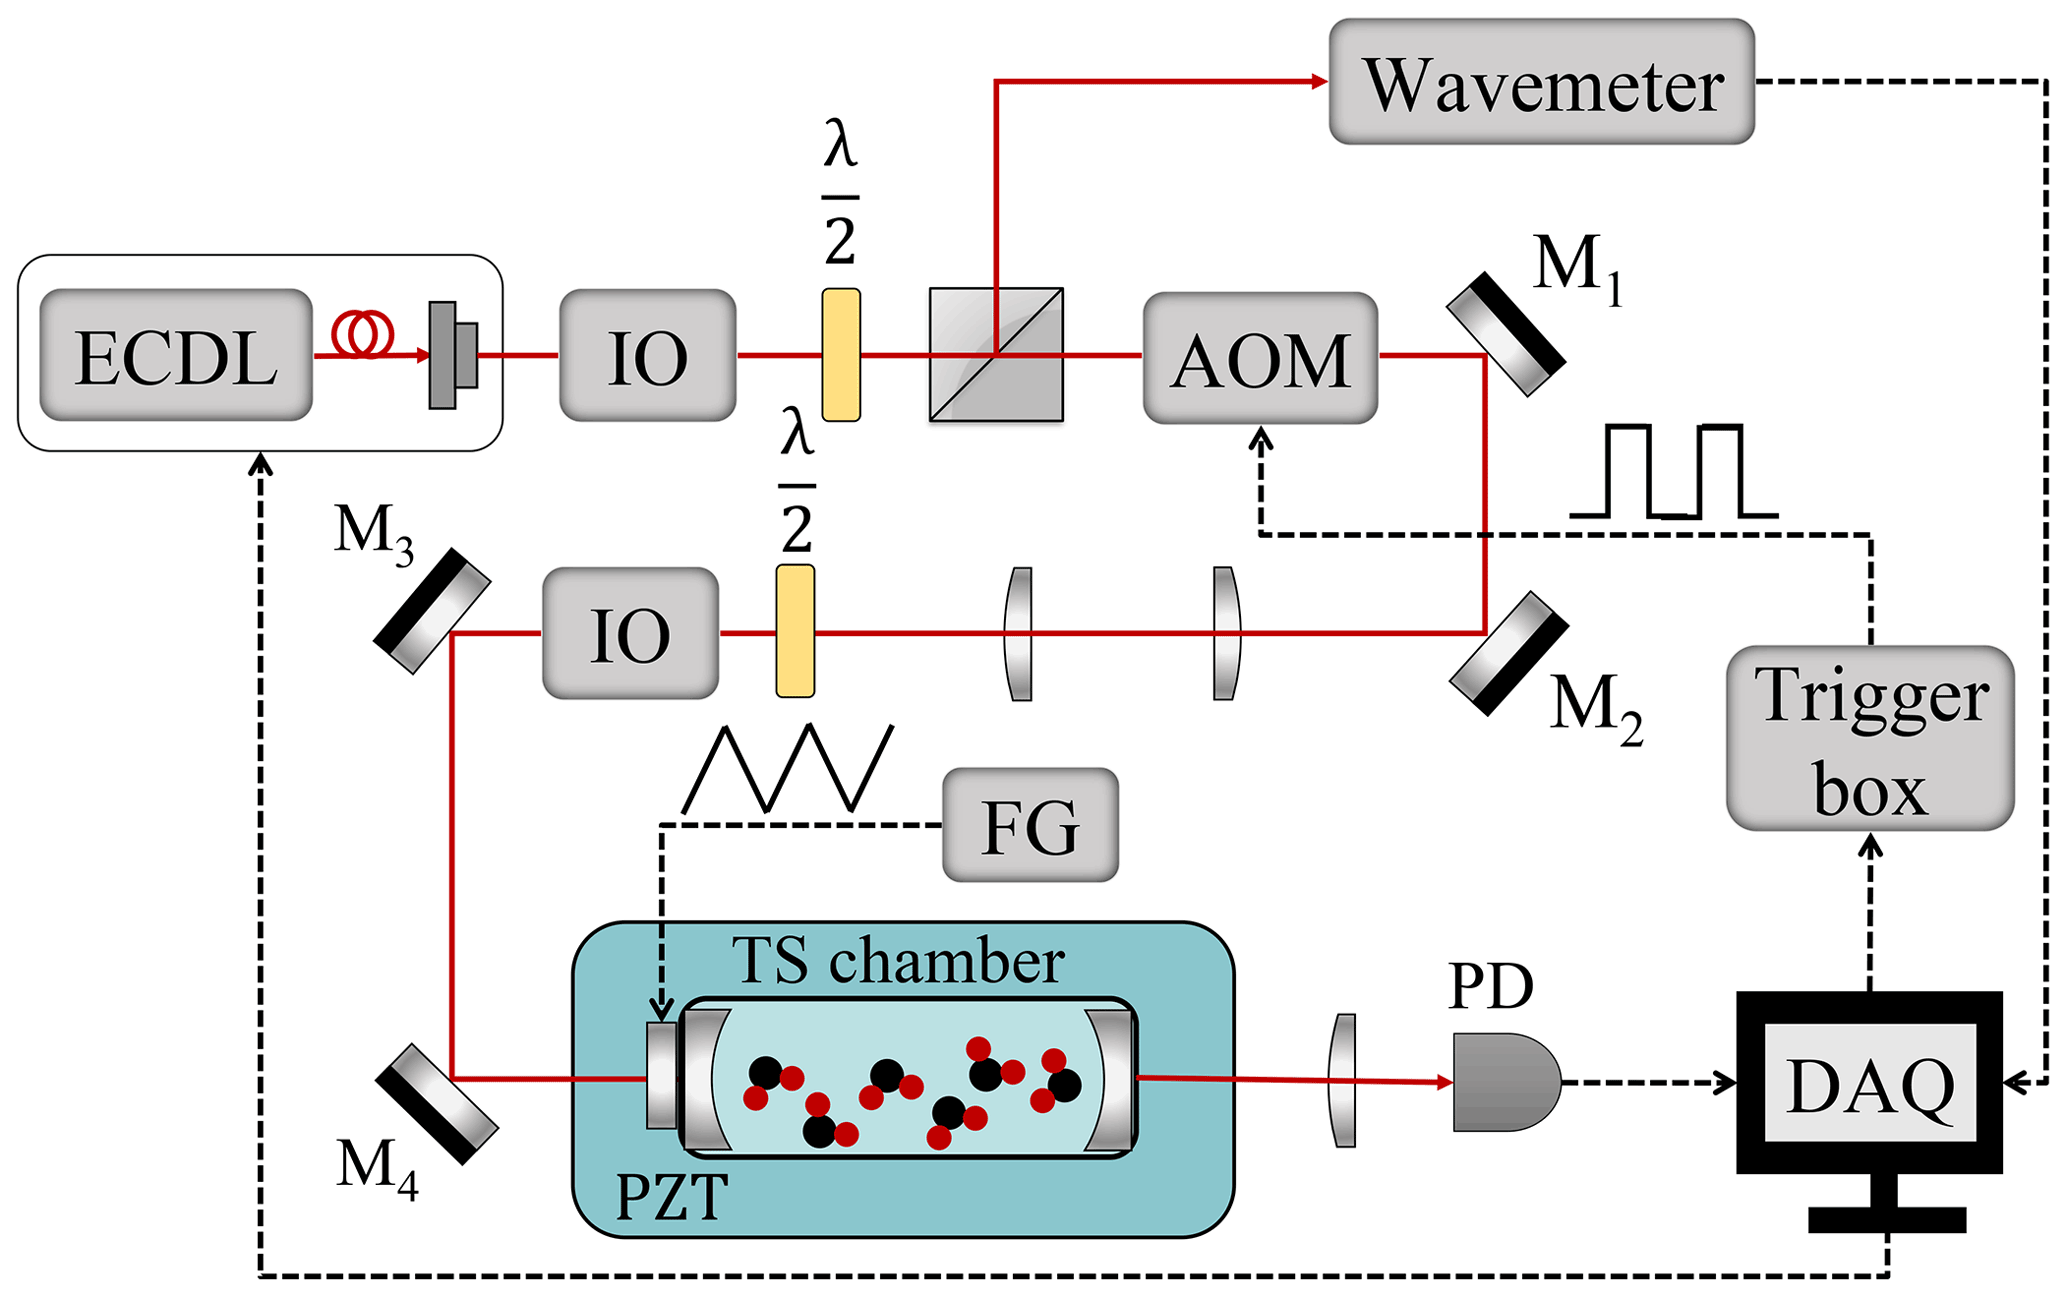
Figure 1The experimental setup of the cavity ring-down spectroscopy. ECDL: external cavity diode laser, AOM: acousto-optical modulator, IO: optical isolator, PZT: piezoelectric actuator, DAQ: data acquisition system, FG: function generator, TS chamber: temperature-stabilized chamber.
A deionized water sample with natural abundance was supplied to the cell through a needle valve. Since the exchange and absorption between water vapor and the cavity walls are inevitable, the gas sample was stabilized for days until equilibrium was reached before the measurement. The pressure inside the cavity was continuously monitored by a capacitance gauge (full-range 10 kPa, 0.5 % accuracy) during the measurement. The initial pressure of the water sample inside the cavity was 1.12 kPa. And a maximum fluctuation of the pressure during the measurement in 30 d was about 150 Pa, leading to a fractional uncertainty of 2 % of the sample pressure per day if we assumed a linear absorption of water vapor inside the cavity. Therefore, we corrected the sample pressure of each recording based on the linear function of pressure on dates. An overview of the recorded spectra is presented in Fig. 4a. Water vapor absorption between 24 062 and 24 124 cm−1 was recorded in this work.
The spectral fitting procedure is outlined in Fig. 2. Two typical water absorption features are shown in Fig. 2a and b, including four transitions centered at 24 082.3462, 24 082.8808, 24 077.5833 and 24 077.9427 cm−1. As shown in the upper panels of the figure, the original recorded spectra exhibited weak interference fringes on the baseline, and the amplitude of the interference fringes drifted over time. We attributed these interference fringes to the optical back reflection from the cavity mirrors since the amplitude could be diminished if we adjust the angle of the cavity mirror, and a relatively stable free spectral range (FSR) of about 15 GHz was observed in our recorded original spectra, which corresponds to an optical distance of 1 cm. Therefore, a sine wave function was applied to fit the baseline drifting and then subtracted from the recorded spectra, as shown in the middle panels, Fig. 2c and d.
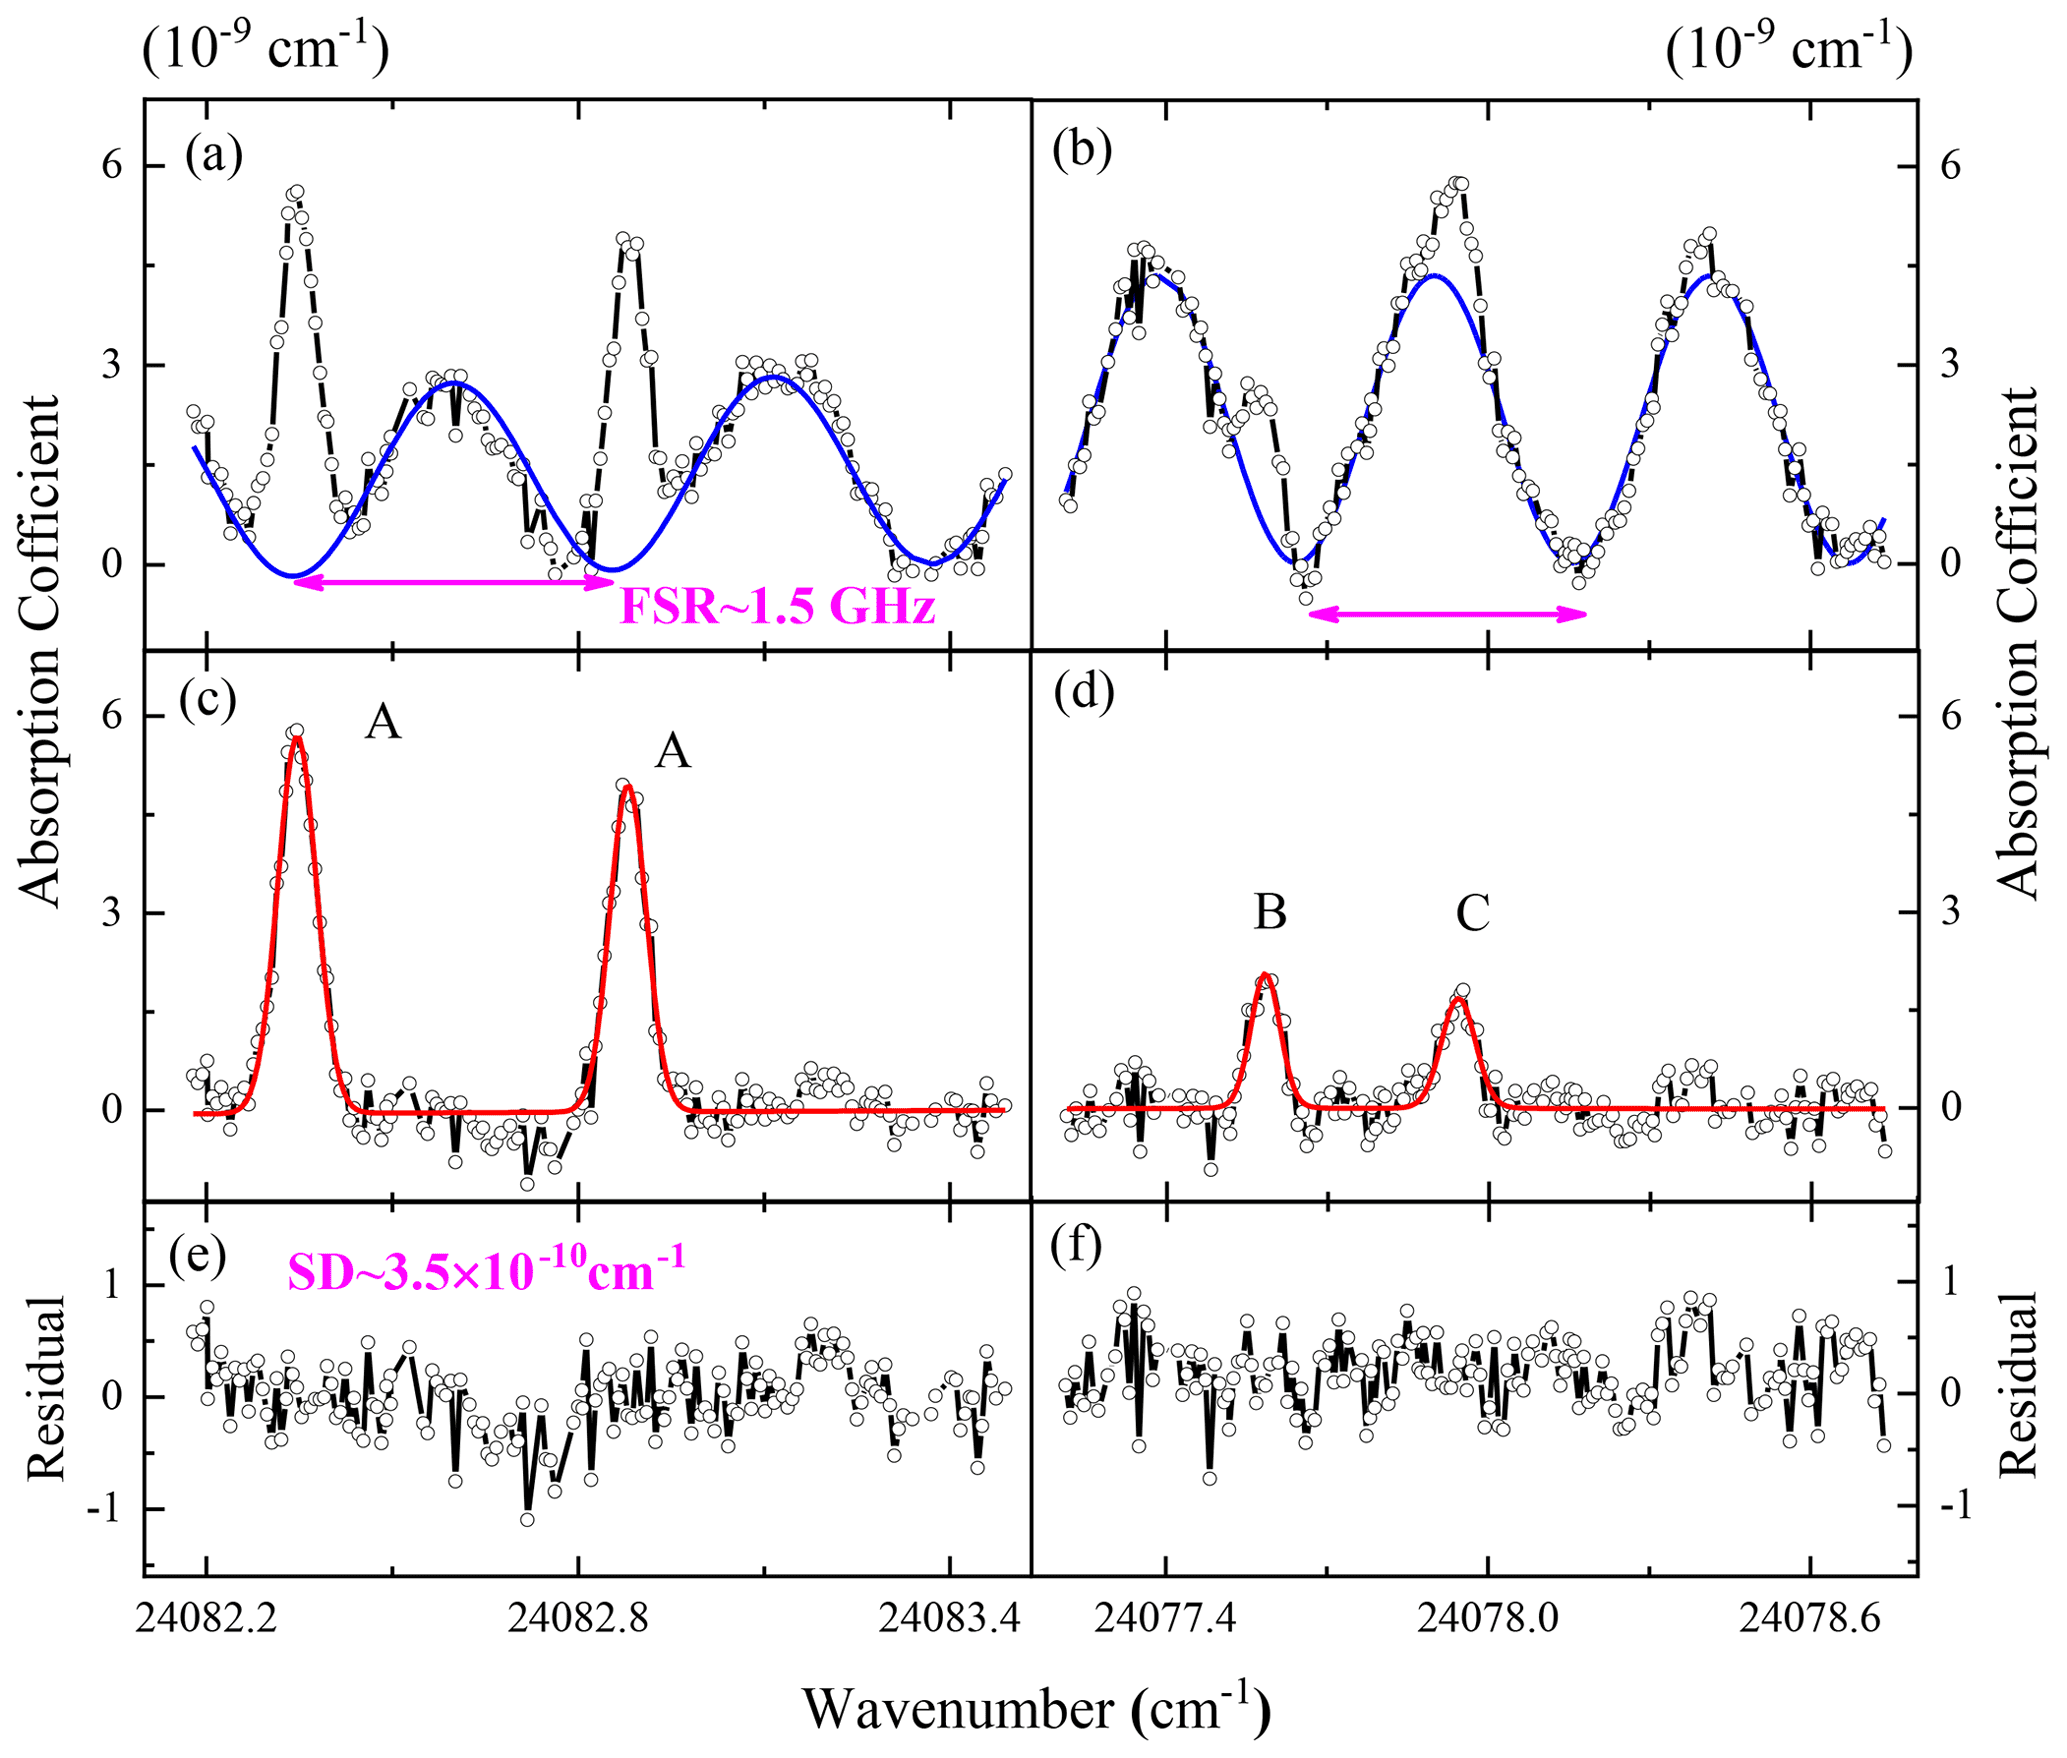
Figure 2The recorded spectra of HO around (a) 24 082 cm−1 and (b) 24 078 cm−1. Solid blue lines indicate the simulated fringes with a sine wave function. Spectra after subtraction of the simulated fringes are shown in (c) and (d). The labels “A”, “B” and “C” for the peaks correspond to their fractional uncertainties as listed in Table 1. The absorption spectra of H2O obtained from a Voigt profile fitting are shown by solid red lines, and their fitting residuals are plotted in (e) and (f). The standard deviation of the fitting residuals is about cm−1.
A simple Voigt profile was employed to fit the observed lines with a Gaussian line width fixed at the calculated Doppler broadening width. The bottom panels, Fig. 2e and f, show fitting residuals obtained with a Voigt profile and a standard deviation of the residual of about cm−1, which also corresponds to minimum cross sections of cm2 molec.−1. Therefore, only transitions with line intensities larger than cm molec.−1 were determined in this work, as summarized in Table 1. In addition, the total cross-sections of water vapor at 415 nm are presented in Fig. 5b, which has been convoluted to a spectral resolution of 5 cm−1. In conclusion, we determined that the cross-section values for water vapor around 415 nm varied between and cm2 molec.−1.
Table 1The summary of line positions determined from the H2O spectrum recorded between 24 062 and 24 124 cm−1 at 296.44 (±0.03) K. Uncertainties in brackets correspond to the unit of the last digit.
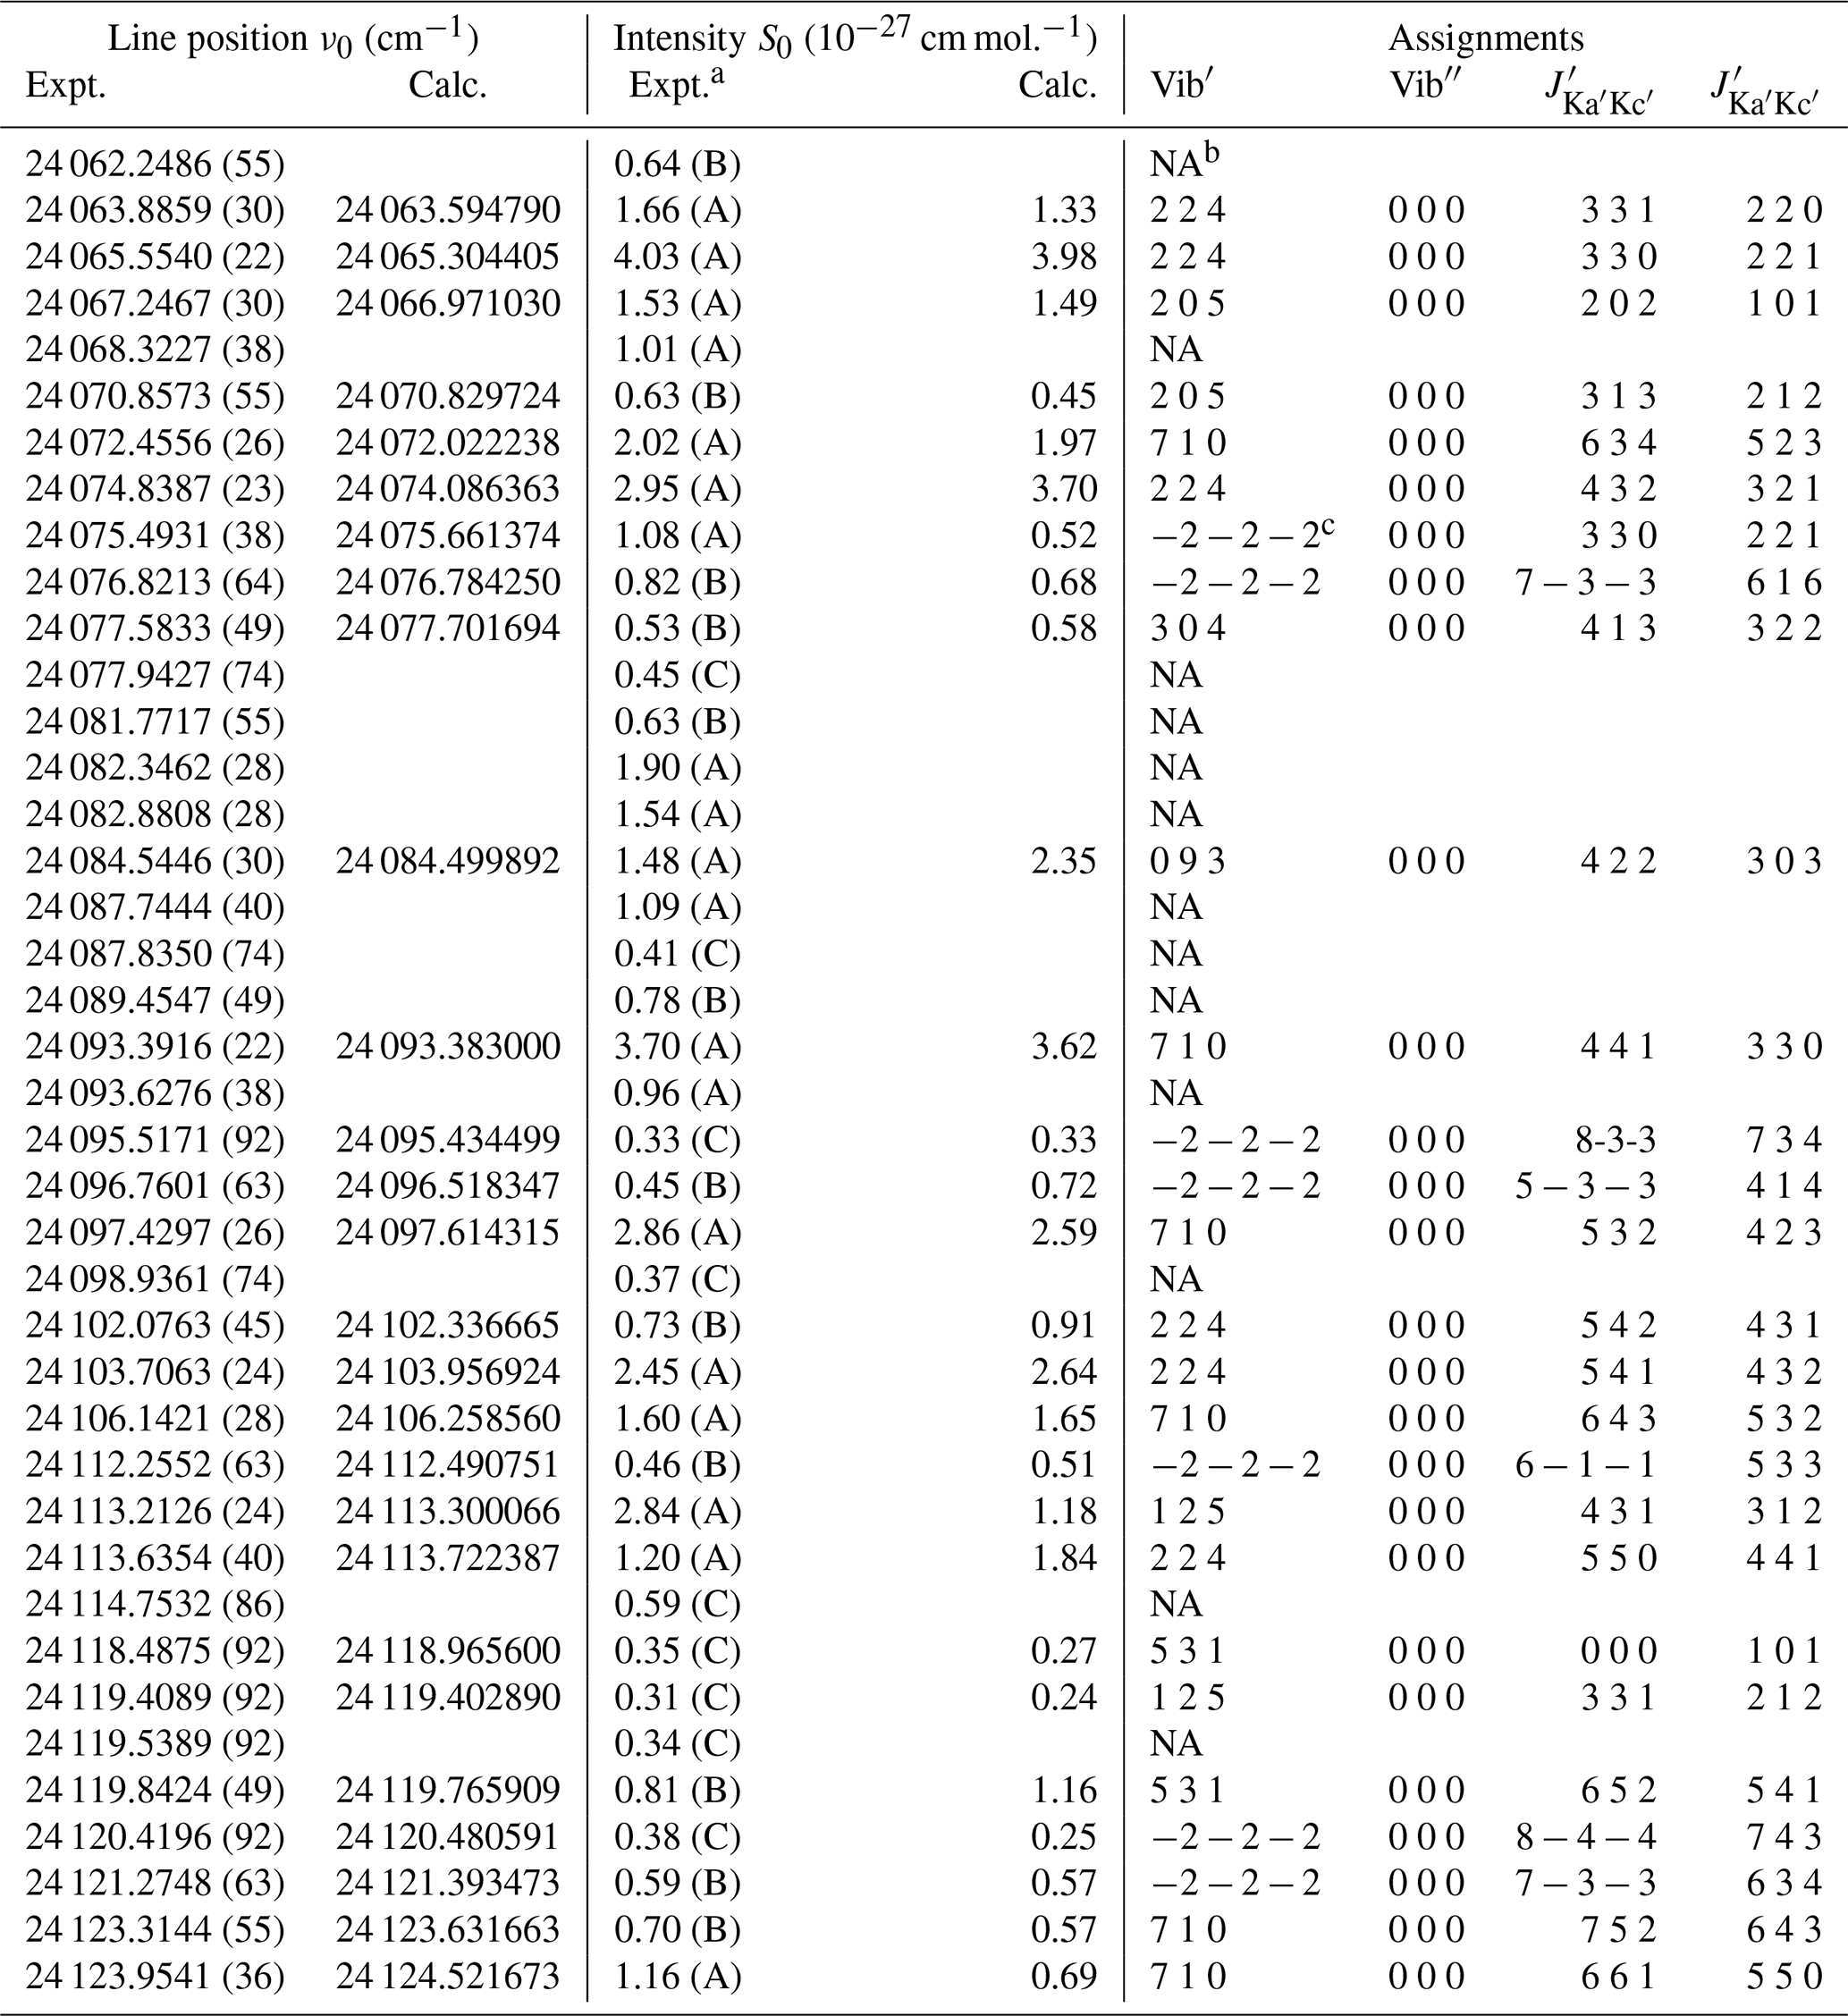
a Codes of “A”, “B” and “C” correspond to fractional uncertainties of 5 %–10 %, 10 %–30 % and >40 %, respectively.
b NA, which stands for not available, indicates unassigned transitions.
c Negative notation indicates unknown upper state.
The calibration of the line positions given in Table 1 is based on the wavemeter with absolute relative accuracy of 0.002 cm−1, and the pressure in the sample cavity was around 1.12 kPa, which contributed to the self-induced line shift of 0.0002 cm−1 on average. As a result, the combined standard uncertainties around 0.002 cm−1 are presented in Table 1, which are mostly limited by the wavelength calibration here. The values of the line intensities correspond to natural abundance of HO, and the relative uncertainties for the line intensities were included as well, seen in Table 1. The relative uncertainty codes for “A”, “B”, and “C” represent a relative accuracy of 5 %–10 %, 10 %–30 % and >40 %, respectively. The main uncertainties for the line intensity measurements came from two parts; the first part is the continuous exchange and absorption of the water molecules between the gas phase and the walls of the sample cell. The sample pressure in the cell was continuously monitored by a capacitance gauge, which resulted in a maximum relative difference of about 2 % every day during the measurements, as discussed before. And the temperature stability of our cavity is better than 0.05 %, which is negligible in the contribution of intensity uncertainties. In combination with the second part from fitting uncertainties for the relatively strong absorption and weak absorption, the intensity error codes were derived.
A line-by-line analysis of the observed spectra from 24 060 to 24 130 cm−1 was conducted through the direct comparison of experimental results with the ab initio line list from Conway et al. (2020), which is also featured in the latest version of the HITRAN database (Gordon et al., 2022). Since there are fewer relative strong lines in this region compared to the low frequencies, only 40 transitions are observed in this work, as shown in Fig. 3a.
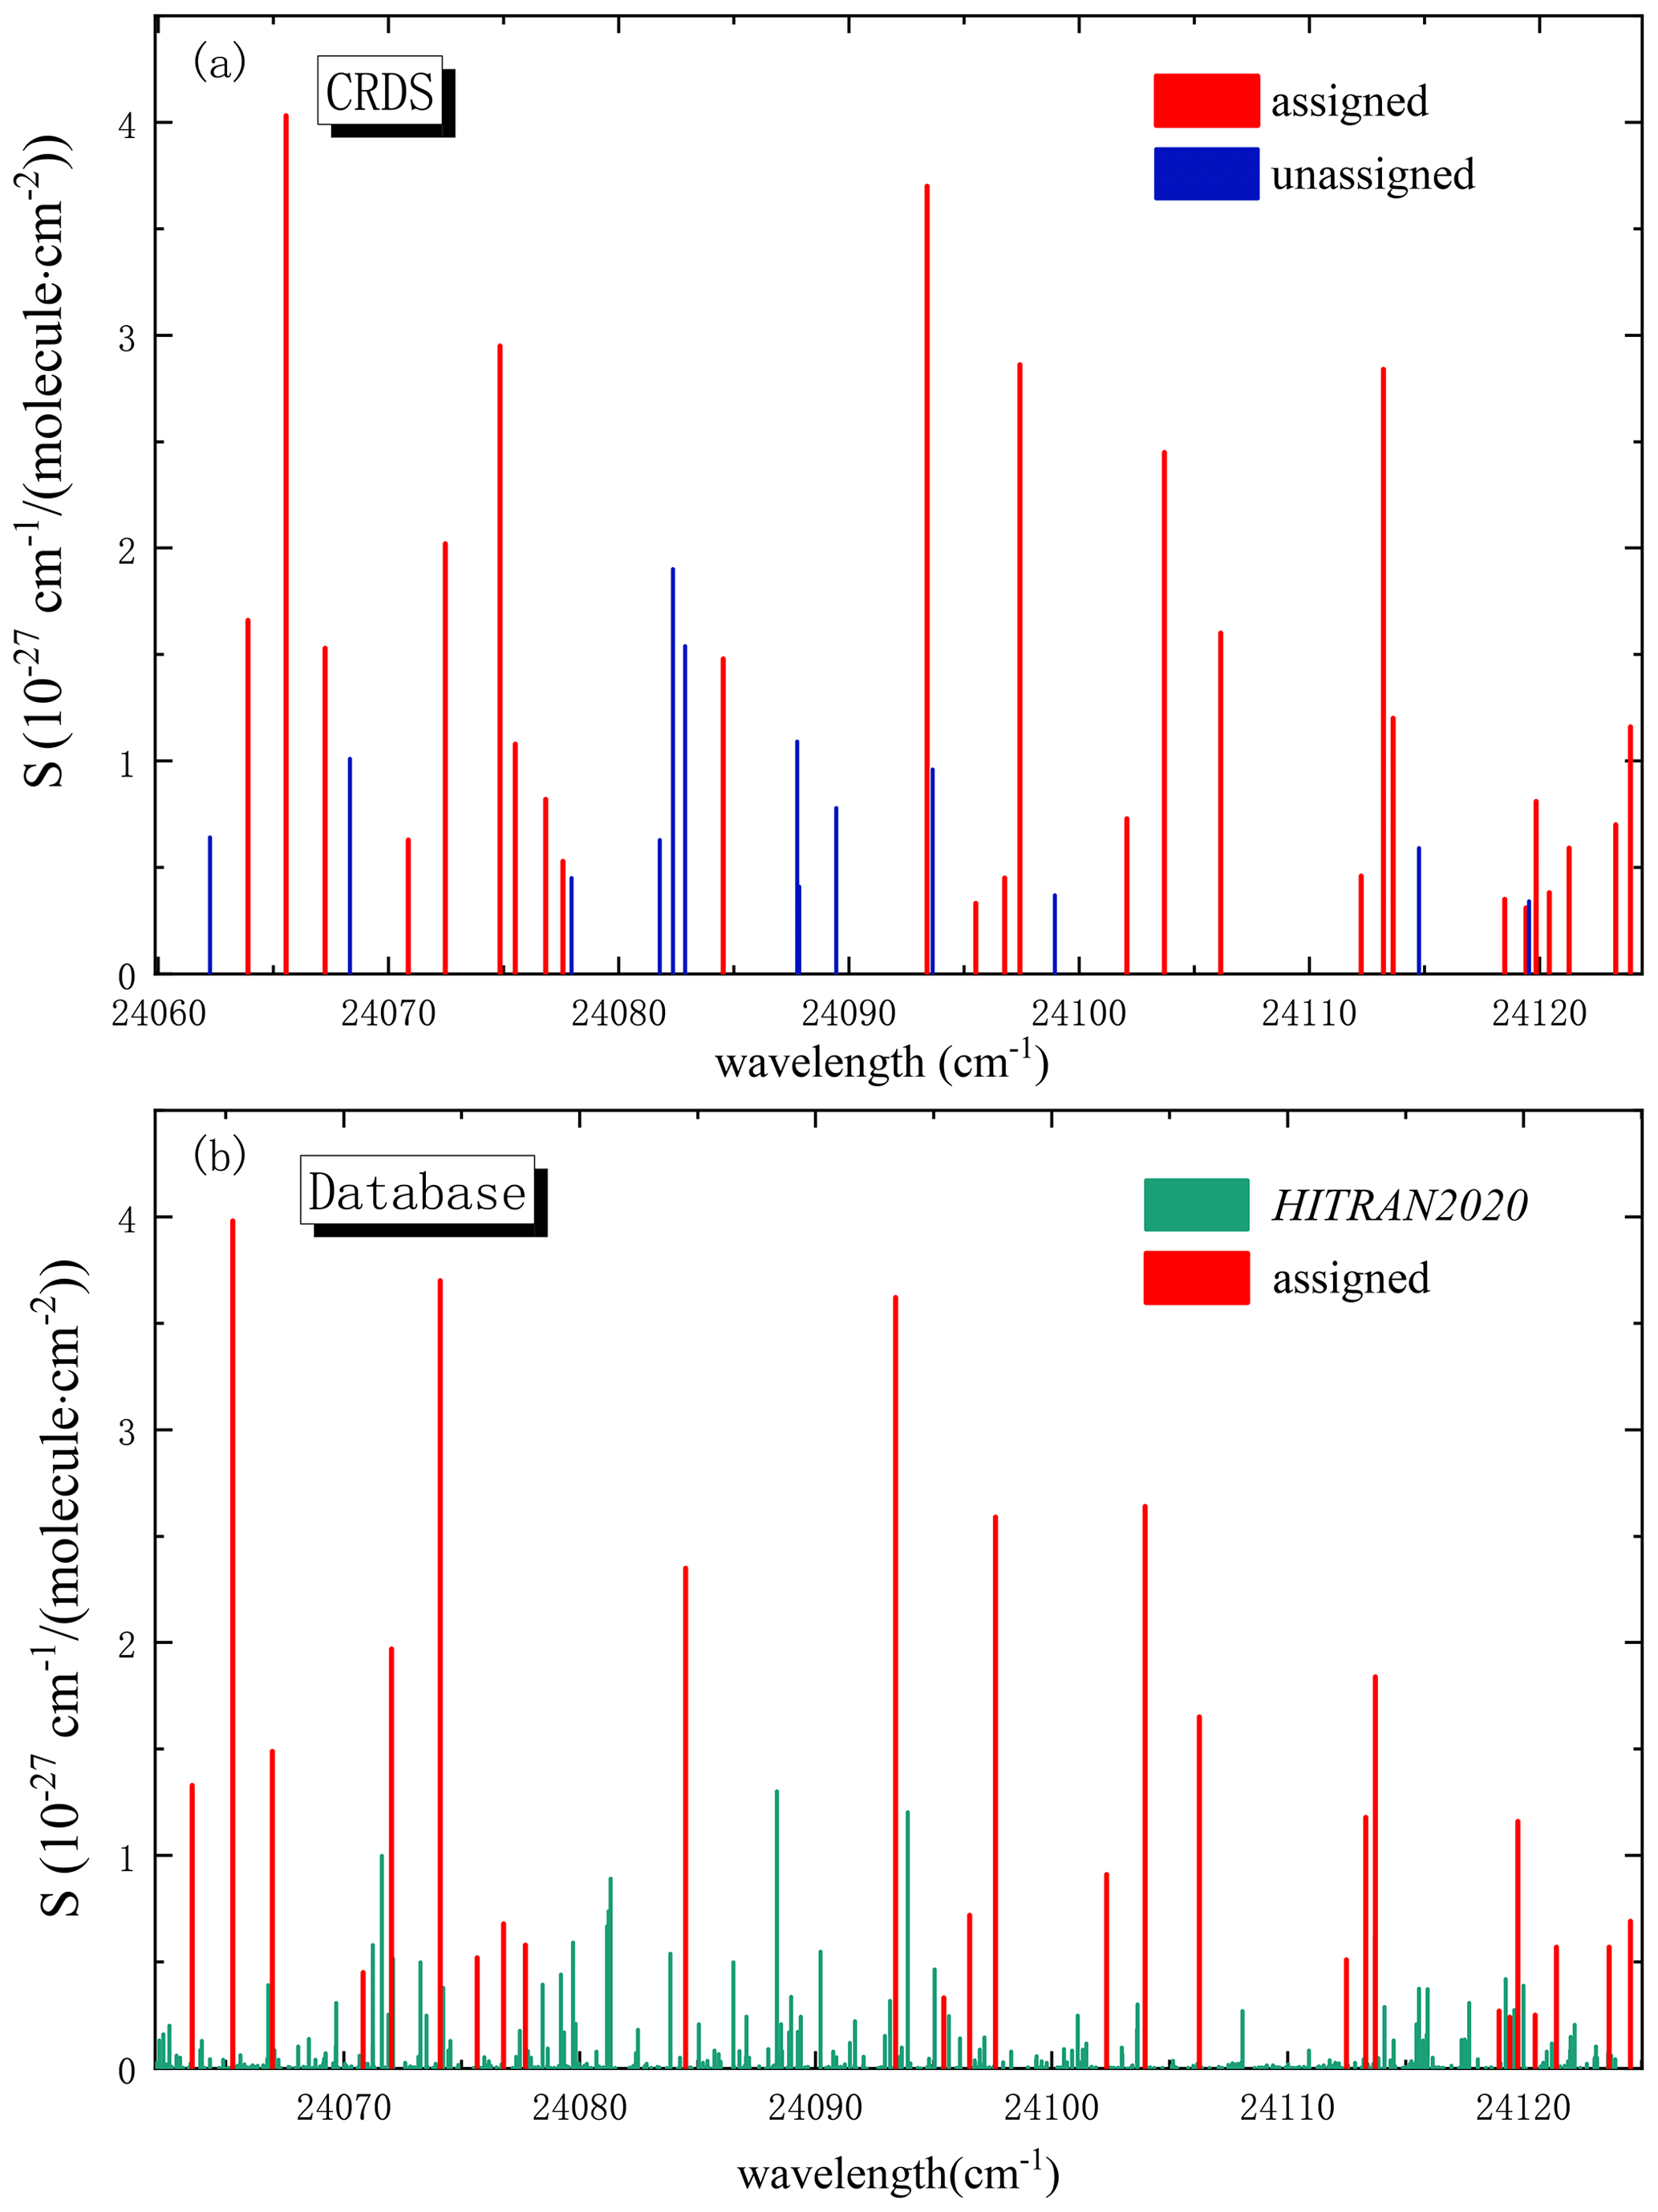
Figure 3(a) An overview of the observed transitions in this work, with red lines corresponding to the assigned transitions and blue lines corresponding to the unassigned transitions. Panel (b) shows the assigned transitions in the red lines of (a) from Gordon et al. (2022) (see also Table 1 for more details).
Conway et al. (2020) assigned part of their ab initio line list using the W2020 database of energy levels, but almost none of the transitions in this line list which are also within our region carry a full quantum assignment. These are defined as those transitions where upper and lower states carry both vibrational and rotational quantum labels. To address this, we attempt to predict the upper states' assignment by considering the already known energy levels in W2020, together with the rotational quanta of states that are available in the line list of Conway et al. (2020). The lower states are already assigned full vibrational and rotational quanta, so we only focus on the upper states.
To begin, we group together all states in W2020 that have the same vibrational quanta and supplement these vibrational groups with the predicted/calculated vibrational quantum labels of the vibrational band origins (total angular momentum of zero) given by Császár et al. (2010). We then separate these vibrational groups into two more internal groups, defined by their rotational parity, which can be ortho (triplet) or para (singlet). Finally, depending on the distribution, trajectory and quantity of the vibrational energy levels native to our ortho/para groups, we fit J+Ka against energy (cm−1) with either a 2- or 3-order polynomial, whichever gave the best fit. This was done as energy levels within a vibrational band and rotational parity typically vary smoothly. We know the upper-state rotational quanta and parity from the line list of Conway et al. (2020); hence we can use these fits to determine an approximate value of the vibrational assignment.
This procedure allows us to assign 27 new transitions, leaving 13 lines unassigned. The assigned lines are in good agreement with the predicted lines from the HITRAN database, also seen in Fig. 3b. In addition, the standard deviation of differences between observed and calculated line positions is around 0.27 cm−1, which is more than an order of magnitude larger than the experimental accuracy. No systematic shift between experimental and predicted line positions was observed, as can be seen in Fig. 3 and Table 1. This discrepancy is likely due to the matched line positions of Conway et al. (2020) being theoretical in origin. The observed line intensities differ from calculated values with a standard deviation of about 41 %.
A comparison of the simulated and measured spectra of water vapor is presented in Fig. 4. It indicates that there has been a significant improvement in this region for both line positions and intensities of HITRAN2020 compared with HITRAN2016. For instance, as shown in the zoomed-in plot of Fig. 4b and c, there are many transitions in HITRAN2016 around 24 070 cm−1, and the maximum line intensity is about cm molec.−1. However, they were not observed in our measurements, and only a few very weak lines, being close to our noise level, are given in HITRAN2020. There are still considerable deviations between the experimental spectrum and the HITRAN2020 simulation. For instance, as indicated by the green circle on Fig. 4b, the line at 24 065.5540 (22) cm−1 observed in this work corresponds to a line in HITRAN2020 with the position of 24 065.304405 cm−1 and a very close line intensity (see Table 1).
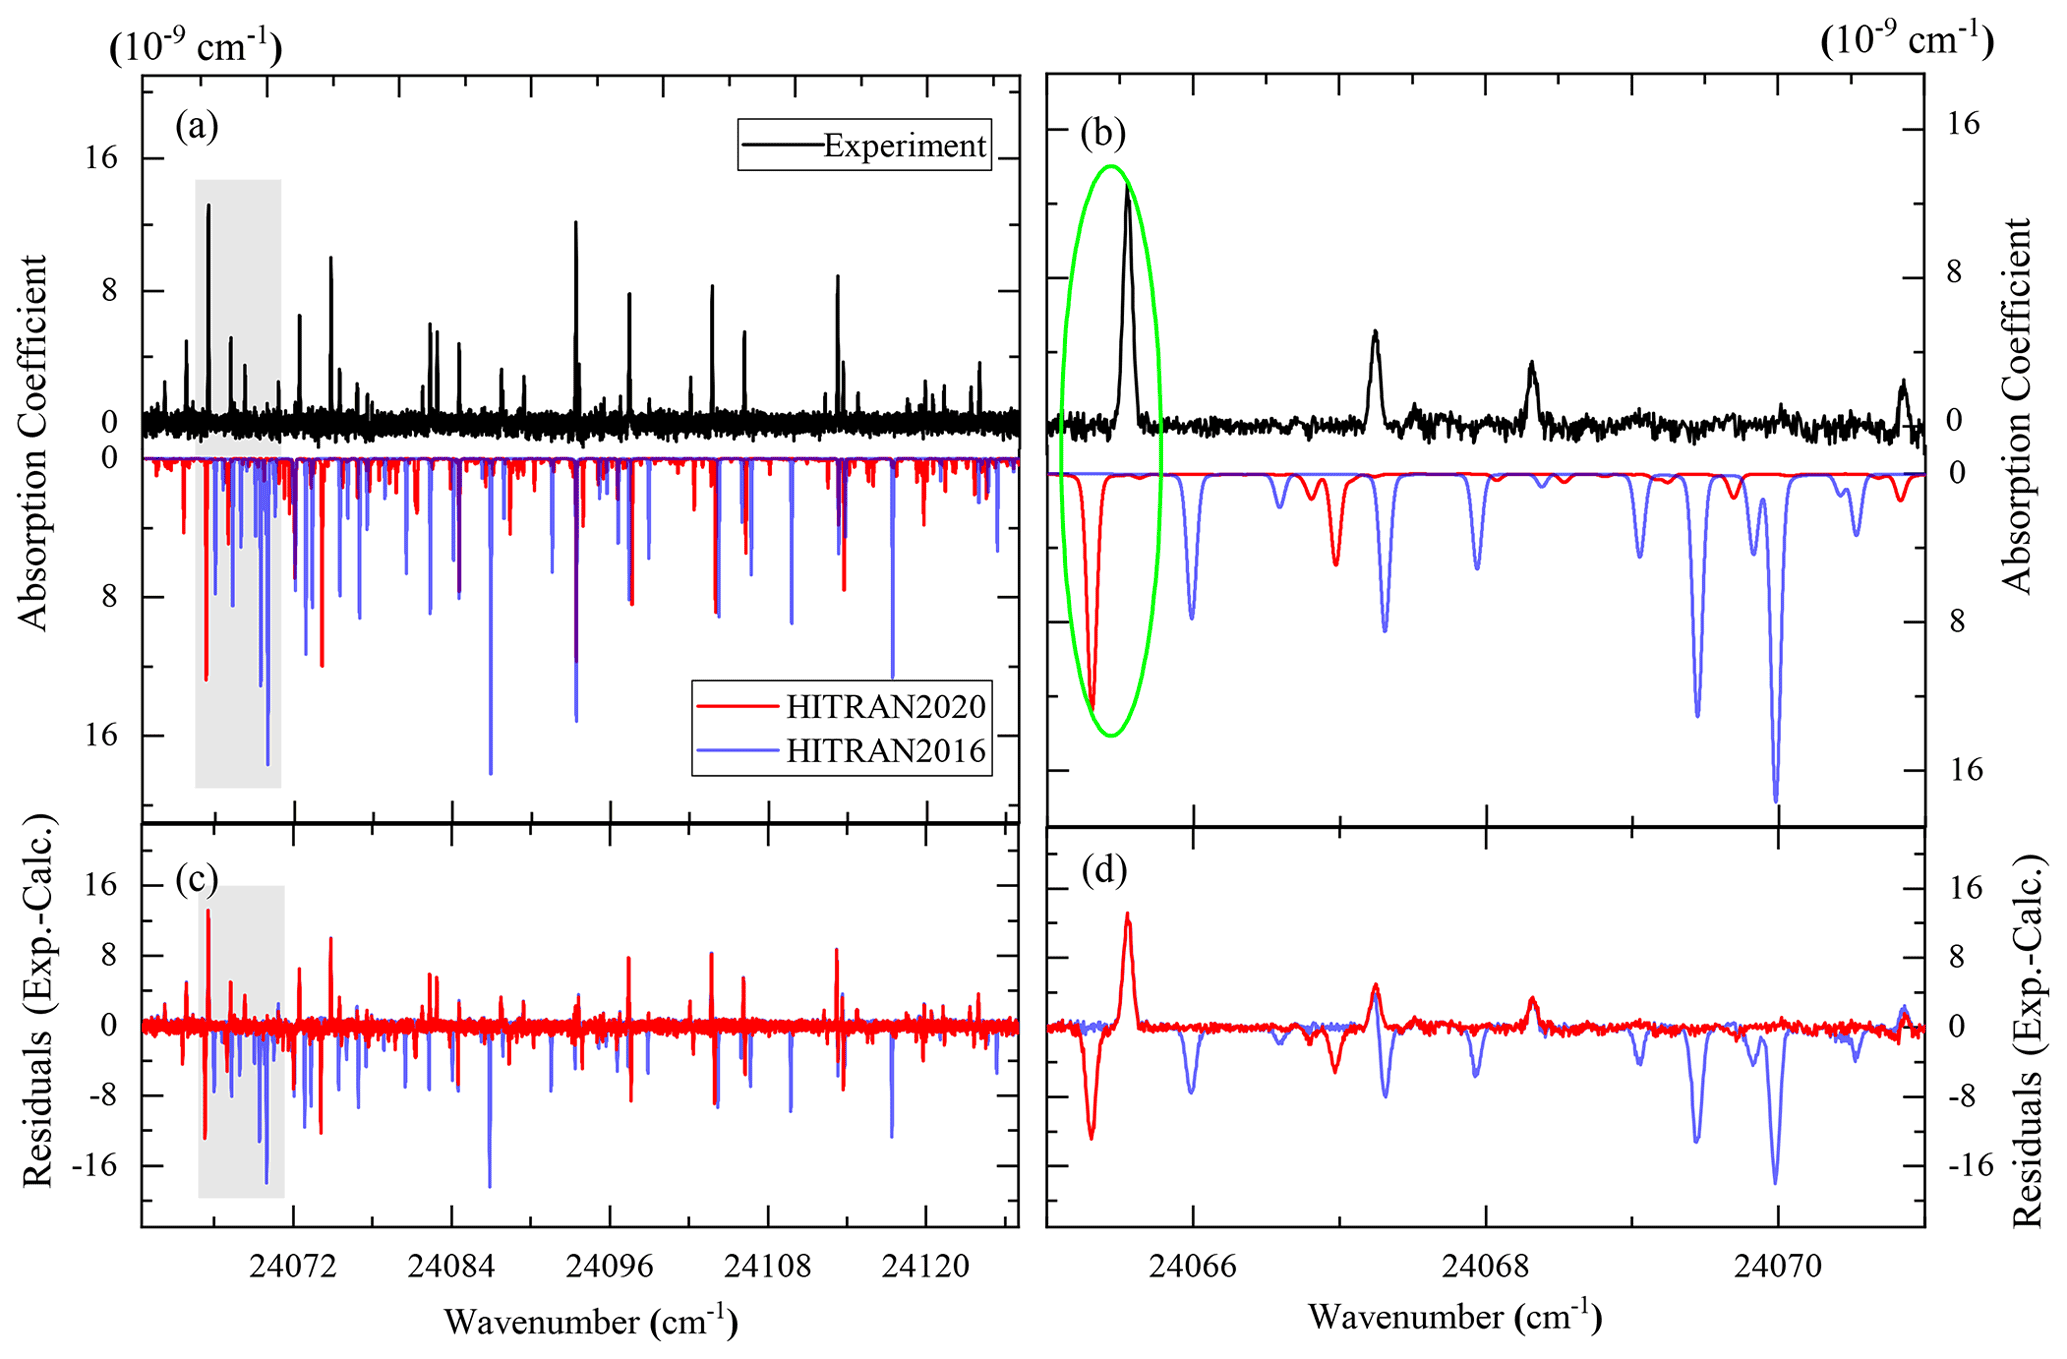
Figure 4(a) Recorded and simulated spectra with different versions of the HITRAN database (including HITRAN2016 and HITRAN2020) between 24 060 and 24 130 cm−1. Panel (b) shows the zoomed-in view presented in the grey shadow of (a). Panel (c) plots the residuals between the observed and calculated spectra. Panel (d) shows the zoomed-in view presented in the grey shadow of (c). The black line corresponds to the experimental recordings, while the red and blue lines correspond to the simulations from HITRAN2020 and HITRAN2016 (Gordon et al., 2017, 2022).
The discussion above gives us a general overview of the water vapor absorption in the deep-blue region, and the comparison with the HITRAN database demonstrates that the line list for water vapor in the UV region has been substantially improved in the latest version. In order to make a further comparison of the cross-sections against other experimental results, we generated the line-by-line list from the CRDS measurements of our work and Dupré et al. (2005), and compiled them with air-broadening coefficients (γair) from the HITRAN database. Water vapor cross-sections are then calculated through the HITRAN Application Programming Interface (HAPI; Kochanov et al., 2016), convoluted with a spectral resolution of 5 cm−1. A Voigt profile was used in the calculation of the cross-sections. The result is depicted in Fig. 5, together with calculations from the HITRAN2020 (Gordon et al., 2022) database in the range from 290 to 417 nm.

Figure 5(a) An overview of cross-sections for water vapor obtained in this work and those reported in previous works, including the measurements by Pei et al. (2019), Du et al. (2013) and Dupré et al. (2005) and the upper limits by Wilson et al. (2016) and Lampel et al. (2017), as well as the calculations from Gordon et al. (2022); the absorption cross-section around 362.3 nm (burgundy star) was also reported by Lampel et al. (2017) at a 0.5 nm resolution. (b) Zoomed-in plots for cross-sections determined in this work at 415 nm and those simulated from HITRAN2020. (c) Zoomed-in plots for cross-sections simulated from Dupré et al. (2005) and those from HITRAN2020. The simulated cross-sections plotted here are convoluted to a spectral resolution of 5 cm−1 (≈0.05 nm), except that results from Pei et al. (2019) are given in 1 nm step sizes and from Du et al. (2013) are given in 5 nm step sizes.
The CRDS data around 396 nm reported by Dupré et al. (2005) are also given in Fig. 5, as well as the cross-sections measured by Pei et al. (2019) and Du et al. (2013) in the range of 290–350 nm. Both Wilson et al. (2016) and Lampel et al. (2017) have placed upper limits of absorptions through different instrumental setups in this region, as displayed in Fig. 5.
The experimental cross-section data from this work and those from Dupré et al. (2005) agree well with the calculated cross-sections based on HITRAN2020 data, as shown in Fig. 5b and c. In addition, both CRDS results (this work and Dupré et al., 2005) fit in the upper limits given by Wilson et al. (2016). However, there are large discrepancies in the range of 290–350 nm if we compare the HITRAN2020 data with experimental results from Du et al. (2013) and Pei et al. (2019). The experimental results are more than 2 orders of magnitude higher than those given by the HITRAN database. And these results are also at least 10 times higher than the other two limits reported by Wilson et al. (2016) and Lampel et al. (2017). It is unlikely that the electronic state would affect the absorption in the 290–350 nm interval as described in Conway et al. (2020), since the nearest electronic state is far away from this region, confirmed by different experiments (Ranjan et al., 2020; Mota et al., 2005; Chung et al., 2001). At this wavelength it is unlikely to observe electronic transitions without a considerable population of highly excited vibration states, which is not achievable at atmospheric temperatures. Hence we suggest that further investigation of the water vapor absorption in the near-UV region is needed. Our measurement, as well as other experimental results, has confirmed that water vapor absorption is very unlikely to affect the atmospheric retrievals for monitoring O3, SO2 and NO2 (Yin et al., 2021) and DOAS measurements of O4, HONO and OClO (Lampel et al., 2017) at the current absorption sensitivities of atmospheric instrumentation.
In summary, we built a continuous-wave cavity ring-down spectroscopic setup and recorded the absorption spectra of water vapor in the deep-blue region surrounding 415 nm. With a minimum detectable limit of cm−1, 40 water vapor transitions have been observed around 415 nm, with line intensities as low as cm molec.−1. Assignments of the experimental data were conducted based on the ab initio calculation from Conway et al. (2020). To the best of our knowledge, these absorption lines were never experimentally verified before, and 27 of them were assigned belonging to the (224), (205), (710), (304), (093), (125) and (531) vibrational bands of HO. The experimental line list is summarized in Table 1 with natural isotopic abundances. The accuracy of line positions determined in this work is about 60 MHz, and relative uncertainties of line intensities vary from 5 %–10 % and 10 %–30 % to >40 %, depending on the line strengths. The recorded absorption spectra exhibit better agreement with calculations from HITRAN2020 than those from HITRAN2016. The results of this work will help improve the corresponding line positions in the HITRAN database, as well as a global network of water vapor energy levels in the next iteration of the W2020 database. Moreover, it will help empirical adjustments of future ab initio PES. Indeed, as explained in Conway et al. (2020), points obtained from the first principles are fit together with the empirically derived energy levels to an analytical function. That function is then used for calculating the line list. Since no energy levels were available in this region, it impacted the quality of the predicted line positions. Therefore, including the energy levels derived from our work will most certainly improve the predictive abilities of the semi-empirical PES. Adding air-broadening coefficients (γair) from the HITRAN database to the line parameters measured in this work, we produced the cross-sections of water vapor, which is up to cm2 molec.−1 at a resolution of 0.05 nm. Comparisons are made against several experimental results of cross-sections in the near-UV region. The HITRAN2020 cross-sections are in good agreement with our results and those reported in the previous works of Dupré et al. (2005) and Wilson et al. (2016). Although we did not measure in the wavelength intervals covered by the experiments of Du et al. (2013) and Pei et al. (2019), our measurements are within the upper detection limits from other experiment that overlap ours and the wavelength region of Du et al. (2013) and Pei et al. (2019). Therefore, our results support the findings of Wilson et al. (2016) that measurements reported in Du et al. (2013) and Pei et al. (2019) appear to be overestimated. Additional laboratory and atmospheric measurements in the 300–350 nm spectral region, as well as theoretical calculations that will address the potential intensity borrowing between electronic transitions of water vapor, can further help resolve the discrepancies.
All data relevant to this study are available from the corresponding author upon reasonable request.
QYY and HL built the experimental setup and performed the experiments and spectral fitting procedure, EKC constructed and described the assignment. IEG contributed the discussion of cross-sections with perspective of the HITRAN database. YT and SMH contributed to all the work in this paper and wrote most of it. All authors reviewed this paper and provided many corrections and suggestions.
The contact author has declared that none of the authors has any competing interests.
Publisher’s note: Copernicus Publications remains neutral with regard to jurisdictional claims in published maps and institutional affiliations.
This article is part of the special issue “Analysis of atmospheric water vapour observations and their uncertainties for climate applications (ACP/AMT/ESSD/HESS inter-journal SI)”. It is not associated with a conference.
The authors would like to thank An-Wen Liu, Cun-Feng Cheng, Yu Robert Sun and Jin Wang from USTC, for providing helpful conversations and suggestions during the experimental setup building procedure and experiments performing procedure. Finally, the authors acknowledge the anonymous reviewers, for their extremely thorough comments on the paper.
This research has been supported by the National Natural Science Foundation of China (grant nos. 41905018, 21903080 and 21688102) and the Bureau of Development and Planning, Chinese Academy of Sciences (grant no. XDC07010000).
This paper was edited by Thomas F. Hanisco and reviewed by two anonymous referees.
Bernath, P. F., Brown, L. R., Campargue, A., Császár, A. G., Daumont, L., Gamache, R. R., Hodges, J. T., Naumenko, O. V., Polyansky, O. L., Rothman, L. S., Toth, R. A., Vandaele, A. C., Zobov, N. F., Fally, S., Fazliev, A. Z., Furtenbacher, T., Gordon, I. E., Hu, S.-M., Mikhailenko, S. N., and Voronin, B. A.: IUPAC critical evaluation of the rotational–vibrational spectra of water vapor. Part II: Energy levels and transition wavenumbers for HD16O, HD17O, and HD18O, J. Quant. Spectrosc. Ra., 111, 2160–2184, https://doi.org/10.1016/J.JQSRT.2010.06.012, 2010. a
Callegari, A., Theulé, P., Muenter, J. S., Tolchenov, R. N., Zobov, N. F., Polyansky, O. L., Tennyson, J., and Rizzo, T. R.: Dipole moments of highly vibrationally excited water, Science, 297, 993–995, https://doi.org/10.1126/science.1073731, 2002. a
Carleer, M., Jenouvrier, A., Vandaele, A.-C., Bernath, P. F., Mérienne, M. F., Colin, R., Zobov, N. F., Polyansky, O. L., Tennyson, J., and Savin, V. A.: The near infrared, visible, and near ultraviolet overtone spectrum of water, J. Chem. Phys., 111, 2444–2450, https://doi.org/10.1063/1.479859, 1999. a
Chance, K.: Ultraviolet and visible spectroscopy and spaceborne remote sensing of the Earth's atmosphere, C. R. Phys., 6, 836–847, https://doi.org/10.1016/j.crhy.2005.07.010, 2005. a, b
Chung, C.-Y., Chew, E. P., Cheng, B.-M., Bahou, M., and Lee, Y.-P.: Temperature dependence of absorption cross-section of H2O, HOD, and D2O in the spectral region 140–193 nm, Nucl. Instrum. Methods Phys. Res. A, 467–468, 1572–1576, https://doi.org/10.1016/S0168-9002(01)00762-8, 2001. a
Coheur, P. F., Fally, S., Carleer, M., Clerbaux, C., Colin, R., Jenouvrier, A., Mérienne, M. F., Hermans, C., and Vandaele, A. C.: New water vapor line parameters in the 26000-13000 cm−1 region, J. Quant. Spectrosc. Ra., 74, 493–510, https://doi.org/10.1016/S0022-4073(01)00269-2, 2002. a
Coheur, P. F., Clerbaux, C., Carleer, M., Fally, S., Hurtmans, D., Colin, R., Hermans, C., Vandaele, A. C., Barret, B., De Mazière, M., and De Backer, H.: Retrieval of atmospheric water vapor columns from FT visible solar absorption spectra and evaluation of spectroscopic databases, J. Quant. Spectrosc. Ra., 82, 133–150, https://doi.org/10.1016/S0022-4073(03)00150-X, 2003. a
Conway, E. K., Gordon, I. E., Tennyson, J., Polyansky, O. L., Yurchenko, S. N., and Chance, K.: A semi-empirical potential energy surface and line list for H216O extending into the near-ultraviolet, Atmos. Chem. Phys., 20, 10015–10027, https://doi.org/10.5194/acp-20-10015-2020, 2020. a, b, c, d, e, f, g, h, i, j, k, l
Császár, A. G., Mátyus, E., Szidarovszky, T., Lodi, L., Zobov, N. F., Shirin, S. V., Polyansky, O. L., and Tennyson, J.: First-principles prediction and partial characterization of the vibrational states of water up to dissociation, J. Quant. Spectrosc. Ra., 111, 1043–1064, https://doi.org/10.1016/j.jqsrt.2010.02.009, 2010. a
Du, J., Huang, L., Min, Q., and Zhu, L.: The influence of water vapor absorption in the 290–350 nm region on solar radiance: Laboratory studies and model simulation, Geophys. Res. Lett., 40, 4788–4792, https://doi.org/10.1002/grl.50935, 2013. a, b, c, d, e, f, g, h, i, j, k
Dupré, P., Gherman, T., Zobov, N. F., Tolchenov, R. N., and Tennyson, J.: Continuous-wave cavity ringdown spectroscopy of the 8ν polyad of water in the 25195–25340 cm−1 range, J. Chem. Phys., 123, 154307, https://doi.org/10.1063/1.2055247, 2005. a, b, c, d, e, f, g, h
Fally, S., Coheur, P. F., Carleer, M., Clerbaux, C., Colin, R., Jenouvrier, A., Mérienne, M. F., Hermans, C., and Vandaele, A. C.: Water vapor line broadening and shifting by air in the 26 000–13 000 cm−1 region, J. Quant. Spectrosc. Ra., 82, 119–131, https://doi.org/10.1016/S0022-4073(03)00149-3, 2003. a
Finkenzeller, H. and Volkamer, R.: O2–O2 CIA in the gas phase: Cross-section of weak bands, and continuum absorption between 297–500 nm, J. Quant. Spectrosc. Ra., 279, 108063, https://doi.org/10.1016/j.jqsrt.2021.108063, 2022. a
Furtenbacher, T., Tóbiás, R., Tennyson, J., Polyansky, O. L., and Császár, A. G.: W2020: A Database of Validated Rovibrational Experimental Transitions and Empirical Energy Levels of HO, J. Phys. Chem. Ref. Data, 49, 033101, https://doi.org/10.1063/5.0008253, 2020. a
Gordon, I. E., Rothman, L., Hill, C., Kochanov, R., Tan, Y., Bernath, P. F., Birk, M., Boudon, V., Campargue, A., Chance, K., Drouin, B., Flaud, J.-M., Gamache, R., Hodges, J., Jacquemart, D., Perevalov, V., Perrin, A., Shine, K., Smith, M.-A., Tennyson, J., Toon, G., Tran, H., Tyuterev, V., Barbe, A., Császár, A., Devi, V., Furtenbacher, T., Harrison, J., Hartmann, J.-M., Jolly, A., Johnson, T., Karman, T., Kleiner, I., Kyuberis, A., Loos, J., Lyulin, O., Massie, S., Mikhailenko, S., Moazzen-Ahmadi, N., Müller, H., Naumenko, O., Nikitin, A., Polyansky, O., Rey, M., Rotger, M., Sharpe, S., Sung, K., Starikova, E., Tashkun, S., Auwera, J. V., Wagner, G., Wilzewski, J., Wcisło, P., Yu, S., and Zak, E.: The HITRAN2016 molecular spectroscopic database, J. Quant. Spectrosc. Ra., 203, 3–69, https://doi.org/10.1016/j.jqsrt.2017.06.038, 2017. a, b, c
Gordon, I. E., Rothman, L. S., Hargreaves, R. J., Hashemi, R., Karlovets, E. V., Skinner, F. M., Conway, E. K., Hill, C., Kochanov, R. V., Tan, Y., Wcisło, P., Finenko, A. A., Nelson, K., Bernath, P. F., Birk, M., Boudon, V., Campargue, A., Chance, K. V., Coustenis, A., Drouin, B. J., Flaud, J. M., Gamache, R. R., Hodges, J. T., Jacquemart, D., Mlawer, E. J., Nikitin, A. V., Perevalov, V. I., Rotger, M., Tennyson, J., Toon, G. C., Tran, H. L., Tyuterev, V. G., Adkins, E. M., Baker, A., Barbe, A., Canè, E., Császár, A. G., Dudaryonok, A., Egorov, O., Fleisher, A. J., Fleurbaey, H., Foltynowicz, A. A., Furtenbacher, T., Harrison, J. J. B., Hartmann, J. M., Horneman, V. M. E., Huang, X. F., Karman, T., Karns, J., Kassi, S., Kleiner, I. M., Kofman, V. R., M, F. K. T., Lavrentieva, N. N., Lee, T. J. G., Long, D. A., Lukashevskaya, A. A., Lyulin, O. M., N, V. Y. M., Matt, W., Massie, S. T. H., Melosso, M., Mikhailenko, S. N., Mondelain, D., Müller, H. S. P. I., Naumenko, O. V., Perrin, A. L., Polyansky, O. L., Raddaoui, E., Raston, P. L. J., Reed, Z. D., Rey, M., Richard, C., Tóbiás, R., Sadiek, I. A., Schwenke, D. W. G., Starikova, E., Sung, K., Tamassia, F., Tashkun, S. A., P, J. V. A., Vasilenko, I. A., and Vigasin, A. A. Q.: The HITRAN2020 molecular spectroscopic database, J. Quant. Spectrosc. Ra., 277, 107949, https://doi.org/10.1016/j.jqsrt.2021.107949, 2022. a, b, c, d, e, f
Kochanov, R. V., Gordon, I. E., Rothman, L. S., Wcisło, P., Hill, C., and Wilzewski, J. S.: HITRAN Application Programming Interface (HAPI): a comprehensive approach to working with spectroscopic data, J. Quant. Spectrosc. Ra., 177, 15–30, https://doi.org/10.1016/j.jqsrt.2016.03.005, 2016. a
Lampel, J., Pöhler, D., Tschritter, J., Frieß, U., and Platt, U.: On the relative absorption strengths of water vapour in the blue wavelength range, Atmos. Meas. Tech., 8, 4329–4346, https://doi.org/10.5194/amt-8-4329-2015, 2015. a, b, c
Lampel, J., Pöhler, D., Polyansky, O. L., Kyuberis, A. A., Zobov, N. F., Tennyson, J., Lodi, L., Frieß, U., Wang, Y., Beirle, S., Platt, U., and Wagner, T.: Detection of water vapour absorption around 363 nm in measured atmospheric absorption spectra and its effect on DOAS evaluations, Atmos. Chem. Phys., 17, 1271–1295, https://doi.org/10.5194/acp-17-1271-2017, 2017. a, b, c, d, e, f, g, h, i
Learner, R. C. M., Zhong, W., Haigh, J. D., Belmiloud, D., and Clarke, J.: The contribution of unknown weak water vapor lines to the absorption of solar radiation, Geophys. Res. Lett., 26, 3609–3612, https://doi.org/10.1029/1999GL003681, 1999. a
Mota, R., Parafita, R., Giuliani, A., Hubin-Franskin, M.-J., Lourenço, J., Garcia, G., Hoffmann, S., Mason, N., Ribeiro, P., Raposo, M., and Limão-Vieira, P.: Water VUV electronic state spectroscopy by synchrotron radiation, Chem. Phys. Lett., 416, 152–159, https://doi.org/10.1016/j.cplett.2005.09.073, 2005. a
Orphal, J. and Chance, K.: Ultraviolet and visible absorption cross-sections for HITRAN, J. Quant. Spectrosc. Ra., 82, 491–504, https://doi.org/10.1016/S0022-4073(03)00173-0, 2003. a, b
Pei, L., Min, Q., Du, Y., Wang, Z., Yin, B., Yang, K., Disterhoft, P., Pongetti, T., and Zhu, L.: Water Vapor Near‐UV Absorption: Laboratory Spectrum, Field Evidence, and Atmospheric Impacts, J. Geophys. Res.-Atmos., 124, 14310–14324, https://doi.org/10.1029/2019JD030724, 2019. a, b, c, d, e, f, g, h, i, j, k, l
Polyansky, O. L., Kyuberis, A. A., Zobov, N. F., Tennyson, J., Yurchenko, S. N., and Lodi, L.: ExoMol molecular line lists XXX: a complete high-accuracy line list for water, Mon. Not. R. Astron. Soc., 480, 2597–2608, https://doi.org/10.1093/mnras/sty1877, 2018. a
Ranjan, S., Schwieterman, E. W., Harman, C., Fateev, A., Sousa-Silva, C., Seager, S., and Hu, R.: Photochemistry of Anoxic Abiotic Habitable Planet Atmospheres: Impact of New H2O Cross Sections, Astrophys. J., 896, 148, https://doi.org/10.3847/1538-4357/ab9363, 2020. a
Rothman, L., Gordon, I., Barber, R., Dothe, H., Gamache, R., Goldman, A., Perevalov, V., Tashkun, S., and Tennyson, J.: HITEMP, the high-temperature molecular spectroscopic database, J. Quant. Spectrosc. Ra., 111, 2139–2150, https://doi.org/10.1016/j.jqsrt.2010.05.001, 2010. a
Tennyson, J., Bernath, P. F., Brown, L. R., Campargue, A., Carleer, M. R., Császár, A. G., Gamache, R. R., Hodges, J. T., Jenouvrier, A., Naumenko, O. V., Polyansky, O. L., Rothman, L. S., Toth, R. A., Vandaele, A. C., Zobov, N. F., Daumont, L., Fazliev, A. Z., Furtenbacher, T., Gordon, I. E., Mikhailenko, S. N., and Shirin, S. V.: IUPAC critical evaluation of the rotational–vibrational spectra of water vapor. Part I–Energy levels and transition wavenumbers for HO and HO, J. Quant. Spectrosc. Ra., 110, 573–596, https://doi.org/10.1016/j.jqsrt.2009.02.014, 2009. a
Tennyson, J., Bernath, P. F., Brown, L. R., Campargue, A., Császár, A. G., Daumont, L., Gamache, R. R., Hodges, J. T., Naumenko, O. V., Polyansky, O. L., Rothman, L. S., Vandaele, A. C., Zobov, N. F., Al Derzi, A. R., Fábri, C., Fazliev, A. Z., Furtenbacher, T., Gordon, I. E., Lodi, L., and Mizus, I. I.: IUPAC critical evaluation of the rotational–vibrational spectra of water vapor, Part III: Energy levels and transition wavenumbers for HO, J. Quant. Spectrosc. Ra., 117, 29–58, https://doi.org/10.1016/j.jqsrt.2012.10.002, 2013. a, b
Tennyson, J., Yurchenko, S. N., Al-Refaie, A. F., Barton, E. J., Chubb, K. L., Coles, P. A., Diamantopoulou, S., Gorman, M. N., Hill, C., Lam, A. Z., Lodi, L., McKemmish, L. K., Na, Y., Owens, A., Polyansky, O. L., Rivlin, T., Sousa-Silva, C., Underwood, D. S., Yachmenev, A., and Zak, E.: The ExoMol database: Molecular line lists for exoplanet and other hot atmospheres, J. Mol. Spectrosc., 327, 73–94, https://doi.org/10.1016/j.jms.2016.05.002, 2016. a, b
Tolchenov, R. N., Naumenko, O., Zobov, N. F., Shirin, S. V., Polyansky, O. L., Tennyson, J., Carleer, M., Coheur, P.-F., Fally, S., Jenouvrier, A., and Vandaele, A. C.: Water vapour line assignments in the 9250–26000 cm−1 frequency range, J. Mol. Spectrosc., 233, 68–76, https://doi.org/10.1016/J.JMS.2005.05.015, 2005. a
Wilson, E. M., Wenger, J. C., and Venables, D. S.: Upper limits for absorption by water vapor in the near-UV, J. Quant. Spectrosc. Ra., 170, 194–199, https://doi.org/10.1016/j.jqsrt.2015.11.015, 2016. a, b, c, d, e, f, g, h
Yin, B., Min, Q., Berndt, J., Harrison, L., and Zhu, L.: A High Resolution Ultraviolet Spectroradiometer and its Application in Solar Radiation Measurement, J. Geophys. Res.-Atmos., 126, 1–19, https://doi.org/10.1029/2020JD032829, 2021. a, b, c, d