the Creative Commons Attribution 4.0 License.
the Creative Commons Attribution 4.0 License.
 | 16 Aug 2022
Modelling ultrafine particle growth in a flow tube reactor
Michael S. Taylor Jr.
Devon N. Higgins
Flow tube reactors are often used to study aerosol kinetics. The goal of this study is to investigate how to best represent complex growth kinetics of ultrafine particles within a flow tube reactor when the chemical processes causing particle growth are unknown. In a typical flow tube experiment, one measures the inlet and outlet particle size distributions to give a time-averaged measure of growth, which may be difficult to interpret if the growth kinetics change as particles transit through the flow tube. In this work, we simulate particle growth for secondary organic aerosol (SOA) formation that incorporates both surface- and volume-limited chemical processes to illustrate how complex growth kinetics inside a flow tube can arise. We then develop and assess a method to account for complex growth kinetics when the chemical processes driving the kinetics are not known. Diameter growth of particles is represented by a growth factor (GF), defined as the fraction of products from oxidation of the volatile organic compound (VOC) precursors that grow particles during a specific time period. Defined in this way, GF is the sum of all non-volatile products that condensationally grow particles plus a portion of semi-volatile molecules that react on or in the particle to give non-volatile products that remain in the particle over the investigated time frame. With respect to flow tube measurements, GF is independent of wall loss and condensation sink, which influence particle growth kinetics and can vary from experiment to experiment. GF is shown to change as a function of time within the flow tube and is sensitive to factors that affect growth such as gas-phase mixing ratios of the precursors and the presence of aerosol liquid water (ALW) on the surface or in the volume of the particle. A method to calculate GF from the outlet-minus-inlet particle diameter change in a flow tube experiment is presented and shown to accurately match GFs from simulations of SOA formation.
- Article
(1693 KB) - Full-text XML
- BibTeX
- EndNote


Atmospheric aerosols have significant effects on human health and the environment, from the direct inhalation of air into our lungs to the changing composition of the atmosphere (Najjar, 2011; Thompson, 2018). Particulate matter in the atmosphere has been a focus of attention since the London Smog incident and similar events of the mid-twentieth century (Bell et al., 2004). Both anthropogenic and biogenic emissions are major sources of new particle formation, whether it be through primary particle emissions or secondary formation (Després et al., 2012; Lehtipalo et al., 2018). Clusters of ambient molecules, such as ammonia, sulfuric acid, and organics with low volatility, are often sources for new particles in the 1 to 2 nm size range that are capable of spontaneously growing to larger sizes (Shrivastava et al., 2017). Once particles grow to the size range of 50–100 nm, they can act as cloud condensation nuclei (CCN), which are capable of affecting radiative forcing on the Earth (Johnson et al., 2018; Riipinen et al., 2011). Due to the many growth and removal processes involved in atmospheric particle growth, the likelihood of a nucleated particle reaching the CCN-active range can vary greatly. Simulations of these processes may contain large uncertainties with respect to secondary organic aerosol (SOA) formed from biogenic emissions and the varying properties of organic aerosols in general (Pierce and Adams, 2007). In the work presented here, we explore fundamental aspects of using a flow tube to characterize particle growth by SOA formation in a size range relevant to CCN activity.
SOA formation occurs when a volatile organic compound (VOC) is oxidized in the gas phase. There is usually a wide range of oxidation products from a given VOC precursor, and these products can be classified by their volatility, a measure of the product molecule's ability to partition between the gas and particle phases or condense from the gas phase to particle phase (Bianchi et al., 2019). Low-volatility and extremely low-volatility organic compounds (LVOCs and ELVOCs) are able to condensationally grow particles, with LVOCs being limited by the Kelvin effect in small particles (<20 nm). Semi-volatile organic compounds (SVOCs) are products with somewhat higher volatility, allowing them to partition between the gas and particle phases. Oxidized volatile organic compounds (OVOCs) are products too volatile to partition to the particles, though they remain available to participate in subsequent gas-phase reactions. SVOCs and possibly OVOCs may significantly contribute to particle growth if they undergo multiphase reactions on the particle surface or within the particle volume to produce non-volatile products that remain on or in the particle (Fuzzi et al., 2006; Gkatzelis et al., 2018).
SOA produced by the oxidation of biogenic VOCs significantly contributes to fine particulate matter in the atmosphere (Jimenez et al., 2009). The molecular composition of biogenic SOA encompasses several hundreds to thousands of potential products that can be formed through various pathways, making its inclusion in atmospheric models complex (Hallquist et al., 2009). Molecular analysis of biogenic SOA has shown evidence of particle-phase chemistry through detection of oligomers formed by accretion reactions, which may enhance the uptake of organic matter into a particle over what would be present from partitioning alone (Barsanti and Pankow, 2006; Tolocka et al., 2004a). The reactivity of VOC oxidation products can vary significantly owing largely to the presence of multiple functional groups (Jia and Xu, 2020; Zhou et al., 2018). For the oxidation of monoterpenes specifically, highly reactive hydroperoxide functionalities have been found on up to 50 % of product molecules (Docherty et al., 2005; Mertes et al., 2012), which are thought to be formed by an autooxidation mechanism (Bianchi et al., 2019; Crounse et al., 2013). Environmental factors such as relative humidity and temperature affect oxidation product formation, especially with respect to product molecule reactivity and volatility, while particle composition and phase state affect the multiphase processes these products may undergo (Zhang et al., 2015). By studying these processes and properties, one is able to more accurately define and understand the life cycle and effects of SOA in climate cycles (Saha and Grieshop, 2016; Shrivastava et al., 2017).
The complexity of SOA chemistry as discussed above poses a challenge for studying particle growth with a flow tube reactor. In a flow tube experiment, seed particles and SOA precursors (VOCs and oxidants) are mixed at the entrance of the flow tube, and the particle size distribution of aerosol at the exit is measured (Krasnomowitz et al., 2019; Stangl et al., 2019). This setup is well-suited for measuring particle growth rates since the inlet size distribution, outlet size distribution, and time difference between the two are all well-known. However, a challenge arises since the growth rate changes as a function of time in the reactor. This time-dependent change is driven by two main processes. First, VOCs and oxidants continue to react as aerosol moves through the flow tube, causing the mixing ratios of oxidation products that are able to grow particles to increase with increasing residence time. Fortunately, this effect is readily accounted for if the second-order rate constant for the VOC–oxidant reaction is known (Krasnomowitz et al., 2019). Second, the relative rates of the various chemical processes that grow particles can change with increasing precursor mixing ratio and/or particle size (Apsokardu and Johnston, 2018). Accounting for these changes is much more difficult since reaction pathways, rate constants, and physicochemical properties that affect these processes are not fully understood – and lead to uncertainty in predicting ambient levels of SOA (Zhu and Penner, 2019). Because of the complex time dependence of particle growth in a flow tube as well as the impacts of wall loss and condensation sink, simply reporting the growth rate (diameter increase per unit time) based on inlet–outlet size distributions and flow tube residence time is insufficient for predicting growth in other laboratory experiments. The goal of this study is to provide a framework for interpreting flow tube data that gives predictive capability.
Toward this end, we introduce the term “growth factor” (GF) as a way of expressing how SOA formation causes diameter growth of ultrafine particles. GF is defined as the fraction of VOC oxidation products able to enter the particle phase and stay there over the investigated time frame, causing the particle to grow. Defined in this way, GF represents the net uptake of product molecules from the gas phase to the particle referenced to the number of VOC molecules that were oxidized, and its time dependence accounts for the complexities of particle growth in the flow tube. First, we simulate particle growth using a basic SOA formation model that incorporates both surface- and volume-limited growth pathways. We use these simulations to illustrate complex growth kinetics that arise and how they are represented by the time dependence of GF. The simulation also illustrates differences in growth that would be encountered under typical ambient and flow tube conditions, including the sensitivity of GF to precursor gas-phase mixing ratios and the presence of aerosol liquid water (ALW). Finally, we show how GF can be estimated directly from flow tube data (inlet–outlet size distribution, residence time, initial VOC, and oxidant mixing ratios). For the SOA simulations described above, we compare the estimated GF to the range of GFs actually inside the flow tube. The estimation method is shown to be a robust way of representing complex growth kinetics from a flow tube experiment, without requiring prior knowledge of the specific chemical processes involved in SOA formation.
Since we cannot directly measure particle size distributions at various locations inside the flow tube, particle growth must be simulated. The simulation described below contains four key elements: gas-phase kinetics (generation of molecular species capable of growing particles), a range of gas-phase mixing ratios (facilitates comparison of growth kinetics under atmospheric vs. flow tube conditions), aerosol growth kinetics (uptake mechanisms of gas-phase molecules on and/or into the particle), and physicochemical processes and parameters typical of biogenic SOA formation. Gas-phase kinetics in the simulation account for the mixing of the VOC and oxidant at the entrance of the flow tube followed by downstream reaction. In principle, aerosol kinetics can take a variety of forms depending on the specific processes involved (Smith et al., 2002; Tolocka et al., 2004b; Zaveri et al., 2018). With respect to particle growth, uptake of gas-phase molecules on and/or into the particle can be independent of particle diameter, increase with increasing particle diameter, or decrease with increasing particle diameter. Decreasing uptake with increasing particle diameter occurs when uptake is limited by molecular diffusion in the gas phase, which is relevant only to particles much larger than those considered in this study. Uptake that is independent of particle diameter occurs for surface-limited processes, which includes irreversible condensation of low-volatility molecules onto the particle surface and surface reactions that immobilize (on the timescale of the experiment) semi-volatile molecules on the particle surface. Uptake that increases with increasing particle diameter occurs for reactions in the particle phase that immobilize (on the timescale of the experiment) semi-volatile molecules within the particle volume.
In order to make these simulations relevant to experimental investigations (Krasnomowitz et al., 2019; Stangl et al., 2019), we use molecular properties and processes typical of α-pinene SOA formation since this system has been so well-studied over the years (Donahue et al., 2012; Khamaganov and Hites, 2001; Pathak et al., 2007a; Stanier et al., 2007; Trump and Donahue, 2014; Zhang and Zhang, 2005). However, it should be understood that the simulations are not meant to accurately calculate the amount of α-pinene SOA formed. While our simulations include surface- and volume- limited reactions (condensation and oligomerization, respectively) that are fundamental drivers of aerosol kinetics (Smith et al., 2002; Tolocka et al., 2004b), they do not include, for example, reversible dimer formation or the possibility of hindered diffusion within the particle phase – which, depending on conditions chosen, could cause reactions within the particle phase to exhibit either surface- or volume-limited kinetics or to make volume chemical processes limited by molecular diffusion rather than by the intrinsic rate of reaction (Galeazzo et al., 2021; Zaveri et al., 2020). Hindered diffusion is more complicated to incorporate into the simulations, it is highly specific to the SOA system being studied, and while it would modify the specific growth kinetics in the flow tube, it does not add much to the basic insight gained from the surface- and volume-limited processes already included in the simulations.
The simulation approach used in this study is built upon a foundation previously developed and described elsewhere (Apsokardu and Johnston, 2018). Organic and inorganic species within the simulation include an ammonium sulfate seed particle, organic matter of varying volatility, and water. The relative humidity for all simulations is maintained at a constant 60 %, which is between the efflorescence (∼ 35 %) and deliquescence (∼ 82 %) relative humidities for ammonium sulfate (Gao et al., 2006). The simulation begins with an initial seed particle size that can be set to any diameter and treated as either an effloresced (solid-phase) or deliquesced (liquid-phase) particle. Organic matter is distributed into six volatility bins, which include one non-volatile organic compound (NVOC), four semi-volatile organic compounds (SVOCs), and one oxidized volatile organic compound (OVOC). Each organic species has the potential to partition and/or condense between the gas and particle phases based on pre-set volatility parameters, as discussed in Sect. 2.1. Several particle-phase reactions (dimer formation) are incorporated into the simulation and will be discussed further in Sect. 2.3. Note that in a real system, e.g. α-pinene SOA formation, a wider range of particle-phase reactions may exist than the set in Sect. 2.3. Water exists as a predetermined number of monolayers which cover the surface of a solid seed particle when applicable. Previous studies have shown the presence of water on effloresced seed particles under conditions of relative humidity approaching the deliquescence relative humidity point, with thickness of 3 to 5 monolayers for 50 nm particles (Hsiao et al., 2016). By incorporating these various conditions, species, and reactions, we gain insight into the complex growth kinetics occurring inside the flow tube.
2.1 Volatility of organic species
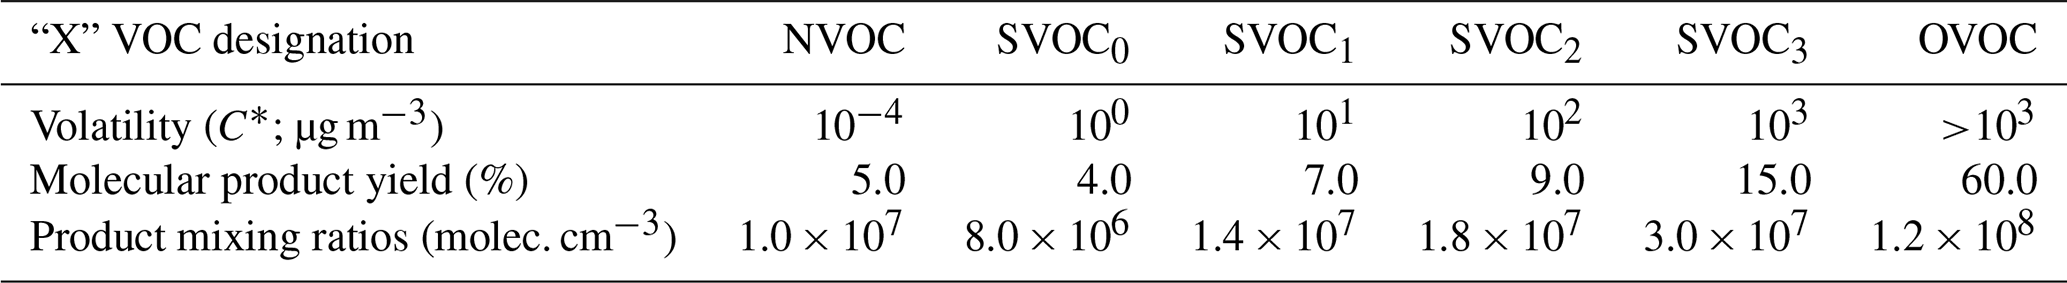
Products found in SOA are regularly quantified based on their volatility, which is expressed in terms of saturation concentration (C*; µg m−3). A study by Donahue et al. (2012) shows that ambient biogenic emissions contain many species which are highly volatile ( µg m−3). Although these components are too volatile to partition and/or condense onto existing particles, oxidation reactions in the atmosphere can produce lower-volatility products from these reactants (Chen et al., 2011; Xavier et al., 2019). For the ozonolysis of α-pinene reaction specifically, SOA products have been shown to range in volatility (C*) from <10−1 to >106 µg m−3 (Donahue et al., 2012). For this simulation, volatility bins are simplified into three classes as follows: NVOCs, which are non-volatile organics having a C* of 10−4 µg m−3, allowing them to condensationally grow particles; SVOCs, which are semi-volatile organics whose volatilities are 10 µg m−3; and OVOCs, which are the remaining oxidation products having a C*>103 µg m−3 and are too volatile to grow particles in these simulations. The simulations incorporate one type of NVOC and OVOC, plus four SVOC species, each with a specified volatility. These volatilities are listed in Table 1 alongside their corresponding “product” yields from the ozonolysis reaction. Molar yields of non-volatile ozonolysis products have been measured between 3.5 % and 7 % through NO Cl API-TOF gas-phase measurements in a high-volume chamber (Ehn et al., 2014; Sarnela et al., 2018). The product yield (fraction of VOC precursor molecules that react with ozone to give a product molecule in the indicated volatility bin) for NVOCs ( µg m−3) is set to 5 % to be consistent with these findings. Product yields for SVOCs and OVOCs are then chosen based on a study by Trump and Donahue (2014), wherein volatility-based yields (10 µg m−3) were fit to SOA aerosol mass yields utilizing an equilibrium model. Our selection of oxidation products and volatilities in Table 1 allow for a reasonably wide range of volume-limited reaction rates relative to (surface-limited) condensation.
Table 1Product distribution for VOC ozonolysis used to simulate particle growth.
2.2 Product mixing ratios
For simulating particle growth under atmospherically relevant conditions, constant values for the product mixing ratios are used as shown in Table 1. These values are consistent with what might be observed in a boreal forest during new particle formation (Vestenius et al., 2014). For simulating growth under typical flow tube conditions, product mixing ratios are time-dependent and calculated according to Eq. (1):
where [XVOC]g,t, [VOC]t, and [O3]t are the respective mixing ratios at time t, Δt is the time increment, and y is the molar yield of the respective XVOC ozonolysis product. Here, three processes are represented: the oxidation of VOCs by ozone based on a second-order rate constant (kII), the loss of products to the inner walls of the flow tube (kWL), and loss of products to the condensation sink (kCS). The [XVOC] designation represents each of the six species in Table 1: NVOC, SVOC0−3, and OVOC, i.e. a separate equation for each volatility product.
2.3 Simulating particle growth
The amount of seed particle growth obtained for a given simulation is evaluated with respect to condensation, partitioning, and reaction of organic species. Partitioning and reaction of SVOCs occur in the portion of the particle considered to be liquid-like. For the purposes of this study, the liquid-like fraction of the particle volume is simply taken as the total amount of organic and aqueous volume in the particle at any time point in the simulation. Calculations are performed recursively, updating gas- and particle-phase concentrations every tenth of a second over the timescale of the simulation. Particle-phase concentrations for each species are calculated according to Eqs. (2–4) at each time point based on the gas-phase product yields discussed previously.
Here, [XVOC]P,t and [dimer]P,t are the respective particle-phase concentrations at time t, [XVOC]g,t and [dimer]g,t are the respective gas-phase concentrations at time t, c is the mean thermal velocity, γ is the uptake coefficient (C* dependent), Sp is the surface area of the particle, Vp is the volume of the particle, Δt is the time increment, and kD is the second-order rate constant for dimer formation. Dimerization rate constants have been reported on the order of 10−4 to 10−2 M−1 s−1 for various reactions of hydroperoxides and aldehydes (Ziemann and Atkinson, 2012). Of the many products formed during SOA formation, approximately 50 % of the mass formed from α-pinene has been reported to have a peroxide functionality (Docherty et al., 2005). Accordingly, a rate constant of 10−2 M−1 s−1 is used for all simulations. The saturation ratio (Sd) determines how well a gas-phase compound partitions into the particle phase and is defined as the ratio of gas-phase mixing ratio to the saturation mixing ratio. A high ratio (Sd≫1) is found for species that condensationally grow particles, such as NVOCs. As SVOCs partition between the gas and particle phase, they grow particles at a slower rate due to Sd≪1. It is important to note that Eq. (3) is written for this situation. However, if and when Sd≥1 for SVOCs, no additional flow into the particle phase would occur unless the formation of a dimer shifted the equilibrium by depleting the particle-phase concentration. Particle-phase reactions responsible for dimer formation are simplified and represented by the term in these equations. In principle, this term represents all possible combinations of NVOC and SVOCi molecules to form a dimer. However, the simulations shown in this study include just one specific dimer formation reaction – two SVOC0 molecules reacting with each other. Simulations including the full range of dimer formation reactions have been performed, but they add very little to calculated diameter growth (most of the growth is due to SVOC0 only) or to the time dependence of GF in the flow tube. Therefore, in the interest of simplicity for discussion in this work, only the SVOC0 dimerization simulations are shown. Each organic molecule and/or compound with a low enough volatility to remain in the particle phase is summed at each time point, representing any increase in particle volume (VP) over the previous time point. This is represented by Eq. (5):
where VNVOC, VSVOC, and Vdimer are the respective molecular volumes contributing to particle growth. Diameter growth of the particle is determined by Eq. (6).
2.4 Growth factor
The growth factor (GF) is defined as the fraction of all oxidation products colliding with the particle surface that are actually taken up into the particle, causing it to grow, as defined by Eq. (7).
GF is calculated for each time increment based on the amount of growth caused by each oxidation product during that increment. In practice, GF includes the full NVOC yield (except for particles ≪20 nm, for which the Kelvin effect causes some NVOC molecules to remain in the gas phase) plus a portion of the SVOCi yield depending upon how significant partitioning is and how much of the partitioned SVOCi undergoes reaction in the particle phase to produce a non-volatile dimer. In this study, the OVOC does not contribute to GF since its concentration in the particle phase is too small to efficiently form a dimer.
The first simulations examine the effects of condensation of NVOCs, partitioning of SVOCs, and dimer formation on particle growth under atmospherically relevant, low-growth (<1 nm h−1) conditions as a base case for comparison to flow tube simulations. Calculations in this section utilize the product mixing ratios listed in Table 1 and are held constant throughout the growth of the particle. Figure 1a shows a 5 nm diameter dry (no aerosol liquid water, ALW) ammonium sulfate seed particle growing to 100 nm by condensation of NVOCs and partitioning of SVOCs alone. Here, GF remains constant at 5 % throughout the simulation as the NVOC condensationally grows the particle. Although the SVOC partitions between the gas and particle phase, the steady-state amount in the particle phase is too low to have a significant contribution to particle growth. Figure 1b shows the same simulation but with the addition of dimer formation. Recall that for the simulations shown, dimer formation is restricted to between two SVOC molecules with a C* equal to 100 µg m−3. Note that GF starts at 5 % as in Fig. 1a. Since SVOC partitioning requires an organic phase (no ALW in this simulation), the NVOC must build up on the particle surface in order to provide a medium for SVOC partitioning and subsequent dimer formation. Relative to condensation and partitioning alone in Fig. 1a, dimer formation increases the rate of particle growth in Fig. 1b (note the slightly shorter timescale to reach 100 nm) and results in an increase in GF with increasing particle size.

Figure 1Growth factor and diameter vs. time for dry (no ALW) ammonium sulfate seed particles with an initial diameter of 5 nm. (a) Condensation of NVOCs and partitioning of SVOCs only. (b) SVOC0 dimer formation in addition to condensation and partitioning.
Also shown in the Fig. 1 plots are shaded regions depicting what a flow tube experiment might look like when a relatively small time slice of the overall growth process is studied, in this case highlighting a time period during which 40 nm diameter particles grow to 45 nm. Particle growth during this time period is associated with a specific GF that changes depending upon whether or not dimer formation occurs. If only condensational growth occurs, i.e. surface-limited kinetics (Fig. 1a), then the aerosol growth kinetics over this time period are straightforward – GF remains constant at 5.0 %. If both surface- and volume-limited kinetics occur (Fig. 1b), then the aerosol growth kinetics become more complex since GF increases slightly over the shaded time period. While the change in aerosol growth kinetics is small in Fig. 1b, the next section shows that such changes are greatly amplified under conditions typically used in flow tube experiments.
In this and subsequent sections, particle growth is simulated under conditions typically used in our flow tube reactor, whose design and performance are described in detail elsewhere (Krasnomowitz et al., 2019). In our laboratory experiments, size-selected ammonium sulfate seed particles are introduced into the flow tube along with a gas-phase VOC (α-pinene in our initial experiments), ozone, cyclohexane (hydroxyl radical scavenger), and water vapour (relative humidity control). Particle residence time in the flow tube is approximately 4 min, which is much shorter than the shaded region in Fig. 1. Experimental conditions must be chosen such that particles exiting the flow tube reactor have increased from their initial diameters by about 1 to 8 nm, which is sufficient for high-precision measurement using a scanning mobility particle sizer (TSI, Inc., Shoreview, MN). This range of diameter increase corresponds to a growth rate between about 15 and 120 nm h−1. For comparison, ambient particle growth rates are on the order of 1 to 10 nm h−1 for new particle formation events. To achieve the desired amount of particle growth, we typically perform flow tube experiments with a VOC mixing ratio on the order of 10 ppbv and ozone mixing ratios between 30 and 300 ppbv (Krasnomowitz et al., 2019). Similar parameters have been used by others (Pathak et al., 2007b) to experimentally study SOA formation by α-pinene ozonolysis.
4.1 Particle growth inside a flow tube with and without particle-phase chemistry
The first set of flow tube simulations start with 40 nm diameter dry (no ALW) ammonium sulfate seed particles that are mixed with VOCs (11 ppbv) and ozone (200 ppbv) at the inlet to the flow tube. As aerosol travels through the flow tube (4 min residence time), VOCs and ozone react, causing the seed particles to grow. NVOC and SVOC gas-phase mixing ratios increase with increasing time as calculated by Eq. (1) using the molecular product yields in Table 1. Dimer formation is calculated from all relevant reactant combinations as described in Sect. 2.3. Figure 2 shows the change in particle diameter and GF with time for simulations analogous to those in Fig. 1. Figure 2a simulates growth by condensation of NVOCs and partitioning of SVOCs. Figure 2b simulates growth by condensation, partitioning, and dimer formation.
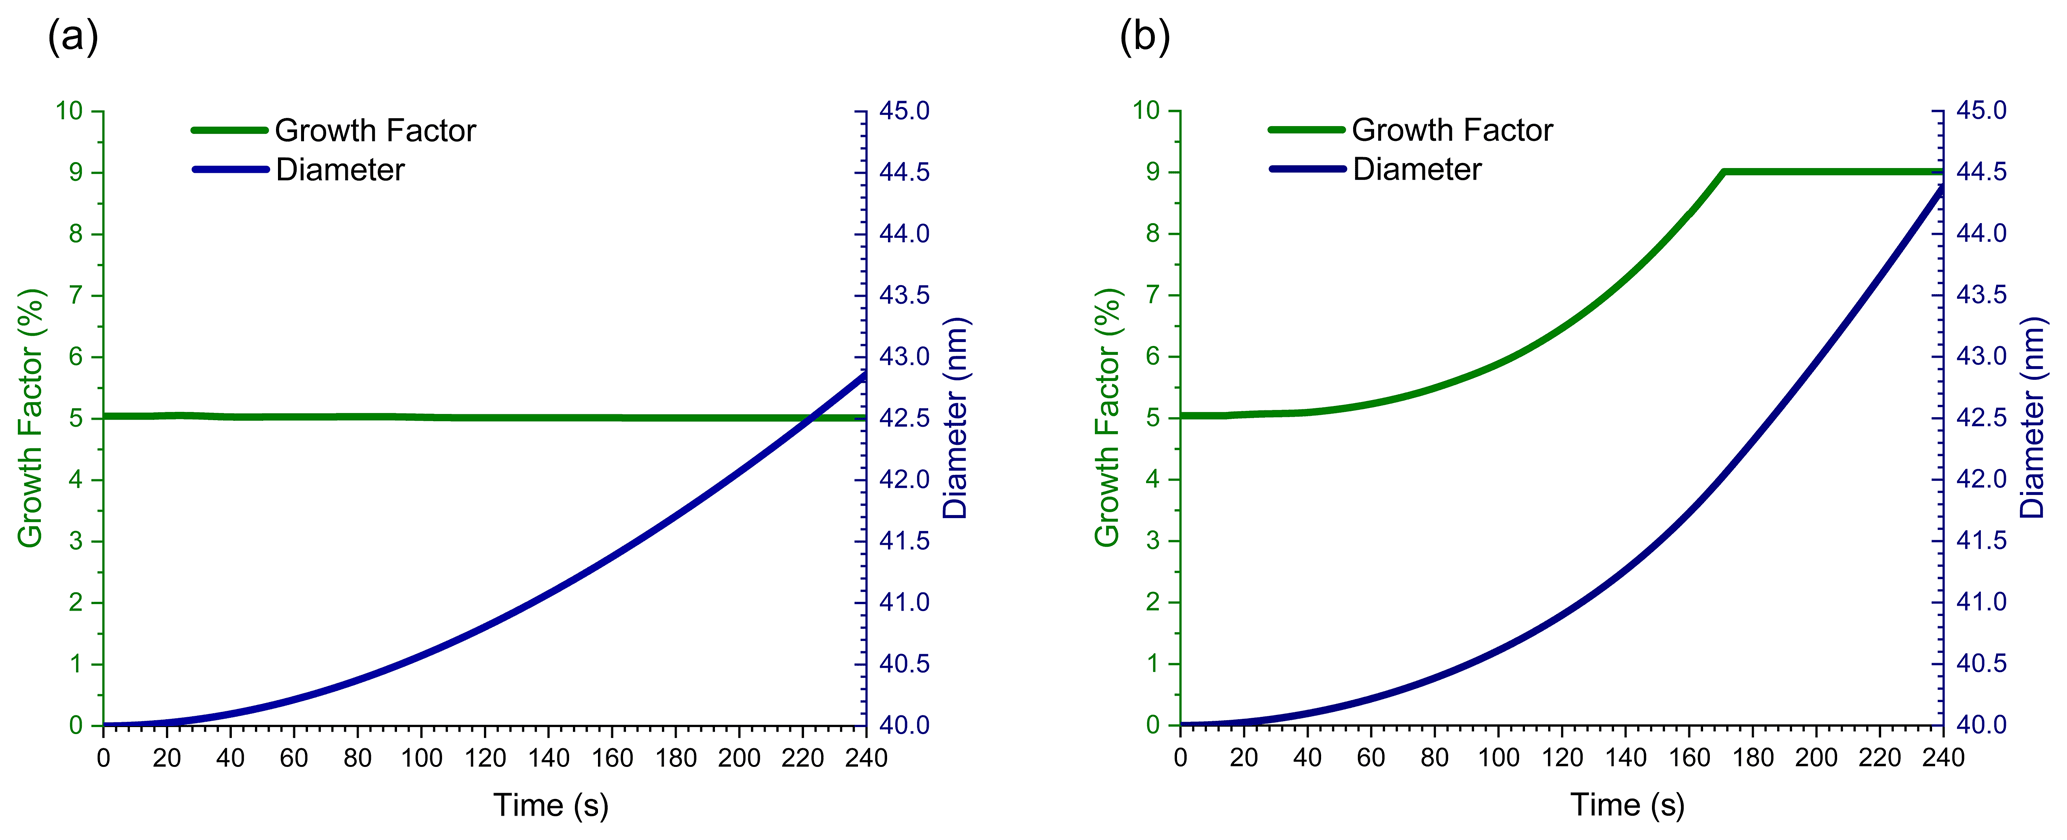
Figure 2Growth factor and particle diameter vs. time for 40 nm diameter ammonium sulfate seed particles travelling through the flow tube, growing by (a) condensation of NVOCs and partitioning of SVOC s alone, and (b) with SVOC0 dimer formation included.
In Fig. 2a, GF remains constant at 5 % throughout the timescale of the simulation. As for the simulation in Fig. 1a, particle growth in Fig. 2a is driven by condensation of NVOCs. Even though the particle growth rate is different for the two simulations, GF is the same since the molar yield of NVOCs is the same, even though the simulation conditions are quite different. These figures illustrate the relative simplicity of surface-limited growth kinetics in a flow tube. In contrast, the GF plot in Fig. 2b is time-dependent and differs substantially in shape and numerical value from Fig. 1b. GFs for Fig. 2a and b both start at 5 % because only NVOC condensation contributes to growth in the absence of a reactive particle phase. However, once an organic coating forms on top of the particle surface, SVOC0 partitioning and dimer formation begin to occur within this coating. GF increases above 5 % because some SVOC0 molecules striking the particle surface react to form a dimer, causing a net flow of SVOC0 from the gas phase to the particle. Since dimer formation follows volume-limited kinetics, the rate of SVOC0 uptake increases as the organic volume on the particle increases, and therefore GF increases as well. Eventually, the organic volume becomes large enough that the rate of SVOC0 uptake reaches a maximum, given by mass flux from the gas phase to the particle surface. At this point, particle growth changes from volume-limited to surface-limited kinetics, and GF becomes approximately independent of time. The magnitude of GF at the end of the simulation is given by the combined molecular product yields of NVOCs and SVOC0 (5 % + 4 % = 9 %) plus a small amount of growth due to partitioning of other SVOCs, giving a total GF of ∼ 9.1–9.2 %. GF in Fig. 2b rises much faster and to a higher numerical value than Fig. 1b because dimer formation is nonlinear with respect to SVOC0 gas-phase mixing ratio (Apsokardu and Johnston, 2018). The difference between Figs. 1b and 2b illustrates the complexity of particle growth for starting conditions when volume-limited kinetics apply and how volume-limited reactions can give surface-limited growth kinetics in the high-precursor-mixing-ratio environment of a flow tube.
4.2 Particle growth inside a flow tube as a function of ozone mixing ratio
This subsection explores the high-mixing-ratio environment of a flow tube in more detail. Simulations in this section have an expanded range of ozone mixing ratios between 50 and 300 ppbv, which are typical for our flow tube experiments (Krasnomowitz et al., 2019). Figure 3 shows GF vs. time for six different ozone mixing ratios. (For reference, the 200 ppbv plot in Fig. 2b is replotted in Fig. 3.) The nonlinear dependence of GF on ozone mixing ratio is readily apparent in this plot. For the lowest mixing ratio, GF hardly increases at all as growth is driven mostly by NVOC condensation. As the ozone mixing ratio increases, GF also increases and, as discussed in the previous subsection, eventually reaches the maximum value possible when growth due to dimer formation becomes surface-limited. The higher the ozone mixing ratio, the faster surface-limited kinetics are reached. While the growth kinetics are complex, Fig. 3 illustrates how the mixing ratio dependence can be used to determine whether nonlinear and/or volume-limited processes contribute to the growth kinetics. It also cautions that one should fully consider these types of processes when extrapolating flow tube experiments back to ambient conditions.
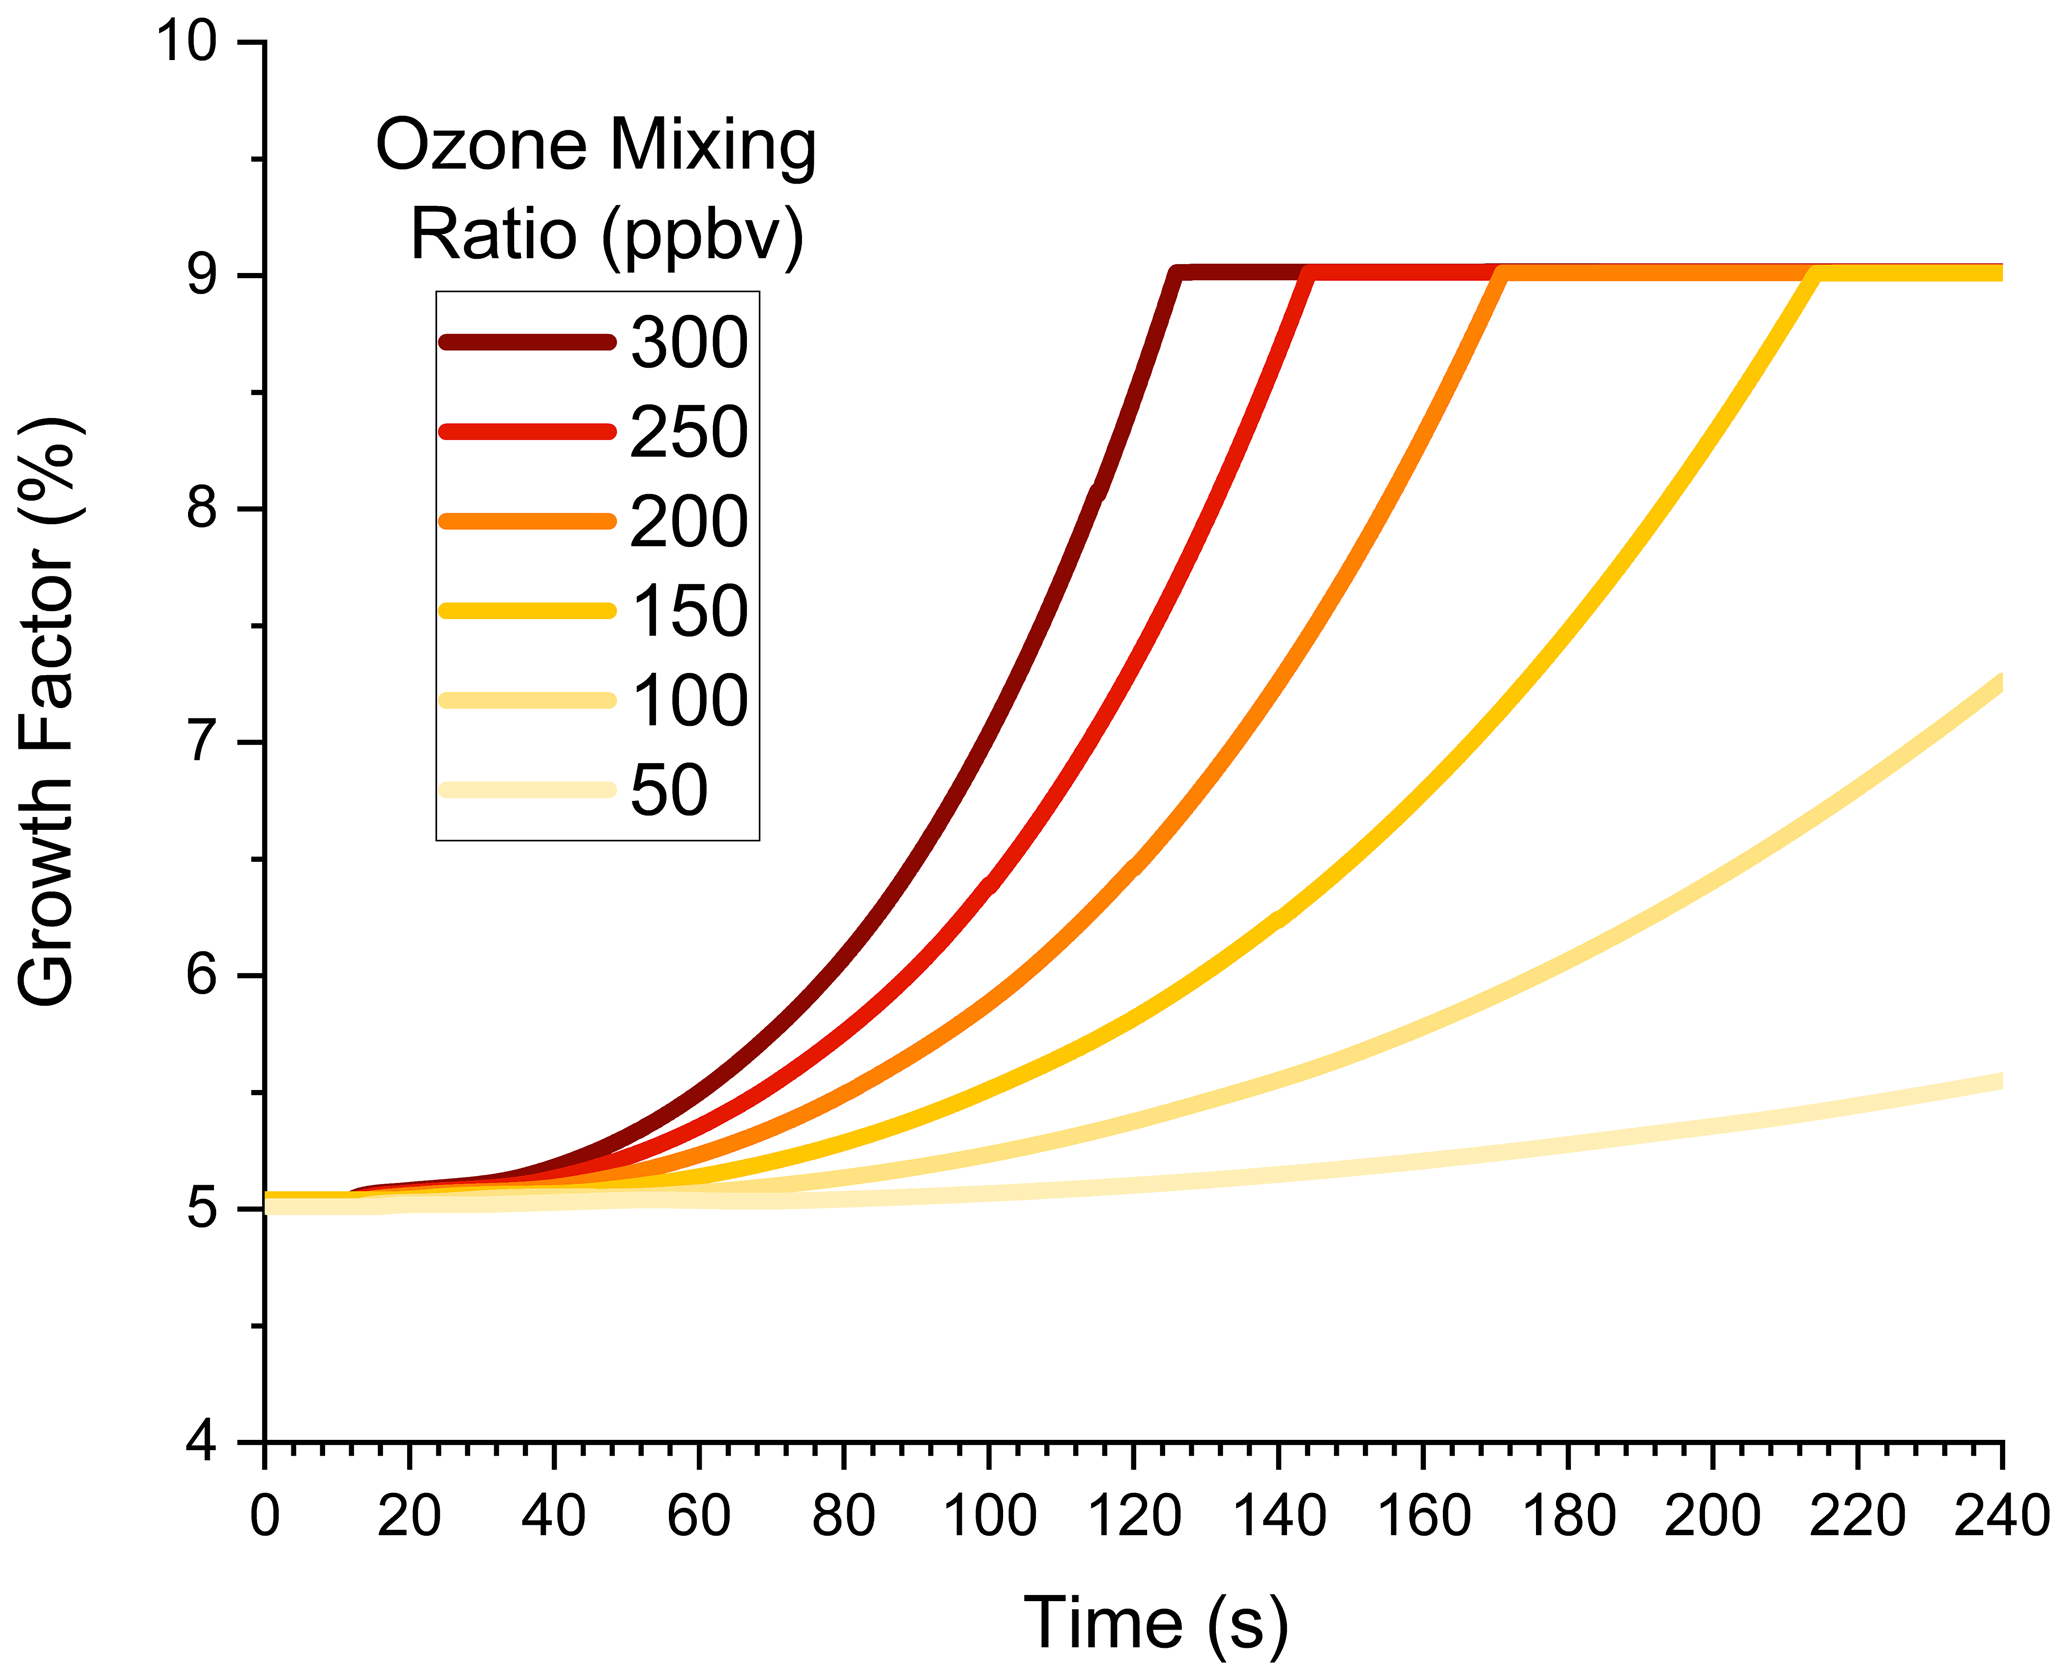
Figure 3Growth factor vs. time in the flow tube for 40 nm ammonium sulfate seed particles. Condensation, partitioning, and dimer formation are all included. The ozone mixing ratio is shown with increasing colour intensity corresponding to an increasing mixing ratio.
4.3 Impact of aerosol liquid water (ALW) on particle growth
This subsection explores how ALW, either on the particle surface or within the particle volume, can enhance growth. In these simulations, the presence of ALW simply increases the volume in which particle-phase chemistry can occur. In other words, SVOC partitioning and dimer formation are assumed to be independent of whether the reactive phase is aqueous, organic, or a combination of the two. Of course, in experimental systems this is probably not the case, but the purpose of these simulations is to explore the effect of total reactive volume, not phase-dependent chemistry. Up to now, all simulations have involved “dry” ammonium sulfate particles, meaning the particles were effloresced without any water molecules on the surface. However, Hsiao et al. (2016) showed that approximately 3 to 5 monolayers of water molecules can exist on the surface of an effloresced ammonium sulfate particle with a relative humidity near but below the deliquescence point. Note that a coverage of 5 monolayers corresponds to an aqueous layer thickness of almost 2 nm based on a density of 1.00 g mL−1 and a molecular diameter of 0.385 nm. In principle, surface water could provide sufficient volume at the beginning of a growth experiment for SVOC partitioning and dimer formation to occur. If the relative humidity is high enough for the particle to deliquesce, then the entire volume would be available for SVOC partitioning and dimer formation, and a large enhancement of SVOC partitioning and dimer formation would be expected. These possibilities are examined in Fig. 4.
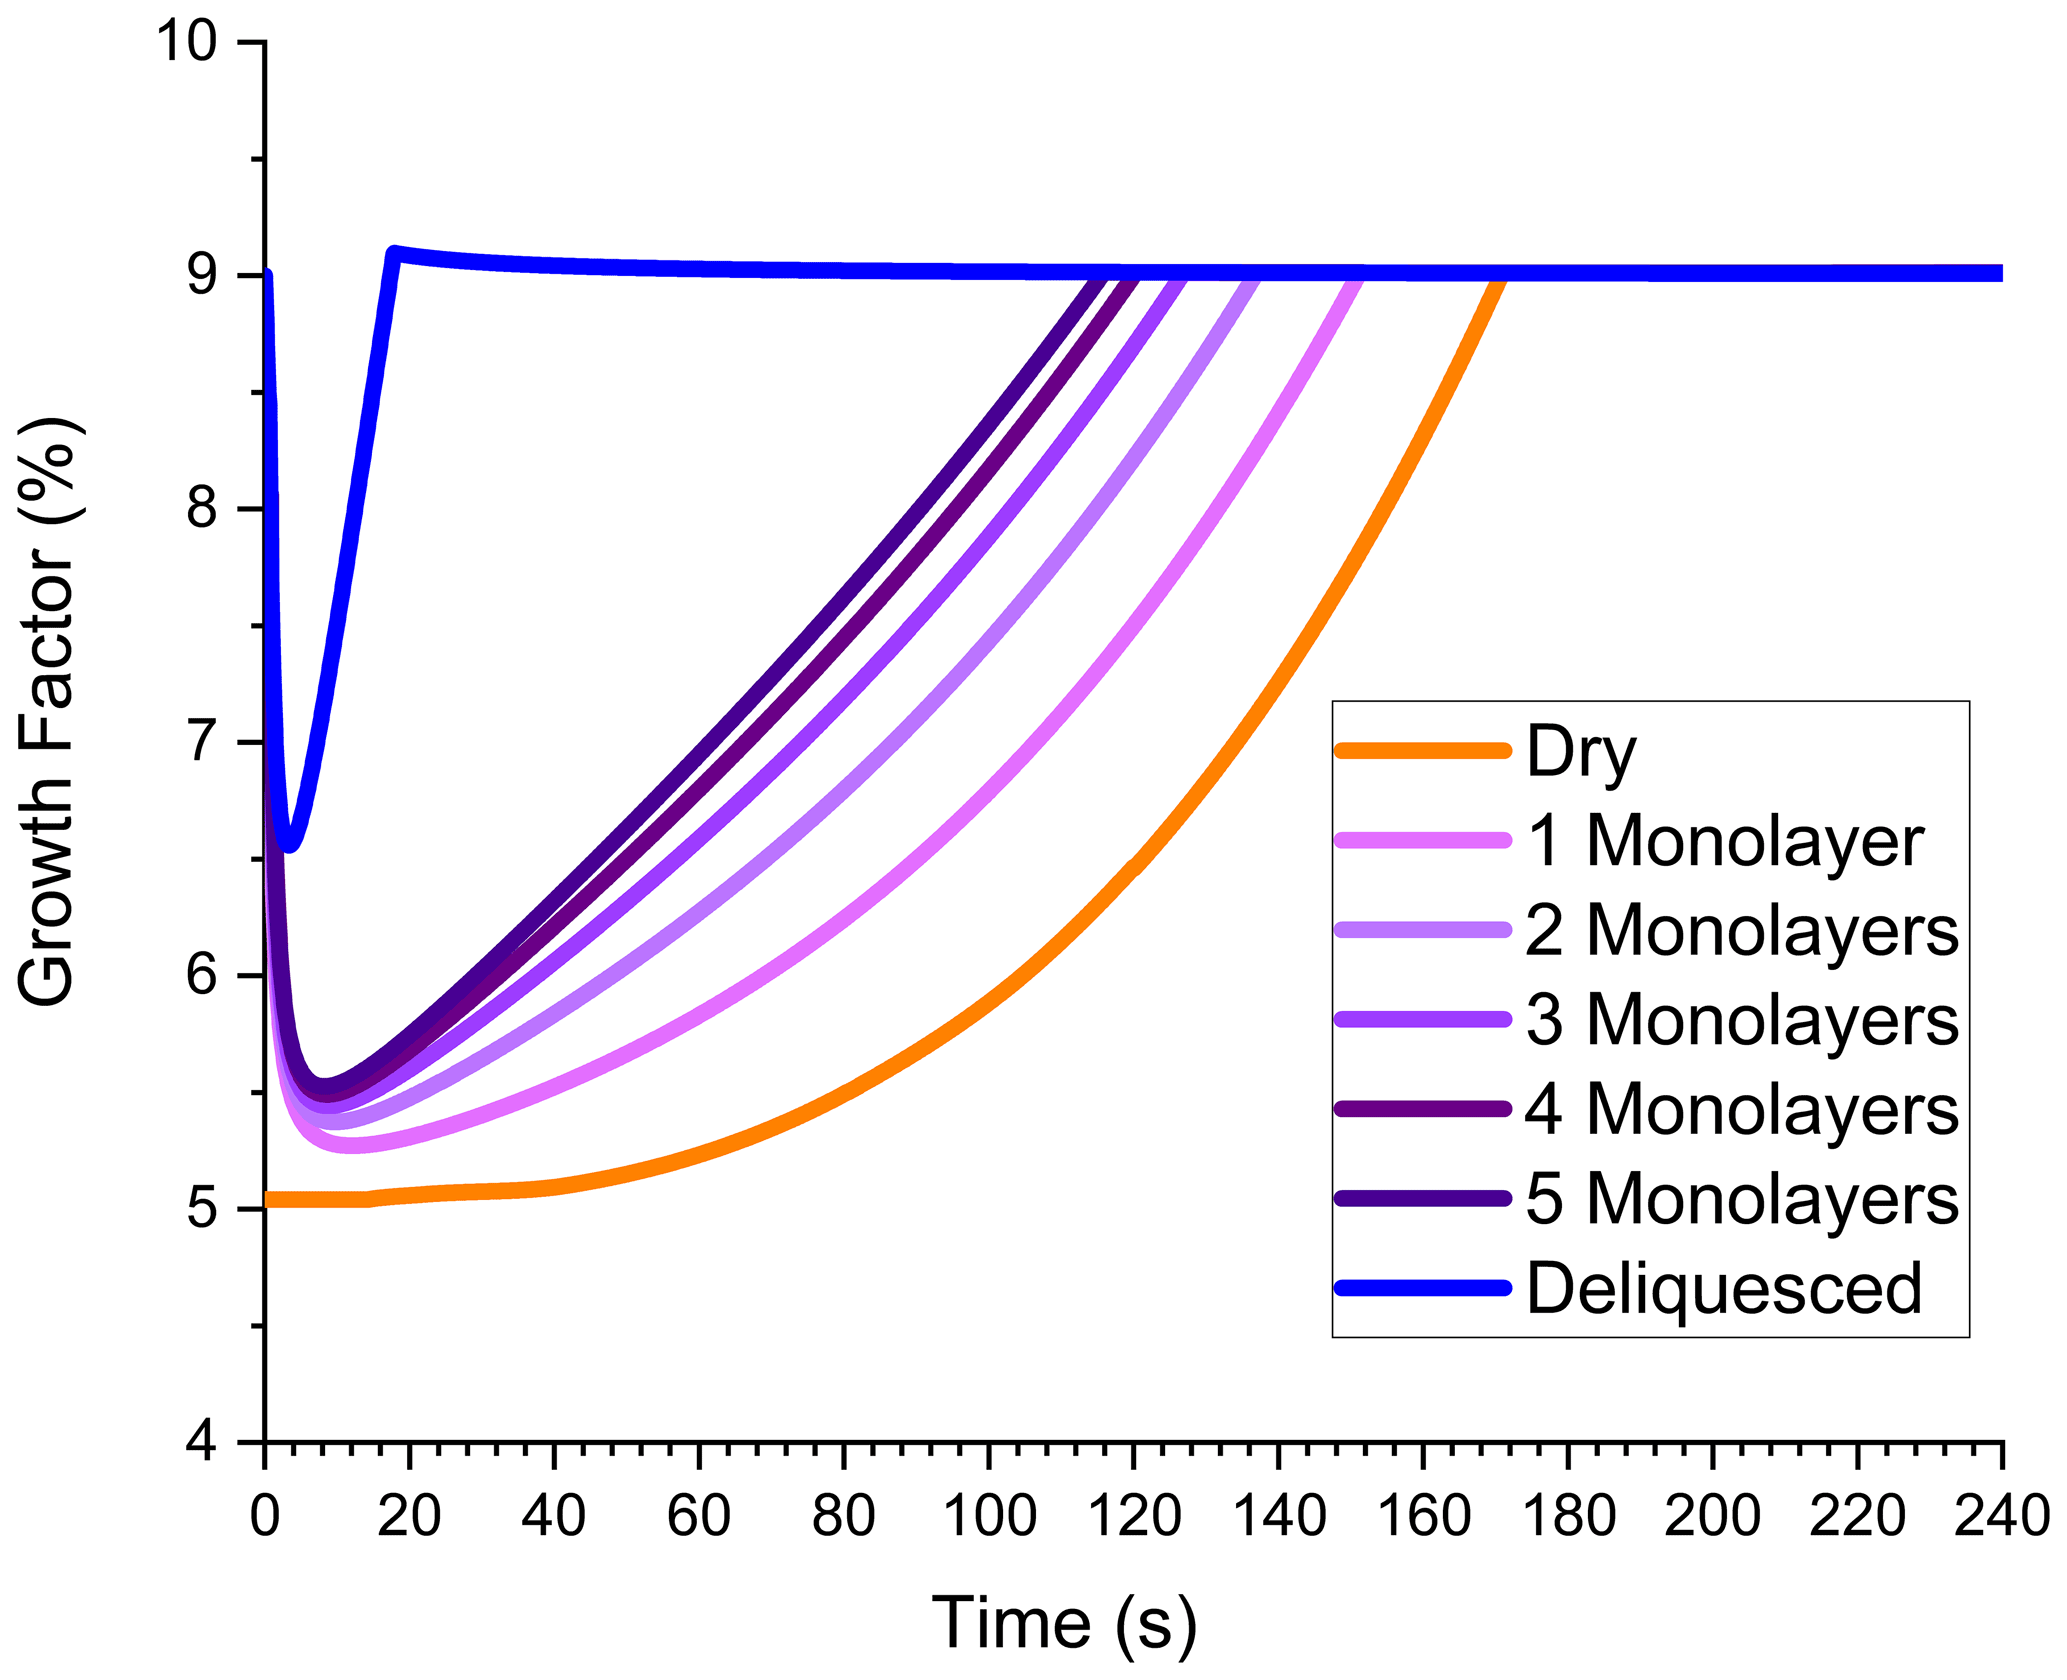
Figure 4Growth factor vs. time in the flow tube for dry (no ALW) ammonium sulfate seed particles (orange), effloresced seed particles initially containing 1–5 water monolayers on the surface (purple shades), and deliquesced seed particles (blue). Condensation, partitioning, and dimer formation are all included. The ozone mixing ratio is 200 ppbv.
The “dry” particle simulation in Fig. 4 is the same as that in Fig. 2b. GF is 5 % at the beginning of the simulation and increases with increasing time, slowly at first because NVOC condensation is needed to grow the organic layer where dimer formation can occur. When surface water is available at the outset, a significant volume for dimer formation already exists. Figure 4 shows that even a single monolayer is able to enhance GF, and the enhancement increases as the number of monolayers increases. GF is highest for deliquesced particles with the full particle volume available for partitioning and reaction. The time dependence of GF for particles containing ALW contains a feature not observed in previous simulations. Initially, GF is very high and then drops with increasing time. The initial spike in GF is associated with SVOC uptake into the aqueous volume to establish the partitioning equilibrium. Once equilibrium is established, GF drops but then later starts to increase again as dimer formation becomes significant. GF reaches its maximum value in all simulations, but the time point that the maximum is achieved decreases as the amount of ALW increases. Figure 4 shows that surface water has the capability to dramatically increase particle growth by processes that are volume-limited. It also cautions that contaminants on the particle surface may substantially alter growth kinetics if they are uncontrolled and influence the initial volume available for reaction.
As discussed in Sect. 1, flow tube reactors are well-suited for measuring particle growth rates (and comparing growth under different experimental conditions) since the inlet size distribution, outlet size distribution, and time difference between the two are all determined. However, the simulations in Sect. 4 show that growth kinetics inside the reactor are complex and not easily predicted unless one already understands the growth processes in detail. Given this complexity, how does one extract useful growth information from an experiment when the processes leading to growth are poorly understood? In this section, we discuss a method to use flow tube data to determine GF without knowledge of the growth processes involved. For the simulations in Sect. 4, we compare GFs obtained from this interpretive method to the actual GFs from the simulations.
The interpretive method is based on five measured quantities and one known kinetic parameter: gas-phase VOC mixing ratio at the inlet, gas-phase oxidant mixing ratio at the inlet, particle size at the inlet, particle size at the exit, residence time of the reactor, and the second-order rate constant for reaction of VOCs and oxidants. From these measurables and parameters, GF is calculated for condensed organic vapour (COV), which is defined as the group of oxidation products that grew particles in a given time period. In the context of the simulations in Sect. 4, COV includes all non-volatile products (NVOCs) that irreversibly condense onto the particle plus the portion of semi-volatile products (SVOCs) that partition into the particle phase, react, and stay there on the timescale of the full simulation. In the simulations, SVOC uptake is calculated, and from it, particle growth (change in diameter) and GF are determined. The interpretive method takes the opposite approach. The “measured” change in particle diameter from the inlet to outlet is used to back-calculate what GF had to be in order to produce this change. With the interpretive method, diameter growth of particles between the inlet and outlet is determined by integrating Eqs. (8) and (9) over the residence time of the reactor:
where c is mean thermal velocity, γ is the uptake coefficient (assumed to be 1 in this work), [COV]t is the time-dependent gas-phase COV mixing ratio, βd is the correction factor for mass flux to a spherical particle with diameter d, and VCOV is the molecular COV volume. When calculating the diameter change, all COV molecules are assumed to have an average molecular weight of 200 g mol−1 and an average density of 1.2 g cm−3, which are typical for biogenic VOC oxidation products. The processes which supply COV to and deplete COV from the system are accounted for in a way analogous to Eq. (1).
In Eqs. (8) and (9), the only unknown parameter is GF, which is adjusted to make the calculated outlet-minus-inlet diameter change match the measured change. Importantly, the interpretive method is based only on experimental observables, and no assumptions are made about the actual growth processes used for simulating SOA formation. An important point to note is that the wall loss and condensation sink terms in Eq. (9) are what make it difficult to simply compare outlet-minus-inlet particle diameter changes from one flow tube experiment to the next, since the magnitudes of these terms affect how much growth is observed, and they are not necessarily constant from experiment to experiment. The growth factor definition overcomes this problem and is specific to the VOC system being studied.
Figure 5 shows how well the COV growth factors determined from the interpretive method (“empirical” GF from Eqs. 8 and 9) match the average of the simulated GFs (“actual”) inside the flow tube from Sect. 4. For comparison, a 1:1 line is also shown. Overall, the two sets of GFs deviate only slightly from each other, and the deviation is much less than the uncertainty encountered in our experimental measurements, which is typically on the order of ±10 % or less of the reported COV growth factor. Figure 5 gives confidence that the empirical GFs obtained from the interpretive method give a close approximation of the actual GFs inside the flow tube.

Figure 5COV growth factor obtained from outlet-minus-inlet diameter change vs. actual growth factor (average of GFs within the flow tube for each simulation in Sect. 4). Colours correspond to those shown for the simulations in Figs. 3 and 4. The line shows a 1:1 ratio.
It is important to realize that the simulations in Sect. 4 and the COV calculation in Sect. 5 are not simply “reverse” calculations of each other. The simulations in Sect. 4, though simplified relative to detailed SOA formation models for specific VOC precursors, incorporate numerous chemical details including relative yields and volatilities of VOC oxidation products (NVOC, SVOC, OVOC), dimer reaction partners, volatilities of the reaction partners, second-order rate constant for dimer formation, and the portion of the particle volume capable of supporting dimer formation. None of these details are included in the COV calculations, which simply determine how many gas-phase molecules (i.e. the fraction of VOC oxidation products) had to go onto or into the particle to cause the outlet-minus-inlet diameter change for each simulation. The GFs obtained from COV calculations accurately represent the actual GFs and as such should allow the prediction of particle growth in new experiments without detailed foreknowledge of growth mechanisms.
Flow tubes provide an effective way to study particle growth as a function of seed particle size, composition, and phase state, as well as other conditions such as precursor mixing ratios and relative humidity. Although these experiments provide a simple measure of size distribution change over a defined length of time, the growth mechanisms that contribute to particle growth can be complex and vary in terms of oxidized product volatilities, yields, and reaction rates. This study highlights how particle-phase chemistry can change aerosol kinetics within the flow tube when compared to growth by NVOC condensation alone. The presence of aerosol liquid water is shown to be capable of enhancing particle growth by increasing the amount of volume available for reaction. Even one or a few monolayers of water on the surface of an effloresced particle can significantly enhance growth by providing a medium for particle-phase chemistry to occur. Since the specific reactions driving aerosol growth kinetics are often unknown or only partially understood for many SOA systems, an empirical calculation of the COV growth factor based on outlet-minus-inlet particle diameters in a flow tube experiment can give predictive capability for SOA growth. In the present study, empirical COV growth factors closely matched the actual GFs from SOA simulations, and one can expect that the difference between empirical and actual growth factors in flow tube experiments will be within typical experimental uncertainties.
The code used in this work can be obtained from the authors.
The simulation results in Figs. 1–5 can be obtained from the authors.
MST Jr. and DNH performed the simulations and COV calculations. MST Jr. prepared the paper with contributions from all authors.
The contact author has declared that none of the authors has any competing interests.
Publisher's note: Copernicus Publications remains neutral with regard to jurisdictional claims in published maps and institutional affiliations.
This research has been supported by the National Science Foundation (grant nos. 1904765 and 1916819).
This paper was edited by Rebecca Washenfelder and reviewed by two anonymous referees.
Apsokardu, M. J. and Johnston, M. V.: Nanoparticle growth by particle-phase chemistry, Atmos. Chem. Phys., 18, 1895–1907, https://doi.org/10.5194/acp-18-1895-2018, 2018.
Barsanti, K. C. and Pankow, J. F.: Thermodynamics of the formation of atmospheric organic particulate matter by accretion reactions-Part 3: Carboxylic and dicarboxylic acids, Atmos. Environ., 40, 6676–6686, https://doi.org/10.1016/j.atmosenv.2006.03.013, 2006.
Bell, M., Davis, D. L., and Fletcher, T.: A retrospective assessment of mortality from the London smog episode of 1952: The role of influenza and pollution, Environ. Health Perspect., 112, 6–8, https://doi.org/10.1289/ehp.6539, 2004.
Bianchi, F., Kurtén, T., Riva, M., Mohr, C., Rissanen, M. P., Roldin, P., Berndt, T., Crounse, J. D., Wennberg, P. O., Mentel, T. F., Wildt, J., Junninen, H., Jokinen, T., Kulmala, M., Worsnop, D. R., Thornton, J. A., Donahue, N., Kjaergaard, H. G., and Ehn, M.: Highly Oxygenated Organic Molecules (HOM) from Gas-Phase Autoxidation Involving Peroxy Radicals: A Key Contributor to Atmospheric Aerosol, Chem. Rev., 119, 3472–3509, https://doi.org/10.1021/acs.chemrev.8b00395, 2019.
Chen, Q., Liu, Y., Donahue, N. M., Shilling, J. E., and Martin, S. T.: Particle-phase chemistry of secondary organic material: Modeled compared to measured O:C and H:C Elemental ratios provide constraints, Environ. Sci. Technol., 45, 4763–4770, https://doi.org/10.1021/es104398s, 2011.
Crounse, J. D., Nielsen, L. B., Jørgensen, S., Kjaergaard, H. G., and Wennberg, P. O.: Autoxidation of organic compounds in the atmosphere, J. Phys. Chem. Lett., 4, 3513–3520, https://doi.org/10.1021/jz4019207, 2013.
Després, V. R., Alex Huffman, J., Burrows, S. M., Hoose, C., Safatov, A. S., Buryak, G., Fröhlich-Nowoisky, J., Elbert, W., Andreae, M. O., Pöschl, U., and Jaenicke, R.: Primary biological aerosol particles in the atmosphere: A review, Tellus B, 64, 1–58, https://doi.org/10.3402/tellusb.v64i0.15598, 2012.
Docherty, K. S., Wu, W., Lim, Y. B., and Ziemann, P. J.: Contributions of organic peroxides to secondary aerosol formed from reactions of monoterpenes with O3, Environ. Sci. Technol., 39, 4049–4059, https://doi.org/10.1021/es050228s, 2005.
Donahue, N. M., Kroll, J. H., Pandis, S. N., and Robinson, A. L.: A two-dimensional volatility basis set – Part 2: Diagnostics of organic-aerosol evolution, Atmos. Chem. Phys., 12, 615–634, https://doi.org/10.5194/acp-12-615-2012, 2012.
Ehn, M., Thornton, J. A., Kleist, E., Sipilä, M., Junninen, H., Pullinen, I., Springer, M., Rubach, F., Tillmann, R., Lee, B., Lopez-Hilfiker, F., Andres, S., Acir, I. H., Rissanen, M., Jokinen, T., Schobesberger, S., Kangasluoma, J., Kontkanen, J., Nieminen, T., Kurtén, T., Nielsen, L. B., Jørgensen, S., Kjaergaard, H. G., Canagaratna, M., Maso, M. D., Berndt, T., Petäjä, T., Wahner, A., Kerminen, V. M., Kulmala, M., Worsnop, D. R., Wildt, J., and Mentel, T. F.: A large source of low-volatility secondary organic aerosol, Nature, 506, 476–479, https://doi.org/10.1038/nature13032, 2014.
Fuzzi, S., Andreae, M. O., Huebert, B. J., Kulmala, M., Bond, T. C., Boy, M., Doherty, S. J., Guenther, A., Kanakidou, M., Kawamura, K., Kerminen, V.-M., Lohmann, U., Russell, L. M., and Pöschl, U.: Critical assessment of the current state of scientific knowledge, terminology, and research needs concerning the role of organic aerosols in the atmosphere, climate, and global change, Atmos. Chem. Phys., 6, 2017–2038, https://doi.org/10.5194/acp-6-2017-2006, 2006.
Galeazzo, T., Valorso, R., Li, Y., Camredon, M., Aumont, B., and Shiraiwa, M.: Estimation of secondary organic aerosol viscosity from explicit modeling of gas-phase oxidation of isoprene and α-pinene, Atmos. Chem. Phys., 21, 10199–10213, https://doi.org/10.5194/acp-21-10199-2021, 2021.
Gao, Y., Chen, S. B., and Yu, L. E.: Efflorescence relative humidity for ammonium sulfate particles, J. Phys. Chem. A, 110, 7602–7608, https://doi.org/10.1021/jp057574g, 2006.
Gkatzelis, G. I., Hohaus, T., Tillmann, R., Gensch, I., Müller, M., Eichler, P., Xu, K.-M., Schlag, P., Schmitt, S. H., Yu, Z., Wegener, R., Kaminski, M., Holzinger, R., Wisthaler, A., and Kiendler-Scharr, A.: Gas-to-particle partitioning of major biogenic oxidation products: a study on freshly formed and aged biogenic SOA, Atmos. Chem. Phys., 18, 12969–12989, https://doi.org/10.5194/acp-18-12969-2018, 2018.
Hallquist, M., Wenger, J. C., Baltensperger, U., Rudich, Y., Simpson, D., Claeys, M., Dommen, J., Donahue, N. M., George, C., Goldstein, A. H., Hamilton, J. F., Herrmann, H., Hoffmann, T., Iinuma, Y., Jang, M., Jenkin, M. E., Jimenez, J. L., Kiendler-Scharr, A., Maenhaut, W., McFiggans, G., Mentel, Th. F., Monod, A., Prévôt, A. S. H., Seinfeld, J. H., Surratt, J. D., Szmigielski, R., and Wildt, J.: The formation, properties and impact of secondary organic aerosol: current and emerging issues, Atmos. Chem. Phys., 9, 5155–5236, https://doi.org/10.5194/acp-9-5155-2009, 2009.
Hsiao, T. C., Young, L. H., Tai, Y. C., and Chen, K. C.: Aqueous film formation on irregularly shaped inorganic nanoparticles before deliquescence, as revealed by a hygroscopic differential mobility analyzer–Aerosol particle mass system, Aerosol Sci. Technol., 50, 568–577, https://doi.org/10.1080/02786826.2016.1168512, 2016.
Jia, L. and Xu, Y. F.: The role of functional groups in the understanding of secondary organic aerosol formation mechanism from α-pinene, Sci. Total Environ., 738, 139831, https://doi.org/10.1016/j.scitotenv.2020.139831, 2020.
Jimenez, J. L., Canagaratna, M. R., Donahue, N. M., Prevot, A. S. H., Zhang, Q., Kroll, J. H., DeCarlo, P. F., Allan, J. D., Coe, H., Ng, N. L., Aiken, A. C., Docherty, K. S., Ulbrich, I. M., Grieshop, A. P., Robinson, A. L., Duplissy, J., Smith, J. D., Wilson, K. R., Lanz, V. A., Hueglin, C., Sun, Y. L., Tian, J., Laaksonen, A., Raatikainen, T., Rautiainen, J., Vaattovaara, P., Ehn, M., Kulmala, M., Tomlinson, J. M., Collins, D. R., Cubison, M. J., Dunlea, E. J., Huffman, J. A., Onasch, T. B., Alfarra, M. R., Williams, P. I., Bower, K., Kondo, Y., Schneider, J., Drewnick, F., Borrmann, S., Weimer, S., Demerjian, K., Salcedo, D., Cottrell, L., Griffin, R., Takami, A., Miyoshi, T., Hatakeyama, S., Shimono, A., Sun, J. Y., Zhang, Y. M., Dzepina, K., Kimmel, J. R., Sueper, D., Jayne, J. T., Herndon, S. C., Trimborn, A. M., Williams, L. R., Wood, E. C., Middlebrook, A. M., Kolb, C. E., Baltensperger, U., and Worsnop, D. R.: Evolution of organic aerosols in the atmosphere, Science, 326, 1525–1529, https://doi.org/10.1126/science.1180353, 2009.
Johnson, J. S., Regayre, L. A., Yoshioka, M., Pringle, K. J., Lee, L. A., Sexton, D. M. H., Rostron, J. W., Booth, B. B. B., and Carslaw, K. S.: The importance of comprehensive parameter sampling and multiple observations for robust constraint of aerosol radiative forcing, Atmos. Chem. Phys., 18, 13031–13053, https://doi.org/10.5194/acp-18-13031-2018, 2018.
Khamaganov, V. G. and Hites, R. A.: Rate constants for the gas-phase reactions of ozone with isoprene, α- and β-pinene, and limonene as a function of temperature, J. Phys. Chem. A, 105, 815–822, https://doi.org/10.1021/jp002730z, 2001.
Krasnomowitz, J. M., Apsokardu, M. J., Stangl, C. M., Tiszenekel, L., Ouyang, Q., Lee, S., and Johnston, M. V.: Growth of Aitken Mode Ammonium Sulfate Particles by α-Pinene Ozonolysis, Aerosol Sci. Technol., 53, 1–14, https://doi.org/10.1080/02786826.2019.1568381, 2019.
Lehtipalo, K., Yan, C., Dada, L., Bianchi, F., Xiao, M., Wagner, R., Stolzenburg, D., Ahonen, L. R., Amorim, A., Baccarini, A., Bauer, P. S., Baumgartner, B., Bergen, A., Bernhammer, A. K., Breitenlechner, M., Brilke, S., Buchholz, A., Mazon, S. B., Chen, D., Chen, X., Dias, A., Dommen, J., Draper, D. C., Duplissy, J., Ehn, M., Finkenzeller, H., Fischer, L., Frege, C., Fuchs, C., Garmash, O., Gordon, H., Hakala, J., He, X., Heikkinen, L., Heinritzi, M., Helm, J. C., Hofbauer, V., Hoyle, C. R., Jokinen, T., Kangasluoma, J., Kerminen, V. M., Kim, C., Kirkby, J., Kontkanen, J., Kürten, A., Lawler, M. J., Mai, H., Mathot, S., Mauldin, R. L., Molteni, U., Nichman, L., Nie, W., Nieminen, T., Ojdanic, A., Onnela, A., Passananti, M., Petäjä, T., Piel, F., Pospisilova, V., Quéléver, L. L. J., Rissanen, M. P., Rose, C., Sarnela, N., Schallhart, S., Schuchmann, S., Sengupta, K., Simon, M., Sipilä, M., Tauber, C., Tomé, A., Tröstl, J., Väisänen, O., Vogel, A. L., Volkamer, R., Wagner, A. C., Wang, M., Weitz, L., Wimmer, D., Ye, P., Ylisirniö, A., Zha, Q., Carslaw, K. S., Curtius, J., Donahue, N. M., Flagan, R. C., Hansel, A., Riipinen, I., Virtanen, A., Winkler, P. M., Baltensperger, U., Kulmala, M., and Worsnop, D. R.: Multicomponent new particle formation from sulfuric acid, ammonia, and biogenic vapors, Sci. Adv., 4, 1–10, https://doi.org/10.1126/sciadv.aau5363, 2018.
Mertes, P., Pfaffenberger, L., Dommen, J., Kalberer, M., and Baltensperger, U.: Development of a sensitive long path absorption photometer to quantify peroxides in aerosol particles (Peroxide-LOPAP), Atmos. Meas. Tech., 5, 2339–2348, https://doi.org/10.5194/amt-5-2339-2012, 2012.
Najjar, Y. S. H.: Gaseous Pollutants Formation and Their Harmful Effects on Health and Environment, Innov. Energy Policies, 1, 1–9, https://doi.org/10.4303/iep/e101203, 2011.
Pathak, R. K., Presto, A. A., Lane, T. E., Stanier, C. O., Donahue, N. M., and Pandis, S. N.: Ozonolysis of α-pinene: parameterization of secondary organic aerosol mass fraction, Atmos. Chem. Phys., 7, 3811–3821, https://doi.org/10.5194/acp-7-3811-2007, 2007a.
Pathak, R. K., Stanier, C. O., Donahue, N. M., and Pandis, S. N.: Ozonolysis of α-pinene at atmospherically relevant concentrations: Temperature dependence of aerosol mass fractions (yields), J. Geophys. Res.-Atmos., 112, 1–8, https://doi.org/10.1029/2006JD007436, 2007b.
Pierce, J. R. and Adams, P. J.: Efficiency of cloud condensation nuclei formation from ultrafine particles, Atmos. Chem. Phys., 7, 1367–1379, https://doi.org/10.5194/acp-7-1367-2007, 2007.
Riipinen, I., Pierce, J. R., Yli-Juuti, T., Nieminen, T., Häkkinen, S., Ehn, M., Junninen, H., Lehtipalo, K., Petäjä, T., Slowik, J., Chang, R., Shantz, N. C., Abbatt, J., Leaitch, W. R., Kerminen, V.-M., Worsnop, D. R., Pandis, S. N., Donahue, N. M., and Kulmala, M.: Organic condensation: a vital link connecting aerosol formation to cloud condensation nuclei (CCN) concentrations, Atmos. Chem. Phys., 11, 3865–3878, https://doi.org/10.5194/acp-11-3865-2011, 2011.
Saha, P. K. and Grieshop, A. P.: Exploring Divergent Volatility Properties from Yield and Thermodenuder Measurements of Secondary Organic Aerosol from α-Pinene Ozonolysis, Environ. Sci. Technol., 50, 5740–5749, https://doi.org/10.1021/acs.est.6b00303, 2016.
Sarnela, N., Jokinen, T., Duplissy, J., Yan, C., Nieminen, T., Ehn, M., Schobesberger, S., Heinritzi, M., Ehrhart, S., Lehtipalo, K., Tröstl, J., Simon, M., Kürten, A., Leiminger, M., Lawler, M. J., Rissanen, M. P., Bianchi, F., Praplan, A. P., Hakala, J., Amorim, A., Gonin, M., Hansel, A., Kirkby, J., Dommen, J., Curtius, J., Smith, J. N., Petäjä, T., Worsnop, D. R., Kulmala, M., Donahue, N. M., and Sipilä, M.: Measurement–model comparison of stabilized Criegee intermediate and highly oxygenated molecule production in the CLOUD chamber, Atmos. Chem. Phys., 18, 2363–2380, https://doi.org/10.5194/acp-18-2363-2018, 2018.
Shrivastava, M., Cappa, C. D., Fan, J., Goldstein, A. H., Guenther, A. B., Jimenez, J. L., Kuang, C., Laskin, A., Martin, S. T., Ng, N. L., Petaja, T., Pierce, J. R., Rasch, P. J., Roldin, P., Seinfeld, J. H., Shilling, J., Smith, J. N., Thornton, J. A., Volkamer, R., Wang, J., Worsnop, D. R., Zaveri, R. A., Zelenyuk, A., and Zhang, Q.: Recent advances in understanding secondary organic aerosol: Implications for global climate forcing, Rev. Geophys., 55, 509–559, https://doi.org/10.1002/2016RG000540, 2017.
Smith, G. D., Woods, E., DeForest, C. L., Baer, T., and Miller, R. E.: Reactive uptake of ozone by oleic acid aerosol particles: Application of single-particle mass spectrometry to heterogeneous reaction kinetics, J. Phys. Chem. A, 106, 8085–8095, https://doi.org/10.1021/jp020527t, 2002.
Stangl, C. M., Krasnomowitz, J. M., Apsokardu, M. J., Tiszenkel, L., Ouyang, Q., Lee, S., and Johnston, M. V.: Sulfur Dioxide Modifies Aerosol Particle Formation and Growth by Ozonolysis of Monoterpenes and Isoprene, J. Geophys. Res.-Atmos., 124, 2018JD030064, https://doi.org/10.1029/2018JD030064, 2019.
Stanier, C. O., Pathak, R. K., and Pandis, S. N.: Measurements of the volatility of aerosols from α-pinene ozonolysis, Environ. Sci. Technol., 41, 2756–2763, https://doi.org/10.1021/es0519280, 2007.
Thompson, J. E.: Airborne Particulate Matter: Human Exposure and Health Effects, J. Occup. Environ. Med., 60, 392–423, https://doi.org/10.1097/JOM.0000000000001277, 2018.
Tolocka, M. P., Jang, M., Ginter, J. M., Cox, F. J., Kamens, R. M., and Johnston, M. V.: Formation of Oligomers in Secondary Organic Aerosol, Environ. Sci. Technol., 38, 1428–1434, https://doi.org/10.1021/es035030r, 2004a.
Tolocka, M. P., Saul, T. D., and Johnston, M. V.: Reactive Uptake of Nitric Acid into Aqueous Sodium Chloride Droplets Using Real-Time Single-Particle Mass Spectrometry, J. Phys. Chem. A, 108, 2659–2665, https://doi.org/10.1021/jp036612y, 2004b.
Trump, E. R. and Donahue, N. M.: Oligomer formation within secondary organic aerosols: equilibrium and dynamic considerations, Atmos. Chem. Phys., 14, 3691–3701, https://doi.org/10.5194/acp-14-3691-2014, 2014.
Vestenius, M., Hellén, H., Levula, J., Kuronen, P., Helminen, K. J., Nieminen, T., Kulmala, M., and Hakola, H.: Acidic reaction products of monoterpenes and sesquiterpenes in atmospheric fine particles in a boreal forest, Atmos. Chem. Phys., 14, 7883–7893, https://doi.org/10.5194/acp-14-7883-2014, 2014.
Xavier, C., Rusanen, A., Zhou, P., Dean, C., Pichelstorfer, L., Roldin, P., and Boy, M.: Aerosol mass yields of selected biogenic volatile organic compounds – a theoretical study with nearly explicit gas-phase chemistry, Atmos. Chem. Phys., 19, 13741–13758, https://doi.org/10.5194/acp-19-13741-2019, 2019.
Zaveri, R. A., Shilling, J. E., Zelenyuk, A., Liu, J., Bell, D. M., D'Ambro, E. L., Gaston, C. J., Thornton, J. A., Laskin, A., Lin, P., Wilson, J., Easter, R. C., Wang, J., Bertram, A. K., Martin, S. T., Seinfeld, J. H., and Worsnop, D. R.: Growth Kinetics and Size Distribution Dynamics of Viscous Secondary Organic Aerosol, Environ. Sci. Technol., 52, 1191–1199, https://doi.org/10.1021/acs.est.7b04623, 2018.
Zaveri, R. A., Shilling, J. E., Zelenyuk, A., Zawadowicz, M. A., Suski, K., China, S., Bell, D. M., Veghte, D., and Laskin, A.: Particle-Phase Diffusion Modulates Partitioning of Semivolatile Organic Compounds to Aged Secondary Organic Aerosol, Environ. Sci. Technol., 54, 2595–2605, https://doi.org/10.1021/acs.est.9b05514, 2020.
Zhang, D. and Zhang, R.: Ozonolysis of α -pinene and B -pinene: Kinetics and mechanism, J. Chem. Phys., 122, 114308, https://doi.org/10.1063/1.1862616, 2005.
Zhang, X., McVay, R. C., Huang, D. D., Dalleska, N. F., Aumont, B., Flagan, R. C., and Seinfeld, J. H.: Formation and evolution of molecular products in α-pinene secondary organic aerosol, P. Natl. Acad. Sci. USA, 112, 14168–14173, https://doi.org/10.1073/pnas.1517742112, 2015.
Zhou, S., Rivera-Rios, J. C., Keutsch, F. N., and Abbatt, J. P. D.: Identification of organic hydroperoxides and peroxy acids using atmospheric pressure chemical ionization–tandem mass spectrometry (APCI-MS/MS): application to secondary organic aerosol, Atmos. Meas. Tech., 11, 3081–3089, https://doi.org/10.5194/amt-11-3081-2018, 2018.
Zhu, J. and Penner, J. E.: Global Modeling of Secondary Organic Aerosol With Organic Nucleation, J. Geophys. Res.-Atmos., 124, 8260–8286, https://doi.org/10.1029/2019JD030414, 2019.
Ziemann, P. J. and Atkinson, R.: Kinetics, products, and mechanisms of secondary organic aerosol formation, Chem. Soc. Rev., 41, 6582–6605, https://doi.org/10.1039/c2cs35122f, 2012.
- Abstract
- Introduction
- Simulating particle growth by SOA formation
- Particle growth under atmospherically relevant conditions
- Particle growth inside a flow tube reactor
- Interpreting flow tube measurements
- Conclusions
- Code availability
- Data availability
- Author contributions
- Competing interests
- Disclaimer
- Financial support
- Review statement
- References