the Creative Commons Attribution 4.0 License.
the Creative Commons Attribution 4.0 License.
 | 19 Aug 2022
Design and fabrication of an electrostatic precipitator for infrared spectroscopy
Nikunj Dudani
Satoshi Takahama
Infrared (IR) spectroscopy is a direct measurement technique for chemical characterization of aerosols that can be applied without solvent extraction thermal treatment a priori. This technique has been used for chemical speciation, source apportionment, and detailed characterization of the complex organic fraction of atmospheric particles. Currently, most IR analyses are performed by transmission through porous membranes on which the particles are collected via filtration. The membrane materials interfere with the IR spectra through scattering and absorption that not only make extracting the chemical information on aerosol harder but also limit the lower extent of detection. An alternative IR measurement method that does not inherit such limitations is to collect the particles on an IR transparent material. We present an electrostatic precipitator (ESP) design that enables such measurements by collection on a zinc selenide (ZnSe) crystal. Through numerical simulations and rapid prototyping with 3D printing, we design and fabricate a device which is tested with polydispersed ammonium sulfate particles to evaluate the quantitative chemical composition estimates against particle count reference. Furthermore, with an image analysis procedure and using variable aperture of the IR spectrometer, we analyze the radial mass distribution. The collector has high collection efficiency (82 ± 8 %) and linear response to mass loading (R2 > 0.94) with a semi-uniform deposition. The method of design and fabrication is transferable to other applications, and the current ESP collector can provide directions for further design improvements.
- Article
(2002 KB) - Full-text XML
-
Supplement
(4822 KB) - BibTeX
- EndNote


Mid-infrared (IR) spectroscopy is a nondestructive technique that can be used to directly probe the chemical signature of particles without solvent extraction or similar transformations for sample preparation. Absorbance signatures of major components of PM2.5 (organic matter, elemental carbon, mineral dust, and inorganic salts) (Ivlev and Popova, 1973; Cunningham et al., 1974; Bogard et al., 1982; Mcclenny et al., 1985; Pollard et al., 1990; Debus et al., 2022; Kidd et al., 2014; Yu et al., 2018) and tracer species (Yazdani et al., 2021) can be found in the IR spectrum. To obtain an IR spectrum of the particles, they must first be isolated from the surrounding vapor as they also absorb IR and are present in comparable or greater concentrations as particle constituents.
Capability for quantification of chemical concentrations and source contributions has been demonstrated in transmission-mode analysis on particles isolated on “optically thin” polytetrafluoroethylene (PTFE) membrane filters with the judicious use of appropriate calibration standards and algorithms (Maria, 2003; Reff et al., 2007; Russell et al., 2009; Takahama et al., 2013; Ruthenburg et al., 2014; Takahama et al., 2019). However, this approach suffers from measurement uncertainties due to spectroscopic interferences from the substrate, as PTFE filters have strong absorption peaks in the fingerprint region and also scatter radiation (Mcclenny et al., 1985), which is partially handed by statistical algorithms for removal (Kuzmiakova et al., 2016; Yazdani et al., 2021). Reflectance spectra of particles collected on quartz-fiber filters, glass-fiber filters, or reflective foils vary in magnitude of interferences but essentially require nonlinear calibration functions for quantitative analysis (Tsai and Kuo, 2006; Hopey et al., 2008; Parks et al., 2021).
One solution to this problem is to collect particles directly onto optical crystals transparent to IR for transmission-mode analysis, but no method exists to achieve high collection efficiency on such substrates. Filtration is not amenable with conventional IR transparent crystals. Impaction has been used for collection onto such crystals in the past (Fischer, 1975; Allen et al., 1994; Blando et al., 1998; Sax et al., 2005) but has material-dependent bounce-off effects, size stratification, and undesirable deposition characteristics for spectroscopy (Marple, 2004; Blando et al., 2001; Virtanen et al., 2010). ESP is a versatile method, has a low pressure drop unlike both the other methods, and is selected for this application.
ESP geometry for particle collection generally falls into two broad categories: a translationally symmetric design (linear ESP) (Harrick and Beckmann, 1974; Ofner et al., 2009) or a radially symmetric design (radial ESP) (Dixkens and Fissan, 1991; Fierz, 2007; Kala et al., 2012). In both systems, the electric field is perpendicular to the fluid flow that is parallel to the collection surface. Additionally, in most radial ESPs, the fluid enters the collection region through a tube perpendicular to the collection surface before moving radially outwards. ESPs can also be categorized by single-stage or two-stage configurations, depending on whether the charging and collection are handled with the same or a different set of electrodes – the former is simpler in design, while the latter permits better control in deposition. However, existing designs across these categories either require high electric field strengths for operation that can cause chemical modification of the aerosol or have high size segregation in deposition.
We therefore introduce a new two-stage radial ESP for collection of particles on IR transparent crystals and report on its capability for quantitative IR analysis. A charger with low chemical interference is selected from the existing literature, while a new radial collector is designed to permit high collection efficiency and mass throughput. The choice of charger is germane since the strong ionization in the chargers results in formation of reactive molecules such as , O+, , N+, NO+, and H3O+ (Volckens and Leith, 2002; Arnold et al., 1997), leading to changes in particle composition through ozone reactions and gas-to-particle conversion (Volckens and Leith, 2002). Numerous chargers have been developed and used either through direct corona discharge to charge the particles (Hewitt, 1957; Liu and Pui, 1975; Biskos et al., 2005; Whitby, 1961; Tsai et al., 2010) or indirect corona discharge with charged ions in gas flow generally mixed with the particle flow separately (Medved et al., 2000; Marquard et al., 2006; Kimoto et al., 2010). Indirect chargers have higher charge levels but lead to diluted particle concentrations after mixing, which reduces mass throughput. Direct or indirect photoelectric discharge (Burtscher et al., 1982; Grob et al., 2014; Nishida et al., 2018; Shimada et al., 1999) – especially with UV photoionization (Hontañón and Kruis, 2008; Grob et al., 2013) – leads to fewer chemical artifacts but generally has strong dependence on the conductivity of the particle (which varies by composition). Two different unipolar chargers with minimal ozone generation suitable for chemical sampling have been proposed: one using carbon fiber ionizer technology (Han et al., 2008) and another using a wire-to-wire configuration of metal electrodes (Han et al., 2017). We adapt the latter for this work.
The radial collector design, numerical simulation, and novel methods for fabrication using 3D printing and post-treatment (together with the rest of the ESP) are described in the rest of the paper. The remaining portion of the paper describes the methods and results for characterization of collected mass and its relationship to apparent IR absorbance.
In this section, we describe the design objectives and constraints (Sect. 2.1), numerical simulations for virtual performance characterization (Sect. 2.2), and 3D printing (Sect. 2.3) with acrylonitrile butadiene styrene (ABS). The fabricated device and an aerosol flow system (Sect. 2.4) were used to collect ammonium sulfate particles on a 25.4 mm diameter ZnSe crystal, which has desirable chemical, electrical, and optical properties for this application. The IR spectra of this crystal are acquired before and after sampling (Sect. 2.5). The spatial deposition pattern on this crystal was also characterized using optical microscopy, electron microscopy, and IR analysis (Sect. 2.6). All of these measurements are combined to evaluate the quantitative response of the IR measurement with particle loading (Sect. 2.7).
2.1 Design of a radial ESP
A two-stage radially symmetric (radial) ESP was selected for geometry and flow design. Separating the charging and collection permits greater control over the conditions for charging and collection within each stage. The radial collector configuration does not have flow and collection directionality that is inherent in a linear ESP, which could theoretically result in some directional dependence in the particle deposition based on particle size and flow rate. The radial symmetry in deposition profile is consistent with the transmission IR beam. The resulting design blueprint has a particle charger connected to an ESP where the flow enters perpendicular to the collection surface, moves radially outward, and is subsequently collected, as illustrated in the device schematic (Fig. 1a).

Figure 1(a) A schematic representation of the radial ESP where particles enter through an inlet tube that is extended closer to the collection crystal through a protrusion. The particles are focused on the crystal using high-voltage electrodes near the exit of the tube, as well as above and around the crystal. (b) Radial particle deposition profile as obtained from a COMSOL simulation of velocity, electrostatics, and particle tracing on the device in (a) – the mound of particles near r = 5 mm corresponds to the position of the protrusion.
One of the critical requirements in the design is to limit the high electric field strength and voltage in the vicinity of the particles, mainly because regions of high electric field facilitate ion production that modifies the chemical composition of the particles (Ofner et al., 2009). For the charging stage, another application wherein ozone production is an undeniable consideration is personal bio-aerosol sampling (PEBS), and the PEBS's wire-to-wire electrode arrangement in the charger (Han et al., 2017) was specifically designed to maintain a low ozone concentration (< 10 ppb). In this work, we employ a similar wire-to-wire charger and design the collector stage with the following desired features: (1) low electric field strength E0 (lower than 1 kV mm−1; a factor of 3 lower than the theoretical breakdown field of air at 3 kV mm−1), (2) low electrode voltage V0 (lower than 10 kV), (3) high collection efficiency (greater than 70 %), and (4) high flow rate (for example, a 1.7 L min−1 flow rate would result in a 1 µg total mass collection in 1 h for an ambient concentration of 10 µg m−3).
In the collector, the combination of an electric field limit to 1 kV mm−1 and a voltage limit of 5 kV imposed a minimum electrode separation distance of 5 mm. For conditions wherein inertial effects and diffusion effects can be neglected, the collection in the radial ESP is a result of the trade-off between the drag force on the particle parallel to the collection surface (r direction) and the electrostatic force into the surface (−z direction). For a given flow condition, a stronger electric field will result in a higher particle collection efficiency, resulting in the closest separation distance of 5 mm being the most desirable, as any larger separation distance would either require that V0 be higher or E0 be lower than 1 kV mm−1.
Based on these design constraints, prototypes were developed using 3D-CAD software (Sect. S1 Fig. S1a–c in the Supplement), simulated for particle collection (Sect. 2.2), and assembled after 3D printing and post-treating (Sects. 2.3 and S1 Fig. S1d in the Supplement). The charger (modeled after Han et al., 2017) was 3D-printed using ABS and had the same dimensions of a 25.4 mm diameter tube, with the circular ground electrode wire made from 0.5 mm diameter stainless-steel wire, and the ionizer was a 0.075 mm diameter tungsten wire, 25.4 mm in length sitting symmetrically about the ground electrode while held rigidly in place at the ends through two thin glass tubes (1 mm outer diameter) that were connected to the ABS housing. The total length of the flow channel was 60 mm and had a further gradually expanding and contracting part at either end (40 mm in length and having 10 mm diameter at the other ends, where stainless-steel tubes were used to connect the charger to the inlet and the collector).
2.2 Numerical simulations
Particle trajectories were numerically simulated in an electrostatic and flow field using COMSOL Multiphysics software. 2D axisymmetric simulations allow much faster simulations, and the fluid flow was simulated using laminar flow physics. The simulation was made with dimensions and materials replicating the actual fabricated device. A radial ESP collector (made of ABS) was simulated with a tubular inlet facing the substrate (ZnSe crystal) resting on the ground electrode, while the high-voltage electrodes were places near the outlet of the tube and at a fixed distance above the collection surface (Sect. S1 Fig. S2a in the Supplement) using an extremely fine physics-controlled mesh. The electrostatic field (Sect. S1 Fig. S2b) and the fluid flow field (Sect. S1 Fig. S2c) were simulated using a stationary solver with 10−3 relative tolerance for convergence. Despite large-scale eddies in laminar flow simulations, no turbulent simulation was required, mainly because mesh refinement analysis yielded identical laminar flow results (for example, changing the mesh to a finer grid resulted in similar flow fields). This was confirmed using mesh refinement in a 3D simulation of the device design with laminar flow field. The in-variance to mesh refinement suggests that the obtained calculations were indeed resolved with laminar physics alone and did not represent a erroneous flow field.
Time-dependent particle trajectories were simulated in the two stationary fields (Sect. S1 Fig. S2d) with convergence at 10−5 relative tolerance. No coupling of the perturbations of the particles on the stationary fields is employed as the particles are too small to cause substantial change. A total of 1000 charged particles were released uniformly spaced at the top of the inlet tube at t=0 until they collected on the surface, collided with another surface, or ran off. The charge levels on the particle were assumed to be proportional to particle diameter (as assumed for diffusion charging) with around one elementary charge for every 20 nm diameter (Biskos et al., 2005). A couple of additional charge values around the linear value were also simulated for each particle size as the charge can be expected to be higher on larger particles if particle charge is a combined effect of field and diffusion charging (Hinds, 1999; Marquard, 2007). The particle diameter Dp was manually adjusted for the slip correction factor (Allen and Raabe, 1985), where Kn is the Knudsen number, in the drag force calculations for the particle simulation.
An iterative simulation process was used to explore geometries and operating parameters to find a configuration permitting high flow rates (for high throughput) and long residence time of particles between the electrodes (to improve collection efficiency) within electric field constraints described above. At the end of each simulation, the position of the particles on the crystal was used to calculate the histogram of the relative frequency at different radial positions (Fig. 1b) as it represents the spatial distribution. Collection efficiency was calculated using the number of particles out of the 1000 that were collected on the surface (i.e., until r < 12.7 mm) – measured through the cumulative frequency from the histogram in Fig. 1b. A simulation of the device with an inlet radius of 10 mm, flow rate of 2.1 L min−1, E0 = 1 kV mm−1, and one elementary charge per every 20 nm diameter for 100 nm < Dp < 800 nm resulted in mean collection efficiencies between 65 % and 90 % (mean of 75 %), with smaller particles showing higher efficiency. An overall increase in collection efficiency of 5 % (mean of 80 %) was achieved in the simulations by incorporating a protrusion that extended the inlet tube closer to the collection surface while keeping the electrodes at a farther distance (Sect. S1 Fig. S2a), a feature we incorporated in the final design. We satisficed with this design for fabrication.
The resulting device is a radial ESP with the particles entering through a 10 mm diameter tube, perpendicular to a 25.4 mm diameter and 5 mm thick ZnSe crystal, which sits on the ground electrode, and the top electrode is positioned at 5 mm above the top crystal surface and at a diameter of 36 mm around the crystal (such that the minimum separation between the crystal surface and the electrode is 5 mm). Furthermore, the entry tube is extended by 4 mm (referred to as “protrusion”) and brought closer to have the exit of the tube 1 mm above the crystal. The electrodes are made using Ag or Cu materials, and the other parts of the device are 3D-printed with ABS (including the tube extension). The device is operated to maintain E0 = 1 kV mm−1, voltage difference of V0 = 5 kV, and operating flow rate of Q = 2.1 L min−1.
This work was completed prior to the publication of an analytical radial electrostatic collector model by Preger et al. (2020). Their model estimates collection spot size as a function of flow rate and electric field strength in a radial collector with parallel plates and small inlet radii, which could now be used in the selection of collector plate or operating parameters for devices which follow these geometric constraints.
2.3 Fabrication via 3D printing
We discuss three considerations for fabrication: material selection, printing protocol, and post-printing assembly and treatment. For rapid prototyping there are limited materials that can be 3D-printed reliably: nylon, ABS, and polylactic acid (PLA) These materials have trade-offs in print reliability, durability, chemical interferences, and electrical properties. PLA is not stable to heat, is less durable, and has known outgassing issues, limiting its application for aerosol chemical analysis. Nylon is a stronger material than ABS but lies higher in the triboelectric series, making it prone to more electrostatic losses of particles near the surface. Moreover, in our observations the main source of leaks in the initial prototypes was through the in-layer space between each print layer. The spacing was much higher in nylon as it can absorb moisture during and after printing, and it results in larger printing defects and layer separation. The additional strength of nylon comes at the cost of being more brittle and harder to seal, leaving ABS as our choice of material for this application. The strength of ABS is sufficient for inherently low-pressure-drop ESP applications as it has a yield strength of ∼ 25 MPa, which is much higher than the expected hoop stress of ∼ 1.7 MPa acting on a 50 mm internal diameter cylinder design with a thin 2 mm ABS body operated with an extreme 1 atm pressure.
The 3D Systems CubePro 3D printer was used to fabricate all printed parts. Warping, cracking, curling, and stringing were reduced with proper printing speed, temperature, and layer spacing adjustment. The print bed was regularly leveled to better adjust to the filament feed rate, leading to smoother printed objects. The feed rate and temperature were self-controlled by the CubePro 3D printer, and the print chamber was kept heated generally up to 55 ∘C (failure in the chamber heating results in poor print quality due to spatially uneven cooling). Using a pre-heated print chamber along with a water-soluble glue that was applied to the print surface and dried completely before starting each print job substantially improved bed adhesion, which can be problematic in longer ABS printing jobs. Finally, the ESP was printed with as few parts as possible to have higher structural stability and avoid forced turbulence because of material discontinuity at the joints. This strategy required fabrication of parts with complex overhangs. Using filler materials with dual-head printers is a possible solution but has limited application for larger parts – as the printing volume and time scale cubically to the size on top of which printing the entire hollow part with a filler substantially increases the chances of print failure. We instead pursued an alternate strategy of printing the parts tilted at 45∘. The parts which have an angle of 90∘ or lower ranged within ± 45∘ with respect to the bed and were hence all inter-supported and further strengthened by using simple line or point supports on the surfaces. Increasing the size of the base on the print bed promoted bed adhesion, and further use of side supports enabled reliable printing of surfaces supported at the largest theoretical angle (45∘).
Further post-assembly and treatment strategies were necessary to reduce gas leak through (1) areas where two parts join and (2) the layer spacing in the print surface. The junctions where two parts assemble were sealed by extending the joining surfaces outward to act as larger flanges and were sealed using an o-ring placed in a groove designed for the static axial (face) assembly, with the pressure lower on the interior. The flanges and the greased (using GE Bayer Silicones Baysilon grease) o-ring were assembled together using multiple screws along the circumference using latches, magnets, or clips. In our observation, even using a calculated number of screws based on the theoretical bite angle sometimes resulted in leaks. A reliable solution was to use a series of magnets arranged in a circumferential Halbach array that directs the field in the axial direction. Two such arrays of 16 magnets were designed with each array being housed in a single 3D-printed part shaped as a leaf spring to redirect the axial force evenly over the flange. The combined force applied was around 1 kN and was sufficient to eliminate all leaks. Another practical advantage of using this design was that despite the very strong force, opening the flange was possible by rotating one of the arrays such that opposite polarities align – resulting in an easy disassembly and reassembly, which is useful for changing the ZnSe crystal between experiments.
The inter-layer spacing in the 3D prints was sealed along with smoothing the rough 3D-printed surface by manually rubbing the outside surface with acetone while pressing down on the surface until no spots were left. Since ABS dissolves in acetone, surfaces are sometimes smoothed by suspending an ABS part in a chamber above an acetone vapor bath. In our observation, the method resulted in overly softened parts or unsealed portions numerous times due to the sensitivity to the bath time and the acetone amount. Therefore, the surface and joint sealing procedure was repeated until the assembled device could hold vacuum at levels of −10 kPa for over 5 min. To locate sources of leaks, positive pressure was created using compressed airflow through the assembly (static pressure in a closed system to avoid a pressure buildup inside 3D-printed parts, which is a safety concern), and a soap solution was applied over the entire printed surface and joint areas. Leak locations were identified by the resulting bubbles and then sealed. Sealing larger gaps in nylon parts required a coat of epoxy solution thinned using acetone for easier application, which required longer preparation times and higher chances of smaller holes remaining after treatment because of the higher surface tension of the epoxy solution, further highlighting the advantages of ABS for prototyping.
2.4 Aerosol flow system
Laboratory-generated ammonium sulfate ((NH4)2SO4) particles were used for ESP performance evaluation, mainly because the solid nearly spherical particles generated are non-volatile and allow us to neglect any mass change between collection and IR measurement. Two flow system setups were used: one to characterize the generated and collected particle size distribution using a scanning mobility particle sizer (SMPS) (Fig. 2a) and another to measure the total particle counts collected at higher time resolution over the course of each experiment with a condensation particle counter (CPC) (Fig. 2b).
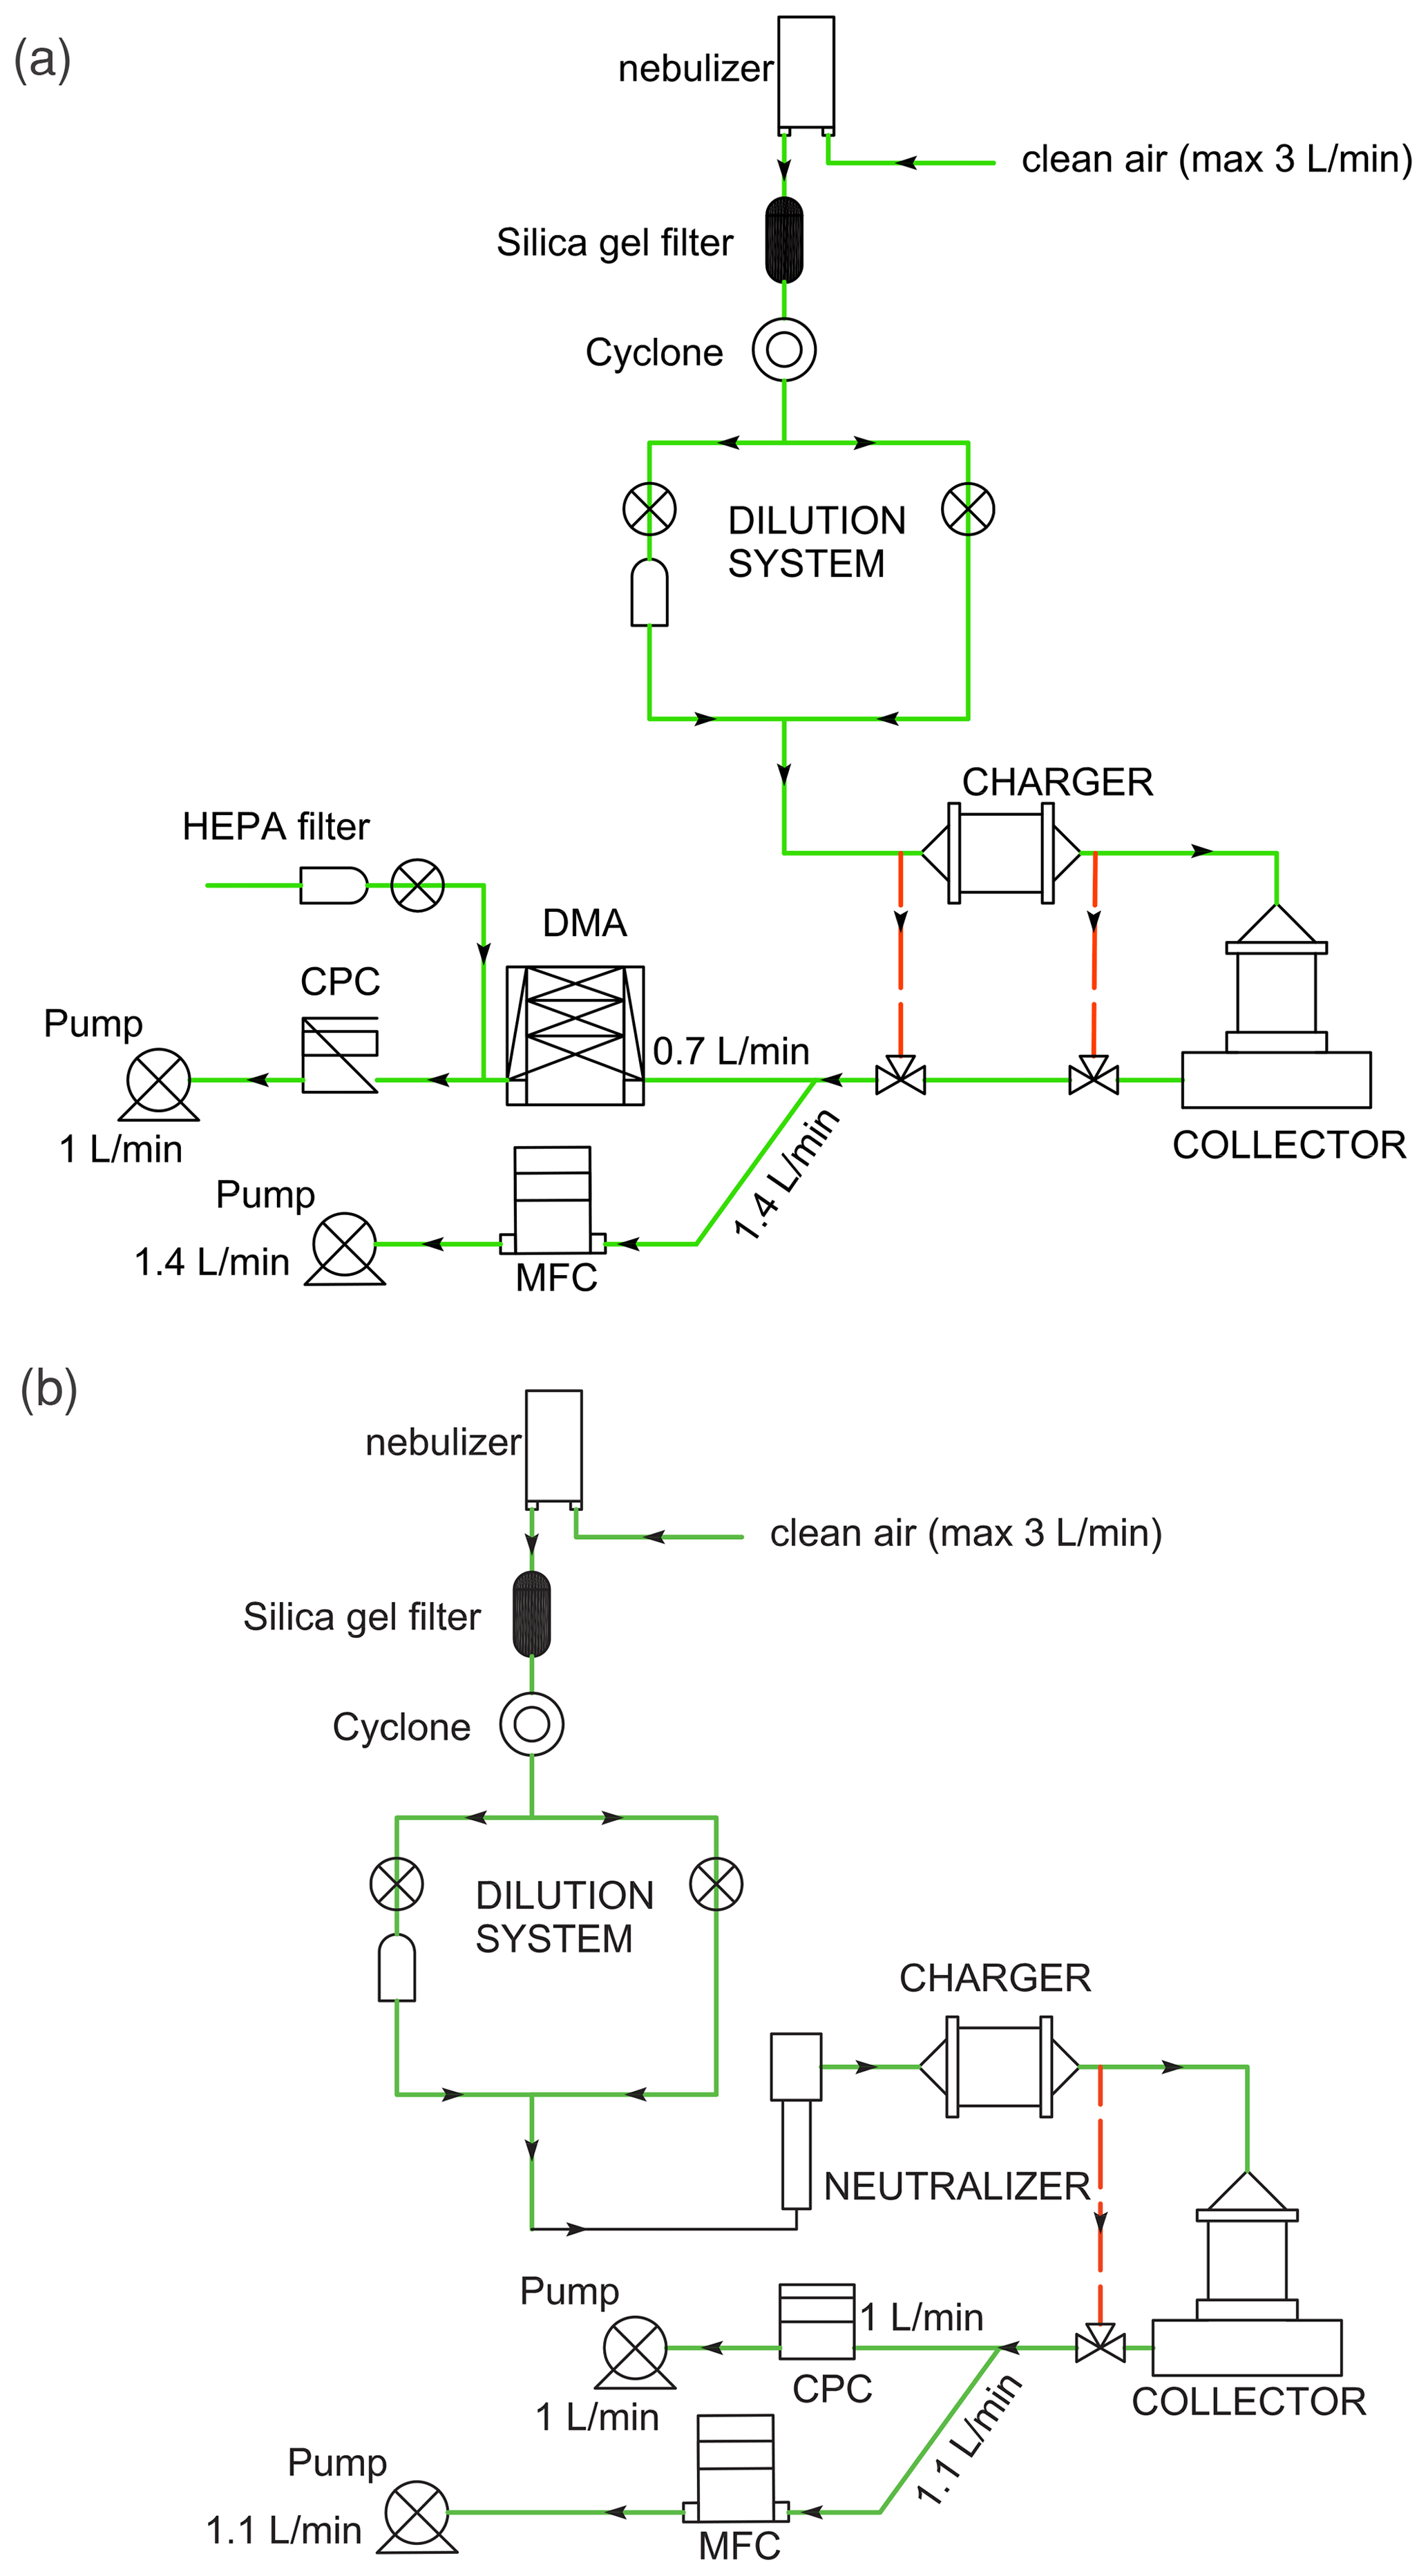
Figure 2Diagram of the aerosol flow system experiments (the green line is the main flow line, and the red dotted lines are the alternate bypass lines) for (a) obtaining the particle size distribution and (b) obtaining the mass loading reference through the CPC particle counts.
Ammonium sulfate particles were continuously nebulized from freshly prepared 5 g L−1 concentration solutions in Milli-Q water with TSI, Inc., 3076 atomizer and dried using silica gel denuder (machined in-house). The particles were passed through a cyclone to remove supermicron particles and the concentration was adjusted with a dilution system before introducing the particles into the ESP. Different bypass lines (red dotted flow lines) were set up to measure the size distribution or particle count at different flow-line points. A mass flow controller (MFC, MKS) with a vacuum pump (GAST) was used to maintain the desired ESP flow (2.1 L min−1).
The charger was operated at a 6 kV voltage on the tungsten wire, and the ESP was operated at 5 kV voltage difference between the top electrode and the top surface of the ZnSe crystal. We used a positively biased ground electrode in the ESP (at 1 kV) to avoid potential negative voltage in any part of the assembly. Moreover, as the ZnSe crystal is not perfectly conducting, we observed that the top surface of the ZnSe crystal was around 1 kV voltage higher than the ground electrode voltage, resulting in a top electrode voltage of 7 kV for maintaining the 5 kV voltage difference. The entire assembly was operated at a 2.1 L min−1 flow rate that was maintained using two pumps – one connected through the CPC and the other through a mass flow controller.
Particle size distributions between 17.5 to 982 nm were measured with a scanning phase of 210 s and a down-sampling time of 30 s with an aerosol flow rate of 0.7 L min−1 and a sheath flow rate of 2 L min−1. Size measurements were obtained with 6, 20, and 33 scans at three points of interest: at the inlet of the ESP (), the outlet of the charger (), and the outlet of the collector (). Additionally, and were measured again at the end of the experiment, with 6 and 13 scans, respectively. The mean volume of collected particles was computed from the collected distribution with flow rate Q and collection interval t.
The transient raw particle count experiment (Fig. 2b) was conducted for different collection intervals, t (from 5 min to 3 h), and adjusting the particle concentration to around 9000–10 000 particles cm−3, i.e., below the operating limit of the CPC. The flow line is switched from measuring from the bypass to in the main line at a resolution of one measurement per second. Because the particle number may drift during the duration of the experiment, the average and deviation in number concentrations over this period ( and , respectively) are characterized for calculation. The corresponding difference in the concentrations between the charger and collector outlet is used to estimate the number of particles collected (N∗) and its error (δN∗).
N∗ and are used to calculate the collected mass (Sect. 2.7).
2.5 Infrared spectroscopy
The IR absorbance spectra of the particle-loaded and clean ZnSe crystal were measured with the Vertex 80 with a deuterated lanthanum α alanine-doped triglycine sulfate (DLaTGS) detector. Each spectrum was measured after purging the measurement chamber for 3 min with dry, compressed air (from Bruker gas generator) after introducing the sample and was measured with an average of 64 scans over 4000–400 cm−1 with 4 cm−1 resolution. The purged chamber was used as the background for measurement of the sample and clean crystal spectra. The default aperture (Jacquinot stop) setting of 6 mm diameter was used, except for a set of experiments to study the spatial distribution of deposited particles (VAIRS, Sect. 2.6). The beam spot is approximately 80 % greater in diameter than the aperture setting (Bruker rep., personal communication, 2018). Two identical ZnSe collection crystals (WG71050 from Thorlabs Inc.) were used for all the experiments. The crystal was cleaned between each loading and IR measurement by alternating between rubbing with a clean wipe (Kimberly Clark 7552) dampened with isopropyl alcohol (IPA, 99.8 %, GC-grade; Sigma Aldrich) and another with Milli-Q water.
The raw IR spectra are processed to correct small deviations in the baseline, which can arise from changes in background conditions in the IR chamber. In this work, (NH4)2SO4 was the only test material, and a method that automatically corrects the baseline is employed. First, the absorbance spectra of the cleaned collection crystal are subtracted from the particle-loaded absorption spectra. The slope of absorbance values is used in combination with the moving mean of absorbance to identify non-absorbing baseline points (Sect. S2 in the Supplement). A smoothing spline was fitted to interpolate the baseline through absorption regions and then subtracted from the original spectrum.
2.6 Spatial profiling
The spatial profile is primarily assessed using optical image analysis and supported by electron microscopy as well as a method we refer to as variable aperture infrared spectroscopy (VAIRS) in this work. A top-view image of the ZnSe crystal was taken with an optical camera after each deposition experiment. Using a dark background to contrast the bright ammonium sulfate particles, we took an image of the particle-loaded crystal under diffused light using a digital camera (Firefly DE300, focal depth of 35 mm with 2048 pixel × 1536 pixel resolution) kept at a fixed height of 30 cm. The image was analyzed by converting to grayscale (0 to 255 pixel intensity) and finding the radial change in pixel intensity from the analyzed center and periphery of the crystal.
Scanning electron microscopy (SEM) analysis was performed to qualitatively assess the particle distribution at different radial positions using the FEI Teneo microscope. Secondary electrons were detected using the Everhart–Thornley detector while using a 5 kV voltage and low 50 pA current to prevent charge buildup on the particles. The crystal was introduced in the SEM chamber without any conductive coating, and images were taken from a working distance of 6 mm.
For VAIRS analysis, IR absorbance intensities for different apertures (0.25 to 8 mm) were used to compute the surface mass distribution. By varying the aperture setting and consequently the beam spot size on the surface (which is around 80 % larger than the aperture), the observed change in absorbance intensity of the peak near 1410 cm−1 was representative of the areal mass density of the deposition under the beam. From the difference in intensities among successive beam areas, the mass per unit annulus area was estimated.
2.7 Quantitative evaluation
The quantitative analysis of spectra outlined in this work is enabled through the condition that small particles are spaced far apart (weak scattering approximation) on the collecting crystal. Further details for the following statements are provided in Sects. S3–S5 in the Supplement. The absorbance contribution from particles is obtained from subtracting the absorbance of the clean crystal from that of the sample. The transmittance T of the sample used for calculation of absorbance is obtained by ratioing the sample spectrum to the single-beam background of the purged chamber, and transmittance Tc of the clean crystal is obtained prior to the experiments by ratioing a clean ZnSe crystal to the purged chamber background. Neglecting scattering interactions between the particle and crystal as well as among particles, the absorbance A is related to the mass of deposited particles per unit area of a disk, , inscribed by the beam radius rb, substance density ρ, and the decadic volume attenuation coefficient α10,v (the Naperian volume attenuation coefficient divided by ln 10) (Adamson, 1979; Bohren and Huffman, 1983; Hapke, 2012):
is the decadic form of the mass attenuation coefficient, which can be related to the molar attenuation coefficient previously used to characterize IR response (Allen et al., 1994; Maria, 2003) and also the molecular absorption cross section used in other applications. Alternatively, the areal mass density can be conceptualized as the equivalent thickness of the sample in the form of a void-free film (without coherent interferences).
The mean areal density over the entire crystal is calculated from the total deposited volume , estimated from the product of the SMPS and CPC measurement outputs:
N∗ is the cumulative number of particles deposited from the CPC (Eq. 1 and Sect. 3.1), is the mean volume obtained from the measured size distribution from the SMPS (Sect. 3.1), and ρ is the mass density of the substance (ammonium sulfate). The mean areal density under the beam is calculated through an adjustment factor ϕR(rb):
The value of this adjustment factor is calculated from the scattered intensity I∗ (Sect. 3.2) integrated over various radii, which is interpreted as being proportional to mass loading:
From measurement, is estimated from individual experiments by dividing the apparent absorbance by or collectively determined by calibration for specific wavenumbers at peak apexes. These values are compared against theoretical values obtained from previously reported refractive indices of ammonium sulfate. Given the size range of particles used in our study (Rayleigh regime), absorption is the dominant process leading to attenuation of IR radiation by particles. In the electrostatics approximation (van de Hulst, 1981), the volume attenuation coefficient of such small particles is related to the vacuum wavenumber and complex refractive index of the substance comprising the particles (Bohren and Huffman, 1983):
In contrast, the decadic linear absorption coefficient α10 that would be used in place of α10,v in Eq. (2) for a homogeneous medium (i.e., bulk substance that excludes effects of dielectric boundaries that gives rise to reflection and scattering) follows a different relation with the refractive index and is also used as a point of comparison:
For a collection of tenuous particles (Rayleigh–Gans–Debye approximation), the volume absorption coefficient and linear absorption coefficient are related in the weak absorption limit as (Bohren and Huffman, 1983), but this condition does not strictly apply here due to the sharp contrast in the refractive index of ammonium sulfate and that of the surrounding medium (air). α10,v is evaluated in Sect. 3.3. The ratio of α10,v to α10 deviates from unity, as calculated from reference spectra for ammonium sulfate (Earle et al., 2006) (Sect. S3 Fig. S4a in the Supplement), especially near the absorption peaks.
We discuss the generated and collected particle size distributions (Sect. 3.1) and spatial deposition profiles (Sect. 3.2) used to estimate the mass deposited within the probing area of the IR beam, and then we evaluate how spectral absorbance relates to this estimated mass (Sect. 3.3).
3.1 Particle size distributions and collection efficiency
The measured average particle size distributions at the charger inlet (), charger outlet (), and collector outlet () according to the described method (Sect. 2.4) shows charger penetration of 78 % ± 6 % (over the particle size range Dp < 982 nm) and a collection efficiency of 82 % ± 8 % on the fraction of particles at the charger outlet (Fig. 3a). The charger efficiency was in accordance with the ones reported in the charger design (between 75 % and 90 %) at the operating voltage of 6 kV but measured only for higher flow rates (Han et al., 2017). The mass mean diameter of the collector fraction was 207 nm, and an additional 5 % mass was estimated to have been present in the system using a lognormal fit extension of the measured volume distribution (which is limited till 982 nm). The lognormal distribution fit was used to obtain a tail that extended further from 982 nm and was scaled to match the volume distribution at the last bin (982 nm).
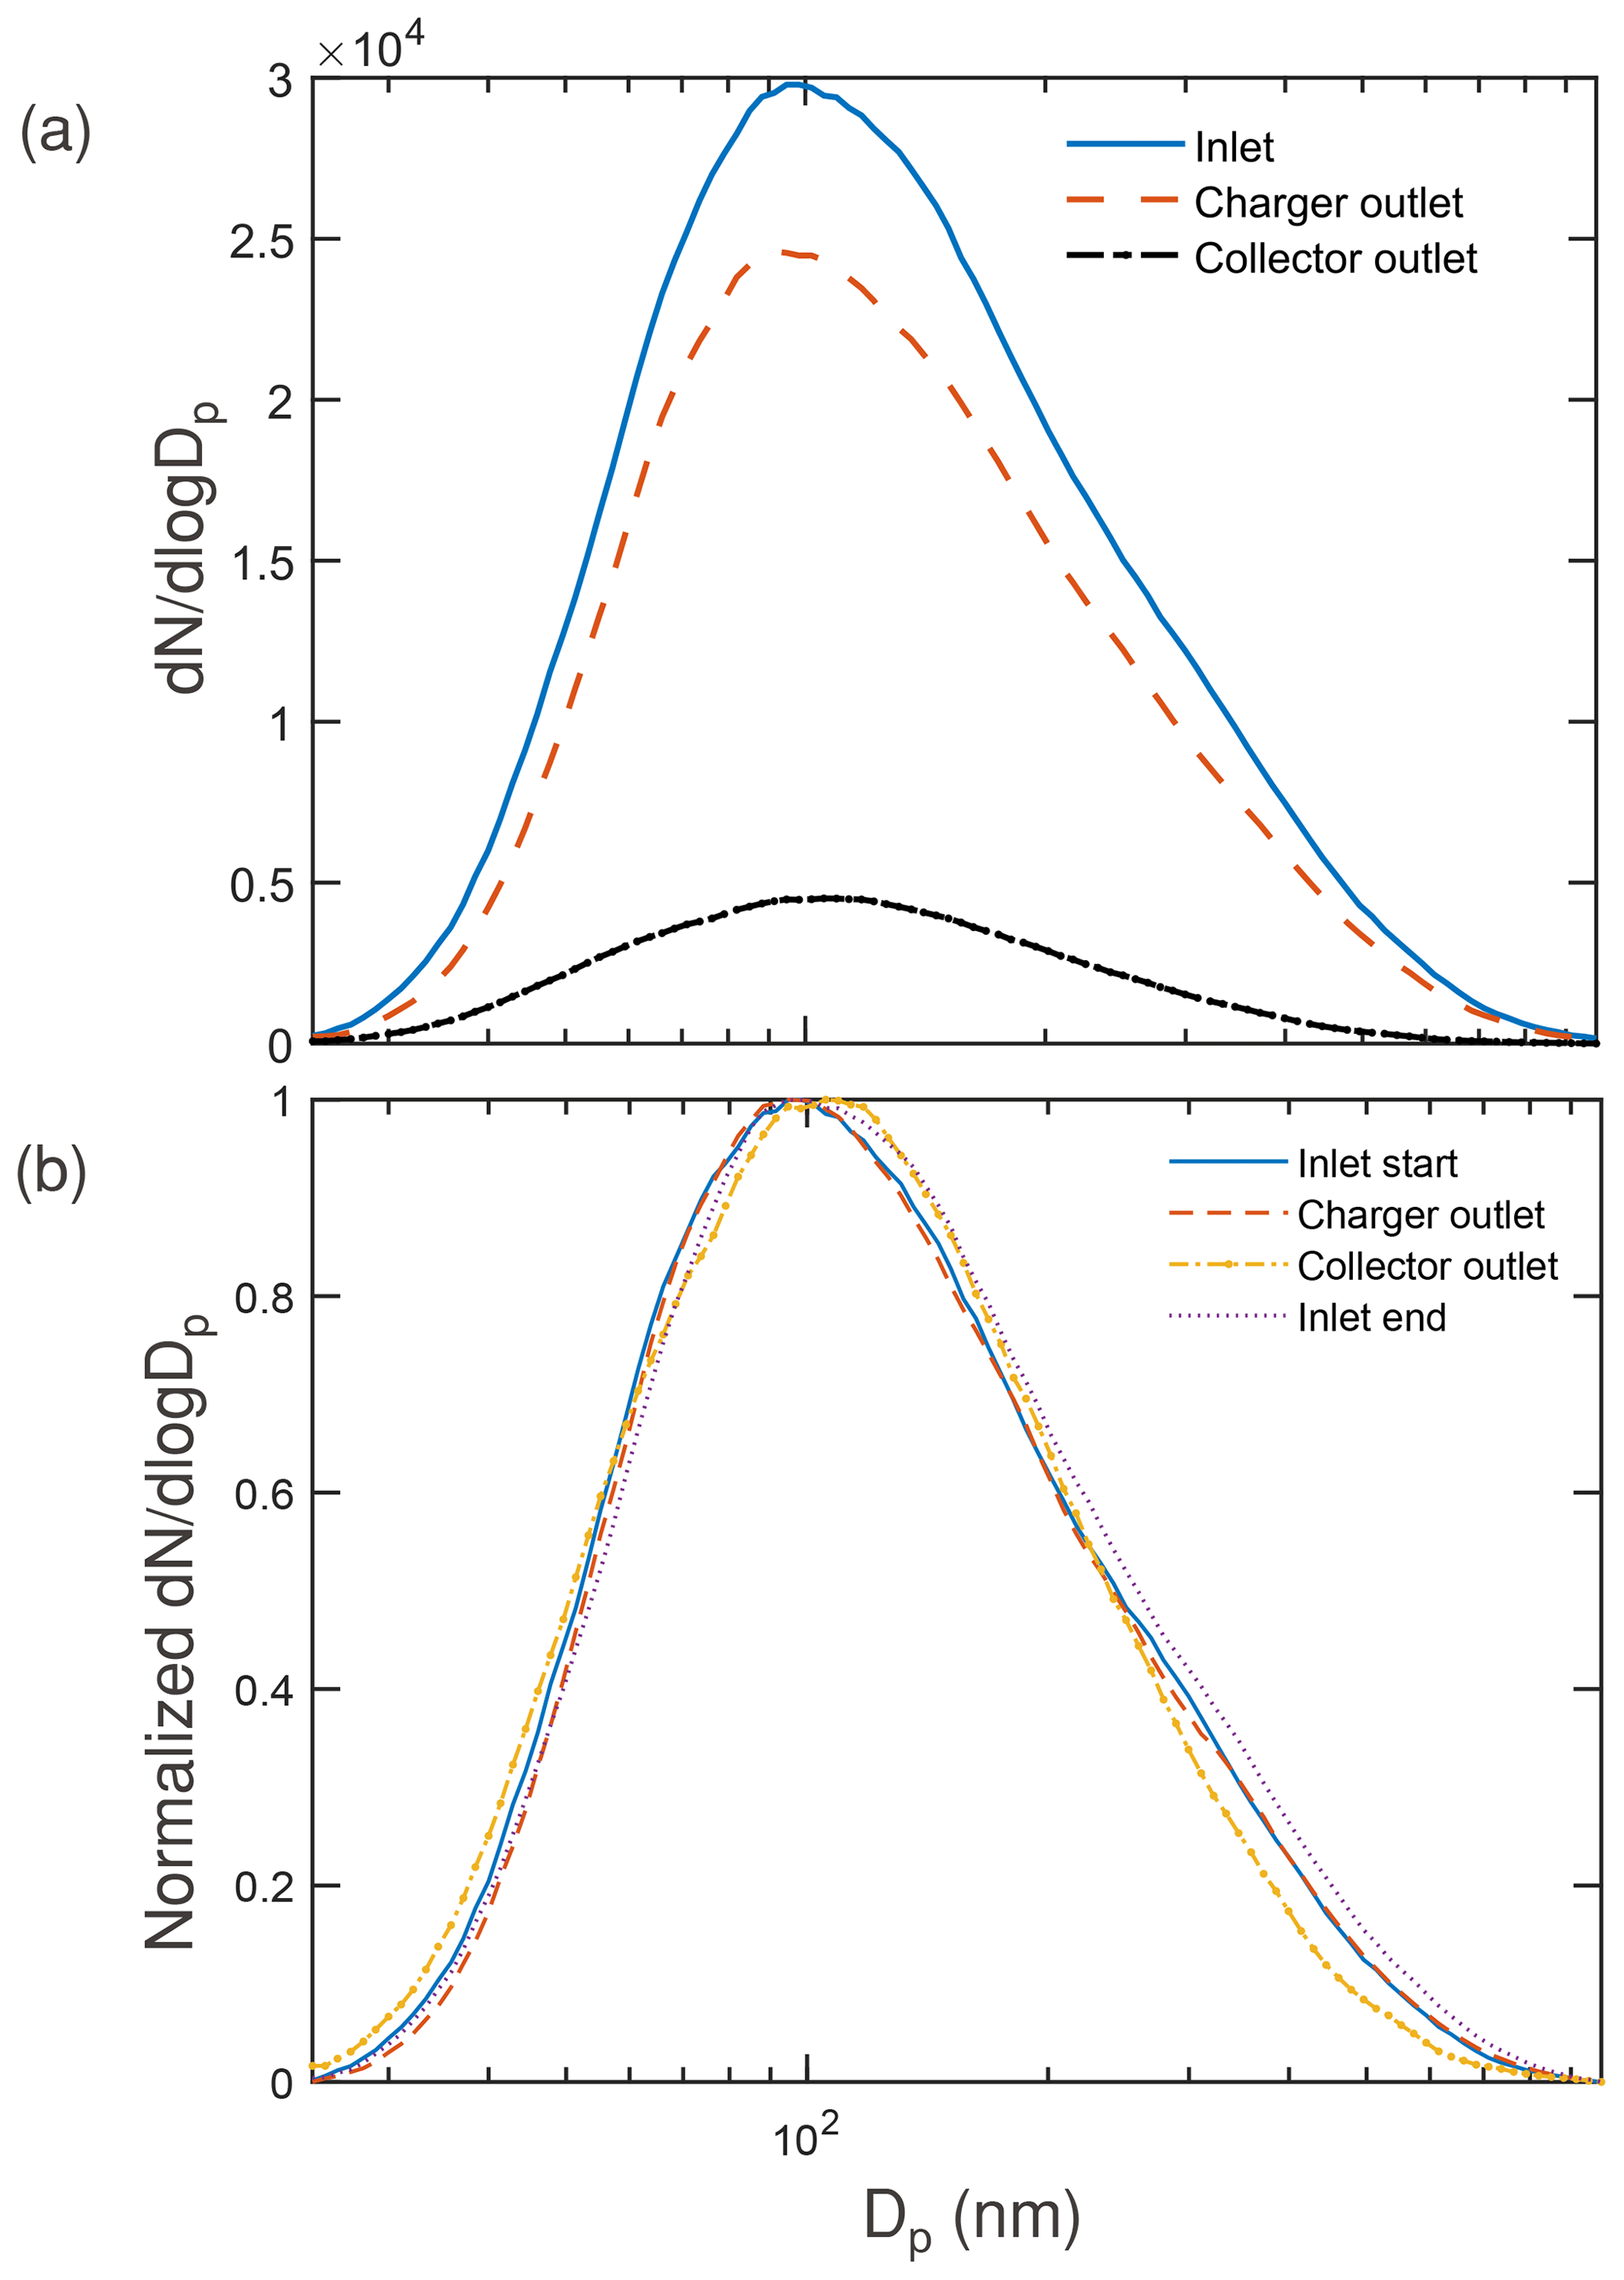
Figure 3(a) Particle size distribution measured at the inlet averaged from that before and after collection, at the charger outlet averaged from that before and after collection, and at the outlet of the collector. (b) Normalized particle size distribution measured for the inlet before staring the experiment, at the outlet of the charger, at the outlet of the collector, and the inlet at the end of the experiment (to determine any bias in the inlet).
Figure 3b shows the corresponding normalized number size distribution, with the charger inlet distribution at both the start and the end of the experiment included to provide an estimate of expected change in the distribution over the long sampling experiment. The collector did preferentially collect some larger particles, but qualitatively there was no large shift in size distribution because of the charger or the collector. Contrary to the observed nominally higher collection for larger particles, COMSOL simulations showed a nominally decreasing collection efficiency with increasing particle size (as the electrical mobility was decreasing) for a charge level proportional to the diameter. The discrepancy is mostly because of a larger fraction of larger particles getting charged vs. un-charged in the charger. From the numerical simulations, the charge level that would result in collection efficiencies for all sizes around the observed 82 % is observed to be between one elementary charge every 25 nm diameter for the smaller particles and one elementary charge every 17 nm diameter for larger particles. The variation in the charge level is not implausible and could have contributed in part to the observed higher efficiency for the larger particles, though a thorough analysis of the charger is planned to estimate the exact charge values. Qualitatively, the particle distribution imaged by the SEM (Sect. S3 Fig. S5a–c in the Supplement) is similar at the three positions and supports the idea that there is lower size segregation in collection. Particles were spatially separated, as expected below 5–20 µg cm−2 (Casuccio et al., 2004), and support the independent scattering assumption (Drolen and Tien, 1987) over the range of areal mass densities in our experiment (< 3.15 µg cm−2).
3.2 Spatial mass distribution
The three methods of evaluating the spatial profile (Sect. 2.6) show that the deposition is semi-uniform. The radial dependence of pixel intensity (Fig. 4a) computed from optical images shows a general trend for a prominent mound near the point where the device inlet tube extrudes towards the surface (r = 5 mm), as predicted by simulation (Fig. 1b). The presence of the mound is supported by qualitative SEM image analysis, which has nominally different particle densities for the different images at different radial positions (1, 6, and 9 mm) (Sect. S3 Fig. S5a–c), despite having low qualitative variation in the size distribution. However, there are some observed variations in the relative height of the mound and whether the deposited mass is increasing or decreasing with radial distance. The VAIRS analysis (Sect. 2.6) of the IR absorbance spectra with different aperture sizes also closely follows the image analysis profile (Fig. 4), though it is much coarser because of a limited number of aperture points. These variations across experiments, especially the relative mound intensity, likely result from small perturbations in the vertical position of the crystal placed in the collector disk housing (Sect. S1 Fig. S1a).
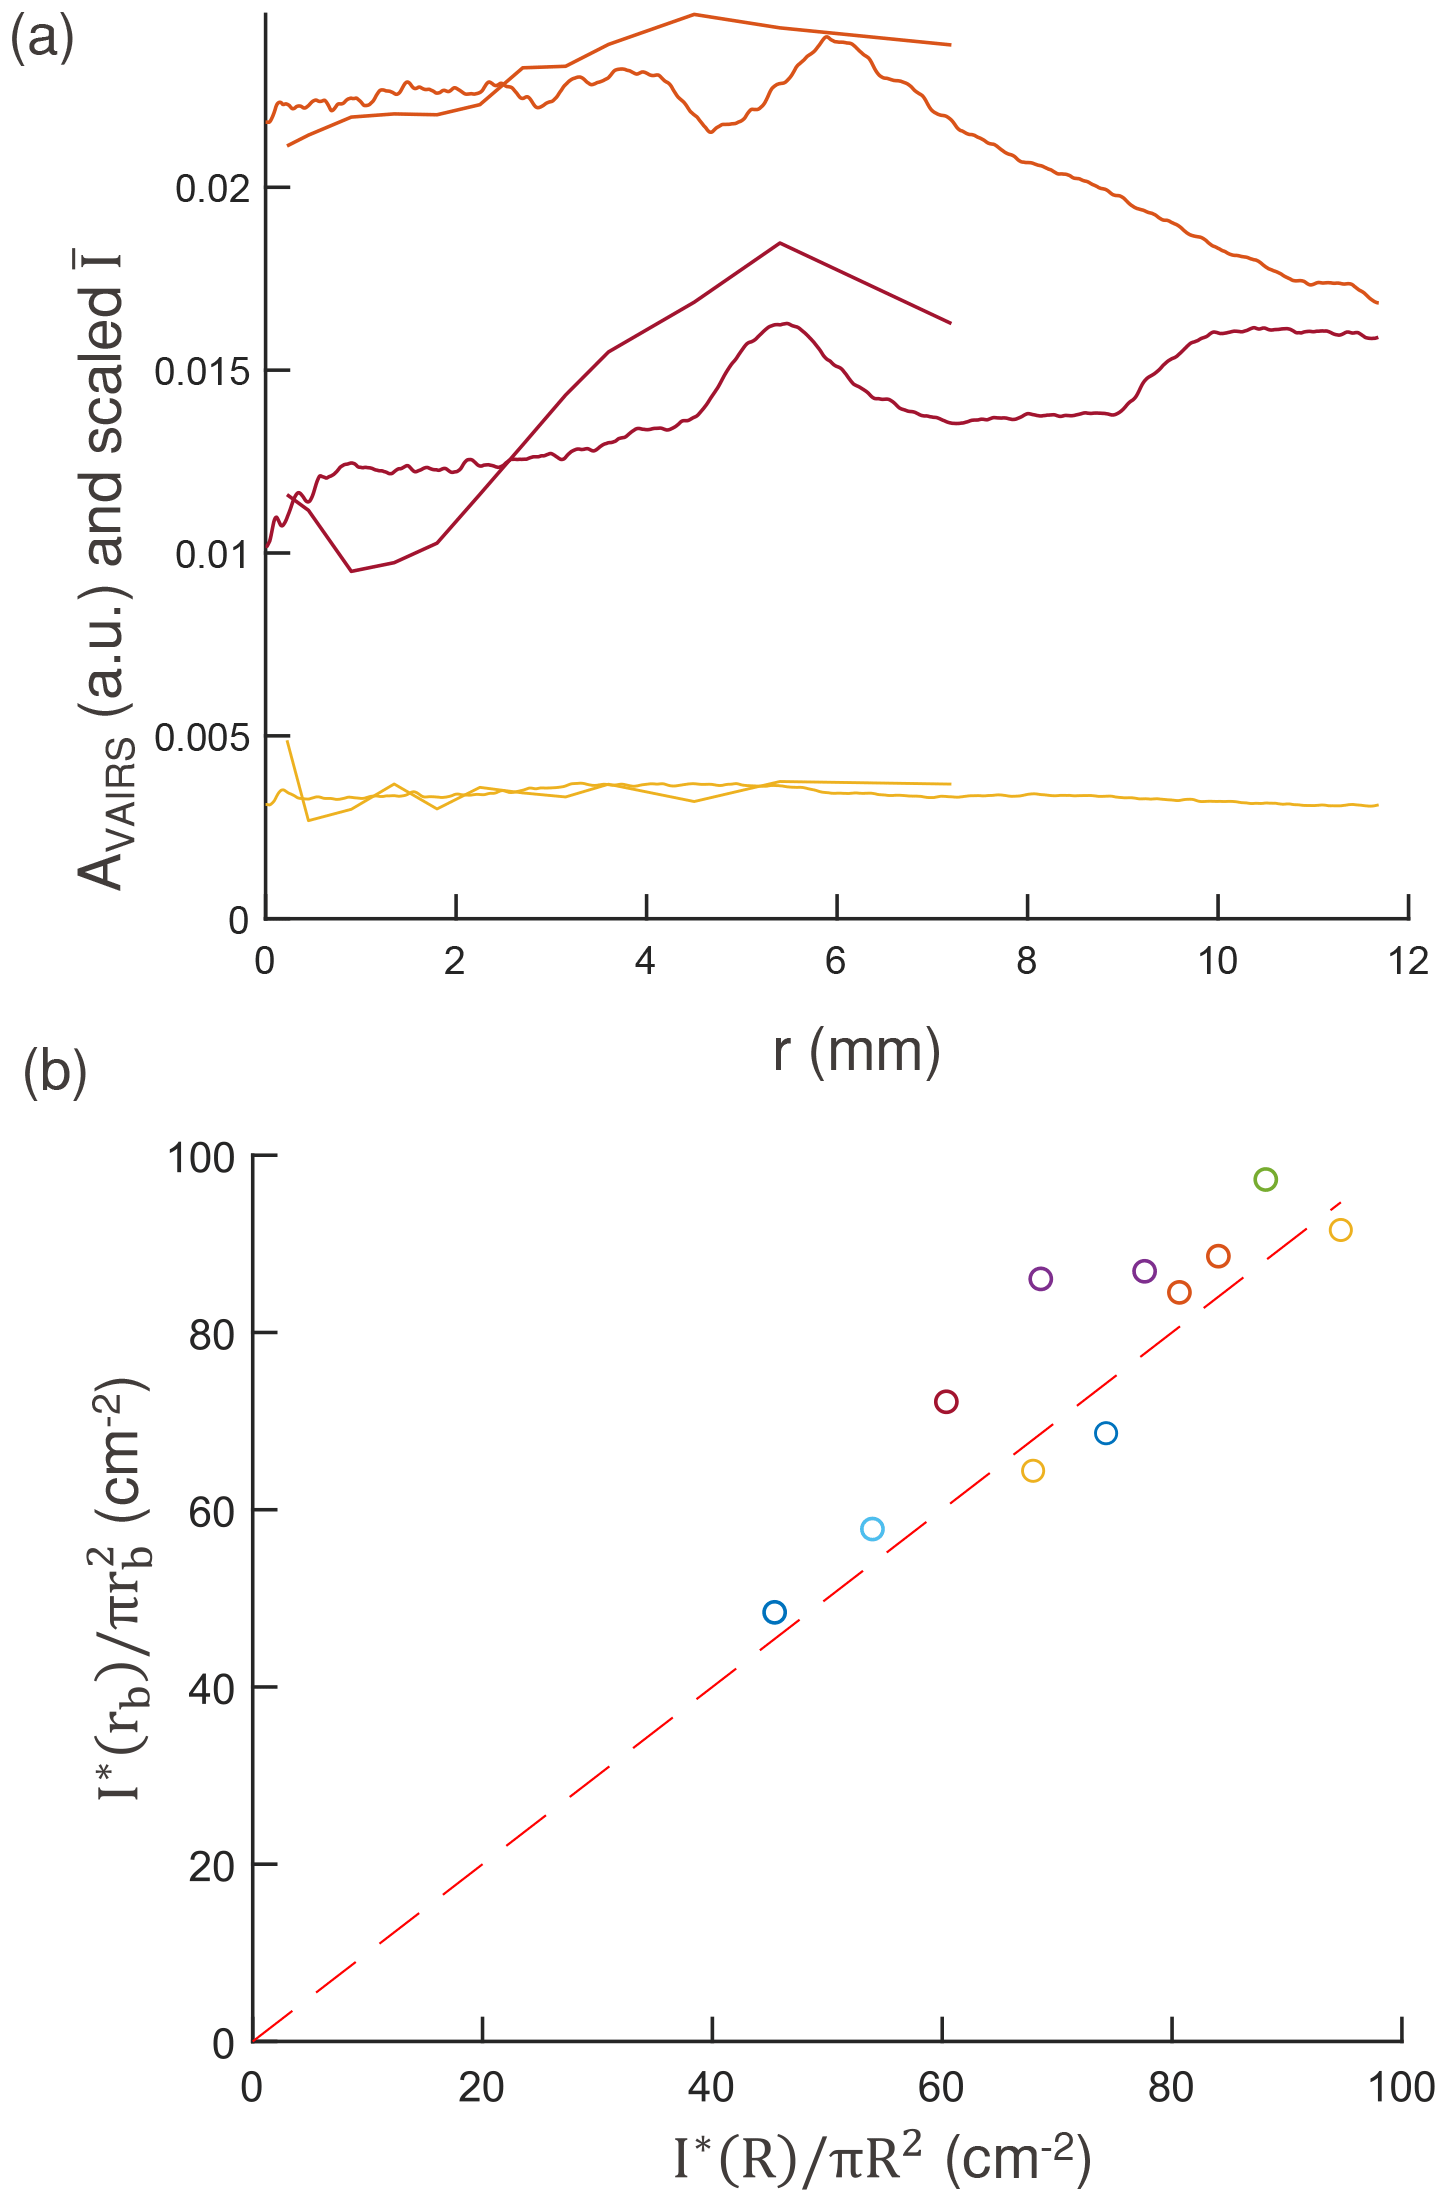
Figure 4(a) Radial profile of scattered intensities () obtained from image analysis (Sect. S5) and from VAIRS analysis (AVAIRS). values range to a higher r, have higher resolution than AVAIRS values, and are scaled differently for each sample to display it together with the corresponding AVAIRS profile. (b) Calculated and from image analysis for the experiments with different and a 1:1 reference line (red dotted line).
The scatter integrated over the entire crystal I∗(R) for each experiment scales with the total mass areal density calculated using image analysis (Sect. S3 Fig. S7a in the Supplement) and supports its use for resolving the spatial distribution of deposited mass (albeit making use of variations in intensity over a single experiment). The estimated density scaling factor ϕR(rb) is the ratio of to (the two axes in Fig. 4b for a beam radius rb = 5.4 mm – corresponding to the aperture diameter of 6 mm). The deviation of ϕR(rb) from unity (corresponding to the 1:1 line in the figure) is mostly ± 10 % (with two points at +20 % and +25 %), with its value being systematically higher for the intensity profiles that increase sharply with radius and systematically lower for profiles which have a decreasing radial intensity (Fig. 4a). For the non-negligible deviation in ϕR(rb) in conjunction with it conserving some detail about the distribution profile, we employ the density scaling factor to estimate the mass, , in this work (Sect. 3.3). Analysis without the image analysis correction – i.e., with a value of ϕR(rb) = 1 for all samples – is also presented in Sect. S3.
3.3 Absorbance with mass loading
We first examine features of the measured volume attenuation coefficient (effectively, its absorption profile) over the entire range of scanned wavenumbers. Then, we examine the magnitude of the volume attenuation coefficient at two of the major peaks. These quantities are compared against reference values derived from previously reported refractive indices of ammonium sulfate obtained by different methods.
The experimentally determined volume attenuation coefficients are shown in Fig. 5a. The absorbance peak locations and their magnitudes are generally consistent, indicating that the method of measurement and baseline correction does not introduce major chemical or spectroscopic artifacts. Some absorption peaks for aliphatic C–H (2800–3150 cm−1) are visible, likely due to impurities on the crystal originating from the o-ring sealing grease in the crystal housing during manual removal of the sample, condensed vapors on optical components, or impurities in the solvent used for cleaning the crystal (resulting in negative peaks). The o-ring sealing grease most likely contaminates each experiment, as most silicone greases use polydimethylsiloxane (PDMS), and absorption bands for both Si–CH3 (800 and 1260 cm−1) are visible for all experiments. PDMS IR spectra (Myers et al., 2001) also have an Si–O–Si band (1130–1100 cm−1) that can potentially interfere with the absorption peak near 1090 cm−1, but it does not appear to materially affect quantification (Sect. S3 Figs. S4b and S7b) and is therefore not further considered in the analysis. The spectra do not appear to contain peaks related to nitrates or other additional artifacts that may be caused by spark discharge and formation of reactive molecules near regions of high electrical potential in the charger or collector. (Such peaks in initial stages of ESP development were observed where needle electrodes and high voltages were used for charging and collection in a single-stage design.) Moreover, no physical heating of the ZnSe crystal was observed after each experiment, which also suggests the absence of sparking and substantial production of reactive gases.
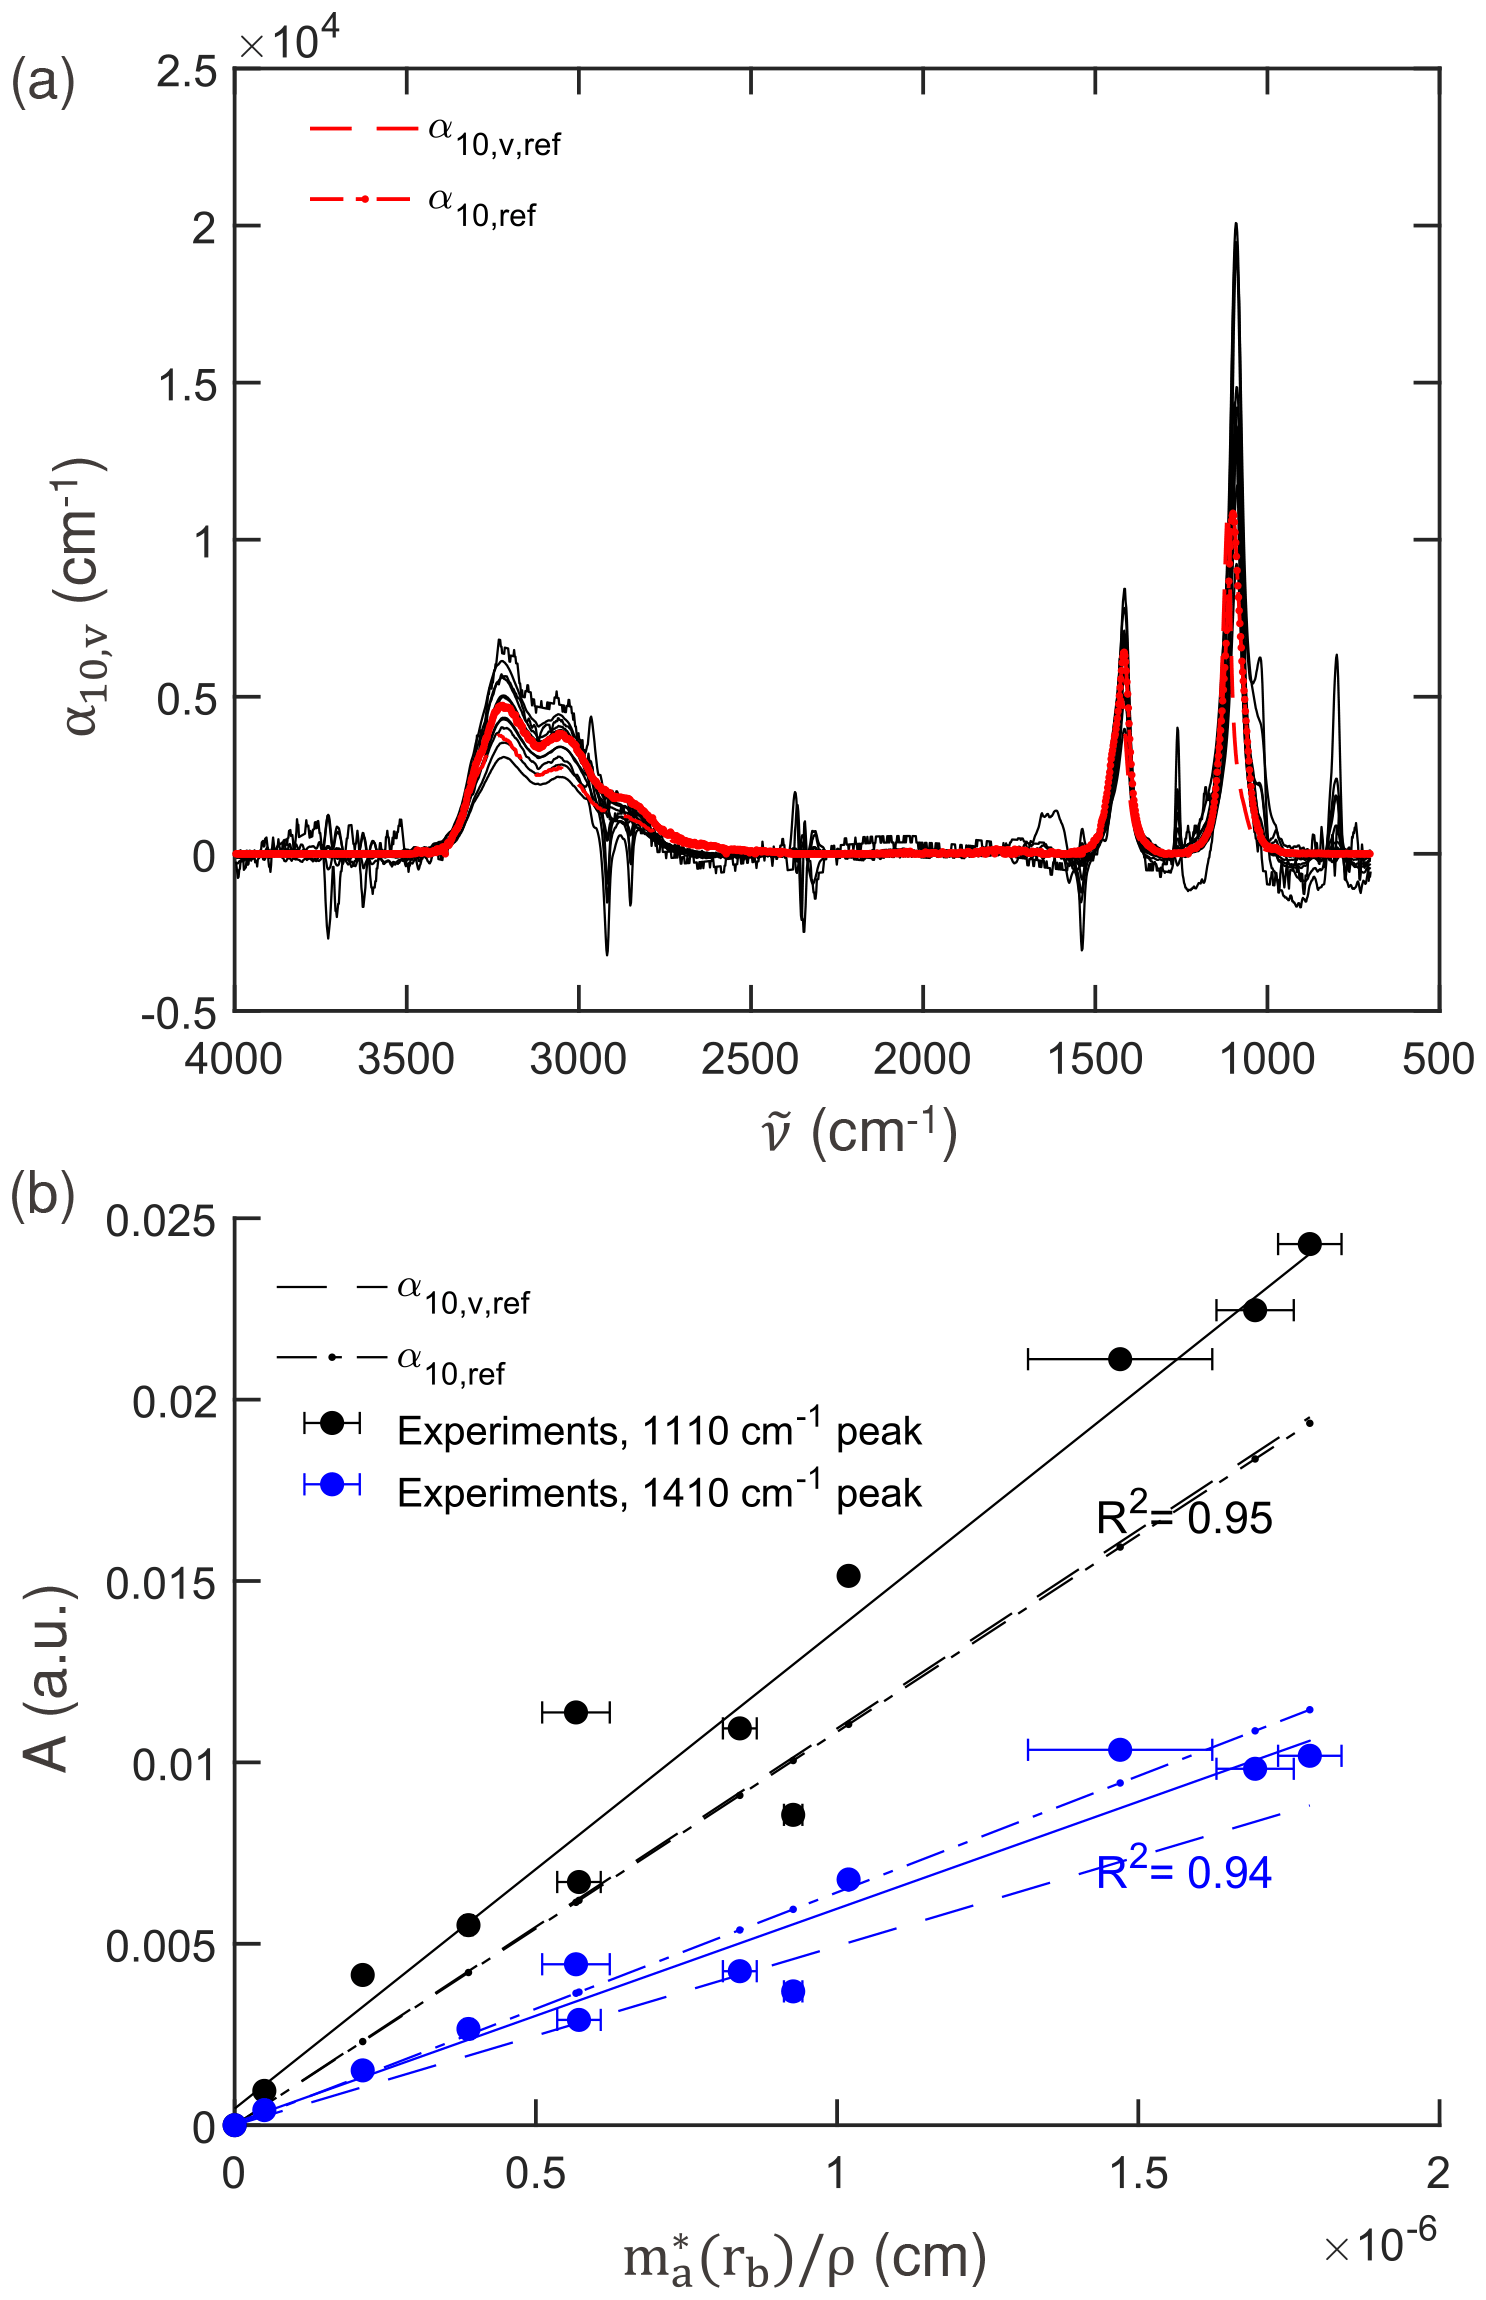
Figure 5(a) Comparison of the volume absorption coefficient (αv) from the experiments for IR measurement with an aperture of 6 mm against the reference linear absorption coefficient (αref) and volume absorption coefficient (αv,ref) for ammonium sulfate calculated using n and k (Earle et al., 2006). (b) Response of IR absorbance A against the effective deposition thickness (cm) of the total particle collected reference from CPC calculated using image analysis for absorbance at the peak near 1110 cm−1 (for ) and at the peak near 1410 cm−1 (for ).
Overlaid on Fig. 5a are α10,v and α10 calculated from refractive indices measured by Earle et al. (2006) using ammonium sulfate particles suspended in nitrogen gas in an aerosol flow tube. In our experiments, we observed consistent peak positions of = 1090 cm−1 (± 0.2 %) and = 1415 cm−1 (± 0.08 %), which are incidentally closer to the reported values for homogeneous samples by Toon et al. (1976) of = 1090 cm−1, = 1415 cm−1 and Torrie et al. (1972) of = 1093 cm−1, = 1417 cm−1 – though the lack of wavenumber resolution in the older measurements made on dispersive spectrometers prevents a more precise comparison of the peak position (20–30 cm−1 rather than 2–4 cm−1 made with Fourier transform instruments for condensed-phase samples). Blue shifting of peaks on the order of ∼ 10 cm−1 can be expected for small particles (Bohren and Huffman, 1983; Maidment et al., 2018), with asphericity and increasing particle size reducing the extent of this shift (Mishchenko, 1990; Segal-Rosenheimer et al., 2009). Blue shifts have been reported in extinction spectra of ammonium sulfate in aerosol flow tubes (Weis and Ewing, 1996; Earle et al., 2006; Segal-Rosenheimer et al., 2009; Laskina et al., 2014), though observations are often below that predicted by Mie theory. Such shifts are not observed in our experiments, though the extent of peak shifts, spectral profiles, and the underlying refractive indices vary among various studies (Laskina et al., 2014; Johnson et al., 2020; Myers et al., 2020) and are attributed to some extent to differences arising from sample morphology.
Figure 5b shows the absorbance against the effective deposition thickness for the peak near 1110 cm−1 and peak near 1410 cm−1, the slope of which can be compared to α10,v and α10 at those wavelengths calculated from the refractive indices of Earle et al. (2006), the same as Fig. 5a. The reference values are calculated for their respective peaks, which vary by a few wavenumbers from our experiments, as mentioned previously. The experimental absorbance and effective deposition thickness estimates are strongly correlated (R2 of 0.95 and 0.94, respectively). While weak bands are typically recommended for quantification of analytes of inorganic substances (Mayo et al., 2004) due to the possibility of signal saturation, for low loadings (low optical depths) for which single-scattering approximation applies, this work confirms that even the strongest absorbance band of at 1110 cm−1 exhibits high linearity and can also be for quantification. The slope values of 1.32 × 104 cm−1 (95 % confidence interval between 1.11 and 1.52 × 104 cm−1) for the peak near 1110 cm−1 and 5.89 × 103 cm−1 (95 % confidence interval between 4.87 and 6.93 × 103 cm−1) for the peak near 1410 cm−1 vary from the reference values within 20 % and −8 %, which is within the uncertainty due to variations in reported refractive indices (Laskina et al., 2014; Johnson et al., 2020; Myers et al., 2020). The higher slope of the peak near 1110 cm−1 (as also evident from its higher values in Fig. 5a) is not because of the Si–O–Si band (1130–1100 cm−1) from the silicone grease, with the removal of which the slope still varies by 18 % (Sect. S3 Fig. S6b in the Supplement). In our experiments the peak height ratio of to was 2.1 (± 10 %); this is consistent with spectra acquired from nebulized and dried polydisperse ammonium sulfate solution (4.8 g L−1) with mass mean diameter of 200 nm studied under conditions close to our experiments (Weis and Ewing, 1996). Overall, the uncertainty in the measurements enveloped the difference in the modeled optical response of ammonium sulfate as an ensemble of particles or (hypothetical) surface-free homogeneous medium of equivalent thickness.
In the analysis above, the ZnSe crystal was not assumed to play a role. Nonmetallic particles collected on the surface of a substrate can behave optically different from suspended particles due to multiple far-field scattering interactions, van der Waals-like interactions, and superposition of incident and reflected electromagnetic fields between the particle and surface (Quinten, 2011). Scattering power of IR radiation by submicron particles is reasonably small (though increasingly important in the region above 1500 cm−1 for larger particles within this range), so these far-field (incoherent) interactions are not considered to be substantial. Otherwise, deviations in our measurements were within uncertainty of past reference measurements, and systematic influences of near-field optical effects or physical interactions were not detected within the precision of our technique.
We also evaluate the value of optical microscopy experiments (and corresponding image analysis) in our quantification by considering a case in which a constant density scaling factor is employed – i.e., ϕR(rb) = 1 for all samples (Sect. S3 Fig. S6a), which results in a shift of the points along the abscissa for each experiment compared to Fig. 5b. The correlation with absorbance remains almost the same (R2 of 0.96 and 0.95) for 1110 and 1410 cm−1, respectively. The estimated slope also remains statistically indifferent at 1.3 × 104 cm−1 (95 % CI between 1.14 × 10⁴ and 1.51 × 104 cm−1) for the peak near 1110 and 5.9 × 103 cm−1 (95 % CI between 4.95 × 10³ and 6.84 × 103 cm−1) for the peak near 1410 cm−1. The results of the analysis are effectively the same regardless of whether image analysis is incorporated because ϕR(rb) was effectively close to unity (Sect. S3 Fig. S7b).
Finally, we estimate a limit of qualification (LOQ) of = 0.012 µg cm−2 for ammonium sulfate based on the threshold at which the absorption at 1410 cm−1 is 10-fold greater than root mean square of noise (Sect. S6). This threshold is at least an order of magnitude lower than for PTFE filters based on reported accounts for other substances or peaks (Russell et al., 2009; Debus et al., 2022), which is an expected result due to low substrate interferences and baseline uncertainties. For our current ESP device operating at a flow rate of 2.1 L min−1 with overall efficiency of 0.64 (for charger and collector), this LOQ translates into a required average airborne concentration threshold of 1.5 µg m−3 of ammonium sulfate over a sampling time of 30 min. PTFE sampling can potentially achieve similar time resolutions for quantification of airborne concentrations due to higher particle collection efficiency and flow rate (at the cost of a greater pressure drop) than our ESP, which is limited by the applicable voltage to maintain the strength of electrostatic forces that facilitate particle deposition. However, greater sensitivity to deposited mass on the optical crystal through ESP collection may confer benefits when the flow rate or total sampled volume is limited, such as in cases of co-sampling from manifolds, environmental chambers, flow reactors, or denuders. Furthermore, the lower pressure drop and face velocity in the ESP are expected to reduce evaporation artifacts from semivolatile substances reported for filter sampling (McDow and Huntzicker, 1990; Zhang and McMurry, 1991).
This work demonstrates the possibility of using a 3D-printed radial ESP for quantitative IR spectroscopy with minimal optical interferences. Rapid prototyping to achieve the presented design was achieved through numerical simulations and 3D printing with ABS. To enable 3D printing of parts for a flow system, the number of joints was minimized by printing with a 45∘ rotation to allow fabrication of parts with overhangs, and a small amount of acetone was used for press-sealing surfaces after printing. Polydisperse ammonium sulfate particles were atomized from solution and studied over 11 experiments with varying particle loading. The collection area and spatial distribution of particles on the crystal were analyzed using optical image analysis and IR absorbance measured across variable aperture sizes. The mass distribution was estimated to be semi-uniform due to the variation in electrode distances and electric field strengths within the collector. We observed the IR absorbance at and peaks at ∼ 1410 and ∼ 1110 cm−1 to scale linearly (R2 > 0.94) with particle loading over 2 orders of magnitude, with an estimated limit of quantification of 61 ng of collected mass, corresponding to an average airborne concentration of 1.5 µg m−3 for a 30 min sampling interval. The peak positions and peak heights of the extinction spectra were within the variability of previous studies using particles suspended in an inert gas, and particle–substrate effects were not discernable. While particle extinction should follow the electrostatic approximation for small, separated particles (for areal mass densities < 3 µg cm−2 and size <1 µm in this work), we find that modeling the particle deposits formed in this work as a homogeneous medium of equivalent mass also provided a reasonable prediction of the apparent absorbance. The advances presented in this work permit higher sensitivity and chemical resolution for aerosol measurement and encourage (1) further investigation of this design and analysis strategy for collector design, as well as (2) use of such a device in studies of aerosol composition for various applications.
Relevant code and data for this paper can be found at https://doi.org/10.5281/zenodo.7005320 (Dudani and Takahama, 2022).
The supplement related to this article is available online at: https://doi.org/10.5194/amt-15-4693-2022-supplement.
ND designed and fabricated the device, ran the simulations, prepared and performed the experiments, and performed the data analysis. ST conceived of, acquired funding for, and provided supervision of the project, as well as providing feedback on the analysis. ND and ST wrote the paper.
The contact author has declared that none of the authors has any competing interests.
Publisher's note: Copernicus Publications remains neutral with regard to jurisdictional claims in published maps and institutional affiliations.
We thank Jiannong Fang for discussions on numerical simulations and SNF 200021_172923 for funding.
This research has been supported by the Schweizerischer Nationalfonds zur Förderung der Wissenschaftlichen Forschung (grant no. 200021_172923).
This paper was edited by Mingjin Tang and reviewed by three anonymous referees.
Adamson, A. W.: A Textbook of Physical Chemistry, 2nd edn., Academic Press, New York, ISBN 978-0-12-044262-1, 1979. a
Allen, D. T., Palen, E. J., Haimov, M. I., Hering, S. V., and Young, J. R.: Fourier transform infrared spectroscopy of aerosol collected in a low pressure impactor (LPI/FTIR): Method development and field calibration, Aerosol Sci. Tech., 21, 325–342, https://doi.org/10.1080/02786829408959719, 1994. a, b
Allen, M. D. and Raabe, O. G.: Slip Correction Measurements of Spherical Solid Aerosol Particles in an Improved Millikan Apparatus, Aerosol Sci. Tech., 4, 269–286, https://doi.org/10.1080/02786828508959055, 1985. a
Arnold, S. T., Viggiano, A. A., and Morris, R. A.: Rate Constants and Branching Ratios for the Reactions of Selected Atmospheric Primary Cations withn-Octane and Isooctane (2,2,4-Trimethylpentane), J. Phys. Chem. A, 101, 9351–9358, https://doi.org/10.1021/jp972106v, 1997. a
Biskos, G., Reavell, K., and Collings, N.: Unipolar diffusion charging of aerosol particles in the transition regime, J. Aerosol Sci., 36, 247–265, https://doi.org/10.1016/j.jaerosci.2004.09.002, 2005. a, b
Blando, J. D., Porcja, R. J., Li, T. H., Bowman, D., Lioy, P. J., and Turpin, B. J.: Secondary formation and the Smoky Mountain organic aerosol: An examination of aerosol polarity and functional group composition during SEAVS, Environ. Sci. Technol., 32, 604–613, https://doi.org/10.1021/es970405s, 1998. a
Blando, J. D., Porcja, R. J., and Turpin, B. J.: Issues in the Quantitation of Functional Groups by FTIR Spectroscopic Analysis of Impactor-Collected Aerosol Samples, Aerosol Sci. Tech., 35, 899–908, https://doi.org/10.1080/02786820126852, 2001. a
Bogard, J. S., Johnson, S. A., Kumar, R., and Cunningham, P. T.: Quantitative analysis of nitrate ion in ambient aerosols by Fourier-transform infrared spectroscopy, Environ. Sci. Technol., 16, 136–140, https://doi.org/10.1021/es00097a004, 1982. a
Bohren, C. and Huffman, D.: Absorption and Scattering of Light by Small Particles, Wiley Science Series, Wiley, ISBN 9783527618156, 1983. a, b, c, d
Burtscher, H., Scherrer, L., Ott, H. C. S. S., Federer, B., Burtscher, H., Scherrer, L., and Siegmann, H. C.: Probing aerosols by photoelectric charging, J. Appl. Phys., 53, 3787, https://doi.org/10.1063/1.331120, 1982. a
Casuccio, G. S., Schlaegle, S. F., Lersch, T. L., Huffman, G. P., Chen, Y., and Shah, N.: Measurement of fine particulate matter using electron microscopy techniques, Fuel Process. Technol., 85, 763–779, https://doi.org/10.1016/j.fuproc.2003.11.026, 2004. a
Cunningham, P. T., Johnson, S. A., and Yang, R. T.: Variations in chemistry of airborne particulate material with particle size and time, Environ. Sci. Technol., 8, 131–135, https://doi.org/10.1021/es60087a002, 1974. a
de Rooi, J. J. and Eilers, P. H.: Mixture models for baseline estimation, Chemometr. Intell. Lab., 117, 56–60, https://doi.org/10.1016/j.chemolab.2011.11.001, 2012.
Debus, B., Weakley, A. T., Takahama, S., George, K. M., Amiri-Farahani, A., Schichtel, B., Copeland, S., Wexler, A. S., and Dillner, A. M.: Quantification of major particulate matter species from a single filter type using infrared spectroscopy – application to a large-scale monitoring network, Atmos. Meas. Tech., 15, 2685–2702, https://doi.org/10.5194/amt-15-2685-2022, 2022. a, b
Dixkens, J. and Fissan, H.: Electrostatic particle sampler for total-reflection X-ray fluorescence analysis, J. Aerosol Sci., 22, S375–S378, https://doi.org/10.1016/s0021-8502(05)80116-8, 1991. a
Drolen, B. and Tien, C.: Absorption and scattering of agglomerated soot particulate, J. Quant. Spectrosc. Ra., 37, 433–448, https://doi.org/10.1016/s0022-4073(87)90090-2, 1987. a
Dudani, N. and Takahama, S.: Supplementary files for paper: “Design and fabrication of an electrostatic precipitator for infrared spectroscopy” in Atmospheric Measurement Techniques, 2022, Zenodo [data set], https://doi.org/10.5281/zenodo.7005320, 2022. a
Earle, M. E., Pancescu, R. G., Cosic, B., Zasetsky, A. Y., and Sloan, J. J.: Temperature-Dependent Complex Indices of Refraction for Crystalline (NH4)2SO4, J. Phys. Chem. A, 110, 13022–13028, https://doi.org/10.1021/jp064704s, 2006. a, b, c, d, e
Fierz, M.: Theoretical and Experimental Evaluation of a Portable Electrostatic TEM Sampler, Aerosol Sci. Tech., 41, 520–528, https://doi.org/10.1080/02786820701253327, 2007. a
Fischer, K.: Mass absorption indices of various types of natural aerosol particles in the infrared, Appl. Optics, 14, 2851, https://doi.org/10.1364/ao.14.002851, 1975. a
Grob, B., Burtscher, H., and Niessner, R.: Charging of ultra-fine aerosol particles by an ozone-free indirect uv photo-charger, Aerosol Sci. Tech., 47, 1325–1333, https://doi.org/10.1080/02786826.2013.840357, 2013. a
Grob, B., Wolf, J. C., Kiwull, B., and Niessner, R.: Calibration system with an indirect photoelectric charger for legislated vehicle number emission measurement counters in the single counting mode, J. Aerosol Sci., 70, 50–58, https://doi.org/10.1016/j.jaerosci.2014.01.001, 2014. a
Haenel, G.: Radiation budget of the boundary layer. II–Simultaneous measurement of mean solar volume absorption and extinction coefficients of particles, Beiträge zur Physik der Atmosphäre, 60, 241–254, 1987.
Han, B., Kim, H.-J., Kim, Y.-J., and Sioutas, C.: Unipolar Charging of Fine and Ultra-Fine Particles Using Carbon Fiber Ionizers Unipolar Charging of Fine and Ultra-Fine Particles Using Carbon Fiber Ionizers, Aerosol Sci. Tech., 42, 793–800, https://doi.org/10.1080/02786820802339553, 2008. a
Han, T. T., Thomas, N. M., and Mainelis, G.: Design and development of a self-contained personal electrostatic bioaerosol sampler (PEBS) with a wire-to-wire charger, Aerosol Sci. Tech., 51, 903–915, https://doi.org/10.1080/02786826.2017.1329516, 2017. a, b, c, d
Hapke, B.: Theory of Reflectance and Emittance Spectroscopy, 2nd edn., Cambridge University Press, New York, ISBN 978-0-521-88349-8, 2012. a
Harrick, N. J. and Beckmann, K. H.: Internal Reflection Spectroscopy, Springer US, Boston, MA, https://doi.org/10.1007/978-1-4613-4490-2_11, pp. 215–245, 1974. a
Hewitt, G. W.: The charging of small particles for electrostatic precipitation Part I: Communication and Electronics, Transactions of the, American Institute of Electrical Engineers, 76, 300–306, https://doi.org/10.1109/TCE.1957.6372672, 1957. a
Hinds, W. C.: Aerosol Technology: Properties, Behavior, and Measurement of Airborne Particles, 2nd edn., John Wiley & Sons, Inc., New York, ISBN 9780471194101, 1999. a
Hontañón, E. and Kruis, F. E.: Single Charging of Nanoparticles by UV Photoionization at High Flow Rates, Aerosol Sci. Tech., 42, 310–323, https://doi.org/10.1080/02786820802054244, 2008. a
Hopey, J., Fuller, K., and Krishnaswamy, V.: Fourier transform infrared spectroscopy of size-segregated aerosol deposits on foil substrates, Appl. Optics, 47, 2266–2274, 2008. a
Ivlev, L. S. and Popova, S. I.: The Complex Refractive Indices of Substances in The Atmospheric-Aerosol Dispersed Phase, Izv. Atmos. Oceanic Phys., 9, 1034–1043, 1973. a
Johnson, T. J., Diaz, E., Hughey, K. D., Myers, T. L., Blake, T. A., Dohnalkova, A. C., and Burton, S. D.: Infrared Optical Constants from Pressed Pellets of Powders: I. Improved n and k Values of (NH4)2SO4 from Single-Angle Reflectance, Appl. Spectrosc., 74, 851–867, https://doi.org/10.1177/0003702820930009, 2020. a, b
Kala, S., Rouenhoff, M., Theissmann, R., and Kruis, F. E.: Synthesis and Film Formation of Monodisperse Nanoparticles and Nanoparticle Pairs, in: Nanoparticles from the Gasphase, edited by: Lorke, A., Winterer, M., Schmechel, R., and Schulz, C., Springer Berlin Heidelberg, 99–119, https://doi.org/10.1007/978-3-642-28546-2_4, 2012. a
Kidd, C., Perraud, V., Wingen, L. M., and Finlayson-Pitts, B. J.: Integrating phase and composition of secondary organic aerosol from the ozonolysis of α-pinene, P. Natl. Acad. Sci. USA, 111, 7552–7557, https://doi.org/10.1073/pnas.1322558111, 2014. a
Kimoto, S., Saiki, K., Kanamaru, M., and Adachi, M.: A small mixing-type unipolar charger (SMUC) for nanoparticles, Aerosol Sci. Tech., 44, 872–880, https://doi.org/10.1080/02786826.2010.498796, 2010. a
Kuzmiakova, A., Dillner, A. M., and Takahama, S.: An automated baseline correction protocol for infrared spectra of atmospheric aerosols collected on polytetrafluoroethylene (Teflon) filters, Atmos. Meas. Tech., 9, 2615–2631, https://doi.org/10.5194/amt-9-2615-2016, 2016. a
Laskina, O., Young, M. A., Kleiber, P. D., and Grassian, V. H.: Infrared Optical Constants of Organic Aerosols: Organic Acids and Model Humic-Like Substances (HULIS), Aerosol Sci. Tech., 48, 630–637, https://doi.org/10.1080/02786826.2014.904499, 2014. a, b, c
Liland, K. H., Almåy, T., and Mevik, B.-H.: Optimal Choice of Baseline Correction for Multivariate Calibration of Spectra, Appl. Spectrosc., 64, 1007–1016, 2010.
Liu, B. Y. H. and Pui, D. Y. H.: On the performance of the electrical aerosol analyzer, J. Aerosol Sci., 6, 249–264, 1975. a
Maidment, L., Schunemann, P. G., Clewes, R. J., Bowditch, M. D., Howle, C. R., and Reid, D. T.: Systematic spectral shifts in the mid-infrared spectroscopy of aerosols, Opt. Express, 26, 18975, https://doi.org/10.1364/oe.26.018975, 2018. a
Maria, S. F.: Source signatures of carbon monoxide and organic functional groups in Asian Pacific Regional Aerosol Characterization Experiment (ACE-Asia) submicron aerosol types, J. Geophys. Res.-Atmos., 108, 8637, https://doi.org/10.1029/2003jd003703, 2003. a, b
Marple, V. A.: History of Impactors—The First 110 Years, Aerosol Sci. Tech., 38, 247–292, https://doi.org/10.1080/02786820490424347, 2004. a
Marquard, A.: Unipolar Field and Diffusion Charging in the Transition Regime—Part I: A 2-D Limiting-Sphere Model, Aerosol Sci. Tech., 41, 597–610, https://doi.org/10.1080/02786820701272053, 2007. a
Marquard, A., Meyer, J., and Kasper, G.: Characterization of unipolar electrical aerosol chargers-Part II:. Application of comparison criteria to various types of nanoaerosol charging devices, J. Aerosol Sci., 37, 1069–1080, https://doi.org/10.1016/j.jaerosci.2005.09.002, 2006. a
Mayo, D. W., Miller, F. A., and Hannah, R. W. (Eds.): Course Notes on the Interpretation of Infrared and Raman Spectra, John Wiley & Sons, Inc., p. 333, https://doi.org/10.1002/0471690082, 2004. a
Mcclenny, W., Childers, J., Rōhl, R., and Palmer, R.: FTIR transmission spectrometry for the nondestructive determination of ammonium and sulfate in ambient aerosols collected on teflon filters, Atmos. Environ. (1967), 19, 1891–1898, https://doi.org/10.1016/0004-6981(85)90014-9, 1985. a, b
McDade, C. E., Dillner, A. M., and Indresand, H.: Particulate Matter Sample Deposit Geometry and Effective Filter Face Velocities, J. Air Waste Manage., 59, 1045–1048, https://doi.org/10.3155/1047-3289.59.9.1045, 2009.
McDow, S. R. and Huntzicker, J. J.: Vapor adsorption artifact in the sampling of organic aerosol: Face velocity effects, Atmos. Environ. A-Gen., 24, 2563–2571, https://doi.org/10.1016/0960-1686(90)90134-9, 1990. a
Medved, A., Dorman, F., Kaufman, S., and Pöcher, A.: A new corona-based charger for aerosol particles, J. Aerosol Sci., 31, 616–617, https://doi.org/10.1016/S0021-8502(00)90625-6, 2000. a
Milosevic, M.: Internal Reflection and ATR Spectroscopy, Chemical Analysis: A Series of Monographs on Analytical Chemistry and Its Applications, John Wiley & Sons, Inc., ISBN 9780470278321, 2012.
Mishchenko, M. I.: Extinction of light by randomly-oriented non-spherical grains, Astrophys. Space, 164, 1–13, https://doi.org/10.1007/bf00653546, 1990. a
Myers, T. L., Tonkyn, R. G., Oeck, A. M., Danby, T. O., Loring, J. S., Taubman, M. S., Sharpe, S. W., Birnbaum, J. C., and Johnson, T. J.: Siloxanes and Silicones, di-Me, https://webbook.nist.gov/cgi/cbook.cgi?ID=C63148629&Mask=80 (last access: 15 August 2022), 2001. a
Myers, T. L., Blake, T. A., Yokosuk, M. O., Fortin, G., and Johnson, T. J.: Improved Infrared Optical Constants from Pressed Pellets: II. Ellipsometric n and k Values for Ammonium Sulfate with Variability Analysis, Appl. Spectrosc., 74, 868–882, https://doi.org/10.1177/0003702820928358, 2020. a, b
Nishida, R. T., Boies, A. M., and Hochgreb, S.: Measuring ultrafine aerosols by direct photoionization and charge capture in continuous flow, Aerosol Sci. Tech., 52, 546–556, https://doi.org/10.1080/02786826.2018.1430350, 2018. a
Northrop, R. B.: Signals and Systems Analysis in Biomedical Engineering, CRC Press, Boca Raton, FL, 2nd edn., 2011.
Ofner, J., Krüger, H.-U., Zetzsch, C., and Grothe, H.: Direct Deposition of Aerosol Particles on an ATR Crystal for FTIR Spectroscopy Using an Electrostatic Precipitator, Aerosol Sci. Tech., 43, 794–798, https://doi.org/10.1080/02786820902946612, 2009. a, b
Parks, D. A., Griffiths, P. R., Weakley, A. T., and Miller, A. L.: Quantifying elemental and organic carbon in diesel particulate matter by mid-infrared spectrometry, Aerosol Sci. Tech., 55, 1014–1027, https://doi.org/10.1080/02786826.2021.1917764, 2021. a
Petzold, A. and Schönlinner, M.: Multi-angle absorption photometry—a new method for the measurement of aerosol light absorption and atmospheric black carbon, J. Aerosol Sci., 35, 421–441, https://doi.org/10.1016/j.jaerosci.2003.09.005, 2004.
Pollard, M., Jaklevic, J., and Howes, J.: Analysis of Carbon Particle Deposition on Teflon Filters Using Fourier Transform Infrared Spectroscopy, Aerosol Sci. Tech., 12, 182–193, https://doi.org/10.1080/02786829008959338, 1990. a
Preger, C., Overgaard, N. C., Messing, M. E., and Magnusson, M. H.: Predicting the deposition spot radius and the nanoparticle concentration distribution in an electrostatic precipitator, Aerosol Sci. Tech., 54, 718–728, https://doi.org/10.1080/02786826.2020.1716939, 2020. a
Quinten, M.: Optical Properties of Nanoparticle Systems: Mie and Beyond, Wiley-VCH Verlag & Co. KGaA, Weinheim, ISBN 978-3-527-41043-9, 2011. a
Reff, A., Turpin, B. J., Offenberg, J. H., Weisel, C. P., Zhang, J., Morandi, M., Stock, T., Colome, S., and Winer, A.: A functional group characterization of organic PM2.5 exposure: Results from the RIOPA study RID C-3787-2009, Atmospheric Environment, 41, 4585–4598, https://doi.org/10.1016/j.atmosenv.2007.03.054, 2007. a
Russell, L. M., Takahama, S., Liu, S., Hawkins, L. N., Covert, D. S., Quinn, P. K., and Bates, T. S.: Oxygenated fraction and mass of organic aerosol from direct emission and atmospheric processing measured on the R/V Ronald Brown during TEXAQS/GoMACCS 2006, J. Geophys. Res., 114, https://doi.org/10.1029/2008jd011275, 2009. a, b
Ruthenburg, T. C., Perlin, P. C., Liu, V., McDade, C. E., and Dillner, A. M.: Determination of organic matter and organic matter to organic carbon ratios by infrared spectroscopy with application to selected sites in the IMPROVE network, Atmos. Environ., 86, 47–57, https://doi.org/10.1016/j.atmosenv.2013.12.034, 2014. a
Sax, M., Zenobi, R., Baltensperger, U., and Kalberer, M.: Time Resolved Infrared Spectroscopic Analysis of Aerosol Formed by Photo-Oxidation of 1,3,5-Trimethylbenzene and α-Pinene, Aerosol Sci. Tech., 39, 822–830, https://doi.org/10.1080/02786820500257859, 2005. a
Scanlon, K., Laux, L., and Overend, J.: The Determination of Absolute Infrared Intensities with a Fourier Transform Spectrometer, Appl. Spectrosc., 33, 346–348, https://doi.org/10.1366/0003702794925552, 1979.
Segal-Rosenheimer, M., Dubowski, Y., and Linker, R.: Extraction of optical constants from mid-IR spectra of small aerosol particles, J. Quant. Spectrosc. Ra., 110, 415–426, https://doi.org/10.1016/j.jqsrt.2009.01.005, 2009. a, b
Shimada, M., Okuyama, K., Inoue, Y., Adachi, M., and Fujii, T.: Removal of Airborne Particles By a Device Using Uv/Photoelectron Method Under Reduced Pressure Conditions, J. Aerosol Sci., 30, 341–353, 1999. a
Takahama, S., Johnson, A., and Russell, L. M.: Quantification of Carboxylic and Carbonyl Functional Groups in Organic Aerosol Infrared Absorbance Spectra, Aerosol Sci. Tech., 47, 310–325, https://doi.org/10.1080/02786826.2012.752065, 2013. a
Takahama, S., Dillner, A. M., Weakley, A. T., Reggente, M., Bürki, C., Lbadaoui-Darvas, M., Debus, B., Kuzmiakova, A., and Wexler, A. S.: Atmospheric particulate matter characterization by Fourier transform infrared spectroscopy: a review of statistical calibration strategies for carbonaceous aerosol quantification in US measurement networks, Atmos. Meas. Tech., 12, 525–567, https://doi.org/10.5194/amt-12-525-2019, 2019. a
Toon, O. B., Pollack, J. B., Khare, B. N., and Owen: The optical constants of several atmospheric aerosol species: Ammonium sulfate, aluminum oxide, and sodium chloride, J. Geophys. Res., 81, 5733–5748, https://doi.org/10.1029/jc081i033p05733, 1976. a
Torrie, B., Lin, C., Binbrek, O., and Anderson, A.: Raman and infrared studies of the ferroelectric transition in ammonium sulphate, J. Phys. Chem. Solids, 33, 697–709, https://doi.org/10.1016/0022-3697(72)90078-9, 1972. a
Tsai, C.-J., Lin, G.-Y., Chen, H.-L., Huang, C.-H., and Alonso, M.: Enhancement of Extrinsic Charging Efficiency of a Nanoparticle Charger with Multiple Discharging Wires Enhancement of Extrinsic Charging Efficiency of a Nanoparticle Charger with Multiple Discharging Wires, Aerosol Sci. Tech., 44, 807–816, https://doi.org/10.1080/02786826.2010.492533, 2010. a
Tsai, Y. I. and Kuo, S.-C.: Development of diffuse reflectance infrared Fourier transform spectroscopy for the rapid characterization of aerosols, Atmos. Environ., 40, 1781–1793, https://doi.org/10.1016/j.atmosenv.2005.11.023, 2006. a
van de Hulst, H. C.: Light Scattering by Small Particles, Dover Publications Inc., ISBN 0-486-64228-3, 1981. a
Villares, G., Hugi, A., Blaser, S., and Faist, J.: Dual-comb spectroscopy based on quantum-cascade-laser frequency combs, Nat. Commun., 5, 5192, https://doi.org/10.1038/ncomms6192, 2014.
Virtanen, A., Joutsensaari, J., Koop, T., Kannosto, J., Yli-Pirilä, P., Leskinen, J., Mäkelä, J. M., Holopainen, J. K., Pöschl, U., Kulmala, M., Worsnop, D. R., and Laaksonen, A.: An amorphous solid state of biogenic secondary organic aerosol particles, Nature, 467, 824–827, https://doi.org/10.1038/nature09455, 2010. a
Volckens, J. and Leith, D.: Electrostatic Sampler for Semivolatile Aerosols: Chemical Artifacts, Environ. Sci. Technol., 36, 4608–4612, https://doi.org/10.1021/es0207100, 2002. a, b
Weis, D. D. and Ewing, G. E.: Infrared spectroscopic signatures of (NH4)2SO4 aerosols, J. Geophys. Res.-Atmos., 101, 18709–18720, https://doi.org/10.1029/96jd01543, 1996. a, b
Whitby, K. T.: Generator for Producing High Concentrations of Small Ions, Rev. Sci. Instrum., 32, 1351–1355, https://doi.org/10.1063/1.1717250, 1961. a
Yazdani, A., Dudani, N., Takahama, S., Bertrand, A., Prévôt, A. S. H., El Haddad, I., and Dillner, A. M.: Characterization of primary and aged wood burning and coal combustion organic aerosols in an environmental chamber and its implications for atmospheric aerosols, Atmos. Chem. Phys., 21, 10273–10293, https://doi.org/10.5194/acp-21-10273-2021, 2021. a, b
Yu, X., Song, W., Yu, Q., Li, S., Zhu, M., Zhang, Y., Deng, W., Yang, W., Huang, Z., Bi, X., and Wang, X.: Fast screening compositions of PM2.5 by ATR-FTIR: Comparison with results from IC andOC/EC analyzers, J. Environ. Sci., 71, 76–88, https://doi.org/10.1016/j.jes.2017.11.021, 2018. a
Zhang, X. and McMurry, P. H.: Theoretical analysis of evaporative losses of adsorbed or absorbed species during atmospheric aerosol sampling, Environ. Sci. Technol., 25, 456–459, https://doi.org/10.1021/es00015a012, 1991. a