the Creative Commons Attribution 4.0 License.
the Creative Commons Attribution 4.0 License.
 | 21 Sep 2022
The Microfluidic Ice Nuclei Counter Zürich (MINCZ): a platform for homogeneous and heterogeneous ice nucleation
Florin N. Isenrich
Michael Rösch
Julia Nette
Stavros Stavrakis
Claudia Marcolli
Zamin A. Kanji
Andrew J. deMello
Ulrike Lohmann
Ice nucleation in the atmosphere is the precursor to important processes that determine cloud properties and lifetime. Computational models that are used to predict weather and project future climate changes require parameterizations of both homogeneous nucleation (i.e. in pure water) and heterogeneous nucleation (i.e. catalysed by ice-nucleating particles, INPs). Microfluidic systems have gained momentum as a tool for obtaining such parameterizations and gaining insight into the stochastic and deterministic contributions to ice nucleation. To overcome the shortcomings of polydimethylsiloxane (PDMS) microfluidic devices with regard to temperature uncertainty and droplet instability due to continuous water adsorption by PDMS, we have developed a new instrument: the Microfluidic Ice Nuclei Counter Zürich (MINCZ). In MINCZ, droplets with a diameter of 75 µm are generated using a PDMS chip, and hundreds of these droplets are then stored in fluoropolymer tubing that is relatively impermeable to water and solvents. Droplets within the tubing are cooled in an ethanol bath. We validate MINCZ by measuring the homogeneous freezing temperatures of water droplets and the heterogeneous freezing temperatures of aqueous suspensions containing microcline, a common and effective INP in the atmosphere. We obtain results with a high accuracy of 0.2 K in measured droplet temperature. Pure water droplets with a diameter of 75 µm freeze at a median temperature of 237.3 K with a standard deviation of 0.1 K. Additionally, we perform several freeze–thaw cycles. In the future, MINCZ will be used to investigate the freezing behaviour of INPs, motivated by a need for better-constrained parameterizations of ice nucleation in weather and climate models, wherein the presence or absence of ice influences cloud optical properties and precipitation formation.
- Article
(12461 KB) - Full-text XML
- BibTeX
- EndNote


Water in mixed-phase clouds is present in both the liquid and crystalline form, and the proportion between cloud droplets and ice crystals alters cloud radiative properties as well as cloud lifetimes (Lohmann, 2017; Lohmann and Feichter, 2005; Matus and L'Ecuyer, 2017). The transformation of liquid to ice in the troposphere can occur via homogeneous nucleation (in a pure water or aqueous droplet) or heterogeneous nucleation (for example, in a droplet containing solid particles). While homogeneous freezing of supercooled water occurs at temperatures below about 238 K depending on droplet size and relative humidity (Ickes et al., 2015; Koop et al., 2000; Kreidenweis et al., 2018), heterogeneous nucleation in mixed-phase clouds may occur at temperatures up to 273 K in aqueous droplets containing impurities (ice-nucleating particles, INPs) that catalyse ice formation. Conversely, the presence of salt ions in solution may lead to a freezing point depression below the corresponding pure water homogeneous or heterogeneous freezing temperature (Koop et al., 2000; Zobrist et al., 2008). A number of INP types are known to originate from natural and anthropogenic sources, including minerals such as feldspars, clay minerals, organic macromolecules, and organic matter (Kanji et al., 2017). However, the exact roles of the stochastic (time-dependent) and deterministic (time-independent) contributions to heterogeneous ice nucleation are uncertain and necessitate further research (Kaufmann et al., 2017; Knopf et al., 2020; Wright and Petters, 2013). A better understanding of these processes could improve our understanding of the role of INPs in precipitation formation so that present uncertainties in climate projections and weather forecasts may be reduced. In fact, the role of INPs in aerosol–cloud interactions has recently been identified as a research priority in the atmospheric community (Murray et al., 2021). Beyond the atmosphere, more complete knowledge of ice nucleation is also pertinent to applications such as cryopreservation (Marquez-Curtis et al., 2021; Pegg, 2015) and pharmaceutical manufacturing (Assegehegn et al., 2019; Deck et al., 2022).
A range of techniques has been developed to study homogeneous and heterogeneous nucleation in atmospherically relevant systems (Diehl et al., 2014; Kaufmann et al., 2016; Miller et al., 2021; Rogers, 1988; Stetzer et al., 2008), and each technique can be associated with a particular drawback. For example, single-particle levitation devices (Diehl et al., 2014; Krämer et al., 1996) are time-consuming for investigating a large number of droplets sufficient for statistical analysis, whereas differential scanning calorimetry measurements of water-in-oil emulsions typically give only qualitative insight into nucleation behaviour due to the polydispersity in droplet size (Kaufmann et al., 2016; Klumpp et al., 2022; Kumar et al., 2018). To overcome such shortcomings, microfluidic techniques can be used to generate a stable, monodisperse population of water droplets at high throughput that is suitable for quantifying nucleation rates. Water-in-oil emulsions are generated at an orifice, where the oil phase cleaves off the water phase to generate a droplet. Nonionic surfactants dispersed in the oil phase stabilize the droplets at the oil–water interface. At the microfluidic size scale, it becomes possible to investigate homogeneous ice nucleation, low INP concentrations, and INPs that are active at temperatures between that of homogeneous freezing and the melting point of water. Moreover, since microfluidic systems allow for the high-throughput generation of water-in-oil droplets, the number of droplets studied with this technique outnumbers the standard 96-well plates employed in many traditional droplet freezing assays (e.g. David et al., 2019; Schneider et al., 2021; Garcia et al., 2012; Kunert et al., 2018; see Miller et al., 2021, for a full list). Briefly, we note that the term cloud droplet denotes diameters up to approximately 50 µm in atmospheric science, while in microfluidics, a droplet can refer to larger sizes up to the nanolitre (nL) range; hereafter, we refer to droplets more generally and not restricted to cloud droplet sizes.
Amongst existing microfluidic platforms designed for studying ice nucleation, there are two common approaches for droplet generation and cooling: dynamic flow-through devices (Roy et al., 2021a; Stan et al., 2009; Tarn et al., 2020, 2021) and static droplet arrays (Brubaker et al., 2019; Edd et al., 2009; Reicher et al., 2018; Roy et al., 2021b). The flow-through approach is beneficial for analysing high numbers of droplets (between 103 and 104; Tarn et al., 2020) and is therefore particularly suitable for detecting low concentrations of INPs suspended in water or an aqueous solution. Continuous flow devices are also desirable for potential use as autonomous in-line instruments for monitoring the temporal evolution of INP concentration in the field (Tarn et al., 2020). One drawback of current flow-through devices is the difficulty of independently controlling the cooling rate of droplets over orders of magnitude. This is due to the fact that cooling rates are a function of fluid flow rate and channel length, and changing these variables will also affect droplet diameter. A second drawback associated with continuous flow devices is the inability to perform refreeze experiments on the produced droplets. On the other hand, static droplet arrays are not suitable for detecting rare INPs in solution since such arrays generally only contain between 102 and 103 droplets per experiment, and it is statistically unlikely for a rare INP to be present in such a small volume of liquid (Brubaker et al., 2019; Reicher et al., 2018). Droplet arrays are beneficial in that they can be cooled at various rates in a controllable fashion, providing the option of multiple cooling and thawing cycles to gain insight into the stochastic vs. deterministic behaviour of heterogeneous ice nucleation.
In both flow-through and droplet array designs, microfluidic devices are almost always fabricated from polydimethylsiloxane (PDMS) and plasma-bonded to glass slides. PDMS is a hydrophobic, non-porous, and gas-permeable material. This gas permeability, however, can lead to the rapid evaporation and concomitant shrinking of water droplets, limiting refreezing experiments. Droplet evaporation can be reduced with various surface treatments (Brubaker et al., 2019) or a blocking layer of a different material (Heyries et al., 2011), but to permanently prevent gas permeation, alternative substrate materials must be considered. One alternative strategy is to cool droplets off-chip on a solid substrate while covering them with a fluid of low gas permeability such as silicone oil or squalene (Peckhaus et al., 2016; Wright and Petters, 2013). A second alternative is to store droplets off-chip in tubing and immerse the tubing in an ethanol bath for cooling, as shown by Atig et al. (2018). It should be noted that, in this study, droplet diameters were more than 1 mm, with the median freezing point of water at this size being observed to be 249 K (−24 ∘C) (Atig et al., 2018), i.e. far above homogeneous ice nucleation temperatures.
In cold-stage microfluidic platforms, droplets are typically cooled from below. Such an approach takes advantage of the excellent heat transfer that accompanies miniaturization, yet it is hampered by the poor heat transfer through PDMS, which gives rise to a temperature gradient within the microfluidic device (Polen et al., 2018). Therefore, measuring the actual temperature of droplets within the device remains a challenge, since cooling a microfluidic device directly from the bottom generates a temperature gradient within the device. To account for such temperature differentials, Reicher et al. (2018) calibrated droplet temperatures as a function of cold-stage temperature by observing the melting of solutions and materials with known melting points. As discussed by Reicher et al. (2018), a different calibration equation was needed for each PDMS substrate thickness, which was identified by Polen et al. (2018) as a potential drawback. To avoid a thickness-dependent calibration, Tarn et al. (2020, 2021) placed a thermocouple within a microfluidic channel parallel to the one through which droplets flow to more accurately determine droplet temperature, but the reported uncertainty in this setup is still at a relatively high value of ±0.7 K. Given that uncertainties in homogeneous ice nucleation rates are dominated by uncertainties in temperature (Riechers et al., 2013), increasing an instrument's temperature accuracy is the single most important factor in improving our ability to precisely discern how nucleation rate changes as a function of temperature. This is especially important because nucleation rates for the homogeneous freezing of water obtained from various instrument types (continuous flow chambers, droplet freezing assays, etc.) and instruments of the same type (e.g. all microfluidic platforms) currently span several orders of magnitude at the same temperature (Ickes et al., 2015; Tarn et al., 2021).
Amongst the rapidly growing number of microfluidic systems designed to investigate ice nucleation, we aimed to develop a setup able to create and freeze picolitre-sized droplets, whilst avoiding the primary disadvantages associated with current methods. Namely, our goals were to achieve a monodisperse size distribution of droplets with diameters of 75 µm, generate a large number of droplets (many hundreds), ensure droplet stability over the time needed to perform multiple (re)freezing cycles at various cooling rates, minimize temperature gradients in the device, and ensure high accuracy and precision in all temperature measurements. Further, and most importantly, we aimed to develop a system that is easy to handle and easy to transfer to other laboratories or field sites. Herein, we present and validate our system and technique. We report data for the homogeneous freezing of pure water and for the heterogeneous freezing of microcline suspensions in water. Microcline, a K-feldspar, is selected as an example, since it is commonly found in collected mineral dust samples and it is a highly active INP (Harrison et al., 2016; Kanji et al., 2017; Klumpp et al., 2022; Welti et al., 2019).
In the Microfluidic Ice Nuclei Counter Zürich (MINCZ), droplets are generated in a conventional PDMS microfluidic device. Droplets are not stored on-chip, but in fluorinated (perfluoroalkoxy alkane, PFA) tubing having an inner diameter of 75 µm. The PFA tubing is immersed and cooled in an ethanol bath, minimizing any temperature gradients while maximizing heat transfer. The chemically inert and relatively gas-impermeable PFA tubing allows for prolonged cooling cycles and refreeze experiments to temperatures below which pure water freezes homogeneously. A CMOS camera connected to a stereoscope is used to image the droplets, and a semi-automated image analysis algorithm is used to identify droplet freezing events. We present a general summary of the components that comprise MINCZ (Sect. 2.1), followed by detailed descriptions of the microfluidic chip (Sect. 2.2) and aqueous sample preparation (Sect. 2.3). Finally, the workflow of a typical experiment is presented, including droplet generation (Sect. 2.4.1), droplet cooling (Sect. 2.4.2), and image analysis to determine droplet size (Sect. 2.4.3) and freezing temperature (Sect. 2.4.4).
2.1 Instrument design
Figure 1 presents an overview of the equipment used in MINCZ. A stereoscope (Nikon SMZ1270, 0.5× objective lens, fibre ring illuminator with LED light source) connected to a CMOS camera (iDS UI-3060CP-M-GL Rev. 2) is used to obtain images. For droplet generation (see Sect. 2.4.1 for more details), we use (i) three syringe pumps fitted with 1 mL glass syringes, (ii) a PDMS microfluidic chip with the channel design shown in Fig. 1a, and (iii) high-purity perfluoroalkoxy alkane (PFA) tubing that is directly inserted into the outlet of the microfluidic chip and kept in place in a custom-milled polyether ether ketone (PEEK) holder. For droplet cooling (see Sect. 2.4.2 for more details), we use (i) an ethanol cooling bath (insulated by a custom 3D-printed structure) to immerse the droplet-containing PFA tubing, (ii) two K-type thermocouples, and (iii) a Peltier element connected to a power supply and cooled from below by a heat transfer fluid circulating through an aluminium block connected to a chiller. To improve image quality during droplet cooling, we use a pair of cross-polarized filters, and we place six glass cover slips underneath the PEEK tubing holder for improved image contrast.
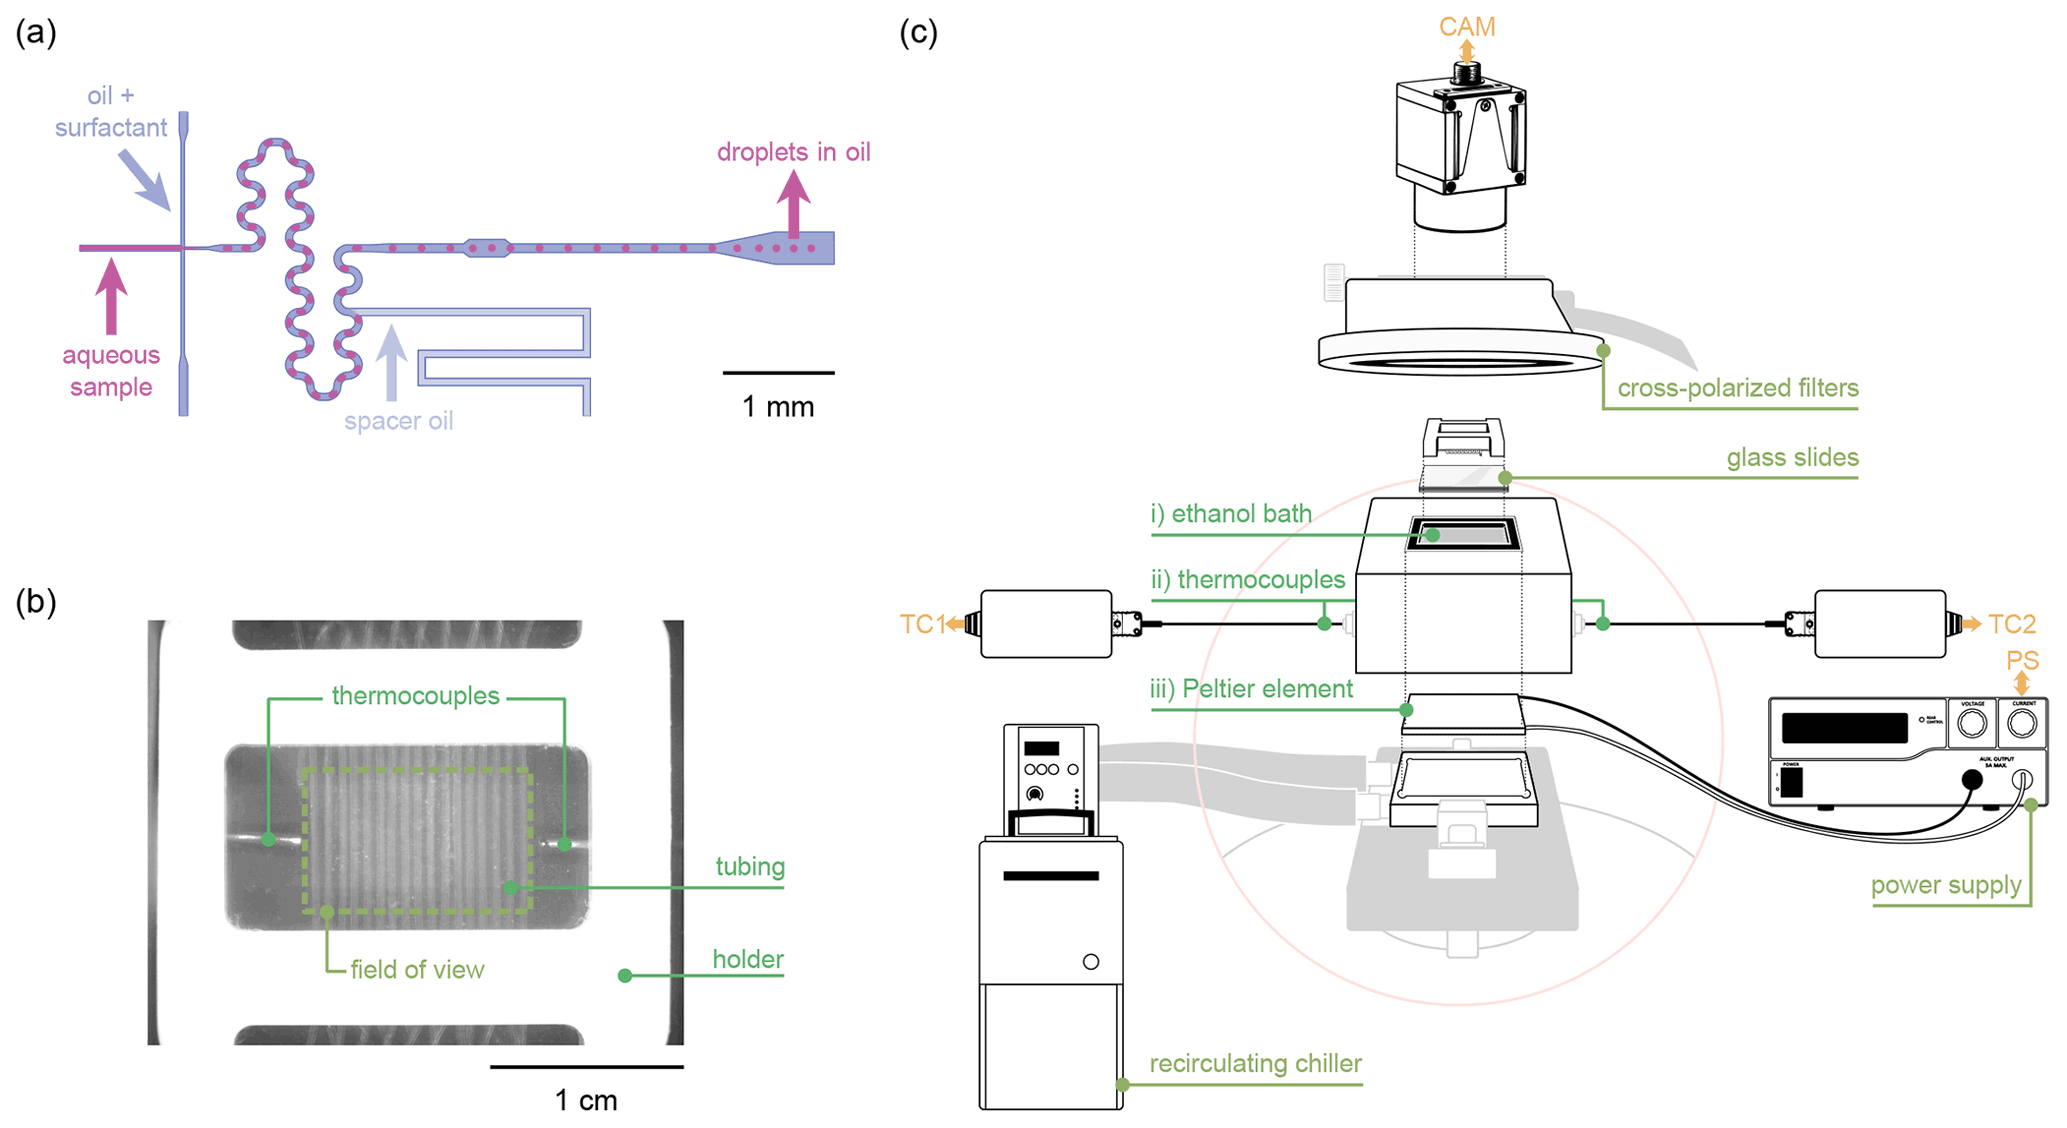
Figure 1Overview of the Microfluidic Ice Nuclei Counter Zürich (MINCZ): (a) microfluidic channels used to generate aqueous droplets surrounded by an oil–surfactant continuous phase; (b) a top-down image of the ethanol bath into which the PEEK holder with PFA tubing is placed, with the dashed outline showing the field of view visible to the camera; (c) the equipment used for cooling the ethanol bath (i) in which the tubing is placed. Temperature is measured by two thermocouples (ii), and temperature control is achieved with a Peltier element (iii).
2.2 Microfluidic chip design and fabrication
The microfluidic chip design was drawn in AutoCAD® 2018 (Autodesk, San Rafael, USA). It features a flow-focusing droplet generator with an orifice that is 75 µm high and 20 µm wide. After passing through passive-mixing structures, the droplets flow from a 350 µm wide outlet into the 75 µm inner diameter PFA outlet tubing. A schematic representation is shown in Fig. 1a. The chip design was printed onto a high-resolution film photomask (Micro Lithography Services Ltd, Chelmsford, UK), which was used to pattern an SU-8 (GM1070, Gersteltec, Switzerland) coated silicon wafer (10 mm diameter, 525±25 µm thickness, orientation, Siegert Wafer GmbH, Germany). This resulting master mould was employed to fabricate the PDMS chips by pouring PDMS (Elastosil RT 601 A/B, Ameba AG, Switzerland) over the mould at a 10:1 mass ratio of base to curing agent, with subsequent curing at 70 ∘C for more than 2 h. Inlets (0.76 mm) and outlets (0.41 mm) were punched with a hole punch (Shafts 20 and 25, Syneo, USA), and the PDMS devices were plasma-bonded (plasma cleaner, Diener electronic GmbH, Germany) to planar glass slides (Menzler-Glaser, Germany). To improve hydrophobicity, the PDMS devices were incubated in 5 % (tridecafluoro-1,1,2,2-tetrahydrooctyl)trichlorosilane (97 %, abcr GmbH, Germany) for 5 min, then in HFE-7500 (3M™ Germany) for 5 min, and then kept on a hot plate at 120 ∘C for at least 14 h.
2.3 Sample preparation
For the homogeneous freezing assays, ultrapure water was used (molecular biology reagent-grade, 0.1 µm filtered, Sigma-Aldrich, USA), hereafter referred to as Sigma-Aldrich (SA) water. The microcline used in the heterogeneous ice nucleation experiments was from the same milled stone from Elba, Italy, as reported in a previous study (Welti et al., 2019; for mineralogical composition, see X-ray diffraction results therein). Scanning electron microscopy (SEM) revealed a high size polydispersity of the mineral particles ranging from submicrometre to more than 30 µm (Fig. A1a). Indeed, individual particles were clearly visible when suspended in microfluidic droplets (Fig. A2). To ensure repeatability and reproducibility, we homogenized the microcline to particles in the submicrometre range using the following procedure. First, the mineral sample (2 g in 50 mL SA water) was sonicated (8×30 s pulse in a UP200ST ultrasonic VialTweeter; Hielscher Ultrasonics GmbH, Germany) followed by filtration using a 0.45 µm polyethersulfone sterile syringe filter (TPP Techno Plastic Products AG, Switzerland). Then, the resulting homogeneous mineral sample was concentrated and dried using a SpeedVac (Savant™ SPD111V, Thermo Scientific™, USA). Just before use, the resulting pellet of mineral particles was rehydrated to a stock solution of 1.5 mg mL−1 in SA water, and this stock solution was subsequently diluted to the working solution of 0.5 mg mL−1 and sonicated in a water bath for 15 min. The size distribution of the microcline particles was visualized using scanning electron microscopy (SEM; FEI Magellan 400 scanning electron microscope), as shown in Fig. A1c.
2.4 Experimental workflow
Spherical water-in-oil droplets are generated within a PDMS chip (see Sect. 2.4.1 for details) and introduced into the PFA tubing. A video is recorded during droplet generation, from which the mean droplet diameter can be evaluated (see Sect. 2.4.3). Afterwards, the droplet population within the PFA tubing is cooled in the ethanol bath, while images are captured at a frequency sufficient to obtain one image for every 0.05 K decrease in temperature depending on the user-specified cooling rate (see Sect. 2.4.2). We process the saved images using a semi-automated image analysis algorithm to determine the number of frozen droplets as a function of temperature (see Sect. 2.4.4).
2.4.1 Droplet generation
The PDMS microfluidic chip is connected to two pieces of PTFE tubing (0.56 mm i.d., 0.25 mm o.d., Rotima AG Switzerland) containing the water phase and the surfactant in oil (5 % 008-FluoroSurfactant – RAN Biotechnologies, USA – diluted to 1 % in HFE-7500) for droplet generation, while a third piece of tubing contains fluorinated oil (HFE-7500) employed as a spacer fluid. Glass syringes (1 mL Hamilton® syringe, Sigma-Aldrich, USA) are filled with a supporting fluid (either water or fluorinated oil) and held in syringe pumps (Aladdin AL1000-220Z, World Precision Instruments, USA), which are employed to ensure stable flow rates. An air bubble between each injected fluid (the aqueous sample and the surfactant–oil mixture) and the supporting fluid in the PTFE tubing prevents contamination and dilution of the sample by the supporting fluid, whilst allowing for flexible and low sample consumption. The air bubble remains in the inlet tubing, and it does not enter the microfluidic chip or the outlet PFA tubing. One end of the PFA tubing for droplet storage (50 cm in length, 360 µm o.d., 75 µm i.d., IDEX Health & Science LLC, USA) is directly inserted into the PDMS device outlet. The rest of the tubing is kept in the custom-milled PEEK holder. During droplet generation, the PDMS device is monitored using the stereoscope and camera. After stable generation of spherical droplets is achieved and a video of droplet generation is recorded, the PFA tubing is immediately cut from the PDMS chip with scissors and the tubing ends mechanically blocked using tweezers.
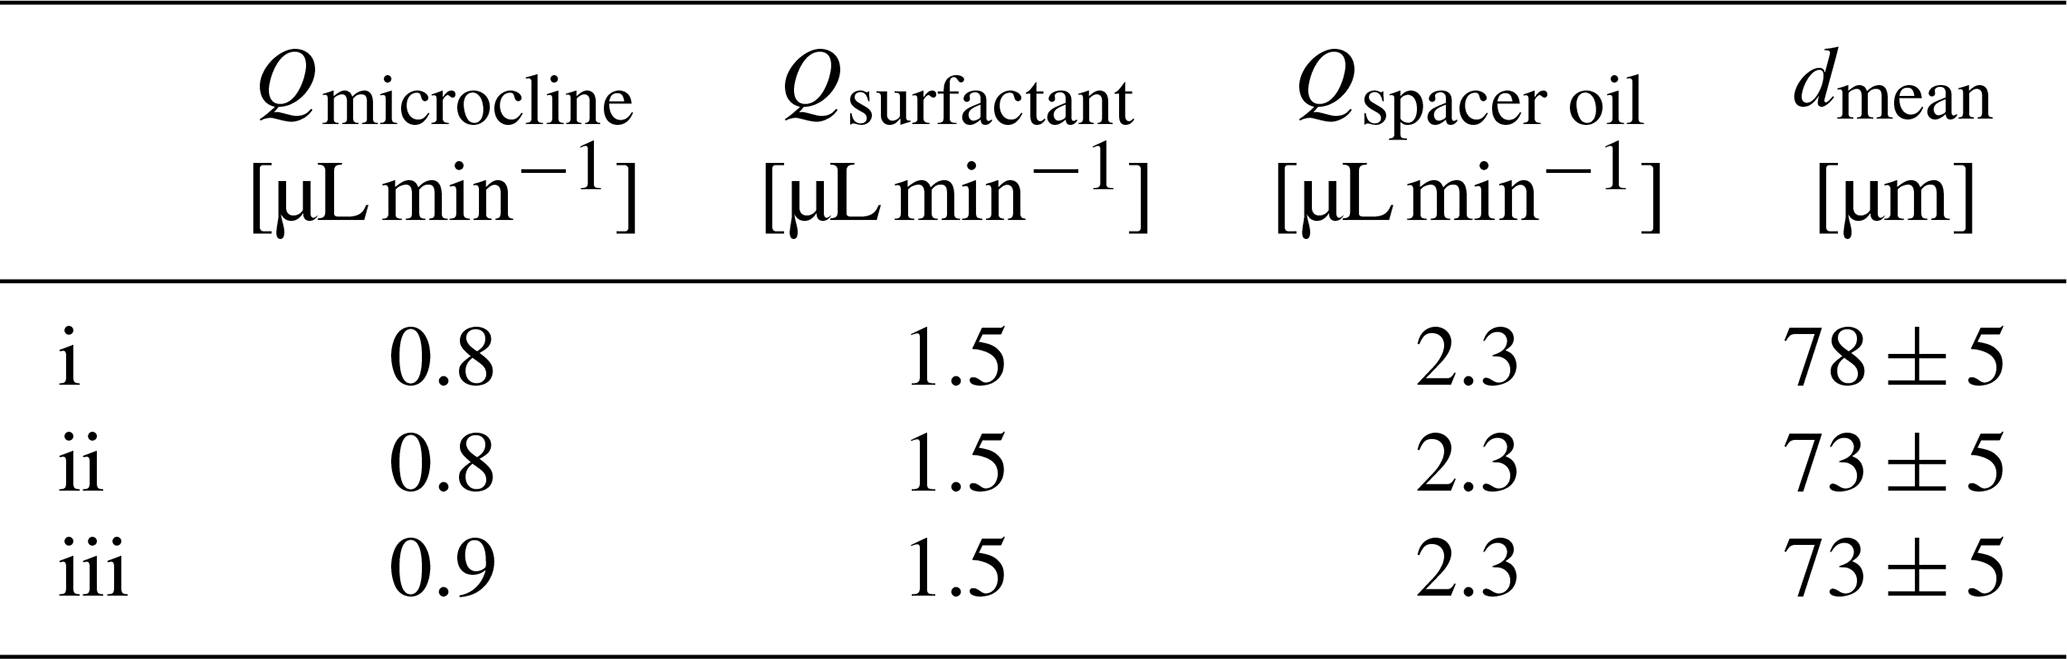
The flow rates used in the current study are listed in Table 1 for the SA water experiments and Table 2 for the microcline experiments. The same PDMS chip can be reused for several consecutive runs (e.g. for the generation of the three microcline suspensions in Table 2), or separate chips may be used if channels become clogged between experiments or if the chip delaminates from the glass slide due to insufficient bonding (e.g. in Table 1). As a result of new chips being used from one day to another, the flow rates in Tables 1 and 2 required for stable droplet generation differ slightly.
Table 1Sigma-Aldrich (SA) water, surfactant in oil, and spacer oil flow rates used to produce each population of droplets for the homogeneous freezing experiments. The mean diameter of droplets obtained from the captured high-speed video is also summarized for each droplet population.
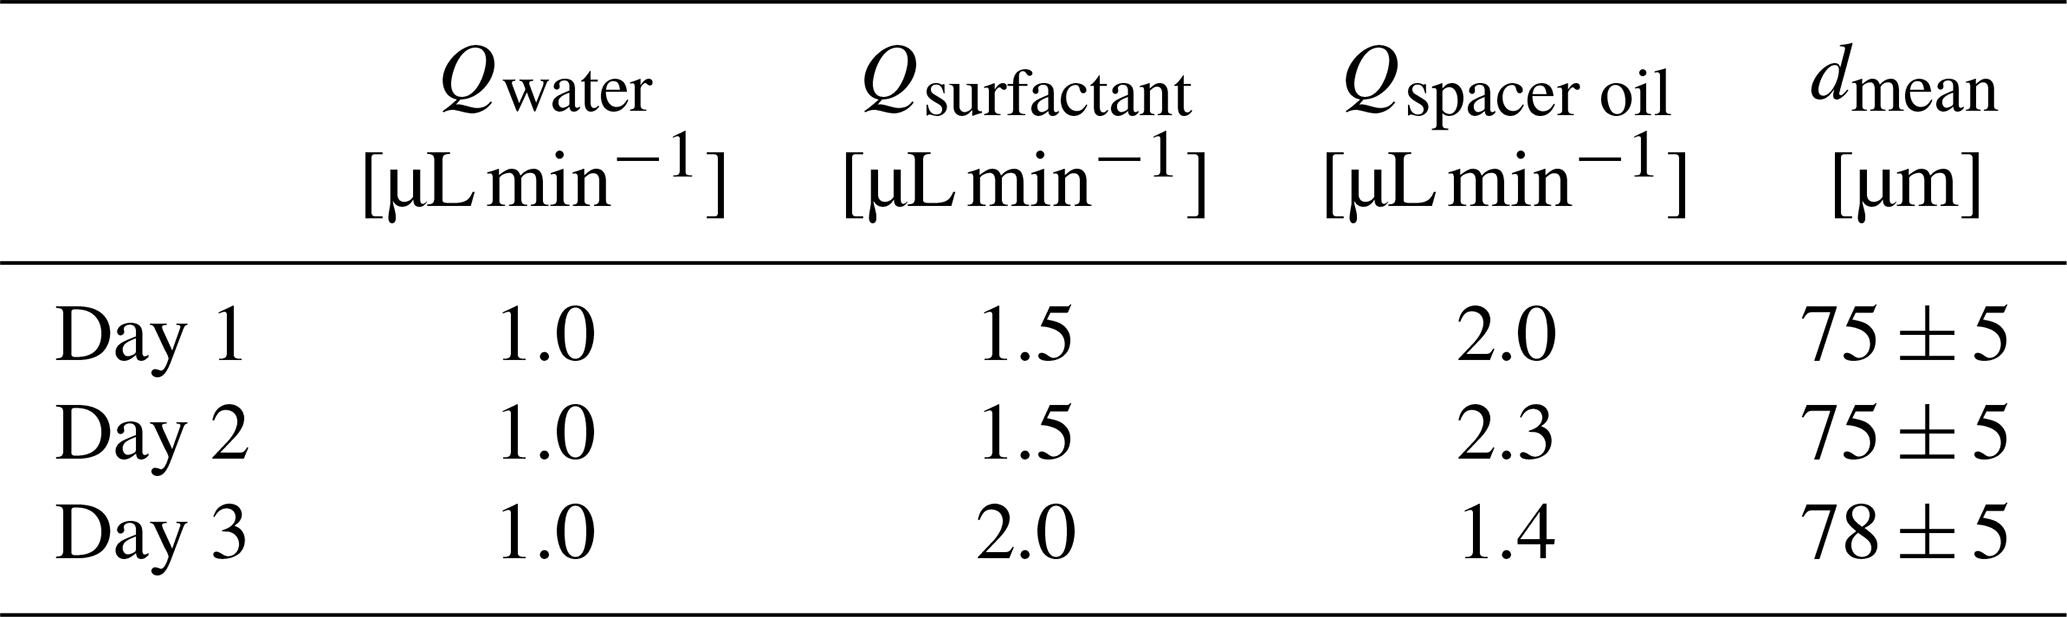
Table 2Microcline suspension, surfactant in oil, and spacer oil flow rates used to produce each population of droplets for the heterogeneous freezing experiments. The mean diameter of droplets obtained from the captured high-speed video is also summarized for each droplet population.
2.4.2 Droplet cooling
The PFA tubing containing the droplets is immersed in an ethanol bath held in an aluminium container (40 mm ×40 mm ×60 mm). The inside walls of the bath are oxidized to provide a black background behind the droplets to improve imaging contrast. Six glass cover slips (24 mm ×24 mm, 0.13–0.17 mm thick, Fisherbrand™, Fisher Scientific AG, Switzerland) are placed under the PFA tubing to further improve contrast. During cooling of the ethanol bath, a vertical temperature gradient develops from the bottom to the top of the bath. To ensure that temperature measurements are representative of actual droplet temperatures, two thermocouples (K-type, 0.5 mm o.d., RS Components GmbH, Germany, and TC Direct, Germany) are placed horizontally in the ethanol bath in the same plane as the PFA tubing (Fig. 1b and c), with the average of the recorded temperatures taken to be representative of the temperature of the droplets. There are no horizontal temperature gradients, as confirmed by the fact that there is no spatial bias in freezing temperature (Appendix B). Each thermocouple was calibrated to the melting point of mercury (−38.8 ∘C or 234.4 K) and water (0 ∘C or 273.15 K), providing high accuracy with a standard deviation of 0.1 K for three measurements at each melting point. Over all experiments reported herein, the average difference in the measured temperature between the two thermocouples (T2−T1) in the ethanol bath was 0.01±0.21 K (standard deviation). The accuracy of our temperature measurement is thus reported to be ±0.2 K.
A Peltier element (PKE 128A 0020 HR 150, Peltron GmbH, Germany) is connected to a laptop-controlled power supply (Manson® HCS-3302, Distrelec Group AG, Switzerland) to achieve the user-defined cooling rate. Heat from the Peltier element is dissipated from below by an aqueous 55 % ethylene glycol (98 % technical grade, Sigma-Aldrich, USA) mixture circulating through an aluminium block connected to a chiller (Huber KISS K6, Huber Kältemaschinenbau AG, Germany). Thermal paste (Fischer Elektronik GmbH, Germany) is applied between the top of the aluminium block and the bottom of the Peltier element to ensure good thermal contact.
A custom Python-based (Python 3.0) user interface was designed to permit the user to select the desired cooling rate and image acquisition settings. Once these parameters are selected and the temperature of the ethanol bath has reached steady state (with the chiller set to −15 ∘C and the power supply at 0.8 V), cooling is initiated. A proportional controller with a temperature-dependent gain parameter sets the voltage of the power supply to maintain this cooling rate (see Figs. B1 and B2 for the time series of cooling rate as a function of temperature for each experiment reported herein). During cooling at 1 K min−1, images are captured every 3 s, and the temperature is recorded. Once the measured temperature reaches the set end temperature, e.g. 233 K, the programme terminates.
2.4.3 Droplet size distribution
From a 10 s video of droplet generation, the mean droplet size is determined through a series of image processing steps implemented in Python (using the cv2 and skimage packages): subtracting the background, equalizing the histogram, morphological opening, thresholding, and using the Hough circle transform to identify and measure the droplets in each frame of the captured video. The obtained mean diameter for each droplet population is summarized in Tables 1 and 2 for pure water and microcline suspensions, respectively. The accuracy of mean diameter measurements is estimated to be ±5 µm. This measurement uncertainty arises from the resolution of the CMOS camera and the magnification of the stereoscope, with an uncertainty in droplet radius of 2 pixels equating to our reported ±5 µm in droplet diameter. However, the physical variability in droplet diameter for one droplet population is far less than this measurement accuracy. We independently monitored droplet generation on an inverted bright field microscope (Ti-E, Nikon, Switzerland) equipped with a 20×0.4 NA objective lens and a high-speed camera (Phantom Miro M310, Vision Research, USA). We used flow rates of Qwater=1.0 µL min−1, Qsurfactant=1.5 µL min−1, and Qspacer oil=2.0 µL min−1, which are the same as those used for the water experiment on day 1 (Table 1). The standard deviation of droplet diameter in one droplet population was 0.5 µm around the mean based on measurements obtained using ImageJ (Schneider et al., 2012), corresponding to a variation in droplet volume of 2 %.
2.4.4 Freezing detection
Due to the high purity of the SA water, only a weak increase in brightness is detected when a droplet freezes (i.e. the raw change in pixel intensity between the background and an unfrozen droplet vs. a frozen droplet is minimal), possibly because few impurities are present to induce crystallographic defects that manifest as an increase in brightness. Therefore, when combined with a low number of pixels per droplet, the detection of droplet freezing in the saved images is challenging and necessitates a semi-automated approach.
An overview of the workflow for detecting droplet freezing is illustrated in Fig. 2. If necessary, prior to automated screening, an image stabilization routine is applied to the images using the cv2 and skimage packages in Python for feature detection and Euclidian transformation. To detect droplet freezing, the images are first automatically screened to find locations where droplet freezing may have occurred. Second, the user is prompted to classify whether freezing did or did not occur. In the future, the manually labelled images of frozen or unfrozen droplets could be used to train a machine learning algorithm for fully automated image processing. Droplets that exhibit a clear spike in brightness upon freezing would facilitate the automation of image classification. A distinct brightness change is expected for droplets containing solid impurities, such as INPs, or aqueous solutions of, for example, NaCl.
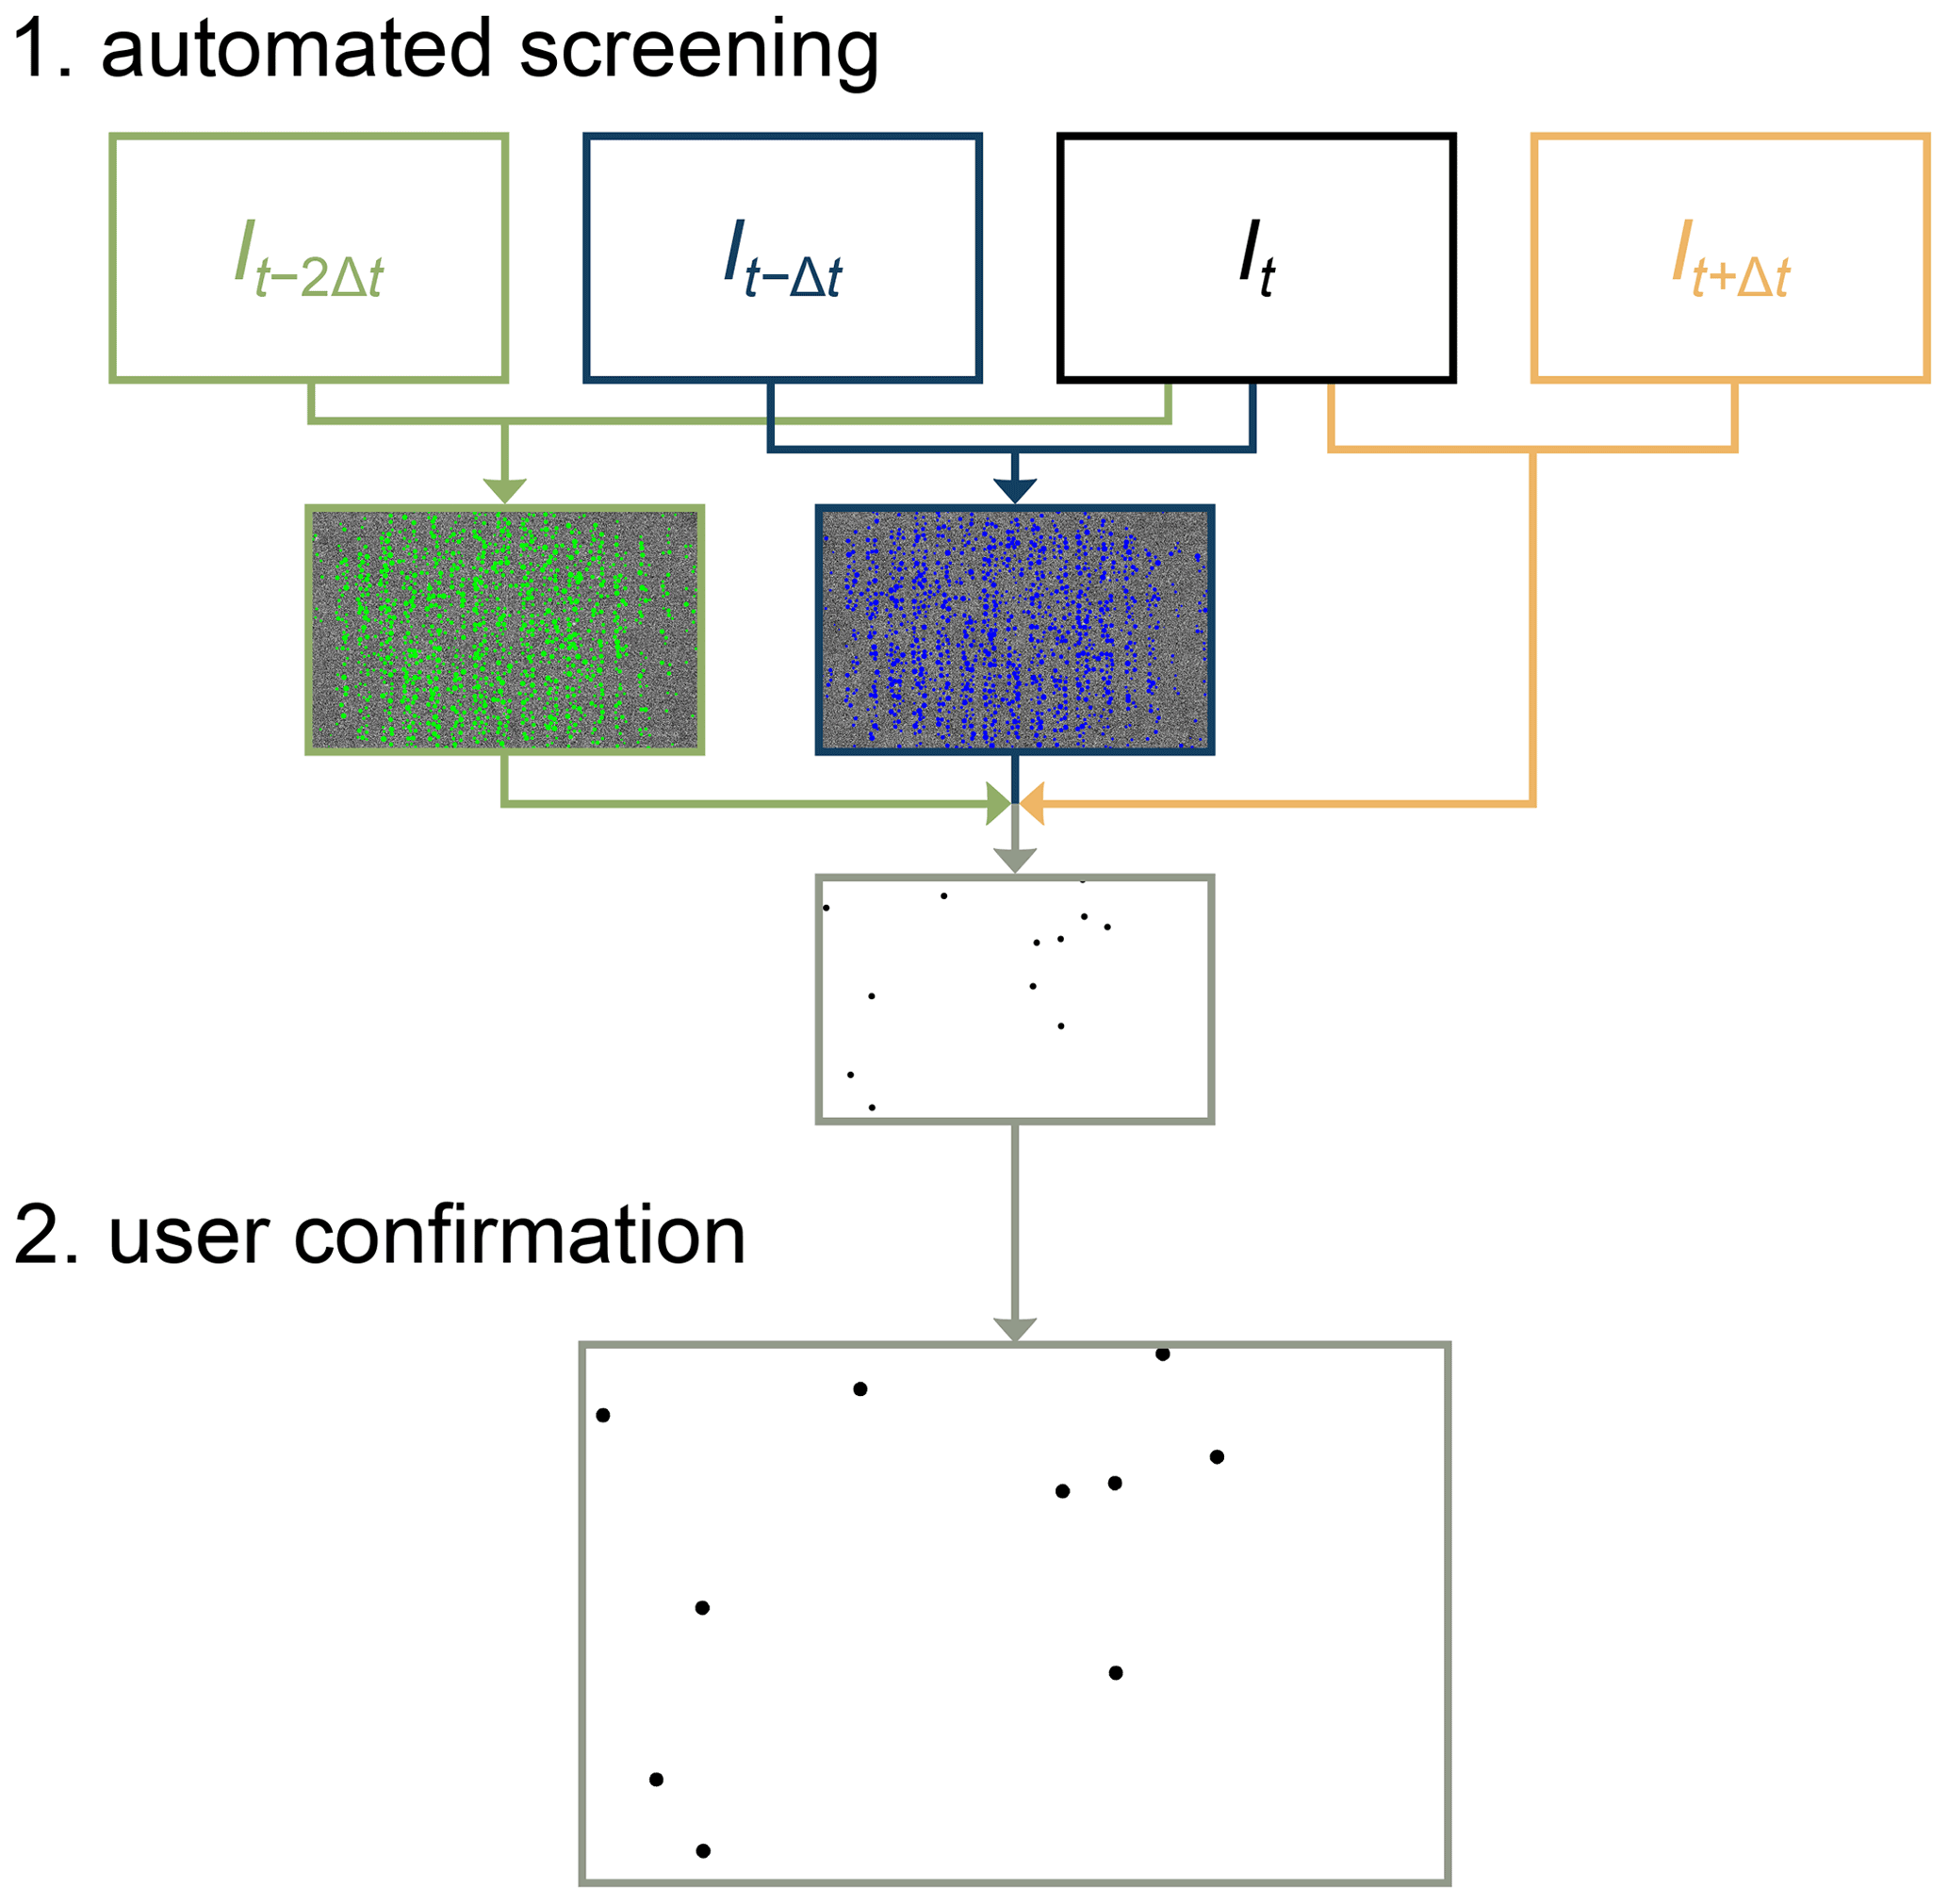
Figure 2Workflow to locate the droplets that froze between two consecutive images (It and It−Δt), also making use of images It−2Δt and It+Δt. In the first step, locations where droplets potentially froze are automatically screened (highlighted in blue pixels for the two consecutive images and in green pixels for comparison to the image two time steps prior to It). The second step is for the user to confirm whether a droplet actually froze at that location (to eliminate false positives due to noise or other optical interference).
The automated screening procedure includes multiple steps: subtracting the pixel intensities of two consecutive images taken at time t and t−Δt, applying a bilateral filter to the subtracted image, carrying out morphological opening, detecting edges, and applying a Hough circle transform to find potential droplet centres. The above procedure is always performed for two pairs of images, resulting in the difference images (with potential droplet centres highlighted in blue in Fig. 2) and (with potential droplet centres highlighted in green in Fig. 2). Only coordinates where brightness changes are detected in both image pairs are considered to be potential freezing events. Additionally, two criteria were defined that must be met in the I−Δt image to definitively tag a droplet: (i) the identified coordinate must fall within a predefined grid of pixels where tubing is present, and (ii) the average pixel intensity of an 8-pixel radius at that coordinate must be less than 90 (i.e. dark in the range of greyscale values between 0 and 255). Finally, the average pixel intensity of an 8-pixel radius at that coordinate in the image must be less than 150. Together, the above criteria aid in removing false positives from consideration and limit the number of potential freezing events that need to be presented to the user for visual classification. The user can also flag any frozen droplets that are not spherical as a result of two droplets coalescing. These frozen droplets with twice the volume are discarded from further analysis.
Figure 3 depicts the fraction of frozen droplets as a function of temperature for three independent droplet populations of Sigma-Aldrich (SA) water cooled at a rate of 1 K min−1. After being frozen once, the third droplet population was thawed and refrozen twice more (days 3b and c). In each frozen fraction curve, there is a single data point corresponding to each saved image (that is, one data point at every interval of 0.05 K showing the cumulative number of droplets frozen down to that temperature). From the three independent droplet populations, the median freezing temperature is 237.3 K with a precision of 0.1 K (standard deviation of the three experiments). Possible contributions to the observed variability could arise from inherent uncertainty in the thermocouple measurement, small changes in the positioning of the tubing holder and thermocouples between experiments, and/or slight differences in droplet diameter between droplet populations. The repeated freeze–thaw cycles yield a better precision of ±0.04 K (standard deviation) in median temperature, which is variability that can be attributed to inherent uncertainty in the thermocouple measurement because there were no changes to the droplet population or to the positioning of the holder or thermocouples. Given the high reproducibility of results over three freezing cycles, MINCZ is ideally suited for investigating questions surrounding the stochasticity of nucleation in a single droplet, in contrast to continuous flow microfluidic devices that are well-suited for high-throughput analysis when detecting the presence of rare ice-nucleating particles. For comparison, Fig. 3 also shows the frozen fraction calculated based on the recommended parameterization for the homogeneous nucleation rate of water from Ickes et al. (2015) (see Appendix C for more details), which was obtained by fitting to a wide range of previously reported experimental data and is representative of the current state of the art. The frozen fractions observed using MINCZ are in general agreement with this parameterization. The accurate and reproducible results for the median freezing temperature of pure water droplets and the lack of an early freezing onset validate MINCZ as a reliable instrument that can be used to detect freezing due to the presence of ice-nucleating particles at any temperature above the onset of homogeneous ice nucleation. Early freezing onset can occur due to impurities present in the pure water sample that would appear, for example, as a gradual increase in frozen fraction at higher temperatures, as seen in the freezing behaviour of pure water in Peckhaus et al. (2016) and Brubaker et al. (2019). The ability of MINCZ to reach such low temperatures is achieved with very small droplet volumes (approx. 200 pL) and the absence of a solid substrate that may initiate the nucleation of ice at higher temperatures. Lastly, we confirmed that there is no spatial bias in freezing behaviour across the observed area, as summarized in Appendix B.
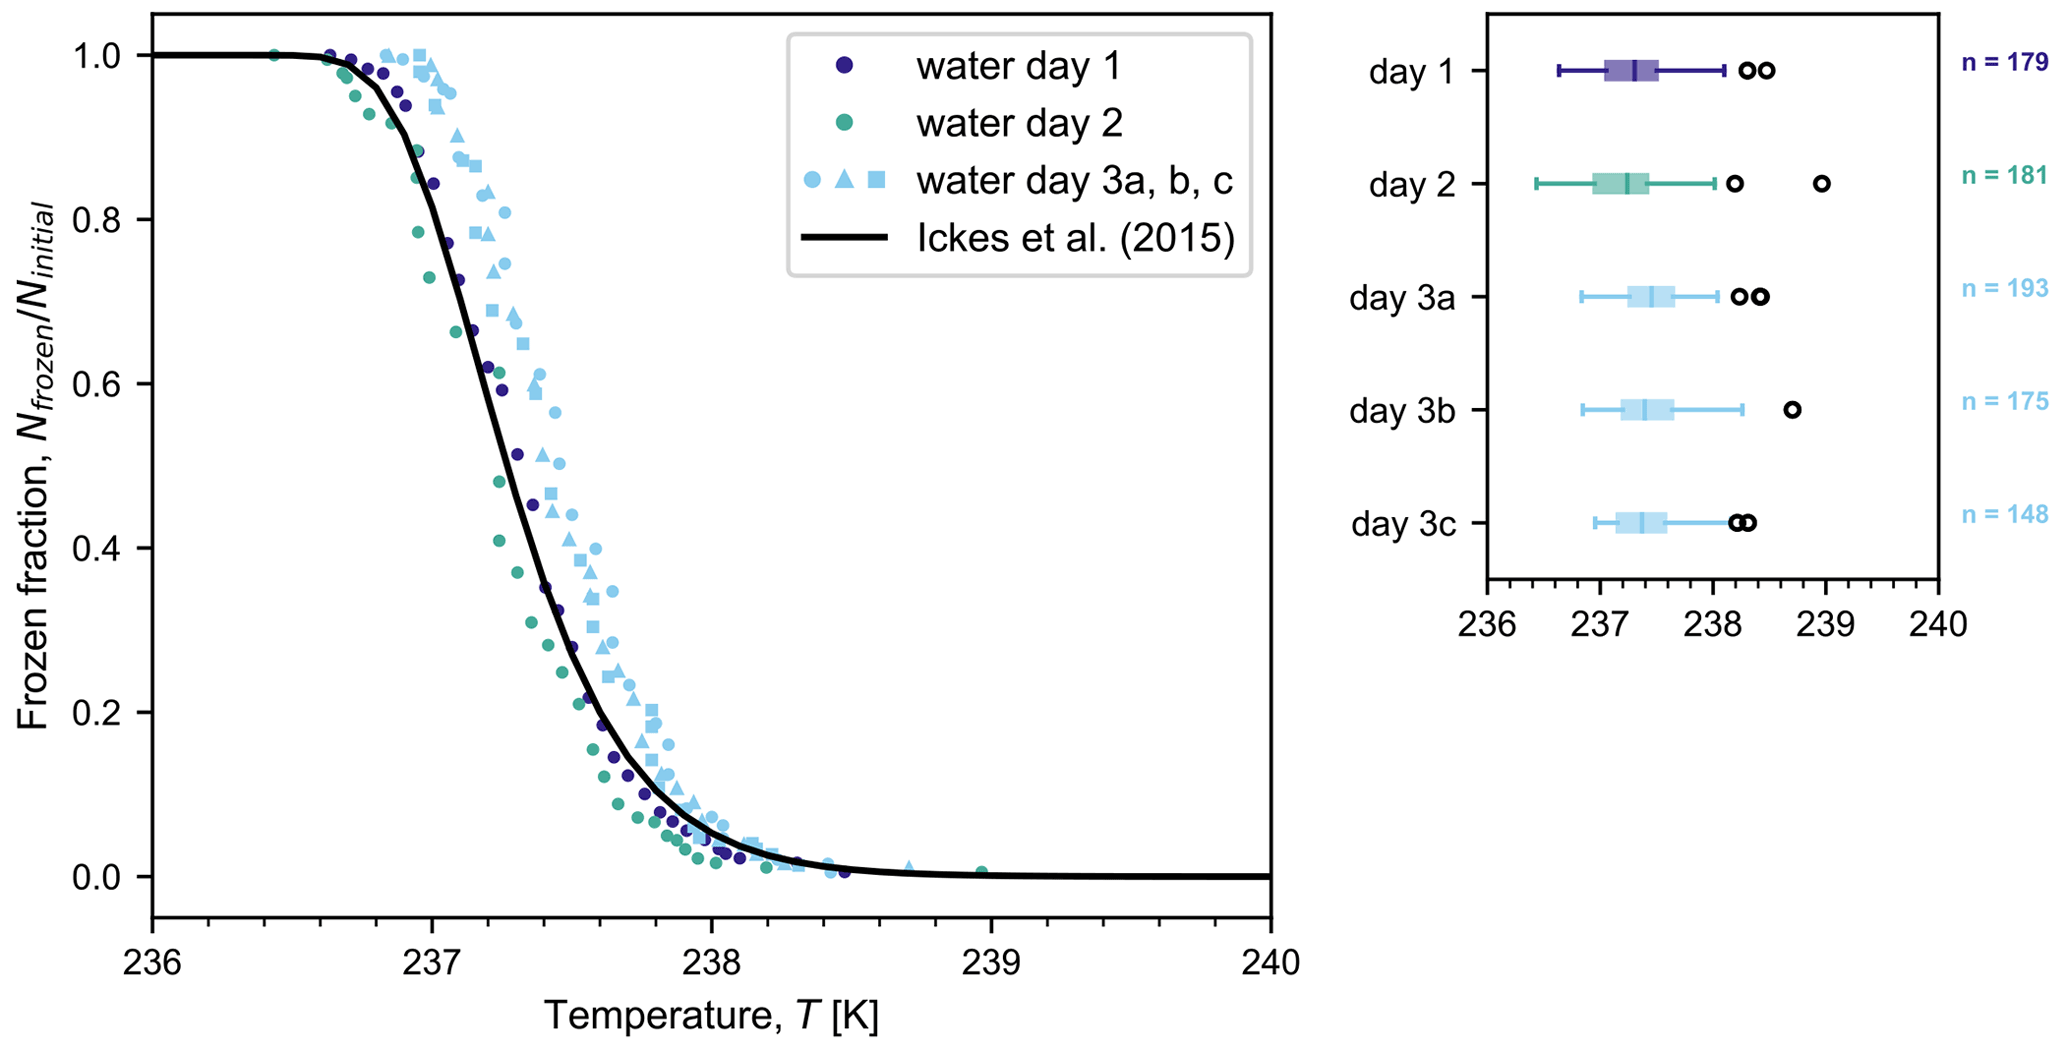
Figure 3Frozen fraction of pure water (Sigma-Aldrich) droplets (with diameters as indicated in Table 1) as a function of temperature for different droplet populations (with n number of droplets) cooled at a rate of 1 K min−1 on three separate days. The droplet population on day 3 was subjected to three freeze–thaw cycles (a, b, c). Also shown is the frozen fraction curve for the homogeneous freezing of water using the parameterization from Ickes et al. (2015) for droplets with a diameter of 75 µm. Box plots on the right-hand side summarize the experimental results. The centre line of each box plot indicates the median freezing temperature, the box spans the interquartile range (between the 25th and 75th percentiles), the whiskers extend to the maximum and minimum temperatures, and outliers are shown by open circles. The temperature accuracy of our measurements is estimated to be ±0.2 K.
Figure 4 shows the frozen fraction of droplets as a function of temperature for aqueous suspensions containing 0.05 wt % microcline, also cooled at a rate of 1 K min−1. Three independent droplet populations were generated and cooled, yielding a median freezing temperature of 244.6 K, with a spread of ±0.7 K (standard deviation). As in Fig. 3, one data point is plotted for every 0.05 K interval in temperature, showing the cumulative number of droplets frozen down to that temperature. In comparison to the results for pure water, droplets containing microcline particles froze at higher temperatures and over a wider range of temperatures. Additionally, the standard deviation of the median freezing temperature increased, showing a higher variability between runs. This widening of freezing temperature and increase in variability relative to that seen for homogeneous freezing can be explained by inherent variations in the quantity and activity of the mineral particles present in each droplet. As investigated by Knopf et al. (2020), variations in the surface area of the mineral in each droplet can be one source of variability in the frozen fraction. In Fig. 4, we also show results reported by Welti et al. (2019) using the same microcline sample, but studied using the Zurich Ice Nucleation Chamber (ZINC) with particles size-selected to a mobility diameter of 400 or 800 nm. Finally, in Fig. 4, we also include the frozen fraction of water droplets (∼750 droplets with volumes of 0.2 nL) containing 0.05 wt % microcline (sample FS02) printed onto a solid substrate and cooled at 1 K min−1 by Peckhaus et al. (2016). Both mineral samples were predominantly microcline (∼90 % K-feldspar and ∼10 % Na-feldspar in Welti et al., 2019; 80 % K-feldspar, 16 % Na/Ca-feldspar, and 4 % quartz in Peckhaus et al., 2016). Overall, the frozen fraction curves obtained from MINCZ and ZINC show ice nucleation activity of the microcline particles in a similar temperature regime, with freezing in MINCZ occurring at temperatures close to those of the 400 nm particles in ZINC; all of these frozen fraction curves are at lower temperatures compared to the data obtained by Peckhaus et al. (2016).
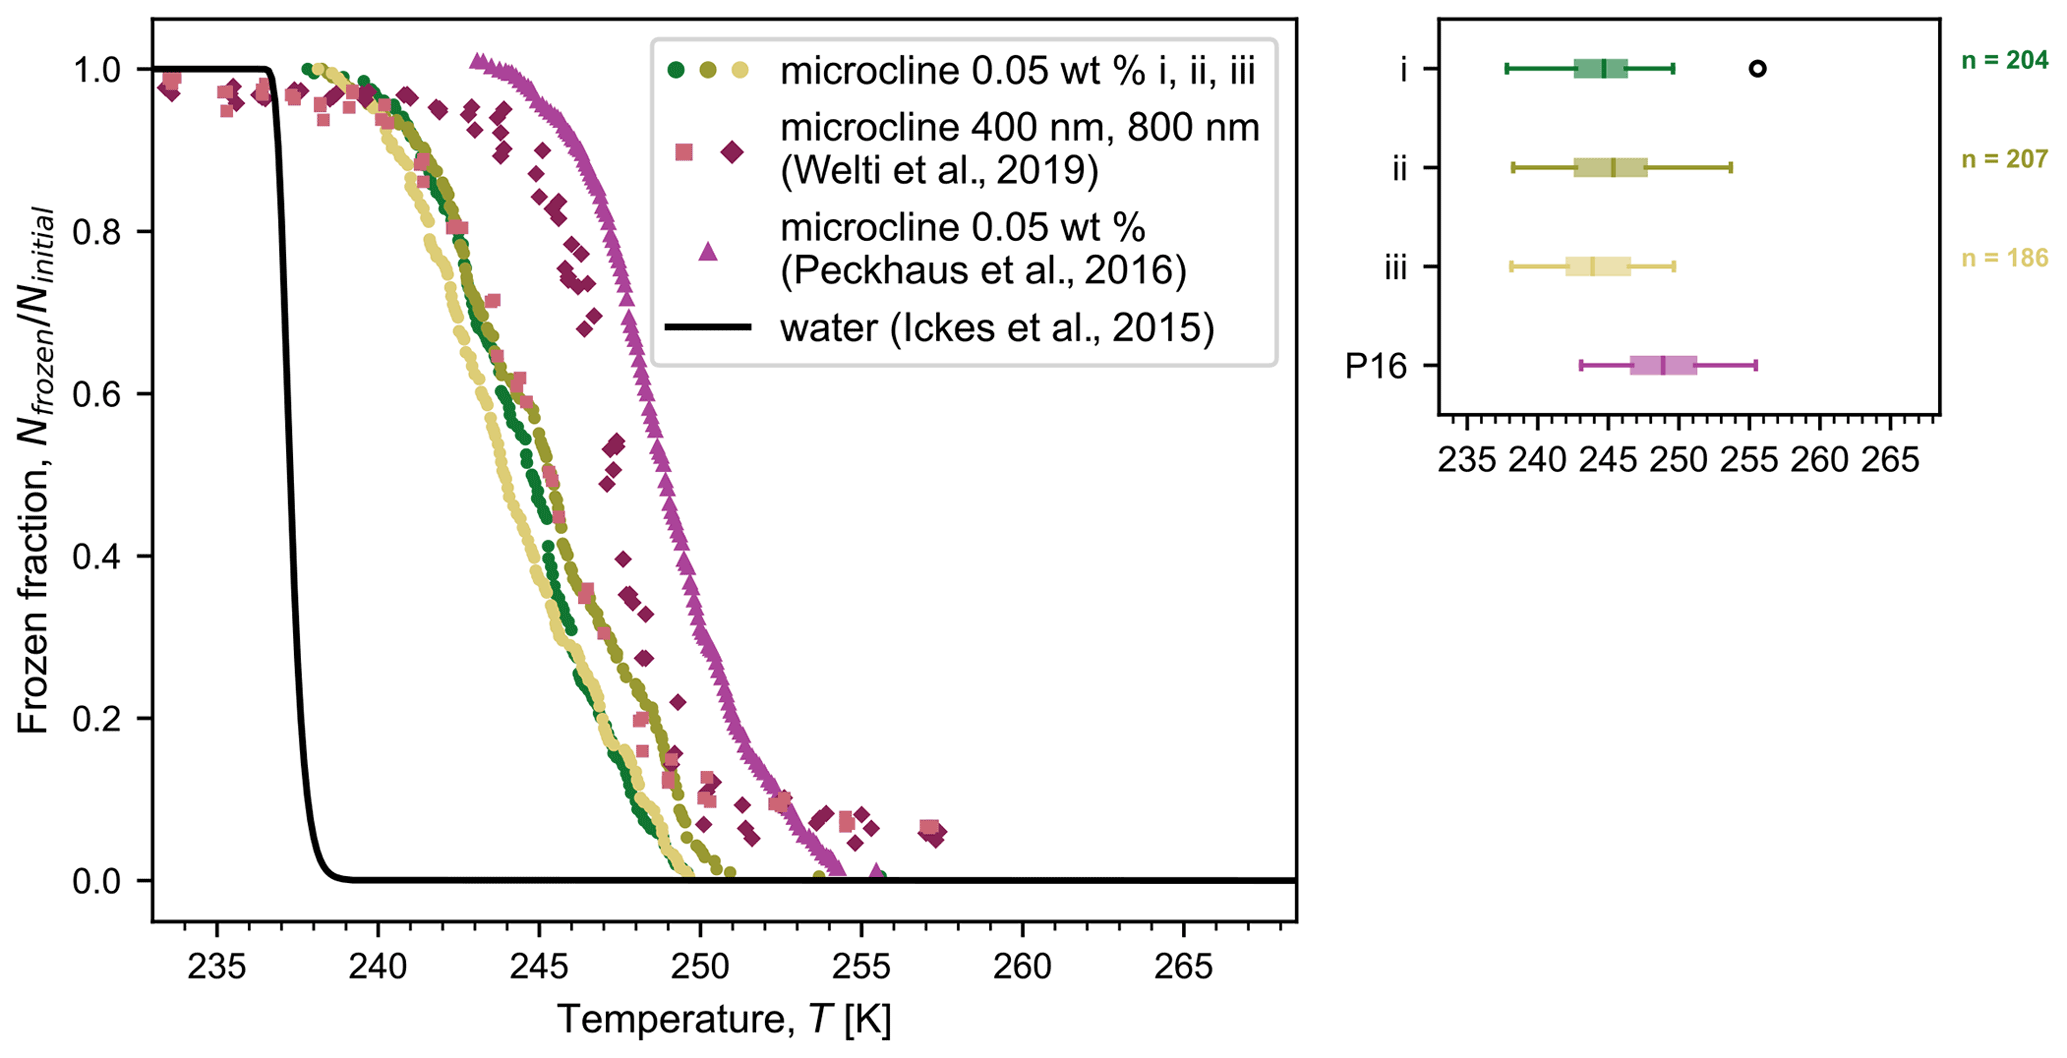
Figure 4Frozen fraction of microcline droplets (0.05 wt % in SA water with diameters as indicated in Table 2) as a function of temperature for three independent droplet populations (i, ii, and iii with n number of droplets) cooled at a rate of 1 K min−1. We show frozen fractions reported by (i) Welti et al. (2019) obtained with the same microcline sample but using the Zurich Ice Nucleation Chamber (ZINC) for single particles size-selected to a mobility diameter of 400 or 800 nm and (ii) Peckhaus et al. (2016) for a suspension of 0.05 wt % microcline (digitized; P16 in the box plot). We emphasize that the total particle surface area in each case must be considered when comparing frozen fractions. The frozen fraction calculated using the parameterization from Ickes et al. (2015) for pure water droplets with a diameter of 75 µm is also shown. On the right, a box plot compares the freezing temperatures of the three droplet populations; the centre line indicates the median freezing temperature, the box spans the interquartile range (between the 25th and 75th percentiles), the whiskers extend to the maximum and minimum temperatures, and outliers are shown by open circles. The temperature accuracy of our measurements is estimated to be ±0.2 K.
We note that the curves obtained using MINCZ depend on the concentration of microcline in suspension, since any change to the available surface area will shift the observed temperature of ice nucleation accordingly. For our concentration of 0.05 wt %, the expected surface area is on the order of 10−10 m2 (assuming a Brunauer–Emmett–Teller, BET, adsorption specific surface area between 1.9 m2 g−1 reported by Atkinson et al., 2013, and 3.2 m2 g−1 reported by Kumar et al., 2018). In contrast, single particles were investigated using ZINC with surface areas on the order of 10−13 to 10−12 m2 for 400 and 800 nm, respectively. Typically, median freezing temperatures increase as particle surface areas increase (e.g. as seen in Welti et al., 2019) because there is an increased probability that the surface contains a nucleation site that is active at higher temperatures. Since the surface area of microcline per droplet in MINCZ is at least 2 orders of magnitude larger than that of a single particle, it may be expected that the median freezing temperature of these droplets would be at a higher temperature than the median freezing temperature of droplets with a single particle in ZINC. However, we observe that the frozen fraction curves obtained with MINCZ are in agreement with the 400 nm particles analysed in ZINC but freeze at lower temperatures compared to the 800 nm particles analysed in ZINC. This could be explained by a mineralogical bias due to 450 nm filtration of the solution used in MINCZ that shifts freezing towards lower temperatures. That is, the larger particles may exhibit a higher density of active sites that induce freezing at higher temperatures because of a size-dependent mineralogical composition or morphology, and as a result, increasing the surface area by increasing only the number of sub-450 nm particles in the droplets would not increase the probability of nucleation. Alternatively, if there was in fact no mineralogical bias depending on particle size, the activity of the microcline could have instead decreased over its storage time as a dry sample over a period of 7 years from when it was previously analysed in ZINC.
Finally, we can compare the frozen fraction of microcline suspensions studied using MINCZ to that obtained by Peckhaus et al. (2016), wherein the same microcline concentration was investigated (0.05 wt %) in printed 0.2 nL droplets at the same cooling rate of 1 K min−1. The main difference between these two studies was in sample preparation: we sonicated and filtered the microcline suspension prior to cooling, but the sample was only suspended in solution after milling the stone sample in Peckhaus et al. (2016). Similar to the discrepancy in the frozen fractions between MINCZ and ZINC, it is again not possible to determine why the observed frozen fraction is at lower temperatures compared to the data in Peckhaus et al. (2016). Either there could have been a mineralogical bias due to 450 nm filtration, or the activity of the microcline sample studied herein could have been lower than the activity of the sample studied by Peckhaus et al. (2016). An inherent difference in ice nucleation activity of two microcline samples collected at different locations has also been observed by Kaufmann et al. (2016), who investigated the same sample from Elba as Welti et al. (2019) and a sample from Namibia. They found that the sample from Namibia exhibited higher ice nucleation activity than the one from Elba despite its lower microcline content.
We note that further interpretation of the frozen fraction and detailed theoretical analysis, such as calculation of particle surface area per droplet, may require considering the potential influence of droplet volume, as outlined in, for example, Vali et al. (2019).
The MINCZ platform employs a microfluidic device to generate monodisperse droplet populations of approximately 75 µm in diameter that are then cooled off-chip in PFA tubing immersed in ethanol. We presented the validation of this technique for the homogeneous freezing of pure water as well as heterogeneous freezing using microcline. Our obtained results in the temperature range of homogeneous freezing fit well within the expected temperature ranges reported previously. By immersing the tubing containing the droplets in a cooling bath, MINCZ cools the droplets from all directions instead of only from below, reducing the temperature gradient and therefore yielding a high temperature accuracy of 0.2 K. The lack of early-onset freezing events in our data obtained for homogeneous nucleation indicates that there are very few, if any, impurities in the water used in this work. Therefore, in future studies this characteristic allows the delineation between freezing due to the homogeneous pathway and freezing catalysed by INPs that are only active at relatively low temperatures. We showed that by storing droplets in gas-impermeable PFA tubing, multiple highly reproducible refreezing cycles can be performed. The semi-automated approach for freezing droplet detection allows for the study of statistically high numbers of droplets (in excess of 102) in parallel. Furthermore, the instrument is comprised of simple components (e.g. stereoscope, Peltier element, chiller, and CMOS camera), and it has a relatively small footprint in the lab. These attributes make MINCZ also suitable for transfer to other laboratories or field sites. Future work will focus on further automation of the operation of MINCZ to ensure continued reproducibility by limiting user-dependent influences.
Figure A1 shows secondary electron (SE) scanning electron microscopy (SEM) images of microcline suspensions that were (a) untreated, (b) sonicated with 8×30 s pulses in an ultrasonic VialTweeter, and (c) sonicated followed by filtration (0.45 µm polyethersulfone sterile syringe filter). Figure A2 shows images of microfluidic droplets with untreated microcline suspensions at two concentrations (0.1 wt % and 2 wt %), where the heterogeneity in microcline particle size is clearly visible. While sonication successfully broke apart the microcline particles, a significant portion of larger particles remained (Fig. A1b). After sonication and filtration, the remaining particles were more uniform in size (Fig. A1c).
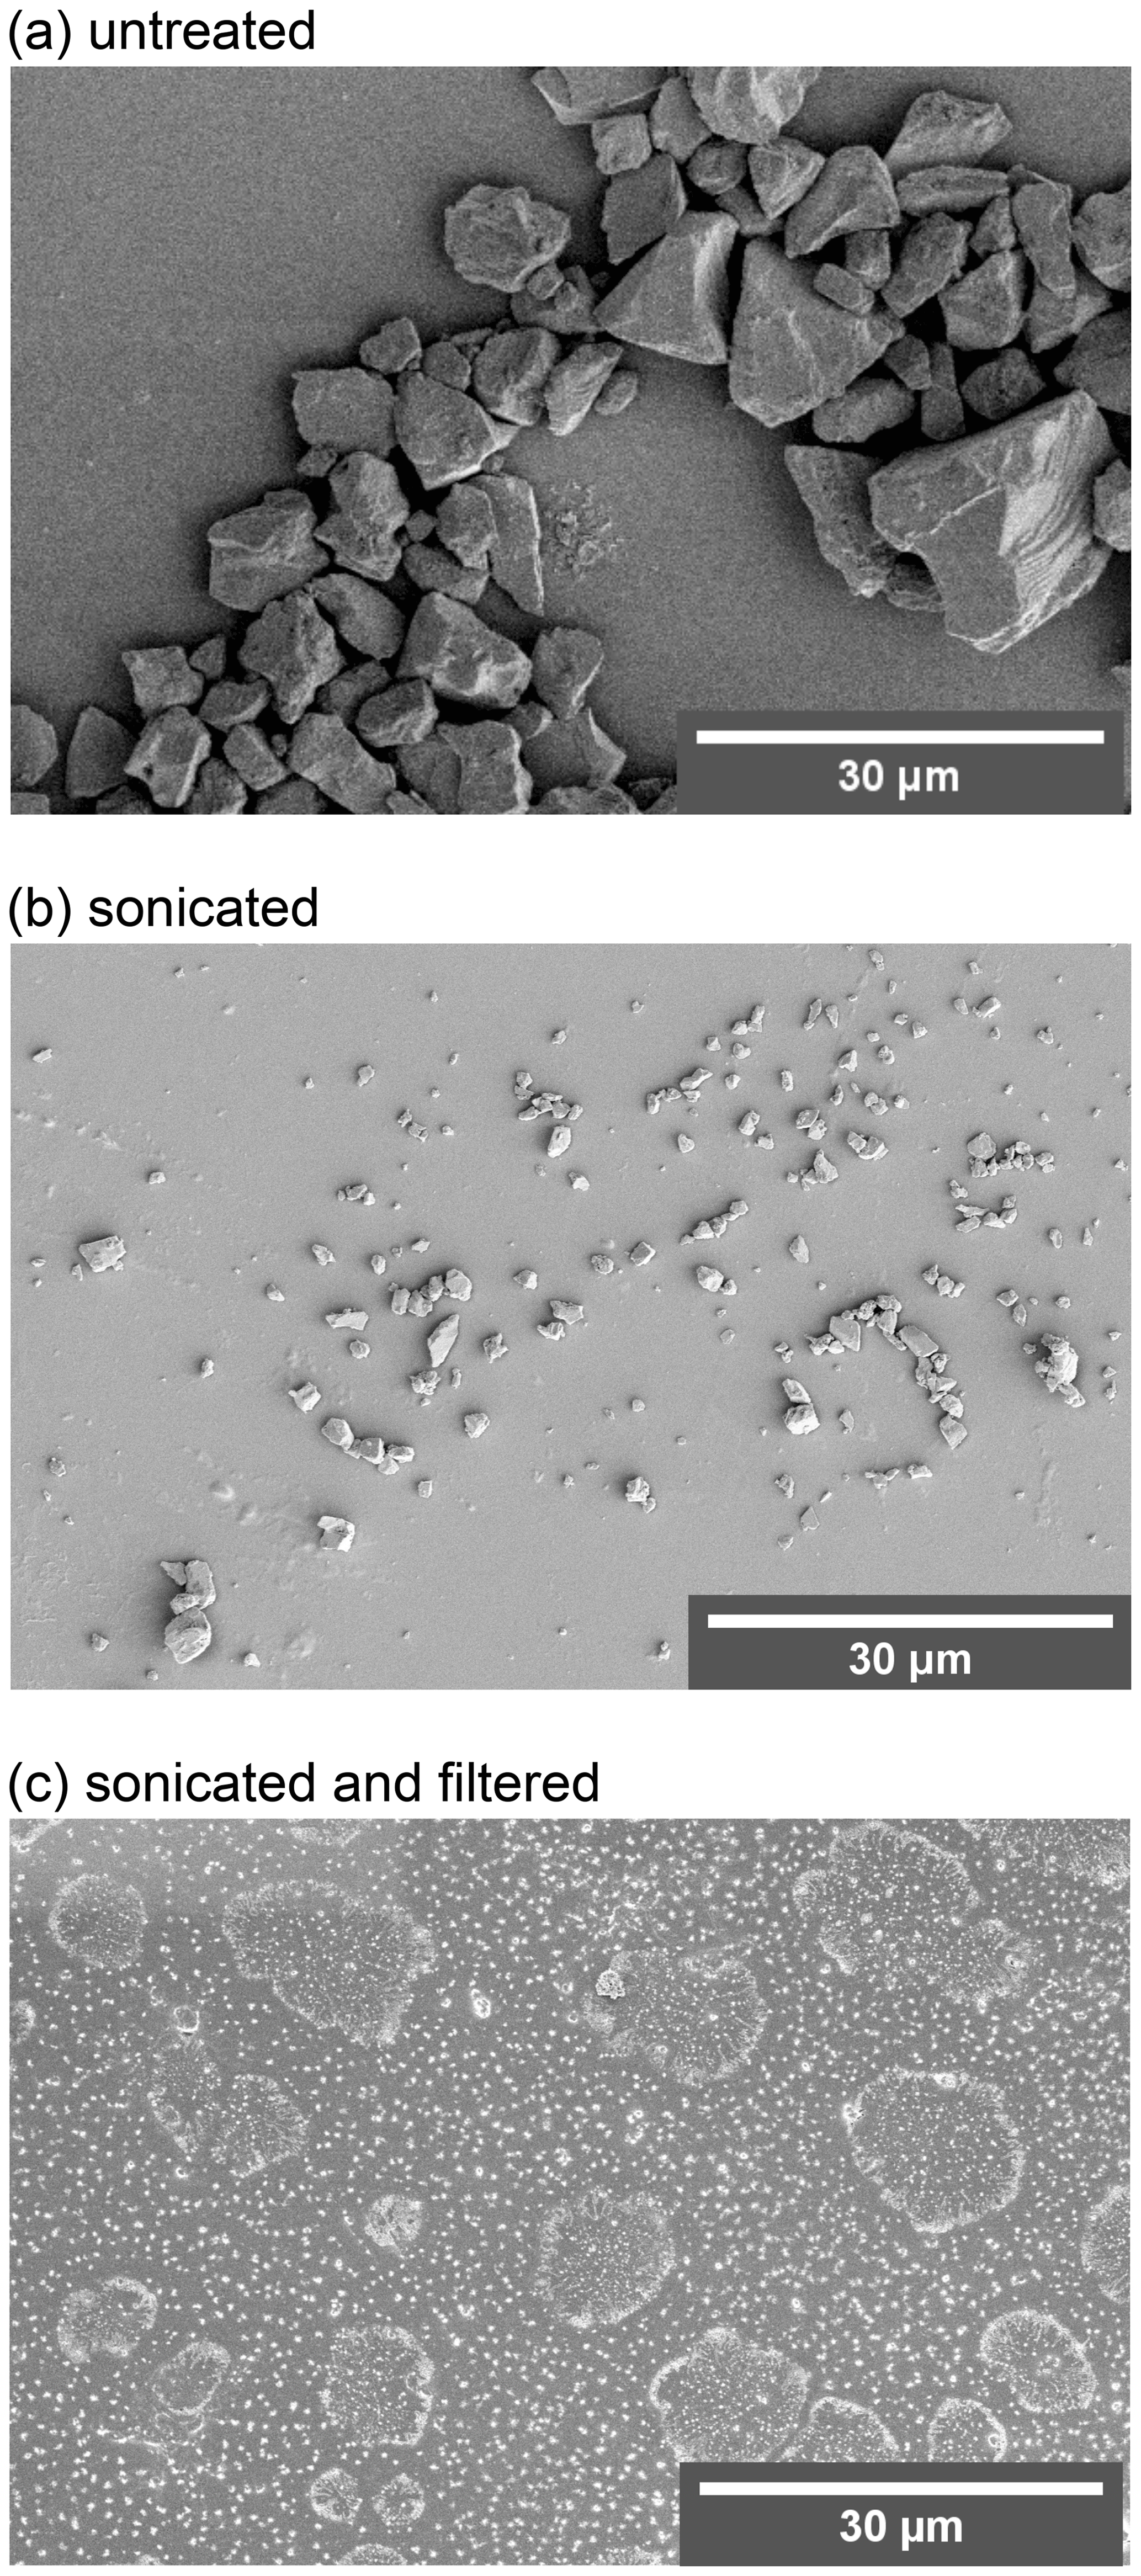
Figure A1Scanning electron microscopy images of microcline that was (a) untreated, (b) sonicated with 8×30 s pulses in an ultrasonic VialTweeter, and (c) sonicated using the same procedure as panel (b) but additionally filtered (0.45 µm syringe filter).
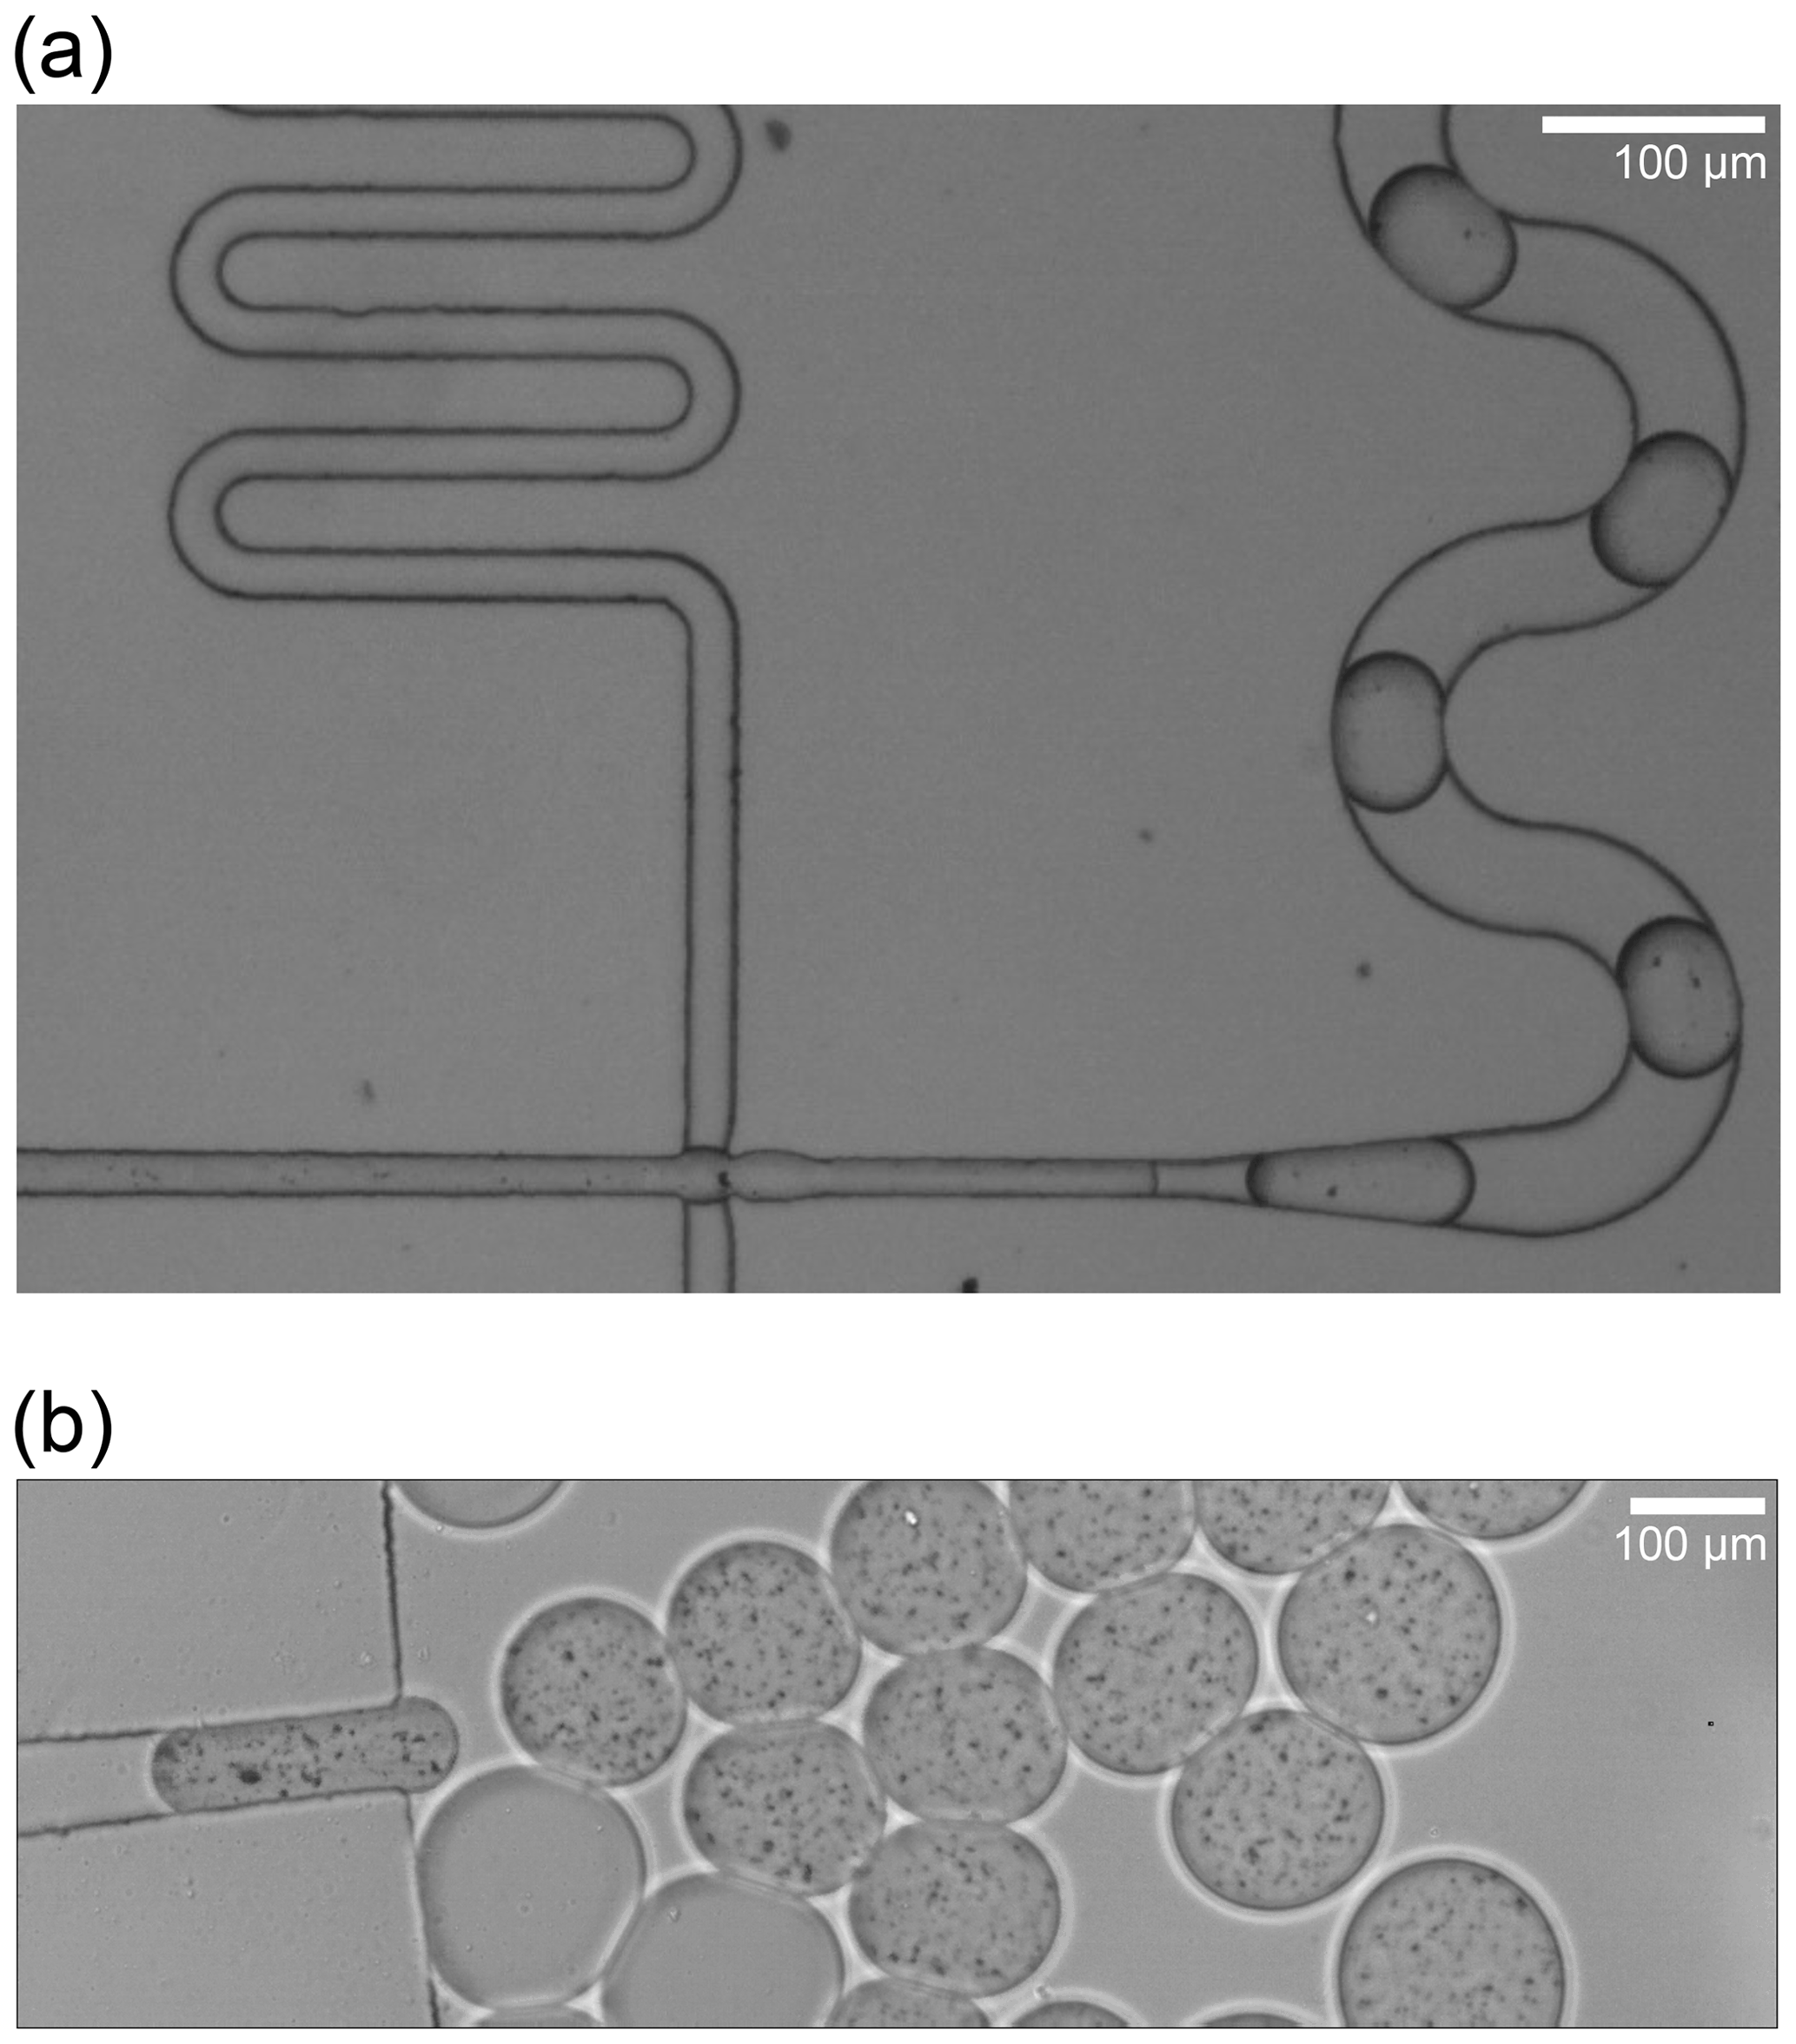
Figure A2Microfluidic droplets of aqueous suspensions containing (a) 0.1 wt % and (b) 2 wt % microcline that were neither sonicated nor filtered. Microcline particles in these droplets are clearly visible as black pixels in both images. The slight difference in droplet sizes can be attributed to partial clogging of the droplet-generating orifice due to the high concentration of large mineral particles in this particular experimental run.
Figures B1 and B2 summarize the spatial temperature distribution of freezing events in the first two columns; each symbol represents one droplet freezing at a specific temperature and x or y coordinate. Over all experiments (Fig. B1 for pure water and Fig. B2 for microcline suspensions), it is evident that there is no spatial bias in freezing behaviour. The third column of each figure shows the measured cooling rate over the course of each experiment, calculated based on the previous 60 s at each temperature for which an image was saved (i.e. ).
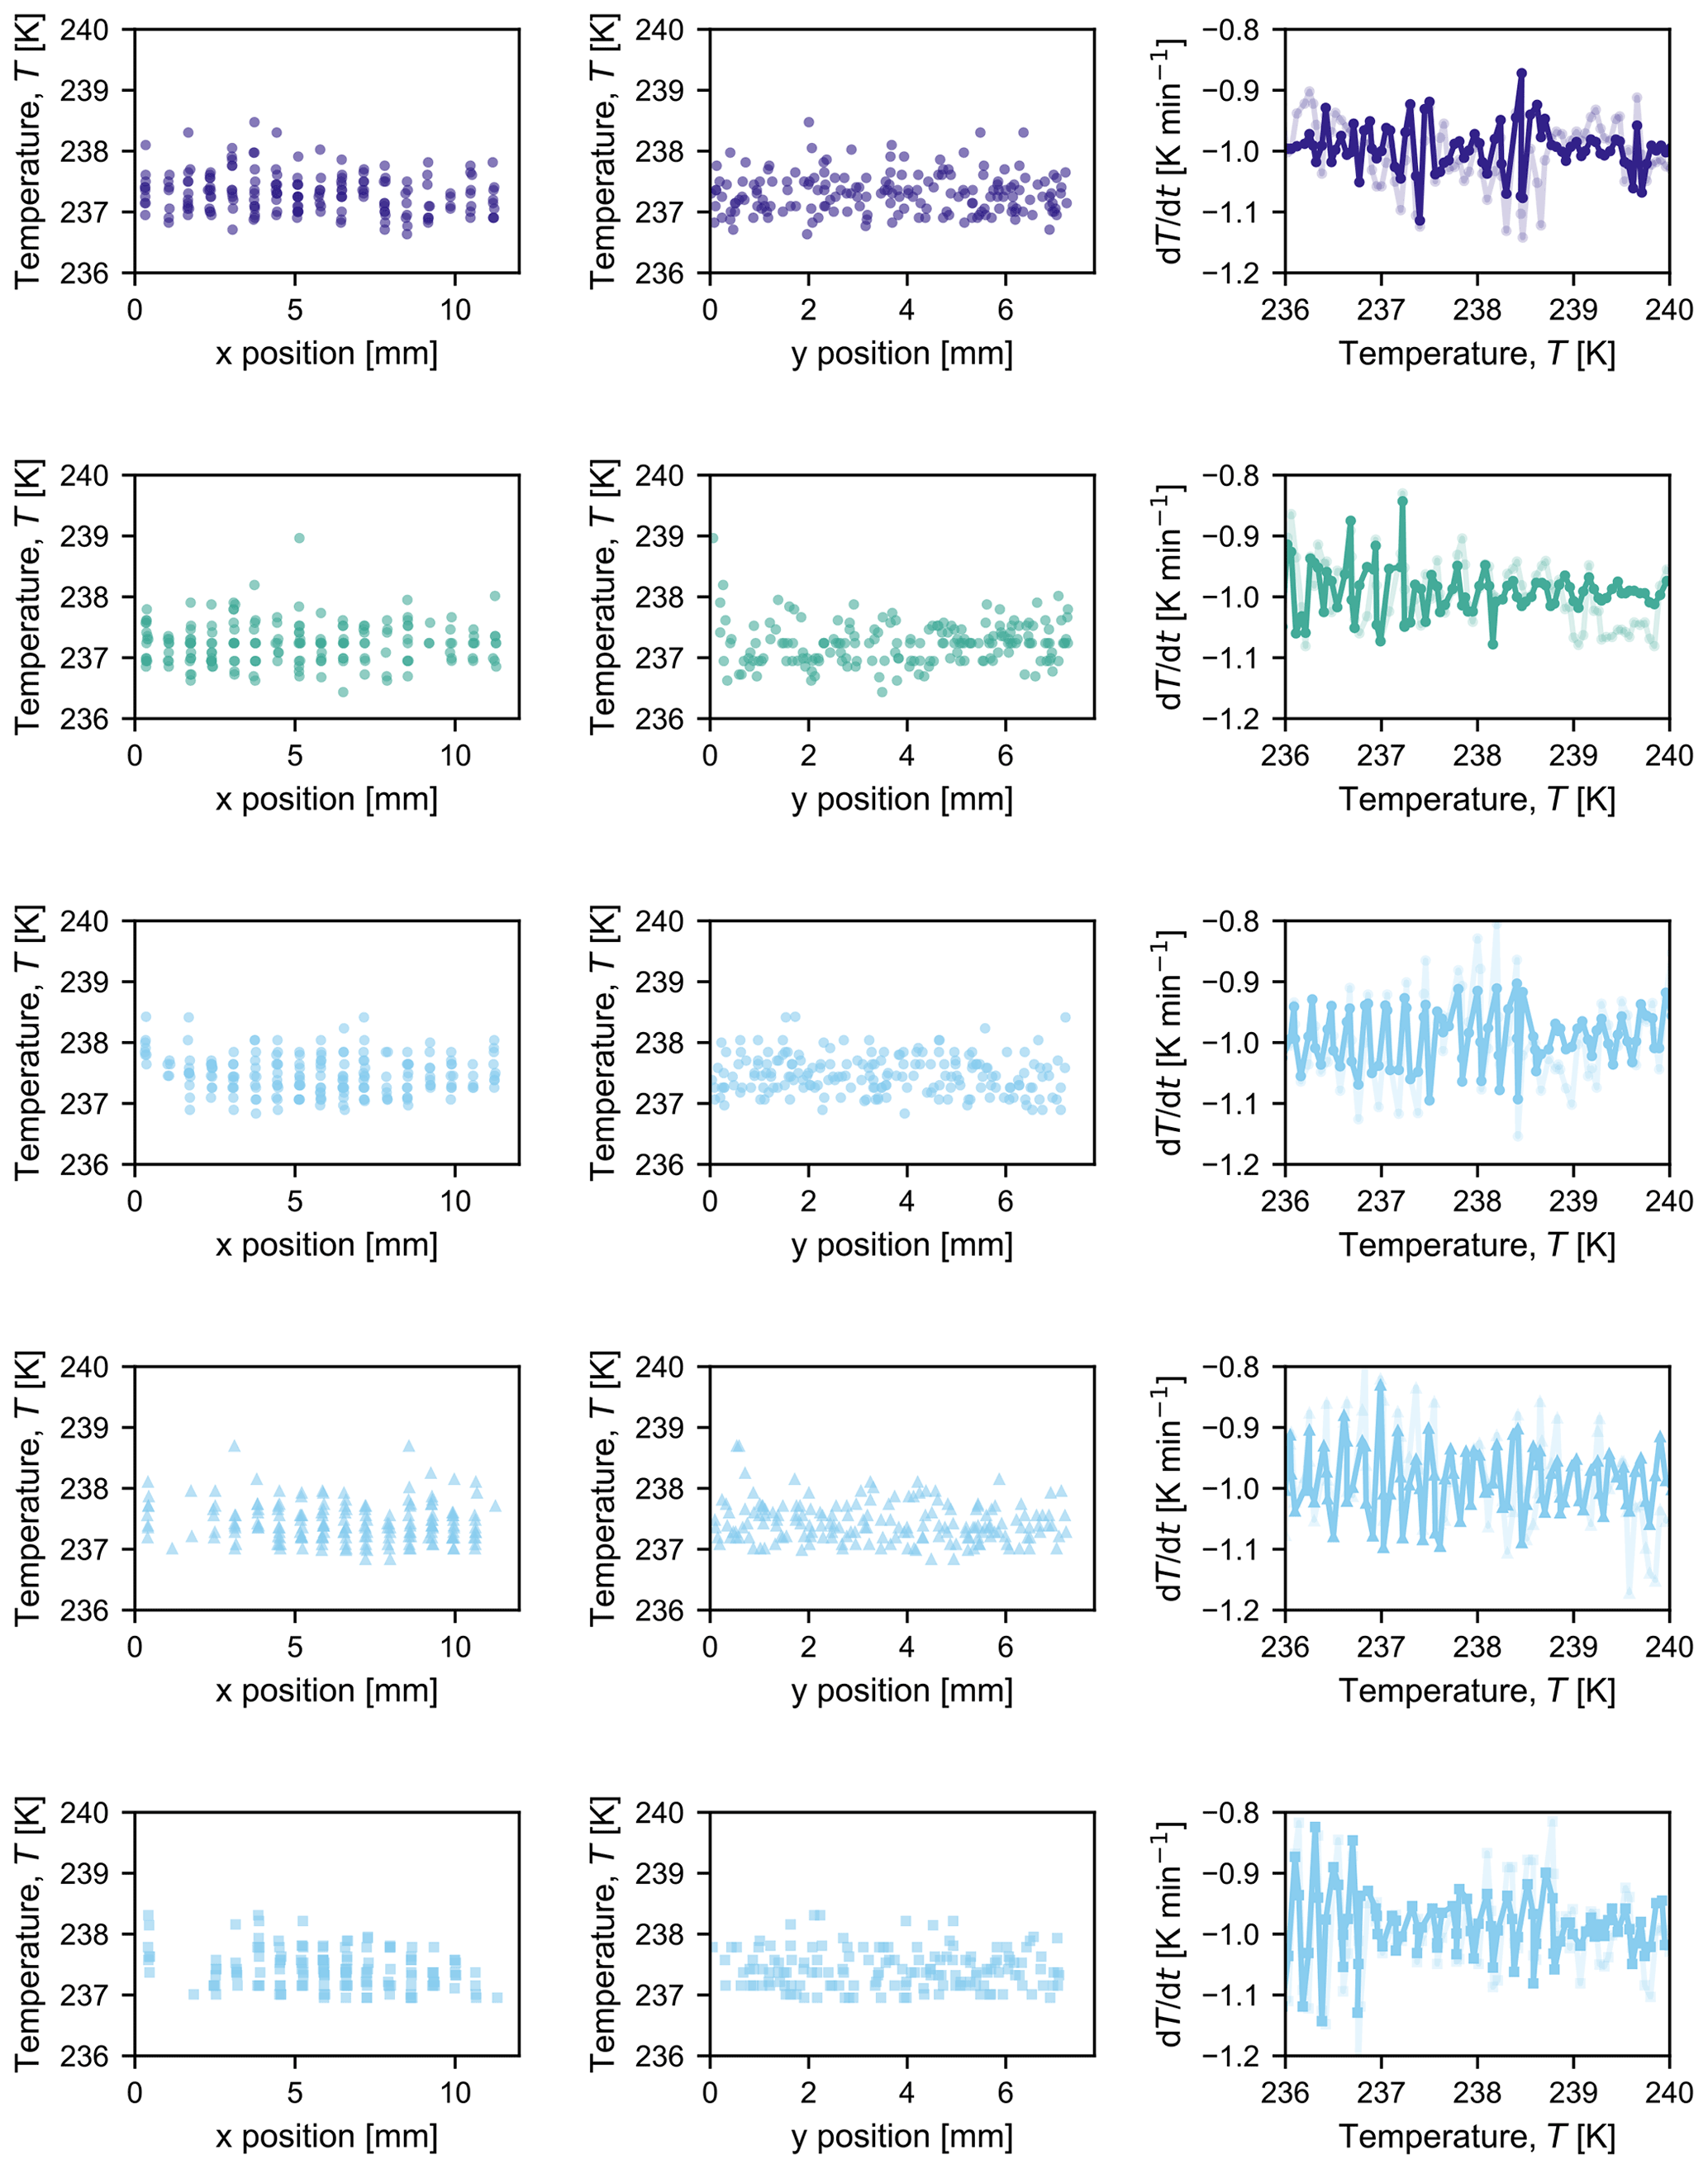
Figure B1Compilation of observed freezing temperatures at each x and y position to illustrate that there is no discernable spatial bias in freezing temperature for each experiment conducted with pure water in Fig. 3 (from top to bottom: water day 1, water day 2, and water day 3a, b, and c). The third graph in each row shows the measured cooling rate at each temperature at which a picture was taken; the opaque line indicates the cooling rate measured by the thermocouple that was used as input to the control loop, and the semi-opaque line indicates the cooling rate measured by the second thermocouple in the bath.
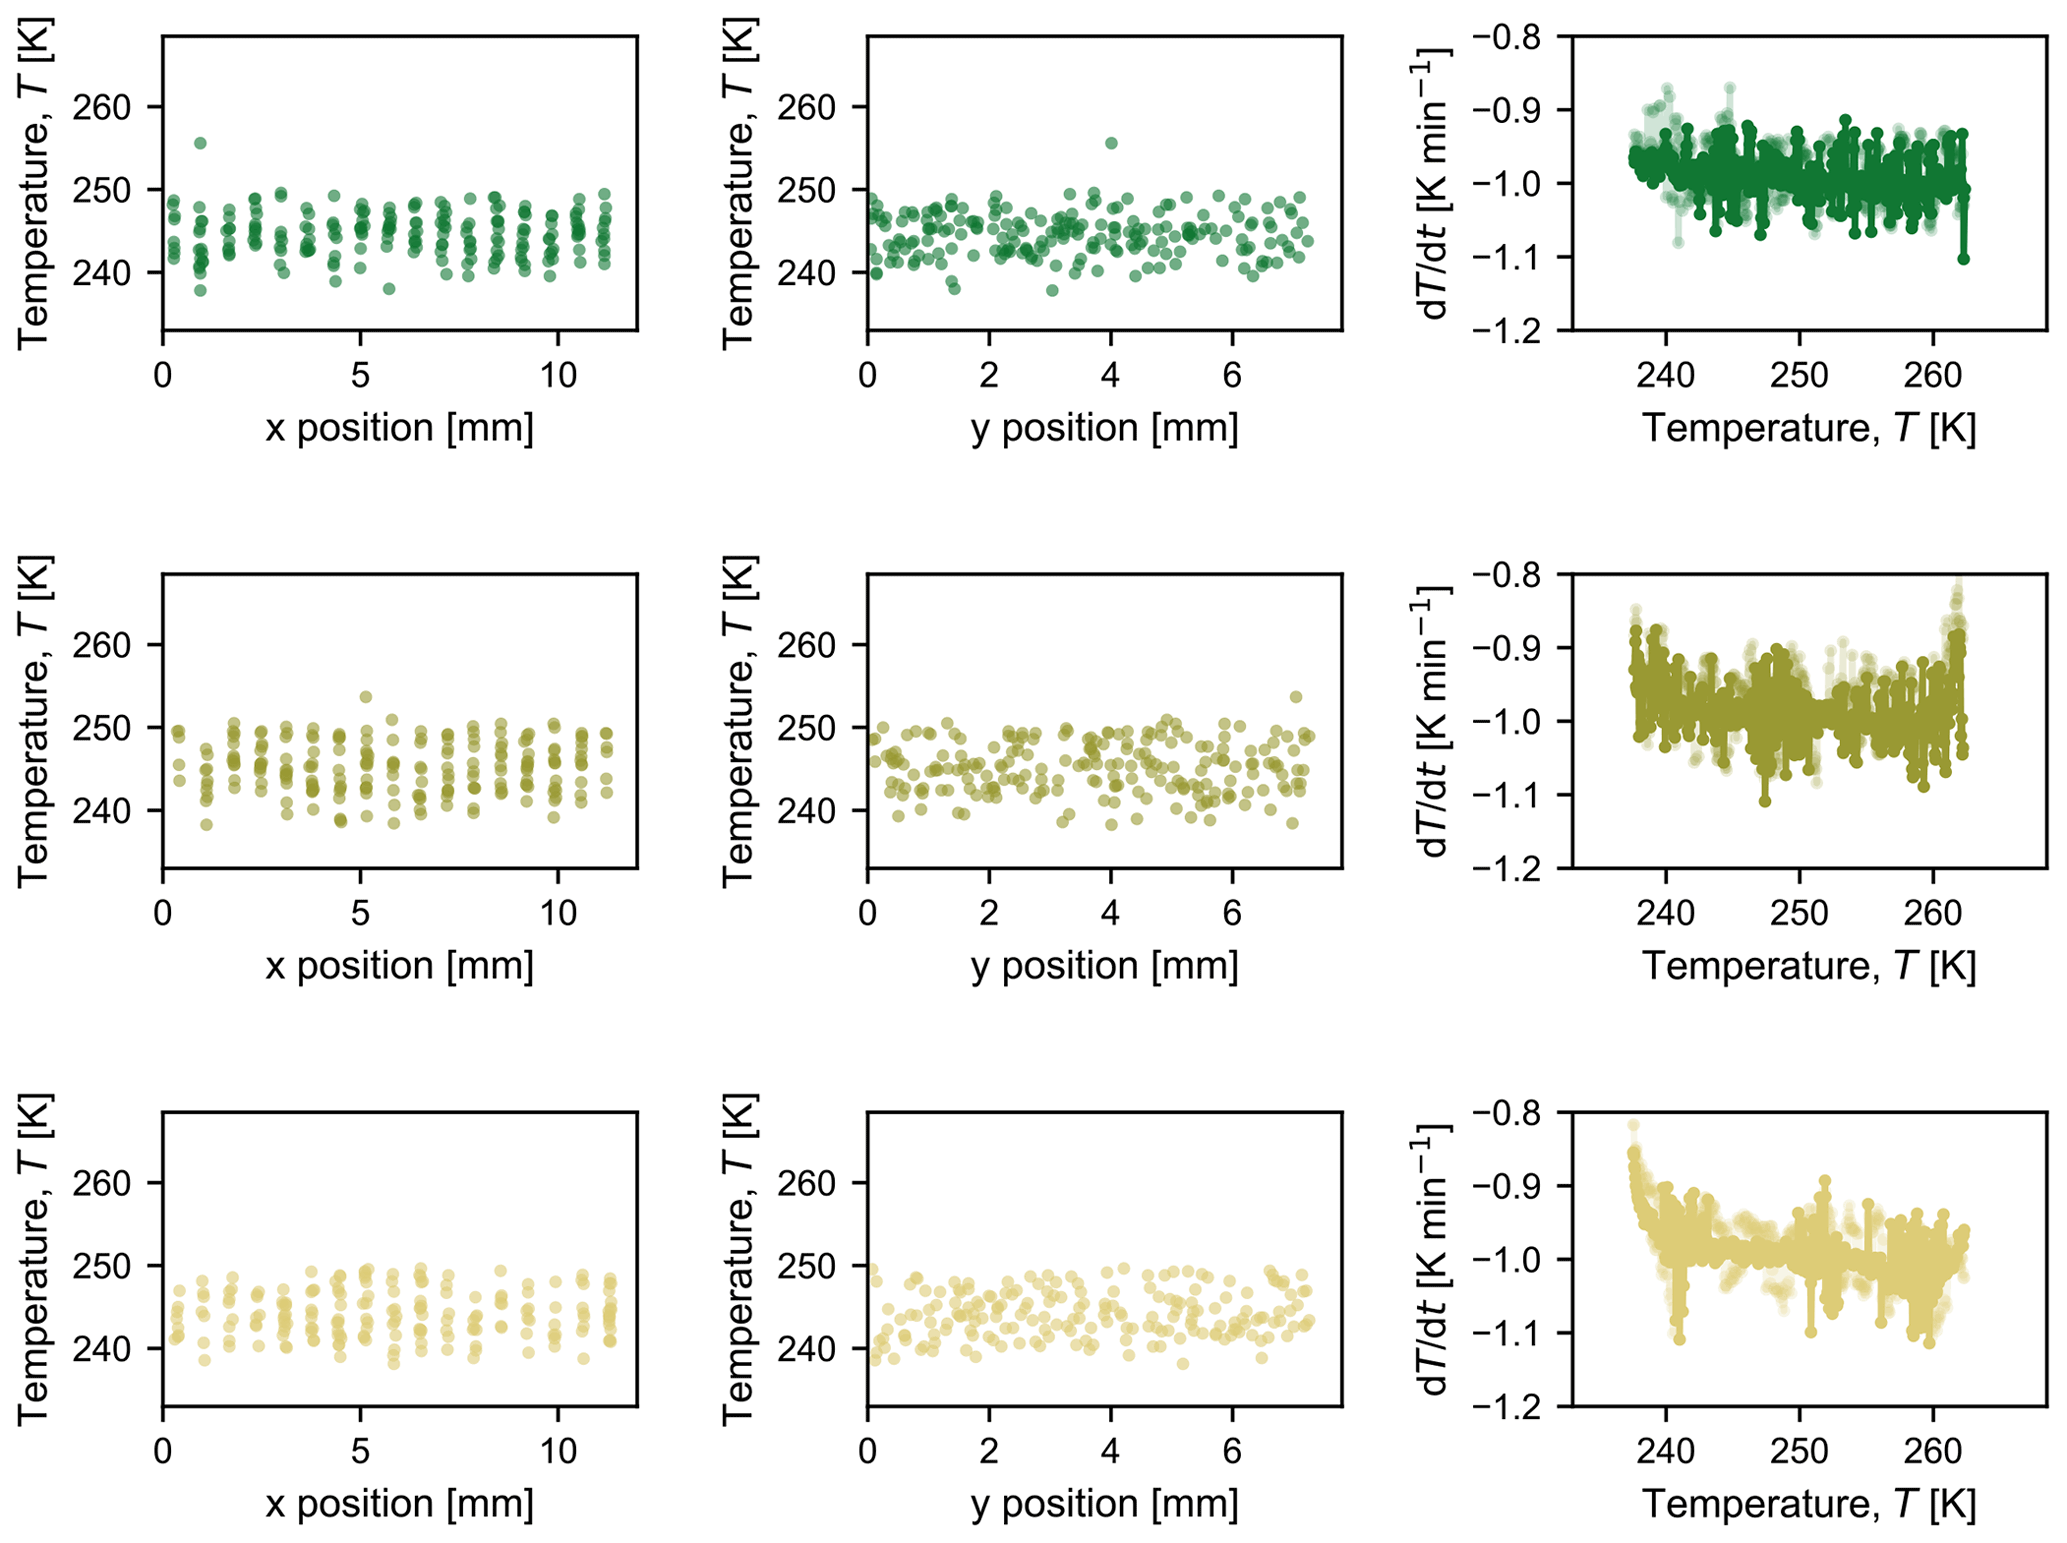
Figure B2Compilation of observed freezing temperatures at each x and y position to illustrate that there is no discernable spatial bias in freezing temperature for each experiment conducted with the microcline suspension shown in Fig. 4 (from top to bottom: i, ii, and iii). The third graph in each row shows the measured cooling rate at each temperature at which a picture was taken; the opaque line indicates the cooling rate measured by the thermocouple that was used as input to the control loop, and the semi-opaque line indicates the cooling rate measured by the second thermocouple in the bath.
Following the derivation in Pruppacher and Klett (2010, p. 211), the differential number of droplets that remains unfrozen in a differential time can be integrated to yield
where fun is the fraction of droplets that remains unfrozen (where Nun is the number of unfrozen droplets after time t, and N0 is the total number of unfrozen droplets at time t=0), Vd is the volume of a droplet, and Jhom is the homogeneous nucleation rate.
To evaluate our experiments, we count the frozen droplets at fixed time intervals, Δt. As we cool the droplets at a rate of 1 K min−1, we evaluate Eq. (C1) every 6 s to obtain a temperature resolution of 0.1 K. We account for the depletion of droplets using the following equation:
where fi,un is the fraction of droplets that remained unfrozen at Ti, is the unfrozen fraction of droplets at Ti−1, and Δt=6 s.
For comparison with our experiments, we use the homogeneous nucleation rate parameterization by Ickes et al. (2015):
where C=1035 cm−3 s−1, kB is the Boltzmann constant, T is temperature, and Δg# and ΔG are the diffusional activation energy and thermodynamic energy barrier, respectively, calculated as follows (Zobrist et al., 2007):
where the molecular volume of ice vice and the saturation ratio S (ratio between the equilibrium vapour pressure of supercooled liquid and that of ice) depend on temperature using the parameterizations outlined in Zobrist et al. (2007), while the solid–liquid interfacial tension σsl is calculated using the parameterization from Reinhardt and Doye (2013):
Plot data are compiled in the ETH Research Collection data repository at https://doi.org/10.3929/ethz-b-000545467 (Isenrich et al., 2022). Python scripts are available upon request.
FNI and NS are co-first authors of the paper and contributed equally to the instrument design, generation of data, data analysis, and writing of the original draft; as such, they may each list their name first in their CV. All authors contributed to project conceptualization, methodology, and writing (review and editing), and all authors have approved the final version of the paper.
At least one of the (co-)authors is a member of the editorial board of Atmospheric Measurement Techniques. The peer-review process was guided by an independent editor, and the authors also have no other competing interests to declare.
Publisher’s note: Copernicus Publications remains neutral with regard to jurisdictional claims in published maps and institutional affiliations.
We acknowledge work by Roland Walker, who machined and 3D-printed portions of the instrument, Fredy Mettler, who provided support for the Peltier element, and Benedikt Waser, who calculated the calibration equations for the thermocouples. We also appreciate technical advice from Cyril Brunner and Kunfeng Gao, as well as helpful discussions with Naama Reicher, Ulrich Krieger, and Thomas Peter.
Nadia Shardt acknowledges support from the ETH Zurich and the Natural Sciences and Engineering Research Council of Canada (NSERC).
This research has been supported by the Eidgenössische Technische Hochschule Zürich (ETH Postdoctoral Fellowship (grant no. 20-1 FEL-46)) and the Natural Sciences and Engineering Research Council of Canada (postdoctoral fellowship).
This paper was edited by Pierre Herckes and reviewed by Gabor Vali and one anonymous referee.
Assegehegn, G., Brito-de la Fuente, E., Franco, J. M., and Gallegos, C.: The importance of understanding the freezing step and its impact on freeze-drying process performance, J. Pharm. Sci., 108, 1378–1395, https://doi.org/10.1016/j.xphs.2018.11.039, 2019.
Atig, D., Touil, A., Ildefonso, M., Marlin, L., Bouriat, P., and Broseta, D.: A droplet-based millifluidic method for studying ice and gas hydrate nucleation, Chem. Eng. Sci., 192, 1189–1197, https://doi.org/10.1016/j.ces.2018.08.003, 2018.
Atkinson, J. D., Murray, B. J., Woodhouse, M. T., Whale, T. F., Baustian, K. J., Carslaw, K. S., Dobbie, S., O'Sullivan, D., and Malkin, T. L.: The importance of feldspar for ice nucleation by mineral dust in mixed-phase clouds, Nature, 498, 355–358, https://doi.org/10.1038/nature12278, 2013.
Brubaker, T., Polen, M., Cheng, P., Ekambaram, V., Somers, J., Anna, S. L., and Sullivan, R. C.: Development and characterization of a “store and create” microfluidic device to determine the heterogeneous freezing properties of ice nucleating particles, Aerosol Sci. Tech., 54, 79–93, https://doi.org/10.1080/02786826.2019.1679349, 2019.
David, R. O., Cascajo-Castresana, M., Brennan, K. P., Rösch, M., Els, N., Werz, J., Weichlinger, V., Boynton, L. S., Bogler, S., Borduas-Dedekind, N., Marcolli, C., and Kanji, Z. A.: Development of the DRoplet Ice Nuclei Counter Zurich (DRINCZ): validation and application to field-collected snow samples, Atmos. Meas. Tech., 12, 6865–6888, https://doi.org/10.5194/amt-12-6865-2019, 2019.
Deck, L. T., Ochsenbein, D. R., and Mazzotti, M.: Stochastic shelf-scale modeling framework for the freezing stage in freeze-drying processes, Int. J. Pharm., 613, 121276, https://doi.org/10.1016/j.ijpharm.2021.121276, 2022.
Diehl, K., Debertshäuser, M., Eppers, O., Schmithüsen, H., Mitra, S. K., and Borrmann, S.: Particle surface area dependence of mineral dust in immersion freezing mode: investigations with freely suspended drops in an acoustic levitator and a vertical wind tunnel, Atmos. Chem. Phys., 14, 12343–12355, https://doi.org/10.5194/acp-14-12343-2014, 2014.
Edd, J. F., Humphry, K. J., Irimia, D., Weitz, D. A., and Toner, M.: Nucleation and solidification in static arrays of monodisperse drops, Lab Chip, 9, 1859–1865, https://doi.org/10.1039/b821785h, 2009.
Garcia, E., Hill, T. C. J., Prenni, A. J., DeMott, P. J., Franc, G. D., and Kreidenweis, S. M.: Biogenic ice nuclei in boundary layer air over two U.S. high plains agricultural regions, J. Geophys. Res., 117, D18209, https://doi.org/10.1029/2012JD018343, 2012.
Harrison, A. D., Whale, T. F., Carpenter, M. A., Holden, M. A., Neve, L., O'Sullivan, D., Vergara Temprado, J., and Murray, B. J.: Not all feldspars are equal: a survey of ice nucleating properties across the feldspar group of minerals, Atmos. Chem. Phys., 16, 10927–10940, https://doi.org/10.5194/acp-16-10927-2016, 2016.
Heyries, K. A., Tropini, C., Vaninsberghe, M., Doolin, C., Petriv, O. I., Singhal, A., Leung, K., Hughesman, C. B., and Hansen, C. L.: Megapixel digital PCR, Nat. Methods, 8, 649–651, https://doi.org/10.1038/nmeth.1640, 2011.
Ickes, L., Welti, A., Hoose, C., and Lohmann, U.: Classical nucleation theory of homogeneous freezing of water: Thermodynamic and kinetic parameters, Phys. Chem. Chem. Phys., 17, 5514–5537, https://doi.org/10.1039/c4cp04184d, 2015.
Isenrich, F., Shardt, N., Nette, J., Stavrakis, S., Marcolli, C., Kanji, Z. A., deMello, A. J., and Lohmann, L.: The Microfluidic Ice Nuclei Counter Zurich (MINCZ): A platform for homogeneous and heterogeneous ice nucleation, ETH Zurich [data set], https://doi.org/10.3929/ethz-b-000545467, 2022.
Kanji, Z. A., Ladino, L. A., Wex, H., Boose, Y., Burkert-Kohn, M., Cziczo, D. J., and Krämer, M.: Overview of ice nucleating particles, Meteor. Mon., 58, 1.1–1.33, https://doi.org/10.1175/AMSMONOGRAPHS-D-16-0006.1, 2017.
Kaufmann, L., Marcolli, C., Hofer, J., Pinti, V., Hoyle, C. R., and Peter, T.: Ice nucleation efficiency of natural dust samples in the immersion mode, Atmos. Chem. Phys., 16, 11177–11206, https://doi.org/10.5194/acp-16-11177-2016, 2016.
Kaufmann, L., Marcolli, C., Luo, B., and Peter, T.: Refreeze experiments with water droplets containing different types of ice nuclei interpreted by classical nucleation theory, Atmos. Chem. Phys., 17, 3525–3552, https://doi.org/10.5194/acp-17-3525-2017, 2017.
Klumpp, K., Marcolli, C., and Peter, T.: The impact of (bio-)organic substances on the ice nucleation activity of the K-feldspar microcline in aqueous solutions, Atmos. Chem. Phys., 22, 3655–3673, https://doi.org/10.5194/acp-22-3655-2022, 2022.
Knopf, D. A., Alpert, P. A., Zipori, A., Reicher, N., and Rudich, Y.: Stochastic nucleation processes and substrate abundance explain time-dependent freezing in supercooled droplets, npj Climate and Atmospheric Science, 3, 1–9, https://doi.org/10.1038/s41612-020-0106-4, 2020.
Koop, T., Luo, B., Tsias, A., and Peter, T.: Water activity as the determinant for homogeneous ice nucleation in aqueous solutions, Nature, 406, 611–614, 2000.
Krämer, B., Schwell, M., Hübner, O., Vortisch, H., Leisner, T., Rühl, E., Baumgärtel, H., and Wöste, L.: Homogeneous ice nucleation observed in single levitated micro droplets, Berichte der Bunsengesellschaft, 100, 1911–1914, https://doi.org/10.1002/bbpc.19961001120, 1996.
Kreidenweis, S. M., Petters, M., and Lohmann, U.: 100 Years of Progress in Cloud Physics, Aerosols, and Aerosol Chemistry Research, Meteor. Mon., 59, 11.1–11.72, https://doi.org/10.1175/AMSMONOGRAPHS-D-18-0024.1, 2018.
Kumar, A., Marcolli, C., Luo, B., and Peter, T.: Ice nucleation activity of silicates and aluminosilicates in pure water and aqueous solutions – Part 1: The K-feldspar microcline, Atmos. Chem. Phys., 18, 7057–7079, https://doi.org/10.5194/acp-18-7057-2018, 2018.
Kunert, A. T., Lamneck, M., Helleis, F., Pöschl, U., Pöhlker, M. L., and Fröhlich-Nowoisky, J.: Twin-plate Ice Nucleation Assay (TINA) with infrared detection for high-throughput droplet freezing experiments with biological ice nuclei in laboratory and field samples, Atmos. Meas. Tech., 11, 6327–6337, https://doi.org/10.5194/amt-11-6327-2018, 2018.
Lohmann, U.: Anthropogenic aerosol influences on mixed-phase clouds, Current Climate Change Reports, 3, 32–44, https://doi.org/10.1007/s40641-017-0059-9, 2017.
Lohmann, U. and Feichter, J.: Global indirect aerosol effects: a review, Atmos. Chem. Phys., 5, 715–737, https://doi.org/10.5194/acp-5-715-2005, 2005.
Marquez-Curtis, L. A., Bokenfohr, R., McGann, L. E., and Elliott, J. A. W.: Cryopreservation of human cerebral microvascular endothelial cells and astrocytes in suspension and monolayers, PLoS ONE, 16, e0249814, https://doi.org/10.1371/journal.pone.0249814, 2021.
Matus, A. V. and L'Ecuyer, T. S.: The role of cloud phase in Earth's radiation budget, J. Geophys. Res.-Atmos., 122, 2559–2578, https://doi.org/10.1002/2016JD025951, 2017.
Miller, A. J., Brennan, K. P., Mignani, C., Wieder, J., David, R. O., and Borduas-Dedekind, N.: Development of the drop Freezing Ice Nuclei Counter (FINC), intercomparison of droplet freezing techniques, and use of soluble lignin as an atmospheric ice nucleation standard, Atmos. Meas. Tech., 14, 3131–3151, https://doi.org/10.5194/amt-14-3131-2021, 2021.
Murray, B. J., Carslaw, K. S., and Field, P. R.: Opinion: Cloud-phase climate feedback and the importance of ice-nucleating particles, Atmos. Chem. Phys., 21, 665–679, https://doi.org/10.5194/acp-21-665-2021, 2021.
Peckhaus, A., Kiselev, A., Hiron, T., Ebert, M., and Leisner, T.: A comparative study of K-rich and Na/Ca-rich feldspar ice-nucleating particles in a nanoliter droplet freezing assay, Atmos. Chem. Phys., 16, 11477–11496, https://doi.org/10.5194/acp-16-11477-2016, 2016.
Pegg, D. E.: Principles of cryopreservation, in: Cryopreservation and Freeze-Drying Protocols, Springer, New York, NY, 3–19, https://doi.org/10.1007/978-1-4939-2193-5_1, 2015.
Polen, M., Brubaker, T., Somers, J., and Sullivan, R. C.: Cleaning up our water: reducing interferences from nonhomogeneous freezing of “pure” water in droplet freezing assays of ice-nucleating particles, Atmos. Meas. Tech., 11, 5315–5334, https://doi.org/10.5194/amt-11-5315-2018, 2018.
Pruppacher, H. R. and Klett, J. D.: Microphysics of Clouds and Precipitation, Springer, Dordrecht, https://doi.org/10.1007/978-0-306-48100-0, 2010.
Reicher, N., Segev, L., and Rudich, Y.: The WeIzmann Supercooled Droplets Observation on a Microarray (WISDOM) and application for ambient dust, Atmos. Meas. Tech., 11, 233–248, https://doi.org/10.5194/amt-11-233-2018, 2018.
Reinhardt, A. and Doye, J. P. K.: Note: Homogeneous TIP4P/2005 ice nucleation at low supercooling, J. Chem. Phys., 139, 096102, https://doi.org/10.1063/1.4819898, 2013.
Riechers, B., Wittbracht, F., Hütten, A., and Koop, T.: The homogeneous ice nucleation rate of water droplets produced in a microfluidic device and the role of temperature uncertainty, Phys. Chem. Chem. Phys., 15, 5873–5887, https://doi.org/10.1039/c3cp42437e, 2013.
Rogers, D. C.: Development of a continuous flow thermal gradient diffusion chamber for ice nucleation studies, Atmos. Res., 22, 149–181, 1988.
Roy, P., House, M. L., and Dutcher, C. S.: A microfluidic device for automated high throughput detection of ice nucleation of Snomax®, Micromachines, 12, 296, https://doi.org/10.3390/mi12030296, 2021a.
Roy, P., Mael, L. E., Hill, T. C. J., Mehndiratta, L., Peiker, G., House, M. L., Demott, P. J., Grassian, V. H., and Dutcher, C. S.: Ice nucleating activity and residual particle morphology of bulk seawater and sea surface microlayer, ACS Earth Space Chem., 5, 1916–1928, https://doi.org/10.1021/acsearthspacechem.1c00175, 2021b.
Schneider, C. A., Rasband, W. S., and Eliceiri, K. W.: NIH Image to ImageJ: 25 years of image analysis, Nat. Methods, 9, 671–675, https://doi.org/10.1038/nmeth.2089, 2012.
Schneider, J., Höhler, K., Heikkilä, P., Keskinen, J., Bertozzi, B., Bogert, P., Schorr, T., Umo, N. S., Vogel, F., Brasseur, Z., Wu, Y., Hakala, S., Duplissy, J., Moisseev, D., Kulmala, M., Adams, M. P., Murray, B. J., Korhonen, K., Hao, L., Thomson, E. S., Castarède, D., Leisner, T., Petäjä, T., and Möhler, O.: The seasonal cycle of ice-nucleating particles linked to the abundance of biogenic aerosol in boreal forests, Atmos. Chem. Phys., 21, 3899–3918, https://doi.org/10.5194/acp-21-3899-2021, 2021.
Stan, C. A., Schneider, G. F., Shevkoplyas, S. S., Hashimoto, M., Ibanescu, M., Wiley, B. J., and Whitesides, G. M.: A microfluidic apparatus for the study of ice nucleation in supercooled water drops, Lab Chip, 9, 2293–2305, https://doi.org/10.1039/b906198c, 2009.
Stetzer, O., Baschek, B., Lüönd, F., and Lohmann, U.: The Zurich Ice Nucleation Chamber (ZINC) – A new instrument to investigate atmospheric ice formation, Aerosol Sci. Tech., 42, 64–74, https://doi.org/10.1080/02786820701787944, 2008.
Tarn, M. D., Sikora, S. N. F., Porter, G. C. E., Wyld, B. V., Alayof, M., Reicher, N., Harrison, A. D., Rudich, Y., Shim, J. U., and Murray, B. J.: On-chip analysis of atmospheric ice-nucleating particles in continuous flow, Lab Chip, 20, 2889–2910, https://doi.org/10.1039/d0lc00251h, 2020.
Tarn, M. D., Sikora, S. N. F., Porter, G. C. E., Shim, J., and Murray, B. J.: Homogeneous freezing of water using microfluidics, Micromachines, 12, 223, https://doi.org/10.3390/mi12020223, 2021.
Vali, G.: Revisiting the differential freezing nucleus spectra derived from drop-freezing experiments: methods of calculation, applications, and confidence limits, Atmos. Meas. Tech., 12, 1219–1231, https://doi.org/10.5194/amt-12-1219-2019, 2019.
Welti, A., Lohmann, U., and Kanji, Z. A.: Ice nucleation properties of K-feldspar polymorphs and plagioclase feldspars, Atmos. Chem. Phys., 19, 10901–10918, https://doi.org/10.5194/acp-19-10901-2019, 2019.
Wright, T. P. and Petters, M. D.: The role of time in heterogeneous freezing nucleation, J. Geophys. Res.-Atmos., 118, 3731–3743, https://doi.org/10.1002/jgrd.50365, 2013.
Zobrist, B., Koop, T., Luo, B. P., Marcolli, C., and Peter, T.: Heterogeneous ice nucleation rate coefficient of water droplets coated by a nonadecanol monolayer, J. Phys. Chem. C, 111, 2149–2155, https://doi.org/10.1021/jp066080w, 2007.
Zobrist, B., Marcolli, C., Peter, T., and Koop, T.: Heterogeneous ice nucleation in aqueous solutions: The role of water activity, J. Phys. Chem. A, 112, 3965–3975, https://doi.org/10.1021/jp7112208, 2008.
- Abstract
- Introduction
- Materials and methods
- Results and discussion
- Conclusions
- Appendix A: Microcline particle imaging
- Appendix B: Spatial distribution of freezing events and cooling rate for each experiment
- Appendix C: Calculation of frozen fraction from nucleation rate
- Code and data availability
- Author contributions
- Competing interests
- Disclaimer
- Acknowledgements
- Financial support
- Review statement
- References