the Creative Commons Attribution 4.0 License.
the Creative Commons Attribution 4.0 License.
 | 30 Sep 2022
A new hot-stage microscopy technique for measuring temperature-dependent viscosities of aerosol particles and its application to farnesene secondary organic aerosol
Kristian J. Kiland
Kevin L. Marroquin
Natalie R. Smith
Shaun Xu
Sergey A. Nizkorodov
The viscosity of secondary organic aerosol (SOA) is needed to improve predictions of air quality, climate, and atmospheric chemistry. Many techniques have been developed to measure the viscosity of micrometer-sized materials at room temperature; however, few techniques are able to measure viscosity as a function of temperature for these small sample sizes. SOA in the troposphere experience a wide range of temperatures, so measurement of viscosity as a function of temperature is needed. To address this need, a new method was developed based on hot-stage microscopy combined with fluid dynamics simulations. The current method can be used to determine viscosities in the range of roughly 104 to 108 Pa s at temperatures greater than room temperature. Higher viscosities may be measured if experiments are carried out over multiple days. To validate our technique, the viscosities of 1,3,5-tris(1-naphthyl)benzene and phenolphthalein dimethyl ether were measured and compared with values reported in the literature. Good agreement was found between our measurements and literature data. As an application to SOA, the viscosity as a function of temperature for lab-generated farnesene SOA material was measured, giving values ranging from 3.1×10⁶ Pa s at 51 ∘C to 2.6×10⁴ Pa s at 67 ∘C. We fit the temperature-dependent data to the Vogel–Fulcher–Tammann (VFT) equation and obtained a fragility parameter for the material of 7.29±0.03, which is very similar to the fragility parameter of 7 reported for α-pinene SOA by Petters and Kasparoglu (2020). These results demonstrate that the viscosity as a function of temperature can be measured for lab-generated SOA material using our hot-stage microscopy method.
- Article
(2309 KB) - Full-text XML
-
Supplement
(993 KB) - BibTeX
- EndNote


Secondary organic aerosol (SOA) is formed in the atmosphere by the oxidation of volatile and intermediate volatile organic compounds followed by gas-to-particle partitioning of oxidation products (Hallquist et al., 2009; Jimenez et al., 2009). SOA can also be formed by condensed-phase reactions (Ervens et al., 2011; McNeill, 2015). SOA is a major contributor to respirable particulate matter in urban environments, which leads to negative health effects (Lelieveld et al., 2015; Nel, 2005; Pope and Dockery, 2006; Shiraiwa et al., 2017a). SOA also influences climate directly by scattering and absorbing incoming solar radiation as well as indirectly by acting as cloud condensation nuclei and ice-nucleating particles (Masson-Delmotte et al., 2021; Myhre et al., 2013).
Recent work has shown that predictions of the size and mass of SOA can be sensitive to diffusion rates in SOA (Han et al., 2019; Kim et al., 2019; Shiraiwa et al., 2011, 2013; Shiraiwa and Seinfeld, 2012; Vander Wall et al., 2020; Ye et al., 2018; Yli-Juuti et al., 2017; Zaveri et al., 2014, 2018, 2022; Zhang et al., 2019a). Diffusion rates within SOA influence heterogeneous chemistry and condensed-phase photochemistry (Alpert et al., 2021; Dalton and Nizkorodov, 2021; Fitzgerald et al., 2016; Gržinić et al., 2015; Li and Knopf, 2021; Li et al., 2021; Marshall et al., 2016; Schmedding et al., 2020; Shiraiwa et al., 2011; Steimer et al., 2014) and the long-range transport of pollutants (Friedman et al., 2014; Keyte et al., 2013; Mu et al., 2018; Shrivastava et al., 2017; Zelenyuk et al., 2012). Water uptake, and hence ice-nucleating properties of SOA, depend on diffusion rates (Fowler et al., 2020; Ignatius et al., 2016; Ladino et al., 2014; Lata et al., 2021; Lee et al., 2020; Murray et al., 2010; Tumminello et al., 2021). Diffusion rates can also influence crystallization rates within SOA-containing particles (Bodsworth et al., 2010; Fard et al., 2017; Ji et al., 2017; Murray, 2008). As a result, measurements of diffusion rates within SOA as a function of key atmospheric variables, namely relative humidity (RH) and temperature (Porter et al., 2021), are needed. Alternatively, measuring the viscosity of SOA as a function of RH and temperature can be used together with the Stokes–Einstein relation or the fractional Stokes–Einstein relation to calculate diffusion rates within SOA (Evoy et al., 2019, 2020, 2021; Ingram et al., 2021; Price et al., 2016).
Measurement of the viscosity of SOA is challenging due to the exceedingly small amount of SOA material (typically in the microgram range) that can be collected from the atmosphere or environmental chambers in a reasonable amount of time. Nevertheless, several techniques have been developed to measure the viscosity of SOA as a function of relative humidity (RH) at ambient temperatures (Reid et al., 2018). In addition, atomic force microscopy (AFM) techniques have recently been developed for probing the RH-dependent phase state of aerosols (Lee et al., 2020; Lee and Tivanski, 2021; Madawala et al., 2021). Although some of these methods could be extended to different temperatures by making modifications to the techniques (e.g. Logozzo and Preston, 2022), only three methods have been developed and used to measure the viscosity of SOA as a function of temperature. One such method is a dimer relaxation technique to measure viscosities of SOA in the range of 5×10⁵ to 2×10⁷ Pa s at temperatures ranging from −15 to 80 ∘C (Champion et al., 2019; Petters et al., 2019). This technique has the advantage that the viscosity of the SOA is determined without collecting the material on substrates. On the other hand, this technique is limited to relatively high aerosol number concentrations. Järvinen et al. (2016) used light scattering techniques to measure viscosities of SOA at ∼107 Pa s and for temperatures between −38 and 10 ∘C (Järvinen et al., 2016). Similar to the dimer relaxation technique, the viscosity of the SOA is determined without collecting the material. Qin et al. (2021) coupled AFM to a temperature-controlled sample module to measure the viscosities in the range of to 10−1 Pa s at temperatures between 15 and 95 ∘C for organic particles collected on substrates (Qin et al., 2021). Although SOA in the atmosphere is frequently Pa s (Maclean et al., 2021a; Shiraiwa et al., 2017b), at this point, the temperature-dependent AFM technique has only been used to probe particles with viscosities Pa s.
Hot-stage microscopy (HSM) has been used previously to measure the temperature-dependent viscosity of relatively large amounts of samples (>70 mg needed for sample preparation) (Garcia-Valles et al., 2013; Pascual et al., 2001, 2005; Scholze, 1962). In this method, the material of interest, in the form of a powder, is pressed into a cube or cylinder with a length scale on the order of ∼3000 µm. The cube or cylinder is then heated at a fixed rate and viewed with an optical microscope. From images recorded during heating, several characteristic temperatures are determined including the temperature of first shrinkage, the temperature of maximum shrinkage, and the temperature for half-ball formation. Viscosities are then estimated for these characteristic temperatures by comparison with characteristic temperatures of laboratory standards having well-known viscosities. For this procedure to be accurate, the material of interest must have a similar surface tension, contact angle, and slip length (a measure of resistance to flow at a solid substrate) as the laboratory standards. Note that this procedure will not work with SOA due to the small amount of SOA material that can be collected on a reasonable timescale. In addition, SOA can have a wide range of properties (and hence surface tensions, contact angles, and slip lengths), so what to use as an appropriate laboratory standard is unclear.
In the following, we develop a new methodology for measuring the viscosity of SOA material as a function of temperature, building on the HSM technique discussed above. In our method, many SOA particles are coalesced into one larger particle with an area-equivalent diameter of ∼60 to 190 µm and placed on a hot stage coupled to an optical microscope. The temperature of the hot stage is then increased rapidly to a temperature of interest and held at this temperature for an extended time. Images of the particles are recorded as a function of time at this fixed temperature. If the temperature is hot enough, the shape of the particles changes to reduce the overall surface energy of the system. Fluid dynamic simulations are then used to determine the viscosity of the material from the change in the shape of the particles during the observation time at the fixed temperature. The fluid dynamics simulations explicitly account for the surface tension, contact angle, and slip length of the material. The technique can be used to measure the viscosity of small amounts of SOA material (<1 mg of material is needed for sample preparation). The viscosity measurements described here can be made on SOA material collected on substrates, and as result they do not have to be made at the same location or time as SOA generation or collection. The methodology presented here is complementary to the dimer relaxation, light scattering, and AFM techniques discussed above for measuring temperature-dependent viscosities of SOA material. Our new methodology also uses inexpensive equipment that is available in many laboratories.
To validate our HSM technique, the viscosities of 1,3,5-tris(1-naphthyl)benzene (TαNB) (Fig. 1a) and phenolphthalein dimethyl ether (PDE) (Fig. 1b) were measured as a function of temperature and the results were compared to literature values. TαNB and PDE were chosen for the validation measurements since these materials readily form an amorphous solid at room temperature (a prerequisite for our measurements), and the temperature-dependent viscosity of this material has been reported in the literature (Plazek et al., 1999; Stickel et al., 1996). We show that the viscosities determined with our new methodology are consistent with the viscosities reported in the literature for TαNB and PDE.

Figure 1Chemical structures of (a) 1,3,5-tris(1-naphthyl)benzene, (b) phenolphthalein dimethyl ether, and (c) farnesene.
As the first application of our new methodology, the temperature-dependent viscosity of SOA material generated from the photooxidation of farnesene was measured. Farnesene (Fig. 1c), an acyclic sesquiterpene, can be a significant component of biogenic volatile organic compounds (VOCs) emitted to the atmosphere from trees, shrubs, grasslands, and crops (Bouvier-Brown et al., 2009; Geron and Arnts, 2010; Helmig et al., 2006; Li and Xie, 2014; Ylisirniö et al., 2020). Plants have increased emission rates of farnesene and other sesquiterpenes under periods of insect herbivory, heat, and drought stress, which is projected to increase due to climate change, making farnesene an interesting VOC to study (Faiola et al., 2019; Mentel et al., 2013). Previous work has shown that farnesene reacts with atmospheric oxidants such as ozone (O3), hydroxyl radicals (OH), and nitrate radicals (NO3) to form SOA with a high yield (Jaoui et al., 2013). Acyclic terpenes, such as farnesene, tend to break down into smaller products during O3 oxidation but not OH or NO3 oxidation. As a result, SOA yields from plants can depend strongly on the prevailing oxidant (Faiola et al., 2019). The viscosity of SOA generated from a mixture of VOCs including farnesene has been studied at room temperature (Smith et al., 2021), but the viscosity of SOA generated from only farnesene has not been studied at room temperature or as a function of temperature.
In addition to measuring the temperature-dependent viscosities of farnesene SOA material, we also determined the chemical composition of the farnesene SOA using high-resolution mass spectrometry. The measured viscosity was then compared with predictions based on the chemical composition coupled with the parameterization presented in DeRieux et al. (2018). The DeRieux et al. (2018) parameterization has often been used to predict the viscosity and glass transition temperatures of SOA (DeRieux et al., 2018; Ditto et al., 2019; Gervasi et al., 2020; Maclean et al., 2021b; Pratap et al., 2018; Riva et al., 2019; Schum et al., 2018; Slade et al., 2019; Tikkanen et al., 2020; Wolf et al., 2019; Zhang et al., 2019a, b), but the accuracy of this parameterization for predicting the viscosity of SOA has not been previously tested for SOA produced from acyclic terpenes.
2.1 Generation of amorphous solid particles
To be compatible with our new technique, the material must have the following properties: (1) the material must be amorphous (i.e. non-crystalline), (2) the material must have a viscosity greater than approximately 108 Pa s at room temperature so the material does not flow significantly on a timescale of hours at room temperature, (3) the material must be in the form of particles with dimensions ∼ 20–300 µm, and (4) the particles must be in a non-equilibrium geometry at the start of the experiments. Below is a description of how we generated particles with these properties for TαNB, PDE, and farnesene SOA material.
When purchased, 1,3,5-tris(1-naphthyl)benzene (TRC Canada) and phenolphthalein dimethyl ether (Polymer Source) were in a crystalline state. To generate amorphous solid particles of TαNB and PDE with the properties discussed above, the following procedure was used: first some of the crystalline material was placed on a glass slide, and the temperature of the slide was increased to a temperature above the melting point of the crystalline material (TαNB: mp = 184–186 ∘C; PDE: mp = 100 ∘C). After the crystalline material had melted, the temperature was rapidly decreased (∼2 ∘C s−1) to room temperature, resulting in the formation of a glassy material (Magill and Plazek, 1967; Plazek and Magill, 1966; Stickel et al., 1996). The glassy material was then scraped off the slide with a razor blade, forming amorphous solid particles in a non-equilibrium geometry (i.e. jagged geometry) with area-equivalent diameters ranging from ∼60 to 190 µm. The formation of a glass state was verified by showing that the material flowed at a temperature significantly lower than the melting temperature of the crystalline material (see below).
Farnesene SOA particles were generated by photooxidation of farnesene in a 5 m3 environmental chamber operated in batch mode at 50 % RH and room temperature (21–23 ∘C), similar to previous work (Smith et al., 2021). A farnesene isomer mixture (Sigma-Aldrich, product no.: W383902) was injected into the chamber (8 µL) and a proton-transfer-reaction time-of-flight mass spectrometer (PTR-ToF-MS; Ionicon model 8000) with H3O+ as the reagent ion was used to confirm the completeness of injection of the farnesene precursor into the chamber by monitoring 205 (protonated farnesene). The initial mixing ratio of farnesene was ∼160 ppb for all experiments. Next, H2O2 (45 µL of 30 wt % H2O2 in water) was added to the chamber through a heated inlet (50 ∘C), resulting in 2 ppm of H2O2 in the chamber. Photooxidation was initiated by turning on a bank of UV-B lights, which led to the production of OH radicals by photodissociation of H2O2 (Smith et al., 2021).
No seeds were used during SOA generation to avoid interference with viscosity measurements. Particle size and number concentration were measured using a scanning mobility particle sizer (SMPS; TSI differential mobility analyzer model 3080 and CPC model 3775). During photooxidation, the mass concentration of SOA in the chamber reached approximately 500 µg m−3. After SOA was generated, the UV-B lights were turned off, and SOA particles were collected onto hydrophobic glass substrates placed on stage 9 of a non-rotating micro-orifice uniform deposit impactor (MOUDI) operated at 30 L min−1 with all the remaining MOUDI stages removed as discussed elsewhere (Smith et al., 2021). Hydrophobic glass slides were generated by coating plain glass slides with FluoroPel 800 (Cytonix USA). Samples were collected for 3 h. This method of collection resulted in droplets with spherical cap geometries and diameters of ∼30 to 250 µm, formed by the aggregation of smaller SOA particles on the hydrophobic glass substrates. These droplets are not expected to contain crystalline material, since SOA consists of hundreds of different compounds, and the concentration of any given compound is not expected to be high enough for crystallization (Marcolli et al., 2004). Furthermore, optical images of SOA particles are consistent with a non-crystalline state for the SOA. After collection, samples were placed in protective plastic enclosures, sealed with a vacuum food sealer, and stored in a freezer at −20 ∘C until analysis (except for 24 h transit time when the samples had to be shipped to other participating laboratories on ice at 0 ∘C). To prepare the sample for the viscosity measurements, some of the SOA material was scraped off the slide using a razor blade, resulting in amorphous solid particles with non-equilibrium geometries and area-equivalent diameters of ∼80 to 170 µm.
2.2 Hot-stage microscope
After the amorphous solid particles were generated, one or more of the particles was attached to the flat end of an ultra-fine tungsten needle (Roboz Surgical Instruments Co.) by bringing the end in contact with the amorphous particles. This needle was then placed in the HSM apparatus for the viscosity measurements. The HSM apparatus consists of a temperature control stage (HC321Gi, INSTEC) mounted above an optical transmission microscope (Zeiss Axio Observer) (Fig. 2a). The needle was held in place using an aluminum needle holder (Fig. 2b), and the needle was situated so that the flat end of the needle hung over the edge of the viewing window for imaging. This configuration enabled a side view of the solid amorphous particles during heating.
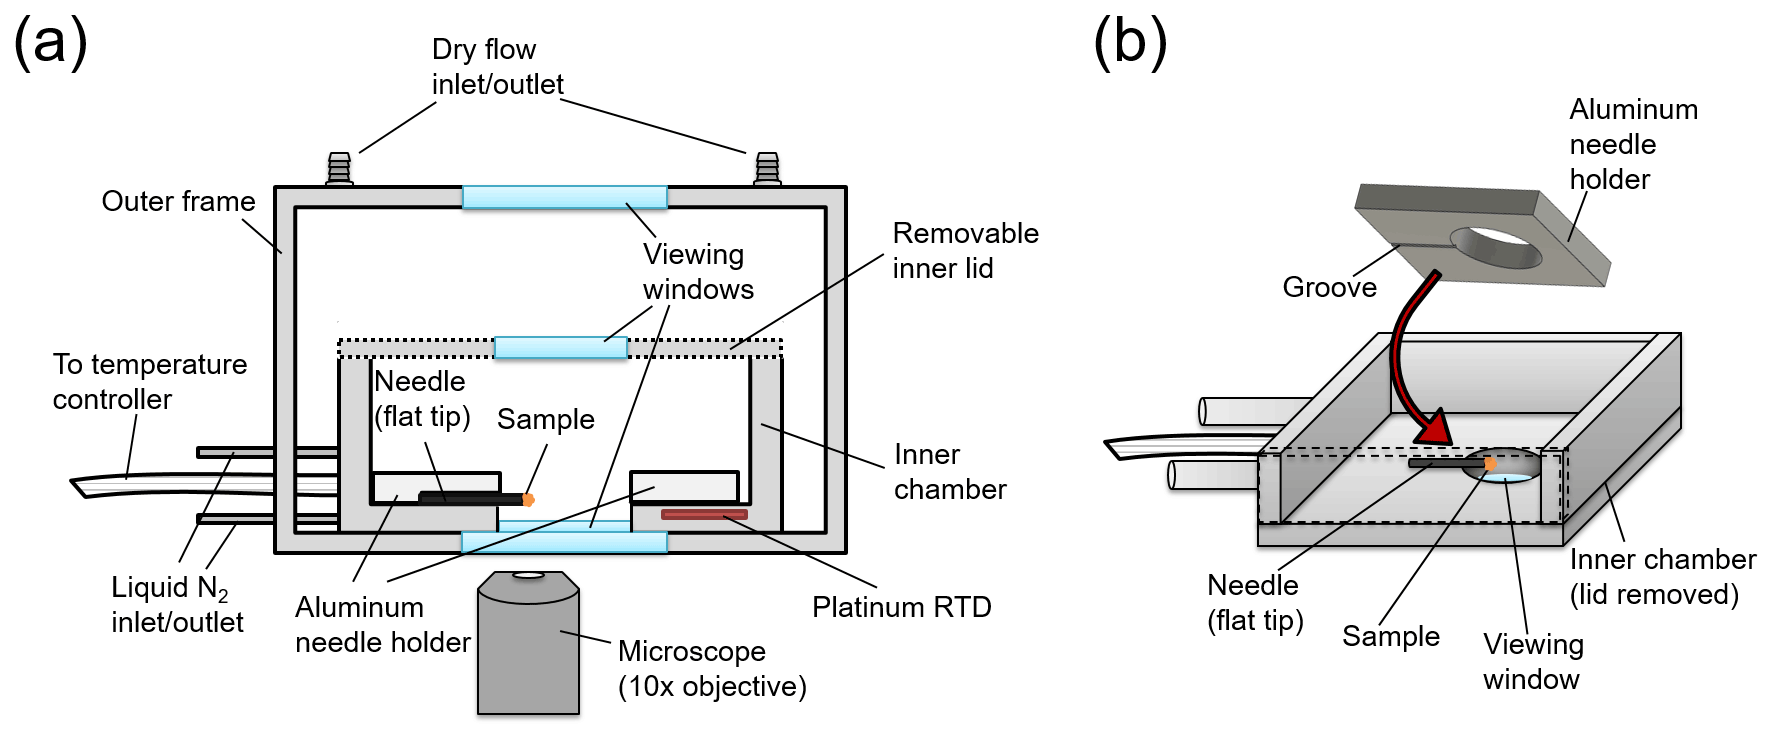
Figure 2Schematic of the hot-stage microscopy apparatus, where panel (a) is a cross-section of the whole apparatus and panel (b) shows a perspective view of the inner chamber of the temperature control stage.
The temperature of the hot stage was controlled by offsetting hot and cold inputs. The cold input was supplied by a liquid nitrogen flow around the walls of the inner chamber and the hot input was supplied by electrical heaters connected to a temperature controller box (mk2000, INSTEC). The temperature of the hot stage was measured with a platinum resistance temperature detector (RTD) (Fig. 2a). The temperature offset between the RTD reading and the flat end of the needle was determined by measuring the melting point of a range of substances (diphenyl ether, 1-octadecanol, glutaric acid, pimelic acid, vanillyl mandelic acid, and cholesterol) placed on the flat end of the needle and by comparing the measurements with melting temperatures reported in the literature for these substances. The temperature ramp used when measuring the melting points was 0.1 ∘C min−1 and images from the melting point experiments were analyzed with the Zen Microscopy software (Zeiss). From the melting point experiments, a calibration curve was generated (Fig. S1 in the Supplement). This calibration curve was used to determine the temperature offset for the viscosity measurements.
2.3 Viscosity measurements
In a typical experiment used to determine the viscosity of particles, the temperature control stage was first purged with nitrogen. For the farnesene SOA experiments, the samples were purged with nitrogen for at least 75 min before heating, since farnesene SOA is hygroscopic. The viscosity results were not strongly sensitive to conditioning times between 75 and 200 min (Fig. S2). If the farnesene SOA material did not reach equilibrium after purging (i.e. it still contained some water), the viscosities reported here should be regarded as lower limits to the viscosity of dry farnesene SOA, since water acts as a plasticizer (i.e. decreases the viscosity of highly viscous material). After purging the cell with nitrogen, the temperature of the cell was increased at a rate of ∼2 ∘C s−1 to an experimental temperature, Texp. During heating, images were recorded as a function of time. Due to the fast ramp rate, the temperature slightly overshot the desired Texp in each experiment and then oscillated around Texp, with the oscillations decreasing with time (e.g. Fig. 3). The start of the experiment (i.e. t=0) was defined as the first image captured after the temperature oscillation was <2 ∘C.
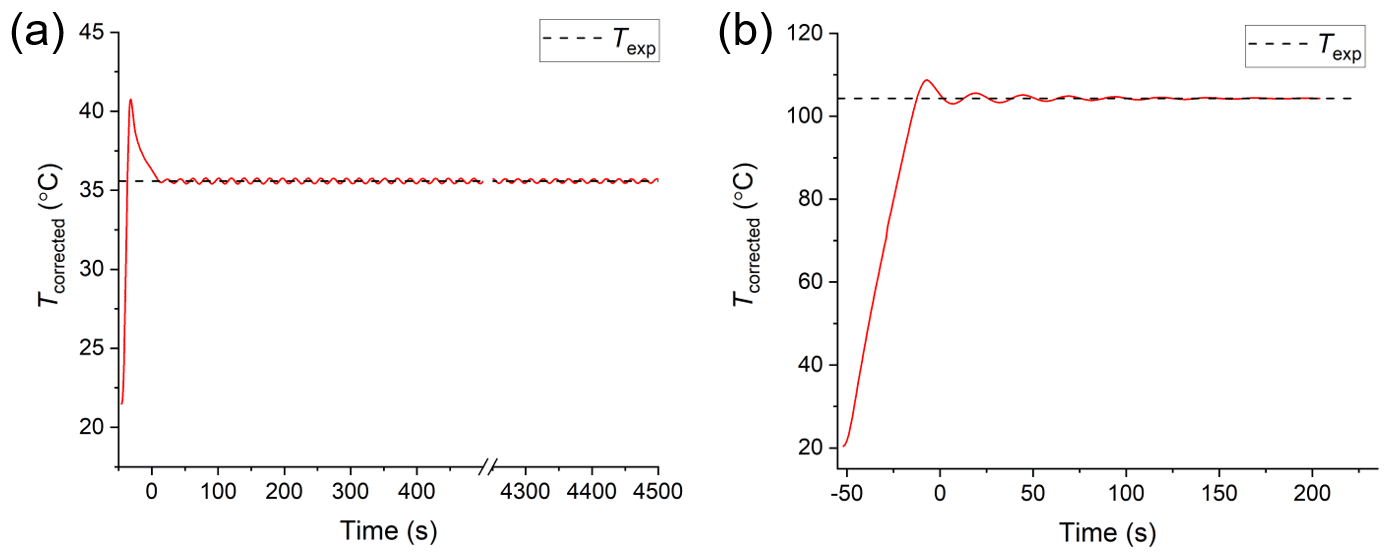
Figure 3Temperature profiles from hot-stage microscopy experiments. Beginning at room temperature (prior to t=0), the temperature ramps at ∼2 ∘C s−1 to the experimental temperature (Texp; black dashed line). The start of the experiment (t=0) begins once the temperature oscillations about Texp are <2 ∘C. The profile in panel (a) is an example of the minimum temperature used (35.6 ∘C) and in panel (b) is an example of the maximum (104.3 ∘C).
At the start of the viscosity measurements, the amorphous solid particles were non-spherical (e.g. Figs. 4–6a, c). If the temperature used in the experiment (Texp) was hot enough, the material began to flow to minimize the surface energy of the system. To relate the flow of the particle to the particle's viscosity, a quantitative measure of the shape change was needed.

Figure 4Hot-stage microscopy experiments with TαNB. Roundness as a function of time at (a) 104.3 ∘C and (c) 98.5 ∘C. The squared difference between observed and simulated roundness as a function of simulated viscosity for the two sample TαNB experiments, where panel (b) corresponds to panel (a) and panel (d) to panel (c). The simulation that best reproduces the observation corresponds to the minimum sum of squared difference. The different colors correspond to different input combinations of surface tension and slip length used in the simulations, where UST, Uslip, LST, and Lslip correspond to the upper limit of surface tension, the upper limit of slip length, the lower limit of surface tension, and the lower limit of slip length, respectively.
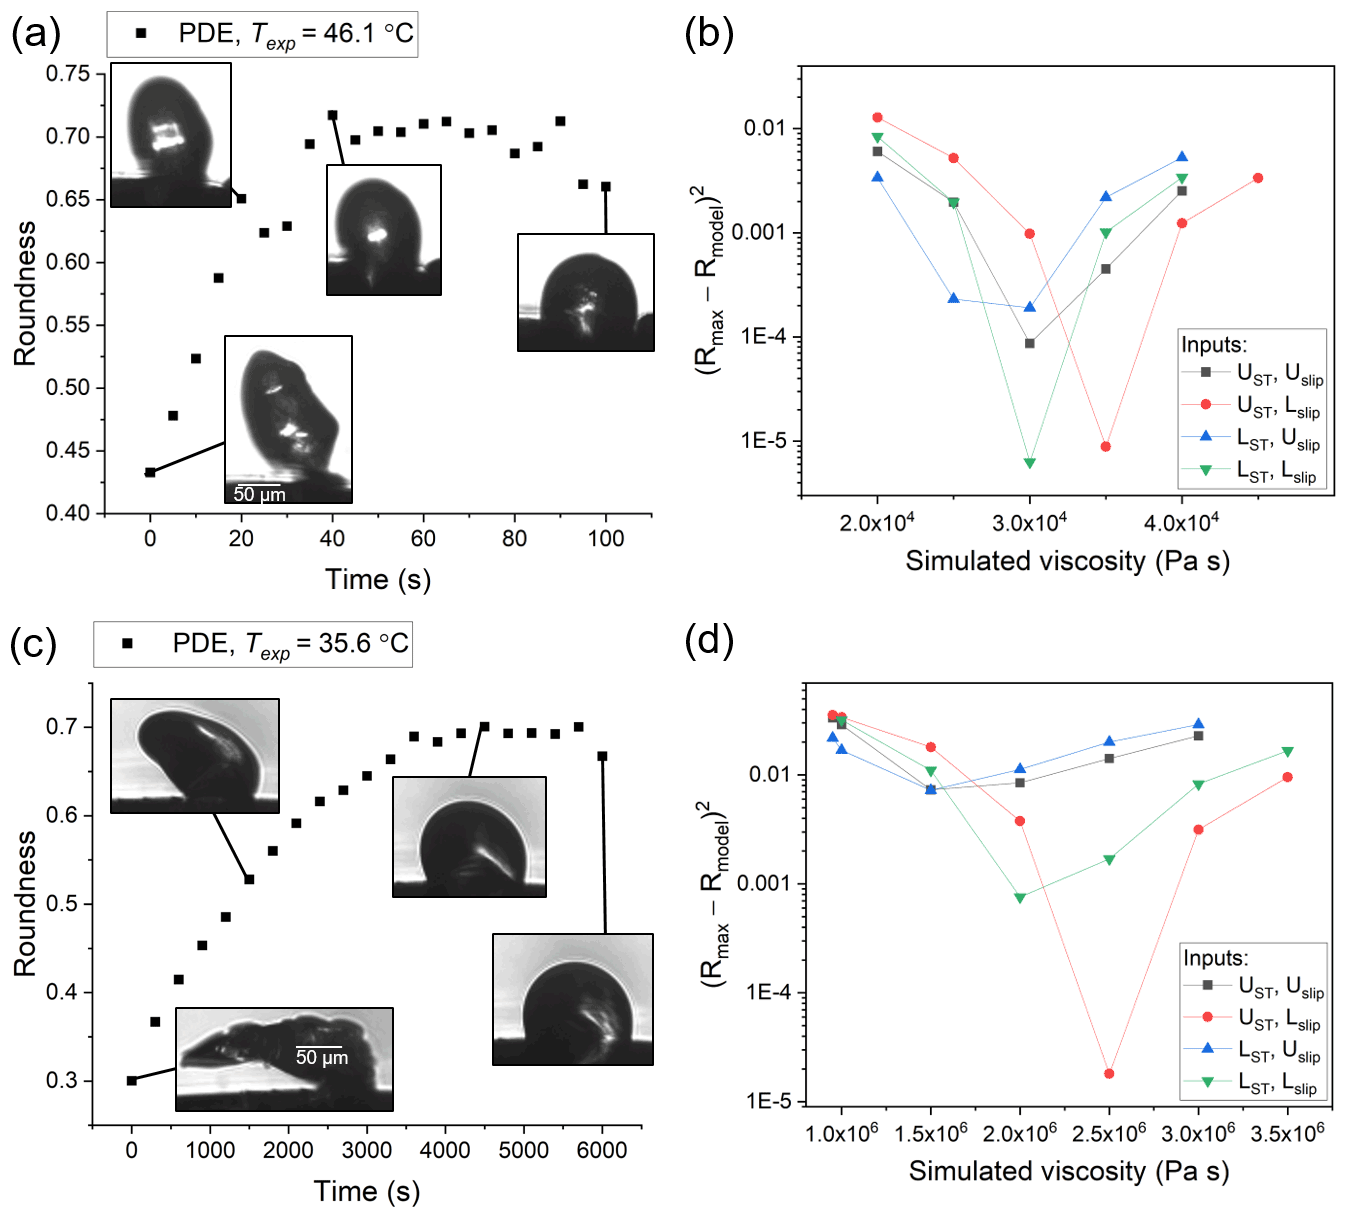
Figure 5Hot-stage microscopy experiments with PDE. Roundness as a function of time at (a) 46.1 ∘C and (c) 35.6 ∘C. The squared difference between observed and simulated roundness as a function of simulated viscosity for the two sample experiments, where panel (b) corresponds to panel (a) and panel (d) to panel (c). The simulation that best reproduces the observation corresponds to the minimum sum of squared difference. The different colors correspond to different input combinations of surface tension and slip length used in the simulations, where UST, Uslip, LST, and Lslip correspond to the upper limit of surface tension, the upper limit of slip length, the lower limit of surface tension, and the lower limit of slip length, respectively.
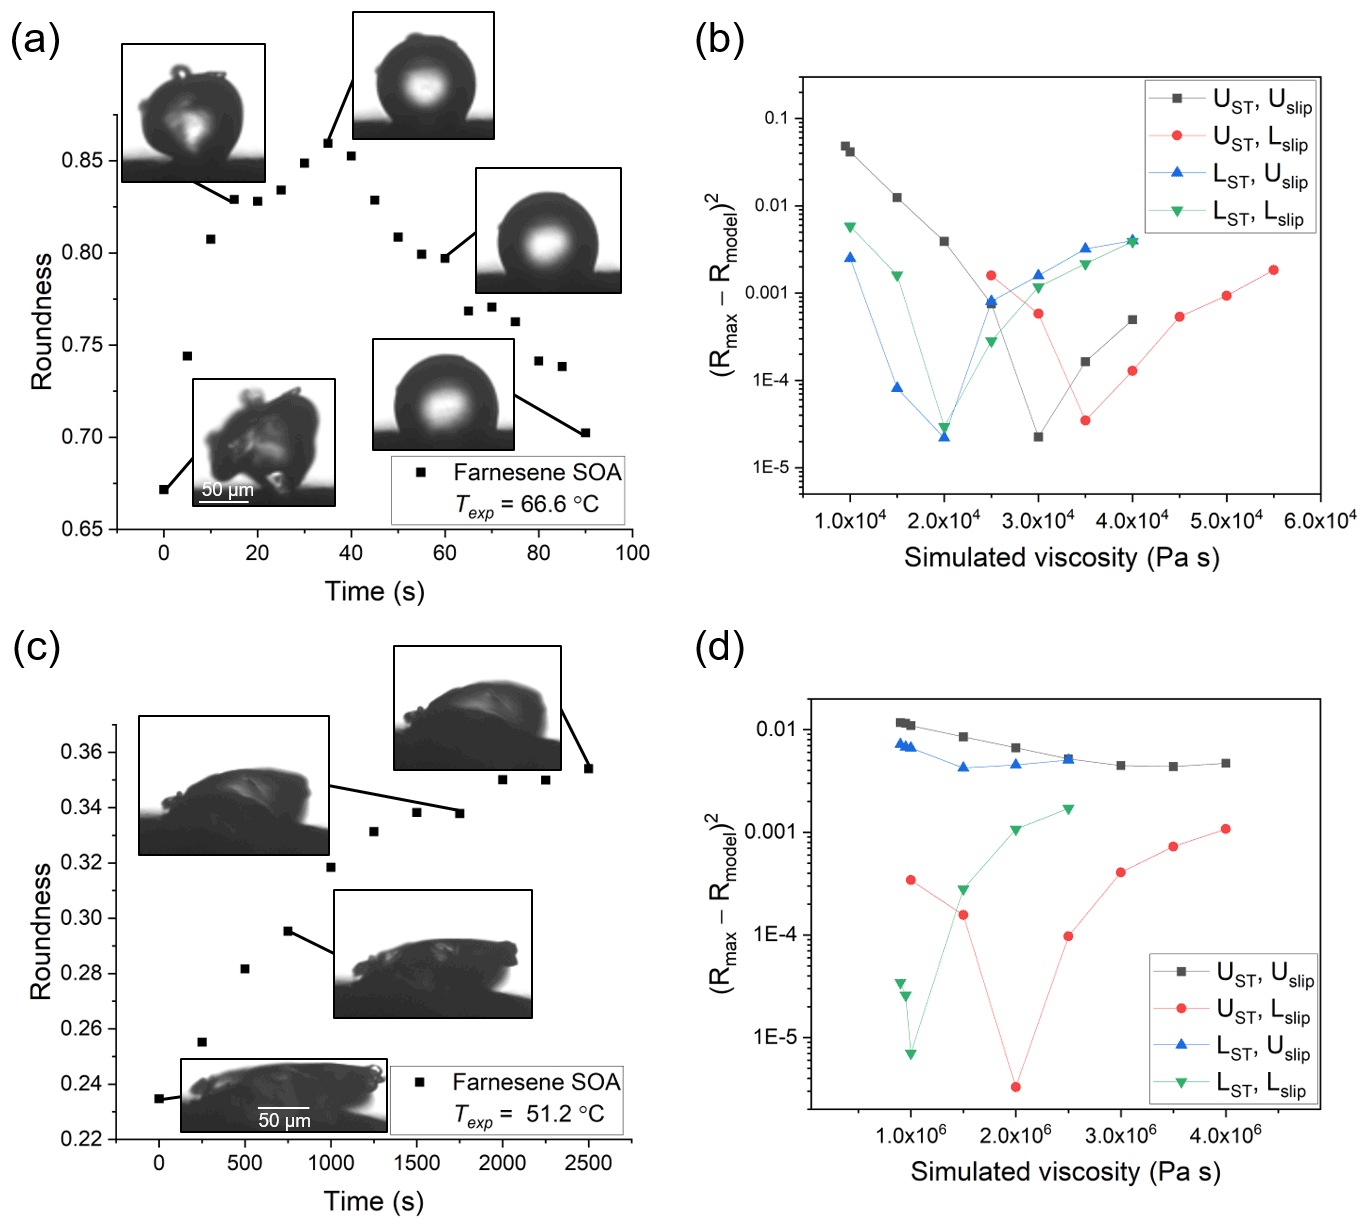
Figure 6Hot-stage microscopy experiments with farnesene SOA material. Roundness as a function of time at (a) 66.6 ∘C and (c) 51.2 ∘C. The squared difference between observed and simulated roundness as a function of simulated viscosity for the two sample experiments, where panel (b) corresponds to panel (a) and panel (d) to panel (c). The simulation that best reproduces the observation corresponds to the minimum sum of squared difference. The different colors correspond to different input combinations of surface tension and slip length used in the simulations, where UST, Uslip, LST, and Lslip correspond to the upper limit of surface tension, the upper limit of slip length, the lower limit of surface tension, and the lower limit of slip length, respectively.
To quantify the shape change we used roundness, which is a measure of how close the shape is to a circle (a roundness value of 1 indicates a perfect circle). Roundness was calculated with the following equation:
where A is the projected area of the particle and LFeret,max is the maximum Feret length of the 2-D projection, which is defined as the maximum distance between two parallel tangential planes to the projected 2-D geometry. The image analysis software ImageJ was used to process the images recorded during the experiments. The silhouette of the needle was removed from the images, and the images were subsequently binarized. The threshold for binarization was calculated using the default ImageJ settings in all but a few cases. In the few exceptions, the default threshold method was clearly not capturing the particle's shape, so the “Mean” threshold method was used instead. For a different microscope set-up with different lighting, a different threshold method may be more accurate than the one chosen here. The roundness was then determined from the sequence of binary images using an image analysis script. This script measures the roundness of binary images by differentiating between black and white pixels and then calculating the area and LFeret,max. The area is calculated by counting the number of black pixels. The LFeret,max is determined by mapping the black pixels on the perimeter of the object and subsequently finding the maximum distance between two diametrically opposed points on the convex hull that encloses the object. One limitation of this approach is that the focus and lighting during image capture can vary across experiments. However, experiments were only analyzed if a majority of the particle was in focus during the experiments, so any uncertainty due to variability in lighting and focus is very likely to be negligible. Note, in these experiments, the effect of gravity on the shape of the particles is expected to be negligible because the force due to gravity (Fg) acting on the particle is much smaller than the surface tension force (FST) acting on the particle (Sect. S3 in the Supplement).
In HSM experiments with TαNB, PDE, and farnesene SOA material, if the temperature was hot enough for the substance to flow, the roundness of the particles first increased to minimize the surface area of the particle and then decreased as the material spread on the surface (e.g. Figs. 4–6a, c). From the images, we determined the maximum roundness (Rmax) and the time necessary to reach Rmax, defined here as the experimental flow time, τexp,flow. The τexp,flow and Rmax values were then used in the fluid dynamics simulations discussed below to determine the viscosity. In some cases with TαNB and PDE, crystallization occurred before the maximum roundness was observed. In these experiments, τexp,flow was assigned as the time just before crystallization was observed and the roundness at τexp,flow was assigned Rmax.
2.4 Fluid dynamics simulations
To extract viscosity values from the experiments, the physics software COMSOL Multiphysics (v5.4) was used. The Microphysics Module within COMSOL was used along with a two-phase laminar flow and moving mesh. Only the 2-D silhouette of the particle could be imaged; the 3-D morphology of the particles was not known. Therefore, a 2-D model was used to represent particle shape in the simulations which has the added benefit of reduced simulation times. Sensitivity tests show that viscosities determined with a 2-D model are similar to viscosities determined with a 3-D model (see Sect. 3.3). The initial 2-D geometry used in the simulations was the same as the projected geometry observed in the HSM experiments. To obtain the same initial 2-D geometry, the initial projected geometry captured during the HSM experiment was binarized and imported into COMSOL. For the simulations, slip length, surface tension, and contact angles were needed. For slip lengths and surface tensions, conservative upper and lower limits were estimated based on literature values (Table 1). For contact angles, 37.5, 50.5, and 29.9∘ were used for TαNB, PDE, and farnesene SOA material, respectively, based on measurements (see Sect. 2.5).
Table 1Input values of surface tension and slip length used in fluid dynamics simulations.
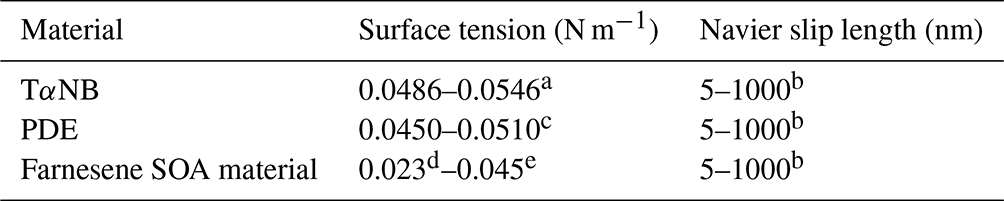
a The surface tension of TαNB was reported to be 0.0516 N m−1,
based on the ACD/Labs Percepta Platform-PhysChem Module retrieved from
ChemSpider. The upper and lower limits correspond to the reported
uncertainty of ±0.0030 N m−1.
b The range of values for Navier slip length is based on values
reported in the literature (Baudry et al., 2001; Bhushan et al., 2009; Cho et al., 2004; Churaev et al., 1984; Cottin-Bizonne et al., 2002, 2005; Craig et al., 2001; Jing and Bhushan, 2013; Joseph and Tabeling, 2005; Mcbride and Law, 2009; Tretheway and Meinhart, 2002; Vinogradova et al., 2009; Zhu et al., 2012).
c The surface tension of PDE was reported to be 0.0480 N m−1, based on the ACD/Labs Percepta Platform-PhysChem Module retrieved from ChemSpider. The upper and lower limits correspond to the reported uncertainty of ±0.0030 N m−1.
d The lower limit for the surface tension of farnesene SOA material was the lower uncertainty of the ACD/Labs value for farnesene retrieved from ChemSpider.
e The upper limit for the surface tension of farnesene SOA material is an upper limit to surface tensions reported in the literature for water + SOA solutions and common SOA functional groups such as alcohols, organic acids, esters, and ketones (Demond and Lindner, 1993; Gorkowski et al., 2020; Gray Bé et al., 2017; Hritz et al., 2016).
The time used in the simulations, τmodel, was set to τexp,flow. The output of a simulation was a binary 2-D image of the final geometry at τmodel. The roundness of the final 2-D geometry, Rmodel, was then calculated with the same MATLAB script as used for the images recorded during HSM experiments (see above). Rmodel was then compared to Rmax by calculating the squared difference between Rmodel and Rmax. The viscosity in the simulation was then varied, and the squared difference between Rmodel and Rmax was determined as a function of the viscosity. This procedure was repeated using upper and lower limits for the surface tension and upper and lower limits for the slip length, resulting in four plots of the squared difference between Rmodel and Rmax as a function of viscosity for each experiment (e.g. Figs. 4–6b, d). From each plot, the viscosity that gave the smallest squared difference between Rmodel and Rmax was identified, resulting in four viscosities for each experiment. The largest and smallest viscosities from these four minima were assigned as the upper and lower limits for the experiment. This whole process was then repeated for several experiments. The upper limit was assigned as the average of the upper limit values from replicate experiments summed with the standard error of the mean. The lower limit was assigned as the average of the lower limit values subtracted by the standard error of the mean.
2.5 Contact angle measurements
For the fluid dynamics simulations discussed above, the contact angle between the material studied and the substrate was needed. To determine these contact angles, the material was heated to the point where it had completely liquefied, flowed, and reached an equilibrium geometry on the flat end of the ultra-fine needle (e.g. Fig. S3). The equilibrium contact angle between the material and the flat end of an ultra-fine tungsten needle was then measured directly from captured images using the ImageJ angle tool. Based on at least five measurements, the average contact angles for TαNB, PDE, and farnesene SOA material were 37.5±4.0, 50.5±5.4, and 29.9±4.3∘, respectively, where the uncertainties are twice the standard error of the mean. The simulations described above used the average contact angles determined with this approach. However, changing the contact angle in the simulations by ±2σ only changed the viscosity in the simulations by 5 % of an order of magnitude at most, which was considered small compared to the uncertainties in the reported viscosities.
2.6 Measurements of the chemical composition of farnesene SOA using mass spectrometry
To determine the chemical composition of the SOA, the SOA was generated in the environmental chamber using the same procedure as discussed above and then collected onto aluminum foil, followed by extraction in 1:1 () liquid chromatography–mass spectrometry (LCMS) grade acetonitrile and water. The chemical composition of the extracted SOA was obtained in positive and negative ionization mode using ultra-performance liquid chromatography–photodiode array detection–electrospray ionization–high-resolution mass spectrometry (UPLC-PDA-ESI-HRMS). A Vanquish Horizon UPLC (Thermo Scientific) was equipped with a Luna 1.6 µm Omega Polar C18 (150×2.1 mm column). Solvents A and B used during liquid chromatography were high-performance liquid chromatography (HPLC) grade acetonitrile (containing 0.1 % formic acid) and water (also with 0.1 % formic acid), respectively. A Q-Exactive Plus Orbitrap mass spectrometer (Thermo Scientific) with a mass resolving power of at 200 was used, and data were acquired from 50 to 750. The ESI source parameters were set to a spray voltage of +3.5 kV in positive mode and −2.5 kV in negative mode, the capillary temperature was 320 ∘C, and the S-lens ion funnel radiofrequency (RF) level was 50. In addition to the samples, a solvent blank was prepared following the same procedure above but using a clean aluminum foil substrate without analyte. The analysis procedure of the mass spectrometry data has been described in detail previously (Maclean et al., 2021a; Smith et al., 2021). Briefly, the peaks were integrated and extracted from the mass spectra from 2 to 16 min corresponding to SOA elution in the chromatogram, and peaks containing 13C isotopes were removed. All peaks were assigned to the formulas CxHyOz with an accuracy of 0.0005 units while containing the assignments to closed-shell ions with even nominal masses and constraining to 0.30–2.25 and to 0.00–2.30. Masses were only considered if they were 3 times more abundant in the sample compared to the blank. The assigned ion formulas were corrected for the ionization mechanism, and all the HRMS results below are reported as formulas of neutral SOA compounds. The assumed ionization mechanisms were the formation of adducts with H+ or Na+ for positive ions and deprotonation for negative ions.
2.7 Predictions of the temperature-dependent viscosity of farnesene SOA using the chemical composition
The temperature-dependent viscosity of farnesene SOA was predicted from the chemical composition of farnesene SOA using the method in DeRieux et al. (2018). First, the Tg of each compound identified in the HRMS was determined using Eq. (2), which relates the number of C, H, and O in a compound, i, to its Tg (DeRieux et al., 2018):
where nC, nH, and nO are the number of carbon, hydrogen, and oxygen, respectively. The coefficients , bC, bH, bCH, bO, and bCO were 12.13, 10.95, −41.82, 21.61, 118.96, and −24.38, respectively, for CHO-containing compounds.
Next, the Tg of the overall SOA (for dry conditions) was calculated using the Gordan–Taylor equation (Gordan and Taylor, 1952) with an assumed Gordan–Taylor constant (kGT) of 1:
where wi is the mass fraction of component i. The wi values were assumed to be proportional to the relative abundance (Ii) in the combined mass spectra, that is,
As described previously, this assumption is a limitation of these viscosity predictions (DeRieux et al., 2018; Song et al., 2019). The Vogel–Fulcher–Tammann equation was used to describe the temperature dependence of viscosity (Fulcher, 1925):
where η is viscosity, T is temperature, Df is the fragility parameter, T0 is the Vogel temperature, and (Angell, 1991). We assumed Df=10, as done previously (Gervasi et al., 2020; Maclean et al., 2021a, b; Shiraiwa et al., 2017b). The Vogel temperature, T0, was determined from Eq. (6) below, which is derived from Eq. (5), assuming the viscosity is 1012 Pa s at T=Tg (Angell, 1991, 2002):
where Tg was obtained from Eq. (3) and Df was set to 10. Once T0 was calculated, a Vogel–Fulcher–Tammann (VFT) curve was constructed using Eq. (5).
3.1 Measured viscosities of TαNB and PDE
The viscosity of TαNB was measured at 98.5 and 104.3 ∘C, and the viscosity of PDE was measured at 35.6, 40.9, and 46.6 ∘C. At each temperature, the experimental flow time, τexp,flow, and maximum roundness, Rmax, was determined for at least two different particles (Tables S1 and S2 in the Supplement). On average, the τexp,flow value decreased as temperature increased, as expected. The 2-D fluid dynamics simulations (Sect. 2.4) were used to convert τexp,flow and Rmax values to viscosities. Upper and lower limits for the viscosities were determined from each experiment and combined to give an overall upper and lower limit to the viscosity of the material (Fig. 7). The viscosity midpoints for TαNB at 98.5 and 104.3 ∘C were 1.1×10⁶ and 2.8×10⁵ Pa s, respectively. The viscosity midpoints for PDE at 35.6, 40.9, and 46.6 ∘C were 8.2×10⁶, 2.4×10⁵, and 3.5×10⁴ Pa s, respectively. For reference, the room temperature viscosities of tar pitch and lard are 108 and 103 Pa s, respectively. For TαNB, the viscosity decreased by a factor of ∼4 for a 5.8 ∘C increase in temperature. For PDE, the viscosity decreased by roughly 2.5 orders of magnitude for a ∼11.0 ∘C increase in temperature.
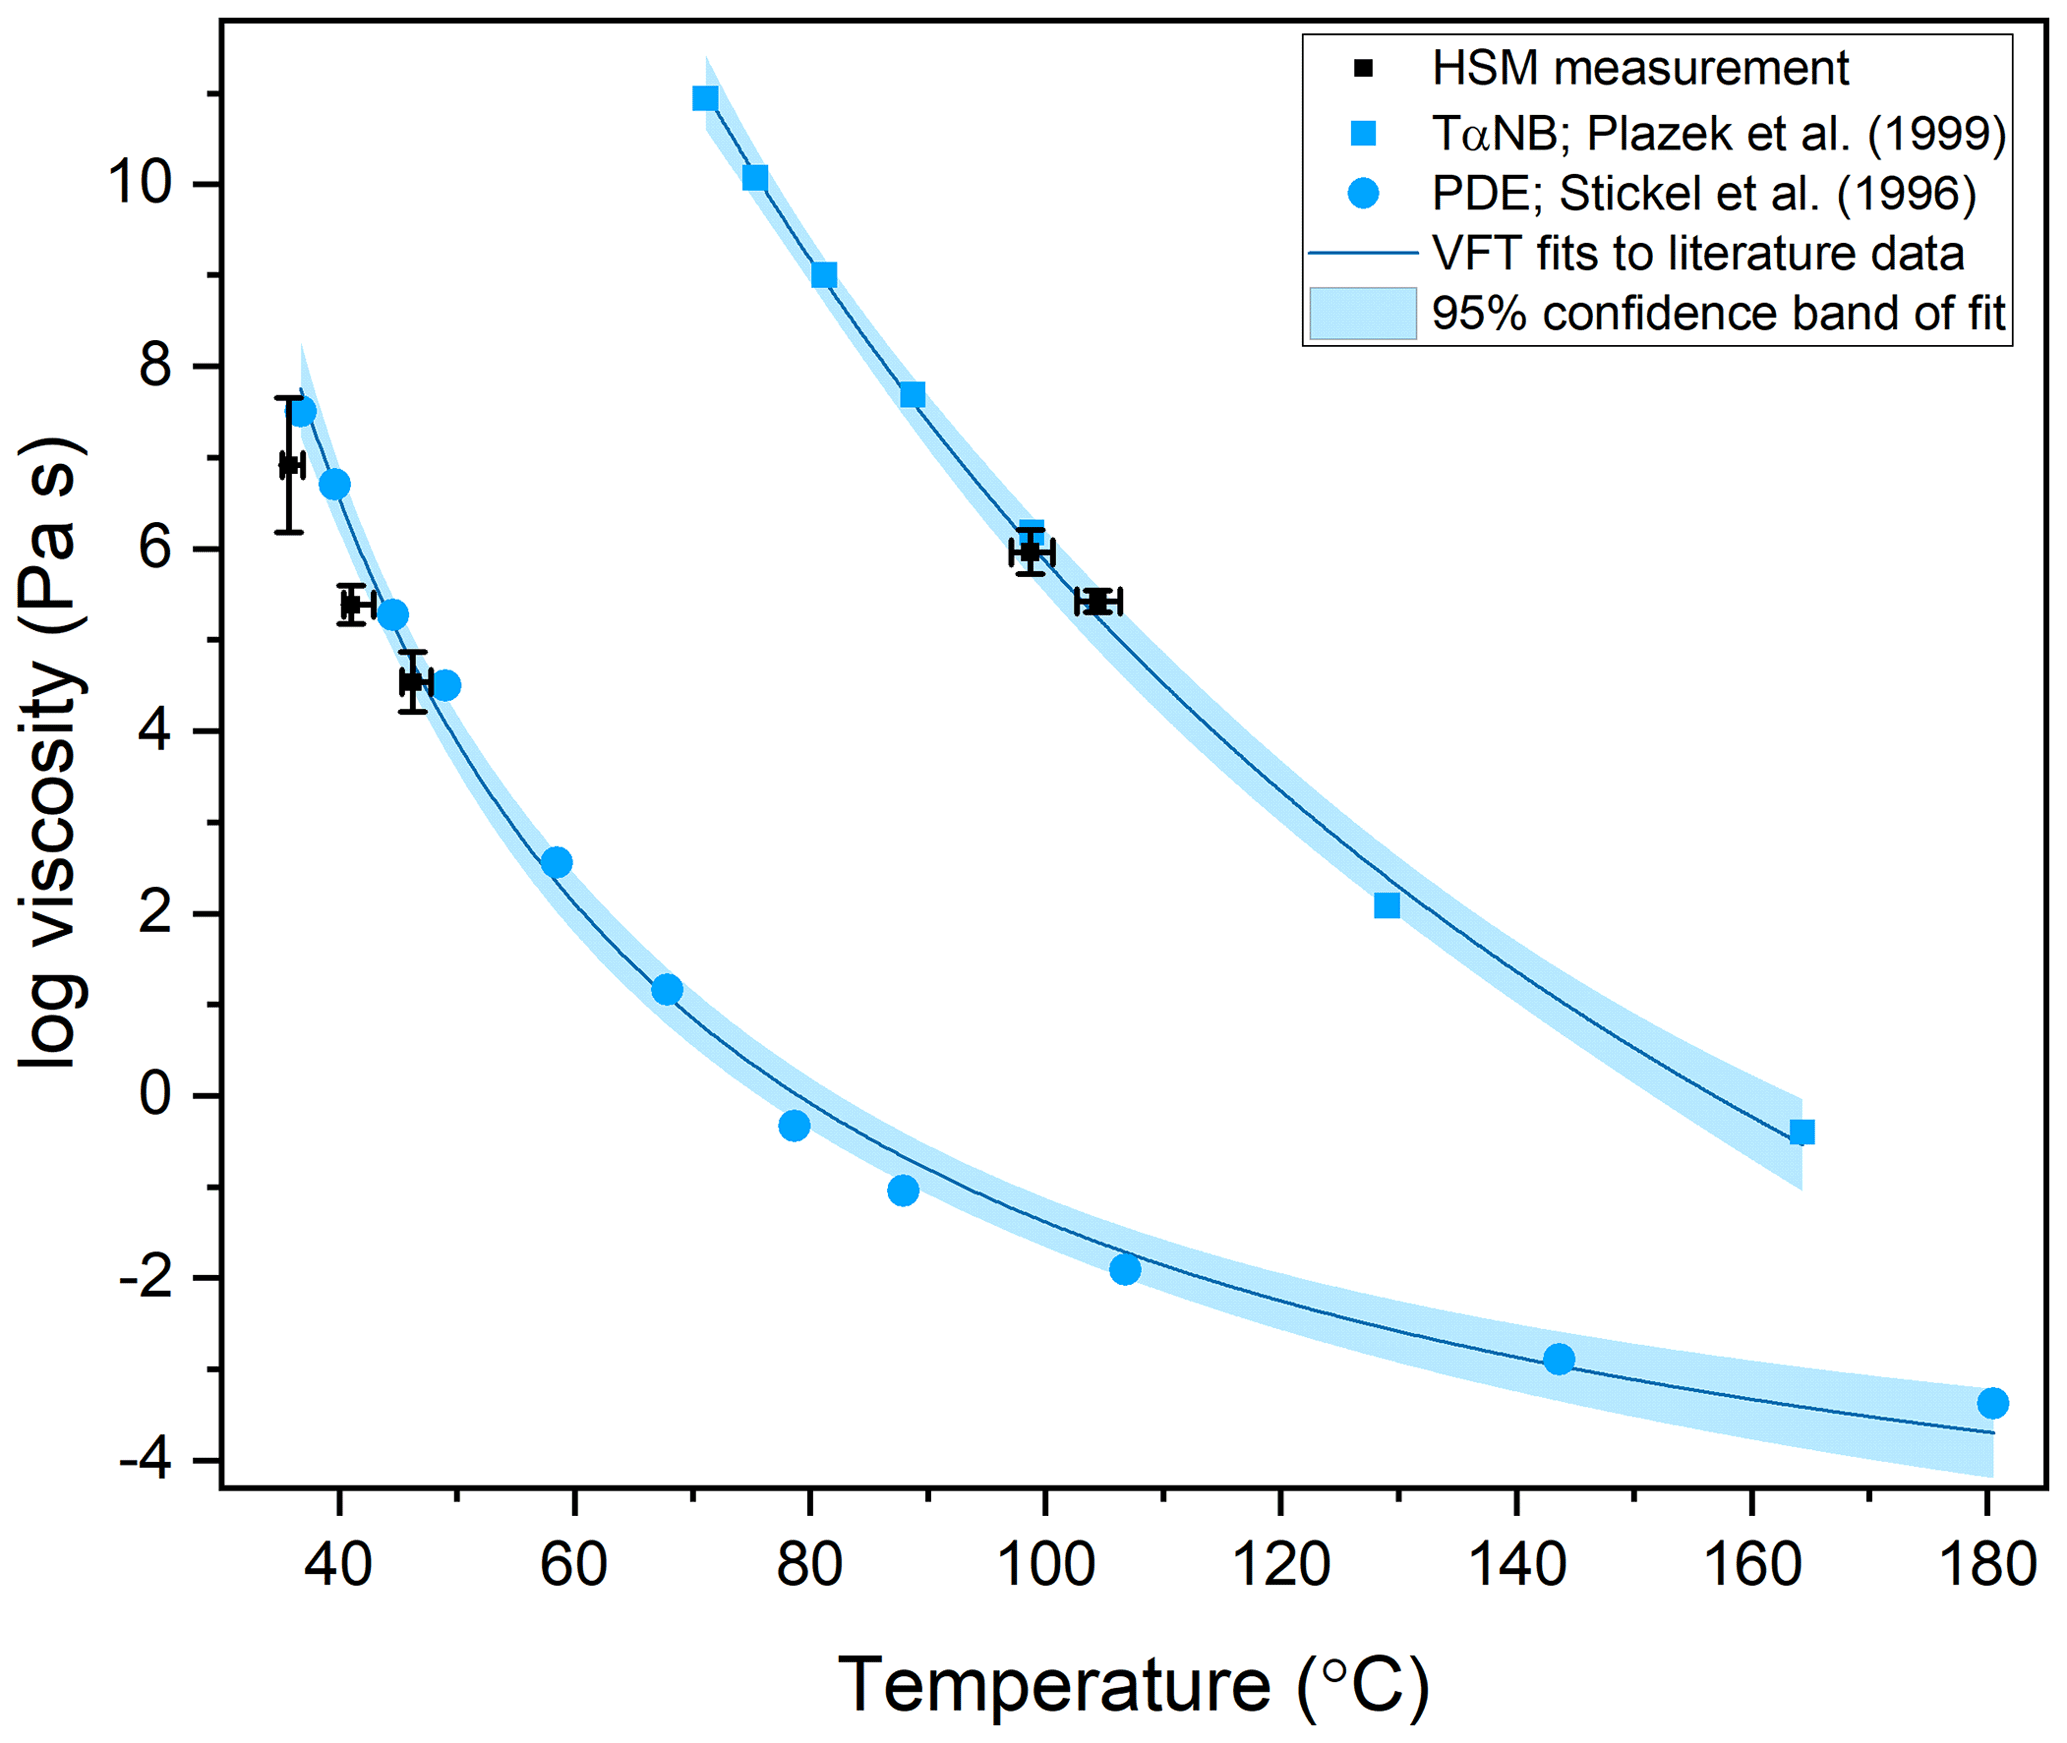
Figure 7The viscosity of TαNB and PDE as a function of temperature. The blue squares are measurements of TαNB from Plazek et al. (1999), and the blue circles are measurements of PDE from Stickel et al. (1996). The blue trend lines are a Vogel–Fulcher–Tammann (VFT) fit to the literature data sets, with the light blue area corresponding to the 95 % confidence band of the fits. The black data points are the midpoint of the upper and lower limits measured with the hot-stage microscopy (HSM) technique. The y-error bars correspond to the calculated upper and lower limits of viscosity from at least two separate experiments. The temperature uncertainty (x error) is a propagation of the uncertainty in the temperature control stage calibration and the largest temperature oscillation during the experiment. Note that for PDE, the x-error bars are asymmetric because the largest temperature oscillation was always toward hotter temperatures.
The measured viscosities of TαNB and PDE were compared to literature values from Plazek et al. (1999) and Stickel et al. (1996) by applying VFT fits to their data, indicated by the blue lines in Fig. 7, with the light blue shading representing the 95 % confidence intervals of the fits. The viscosity measured using our HSM method agrees with the literature values, within the uncertainty of our measurements and the VFT fit to their data, suggesting our approach is valid for determining temperature-dependent viscosities of small samples (<1 mg of material).
The temperature ranges over which we reported viscosities for TαNB and PDE were quite narrow (temperature ranges of 5.8 and 11.0 ∘C, respectively). The upper limit of the temperature range in our experiments is limited by flow becoming so fast that Rmax is reached before the temperature has stabilized (oscillations <2 ∘C) at Texp. At Texp=104.3 ∘C, Rmax is reached in ∼1 min, so the upper-temperature range in our experiments for TαNB is likely only a few degrees warmer. Similarly, for PDE at Texp=46.6 ∘C, Rmax was reached in <45 s. The lower limit of the temperature ranges for TαNB and PDE experiments was restricted, in part because crystallization became dominant at colder temperatures. However, wider temperature ranges should be possible for other amorphous materials where crystallization does not occur.
3.2 Measured viscosity of farnesene SOA material
The viscosity of farnesene SOA material was determined at temperatures of 51.2, 61.5, and 66.6 ∘C. For each experiment, τexp,flow, Rmax, and the upper and lower limits to the viscosities were determined using the observed projected geometry and 2-D fluid dynamics simulations (Table S3). On average, τexp,flow increased with colder temperature: as the temperature decreased by ∼15 ∘C, τexp,flow increased by ∼2 orders of magnitude. At Texp=66.6 ∘C, the temperature was near the upper limit of the measurable temperature range, since τexp,flow was ∼30 s at this temperature. It could be possible to do experiments a couple of degrees warmer, but soon the flow will be so fast that Rmax is reached before the temperature stabilizes (oscillations <2 ∘C) at Texp. On the lower end, we chose Texp=51.2 ∘C for the practical purpose of keeping τexp,flow less than a few hours. In principle, the τexp,flow in our experiments could be as long as multiple days.
The viscosity midpoints determined from the fluid dynamics simulations for farnesene SOA at Texp= 51.2, 61.5, and 66.6 ∘C were 3.1×10⁶, 1.1×10⁵, and 2.6×10⁴ Pa s, respectively (Fig. 8). These viscosities fall between the viscosities of tar pitch (viscosity =108 Pa s) and lard (viscosity =103 Pa s).
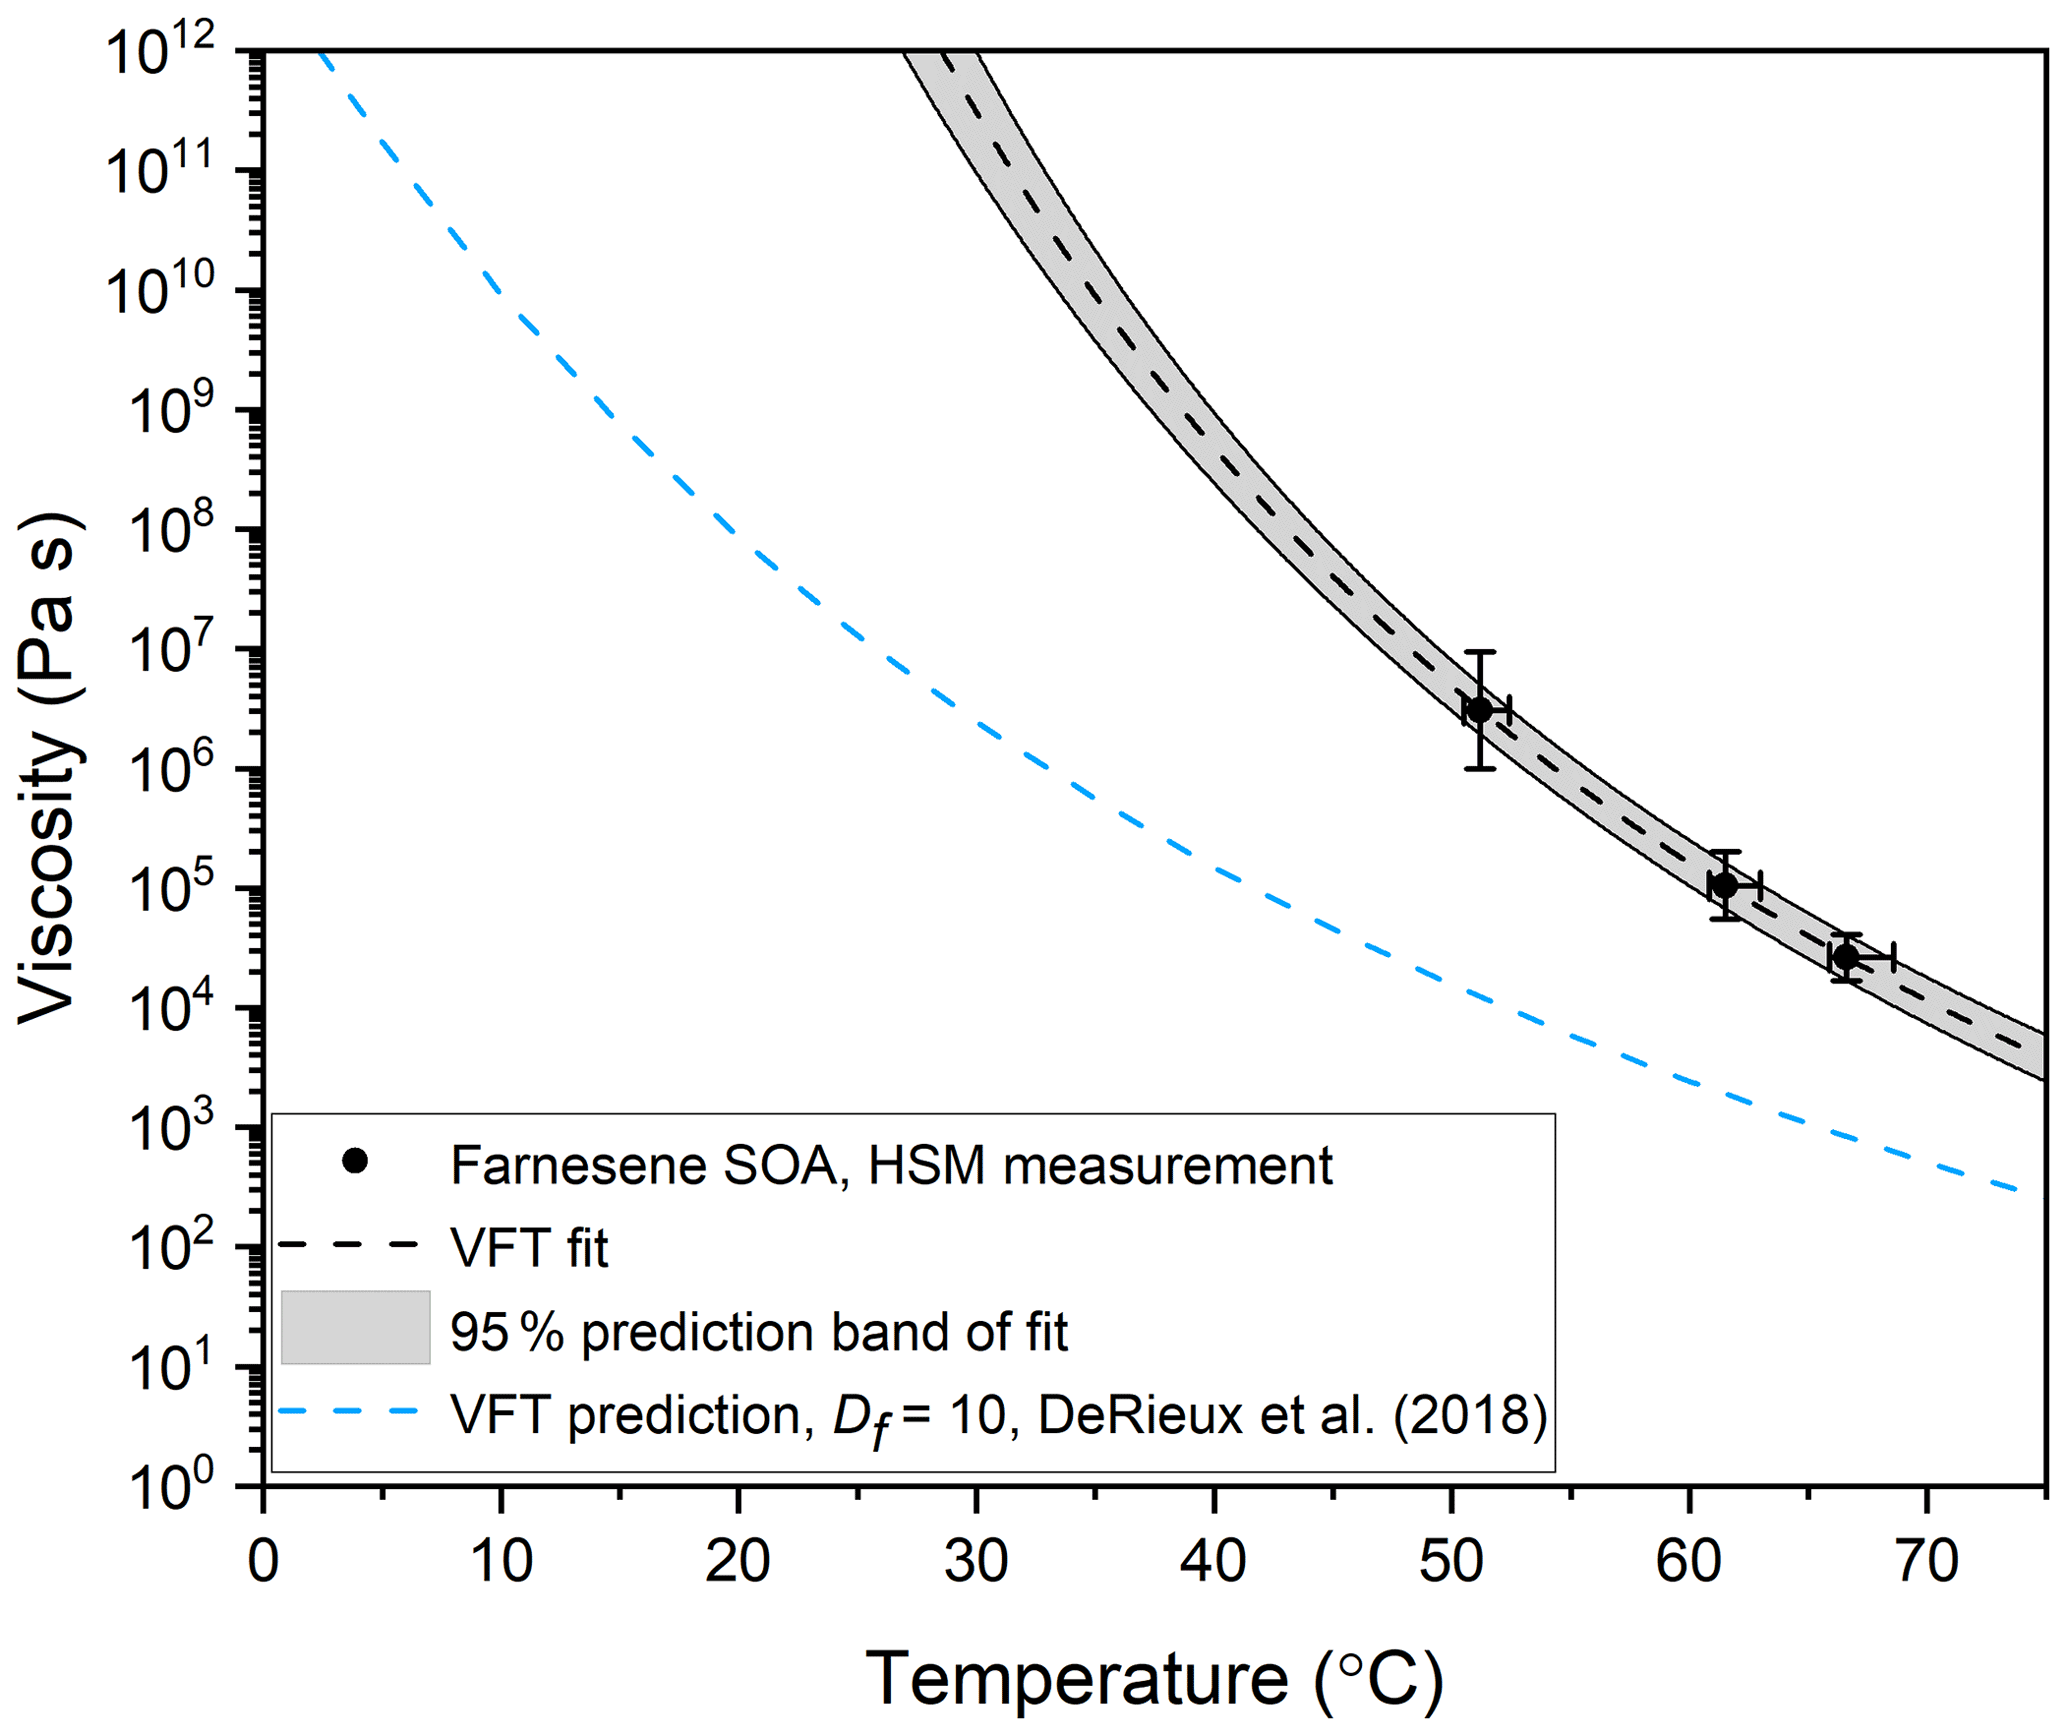
Figure 8Viscosity as a function of temperature for farnesene SOA material. The black data points represent the midpoint of the upper and lower limits of viscosity, measured with hot-stage microscopy (HSM). The y-error bars correspond to the calculated upper and lower limits of viscosity from at least two separate experiments. The temperature uncertainty (x error) is a propagation of the uncertainty in the temperature control stage calibration and the largest temperature oscillation during the experiment. Note that the x-error bars are asymmetric because the largest temperature oscillation was always toward hotter temperatures. The black dotted line is a VFT fit to the HSM measurements, with the grey area representing the 95 % prediction band of the fit. In the VFT fit, Df and T0 were left as free parameters, while A was fixed at −5. This fit was extrapolated to 1012 Pa s, yielding a Tg of 302 K. The blue dashed line is the prediction using the method in DeRieux et al. (2018) with HRMS data and of Df=10, which yields a Tg of 275 K.
3.3 Sensitivity to the geometry assumed in the fluid dynamics simulations
All the viscosity results discussed above were determined using fluid dynamic simulations and a 2-D model to describe the HSM experiments. A 2-D model was used to minimize computation time and because the actual 3-D morphology of the particles was not known. To test if the simulated viscosities were sensitive to the assumed morphology (2-D vs. 3-D), we compared simulations with both 2-D and 3-D geometries for a few experimental conditions. To create a 3-D geometry, the 2-D geometry was expanded into 3-D by using the “extrude” function in COMSOL (e.g. Fig. S4). To determine the extrude depth, we used the conservation of mass. Specifically, we assumed the depth of the extrusion was equal to the particle volume (V) divided by the initial 2-D area (Ai). Ai was measured directly using ImageJ. V was determined from images of the particles after they had flowed and reached an equilibrium geometry, assuming a spherical cap geometry. The difference in simulated viscosity between the 2-D and 3-D simulations was minor (Table S4). Specifically, for TαNB, the upper and lower limits of viscosity calculated using the 3-D geometry fell within the upper and lower limits of the 2-D geometry. For farnesene SOA material, the upper and lower limits of viscosity were equivalent for 2-D and 3-D. Based on the 2-D vs. 3-D results for both TαNB and farnesene SOA material, 2-D simulations were deemed adequate, since there were only minor variations in simulated viscosity and there was a significant amount of saved computation time (∼5 s for each 2-D simulation compared to ∼ 7–45 min for each 3-D simulation).
3.4 Predicted viscosities of farnesene SOA based on chemical composition
The combined mass spectra for farnesene photooxidation SOA in positive and negative mode are shown as a function of neutral mass and normalized to the largest peak in each mode (Fig. S5). The chemical composition of the SOA is discussed in Sect. S7, including a summary of compounds that have been previously identified in the literature (Table S5). Based on the HRMS data and Eq. (3), the glass transition temperature for farnesene SOA was predicted to be Tg=275 K. This value, together with Eqs. (5) and (6), was used to predict the viscosity of farnesene SOA (blue dashed curve in Fig. 8). Assuming a Df value of 10, as done previously, the predicted viscosities were ∼ 1–2 orders of magnitude less than the measured viscosities. This level of disagreement is not surprising considering the uncertainties in the parameterization and the uncertainty in the composition of the SOA material. For example, as shown by Angell (1997), and discussed in Gervasi et al. (2020), the Df value for organics is typically in the range of ∼ 5–30 (Angell, 1997; Gervasi et al., 2020). Furthermore, in-source fragmentation may have occurred for farnesene SOA during the UPLC-PDA-ESI-HRMS analysis. In-source fragmentation could lead to smaller molecular-weight compounds seen in the mass spectra <250 Da and the presence of compounds containing less than 10 carbons (Fig. S6). These lower molecular-weight compounds would lead to lower calculated glass transition temperatures and therefore contribute to an overall lower predicted viscosity than the experimentally determined viscosity values. Future studies are needed in order to confirm if this phenomenon is happening for farnesene SOA.
An alternative approach for interpreting temperature-dependent viscosity data used by Rothfuss and Petters (2017) and Marsh et al. (2018) involves fitting the VFT equation to the temperature-dependent viscosity data to estimate Df, T0, and Tg values for the material (Marsh et al., 2018; Rothfuss and Petters, 2017). In Fig. 8 we follow this approach. The VFT equation was fit to the experimental data with Df and T0 as free parameters, and A fixed at −5 as done previously. Using this approach, we get a Df value of 7.29±0.03, a T0 value of 254.4±0.3 K, and a Tg value of K. The Df value is very similar to the Df value of 7 reported for α-pinene SOA by Petters and Kasparoglu (2020) from temperature-dependent viscosity data (Petters and Kasparoglu, 2020). The Tg value is ∼27 K higher than predicted with the DeRieux et al. (2018) model. However, better closure is not expected due to the uncertainties in the chemical composition of the SOA (see discussion above) and the uncertainties in Tg values (±21 K) predicted by DeRieux et al. (2018).
We have presented the details of a new hot-stage microscopy technique for measuring the temperature-dependent viscosity of samples with small sizes (<1 mg of material). Highly viscous samples were stuck to a flat-tipped needle, heated in a temperature control stage, and imaged with a microscope. When the temperature was increased, the particles flowed to minimize their surface energy. The viscosity was extracted from these images by modelling the flow using fluid dynamics simulations. The current method can be used to provide viscosities in the range of roughly 104 to 108 Pa s at temperatures greater than room temperature. Higher viscosities may be measured if experiments are carried out over multiple days. The technique was validated by reproducing the viscosity of two literature standards: TαNB and PDE. The viscosity of TαNB was measured at temperatures of 98.5 and 104.3 ∘C, while the viscosity of PDE was measured at temperatures of 35.6, 40.9, and 46.6 ∘C. As an application to the study of atmospheric aerosols, the viscosity of farnesene SOA material was measured at 51.2, 61.5, and 66.6 ∘C. The viscosity of farnesene SOA material increased by ∼2 orders of magnitude as the temperature decreased by ∼15 ∘C. We compared our measurements here to the predicted viscosity using HRMS measurements with the DeRieux et al. (2018) parameterization. Using the previously used value of Df=10, the parameterization underpredicted our measurements by ∼ 1–2 orders of magnitude. Considering the uncertainties in composition and uncertainties in the parameterization, this level of disagreement is not surprising. We fit the temperature-dependent data to the VFT equation and obtain a fragility parameter for the material of 7.29±0.03, which is very similar to the fragility parameter of 7 reported for α-pinene SOA by Petters and Kasparoglu (2020). This study illustrates that our new experimental approach for measuring viscosities as a function of temperature provides important data for testing methods used for predicting viscosities of SOA in the atmosphere.
Underlying material and related items for this paper are located in the Supplement.
The supplement related to this article is available online at: https://doi.org/10.5194/amt-15-5545-2022-supplement.
KJK and AKB came up with the idea, methods, and experimental design. KJK performed the calibrations, viscosity measurements, and analysis. KLM designed and wrote the image analysis script. KJK and SX designed the fluid dynamics simulations. NRS and SAN performed the HRMS experiments and analysis. KJK and AKB led the writing of the paper, with contributions from NRS and SAN. All authors gave their final approval for publication.
The contact author has declared that none of the authors has any competing interests.
Publisher's note: Copernicus Publications remains neutral with regard to jurisdictional claims in published maps and institutional affiliations.
This research has been supported by the Natural Sciences and Engineering Research Council of Canada (NSERC; grant no. RGPIN/04441-2016), the US National Science Foundation (grant no. AGS-1853639), and the National Science Foundation (NSF; grant no. CHE-1920242).
This paper was edited by Francis Pope and reviewed by Markus Petters and one anonymous referee.
Alpert, P. A., Dou, J., Corral Arroyo, P., Schneider, F., Xto, J., Luo, B., Peter, T., Huthwelker, T., Borca, C. N., Henzler, K. D., Schaefer, T., Herrmann, H., Raabe, J., Watts, B., Krieger, U. K., and Ammann, M.: Photolytic radical persistence due to anoxia in viscous aerosol particles, Nat. Commun., 12, 1–8, https://doi.org/10.1038/s41467-021-21913-x, 2021.
Angell, C. A.: Relaxation in liquids, polymers and plastic crystals – strong/fragile patterns and problems, J. Non.-Cryst. Solids, 131–133, 13–31, https://doi.org/10.1016/0022-3093(91)90266-9, 1991.
Angell, C. A.: Entropy and fragility in supercooling liquids, J. Res. Natl. Inst. Stan., 102, 171, https://doi.org/10.6028/jres.102.013, 1997.
Angell, C. A.: Liquid fragility and the glass transition in water and aqueous solutions, Chem. Rev., 102, 2627–2650, https://doi.org/10.1021/cr000689q, 2002.
Baudry, J., Charlaix, E., Tonck, A., and Mazuyer, D.: Experimental Evidence for a Large Slip Effect at a Nonwetting Fluid–Solid Interface, Langmuir, 17, 5232–5236, https://doi.org/10.1021/la0009994, 2001.
Bhushan, B., Wang, Y., and Maali, A.: Boundary Slip Study on Hydrophilic, Hydrophobic, and Superhydrophobic Surfaces with Dynamic Atomic Force Microscopy, Langmuir, 25, 8117–8121, https://doi.org/10.1021/la900612s, 2009.
Bodsworth, A., Zobrist, B., and Bertram, A. K.: Inhibition of efflorescence in mixed organic-inorganic particles at temperatures less than 250 K, Phys. Chem. Chem. Phys., 12, 12259–12266, https://doi.org/10.1039/c0cp00572j, 2010.
Bouvier-Brown, N. C., Goldstein, A. H., Gilman, J. B., Kuster, W. C., and de Gouw, J. A.: In-situ ambient quantification of monoterpenes, sesquiterpenes, and related oxygenated compounds during BEARPEX 2007: implications for gas- and particle-phase chemistry, Atmos. Chem. Phys., 9, 5505–5518, https://doi.org/10.5194/acp-9-5505-2009, 2009.
Champion, W. M., Rothfuss, N. E., Petters, M. D., and Grieshop, A. P.: Volatility and Viscosity Are Correlated in Terpene Secondary Organic Aerosol Formed in a Flow Reactor, Environ. Sci. Technol. Lett., 6, 513–519, https://doi.org/10.1021/acs.estlett.9b00412, 2019.
Cho, J. J., Law, B. M., and Rieutord, F.: Dipole-Dependent Slip of Newtonian Liquids at Smooth Solid Hydrophobic Surfaces, Phys. Rev. Lett., 92, 166102, https://doi.org/10.1103/PhysRevLett.92.166102, 2004.
Churaev, N. V, Sobolev, V. D., and Somov, A. N.: Slippage of Liquids over Lyophobic Solid Surfaces, J. Colloid Interf. Sci., 97, 574–581, 1984.
Cottin-Bizonne, C., Jurine, S., Baudry, J., Crassous, J., and Restagno, F.: Nanorheology: An investigation of the boundary condition at hydrophobic and hydrophilic interfaces, Eur. Phys. J. E, 9, 47–53, https://doi.org/10.1140/epje/i2001-10112-9, 2002.
Cottin-Bizonne, C., Cross, B., Steinberger, A., and Charlaix, E.: Boundary Slip on Smooth Hydrophobic Surfaces: Intrinsic Effects and Possible Artifacts, Phys. Rev. Lett., 94, 056102, https://doi.org/10.1103/PhysRevLett.94.056102, 2005.
Craig, V. S. J., Neto, C., and Williams, D. R. M.: Shear-Dependent Boundary Slip in an Aqueous Newtonian Liquid, Phys. Rev. Lett., 87, 054504, https://doi.org/10.1103/PhysRevLett.87.054504, 2001.
Dalton, A. B. and Nizkorodov, S. A.: Photochemical Degradation of 4-Nitrocatechol and 2,4-Dinitrophenol in a Sugar-Glass Secondary Organic Aerosol Surrogate, Environ. Sci. Technol., 55, 14586–14594, https://doi.org/10.1021/acs.est.1c04975, 2021.
Demond, A. H. and Lindner, A. S.: Estimation of interfacial tension between organic liquid mixtures and water, Environ. Sci. Technol., 27, 2318–2331, 1993.
DeRieux, W.-S. W., Li, Y., Lin, P., Laskin, J., Laskin, A., Bertram, A. K., Nizkorodov, S. A., and Shiraiwa, M.: Predicting the glass transition temperature and viscosity of secondary organic material using molecular composition, Atmos. Chem. Phys., 18, 6331–6351, https://doi.org/10.5194/acp-18-6331-2018, 2018.
Ditto, J. C., Joo, T., Khare, P., Sheu, R., Takeuchi, M., Chen, Y., Xu, W., Bui, A. A. T., Sun, Y., Ng, N. L., and Gentner, D. R.: Effects of Molecular-Level Compositional Variability in Organic Aerosol on Phase State and Thermodynamic Mixing Behavior, Environ. Sci. Technol., 53, 13009–13018, https://doi.org/10.1021/acs.est.9b02664, 2019.
Ervens, B., Turpin, B. J., and Weber, R. J.: Secondary organic aerosol formation in cloud droplets and aqueous particles (aqSOA): a review of laboratory, field and model studies, Atmos. Chem. Phys., 11, 11069–11102, https://doi.org/10.5194/acp-11-11069-2011, 2011.
Evoy, E., Maclean, A. M., Rovelli, G., Li, Y., Tsimpidi, A. P., Karydis, V. A., Kamal, S., Lelieveld, J., Shiraiwa, M., Reid, J. P., and Bertram, A. K.: Predictions of diffusion rates of large organic molecules in secondary organic aerosols using the Stokes–Einstein and fractional Stokes–Einstein relations, Atmos. Chem. Phys., 19, 10073–10085, https://doi.org/10.5194/acp-19-10073-2019, 2019.
Evoy, E., Kamal, S., Patey, G. N., Martin, S. T., and Bertram, A. K.: Unified Description of Diffusion Coefficients from Small to Large Molecules in Organic-Water Mixtures, J. Phys. Chem. A, 124, 2301–2308, https://doi.org/10.1021/acs.jpca.9b11271, 2020.
Evoy, E., Kiland, K. J., Huang, Y., Schnitzler, E. G., Maclean, A. M., Kamal, S., Abbatt, J. P. D., and Bertram, A. K.: Diffusion Coefficients and Mixing Times of Organic Molecules in β-Caryophyllene Secondary Organic Aerosol (SOA) and Biomass Burning Organic Aerosol (BBOA), ACS Earth Space Chem., 5, 3268–3278, https://doi.org/10.1021/acsearthspacechem.1c00317, 2021.
Faiola, C. L., Pullinen, I., Buchholz, A., Khalaj, F., Ylisirniö, A., Kari, E., Miettinen, P., Holopainen, J. K., Kivimäenpää, M., Schobesberger, S., Yli-Juuti, T., and Virtanen, A.: Secondary Organic Aerosol Formation from Healthy and Aphid-Stressed Scots Pine Emissions, ACS Earth Space Chem., 3, 1756–1772, https://doi.org/10.1021/acsearthspacechem.9b00118, 2019.
Fard, M. M., Krieger, U. K., and Peter, T.: Kinetic Limitation to Inorganic Ion Diffusivity and to Coalescence of Inorganic Inclusions in Viscous Liquid-Liquid Phase-Separated Particles, J. Phys. Chem. A, 121, 9284–9296, https://doi.org/10.1021/acs.jpca.7b05242, 2017.
Fitzgerald, C., Hosny, N. A., Tong, H., Seville, P. C., Gallimore, P. J., Davidson, N. M., Athanasiadis, A., Botchway, S. W., Ward, A. D., Kalberer, M., Kuimova, M. K., and Pope, F. D.: Fluorescence lifetime imaging of optically levitated aerosol: A technique to quantitatively map the viscosity of suspended aerosol particles, Phys. Chem. Chem. Phys., 18, 21710–21719, https://doi.org/10.1039/c6cp03674k, 2016.
Fowler, K., Connolly, P., and Topping, D.: Modelling the effect of condensed-phase diffusion on the homogeneous nucleation of ice in ultra-viscous particles, Atmos. Chem. Phys., 20, 683–698, https://doi.org/10.5194/acp-20-683-2020, 2020.
Friedman, C. L., Pierce, J. R., and Selin, N. E.: Assessing the influence of secondary organic versus primary carbonaceous aerosols on long-range atmospheric polycyclic aromatic hydrocarbon transport, Environ. Sci. Technol., 48, 3293–3302, https://doi.org/10.1021/es405219r, 2014.
Fulcher, G. S.: Analysis of Recent Measurements of the Viscosity of Glasses, J. Am. Ceram. Soc., 8, 339–355, https://doi.org/10.1111/j.1151-2916.1992.tb05536.x, 1925.
Garcia-Valles, M., Hafez, H. S., Cruz-Matías, I., Vergés, E., Aly, M. H., Nogués, J., Ayala, D., and Martínez, S.: Calculation of viscosity-temperature curves for glass obtained from four wastewater treatment plants in Egypt, J. Therm. Anal. Calorim., 111, 107–114, https://doi.org/10.1007/s10973-012-2232-7, 2013.
Geron, C. D. and Arnts, R. R.: Seasonal monoterpene and sesquiterpene emissions from Pinus taeda and Pinus virginiana, Atmos. Environ., 44, 4240–4251, https://doi.org/10.1016/j.atmosenv.2010.06.054, 2010.
Gervasi, N. R., Topping, D. O., and Zuend, A.: A predictive group-contribution model for the viscosity of aqueous organic aerosol, Atmos. Chem. Phys., 20, 2987–3008, https://doi.org/10.5194/acp-20-2987-2020, 2020.
Gordan, J. M. and Taylor, J. S.: Ideal Copolymers and the Second-Order Transition of Synthetic Rubbers, Appl. Chem., 2, 493–500, 1952.
Gorkowski, K., Donahue, N. M., and Sullivan, R. C.: Aerosol Optical Tweezers Constrain the Morphology Evolution of Liquid-Liquid Phase-Separated Atmospheric Particles, Chem, 6, 204–220, https://doi.org/10.1016/j.chempr.2019.10.018, 2020.
Gray Bé, A., Upshur, M. A., Liu, P., Martin, S. T., Geiger, F. M., and Thomson, R. J.: Cloud Activation Potentials for Atmospheric α-Pinene and β-Caryophyllene Ozonolysis Products, ACS Cent. Sci., 3, 715–725, https://doi.org/10.1021/acscentsci.7b00112, 2017.
Gržinić, G., Bartels-Rausch, T., Berkemeier, T., Türler, A., and Ammann, M.: Viscosity controls humidity dependence of N2O5 uptake to citric acid aerosol, Atmos. Chem. Phys., 15, 13615–13625, https://doi.org/10.5194/acp-15-13615-2015, 2015.
Hallquist, M., Wenger, J. C., Baltensperger, U., Rudich, Y., Simpson, D., Claeys, M., Dommen, J., Donahue, N. M., George, C., Goldstein, A. H., Hamilton, J. F., Herrmann, H., Hoffmann, T., Iinuma, Y., Jang, M., Jenkin, M. E., Jimenez, J. L., Kiendler-Scharr, A., Maenhaut, W., McFiggans, G., Mentel, Th. F., Monod, A., Prévôt, A. S. H., Seinfeld, J. H., Surratt, J. D., Szmigielski, R., and Wildt, J.: The formation, properties and impact of secondary organic aerosol: current and emerging issues, Atmos. Chem. Phys., 9, 5155–5236, https://doi.org/10.5194/acp-9-5155-2009, 2009.
Han, Y. M., Gong, Z. H., Ye, J. H., Liu, P. F., McKinney, K. A., and Martin, S. T.: Quantifying the Role of the Relative Humidity-Dependent Physical State of Organic Particulate Matter in the Uptake of Semivolatile Organic Molecules, Environ. Sci. Technol., 53, 13209–13218, https://doi.org/10.1021/acs.est.9b05354, 2019.
Helmig, D., Ortega, J., Guenther, A., Herrick, J. D., and Geron, C.: Sesquiterpene emissions from loblolly pine and their potential contribution to biogenic aerosol formation in the Southeastern US, Atmos. Environ., 40, 4150–4157, https://doi.org/10.1016/j.atmosenv.2006.02.035, 2006.
Hritz, A. D., Raymond, T. M., and Dutcher, D. D.: A method for the direct measurement of surface tension of collected atmospherically relevant aerosol particles using atomic force microscopy, Atmos. Chem. Phys., 16, 9761–9769, https://doi.org/10.5194/acp-16-9761-2016, 2016.
Ignatius, K., Kristensen, T. B., Järvinen, E., Nichman, L., Fuchs, C., Gordon, H., Herenz, P., Hoyle, C. R., Duplissy, J., Garimella, S., Dias, A., Frege, C., Höppel, N., Tröstl, J., Wagner, R., Yan, C., Amorim, A., Baltensperger, U., Curtius, J., Donahue, N. M., Gallagher, M. W., Kirkby, J., Kulmala, M., Möhler, O., Saathoff, H., Schnaiter, M., Tomé, A., Virtanen, A., Worsnop, D., and Stratmann, F.: Heterogeneous ice nucleation of viscous secondary organic aerosol produced from ozonolysis of α-pinene, Atmos. Chem. Phys., 16, 6495–6509, https://doi.org/10.5194/acp-16-6495-2016, 2016.
Ingram, S., Rovelli, G., Song, Y. C., Topping, D., Dutcher, C. S., Liu, S. H., Nandy, L., Shiraiwa, M. and Reid, J. P.: Accurate Prediction of Organic Aerosol Evaporation Using Kinetic Multilayer Modeling and the Stokes-Einstein Equation, J. Phys. Chem. A, 125, 3444–3456, https://doi.org/10.1021/acs.jpca.1c00986, 2021.
Jaoui, M., Kleindienst, T. E., Docherty, K. S., Lewandowski, M., and Offenberg, J. H.: Secondary organic aerosol formation from the oxidation of a series of sesquiterpenes: α-cedrene, β-caryophyllene, α-humulene and α-farnesene with O3, OH and NO3 radicals, Environ. Chem., 10, 178–193, https://doi.org/10.1071/EN13025, 2013.
Järvinen, E., Ignatius, K., Nichman, L., Kristensen, T. B., Fuchs, C., Hoyle, C. R., Höppel, N., Corbin, J. C., Craven, J., Duplissy, J., Ehrhart, S., El Haddad, I., Frege, C., Gordon, H., Jokinen, T., Kallinger, P., Kirkby, J., Kiselev, A., Naumann, K.-H., Petäjä, T., Pinterich, T., Prevot, A. S. H., Saathoff, H., Schiebel, T., Sengupta, K., Simon, M., Slowik, J. G., Tröstl, J., Virtanen, A., Vochezer, P., Vogt, S., Wagner, A. C., Wagner, R., Williamson, C., Winkler, P. M., Yan, C., Baltensperger, U., Donahue, N. M., Flagan, R. C., Gallagher, M., Hansel, A., Kulmala, M., Stratmann, F., Worsnop, D. R., Möhler, O., Leisner, T., and Schnaiter, M.: Observation of viscosity transition in α-pinene secondary organic aerosol, Atmos. Chem. Phys., 16, 4423–4438, https://doi.org/10.5194/acp-16-4423-2016, 2016.
Ji, Z. R., Zhang, Y., Pang, S. F., and Zhang, Y. H.: Crystal Nucleation and Crystal Growth and Mass Transfer in Internally Mixed Sucrose/NaNO3 Particles, J. Phys. Chem. A, 121, 7968–7975, https://doi.org/10.1021/acs.jpca.7b08004, 2017.
Jimenez, J. L., Canagaratna, M. R., Donahue, N. M., Prevot, A. S. H., Zhang, Q., Kroll, J. H., DeCarlo, P. F., Allan, J. D., Coe, H., Ng, N. L., Aiken, A. C., Docherty, K. S., Ulbrich, I. M., Grieshop, A. P., Robinson, A. L., Duplissy, J., Smith, J. D., Wilson, K. R., Lanz, V. A., Hueglin, C., Sun, Y. L., Tian, J., Laaksonen, A., Raatikainen, T., Rautiainen, J., Vaattovaara, P., Ehn, M., Kulmala, M., Tomlinson, J. M., Collins, D. R., Cubison, M. J., Dunlea, E. J., Huffman, J. A., Onasch, T. B., Alfarra, M. R., Williams, P. I., Bower, K., Kondo, Y., Schneider, J., Drewnick, F., Borrmann, S., Weimer, S., Demerjian, K., Salcedo, D., Cottrell, L., Griffin, R., Takami, A., Miyoshi, T., Hatakeyama, S., Shimono, A., Sun, J. Y., Zhang, Y. M., Dzepina, K., Kimmel, J. R., Sueper, D., Jayne, J. T., Herndon, S. C., Trimborn, A. M., Williams, L. R., Wood, E. C., Middlebrook, A. M., Kolb, C. E., Baltensperger, U., and Worsnop, D. R.: Evolution of organic aerosols in the atmosphere, Science, 326, 1525–1529, https://doi.org/10.1126/science.1180353, 2009.
Jing, D. and Bhushan, B.: Boundary Slip of Superoleophilic, Oleophobic, and Superoleophobic Surfaces Immersed in Deionized Water, Hexadecane, and Ethylene Glycol, Langmuir, 29, 14691–14700, https://doi.org/10.1021/la4030876, 2013.
Joseph, P. and Tabeling, P.: Direct measurement of the apparent slip length, Phys. Rev. E, 71, 035303, https://doi.org/10.1103/PhysRevE.71.035303, 2005.
Keyte, I. J., Harrison, R. M., and Lammel, G.: Chemical reactivity and long-range transport potential of polycyclic aromatic hydrocarbons – a review, Chem. Soc. Rev., 42, 9333–9391, https://doi.org/10.1039/c3cs60147a, 2013.
Kim, Y., Sartelet, K., and Couvidat, F.: Modeling the effect of non-ideality, dynamic mass transfer and viscosity on SOA formation in a 3-D air quality model, Atmos. Chem. Phys., 19, 1241–1261, https://doi.org/10.5194/acp-19-1241-2019, 2019.
Ladino, L. A., Zhou, S., Yakobi-Hancock, J. D., Aljawhary, D., and Abbatt, J. P. D.: Factors controlling the ice nucleating abilities of α-pinene SOA particles, J. Geophys. Res., 119, 9041–9051, https://doi.org/10.1002/2014JD021578, 2014.
Lata, N. N., Zhang, B., Schum, S., Mazzoleni, L., Brimberry, R., Marcus, M. A., Cantrell, W. H., Fialho, P., Mazzoleni, C., and China, S.: Aerosol Composition, Mixing State, and Phase State of Free Tropospheric Particles and Their Role in Ice Cloud Formation, ACS Earth Space Chem., 5, 3499–3510, https://doi.org/10.1021/acsearthspacechem.1c00315, 2021.
Lee, H. D. and Tivanski, A. V: Atomic Force Microscopy: An Emerging Tool in Measuring the Phase State and Surface Tension of Individual Aerosol Particles, in: Annual Review of Physical Chemistry, edited by: Johnson, M. A. and Martinez, T. J., 72, 235–252, 2021.
Lee, H. D., Morris, H. S., Laskina, O., Sultana, C. M., Lee, C., Jayarathne, T., Cox, J. L., Wang, X. F., Hasenecz, E. S., DeMott, P. J., Bertram, T. H., Cappa, C. D., Stone, E. A., Prather, K. A., Grassian, V. H., and Tivanski, A. V: Organic Enrichment, Physical Phase State, and Surface Tension Depression of Nascent Core-Shell Sea Spray Aerosols during Two Phytoplankton Blooms, ACS Earth Space Chem., 4, 650–660, https://doi.org/10.1021/acsearthspacechem.0c00032, 2020.
Lelieveld, J., Evans, J. S., Fnais, M., Giannadaki, D., and Pozzer, A.: The contribution of outdoor air pollution sources to premature mortality on a global scale, Nature, 525, 367–371, https://doi.org/10.1038/nature15371, 2015.
Li, J. and Knopf, D. A.: Representation of Multiphase OH Oxidation of Amorphous Organic Aerosol for Tropospheric Conditions, Environ. Sci. Technol., 55, 7266–7275, https://doi.org/10.1021/acs.est.0c07668, 2021.
Li, L. Y. and Xie, S. D.: Historical variations of biogenic volatile organic compound emission inventories in China, 1981–2003, Atmos. Environ., 95, 185–196, https://doi.org/10.1016/j.atmosenv.2014.06.033, 2014.
Li, W. J., Teng, X. M., Chen, X. Y., Liu, L., Xu, L., Zhang, J., Wang, Y. Y., Zhang, Y., and Shi, Z. B.: Organic Coating Reduces Hygroscopic Growth of Phase-Separated Aerosol Particles, Environ. Sci. Technol., 55, 16339–16346, https://doi.org/10.1021/acs.est.1c05901, 2021.
Logozzo, A. and Preston, T. C.: Temperature-Controlled Dual-Beam Optical Trap for Single Particle Studies of Organic Aerosol, J. Phys. Chem. A, 126, 109–118, https://doi.org/10.1021/acs.jpca.1c09363, 2022.
Maclean, A. M., Li, Y., Crescenzo, G. V., Smith, N. R., Karydis, V. A., Tsimpidi, A. P., Butenhoff, C. L., Faiola, C. L., Lelieveld, J., Nizkorodov, S. A., Shiraiwa, M., and Bertram, A. K.: Global Distribution of the Phase State and Mixing Times within Secondary Organic Aerosol Particles in the Troposphere Based on Room-Temperature Viscosity Measurements, ACS Earth Space Chem., 5, 3458–3473, https://doi.org/10.1021/acsearthspacechem.1c00296, 2021a.
Maclean, A. M., Smith, N. R., Li, Y., Huang, Y., Hettiyadura, A. P. S., Crescenzo, G. V., Shiraiwa, M., Laskin, A., Nizkorodov, S. A., and Bertram, A. K.: Humidity-Dependent Viscosity of Secondary Organic Aerosol from Ozonolysis of β-Caryophyllene: Measurements, Predictions, and Implications, ACS Earth Space Chem., 5, 305–318, https://doi.org/10.1021/acsearthspacechem.0c00296, 2021b.
Madawala, C. K., Lee, H. D., Kaluarachchi, C. P., and Tivanski, A. V: Probing the Water Uptake and Phase State of Individual Sucrose Nanoparticles Using Atomic Force Microscopy, ACS Earth Space Chem., 5, 2612–2620, https://doi.org/10.1021/acsearthspacechem.1c00101, 2021.
Magill, J. H. and Plazek, D. J.: Physical Properties of Aromatic Hydrocarbons. II. Solidification Behavior of 1,3,5-Tri-a-Naphthylbenzene, J. Cryst. Growth, 46, 3757–3769, https://doi.org/10.1016/0022-0248(73)90127-9, 1967.
Marcolli, C., Luo, B., and Peter, T.: Mixing of the Organic Aerosol Fractions: Liquids as the Thermodynamically Stable Phases, J. Phys. Chem. A, 108, 2216–2224, https://doi.org/10.1021/jp036080l, 2004.
Marsh, A., Petters, S. S., Rothfuss, N. E., Rovelli, G., Song, Y. C., Reid, J. P., and Petters, M. D.: Amorphous phase state diagrams and viscosity of ternary aqueous organic/organic and inorganic/organic mixtures, Phys. Chem. Chem. Phys., 20, 15086–15097, https://doi.org/10.1039/c8cp00760h, 2018.
Marshall, F. H., Miles, R. E. H., Song, Y. C., Ohm, P. B., Power, R. M., Reid, J. P., and Dutcher, C. S.: Diffusion and reactivity in ultraviscous aerosol and the correlation with particle viscosity, Chem. Sci., 7, 1298–1308, https://doi.org/10.1039/c5sc03223g, 2016.
Masson-Delmotte, V., Zhai, P., Pirani, A., Connors, S. L., Péan, C., Berger, S., Caud, N., Chen, Y., Goldfarb, L., Gomis, M. I., Huang, M., Leitzell, K., Lonnoy, E., Matthews, J. B. R., Maycock, T. K., Waterfield, T., Yelekçi, O., Yu, R., and Zhou, B. (Eds.): IPCC: Climate Change 2021: The Physical Science Basis, Cambridge University Press, Cambridge, United Kingdom and New York, NY, USA, 3–32, 2021.
Mcbride, S. P. and Law, B. M.: Viscosity-dependent liquid slip at molecularly smooth hydrophobic surfaces, Phys. Rev. E, 80, 060601, https://doi.org/10.1103/PhysRevE.80.060601, 2009.
McNeill, V. F.: Aqueous organic chemistry in the atmosphere: Sources and chemical processing of organic aerosols, Environ. Sci. Technol., 49, 1237–1244, https://doi.org/10.1021/es5043707, 2015.
Mentel, Th. F., Kleist, E., Andres, S., Dal Maso, M., Hohaus, T., Kiendler-Scharr, A., Rudich, Y., Springer, M., Tillmann, R., Uerlings, R., Wahner, A., and Wildt, J.: Secondary aerosol formation from stress-induced biogenic emissions and possible climate feedbacks, Atmos. Chem. Phys., 13, 8755–8770, https://doi.org/10.5194/acp-13-8755-2013, 2013.
Mu, Q., Shiraiwa, M., Octaviani, M., Ma, N., Ding, A., Su, H., Lammel, G., Pöschl, U., and Cheng, Y.: Temperature effect on phase state and reactivity controls atmospheric multiphase chemistry and transport of PAHs, Science Advances, 4, eaap7314, https://doi.org/10.1126/sciadv.aap7314, 2018.
Murray, B. J.: Inhibition of ice crystallisation in highly viscous aqueous organic acid droplets, Atmos. Chem. Phys., 8, 5423–5433, https://doi.org/10.5194/acp-8-5423-2008, 2008.
Murray, B. J., Wilson, T. W., Dobbie, S., Cui, Z., Al-Jumur, S. M. R. K., Möhler, O., Schnaiter, M., Wagner, R., Benz, S., Niemand, M., Saathoff, H., Ebert, V., Wagner, S., and Kärcher, B.: Heterogeneous nucleation of ice particles on glassy aerosols under cirrus conditions, Nat. Geosci., 3, 233–237, https://doi.org/10.1038/ngeo817, 2010.
Myhre, G., Myhre, C. E. L., Samset, B. H., and Storelvmo, T.: Aerosols and their Relation to Global Climate and Climate Sensitivity, Nature Education Knowledge, https://www.nature.com/scitable/knowledge/library/aerosols-and-their-relation-to-global-climate-102215345/ (last access: 20 September 2022), 2013.
Nel, A.: Air Pollution-Related Illness: Effects of Particles, Science, 308, 804–806, https://doi.org/10.1126/science.1108752, 2005.
Pascual, M. J., Pascual, L., and Durán, A.: Determination of the Viscosity-Temperature Curve for Glasses on the Basis of Fixed Viscosity Points Determined by Hot Stage Microscopy, Phys. Chem. Glasess, 42, 61–66, 2001.
Pascual, M. J., Durán, A., and Prado, M. O.: A new method for determining fixed viscosity points of glasses, Phys. Chem. Glasess, 46, 512–520, 2005.
Petters, M. and Kasparoglu, S.: Predicting the influence of particle size on the glass transition temperature and viscosity of secondary organic material, Scientific Reports, 10, 15170, https://doi.org/10.1038/s41598-020-71490-0, 2020.
Petters, S. S., Kreidenweis, S. M., Grieshop, A. P., Ziemann, P. J., and Petters, M. D.: Temperature- and Humidity-Dependent Phase States of Secondary Organic Aerosols, Geophys. Res. Lett., 46, 1005–1013, https://doi.org/10.1029/2018GL080563, 2019.
Plazek, D. J. and Magill, J. H.: Physical Properties of Aromatic Hydrocarbons. I. Viscous and Viscoelastic Behavior of 1:3:5-Tri-α-Naphthyl Benzene, J. Cryst. Growth, 45, 3038–3050, https://doi.org/10.1063/1.1728059, 1966.
Plazek, D. J., Magill, J. H., Echeverria, I. and Chay, I.: Viscoelastic behavior of 1,3,5 tri α-napthyl benzene (will the real TαNB please stand up), J. Chem. Phys., 10445(December 1998), 1999.
Pope, C. A. and Dockery, D. W.: Health effects of fine particulate air pollution: Lines that connect, J. Air Waste Manage., 56, 709–742, https://doi.org/10.1080/10473289.2006.10464485, 2006.
Porter, W. C., Jimenez, J. L., and Barsanti, K. C.: Quantifying Atmospheric Parameter Ranges for Ambient Secondary Organic Aerosol Formation, ACS Earth Space Chem., 5, 2380–2397, https://doi.org/10.1021/acsearthspacechem.1c00090, 2021.
Pratap, V., Chen, Y., Yao, G. M., and Nakao, S.: Temperature effects on multiphase reactions of organic molecular markers: A modeling study, Atmos. Environ., 179, 40–48, https://doi.org/10.1016/j.atmosenv.2018.02.009, 2018.
Price, H. C., Mattsson, J., and Murray, B. J.: Sucrose diffusion in aqueous solution, Phys. Chem. Chem. Phys., 18, 19207–19216, https://doi.org/10.1039/C6CP03238A, 2016.
Qin, Y., Ye, J., Ohno, P., Nah, T., and Martin, S. T.: Temperature-dependent viscosity of organic materials characterized by atomic force microscope, Atmosphere, 12, 1476, https://doi.org/10.3390/atmos12111476, 2021.
Reid, J. P., Bertram, A. K., Topping, D. O., Laskin, A., Martin, S. T., Petters, M. D., Pope, F. D., and Rovelli, G.: The viscosity of atmospherically relevant organic particles, Nat. Commun., 9, 956, https://doi.org/10.1038/s41467-018-03027-z, 2018.
Riva, M., Chen, Y., Zhang, Y., Lei, Z., Olson, N. E., Boyer, H. C., Narayan, S., Yee, L. D., Green, H. S., Cui, T., Zhang, Z., Baumann, K., Fort, M., Edgerton, E., Budisulistiorini, S. H., Rose, C. A., Ribeiro, I. O., Oliveira, R. L. E., Dos Santos, E. O., Machado, C. M. D., Szopa, S., Zhao, Y., Alves, E. G., De Sá, S. S., Hu, W., Knipping, E. M., Shaw, S. L., Duvoisin Junior, S., De Souza, R. A. F., Palm, B. B., Jimenez, J. L., Glasius, M., Goldstein, A. H., Pye, H. O. T., Gold, A., Turpin, B. J., Vizuete, W., Martin, S. T., Thornton, J. A., Dutcher, C. S., Ault, A. P., and Surratt, J. D.: Increasing Isoprene Epoxydiol-to-Inorganic Sulfate Aerosol Ratio Results in Extensive Conversion of Inorganic Sulfate to Organosulfur Forms: Implications for Aerosol Physicochemical Properties, Environ. Sci. Technol., 53, 8682–8694, https://doi.org/10.1021/acs.est.9b01019, 2019.
Rothfuss, N. E. and Petters, M. D.: Characterization of the temperature and humidity-dependent phase diagram of amorphous nanoscale organic aerosols, Phys. Chem. Chem. Phys., 19, 6532–6545, https://doi.org/10.1039/C6CP08593H, 2017.
Schmedding, R., Rasool, Q. Z., Zhang, Y., Pye, H. O. T., Zhang, H., Chen, Y., Surratt, J. D., Lopez-Hilfiker, F. D., Thornton, J. A., Goldstein, A. H., and Vizuete, W.: Predicting secondary organic aerosol phase state and viscosity and its effect on multiphase chemistry in a regional-scale air quality model, Atmos. Chem. Phys., 20, 8201–8225, https://doi.org/10.5194/acp-20-8201-2020, 2020.
Scholze, H.: The influence of viscosity and surface tension on the hot-stage microscope measurements of glasses, Reports Ger. Ceram. Soc., 30, 63–68, 1962.
Schum, S. K., Zhang, B., Džepina, K., Fialho, P., Mazzoleni, C., and Mazzoleni, L. R.: Molecular and physical characteristics of aerosol at a remote free troposphere site: implications for atmospheric aging, Atmos. Chem. Phys., 18, 14017–14036, https://doi.org/10.5194/acp-18-14017-2018, 2018.
Shiraiwa, M. and Seinfeld, J. H.: Equilibration timescale of atmospheric secondary organic aerosol partitioning, Geophys. Res. Lett., 39, L24801, https://doi.org/10.1029/2012GL054008, 2012.
Shiraiwa, M., Ammann, M., Koop, T., and Pöschl, U.: Gas uptake and chemical aging of semisolid organic aerosol particles, P. Natl. Acad. Sci. USA, 108, 11003–11008, https://doi.org/10.1073/pnas.1103045108, 2011.
Shiraiwa, M., Yee, L. D., Schilling, K. A., Loza, C. L., Craven, J. S., Zuend, A., Ziemann, P. J., and Seinfeld, J. H.: Size distribution dynamics reveal particle-phase chemistry in organic aerosol formation, P. Natl. Acad. Sci. USA, 110, 11746–11750, https://doi.org/10.1073/pnas.1307501110, 2013.
Shiraiwa, M., Ueda, K., Pozzer, A., Lammel, G., Kampf, C. J., Fushimi, A., Enami, S., Arangio, A. M., Fröhlich-Nowoisky, J., Fujitani, Y., Furuyama, A., Lakey, P. S. J., Lelieveld, J., Lucas, K., Morino, Y., Pöschl, U., Takahama, S., Takami, A., Tong, H., Weber, B., Yoshino, A., and Sato, K.: Aerosol Health Effects from Molecular to Global Scales, Environ. Sci. Technol., 51, 13545–13567, https://doi.org/10.1021/acs.est.7b04417, 2017a.
Shiraiwa, M., Li, Y., Tsimpidi, A. P., Karydis, V. A., Berkemeier, T., Pandis, S. N., Lelieveld, J., Koop, T., and Pöschl, U.: Global distribution of particle phase state in atmospheric secondary organic aerosols, Nat. Commun., 8, 15002, https://doi.org/10.1038/ncomms15002, 2017b.
Shrivastava, M., Lou, S., Zelenyuk, A., Easter, R. C., Corley, R. A., Thrall, B. D., Rasch, P. J., Fast, J. D., Massey Simonich, S. L., Shen, H., and Tao, S.: Global long-range transport and lung cancer risk from polycyclic aromatic hydrocarbons shielded by coatings of organic aerosol, P. Natl. Acad. Sci. USA, 114, 1246–1251, https://doi.org/10.1073/pnas.1618475114, 2017.
Slade, J. H., Ault, A. P., Bui, A. T., Ditto, J. C., Lei, Z., Bondy, A. L., Olson, N. E., Cook, R. D., Desrochers, S. J., Harvey, R. M., Erickson, M. H., Wallace, H. W., Alvarez, S. L., Flynn, J. H., Boor, B. E., Petrucci, G. A., Gentner, D. R., Griffin, R. J., and Shepson, P. B.: Bouncier Particles at Night: Biogenic Secondary Organic Aerosol Chemistry and Sulfate Drive Diel Variations in the Aerosol Phase in a Mixed Forest, Environ. Sci. Technol., 53, 4977–4987, https://doi.org/10.1021/acs.est.8b07319, 2019.
Smith, N. R., Crescenzo, G. V., Huang, Y., Hettiyadura, A. P. S., Siemens, K., Li, Y., Faiola, C. L., Laskin, A., Shiraiwa, M., Bertram, A. K., and Nizkorodov, S. A.: Viscosity and liquid–liquid phase separation in healthy and stressed plant SOA, Environ. Sci.: Atmos., 1, 140–153, https://doi.org/10.1039/d0ea00020e, 2021.
Song, M., Maclean, A. M., Huang, Y., Smith, N. R., Blair, S. L., Laskin, J., Laskin, A., DeRieux, W.-S. W., Li, Y., Shiraiwa, M., Nizkorodov, S. A., and Bertram, A. K.: Liquid–liquid phase separation and viscosity within secondary organic aerosol generated from diesel fuel vapors, Atmos. Chem. Phys., 19, 12515–12529, https://doi.org/10.5194/acp-19-12515-2019, 2019.
Steimer, S. S., Lampimäki, M., Coz, E., Grzinic, G., and Ammann, M.: The influence of physical state on shikimic acid ozonolysis: a case for in situ microspectroscopy, Atmos. Chem. Phys., 14, 10761–10772, https://doi.org/10.5194/acp-14-10761-2014, 2014.
Stickel, F., Fischer, E. W., and Richert, R.: Dynamics of glass-forming liquids. II. Detailed comparison of dielectric relaxation, de-conductivity, and viscosity data, J. Chem. Phys., 104, 2043–2055, https://doi.org/10.1063/1.470961, 1996.
Tikkanen, O.-P., Buchholz, A., Ylisirniö, A., Schobesberger, S., Virtanen, A., and Yli-Juuti, T.: Comparing secondary organic aerosol (SOA) volatility distributions derived from isothermal SOA particle evaporation data and FIGAERO–CIMS measurements, Atmos. Chem. Phys., 20, 10441–10458, https://doi.org/10.5194/acp-20-10441-2020, 2020.
Tretheway, D. C. and Meinhart, C. D.: Apparent fluid slip at hydrophobic microchannel walls, Phys. Fluids, 14, L9, https://doi.org/10.1063/1.1432696, 2002.
Tumminello, P. R., James, R. C., Kruse, S., Kawasaki, A., Cooper, A., Guadalupe-Diaz, I., Zepeda, K. L., Crocker, D. R., Mayer, K. J., Sauer, J. S., Lee, C., Prather, K. A., and Slade, J. H.: Evolution of Sea Spray Aerosol Particle Phase State Across a Phytoplankton Bloom, ACS Earth Space Chem., 5, 2995–3007, https://doi.org/10.1021/acsearthspacechem.1c00186, 2021.
Vinogradova, O. I., Koynov, K., Best, A., and Feuillebois, F.: Direct Measurements of Hydrophobic Slippage Using Double-Focus Fluorescence Cross-Correlation, Phys. Rev. Lett., 102, 118302, https://doi.org/10.1103/PhysRevLett.102.118302, 2009.
Vander Wall, A. C., Wingen, L. M., Perraud, V., Zhao, Y., and Finlayson-Pitts, B. J.: Enhanced gas uptake during α-pinene ozonolysis points to a burying mechanism, ACS Earth Space Chem., 4, 1435–1447, https://doi.org/10.1021/acsearthspacechem.0c00163, 2020.
Wolf, M. J., Coe, A., Dove, L. A., Zawadowicz, M. A., Dooley, K., Biller, S. J., Zhang, Y., Chisholm, S. W., and Cziczo, D. J.: Investigating the Heterogeneous Ice Nucleation of Sea Spray Aerosols Using Prochlorococcus as a Model Source of Marine Organic Matter, Environ. Sci. Technol., 53, 1139–1149, https://doi.org/10.1021/acs.est.8b05150, 2019.
Ye, J., Van Rooy, P., Adam, C. H., Jeong, C.-H., Urch, B., Cocker III, D. R., Evans, G. J., and Chan, A. W. H.: Predicting Secondary Organic Aerosol Enhancement in the Presence of Atmospherically Relevant Organic Particles, ACS Earth Space Chem., 2, 1035–1046, https://doi.org/10.1021/acsearthspacechem.8b00093, 2018.
Yli-Juuti, T., Pajunoja, A., Tikkanen, O. P., Buchholz, A., Faiola, C., Väisänen, O., Hao, L., Kari, E., Peräkylä, O., Garmash, O., Shiraiwa, M., Ehn, M., Lehtinen, K., and Virtanen, A.: Factors controlling the evaporation of secondary organic aerosol from α-pinene ozonolysis, Geophys. Res. Lett., 44, 2562–2570, https://doi.org/10.1002/2016GL072364, 2017.
Ylisirniö, A., Buchholz, A., Mohr, C., Li, Z., Barreira, L., Lambe, A., Faiola, C., Kari, E., Yli-Juuti, T., Nizkorodov, S. A., Worsnop, D. R., Virtanen, A., and Schobesberger, S.: Composition and volatility of secondary organic aerosol (SOA) formed from oxidation of real tree emissions compared to simplified volatile organic compound (VOC) systems , Atmos. Chem. Phys., 20, 5629–5644, https://doi.org/10.5194/acp-20-5629-2020, 2020.
Zaveri, R. A., Easter, R. C., Shilling, J. E., and Seinfeld, J. H.: Modeling kinetic partitioning of secondary organic aerosol and size distribution dynamics: representing effects of volatility, phase state, and particle-phase reaction, Atmos. Chem. Phys., 14, 5153–5181, https://doi.org/10.5194/acp-14-5153-2014, 2014.
Zaveri, R. A., Shilling, J. E., Zelenyuk, A., Liu, J., Bell, D. M., D'Ambro, E. L., Gaston, C. J., Thornton, J. A., Laskin, A., Lin, P., Wilson, J., Easter, R. C., Wang, J., Bertram, A. K., Martin, S. T., Seinfeld, J. H., and Worsnop, D. R.: Growth Kinetics and Size Distribution Dynamics of Viscous Secondary Organic Aerosol, Environ. Sci. Technol., 52, 1191–1199, https://doi.org/10.1021/acs.est.7b04623, 2018.
Zaveri, R. A., Wang, J., Fan, J. W., Zhang, Y. W., Shilling, J. E., Zelenyuk, A., Mei, F., Newsom, R., Pekour, M., Tomlinson, J., Comstock, J. M., Shrivastava, M., Fortner, E., Machado, L. A. T., Artaxo, P., and Martin, S. T.: Rapid growth of anthropogenic organic nanoparticles greatly alters cloud life cycle in the Amazon rainforest, Sci. Adv., 8, eabj0329, https://doi.org/10.1126/sciadv.abj0329, 2022.
Zelenyuk, A., Imre, D., Beránek, J., Abramson, E., Wilson, J., and Shrivastava, M.: Synergy between Secondary Organic Aerosols and Long-Range Transport of Polycyclic Aromatic Hydrocarbons, Environ. Sci. Technol., 46, 12459–12466, https://doi.org/10.1021/es302743z, 2012.
Zhang, Y., Chen, Y., Lei, Z., Olson, N. E., Riva, M., Koss, A. R., Zhang, Z., Gold, A., Jayne, J. T., Worsnop, D. R., Onasch, T. B., Kroll, J. H., Turpin, B. J., Ault, A. P., and Surratt, J. D.: Joint Impacts of Acidity and Viscosity on the Formation of Secondary Organic Aerosol from Isoprene Epoxydiols (IEPOX) in Phase Separated Particles, ACS Earth Sp. Chem., 3, 2646–2658, https://doi.org/10.1021/acsearthspacechem.9b00209, 2019a.
Zhang, Y., Nichman, L., Spencer, P., Jung, J. I., Lee, A., Heffernan, B. K., Gold, A., Zhang, Z., Chen, Y., Canagaratna, M. R., Jayne, J. T., Worsnop, D. R., Onasch, T. B., Surratt, J. D., Chandler, D., Davidovits, P., and Kolb, C. E.: The Cooling Rate- And Volatility-Dependent Glass-Forming Properties of Organic Aerosols Measured by Broadband Dielectric Spectroscopy, Environ. Sci. Technol., 53, 12366–12378, https://doi.org/10.1021/acs.est.9b03317, 2019b.
Zhu, L., Attard, P., and Neto, C.: Reconciling Slip Measurements in Symmetric and Asymmetric Systems, Langmuir, 28, 7768–7774, https://doi.org/10.1021/la301040d, 2012.