the Creative Commons Attribution 4.0 License.
the Creative Commons Attribution 4.0 License.
 | 08 Feb 2022
A source for the continuous generation of pure and quantifiable HONO mixtures
Guillermo Villena
Jörg Kleffmann
A continuous source for the generation of pure HONO mixtures was developed and characterized, which is based on the Henry's law solubility of HONO in acidic aqueous solutions. With the help of a peristaltic pump, diluted nitrite and sulfuric acid solutions are mixed in a temperature-controlled stripping coil, which is operated with pure nitrogen or synthetic air at gas flow rates of 0.5–2 L min−1. Caused by the acidic conditions of the aqueous phase (pH ≈ 2.5), nitrite is almost completely converted into HONO, which partitions to the gas phase limited by its known solubility in water. The source shows a fast time response of ∼ 2 min (0 %–90 %) at higher concentrations and an excellent long-term stability (2σ noise < 1 %). The HONO emission of the source perfectly correlates with the nitrite concentration from the sub-ppb range up to 500 ppb. The rate of NOx formation increases quadratically with the HONO concentration from non-detectable values at atmospheric relevant HONO concentrations reaching a NOx content of 1.6 % at 500 ppb. A general equation based on Henry's law is developed, whereby the HONO concentration of the source can be calculated using measured experimental parameters, i.e. nitrite concentration, liquid flow rates, gas flow rate, pH of the solution, and temperature of the stripping coil. In the equation, the known Henry's law constant of HONO in sulfuric acid solutions is used. For the calculation of the effective Henry's law constant, the acid dissociation equilibrium of HONO nitrite is used as a variable to adjust the theoretical HONO concentration to the measured values. From the average of all experimental data the equilibrium of HONO nitrite is described well by p. The pKa of 3.0 ± 0.1 (1σ) at 25 ∘C is in good agreement with the range of 2.8–3.28 published in former studies. A standard deviation between all measured and theoretical HONO concentrations of only ±3.8 % was observed, and a conservative upper-limit accuracy of the HONO concentration of better 10 % is estimated. Thus, for the first time, a stable HONO source is developed which can be used for the absolute calibration of HONO instruments.
- Article
(1846 KB) - Full-text XML
- BibTeX
- EndNote


Nitrous acid (HONO) is an important trace gas in the atmosphere which represents a major source of the OH radical (Kleffmann et al., 2005; Acker et al., 2006; Ma et al., 2013; Michoud et al., 2014; Gu et al., 2020), the detergent of the atmosphere. In addition, HONO and its reaction products show mutagenic and carcinogenic properties (Pitts et al., 1978; Kirchner and Hopkins, 1991), which is especially important for indoor conditions, for which much higher levels of up to 90 ppb compared to the ambient atmosphere have been observed (Večeřa and Dasgupta, 1994).
The sources of HONO in the atmosphere are controversially discussed (Kleffmann, 2007), and among others, photochemical heterogeneous reactions have been proposed to explain unexpectedly high HONO concentrations during daytime (Stemmler et al., 2006; Zhou et al., 2011). However, the accuracy of the daytime HONO data was often doubted, for which spectroscopic instruments are often not sensitive enough, while wet-chemical instruments may suffer from chemical interferences (Kleffmann and Wiesen, 2008). Thus, the development of sensitive and selective HONO instruments is still of high interest, for which a stable and pure HONO source is very helpful. Such a HONO source should ideally be simple in operation, produce HONO mixtures with high purity and stability, cover a wide range of concentrations, and also produce predictable HONO concentrations for the calibration of HONO instruments in the field when other calibration methods are not available. Several attempts have been made in the past to produce HONO mixtures in the laboratory and in the field. In the first studies, simply the equilibrium between nitrogen oxides (NO + NO2) and water vapour was used to generate HONO (Wayne and Yost, 1951):
However, Reaction (R1) is never quantitative, and the purity of HONO is typically lower than 50 %. Accordingly, other methods were developed which are mainly based on different acid displacement reactions, for example using oxalic acid (Braman and de la Cantera, 1986),
sulfuric acid (Taira and Kanda, 1990),
or hydrochloric acid (Febo et al., 1995),
In addition to the acid displacement, Večeřa and Dasgupta (1991) developed a source where the thermal decomposition of ammonium nitrite was used:
The purity of the latter source is however low, caused by the equimolar formation of HONO and NH3. The different types of sources used in various studies were recently summarized in Table 1 of Gingerysty and Osthoff (2020).
In the most recent studies, the acid displacement using HCl was applied (Ren et al., 2010; Reed et al., 2016; Gingerysty and Osthoff, 2020; Lao et al., 2020); these are all based on the pioneering study of Febo et al. (1995). Gaseous HCl is produced by any kind of permeation source and after humidification reacts heterogeneously with solid sodium nitrite. After careful optimization, high purity and a large concentration range from ppb to ppm levels can be obtained by the source (Febo et al., 1995). However, when using HCl under dry conditions or at low relative humidity, there is always a risk of the undesired formation of ClNO. In addition, unreacted HCl may occur when the sodium nitrite reactor is not working properly (Gingerysty and Osthoff, 2020). For this reason, we used this source only for a short period in our laboratory (Brust et al., 2000) and later switched to the experimentally much simpler source from Taira and Kanda (1990), for which the above-mentioned by-product formation is completely absent when using the non-volatile H2SO4. In the source, diluted nitrite and H2SO4 solutions are mixed in a temperature-controlled bubbler-type reactor while flushed with synthetic air. The HONO concentration of the source can be adjusted simply by changing the concentration of the aqueous nitrite solution. In contrast, for the source by Febo et al. (1995), variations of the temperature and the concentration of the liquid HCl in the permeation source are required, which is more complicated and time-consuming. Finally, the source of Taira and Kanda (1990) was optimized by using a temperature-controlled stripping coil reactor, leading to even higher simplicity and stability, faster time response, and lower NOx formation (Kleffmann et al., 2004). The source was later commercialized (QUMA Elektronik & Analytik GmbH), and its prototype is in regular use in our laboratory and for the characterization of different HONO instruments (e.g. Jurkat et al., 2011; Ródenas et al., 2013). However, in addition to the very little information given in Kleffmann et al. (2004), the source was never explained in detail. Caused by the increasing general interest in the chemistry of HONO and in the development of simple HONO sources during the last years (e.g. Gingerysty and Osthoff, 2020; Lao et al., 2020), the aim of the present study was to characterize the source in more detail and also to apply Henry's law for its theoretical quantification for use in the standalone calibration of HONO instruments.
2.1 HONO source
The set-up of the source is shown in Fig. 1. Nitrogen (N2) from the evaporation of 99.999 % pure liquid nitrogen (alternatively also synthetic air can be used) controlled by a 2 L min−1 flow controller (Bronckhorst) is passed through a temperature controller stripping coil (2.4 mm i.d. glass tube, 25 turns, 20 mm turn diameter) with gas flow rates in the range 0.5–2 L min−1. The temperature of the stripping coil is controlled in the range 5–20 ∘C by a compact liquid thermostat (QUMA, Peltier type) and a thermoelement, which was calibrated by a certified Hg thermometer. The maximum temperature of the stripping coil is limited to a few degrees Celsius below room temperature. If higher temperatures are used, water will condensate in the PFA (perfluoroalkoxy alkanes) lines (4 mm i.d.). For most experiments, the source was operated at the nominal instrument set point of 15 ∘C, which represents a real calibrated temperature of 15.9 ∘C.
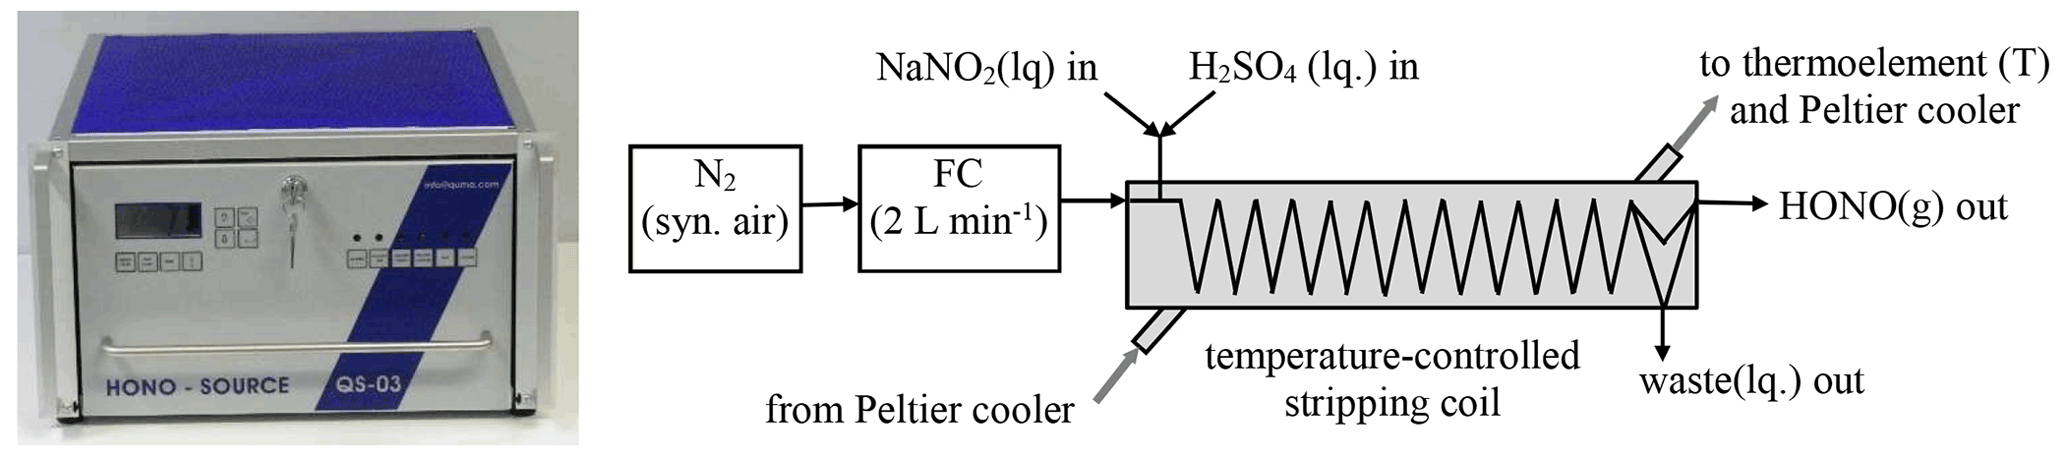
In the stripping coil, the gas phase comes into contact with a mixture of diluted nitrite and H2SO4 solutions. Except for the study of the pH dependence, a 3.6 mM H2SO4 solution was used, for which 2 mL of a diluted H2SO4 (Aldrich p.a., 95 %–98 %) was diluted to 1 L with pure water. Diluted nitrite solutions (0.001–10 mg L−1) were made from a 1000 mg L−1 standard stock solution (Merck Titrisol) by dilution with volumetric pipettes and flasks. If nitrite concentrations ≥ 0.1 mg L−1 are used, these solutions are stable for weeks when stored in the dark. For lower concentrations daily preparation is recommended. The pH of the combined solutions of ∼ 2.5 collected from the waste channel of the instrument was measured by a calibrated pH meter (HANNA instruments, HI8314 membrane pH meter). The liquid flow rates of the two reagent solutions and of the waste are controlled by an eight-channel peristaltic pump (Ismatec) using each 0.51 mm i.d. peristaltic-pump tubing for the nitrite and H2SO4 solutions and a 1.14 mm i.d. tubing for the waste (Ismaprene, PharMed®, three stopper, lifetime of 2 × 1000 h), respectively. The peristaltic pump can be operated from 8–40 rpm, and the liquid flow rates were measured by the time to fill 5 mL volumetric flasks. The liquid flow rate of a peristaltic pump is typically decreasing by ∼ 20 % during the lifetime of the tubes and should be measured when the theoretical HONO concentrations are calculated. All components described above including plastic bottles for the reagents (2 × 0.5 L) and the waste (1 L) are installed in a 19 in. (48.62 cm) rack housing (see Fig. 1).
2.2 Other analytical equipment
For the measurement of HONO and NOx a chemiluminescence NOx monitor (ECO PHYSICS, nCLD SL899) with a molybdenum converter was used. The instrument has a detection limit of ∼ 30 ppt at a sample flow rate of 1 L min−1 and was daily calibrated by a certified NO calibration mixture (410 ppb NO, Messer) with an accuracy of 3 %. While the instrument is very selective for the detection of NO, all other reactive nitrogen species (NOy), i.e. for the present study NO2 and HONO, are quantitatively measured in the NOx channel of the instrument (Villena et al., 2012). Quantitative NO2 conversion was assured by the replacement of the molybdenum converter during the annual maintenance of the instrument just a week before the experiments and was also verified with an O3 titration unit (Anysco GPT; gas phase titration). Quantitative conversion of HONO to NO was demonstrated by comparison with an HONO LOPAP instrument (long-path absorption photometer; Heland et al., 2001; Kleffmann et al., 2002). To confirm that HONO decomposes to NO and NO2 at an equimolar ratio according to the back-reaction of equilibrium (R1), an NO2 LOPAP instrument (Villena et al., 2011) was also used during the concentration dependency.
The HONO mixture from the source was guided by PFA lines (4 mm i.d.) to the different instruments. The excess flow passed a humidity and temperature sensor (HYTELOG USB, HYGROSENS Instruments GmbH, accuracy of ±2 % RH) to also measure the dew point of the gas phase. Caused by this set-up, the lower gas flow rate of the HONO source applied in the present study was limited by the flow rate of the chemiluminescence instrument (1 L min−1).
At HONO mixing ratios higher than 100 ppb significant formation of NOx was observed (see below Sect. 3.2), which is caused by the decomposition of HONO; see the back-reaction of equilibrium (R1). In agreement with the stoichiometry of the reaction, the NO2 concentration measured by the NO2 LOPAP instrument was found to be similar to the NO concentration measured by the chemiluminescence instrument. Thus, for simplicity, the NOx level of the HONO source was calculated by doubling the measured NO signal. The HONO concentration measured by the chemiluminescence monitor was then determined by the difference between [NOy] and 2 × [NO]. The calculated HONO concentrations agreed well with those from the HONO LOPAP instrument in between the experimental errors of both instruments. During a concentration dependency experiment in the range 0–100 ppb (see Sect. 3.2) both instruments showed an excellent linear correlation (R2 = 0.9995) and agreement (slope LOPAP instrument against the ECO PHYSICS instrument: 0.972). Since the accuracy of the ECO PHYSICS instrument is slightly higher (3 %) than that of the HONO LOPAP instrument (5 %), the chemiluminescence HONO data were further used for the characterization of the HONO source. Only for one low-concentration experiment (see Sect. 3.6) were the HONO LOPAP data shown.
3.1 pH dependence
The effective solubility of HONO in an aqueous solution is limited by different processes. First, the solubility of undissociated HONO is described by Henry's law:
where clq. is the liquid concentration (mol L−1) and pg is the gas phase partial pressure of HONO (atm). In former studies, consistent values of the Henry's law constant KH (mol L−1 atm−1) were observed (e.g. Park and Lee, 1988; Becker et al., 1996). Second, since H2SO4 solutions were used in the present study, the salting-out effect of the weak acid HONO by the strong acid H2SO4 has to be considered. Thus, for the HONO–H2SO4 system the solubility data from the former study of Becker et al. (1996) were used, which agreed well with the results from Park and Lee (1988) for pure water. Furthermore, considering that only a moderate acidity of the reaction mixture was finally used (pH ≈ 2.5; see below), the added nitrite is still not completely converted into undissociated HONO in the aqueous phase, caused by the pH-dependent acid dissociation equilibrium:
To quantitatively describe equilibrium (R6), pKa values in the range 2.8–3.26 have been published in former studies (Park and Lee, 1988; Riordan et al., 2005; da Silva et al., 2006). Considering this equilibrium, the effective Henry's law constant (mol L−1 atm−1) is given by
where the H+ concentration (mol L−1) is calculated from the measured pH of the combined solutions (waste). Since the acid dissociation constant has a significant uncertainty, we used the pKa as an unknown variable to adjust the theoretical HONO concentrations (see Eq. 3, Sect. 4.2) to the experimental values. When using all experimental data at pH > 2.4 and excluding the temperature dependence, an average pKa = 3.09 ± 0.12 (1σ) was determined at the typical used temperature of 15.9 ∘C. When the temperature dependence was also considered (see Sect. 3.5), the equilibrium is described well by p in the experimental temperature range (5.4–18.6 ∘C). The resulting pKa of 3.0 ± 0.1 (1σ) at 25 ∘C is in good agreement with the range of 2.8–3.28 published in former studies (Park and Lee, 1988; Riordan et al., 2005; da Silva et al., 2006).
When the pH of the solution was varied, an excellent agreement between theoretical (see Sect. 4.2) and experimental HONO concentrations was observed only for pH values > 2.4. For lower pH values, significantly lower HONO concentrations were observed in comparison with the values calculated with Eq. (3) (see Fig. 2). Reasons for this discrepancy are still unclear and could not be explained by the increasing rate of NOx formation with decreasing pH, as even the measured NOy concentration was lower than the theoretical HONO concentration (see Fig. 2). One potential problem could be the pH measurements, which showed excellent agreement between measured and theoretical values only for pH > 2. In contrast, at higher acidity, measured pH values were significantly higher than theoretically expected, which is a known problem when using pH electrodes (Bates, 1973). Thus, the theoretical and not the experimental pH values were used for pH < 2 in Fig. 2. For the calculation of the theoretical pH, the acid concentration was used, and reasonable quantitative dissociation of the strong H2SO4 was assumed. Furthermore, according to the study by Riordan et al. (2005) a second equilibrium between HONOaq. and H2ONO at pH < 2 could lead to a higher effective solubility compared to undissociated HONO. However, in the former study of Becker et al. (1996), the equilibrium between HONO and NO+ was observed at much higher acidity around 55 wt %, which was in good agreement with a former study by Seel and Winkler (1960). Thus, any increasing effective solubility by the formation of H2ONO+–NO+ should not be of importance in the pH range 0–2. Finally, liquid phase diffusion in the stripping coil could limit the experimental HONO emission with increasing viscosity of the H2SO4 solutions at concentrations up to 2.7 wt % used, leading to lower HONO concentrations than theoretically expected from the thermodynamic equilibrium. In contrast, in the study by Becker et al. (1996), on which Eq. (3) is based, a bubbler set-up was used under thermodynamic equilibrium.
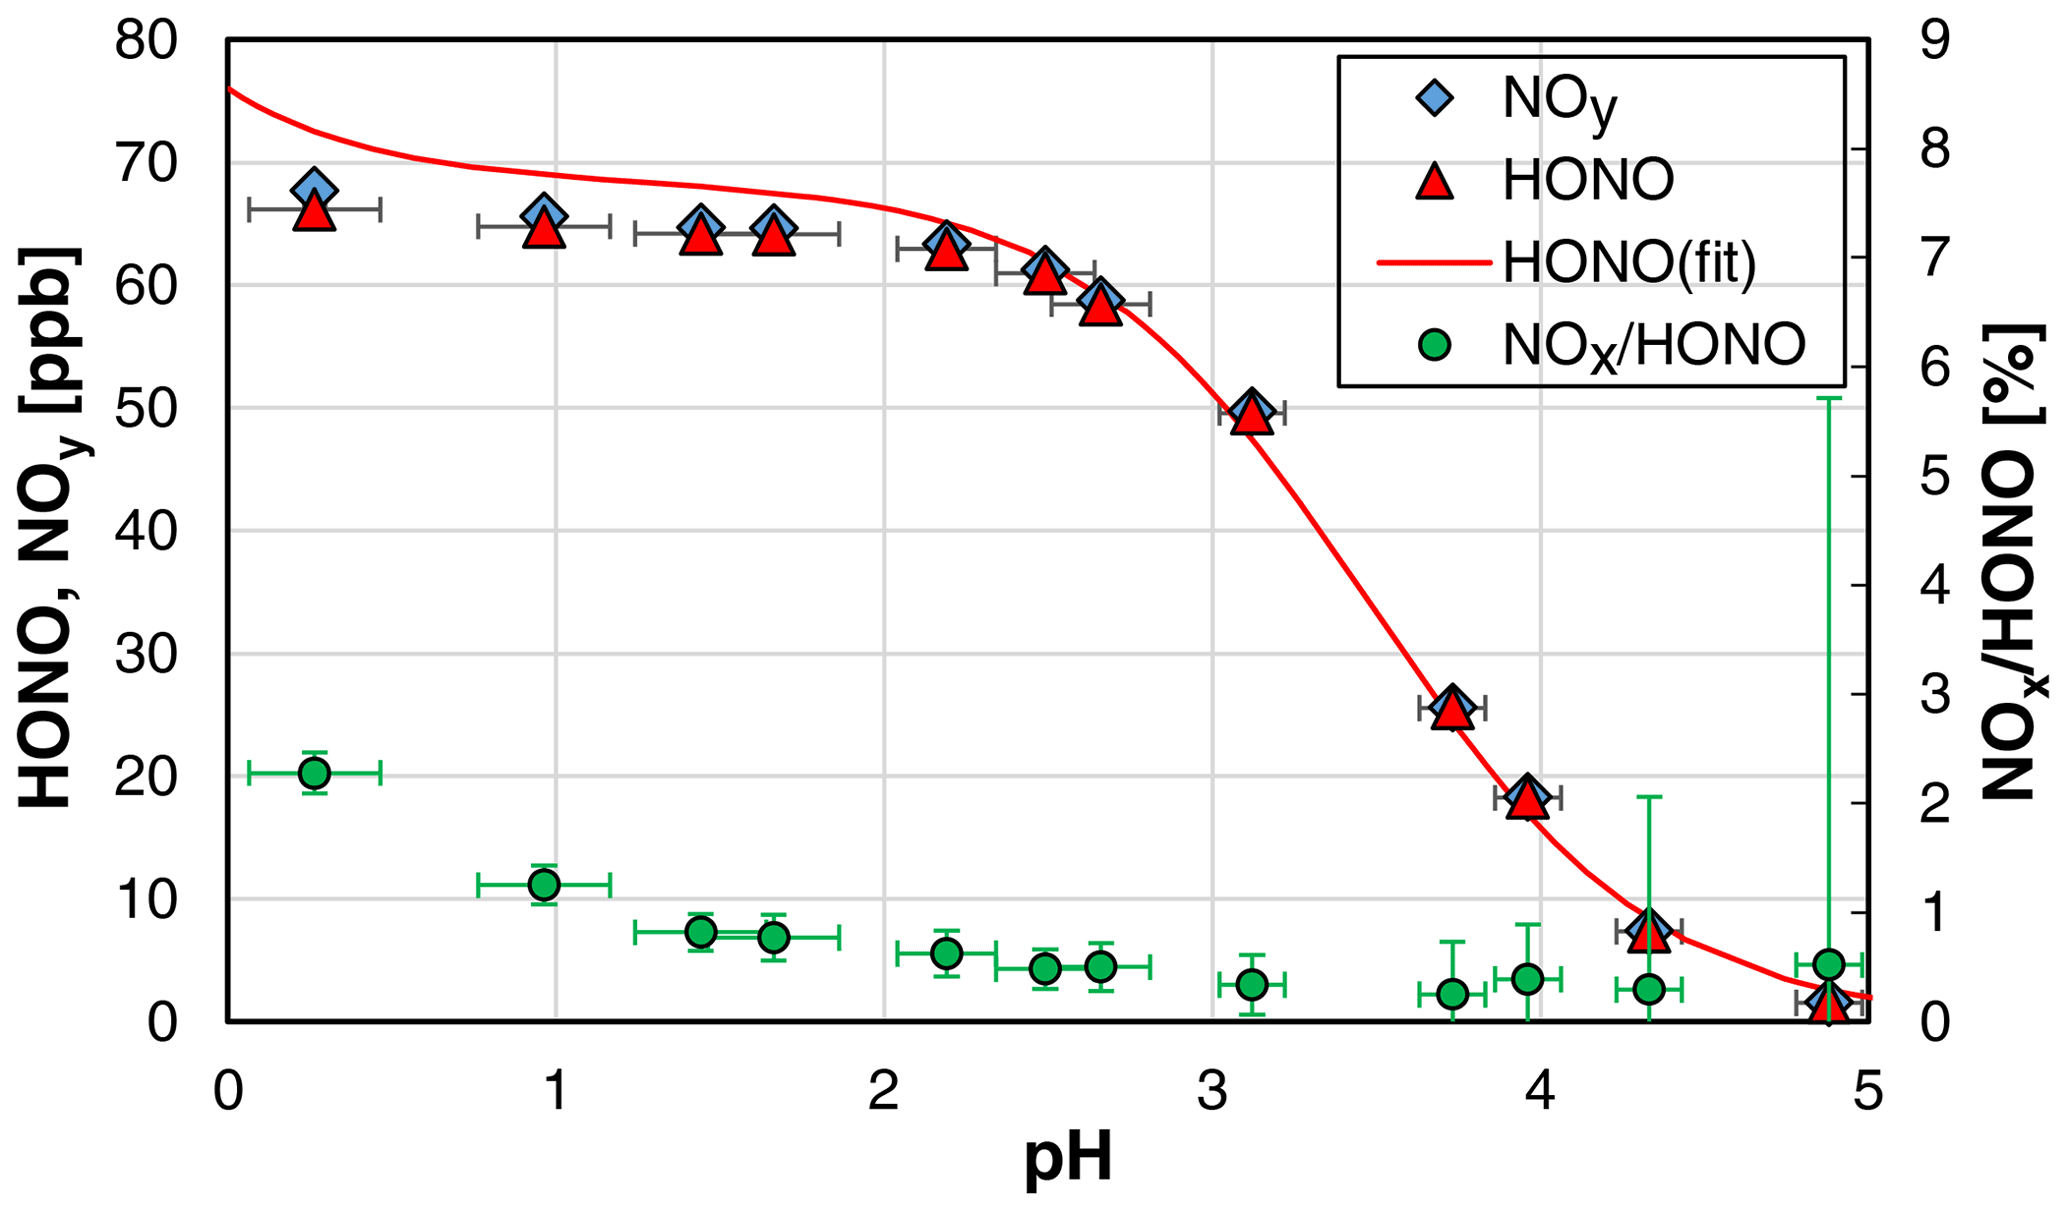
Figure 2Dependence of the HONO mixing ratio and the NOx HONO ratio on the pH of the NO–H2SO4 reaction mixture (NO = 1 mg L−1; T = 15.9 ∘C, = 1570 cm3 min−1, 20 rpm). In addition, the theoretical HONO mixing ratios calculated by Eq. (3) (see Sect. 4.2) are also shown, for which pKa = 3.16 was used (weighted average of all shown data at pH > 2.4). The y error bars represent the precision errors (2σ), which are only visible for the NOx HONO ratio but smaller than the size of the symbols for HONO and NOy. The x error bars represent the accuracy of the pH measurements.
Since our focus was not the exact study of the system N(III) in sulfuric acid solutions but the development of a HONO source, we did not further investigate this issue in detail but simply limited the acidity to pH ≥ 2.4. For these conditions, the pH measurements were accurate; the theoretical and experimental HONO concentrations agreed well; a potential equilibrium of HONO and H2ONO+ is still not significant (Riordan et al., 2005); and the unwanted NOx formation is still small (see Fig. 2). The pH should however also not be too high (i.e. > 3), since the uncertainties in the theoretical HONO concentrations increase at higher pH values, caused by the incomplete conversion of the added nitrite to HONO; see equilibrium (R6). Thus, for the present HONO source an acidity of the reaction mixture of pH ≈ 2.5 is recommended.
3.2 Concentration dependence
The dependence of the added nitrite concentration on the HONO mixing ratio was studied in two different experiments and by two different operators of the source. The experimental data from one experiment are shown in Fig. 3, for which the nitrite concentration was varied by several orders of magnitude (0.002–10 mg L−1). The source showed a very fast time response of ∼ 2 min (0 %–90 %) for HONO concentrations > 20 ppb increasing to 6–7 min at lower concentrations at a liquid pump speed of 20 rpm. The increasing time response at low HONO levels is explained by adsorption/desorption of HONO on the surfaces behind the HONO source, which gets less important with increasing HONO levels, leading to faster saturation of the surfaces. From the experiment shown in Fig. 3, we conclude that most of this adsorption/desorption took place on the surfaces of the chemiluminescence instrument used (inlet particle filter, stainless-steel lines) and not on the PFA transfer lines. At 16:09 local time (LT) the HONO source was switched from reagents to pure water, for which the HONO emissions should quickly decrease to zero. However, after a first fast decrease of the HONO concentration there was a significant tailing of the signal. Here the slope of the decreasing signal did not change when the HONO source was replaced by pure nitrogen at 16:59 LT. This can only be explained when the tailing is caused by desorption of HONO from the surfaces of the chemiluminescence instrument, as all other PFA surfaces were removed. This conclusion is also confirmed by the LOPAP data, for which a time response of only 4 min was observed at low mixing ratios in the range 0.05–0.5 ppb (see Sect. 3.6 and Fig. 8). Since this time response is similar to the one of the LOPAP instrument under the experimental conditions applied, the time response of the HONO source will be ≤ 4 min, in agreement with the high-concentration data. The proposed adsorption of HONO mainly on the metal surfaces of the chemiluminescence instrument at low HONO levels is also in agreement with our experience with pure HONO mixtures, for which adsorption losses in PFA transfer lines of up to 20 m length were found to be insignificant.
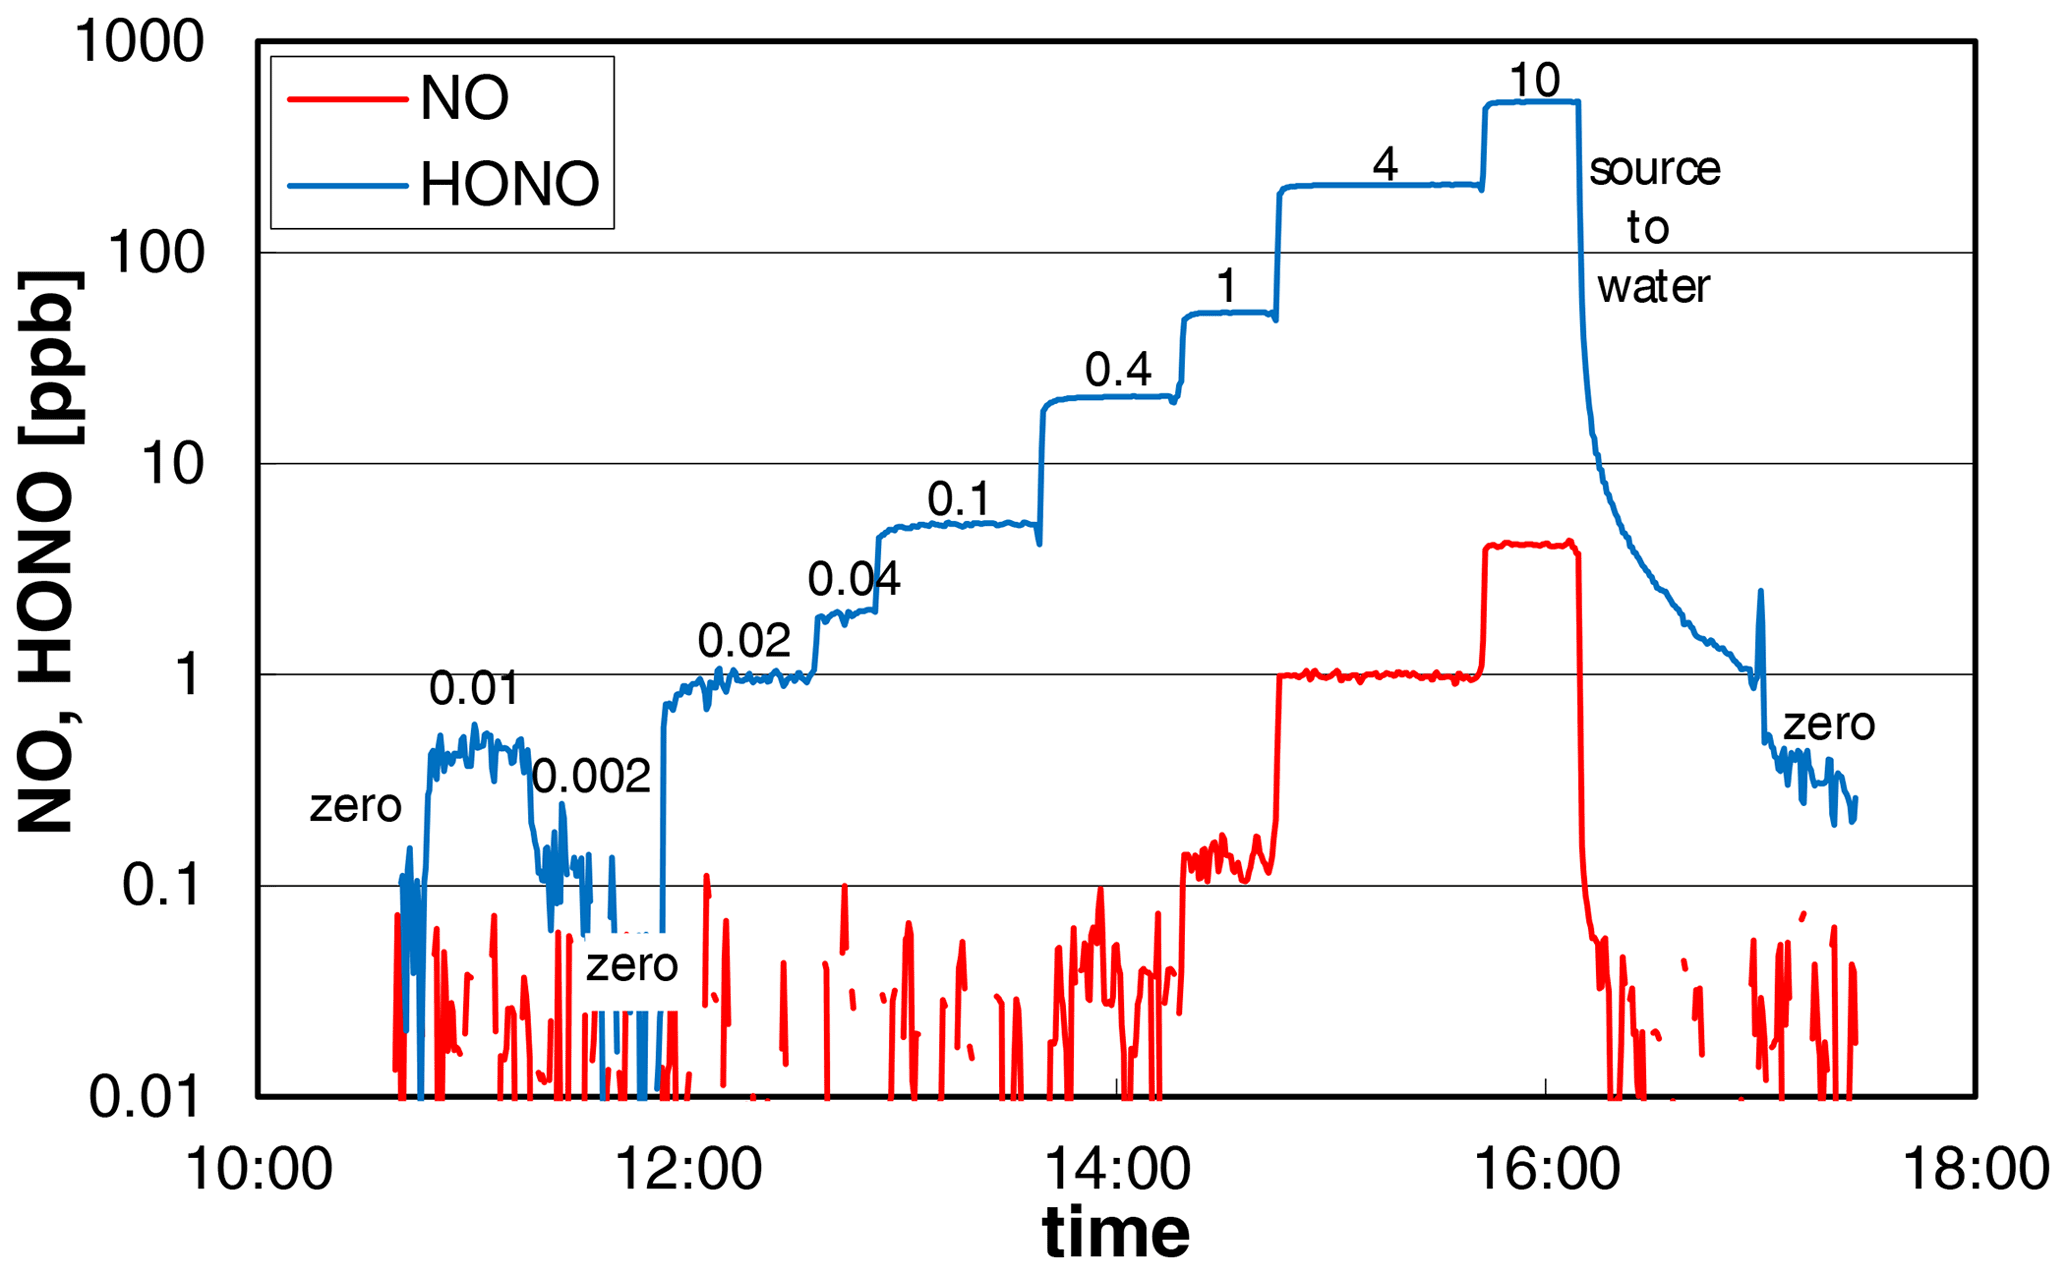
Figure 3NO and HONO concentrations of the HONO source (logarithmic scale) for variable nitrite concentrations (numbers in the figure in mg L−1). The HONO signal of the chemiluminescence instrument shows significant tailing for zero measurements, which follow high HONO concentrations (see last zero). Experimental conditions: T = 15.9 ∘C, = 2104 cm3 min−1, 20 rpm, pH = 2.48.
When all HONO data from the two experiments were plotted against the nitrite concentration, an excellent linear correlation (R2 = 0.99996) was observed. Similar slopes were observed when using all HONO data up to 500 ppb (see Fig. 4a) compared to mixing ratios only up to 10 ppb (see Fig. 4b). At typical atmospheric HONO mixing ratios < 20 ppb, no NOx formation was observed in between the experimental errors. Only at higher HONO levels, did NOx quadratically increase with the HONO concentration (see Fig. 4a), in agreement with the expected second-order kinetic behaviour of the back-reaction of equilibrium (R1). But even at 500 ppb HONO, a NOx content of only 1.6 % was observed, which is significantly lower than in the original bubbler set-up of Taira and Kanda (1990). Thus, the HONO source can be operated for mixing ratios up to 500 ppb and up to 20 ppb with purities of > 98 % and > 99.8 %, respectively. In addition, the excellent agreement of the HONO and NOx data for the two completely independent experiments performed by two different operators including different NOx calibration and dilution of the nitrite stock solution (see Fig. 4) demonstrates the high precision and reproducibility of the HONO source (see also Sect. 3.6).
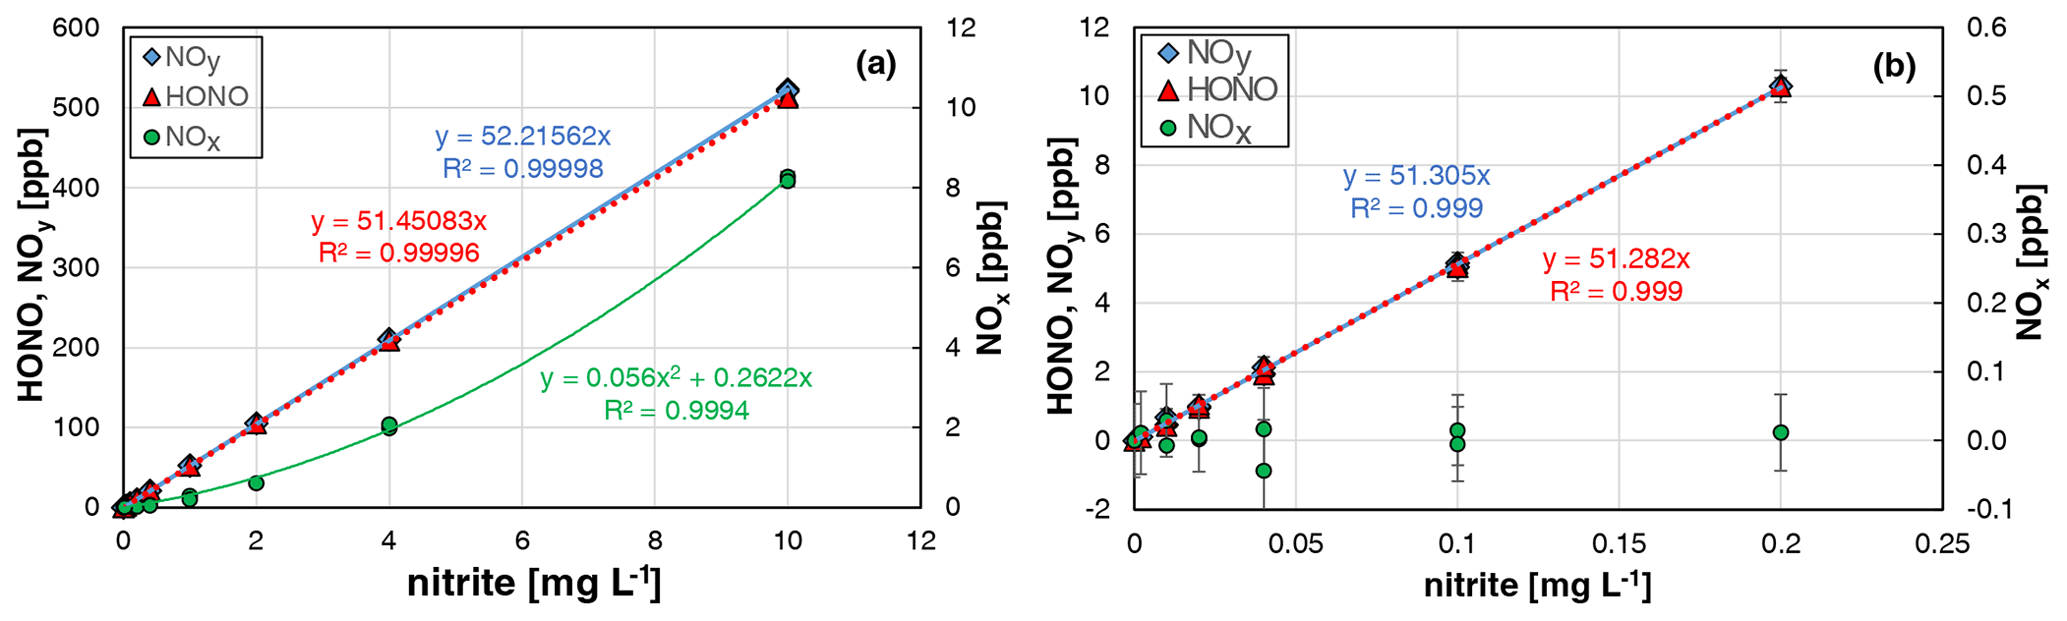
Figure 4Nitrite concentration dependence of NOy, HONO, and NOx formation of the HONO source for two independent experiments. (a) All data including the data shown in Fig. 3; (b) same data for nitrite concentrations ≤ 0.2 mg L−1 (T = 15.9 ∘C, = 2104 cm3 min−1, 20 rpm, pH = 2.45 and 2.48). The error bars represent the 2σ precision errors, which are smaller than the size of the symbols in (a).
3.3 Gas flow rate dependence
The used stripping coil can be operated at gas flow rates in the range 0.5–2 L min−1. However, caused by the sample flow rate of the chemiluminescence instrument of 1 L min−1, only gas flow rates in the range 1–2 L min−1 were investigated. The HONO concentration was decreasing with the gas flow rate (see Fig. 5), which can be explained by the increasing dilution of the formed HONO in the increasing gas volume.
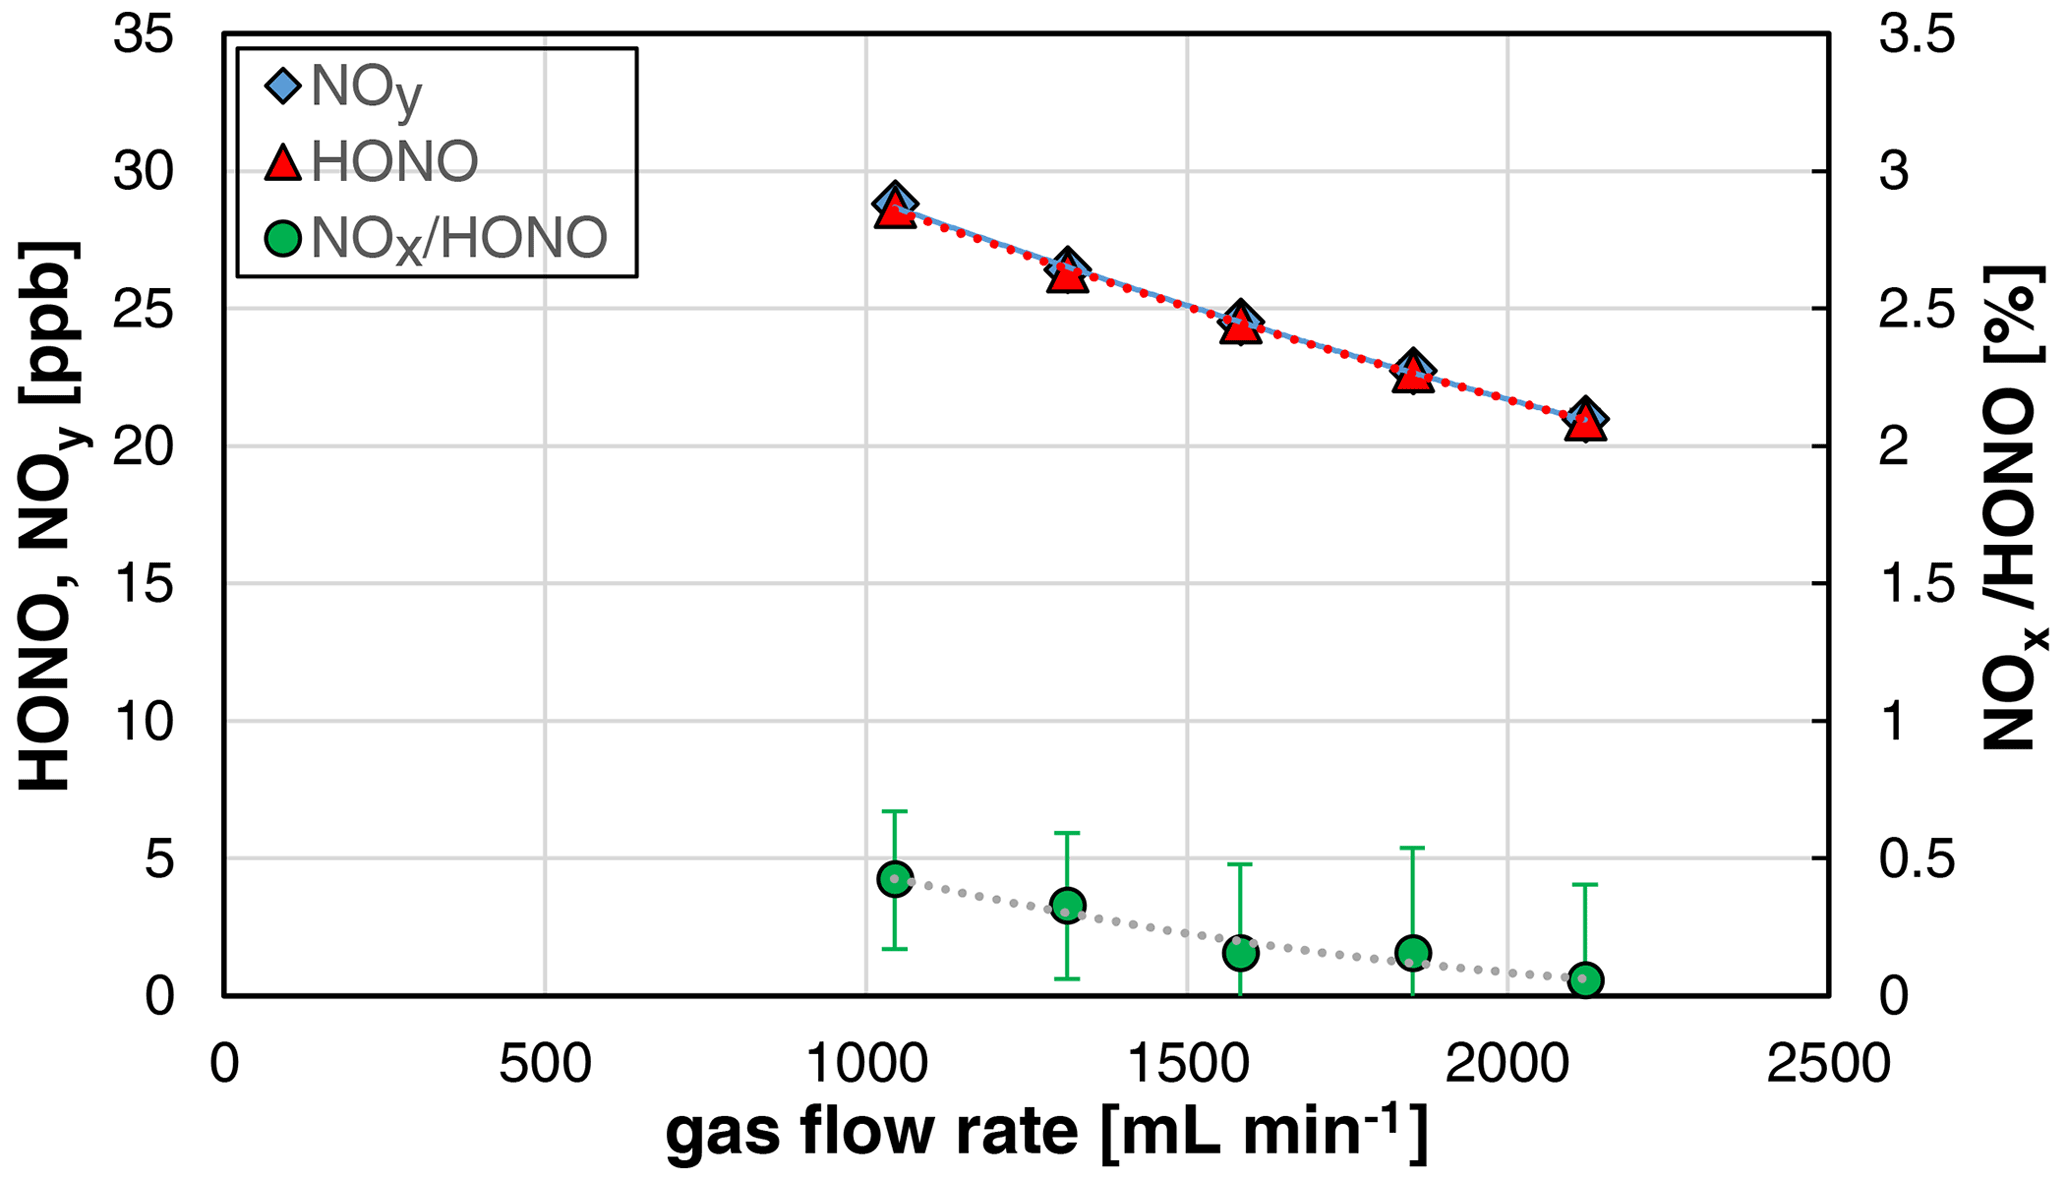
Figure 5Gas flow rate dependence of NOy, HONO, and the NOx HONO ratio of the HONO source (NO = 0.4 mg L−1, T = 15.9 ∘C, 20 rpm, pH = 2.47). The error bars represent the precision errors (2σ), which are only visible for the NOx HONO ratio but smaller than the size of the symbols for HONO and NOy.
Furthermore, a decreasing NOx content with increasing gas flow rate was observed, which is explained by the decreasing reaction time of HONO in the stripping coil and the heterogeneous decomposition of HONO (back-reaction of equilibrium R1, second-order kinetics). Thus, for increasing the purity of the source, it should be operated at gas flow rates > 1.5 L min−1. If lower flow rates are necessary, the HONO levels should be reduced to mixing ratios < 10 ppb, caused by the quadratic dependence of the NOx formation with the HONO mixing ratio; see Sect. 3.2. The time response of the source was found to be independent of the gas flow rate.
3.4 Liquid flow dependence
Since the amount of nitrite pumped into the stripping coil is directly proportional to the liquid flow rate, the speed of the liquid peristaltic pump was varied in the range 10–40 rpm. As expected, the HONO mixing ratios increased with the liquid flow rate (see Fig. 6). However, the increase was found to be non-linear, since at higher liquid flow rates the liquid volume in the stripping coil also increases. Thus, an increasing content of nitrite HONO remains in the liquid phase according to Henry's law.

Figure 6Nitrite liquid flow rate dependence (10, 20, 30, and 40 rpm of the peristaltic pump) of NOy, HONO, and the NOx HONO ratio of the HONO source (NO = 0.4 mg L−1, T = 15.9 ∘C, = 1570 cm3 min−1, pH = 2.47). The error bars represent the precision errors (2σ), which are only visible for the NOx HONO ratio but smaller than the size of the symbols for HONO and NOy.
No significant impact of the NOx formation on the liquid flow was observed (see Fig. 6). This could be explained by the heterogeneous back-reaction of equilibrium (R1) that only occurs on the surface of the stripping coil, which is not affected by the liquid flow rate. In contrast, if the decomposition of HONO proceeded via a liquid phase reaction, the NOx content should increase with the liquid flow rate. As expected, the time response of the source was observed to decrease with the liquid flow rate, which can be explained by faster liquid exchange in the stripping coil.
3.5 Temperature dependence
Since the solubility of HONO is temperature dependent (Park and Lee, 1988), also the temperature of the stripping coil was varied in the range 5.4–18.6 ∘C. The maximum temperature of the stripping coil is limited to a few degrees Celsius below the laboratory temperature to exclude condensation of water on surfaces behind the stripping coil. Here, a strong fluctuation of the HONO concentration was observed when the source was operated close to the dew point of water. The lower temperature limit is given by the power of the Peltier cooler of the source. Besides the HONO levels, also the absolute humidity of the gas phase can be varied by the temperature of the stripping coil (see the Clausius–Clapeyron relation).
As expected from the known solubility data (Park and Lee, 1988; Becker et al., 1996), the HONO concentration of the source was found to increase with the temperature (see Fig. 7). In contrast, the NOx content of the source was slightly decreasing with the temperature, which was not caused by decreasing absolute NOx concentrations but by the increasing HONO levels.
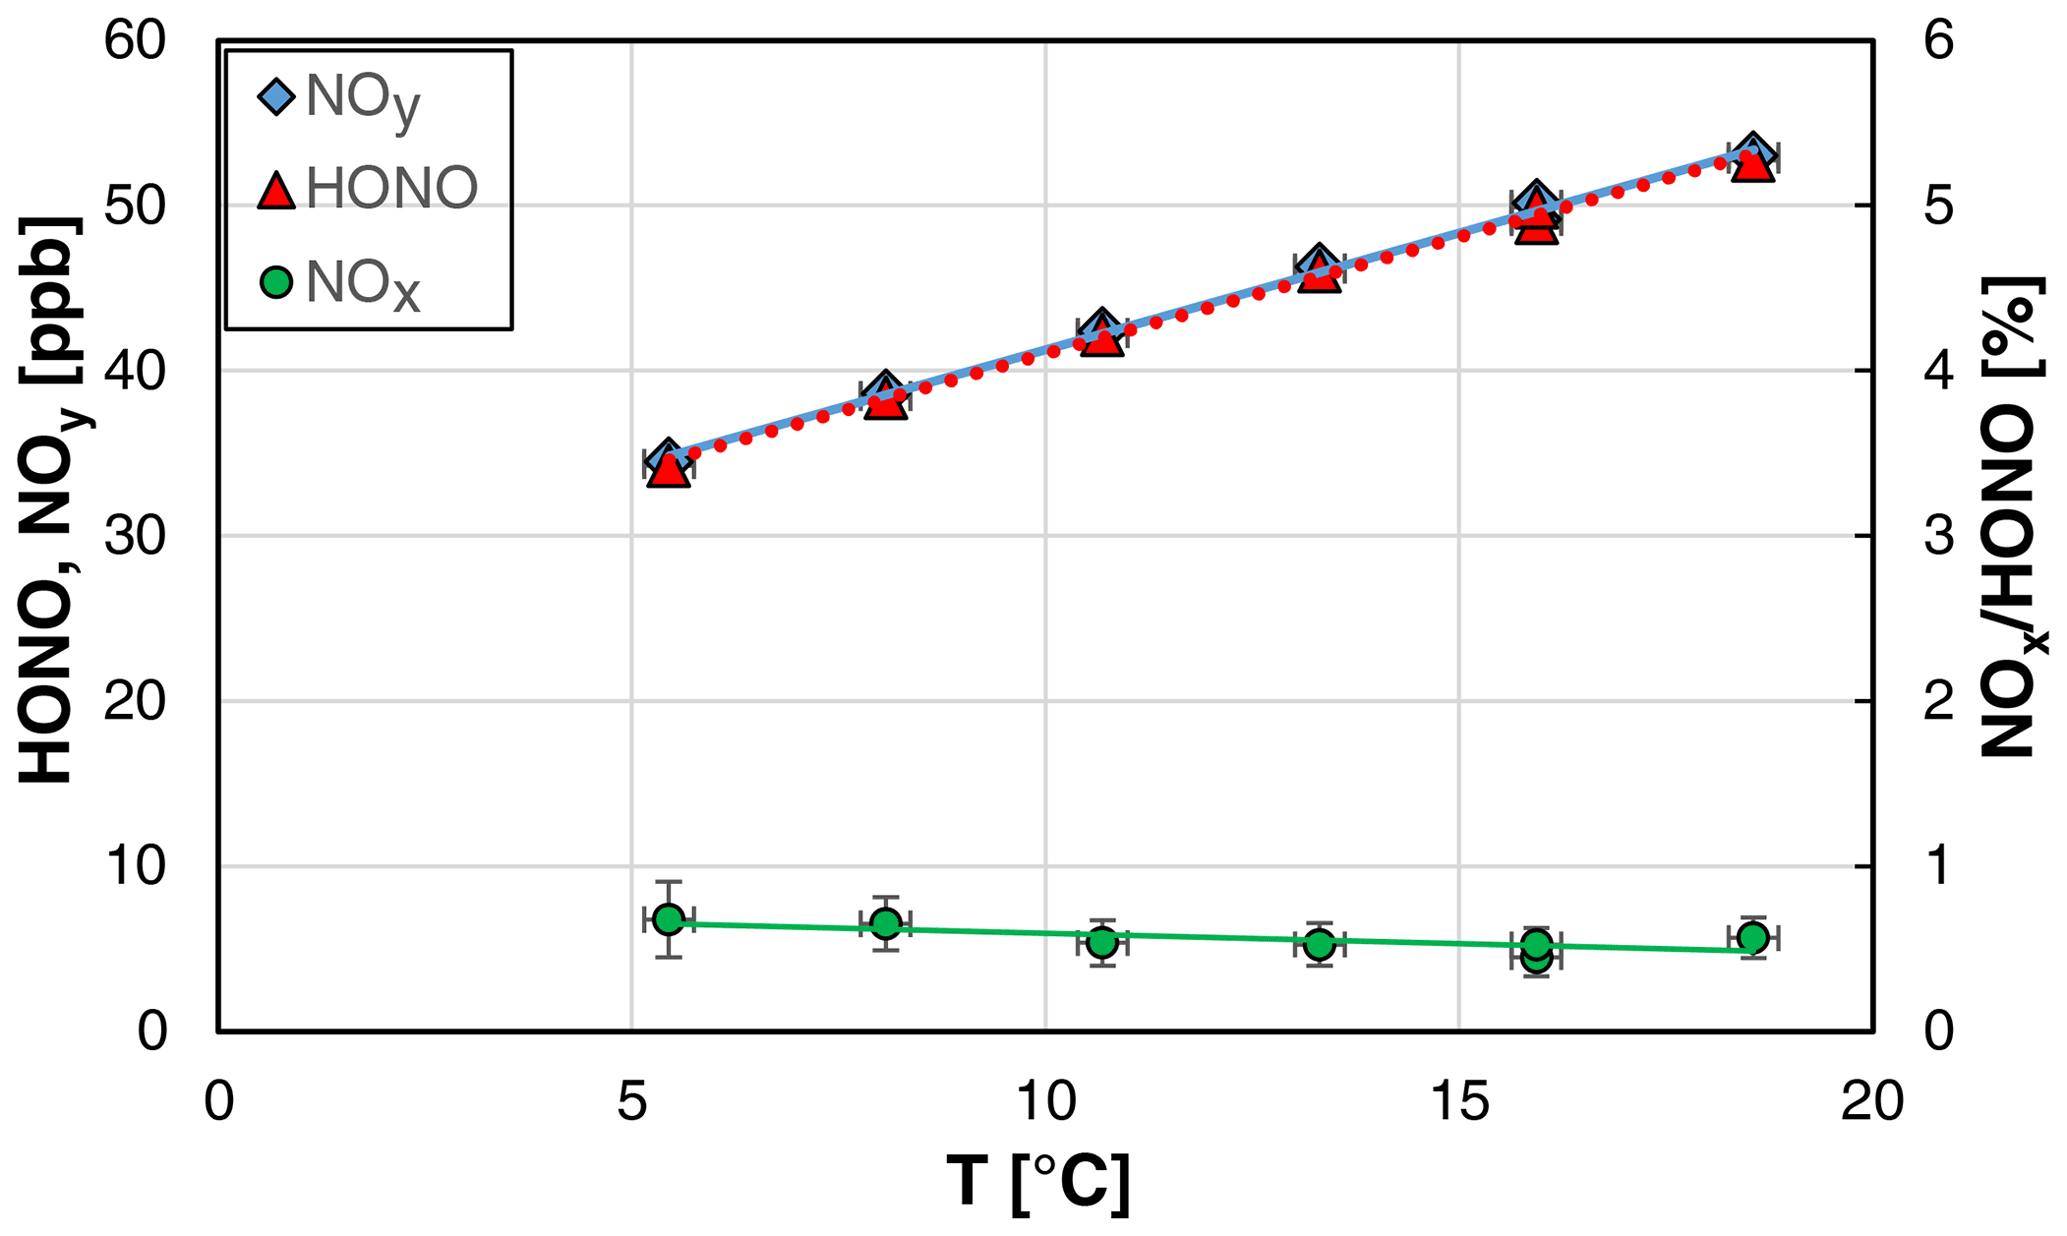
Figure 7Temperature dependence of NOy, HONO, and the NOx HONO ratio of the HONO source (NO = 0.8 mg L−1, = 1570 cm3 min−1, 20 rpm, pH = 2.46). The y error bars represent the precision errors (2σ), which are only visible for the NOx HONO ratio but smaller than the size of the symbols for HONO and NOy. Accuracy errors of the temperature of ±0.3 ∘C are also shown.
Similar to the other experiments, the theoretical HONO concentrations calculated by Eq. (3) (see Sect. 4.2) were adjusted to the measured values by varying the pKa for acid dissociation, equilibrium (R6), leading to a decreasing pKa with increasing temperature; for the quantitative description, see Sect. 3.1.
3.6 Stability test
To test the long-term stability and precision, the source was operated overnight at constant experimental conditions at a low liquid pump speed of 10 rpm, leading to reduced liquid consumption and a time response (0 %–90 %) of the source of ∼ 4 min. At high HONO mixing ratios of ∼ 33 ppb, the precision of the source was < 1 % (2σ noise: 0.76 %); see Fig. 8. This high precision is similar to the precision of the chemiluminescence instrument used to quantify the HONO source. Thus, the given precision error of the source is even an upper limit. When a much lower mixing ratio of ∼ 0.5 ppb was used, almost the same precision of 1.1 % was obtained (see Fig. 8). However, caused by the lower HONO level applied, the much more sensitive LOPAP technique was used for quantification. The LOPAP instrument had a detection limit of 2 ppt and a precision of 1.0 % for the experimental conditions applied, explaining the slightly lower precision of the data. In good agreement with the results shown in Sect. 3.2, an excellent linear correlation of the HONO mixing ratio with the nitrite concentration was also observed (R2 = 0.9997) in the very low-concentration range of 0.05–0.5 ppb (see Fig. 8). The two experiments show that the precision of the HONO source does not depend on the HONO concentration in agreement with the used concept of the source. The variability of the HONO emission only depends on the mixing of the two reagents at the inlet of the stripping coil (see Fig. 1) and the stabilities of the gas and liquid flows. These parameters will not change with the nitrite concentration.
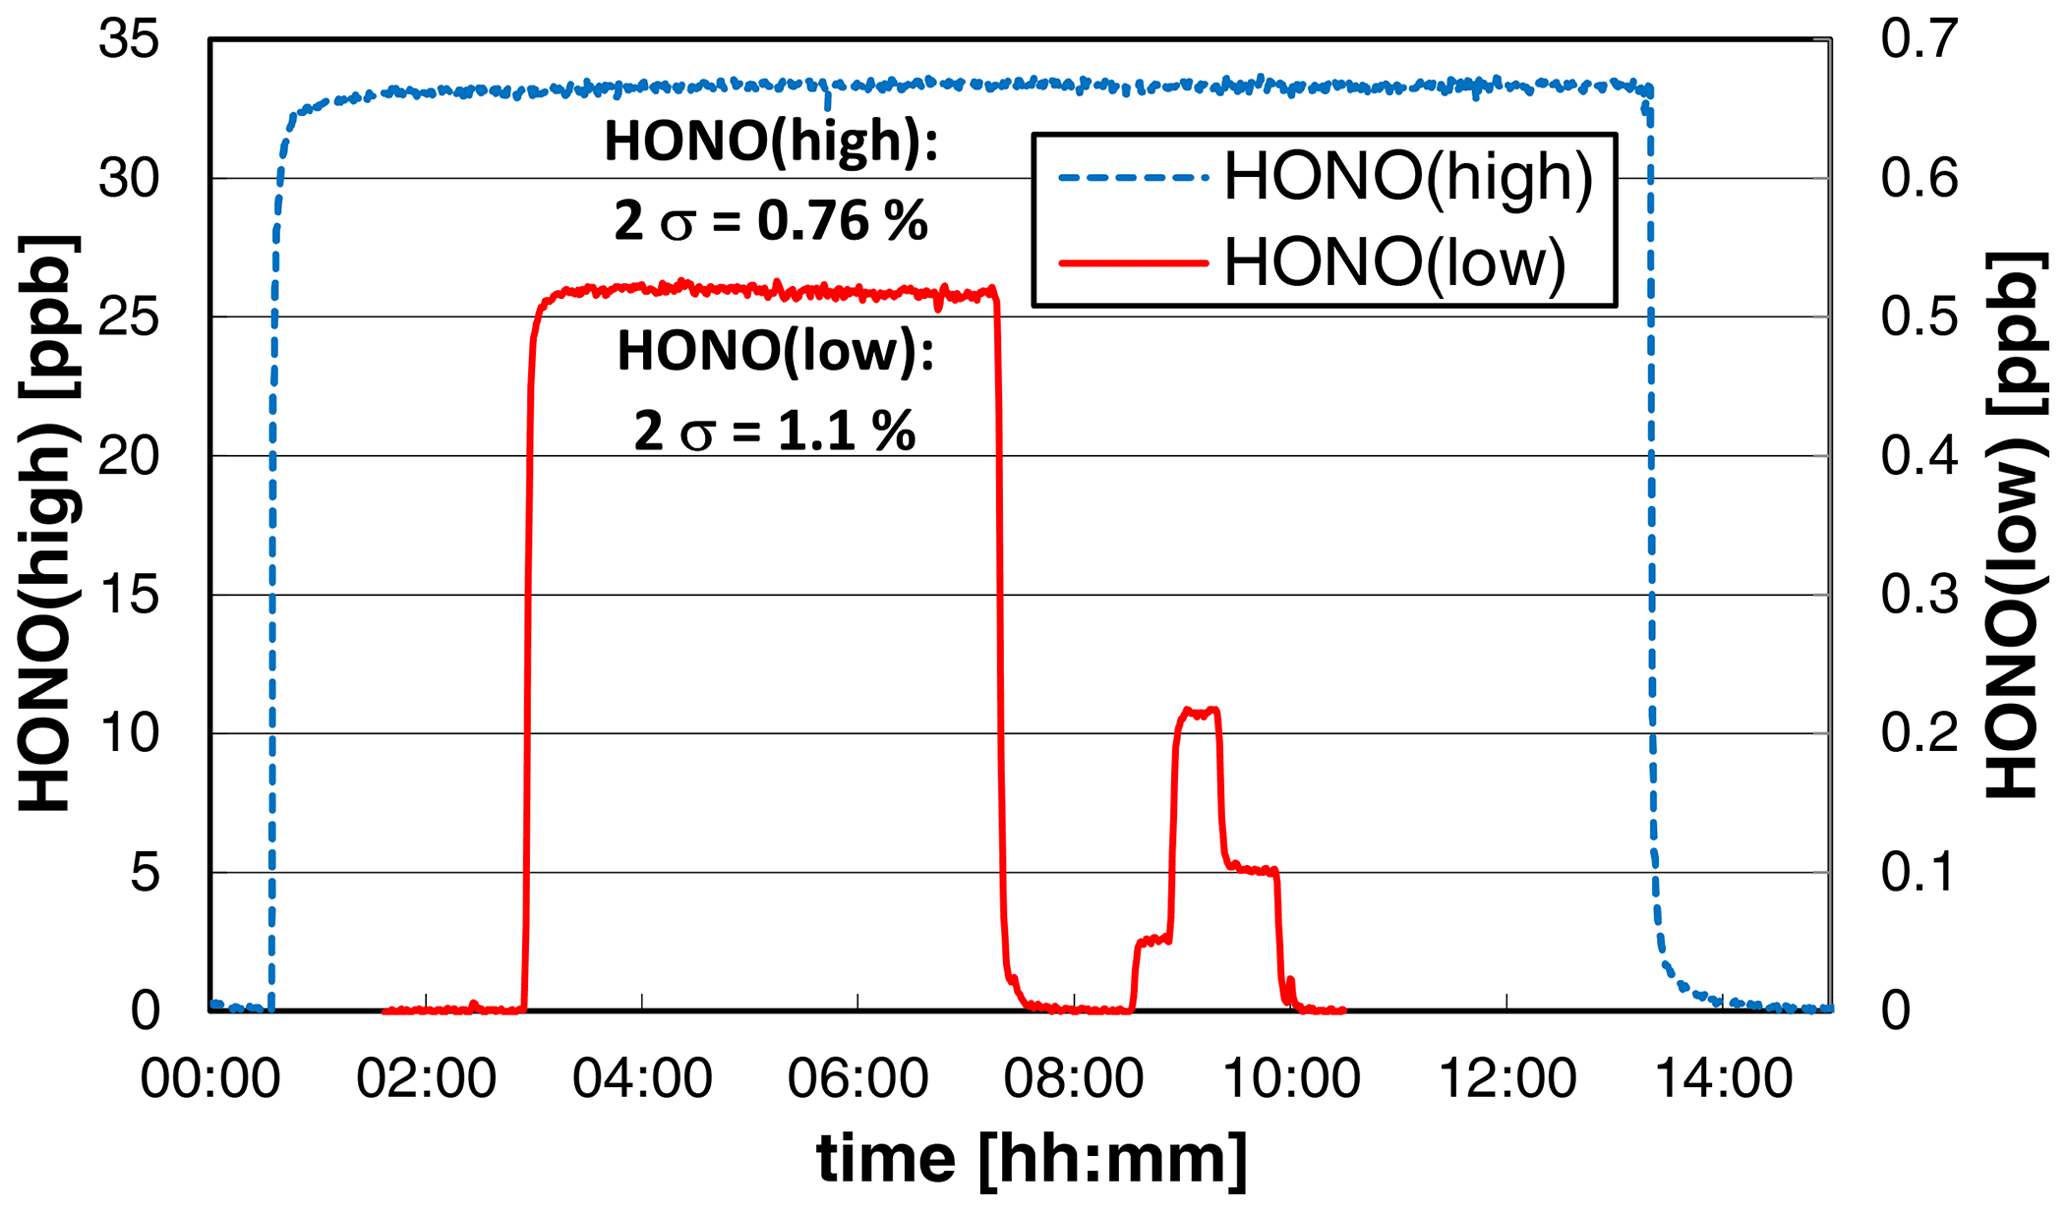
Figure 8Stability tests of the HONO source at different HONO mixing ratios. On the left axis the chemiluminescence data of a high-concentration experiment (NO = 0.8 mg L−1, T = 15.9 ∘C, = 1570 cm3 min−1, 10 rpm, pH = 2.47) and on the right axis the LOPAP data at lower concentrations (NO = 0.01 (0.001/0.004/0.002) mg L−1, T = 15.9 ∘C, = 2104 cm3 min−1, 20 rpm, pH = 2.54) are shown. For zero measurements the source was operated under water.
With the reduced liquid flow rate and using the internal liquid containers of the instrument, the source can be continuously operated for ∼ 43 h. If longer operation is necessary, 5 L (nitrite, H2SO4) and 10 L (waste) liquid bags could be used. However, for such long periods the liquid flow rate of a peristaltic pump typically slightly decreases with time, leading to some expected drift of the HONO source. In this case, the liquid flow rates (nitrite, waste) should be regularly measured and included in the calculation of the theoretical HONO concentration; see Sect. 4.2.
4.1 General considerations
In the present study a new HONO source was developed and characterized. In contrast to most recent studies (Ren et al., 2010; Reed et al., 2016; Gingerysty and Osthoff, 2020; Lao et al., 2020), HONO is produced by the reaction of nitrite and H2SO4 in the liquid phase. In a stripping coil reactor, HONO partitions to the gas phase according to its known moderate solubility in acidic solutions. The advantage of using H2SO4 is the missing formation of unwanted by-products like HCl and ClNO as observed in HONO sources using the volatile HCl, which are based on the original concept of Febo et al. (1995). While these sources can be carefully optimized for low by-product formation (Febo et al., 1995; Gingerysty and Oshoff, 2020; Lao et al., 2020), the use of the non-volatile H2SO4 completely excludes the still existing risk of any malfunction of the source. For example, when the Febo et al. (1995) source was used in our laboratory 2 decades ago (Brust et al., 2000), we often had problems related to the homogeneous mixing of the solid NaNO2 and the use of low relative humidity, leading to a lower purity of HONO.
Further advantages of the new HONO source are as follows:
-
The high time response (0 %–90%) of 1.5–7 min depending on the liquid flow rates and the HONO concentration levels used. For a typical pump speed of 20 rpm and HONO levels > 20 ppb, a time response of 2 min was observed. In contrast, the sources of Taira and Kanda (1990) and Febo et al. (1995) show much longer time responses. Even when the original source from Febo et al. (1995) was optimized by using a modified HCl permeation source and a solid NaNO2-coated flow tube reactor, HONO stabilization times of 2 h were observed, after the HCl permeation source was running constantly (Lao et al., 2020). Furthermore, for the HCl permeation source stabilization times of a week and more were necessary, still leading to some unwanted peaks of the permeation rate after this long stabilization time (Lao et al., 2020). In contrast, the present HONO source can be started under water, which can additionally be used to zero any HONO instrument, and after 1 h stabilization of the liquid flow rate of the peristaltic pump stable HONO concentrations are obtained in a few minutes, when water is exchanged by the nitrite and H2SO4 reagents.
-
The wide mixing ratio range of 0.05–500 ppb, simply by changing the nitrite concentration. Variable HONO mixing ratios can be important in laboratory studies but are also necessary when HONO instruments with non-linear response are calibrated (Jurkat et al., 2011). A very linear correlation between HONO and nitrite is observed. Different concentrated nitrite solutions can be easily made with high accuracy by the dilution of a stock solution using volumetric pipettes and flasks. In contrast, for the source of Febo et al. (1995), different concentrated HCl solutions and HCl temperatures have to be used to adjust the output of the source, which is much more difficult and time-consuming. Dilution of the source by synthetic air and using flow controllers is not recommended, due to the decreasing precision of the source and the resulting variable humidity. The latter can be a problem when a humidity-dependent HONO instrument is characterized, e.g. when the CIMS (chemical ionization mass spectrometer) technique is used (Jurkat et al., 2011). In contrast, for the present source, variable HONO concentrations are obtained for constant humidity.
-
The high purity of the source. For HONO mixing ratios < 20 ppb, no NOx formation and a purity of > 99.8 % are observed. And even at high HONO levels of 500 ppb the purity of the source is > 98 %. In contrast, for other recent HONO sources only purities > 95 % and > 90% were observed, respectively (Gingerysty and Osthoff, 2020; Lao et al., 2020).
-
The high long-term stability and precision of the source. After stabilization, an upper-limit 2σ precision of the source of 0.76 % was observed, which is similar to the precision error of the used NOx instrument.
-
The wide variability of the experimental conditions. Here, the liquid and gas flow rates and the temperature can be varied, leading, for example, to variable humidity, time response, and reagent consumption of the source.
-
The predictability of the HONO output. The absolute HONO concentration can be calculated based on Henry's law with high accuracy (see next Sect. 4.2), which offers for the first time the possibility of using a HONO source for the absolute calibration of HONO instruments.
4.2 Theoretical calculation of the HONO concentration
When the acidity of the reaction mixture was fixed to pH ≈ 2.5, for which the effective solubility of HONO is described well by the Henry's law solubility and the acid dissociation equilibrium (R6) (see Sect. 3.1), the experimental HONO mixing ratios of the source are calculated by Eq. (3):
where represents the nitrite concentration (g L−1), is the nitrite liquid flow rate (L min−1), NA is the Avogadro constant (6.02214 × 10²³ molecules mol−1), is the molar mass of nitrite (46.005 g mol−1), ϕwaste is the liquid flow rate of the waste (L min−1), is the effective Henry's law constant (mol L−1 atm−1, see Sect. 3.1), p is the ambient pressure (atm), is the number density of the gas phase according to the ideal gas law at ambient pressure and temperature of the stripping coil (molecules cm−3), and is the gas flow rate at ambient pressure and temperature of the stripping coil and considering the evaporation of water at the temperature of the stripping coil (cm3 min−1). is calculated by
where is the gas flow rate (cm3 min−1) of the calibrated flow controller at dry standard conditions (T∅ = 298.15 K, p∅ = 1 atm) and Texp. and pexp. are the experimental temperature (K) and pressure (atm), respectively. To calculate the water vapour pressure pwater (atm), the Magnus equation was used (Alduchov and Eskridge, 1996):
The measured liquid flow rate of the waste ϕwaste was in excellent agreement with the sum of the flow rates of nitrite and H2SO4 considering the theoretical water evaporation in the stripping coil, confirming an almost complete saturation of the gas phase by water vapour at the temperature of the stripping coil. The liquid flow rates were measured by the time taken to fill up 5 mL volumetric flasks.
When all experimental data described in the previous sections, excluding the pH dependence (see Sect. 3.1), were compared to the theoretical HONO concentrations, a weighted average ratio of [HONO]exp. [HONO]theo. of 0.996 was observed. This excellent agreement is trivial, since the applied pKa was derived from the average of all individual adjusted values for fitting the theoretical HONO mixing ratios to the measured values; see Sect. 3.1. However, more importantly, the average 1σ standard deviation of all [HONO]exp. [HONO]theo. ratios was only 3.8 %, despite the high variability of the experimental conditions applied. When the less precise data at [HONO] < 5 ppb were excluded, the average 1σ standard deviation of the [HONO]exp. [HONO]theo. ratios was only 1.7 %, showing the very high precision of the source. The lower precision of the data at HONO mixing ratios < 5 ppb is not caused by the precision of the HONO source but by the lower precision of the chemiluminescence instrument used. This is confirmed by the low-concentration data shown in Fig. 8 determined by the much more sensitive LOPAP technique, for which an average deviation between experimental and theoretical HONO mixing ratios of only 1.2 ± 1.6 % was observed in the range 0.05–0.5 ppb.
Besides this high precision, also a high accuracy of better than 10 % is estimated for the HONO source, which is mainly based on the accuracy of the used chemiluminescence monitor (3 %), the precision error of all data for HONO concentrations > 5 ppb (1.7 %), and the errors in the different variables used in Eq. (3). For the liquid nitrite concentration, an accuracy of typically 3 %–4 % is obtained, considering the accuracy of the nitrite stock solution of 1000 mg L−1 (1 %) and those of the used volumetric pipettes and flasks. An accuracy of 2 % is estimated for the gas flow rate, since the flow controller was used at 50 %–100 % of its nominal flow rate. In addition, it was calibrated during the experiments with a soap bubble flow tube, for which temperature, pressure, and water evaporation were carefully considered. Accuracies of the liquid flow rates of 1 % are estimated. The error of the theoretical HONO concentration induced by the pH measurements is estimated to be 1.5 %. And finally, the error introduced by the uncertainty of the stripping coil temperature of ±0.5 ∘C is 1 %. By error propagation a combined accuracy of ±5.8 % is obtained.
Because of the accuracy of better than 10 %, the HONO source can be used as a standalone device to absolutely calibrate HONO instruments, for which no simple calibration is available, e.g. mass spectrometers. In contrast, instruments which measure HONO after sampling in a liquid phase (e.g. HPLC, high-performance liquid chromatography; WEDD, wetted effluent diffusion denuder; and LOPAP) can typically be calibrated by using liquid nitrite standards. However, even these instruments need careful characterization, for example of the sampling and detection efficiencies, where a pure HONO source would be also very helpful. And finally, the HONO source can be used to study the chemistry of HONO in the laboratory.
In the present study, a HONO source is developed and characterized, which is based on the effective Henry's law solubility of HONO in water. Diluted nitrite and sulfuric acid solutions are mixed in a temperature-controlled stripping coil, which is operated with pure nitrogen or synthetic air at gas flow rates of 0.5–2 L min−1. Under the acidic conditions of the combined reaction mixture (pH ≈ 2.5), nitrite is almost completely converted into HONO, which partitions to the gas phase. The known Henry's law constant of HONO in H2SO4 is used for the calculation of the effective solubility. In addition, in the present study the acid dissociation equilibrium is described by p. The pKa of 3.0 ± 0.1 (1σ) at 25 ∘C is in good agreement with the range of 2.8–3.28 published in former studies. The source shows a fast time response of ∼ 2 min (0 %–90 %) at higher concentrations and an excellent long-term stability (2σ noise of 0.76 %). The HONO emission of the source perfectly correlates with the nitrite concentration from the sub-ppb range up to 500 ppb. The rate of NOx formation increases quadratically with the HONO concentration from non-detectable values at atmospheric relevant HONO concentrations reaching a NOx content of 1.6 % at 500 ppb. A general equation based on the effective Henry's law solubility is developed, by which the HONO concentration of the source can be calculated using measured experimental parameters, i.e. nitrite concentration, liquid flow rates, gas flow rate, pH of the solution, and temperature of the stripping coil. An average deviation between the measured and theoretical HONO concentration of only ±3.8 % is observed, and a conservative accuracy of the calculated HONO concentration of better than 10 % is estimated. Thus, for the first time, a HONO source is developed, which can be used for the absolute calibration of HONO instruments.
The underlying data are available upon request.
GV conducted and evaluated most of the experiments. JK developed the HONO source, conducted and evaluated a few experiments, developed the theoretical calculation of the HONO mixing ratio, and wrote the manuscript.
The contact author has declared that neither they nor their co-author has any competing interests.
Publisher’s note: Copernicus Publications remains neutral with regard to jurisdictional claims in published maps and institutional affiliations.
We would like to thank the three anonymous referees for their comments, which helped to improve our manuscript.
This paper was edited by Mingjin Tang and reviewed by three anonymous referees.
Acker, K., Möller, D., Wieprecht, W., Meixner, F. X., Bohn, B., Gilge, S., Plass-Dülmer, C., and Berresheim, H.: Strong Daytime Production of OH from HNO2 at a Rural Mountain Site, Geophys. Res. Lett., 33, L02809, https://doi.org/10.1029/2005GL024643, 2006.
Alduchov, O. A. and Eskridge, R. E.: Improved Magnus Form Approximation of Saturation Vapor Pressure, J. Appl. Meteorol., 35, 601–609, https://doi.org/10.1175/1520-0450(1996)035<0601:IMFAOS>2.0.CO;2, 1996.
Bates, R. G.: Determination of pH, Theory and Practice, John Wiley & Sons, New York, ISBN 0-471-05647-2, 1973.
Becker, K. H., Kleffmann, J., Kurtenbach, R., and Wiesen, P.: Solubility of Nitrous Acid (HONO) in Sulfuric Acid Solutions, J. Phys. Chem., 100, 14984–14990, https://doi.org/10.1021/jp961140r, 1996.
Braman, R. S. and de la Cantera, M. A.: Sublimation Source for Nitrous Acid and Other Nitrogen Compounds in Air, Anal. Chem., 58, 1533–1537, https://doi.org/10.1021/ac00298a059, 1986.
Brust, A. S., Becker, K. H., Kleffmann, J., and Wiesen, P.: UV Absorption Cross Sections of Nitrous Acid, Atmos. Environ., 34, 13–19, https://doi.org/10.1016/S1352-2310(99)00322-2, 2000.
da Silva, G., Kennedy, E. M., and Dlugogorski, B. Z.: Ab Initio Procedure for Aqueous-Phase pKa Calculation: The Acidity of Nitrous Acid, J. Phys. Chem. A, 110, 11371–11376, doi:10/1021/jp0639243, 2006.
Febo, A., Perrino, C., Gherardi, M., and Sparapani, R.: Evaluation of a High-Purity and High-Stability Continuous Generation System for Nitrous Acid, Environ. Sci. Technol., 29, 2390–2395, https://doi.org/10.1021/es00009a035, 1995.
Gingerysty, N. J. and Osthoff, H. D.: A compact, high-purity source of HONO validated by Fourier transform infrared and thermal-dissociation cavity ring-down spectroscopy, Atmos. Meas. Tech., 13, 4159–4167, https://doi.org/10.5194/amt-13-4159-2020, 2020.
Gu, R., Zheng, P., Chen, T., Dong, C., Wang, Y., Liu, Y., Liu, Y., Luo, Y., Han, G., Wang, X., Zhou, X., Wang, T., Wang, W., and Xue, L.: Atmospheric Nitrous Acid (HONO) at a Rural Coastal Site in North China: Seasonal Variations and Effects of Biomass Burning, Atmos. Environ., 229, 117429, https://doi.org/10.1016/j.atmosenv.2020.117429, 2020.
Heland, J., Kleffmann, J., Kurtenbach, R., and Wiesen, P.: A New Instrument to Measure Gaseous Nitrous Acid (HONO) in the Atmosphere, Environ. Sci. Technol., 35, 3207–3212, https://doi.org/10.1021/es000303t, 2001.
Jurkat, T., Voigt, C., Arnold, F., Schlager, H., Kleffmann, J., Aufmhoff, H., Schäuble, D., Schaefer, M., and Schumann, U.: Measurements of HONO, NO, NOy and SO2 in aircraft exhaust plumes at cruise, Geophys. Res. Lett., 38, L10807, https://doi.org/10.1029/2011GL046884, 2011.
Kirchner, J. J. and Hopkins, P. B.: Nitrous Acid Cross-Links Duplex DNA Fragments through Deoxyguanosine Residues at the Sequence 5'-CG, J. Am. Chem. Soc., 113, 4681–4682, https://doi.org/10.1021/ja00012a047, 1991.
Kleffmann, J.: Daytime Sources of Nitrous Acid (HONO) in the Atmospheric Boundary Layer, Chem. Phys. Chem., 8, 1137–1144, https://doi.org/10.1002/cphc.200700016, 2007.
Kleffmann, J. and Wiesen, P.: Technical Note: Quantification of interferences of wet chemical HONO LOPAP measurements under simulated polar conditions, Atmos. Chem. Phys., 8, 6813–6822, https://doi.org/10.5194/acp-8-6813-2008, 2008.
Kleffmann, J., Heland, J., Kurtenbach, R., Lörzer, J., and Wiesen, P.: A New Instrument (LOPAP) for the Detection of Nitrous Acid (HONO), Environ. Sci. Pollut. Res., 9 (special issue 4), 48–54, 2002.
Kleffmann, J., Benter, T., and Wiesen, P.: Heterogeneous Reaction of Nitric Acid with Nitric Oxide on Glass Surfaces under Simulated Atmospheric Conditions, J. Phys. Chem. A, 108, 5793–5799, https://doi.org/10.1021/jp040184u, 2004.
Kleffmann, J., Gavriloaiei, T., Hofzumahaus, A., Holland, F., Koppmann, R., Rupp, L., Schlosser, E., Siese, M., and Wahner, A.: Daytime Formation of Nitrous Acid: A Major Source of OH Radicals in a Forest, Geophys. Res. Lett., 32, L05818, https://doi.org/10.1029/2005GL022524, 2005.
Lao, M., Crilley, L. R., Salehpoor, L., Furlani, T. C., Bourgeois, I., Neuman, J. A., Rollins, A. W., Veres, P. R., Washenfelder, R. A., Womack, C. C., Young, C. J., and VandenBoer, T. C.: A portable, robust, stable, and tunable calibration source for gas-phase nitrous acid (HONO), Atmos. Meas. Tech., 13, 5873–5890, https://doi.org/10.5194/amt-13-5873-2020, 2020.
Ma, J., Liu, Y., Han, C., Ma, Q., Liu, C., and He, H.: Review of heterogeneous photochemical reactions of NOy on aerosol – A possible daytime source of nitrous acid (HONO) in the atmosphere, J. Environ. Sci., 25, 326–334, https://doi.org/10.1016/S1001-0742(12)60093-X, 2013.
Michoud, V., Colomb, A., Borbon, A., Miet, K., Beekmann, M., Camredon, M., Aumont, B., Perrier, S., Zapf, P., Siour, G., Ait-Helal, W., Afif, C., Kukui, A., Furger, M., Dupont, J. C., Haeffelin, M., and Doussin, J. F.: Study of the unknown HONO daytime source at a European suburban site during the MEGAPOLI summer and winter field campaigns, Atmos. Chem. Phys., 14, 2805–2822, https://doi.org/10.5194/acp-14-2805-2014, 2014.
Park, J.-Y. and Lee, Y.-N.: Solubility and Decomposition Kinetics of Nitrous Acid in Aqueous Solution, J. Phys. Chem., 92, 6294–6302, https://doi.org/10.1021/j100333a025, 1988.
Pitts Jr., J. N., Grosjean, D., Van Cauwenberghe, K., Schmid, J. P., and Fitz, D. R.: Photooxidation of Aliphatic Amines under Simulated Atmospheric Conditions: Formation of Nitrosamines, Nitramines, Amides, and Photochemical Oxidant, Environ. Sci. Technol., 12, 946–953, https://doi.org/10.1021/es60144a009, 1978.
Reed, C., Brumby, C. A., Crilley, L. R., Kramer, L. J., Bloss, W. J., Seakins, P. W., Lee, J. D., and Carpenter, L. J.: HONO measurement by differential photolysis, Atmos. Meas. Tech., 9, 2483–2495, https://doi.org/10.5194/amt-9-2483-2016, 2016.
Ren, X., Gao, H., Zhou, X., Crounse, J. D., Wennberg, P. O., Browne, E. C., LaFranchi, B. W., Cohen, R. C., McKay, M., Goldstein, A. H., and Mao, J.: Measurement of atmospheric nitrous acid at Bodgett Forest during BEARPEX2007, Atmos. Chem. Phys., 10, 6283–6294, https://doi.org/10.5194/acp-10-6283-2010, 2010.
Riordan, E., Minogue, N., Healy, D., O'Driscoll, P., and Sodeau, J. R.: Spectroscopic and Optimization Modeling Study of Nitrous Acid in Aqueous Solution, J. Phys. Chem. A, 109, 779–786, https://doi.org/10.1021/jp040269v, 2005.
Ródenas, M., Muñoz, A., Alacreu, F., Brauers, T., Dorn, H.-P., Kleffmann, J., and Bloss, W. J.: Assessment of HONO Measurements: The FIONA Campaign at EUPHORE, in: Disposal of Dangerous Chemicals in Urban Areas and Mega Cities. Role of Oxides and Acids of Nitrogen in Atmospheric Chemistry, edited by: Barnes, I. and Rudziński, K., NATO Science for Peace and Security Series C: Environmental Security, Springer, Dordrecht, 45–58, https://doi.org/10.1007/978-94-007-5034-0_4, 2013.
Seel, F. and Winkler, R.: Das Gleichgewicht salpetrige Säure–Stickoxydkation im System Schwefelsäure–Wasser, Z. Phys. Chem., 25, 217–232, https://doi.org/10.1524/zpch.1960.25.3_4.217, 1960.
Stemmler, K., Ammann, M., Donders, C., Kleffmann, J., and George, C.: Photosensitized Reduction of Nitrogen Dioxide on Humic Acid as a Source of Nitrous Acid, Nature, 440, 195–198, https://doi.org/10.1038/nature04603, 2006.
Taira, M. and Kanda, Y.: Continuous Generation System for Low-Concentration Gaseous Nitrous Acid, Anal. Chem., 62, 630–633, https://doi.org/10.1021/ac00205a018, 1990.
Večeřa Z. and Dasgupta, P. K.: Measurement of Ambient Nitrous Acid and a Reliable Calibration Source for Gaseous Nitrous Acid, Environ. Sci. Technol., 25, 255–260, https://doi.org/10.1021/es00014a006, 1991.
Večeřa, Z. and Dasgupta, P. K.: Indoor Nitrous Acid Levels. Production of Nitrous Acid from Open-Flame Sources, Int. J. Environ. Anal. Chem., 56, 311–316, https://doi.org/10.1080/03067319408034109, 1994.
Villena, G., Bejan, I., Kurtenbach, R., Wiesen, P., and Kleffmann, J.: Development of a new Long Path Absorption Photometer (LOPAP) instrument for the sensitive detection of NO2 in the atmosphere, Atmos. Meas. Tech., 4, 1663–1676, https://doi.org/10.5194/amt-4-1663-2011, 2011.
Villena, G., Bejan, I., Kurtenbach, R., Wiesen, P., and Kleffmann, J.: Interferences of commercial NO2 instruments in the urban atmosphere and in a smog chamber, Atmos. Meas. Tech., 5, 149–159, https://doi.org/10.5194/amt-5-149-2012, 2012.
Wayne, L. G. and Yost, D. M.: Kinetics of the Rapid Gas Phase Reaction between NO, NO2, and H2O, J. Chem. Phys., 19, 41–47, https://doi.org/10.1063/1.1747986, 1951.
Zhou, X., Zhang, N., TerAvest, M., Tang, D., Hou, J., Bertman, S., Alaghmand, M., Shepson, P. B., Caroll, M. A., Griffith, S., Dusanter, S., and Stevens, P. S.: Nitric Acid Photolysis on Forest Canopy Surface as a Source for Tropospheric Nitrous Acid, Nat. Geosci., 4, 440–443, https://doi.org/10.1038/NGEO1164, 2011.