the Creative Commons Attribution 4.0 License.
the Creative Commons Attribution 4.0 License.
 | 04 Nov 2022
Sizing ice hydrometeor populations using the dual-wavelength radar ratio
Sergey Y. Matrosov
Alexei Korolev
Mengistu Wolde
Cuong Nguyen
Dual-wavelength (3.2 and 0.32 cm, i.e., X- and W-radar bands) radar ratio (DWR) measurements in ice clouds and precipitation using Canada's National Research Council Institute for Aerospace Research airborne radar are compared to closely collocated particle microphysical in situ sampling data in order to develop relations between DWR and characteristic hydrometeor size. This study uses the radar and in situ data sets collected during the In-Cloud ICing and Large-drop Experiment (ICICLE) campaign in midlatitude frontal clouds. Since atmospheric particle scattering at X band is predominantly in the Rayleigh regime and the W-band frequency is the highest frequency usually used for hydrometeor remote sensing, the X–W-band combination provides a relatively strong dual-wavelength reflectivity difference. This study considers radar and in situ measurements conducted in relatively homogeneous cloud and precipitation conditions. Measurements show that under these conditions, the difference between the X-band radar reflectivities observed with vertical and horizontal pointing of the radar beam are generally small and often negligible. However, W-band reflectivities at vertical beam pointing are, on average, larger than those for horizontal beam pointing by about 4 dB, which is a non-Rayleigh scattering effect from preferentially oriented non-spherical particles. A horizontal radar beam DWR–mean volume particle size relation, Dv, provides robust estimates of this characteristic size for populations of particles with different habits. Uncertainties of Dv retrievals using DWR are around 0.6 mm when Dv is greater than approximately 1 mm. Size estimates using vertical radar beam DWRs have larger uncertainties due to smaller dual-wavelength signals and stronger influences of hydrometeor habits and orientations at this geometry of beam pointing. Mean relations among different characteristic sizes, which describe the entire particle size distribution (PSD), such as Dv, and other sizes used in various applications (e.g., the mean, effective, and median sizes) are derived, so the results of this study can be used for estimating different PSD characteristic sizes.
- Article
(4245 KB) - Full-text XML
- BibTeX
- EndNote


Multi-wavelength meteorological radar systems are useful tools for studies of clouds and precipitation. These systems are deployed at different locations such as ground-based facilities of the US Department of Energy's Atmospheric Radiation Measurement (ARM) sites (e.g., Kollias et al., 2014) as well as on airborne platforms (e.g., Heymsfield et al., 2016; Nguyen et al., 2022). The availability of simultaneous and approximately collocated radar measurements at different frequencies stimulated interest in the development of remote sensing approaches for hydrometeor property retrievals using multi-wavelength radar data.
Compared to single-wavelength measurements, multi-wavelength radar measurements of clouds and precipitation provide additional information on hydrometeor properties when deviations from the Rayleigh scattering regime (i.e., the scattering regime when scatterer sizes are much smaller than the radar wavelength) are different at different wavelengths. In the earlier studies of the multi-wavelength approach, it was shown (e.g., Matrosov, 1993; Hogan et al., 2000; Liao et al., 2005) that measurements at two wavelengths can be used to infer information on characteristic sizes of the ice hydrometeor populations. This information is important for many applications since the cloud feedback in models is strongly affected by the hydrometeor sizes (Tan and Storelvmo, 2019). Relatively recently, triple-wavelength radar approaches were developed for retrievals of hydrometeor properties and information on the ice cloud and precipitation processes, such as particle riming and aggregation (e.g., Kneifel et al., 2011; Tyynelä and Chandrasekar, 2014; Leinonen et al., 2018; Mason et al., 2019; Tridon et al., 2019; Mroz et al., 2021). Collocated triple-wavelength measurement systems, however, are not that widely available compared to dual-wavelength ones.
Reliable in situ information about the hydrometeor properties estimated from radar measurements is necessary for the assessment of the accuracy of remote sensing retrievals. To mitigate the effect of natural spatial inhomogeneity of cloud microstructure, it is important that the radar and in situ microphysical measurements are temporally and spatially collocated to the best possible extent. It can be achieved when both radar systems and in situ instruments are deployed on the same platform. One example of such platforms is the National Research Council of Canada (NRC) twin-engine Convair-580 research aircraft, which is equipped with collocated W-band (94.05 GHz) and X-band (9.41 GHz) radars (Wolde and Pazmany, 2005; Wolde et al., 2016; Nguyen et al., 2022) as well as state-of-the-art in situ microphysical instrumentation.
The data set used in this study was collected during the Federal Aviation Administration (FAA) In-Cloud ICing and Large-drop Experiment (ICICLE) campaign conducted in January–March 2019 (Bernstein et al., 2021). During this campaign, the NRC, in collaboration with the FAA and Environment and Climate Change Canada (ECCC), collected in situ and remote sensing measurements from the NRC Convair-580 aircraft in icing conditions. The flight operations were performed out of Rockford, Illinois. Although these studies primarily targeted supercooled liquid clouds, the data set obtained during the ICICLE campaign includes a variety of ice clouds and precipitation.
The main objective of this study was to develop and assess statistical relations between the dual-wavelength radar ratio and characteristic sizes of ice hydrometeor populations. Since recent studies (e.g., Matrosov et al., 2019) have indicated the dependence of dual-wavelength radar signatures on the pointing of the radar beam, another important task pursued by this study was evaluating influences of viewing geometry on radar measurements and particle size retrievals. Other objectives included assessment of the ability of single-frequency radar measurements to infer characteristic particle size and establishing statistical relations between various definitions of characteristic particle sizes used for describing hydrometeor populations.
2.1 Instrumentation
During the ICICLE campaign, airborne measurements of the radar reflectivity factor (hereafter, just reflectivity) aboard the Convair-580 aircraft were conducted using the NRC Airborne W- and X-band (NAWX) radar system (Wolde and Pazmany, 2005). The NAWX antenna configuration allows for simultaneous measurements of radar returns from three directions: (a) sideward (i.e., horizontal), (b) upward, and (c) downward. Horizontal polarization measurements of X-band (i.e., ZeX) and W-band (i.e., ZeW) equivalent reflectivity were further used in this study for all radar beam pointing directions. The dual-wavelength ratio – DWR (also sometimes referred to as the dual-frequency ratio – DFR) is expressed in logarithmic units as
Except in heavier precipitation, hydrometeor scattering at X-band frequency is mostly within the Rayleigh scattering regime (e.g., Matrosov et al., 2014). Some deviations from this regime occur for larger ice particles, whose sizes are greater than approximately 5 mm. With this lower frequency, the use of the higher W-band frequency provides the largest wavelength separation compared to other commonly used cloud radar frequencies (e.g., Ka band ∼ 35 GHz, Ku band ∼ 14 GHz). This results in stronger and more pronounced DWR signals compared to other cloud radar frequency pairs.
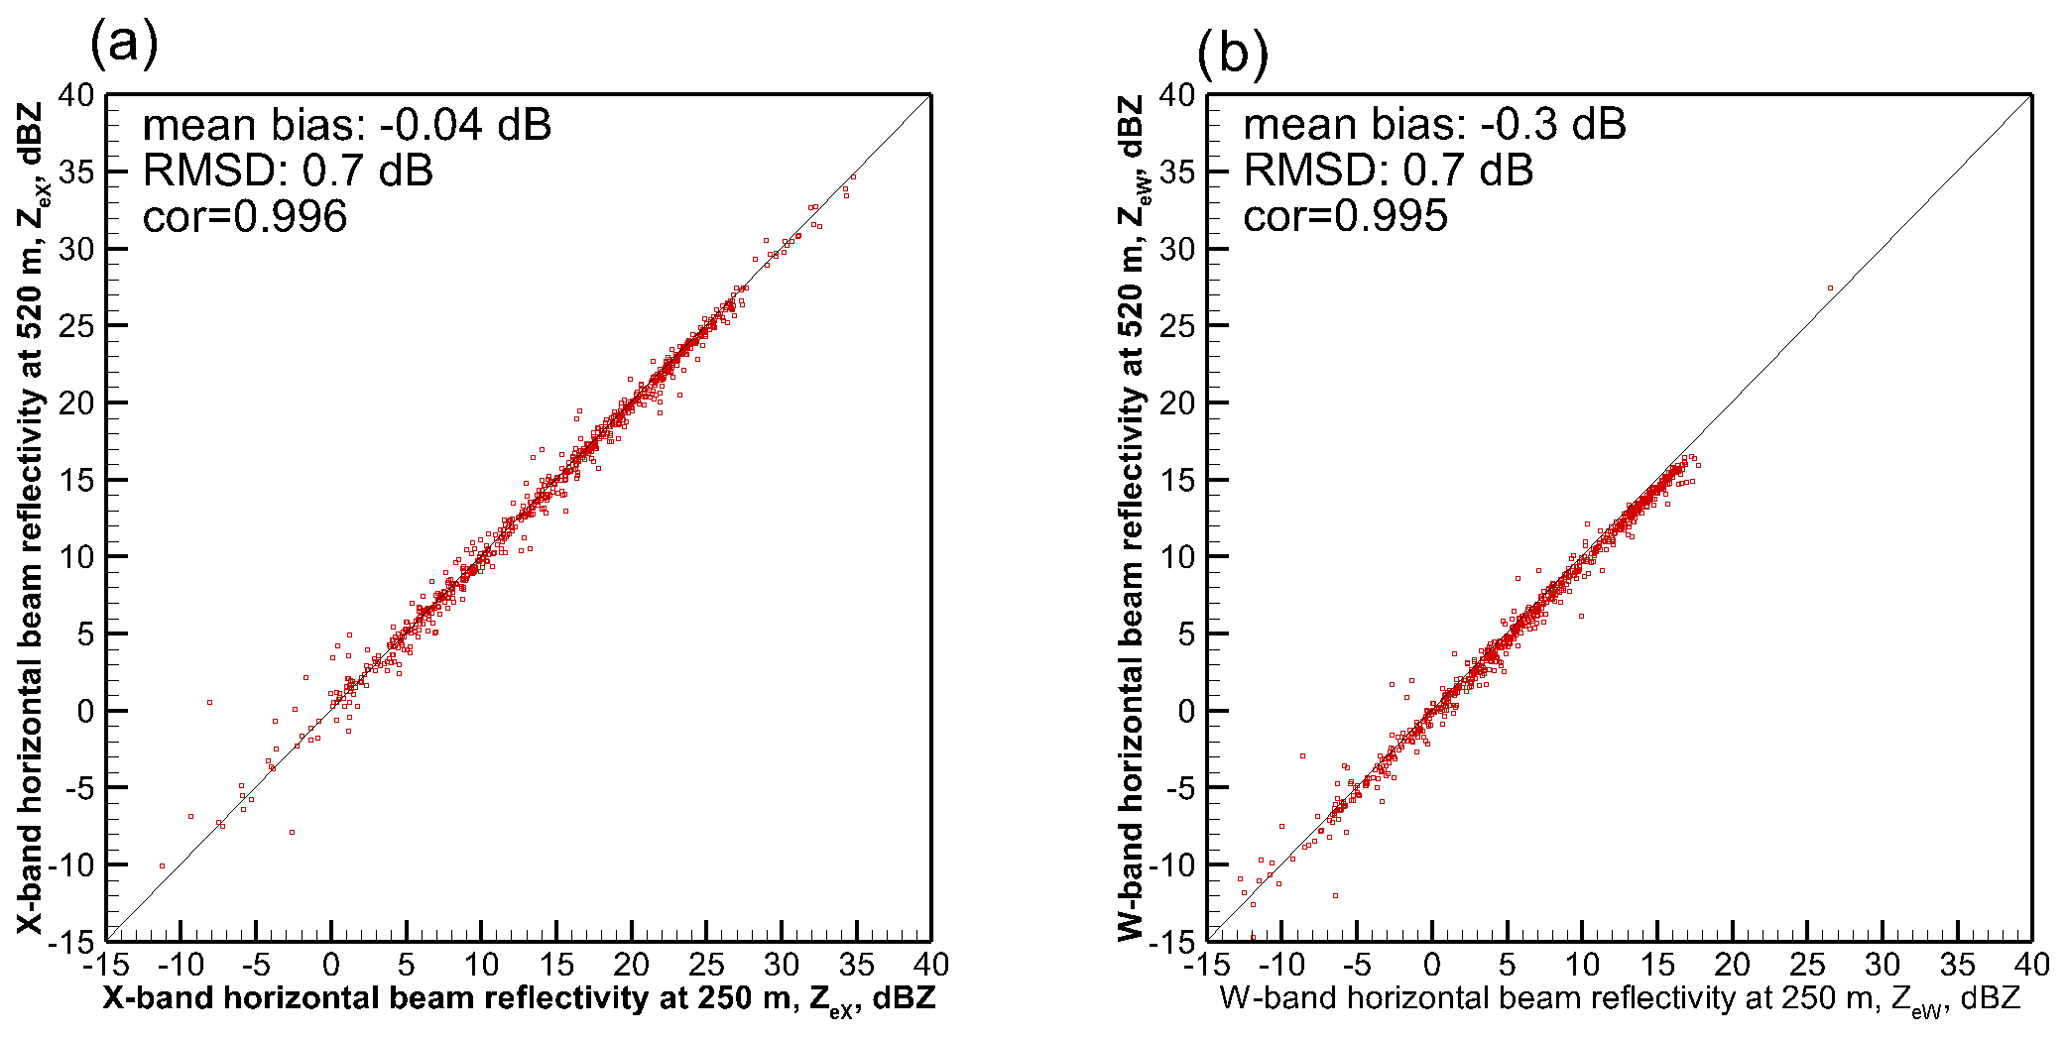
Figure 1Scatter plots of observed reflectivities at 250 and 520 m distances for (a) X-band and (b) W-band horizontal beam data.
The airborne in situ microphysical measurements were performed with an advanced suite of microphysical sensors. The Droplet Measurement Technologies (DMT) cloud droplet probe (CDP, Lance et al., 2010) and the Stratton Park Engineering Company (SPEC) fast cloud droplet probe (FCDP) (Lawson et al., 2017) were used for measurements of particles in the size range from 2 to 50 µm. The two-dimensional cloud optical array probe (OAP-2DC) (Knollenberg, 1981) was used to measure particles in the 50 µm–1.6 mm range. The SPEC 2D imaging-stereo (2D-S) probe covered measurements of cloud particles in the nominal size range from 10 to 1280 µm (Lawson et al., 2006). The SPEC high-volume precipitation spectrometer (HVPS) was employed for measurements of particles in the nominal size range from 200 µm to 1.92 cm (Lawson et al., 2017). The processing software applied retrieval algorithms of partially viewed particle images (Heymsfield and Parrish, 1979; Korolev and Sussman, 2000), which allowed the enhancement of particle statistics and extended the maximum size of the composite particle size distribution (PSD) up ∼ 3.8 cm. All particle probes were equipped with anti-shattering tips to mitigate the effect of ice shattering on the measurements of ice particle concentrations. The residual shattering artifacts were identified and filtered out with the help of the inter-arrival time algorithm (Field et al., 2006; Korolev and Field, 2015). Calculations of composite PSDs for ice cloud segments employed 2D-S and HVPS measurements in the following size subranges (the midpoints are shown): 40 to 670 µm (at 10 µm resolution) and 750 µm to 3.84 cm (at 150 µm resolution), respectively. Liquid versus ice hydrometeor type identification was performed based on the analysis of measurements of a combination of the Rosemount Icing Detector (RID, Mazin et al., 2001), the particle scattering probes (CDP, FCDP), the Cloud Particle Imager (CPI, Lawson et al., 2001), and the 2D-S probe. The analysis of the RID and scattering probe measurements was primarily used to identify the presence of small liquid cloud droplets. The CPI and 2D-S imagery was used to identify drizzle or rain.
2.2 Methodology and data sets
Of main interest to this study were ice hydrometeors observed at temperatures below freezing in relatively spatially homogeneous cloud conditions, so the relations between DWR and reflectivities observed at a distance of several hundred meters, where radar measurements are reliable, and microphysical data aboard the aircraft can be robustly assessed. The selected data excluded in-cloud segments in the proximity of cloud boundaries. This ensured availability of meaningful radar measurements at both frequencies for all radar beam pointing directions up to a 520 m range gate. Such conditions were observed for extended periods (>1 h) during ICICLE flights 5, 9, 15, 16, 20, and 29, and they were further used in this study. The vertical beam pointing reflectivity is defined as an average between reflectivities measured at upward and downward directions. The averaging was performed in the linear units of mm6 m−3. The radar and microphysical data were averaged in 30 s intervals. Deviations of upward and downward radar beam pointing from the true vertical direction generally do not exceed a few degrees, and they were neglected. The radar and microphysical in situ data are available from Nguyen and Wolde (2020a, b) and Korolev and Heckman (2020a, b). The microphysical data were processed using the ECCC D2G software.
In order to minimize the influence of supercooled water drops on reflectivity measurements and to avoid contamination by melting layer particles, the time periods when the temperature at the aircraft level was higher than −2 ∘C were excluded. Data collected during mixed-phase periods when estimates of liquid drop mean volume diameter (MVD) were greater than 10 % of ice particle MVD values and liquid water content values were larger than 0.05 g m−3 were also excluded. These exclusions ensure that the liquid-phase contribution (if any) to the total reflectivity is generally negligible and the radar echoes are dominated by ice hydrometeors. Furthermore, since this study considered radar measurements in an ice cloud environment at close ranges, the radar signal attenuation was neglected.
The 250 m range is the nearest to the aircraft, where NAWX radar measurements can be considered reliable (Nguyen et al., 2022). Therefore, the radar and in situ data were spatially separated by 250 m. Since objectives of this study included establishing relations between the radar measurements and cloud microphysical parameters, it is important that clouds are relatively homogeneous at scales of several hundred meters. In order to evaluate homogeneity of clouds for the data set considered in this study, Fig. 1 shows the data scatter between reflectivities observed with the horizontal radar beam pointing at a 250 and 520 m distances from the aircraft. As seen from this figure, correlations between 250 and 520 m reflectivities are very high (≥ 0.995) at both frequencies. The root mean square deviation (RMSD) and bias values between 250 and 520 m reflectivities are generally small and on the order of radar measurement uncertainties. Such spatial homogeneity of radar reflectivity satisfies the objectives of this study.
Characteristic sizes of PSDs are often defined as a ratio of different PSD moments. The PSD Nth moment is defined as
where Di, ΔDi, and n(Di) are the bin center, bin width, and particle concentration per a particle size unit in the ith bin of the composite ice PSD measured by the microphysical probes, and the summation is performed over all bin sizes. Individual particle sizes, Di, are given in terms of the major dimensions of 2D images of the particles. The X–W-band DWR–characteristic sizes relations in this study are sought in terms of the mean volume particle size (also sometimes referred to as a volume moment mean size):
This size is retrieved in a number of polarimetric radar remote sensing approaches (e.g., Ryzhkov et al., 2018). Mean statistical relations among various characteristic sizes used in different direct measurements and remote sensing approaches are discussed in Sect. 5.
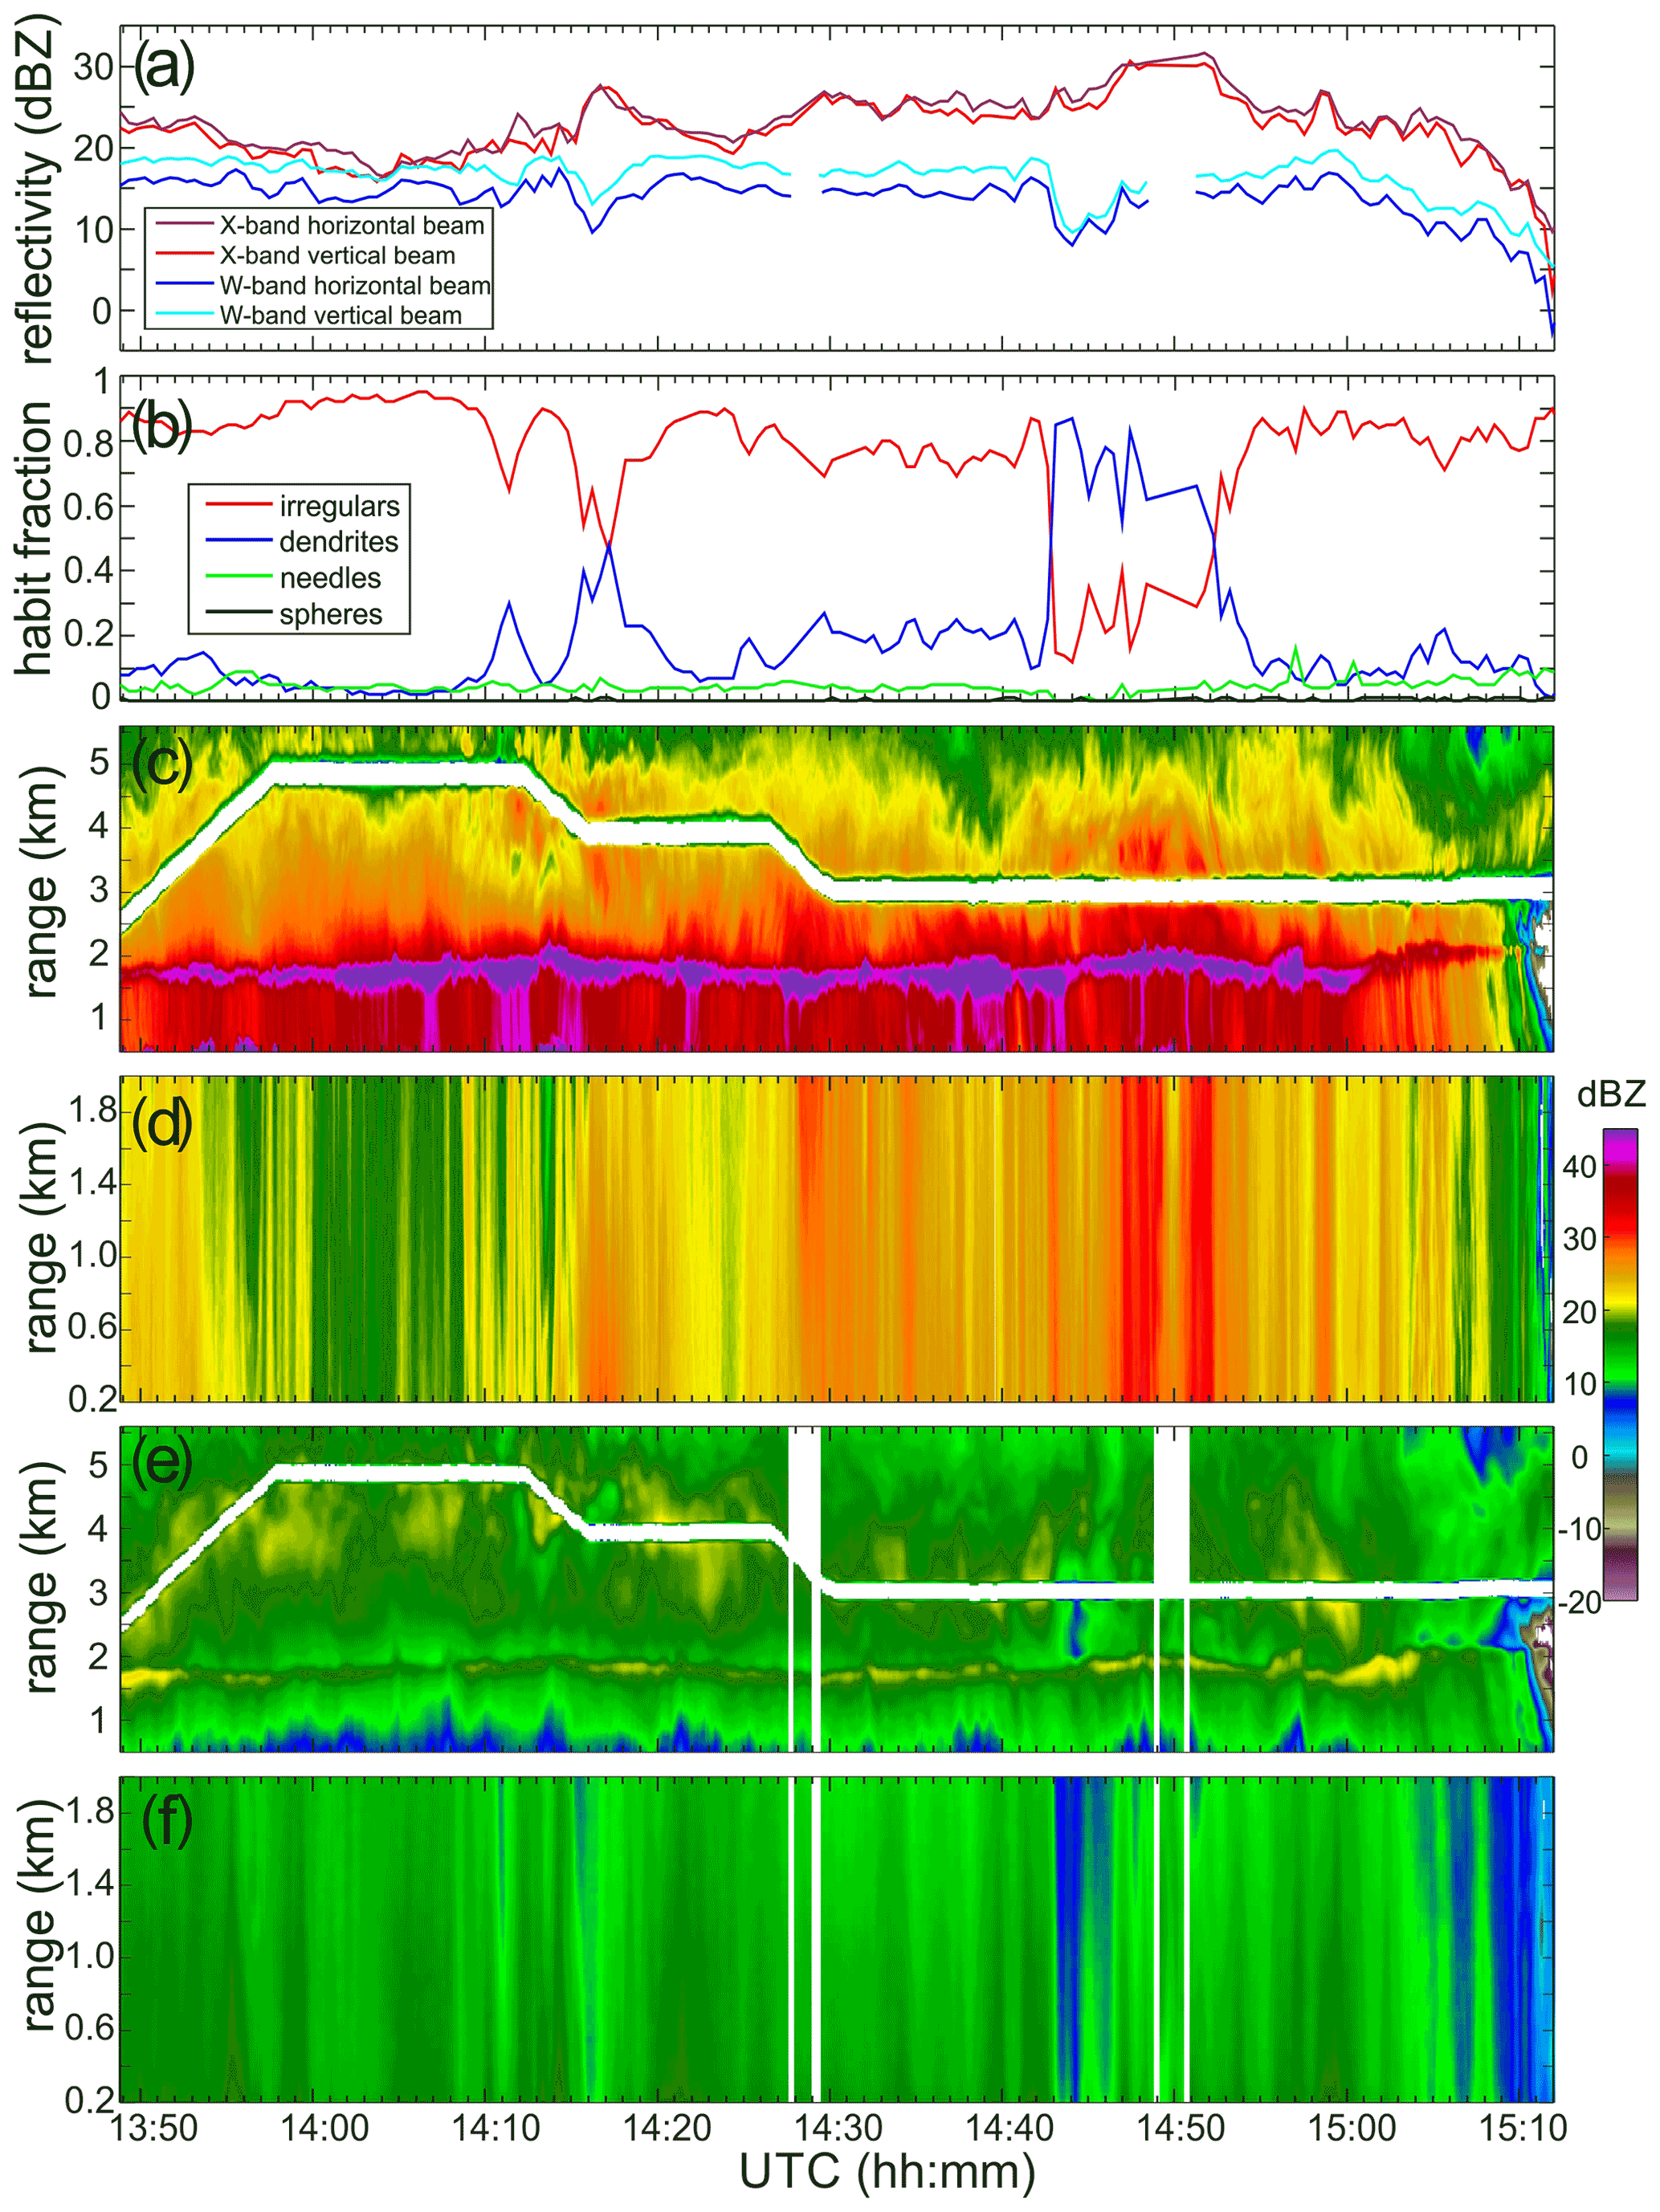
Figure 2F20 (a) time series of horizontal and vertical beam pointing measurements of NAWX reflectivities at a 250 m range gate, (b) estimates of relative fractions of different ice hydrometeor habits, (c, d) X-band reflectivity time–height cross sections for vertical and horizontal beam pointing, and (e, f) W-band reflectivity time–height cross sections for vertical and horizontal beam pointing, respectively. Vertical white bands in (e) and (f) indicate no W-band data.
Figure 2a shows time series of X- and W-band reflectivity measurements for horizontal and vertical beam pointing at a 250 m range gate during the ICICLE flight 20 (F20) conducted on 23 February 2019. As seen from this figure, the vertical and horizontal beam horizontal polarization reflectivities at X band, where scattering by hydrometeors is generally in the Rayleigh regime, agree quite well. The corresponding mean X-band reflectivity difference is only about 1 dB. The vertical beam W-band reflectivities, however, are persistently greater than those at horizontal radar beam pointing by several decibels (∼ 4 dB). This is a manifestation of a non-Rayleigh effect of the backscatter enhancement from non-spherical particles with preferential orientation.
A similar effect of the vertical beam W-band reflectivity enhancement was observed during a number of field experiments with W-band radars (e.g., Matrosov et al., 2012, 2019). The vertical radar beam reflectivities exceed those from horizontal beam measurements when ice particles' mean dimensions in the horizontal plane are greater than those in the vertical plane. In other words, this non-Rayleigh reflectivity enhancement is observed when undisturbed particles are preferentially oriented with their major dimensions being nearly horizontal as dictated by aerodynamic forcing (even though some wobbling around this preferential orientation exists).
The results of the 2D particle image recognition in Fig. 2b show distinct ice hydrometeor regions with dendritic ice crystals embedded in the cloud filled by irregularly shaped ice particles. The Korolev and Sussman (2000) algorithm was applied in the recognition process using measurements from the OAP-2DC probe. Complete and partial hydrometeor images were included in the analysis. Inclusion of the partial images allowed an extension of the image recognition analysis to particles with sizes up to approximately 5 mm. The habit recognition was tuned in a way that aggregates of irregular particles and needles fall in the category of “irregular particles”. However, the category “dendrites” included aggregates of dendrites. It is worth noting that for the ICICLE data set the occurrence of aggregates of needles was quite low.
As seen from Fig. 2a and b, the differences between the vertically and horizontally pointing W-band radar reflectivities are observed for all dominant particle habits. These differences depend on both the characteristic particle size and the degree of particle non-sphericity. Horizontal and slant no-data white bands indicating the aircraft trajectory in Fig. 2c and e correspond to the closest radar ranges. The aircraft was flying in precipitating ice conditions at heights between approximately 2.5 and 5 km with the radar bright band present at a height of about 1.7 km. The X-band bright band enhancement (Fig. 2c) is rather strong (∼ 10 dB). The W-band bright band (Fig. 2e), which is caused in part by attenuation of high-frequency radar signals by melting and liquid hydrometeors (Matrosov, 2007; Sassen et al., 2007), is less pronounced (∼ 3 dB).
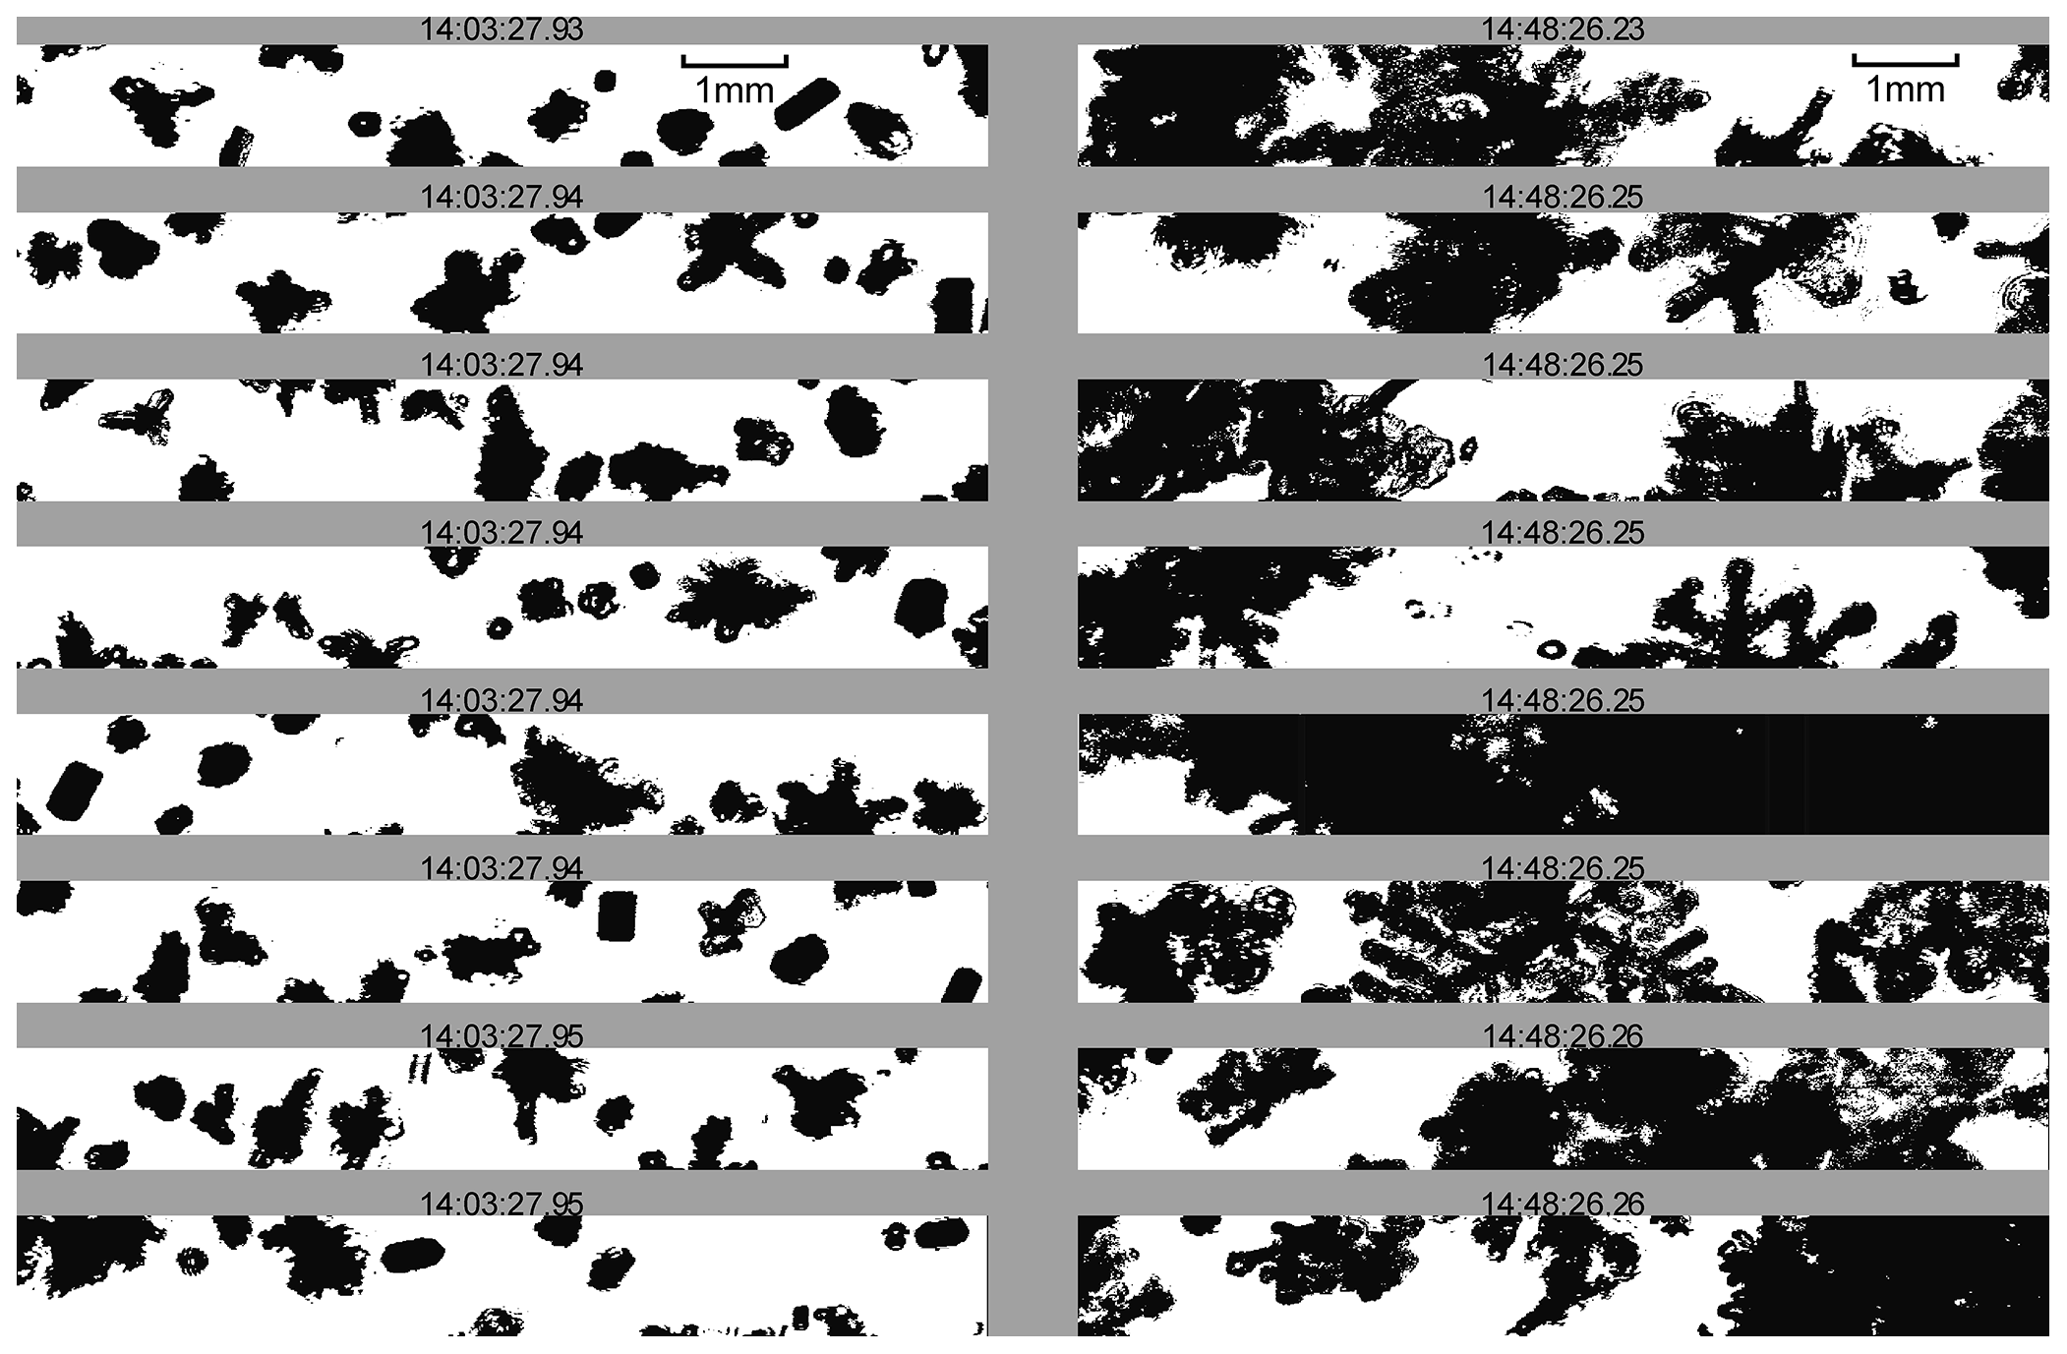
Figure 3Examples of particle 2D-S images (same scale) with Dv≈ 1.4 mm and DWR ≈ 1.8 dB (left) as well as Dv≈ 8 mm and DWR ≈ 16 dB (right). DWR data are for the horizontal radar beam measurements.
For illustration purposes, Fig. 3 shows images of typical populations of smaller (Dv≈ 1.4 mm) and larger (Dv≈ 8 mm) particles during ICICLE flight 20. The former was observed at around 14:03:28 UTC, and the latter one corresponds to approximately 14:48:26 UTC. As seen from Fig. 2a, the differences in X- and W-reflectivities around 14:03 UTC are rather small (∼ 1–1.5 dB) and are close to the DWR measurement uncertainty. This suggests that meaningful retrievals of Dv from X–W-band dual-wavelength measurements could be performed when this characteristic size exceeds about 1 mm.
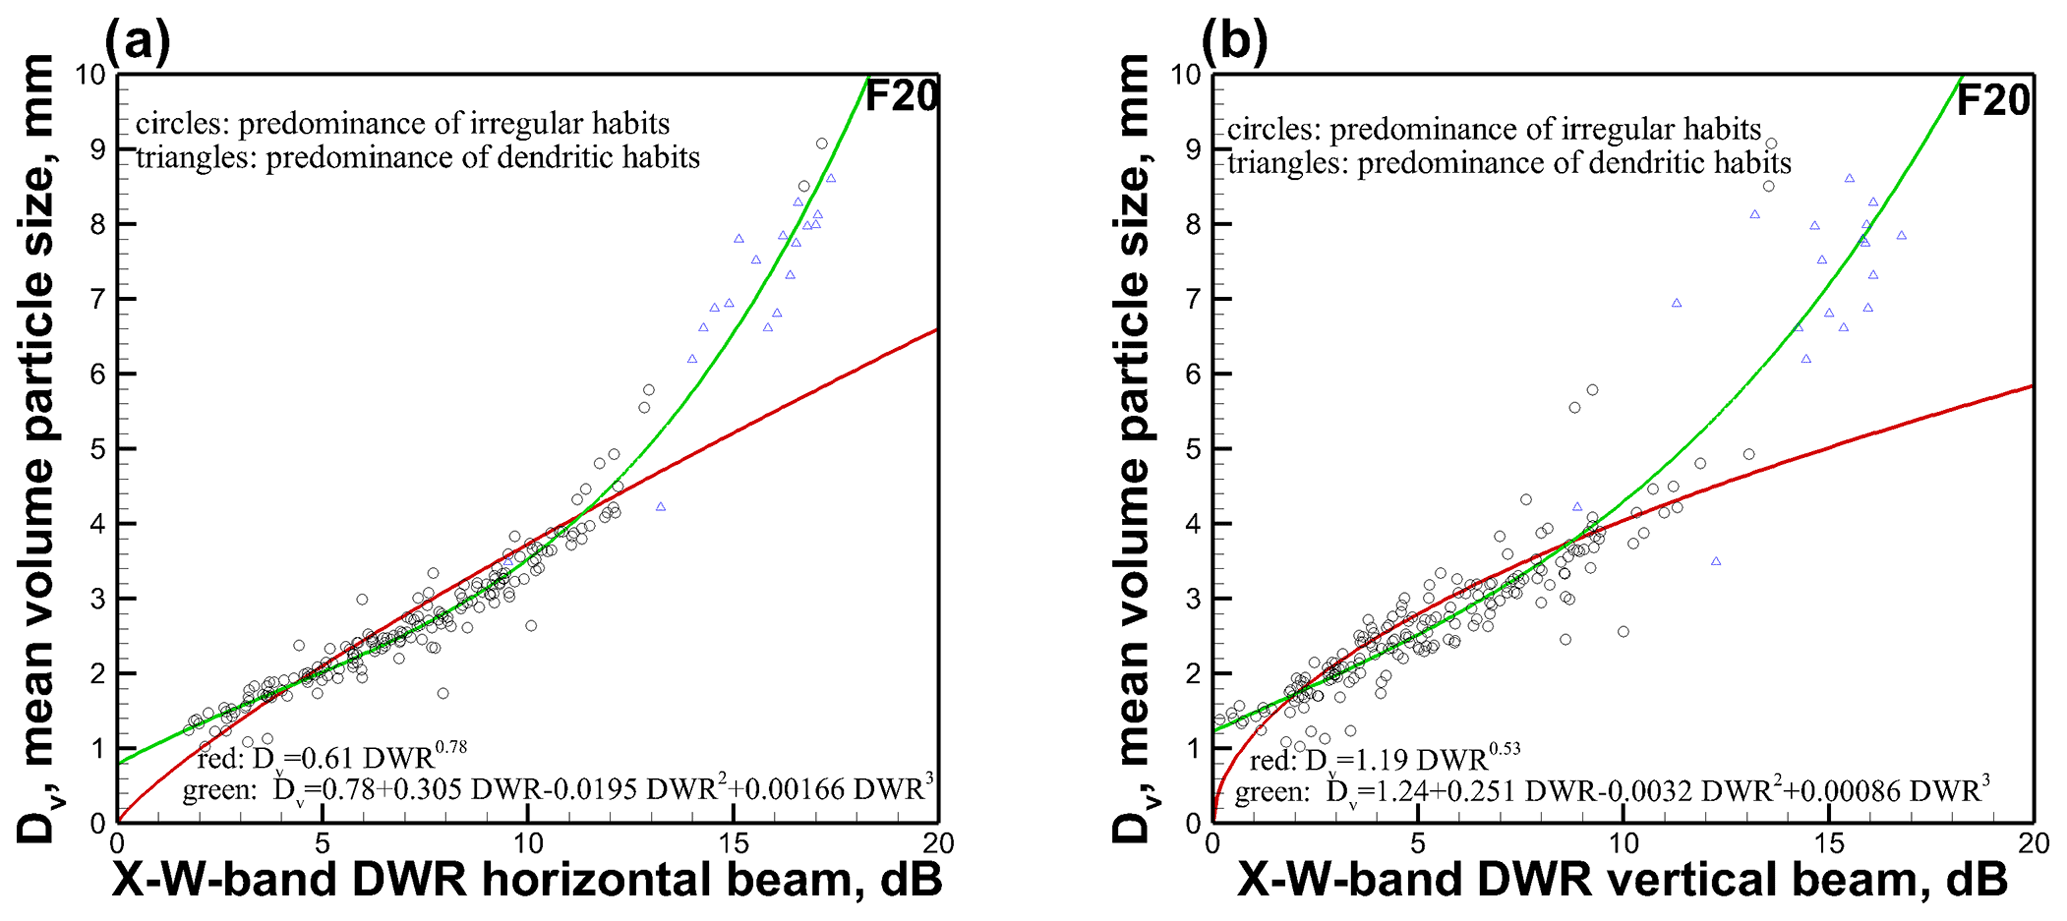
Figure 4Scatter diagrams of the mean volume particle size vs. X–W-band DWR for (a) horizontal radar beam pointing and (b) vertical radar beam pointing during flight 20 measurements at the 250 m range gate. Best-fit power-law (red lines) and polynomial (green lines) approximations for all habits are also shown.
Figure 4 shows scatter diagrams of Dv and DWR for the horizontal and vertical radar beam measurements collected during ICICLE flight 20. It appears that the best-fit power-law approximations (red lines) of the Dv–DWR relation works well when DWR is smaller than about 10–12 dB. Polynomial approximations (green lines) provide a better fit when DWR is greater than about 13 dB. Also note that practically all Dv values for the F20 data are greater than approximately 1 mm.
One of the features of DWR is that this ratio exhibits only a relatively weak dependence on particle bulk density (Matrosov et al., 2019). Compared to other remote sensing approaches (e.g., Ryzhkov et al., 2018), this provides an important advantage when observing particle populations with habit-dependent relations between particle mass and size (i.e., m–D relations). These relations determine particle bulk densities and can vary depending on particle habits and the presence of different microphysical processes (e.g., riming, aggregation).
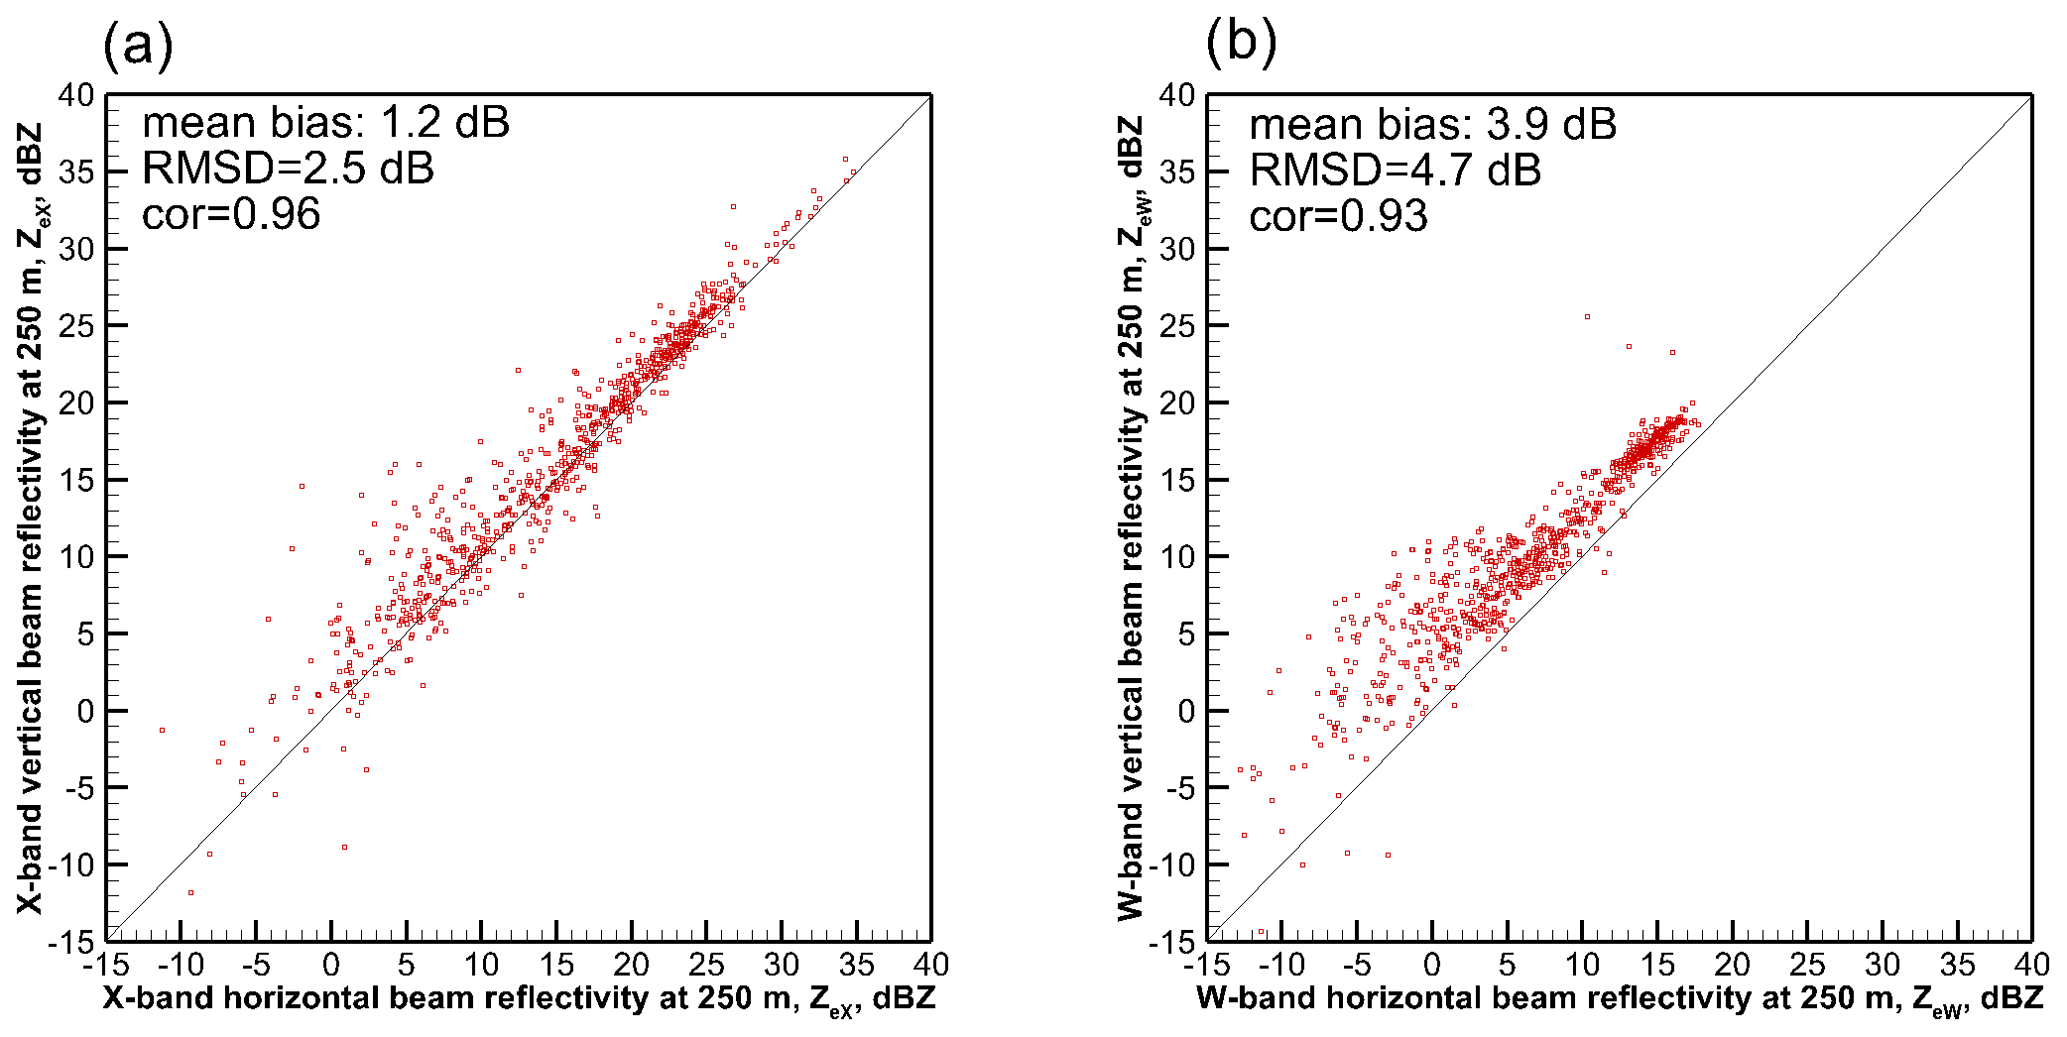
Figure 5Scatter plots of observed 250 m horizontal and vertical pointing reflectivities for (a) X-band and (b) W-band measurements.
As seen from Fig. 4, the Dv–DWR data scatter for the horizontal beam radar measurements (Fig. 4a) is smaller compared to the vertical beam (Fig. 4b) (e.g., the horizontal and vertical beam Dv RMSD values relative to the polynomial approximations are 0.62 and 0.72 mm, respectively). This is in part due to the fact that for the horizontal radar beam geometry of viewing, DWR is less susceptible to variations in ice particle shapes and orientations compared to that for the vertical radar beam measurements (Matrosov et al., 2019). It is worth noting that the data scatter (especially at horizontal radar beam viewing for the entire range of observed DWR) is rather modest despite the fact that the predominant particle habit through this cloud segment was changing rather significantly (Fig. 2b). Though dendritic crystals produced higher DWR values on average due to generally larger sizes (e.g., Fig. 3) during this flight, high DWR values were also observed when irregular particles were a dominant species.
4.1 Differences between horizontal and vertical beam DWR measurements
As mentioned in Sect. 2, homogeneity of the cloud environment is an important factor for the analysis of the relations between the particle characteristic sizes and radar reflectivities. Since in this study the in situ microphysics and radar reflectivity measurements are separated by 250 m, cloud microphysics spatial inhomogeneities at scales ΔX < 250 m would result in enhanced decorrelation and masking of potential relations. As shown in Fig. 1, the clouds considered here were sufficiently homogeneous in the horizontal direction.
Figure 5 shows scatter plots of 250 m horizontal and vertical beam reflectivities. As seen from Fig. 5a, the vertical and horizontal beam X-band reflectivities, for which non-Rayleigh scattering effects are small, are still rather close. A modest bias of 1.2 dB can be attributed in part to the vertical anisotropy of cloud microphysical parameters related to various microphysical processes such as particle sedimentation, aggregation, diffusional growth, and riming.
Unlike for the X band, W-band reflectivities at the vertical beam pointing were significantly higher than those at the horizontal beam pointing (Fig. 5b vs. Fig. 5a). This suggests that the non-Rayleigh reflectivity enhancement effects were more pronounced than those due to cloud inhomogeneity in the vertical direction. This leads to generally smaller vertical radar beam DWRs compared to those for horizontal radar beam DWRs for the same cloud microphysical parameters.
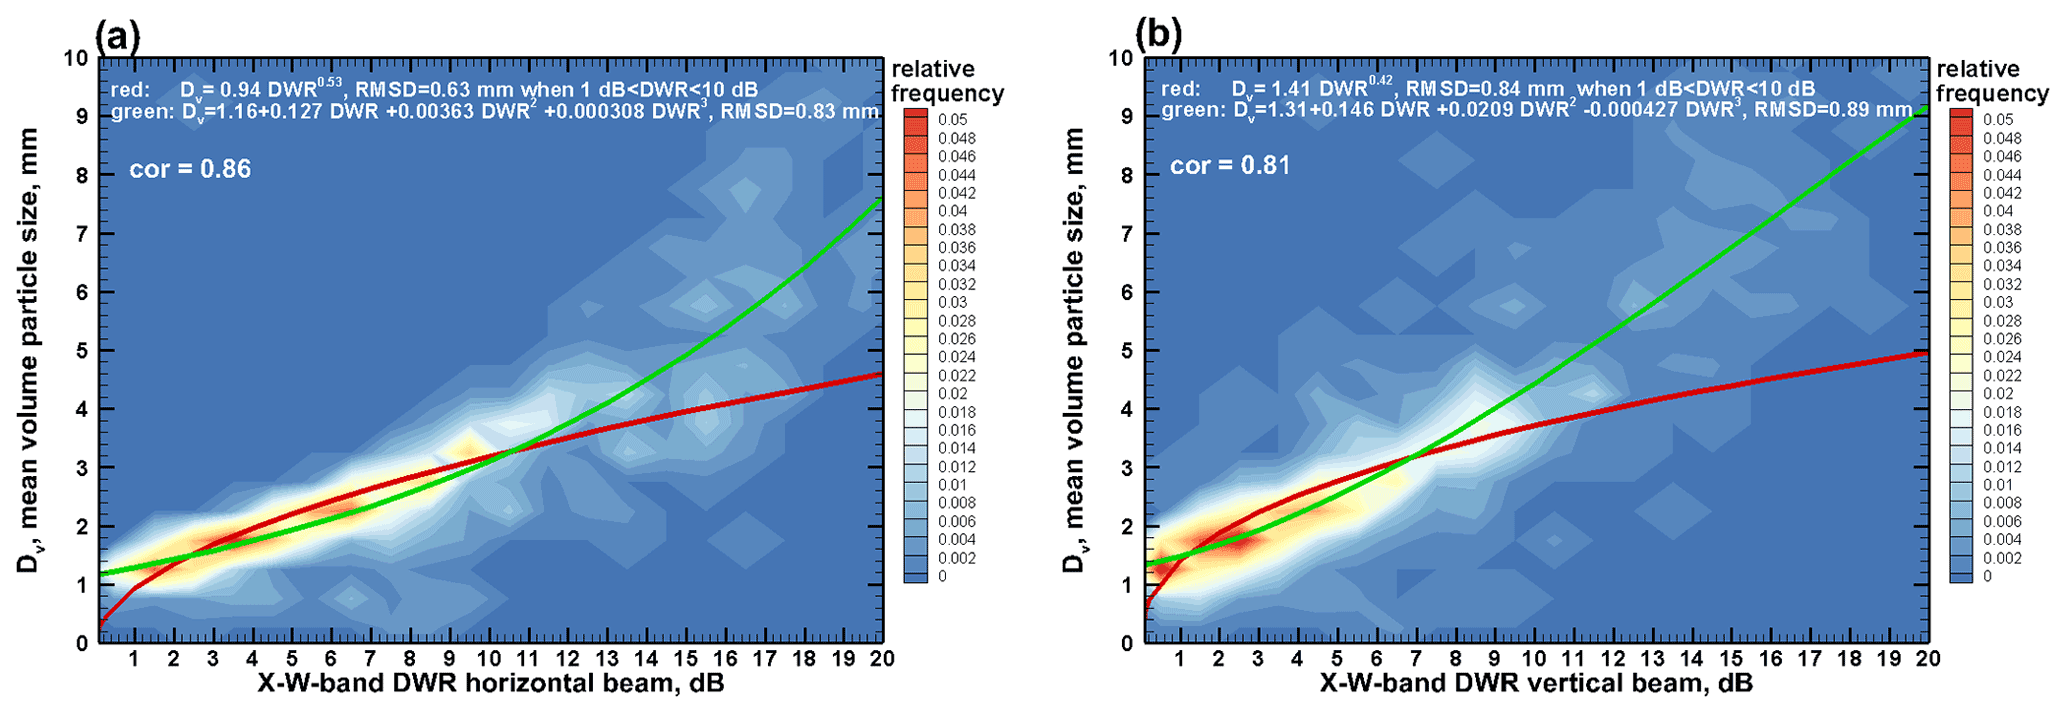
Figure 6Frequency scatter plots of mean volume PSD size, Dv, versus DWR observed with (a) horizontal and (b) vertical radar beam pointing.
4.2 Relations between characteristic particle size and DWR
For all ICICLE flights considered in this study, Fig. 6 shows frequency of occurrence scatter plots between the mean volume particle size Dv and DWR for horizontal and vertical beam pointing. The bin sizes in this figure are 1 dB and 0.5 mm for DWR and Dv, respectively. The sample size consisted of ∼ 800 Dv–DWR pairs, which represented 30 s averages. The ice water content and temperature values in observed clouds varied in approximate ranges of 0.002–2 g m−3 and −2 to −24 ∘C, respectively.
As seen from Fig. 6, DWR values for the same particle size are generally greater for the horizontal beam pointing data. There is an overall good correlation between Dv and DWR. TheDv–DWR relation is generally more robust for horizontal beam measurements as the data scatter is smaller in Fig. 6a compared to Fig. 6b. The correlation coefficients between Dv and DWR are 0.86 and 0.81 for the horizontal and vertical beam data, respectively. A better correlation for the horizontal beam DWR can be explained in part by the fact that hydrometeor backscatter for this beam pointing is less affected by particle shapes and habits (Matrosov et al., 2019).
Best-fit Dv–DWR approximations are also shown in Fig. 6. Unlike the polynomial fits, the power-law approximations do not adequately describe the Dv–DWR data for larger DWR values. These approximations, however, provide a better fit when DWR values are approximately in the 1–10 dB range, where the majority of the measurements are contained. The RMSD values of the best power-law fits shown in Fig. 6a and b (i.e., Dv = 0.94 DWR0.53 for horizontal beam measurements and Dv = 1.41 DWR0.42 for vertical beam measurements) are 0.64 and 0.84 mm, respectively, if 1 dB < DWR < 10 dB. The corresponding RMSD values for the polynomial fits in Fig. 6a and b applied for entire observed range of DWR are 0.83 and 0.89 mm, respectively. If a DWR value of 1 dB is assumed as an uncertainty in X–W-band dual-wavelength measurements then Dv values of around 1 mm could be considered the smallest characteristic size reliably retrievable from these measurements at horizontal radar beam pointing. Also note that even though the best-fit approximations for the multiple-flight data (Fig. 6) and those for one-flight data (Fig. 4) differ, the characteristic size estimates from these approximations are quite close. For example, for the DWR range between 1 and 10 dB, an RMSD value describing a spread between Dv estimates from the horizontal beam best power-law relations in Figs. 4a and 6a is only ∼ 0.3 mm.
4.3 Relations between characteristic particle size and reflectivities
As seen from the data in Fig. 6a, the X–W-band DWR at horizontal radar beam pointing can be used for robust estimations of ice particle characteristic sizes describing PSDs if Dv is greater than approximately 1 mm. Closely collocated dual-wavelength radar measurements, however, are not always available in many instances. Previous studies have shown that single-frequency reflectivity measurements are also noticeably correlated with characteristic hydrometeor size if non-Rayleigh scattering effects are small (e.g., Matrosov, 1997; Matrosov and Heysmfield, 2017). Given this, it is instructive to evaluate statistical relations between single-frequency NAWX reflectivity measurements and particle sizes using the ICICLE data.
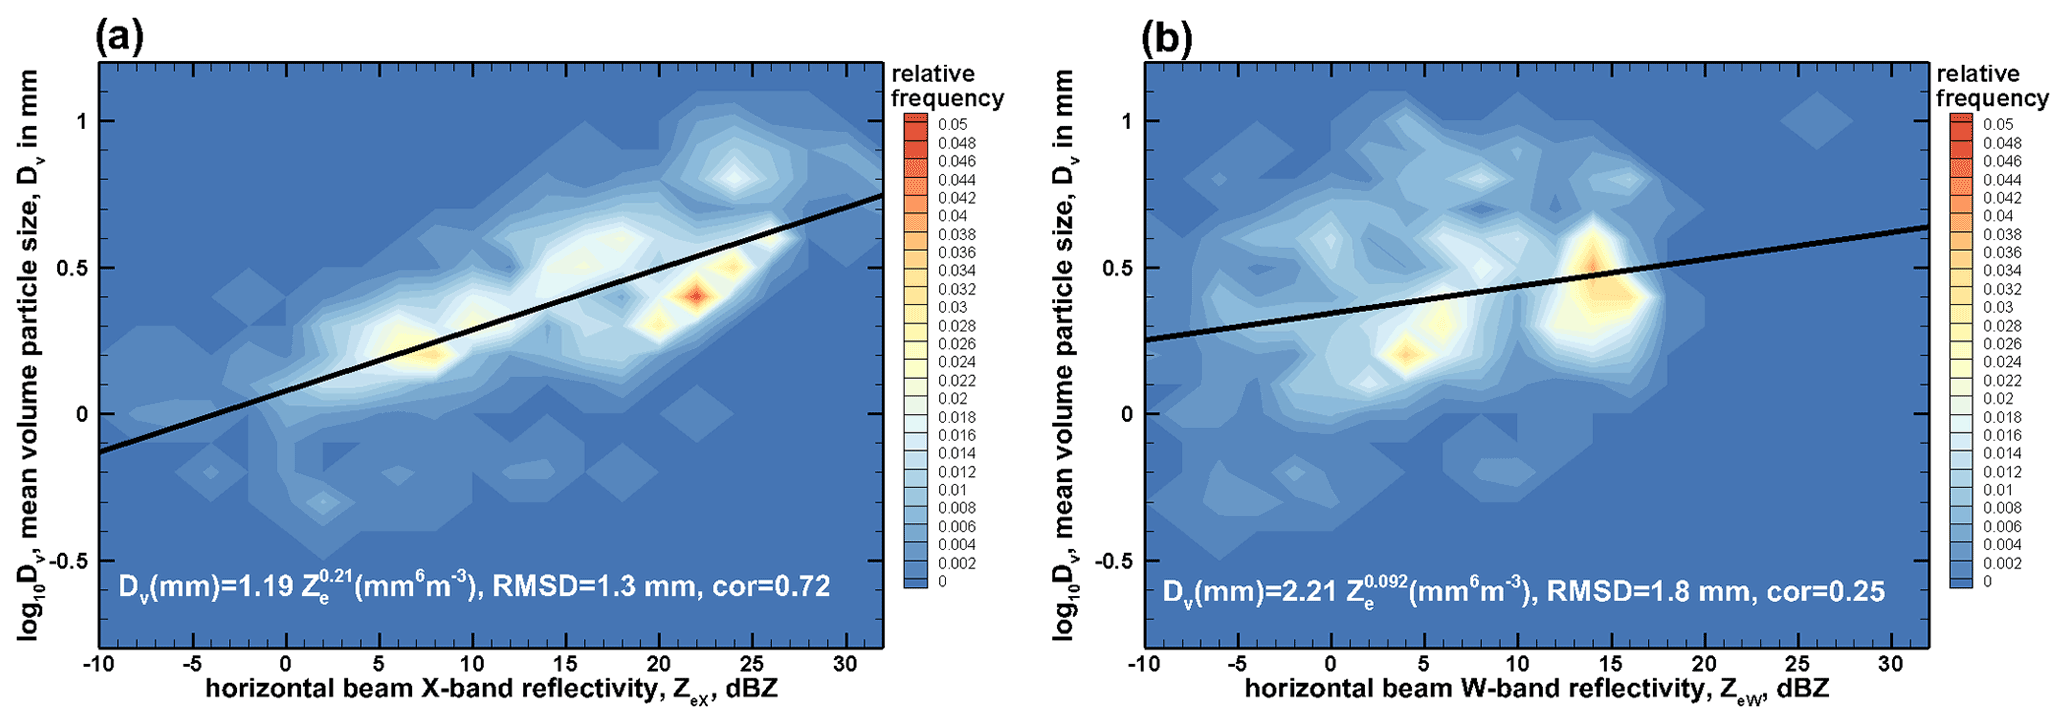
Figure 7Frequency scatter plots of mean volume PSD size, Dv, versus (a) X-band and (b) W-band reflectivity observed at horizontal beam pointing. Best-fit power-law approximations and corresponding RMSD values are also shown.
Figure 7 shows Dv–Ze frequency of occurrence scatter plots. The data are presented for the horizontal radar beam measurements, since those are less susceptible to the hydrometeor shape variability. As seen from Fig. 7a, there is a significant correlation (correlation coefficient ∼ 0.72) between Dv and ZeX. The Dv data scatter relative to the best-fit power-law approximation of Dv (mm) = (mm6 m−3) is, however significantly larger than that for the Dv–DWR relation (i.e., RMSD ≈ 1.3 mm in Fig. 7a versus RMSD ≈ 0.64 mm in Fig. 6a). The vertical radar beam data for X-band measurements (not shown) do not significantly differ from the horizontal beam measurements as reflectivities for both geometries of pointing are similar (Fig. 5a). The correlation between Dv and W-band reflectivity is low (Fig. 7b) as non-Rayleigh scattering diminishes backscatter dependence on particle size.
The relations among the characteristic size of ice hydrometeor PSDs and radar parameters discussed in previous sections were given in terms of mean volume particle size, Dv, defined as a ratio of fourth and third PSD moments (i.e., ). While Dv is used in some remote sensing retrievals of ice hydrometeor parameters (e.g., Ryzhkov et al., 2018), a number of other characteristic particle sizes, which describe the entire PSD, are in common use in various remote sensing approaches and in different microphysical studies. The existence of ice microphysical data sets, wherein different definitions of ice particle characteristic size are used, necessitates establishing mean statistical relations among various definitions of PSD characteristic sizes. It is especially important when intercomparing results from different remote sensing approaches as well as model assumptions and parameterizations.
The mean volume diameter (MVD) is the characteristic size which is used in some applications (e.g., Schumann et al., 2011) including aircraft icing studies. While mean volume particle size, Dv, and MVD are similarly named, they are calculated differently. Using the PSD moment definition (2), MVD, which is defined using zeroth and third PSD moments, is expressed as
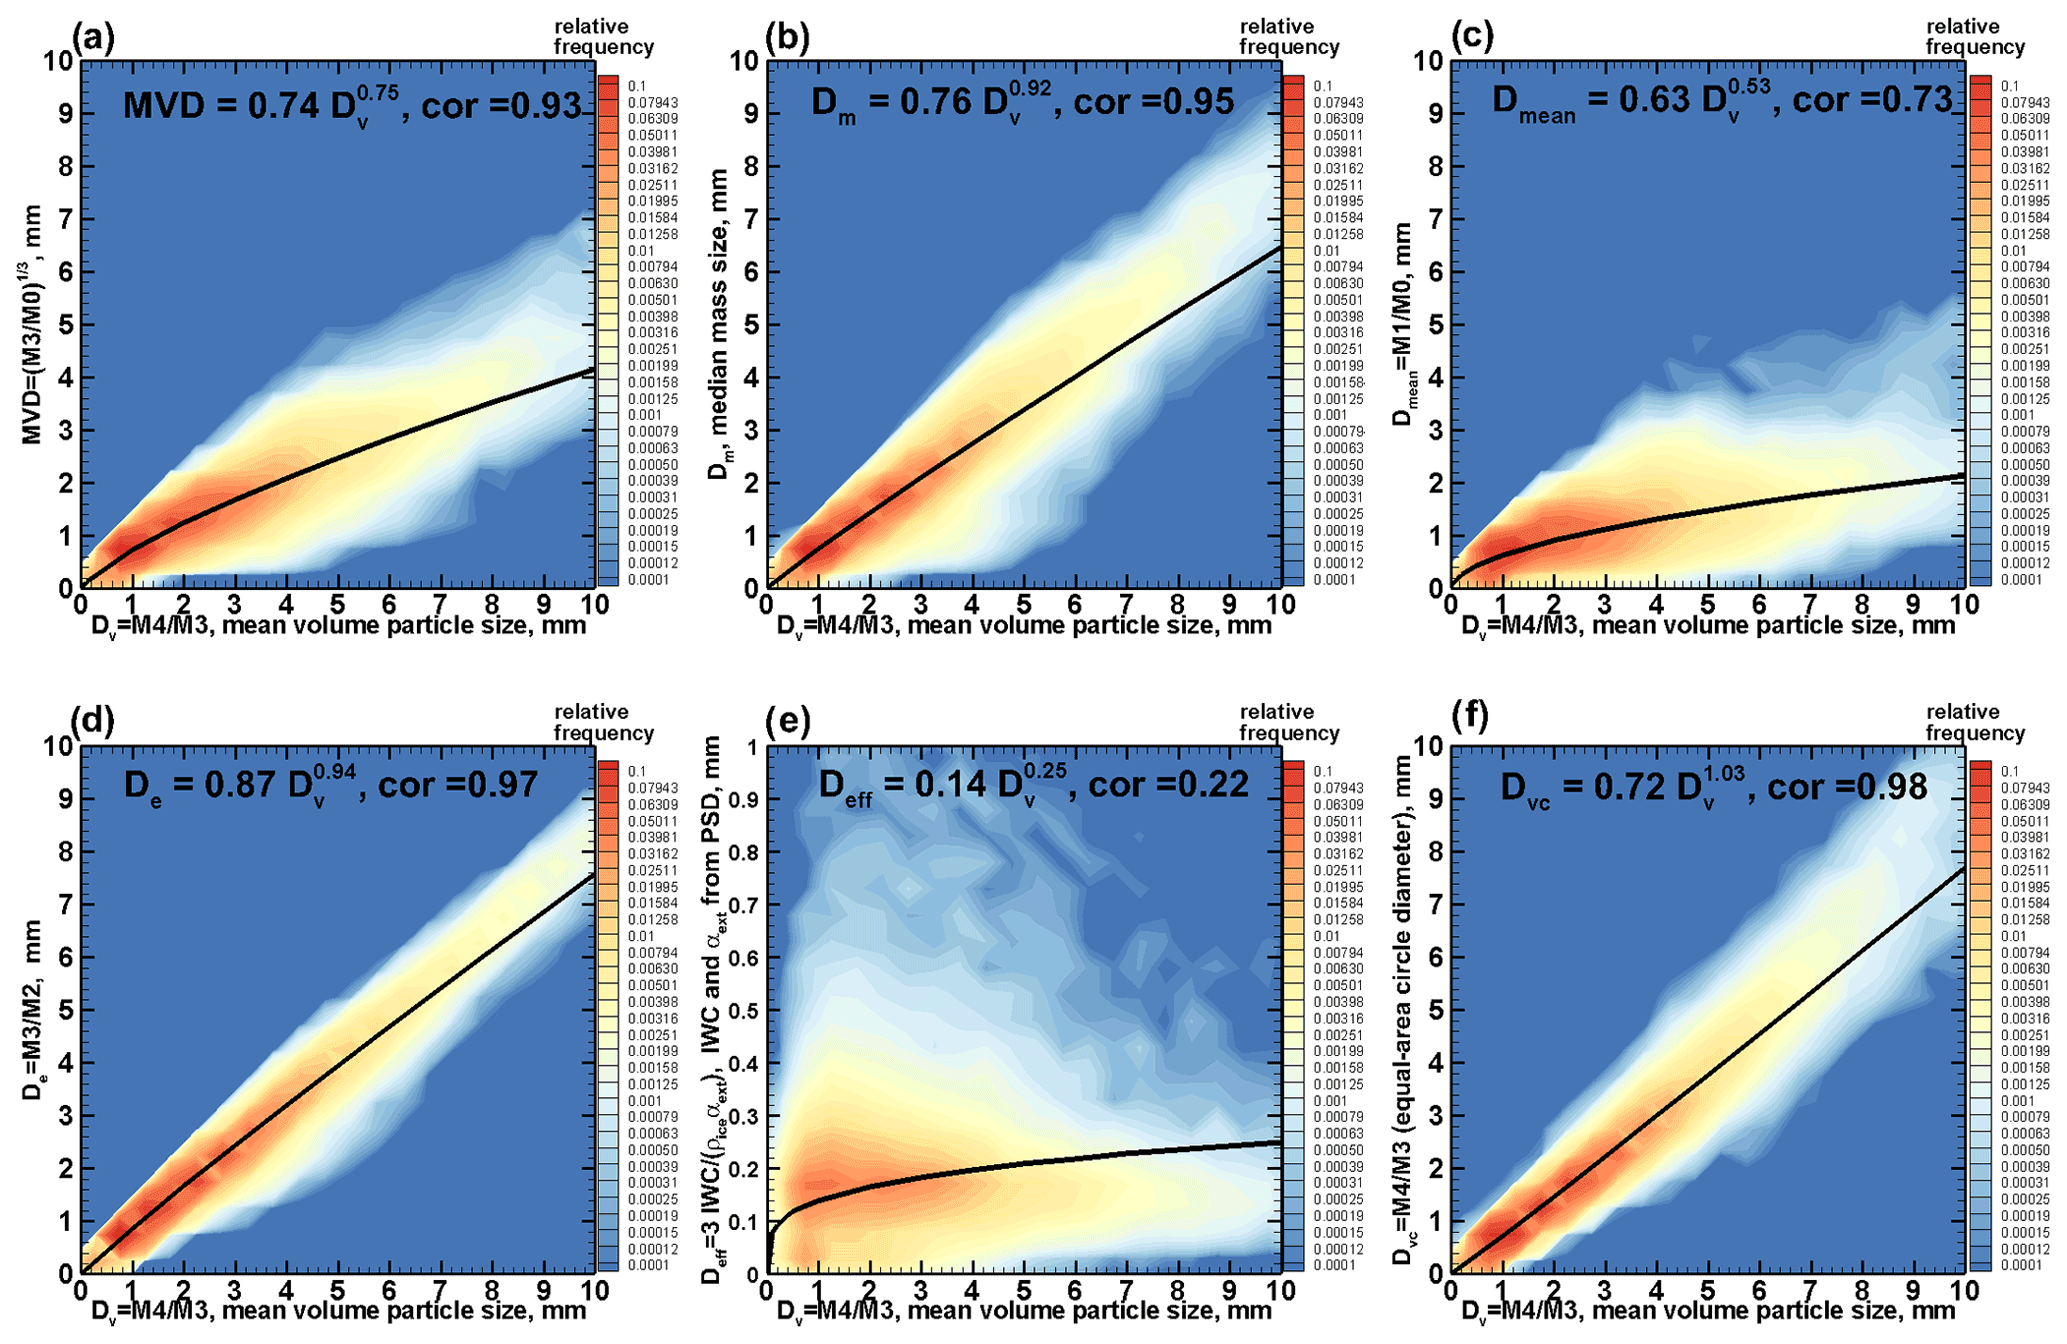
Figure 8Observationally based statistical relations between (a) MDV and Dv, (b) Dm and Dv, (c) Dmean and Dv, (d) De and Dv, (e) Deff and Dv, and (f) Dvc and Dv according to the ICICLE in situ sampling data. Corresponding correlation coefficients are also shown. Note that the Y-axis scale in (e) is different from other frames.
Figure 8a shows a frequency scatter plot between MVD and Dv as calculated from the ICICLE in situ data set used in this study. As seen from this figure, MVD values are generally smaller than Dv values by approximately a factor of 2 on average.
Another widely used characteristic particle size describing PSDs is the median volume size, D0. For hydrometeors of similar shapes and non-truncated gamma function size distributions, which are often used to approximate observational PSDs, the theoretical relation between D0 and Dv is
where μ is the order of the gamma function. It can be seen from Eq. (5) that for exponential distributions (μ=0), D0 and Dv differ by less than approximately 10 %. This difference diminishes even further for higher orders of gamma function PSDs.
A median mass size, Dm, is sometimes used instead of D0 for describing PSDs. For particles of constant bulk density, Dm≈ D0. When bulk density changes with size, which is the case for ice hydrometeors, Dm also depends on the individual particle mass–size relations (i.e., m–D relations). Figure 8b shows the relation between Dm and Dv obtained using the m–D relation (i.e., m = 0.00338 D1.9, centimeter–gram–second or CGS units) for collected ICICLE PSDs. This relation was found as a result of comparing the PSD-to-mass calculations and bulk ice mass content estimates measured by the isokinetic probe (IKP, Davison et al., 2011) in ice clouds. This allowed finding the m–D relation coefficients that provide the best matching of the ice mass calculated from PSDs and that measured directly by the IKP. As seen in Fig. 8b, Dm is about 70 % of Dv on average.
Sometimes PSDs are characterized by the mean particle size (e.g., Shupe et al., 2006), which is defined as the ratio of the first and zeroth PSD moments:
The statistical relation between Dv and Dmean is shown in Fig. 8c. Dmean is generally significantly smaller than Dv.
The effective particle size (diameter), De, is often used in optical remote sensing and model parameterizations. It is frequently defined as the ratio of the third and second PSD moments (e.g., Schumann et al., 2011):
Quite often, however, the effective radius (i.e., re = ) is used instead of the effective diameter (McFarquhar and Heymsfield, 1998).
The statistical relation between De and Dv obtained using ICICLE microphysical data is shown in Fig. 8d. It can be seen that, if the effective size is expressed in physical particle sizes (i.e., as a major dimension of a two-dimensional particle projection), then on average De is about 0.8 Dv, though there is some data scatter around the best-fit approximation. For particles of similar habits and size-independent bulk density, ρ, the effective size can be expressed in terms of liquid or ice cloud water content (WC) and visible extinction coefficient, αe (e.g., Mitchell et al., 2011):
For spherical water drops, Eqs. (7) and (8) are equivalent, and they provide the effective size in terms of particle physical dimensions. If Eq. (8) is applied to ice hydrometeors and the density of the solid ice is used (i.e., ρ = ρi = 0.916 g cm−3), it becomes
where IWC is ice water content and the notation Deff (rather than De) underlines the fact that the effective size here is derived not in terms of the PSD moments using physical dimensions of observed hydrometeors but rather from measurements or estimates of the extinction coefficient and IWC (). This definition of Deff is used in various applications (McFarquhar and Heymsfield, 1998; Mitchell et al., 2011).
The ICICLE microphysical data set allows for evaluating the relation between Deff defined by bulk quantities and PSD characteristic sizes expressed in terms of particle physical dimensions. The Deff–Dv frequency of occurrence scatter plot as derived from the ICICLE data set is shown in Fig. 8e. When calculating Deff, the IWC data were obtained using the m = 0.00338 D1.9 relation with observed composite PSDs, and the extinction coefficient was approximated using estimates of the total projected area of all particles in the size distribution (Korolev et al., 2014). Deff depends on the assumed m–D relation (i.e., it is proportional to the prefactor in this relation).
It can be seen from Fig. 8e that Deff is significantly smaller than Dv. The majority of Deff values are under 0.25 mm regardless of the Dv magnitude. Unlike for other characteristic sizes, a power-law approximation does not provide a robust fit for the Deff–Dv relation, and the correlation coefficient between these two characteristic ice hydrometeor sizes is very low (cor = 0.22). Such a weak dependence of Deff on Dv can be explained by the fact that both particle mass (hence IWC in the numerator of Eq. 9) and their cross-sectional area (hence the extinction coefficient in the denominator of Eq. 9) are both approximately proportional to particle physical size squared (e.g., Mitchell, 1996), so their ratio does not significantly depend on particle physical sizes.
The characteristic particle sizes given by Eqs. (3)–(7) and shown in Fig. 8a–d were calculated using moments of PSD given in terms of the major particle dimensions and projections as inferred from 2D probes. Sometimes, particle dimensions are given in terms of diameters of the circles that have the same projection area as 2D particle images (e.g., McFarquhar and Heymsfield, 1998). Figure 8f shows a Dv–Dvc frequency scatter plot where Dv and Dvc are calculated as the ratio in terms of particle major dimensions and diameters of the equal-area circles, respectively. It can be seen that Dvc values are smaller on average than those of Dv by about 20 %–30 %. Power-law approximations of the statistical relations among different characteristic sizes of ice hydrometeors, which are shown in Fig. 8, can be used to convert (at least in a mean sense) the Dv–DWR relations discussed in Sect. 4 to such relations given in terms of various other definitions of particle characteristic size describing an entire PSD.
Correlations between most hydrometeor PSD characteristic sizes expressed in terms particle physical dimensions are quite high (e.g., Fig. 8a–d). The correlation between the characteristic size expressed in terms of the maximal 2D projection and the one in terms of the diameter of an equal-area circle (Fig. 8f) is also very high. Somewhat smaller but still significant is the correlation coefficient between Dv and Dmean. The statistical relation shown in Fig. 8 can facilitate meaningful comparisons of characteristic particle sizes from different retrievals as well as from different microphysical parameterizations in climate and weather models. Approximate relations between DWR and the characteristic particle sizes other than Dv can be readily obtained from the Dv–DWR relations (Fig. 6) by expressing these sizes in terms of Dv using best-fit power laws shown in Fig. 8. Correlation coefficients between the horizontal radar beam DWR and MVD, Dm, De, and Dvc are approximately in the 0.82–0.86 range, which is close to the correlation between DWR and Dv. DWR and Dmean are less correlated (cor ≈ 0.6), which is mostly due to the lower correlation between Dmean and other characteristic sizes (Fig. 8c). No meaningful correlation exists between DWR and Deff. The correlation coefficients between the vertical beam DWR and characteristic particle sizes are smaller by about 0.05 compared to those for the horizontal beam DWR.
Radar and microphysical data sets collected during the ICICLE project were used to quantitatively evaluate relations between X–W-band dual-wavelength airborne radar measurements and characteristic sizes of ice hydrometeor populations. A close collocation of the radar and microphysical sampling measurements allowed for robust comparisons of microphysical and radar data. To minimize effects of cloud microstructure inhomogeneity, the consideration was limited to ice cloud regions where radar reflectivity was assessed as spatially homogeneous within ranges up to several hundred meters. The data considered here were also limited to the regions where radar echoes were dominated by ice hydrometeors. In the selected cloud regions, the mean volume particle size Dv varied from a few hundred micrometers to about 1 cm, and ice particle shapes were presented by a variety of major ice habits including dendrites, needles, and irregulars.
Radar reflectivities observed with horizontal and vertical radar beam pointing did not exhibit significant differences at the X-band radar frequency, where hydrometeor backscatter is mostly within the Rayleigh scattering regime. In this scattering regime, this generally agrees with the horizontally oriented spheroidal particle model (e.g., Bohren and Huffman, 1983). Unlike at X band, reflectivity values at W band for the vertical radar beam pointing were consistently higher than those for the horizontal radar beam measurements due to zenith and nadir reflectivity enhancements, which is explained by non-Rayleigh scattering by non-spherical particles with preferential orientation. Due to this enhancement, DWR values at vertical incidence were about 4 dB lower on average than those for the horizontal beam measurements.
The X–W-band dual-wavelength ratio at horizontal beam pointing was found to provide a robust tool for retrieving the characteristic particle size if Dv > 1 mm. The influence of particle non-sphericity and orientation is minimized at this geometry of viewing. A measure of uncertainty of the retrieval (as estimated using the RMSD from the mean ICICLE best-fit approximation of Dv(mm) = 0.94 DWR0.53;dB) is about 0.64 mm if 1 dB < DWR < 10 dB. While the power-law approximations work better for this DWR range, the Dv–DWR relation for higher dual-wavelength ratio values is better approximated by a polynomial function. The Dv–DWR relation for the vertical beam measurements exhibits higher variability (compared to horizontal beam pointing) due to W-band zenith and nadir reflectivity enhancements, which are particle-habit- and orientation-dependent.
DWR-based particle characteristic size retrievals generally do not require the absolute calibration of radar reflectivities. A relative calibration of the dual-wavelength signals can be potentially performed when observing cloud regions with smaller crystal populations, which provide the Rayleigh regime of scattering at both radar frequencies. Another advantage of the DWR approach for sizing ice particle populations include relatively little dependence of dual-wavelength radar signal on particle bulk density.
Single-frequency reflectivity measurements at X band are also informative on the characteristic particle size. Correlation coefficients between ZeX and Dv, however, are noticeably lower than those between DWR and Dv (∼ 0.72 versus ∼ 0.86, respectively, for the horizontal beam pointing). The RMSD value for the Dv–ZeX relation is ∼ 1.3 mm. Reflectivity-based estimates of ice particle characteristic sizes, however, can also be obtained for smaller values of Dv, while the X–W-band DWR-based hydrometeor sizing approach is generally viable for Dv > 1 mm.
There are different characteristic sizes used to describe particle populations. For the same PSD, various characteristic sizes differ in magnitude. The mean volume size, Dv, is usually larger than other commonly used characteristic sizes describing PSDs such as the median mass size, the mean size, the effective size, and the mean volume diameter. Characteristic size nomenclature and definition differences need to be accounted for when comparing data from different retrieval approaches and model studies. Approximate relations among characteristic sizes other than Dv and DWR can be readily obtained from Dv–DWR relations and relations between these other sizes and Dv (Fig. 8).
Overall, the results of this study indicate the robustness of the DWR radar approach for inferring characteristic sizes of ice hydrometeors. Since atmospheric ice particles are generally non-spherical and are not randomly oriented, the influences of the geometry of viewing are important for dual-wavelength methods and also for triple-wavelength approaches, which predominantly use vertical beam measurements. Measurements with nearly horizontal radar beam pointing are better suited for size retrievals as they are less susceptible to the effects of particle non-sphericity and preferential orientation, so characteristic size retrievals for this measurement geometry have smaller uncertainties. Future enhancements of multi-wavelength radar remote sensing methods for retrievals of ice hydrometeor microphysical parameters need to account for realistic orientations of particles. The ICICLE radar measurements can provide a valuable data set for testing different computational approaches of calculating ice hydrometeor scattering properties.
Besides the NAWX, X–W-band radar measurements are available from a number of airborne platforms (e.g., Heymsfield et al., 2016) and ground-based sites including the US Department of Energy's Atmospheric Radiation Measurement (ARM) facilities (Kollias et al., 2014). The relations suggested here between DWR and the characteristic particle size can be used with measurements from these radar data. Attenuation effects (especially those at W band), however, need to be accounted for if radar measurements are performed at longer ranges. The results of this study could also be potentially useful for dual-wavelength radar measurements for which lower radar frequencies such those at S band or C band (i.e., ∼ 3 or ∼ 5.5 GHz, respectively) are used instead of the X-band frequency. Combinations of S- and W-band frequency radar measurements could be available from spatially matching spaceborne CloudSat W-band reflectivities with those from the US Next Generation Weather Radar (NEXRAD) ground-based S-band systems (e.g., Matrosov, 2010).
The ICICLE data used in this study are available from the NCAR/UCAR Earth Observing Laboratory (EOL) archive: W-band radar data at https://doi.org/10.26023/PBVG-0S4X-3D05 (Nguyen and Wolde, 2020b); X-band radar data at https://doi.org/10.26023/KAGA-JH3J-0Y06 (Nguyen and Wolde, 2020a); hydrometeor microphysics data at https://doi.org/10.26023/DREN-VTHA-0N0E (Korolev and Heckman, 2020c), https://doi.org/10.26023/7BZP-NGPY-WG0B (Korolev and Heckman, 2020a), and https://doi.org/10.26023/R6A2-G92Q-CF0S (Korolev and Heckman, 2020b).
Conceptualization of the remote sensing approach was performed by SYM. Data quality control and processing were performed by AK (hydrometeor microphysics data) as well as MW and CN (radar data). Data interpretation, analysis, and writing were shared by SYM and AK.
The contact author has declared that none of the authors has any competing interests.
The views expressed are those of the authors and do not necessarily represent the official policy or position of the FAA.
Publisher's note: Copernicus Publications remains neutral with regard to jurisdictional claims in published maps and institutional affiliations.
This research was supported, in part, by the US Department of Energy (DOE) Atmospheric Systems Research (ASR) program projects DE-SC0022163. The ICICLE field campaign was funded by the Federal Aviation Administration (FAA). Additional support was provided by the NOAA Physical Sciences Laboratory through cooperative agreements NA170AR4320101 and NA22OAR4320151.
This paper was edited by Alexis Berne and reviewed by two anonymous referees.
Bernstein, B., DiVito, S., Riley, J. T., Landolt, S., Haggerty, J., Thompson, G., Adriaansen, D., Serke, D., Kessinger, C., Tessendorf, S., Wolde, M., Korolev, A., Brown, A., Nichman, L., Sims,D., and Dumont, C.: The In-Cloud Icing and Large-Drop Experiment (ICICLE) Science and Operations Plans, Federal Aviation Administration, William J. Hughes Technical Center, Aviation Research Division, DOT/FAA/TC-21/29, Atlantic City International Airport, NJ, Federal Aviation Administration, https://www.tc.faa.gov/its/worldpac/techrpt/tc21-29.pdf (last access: 7 May 2022), 2021.
Bohren, C. F. and Huffman, D. R.: Absorption and Scattering of Light by Small Particles, John Wiley and Sons, New York, ISBN 10 047105772X, 530 pp., 1983.
Davison, C., Ratvasky, T., and Lilie, L.: Naturally aspirating isokinetic total water content probe: Wind tunnel test results and design modifications, in: SAE 2011 International Conference on Aircraft and Engine Icing and Ground Deicing, Chicago, Illinois, 13–17 June 2011, https://doi.org/10.4271/2011-38-0036, 2011.
Field, P. R., Heymsfield, A. J., and Bansemer, A.: Shattering and Particle Inter-arrival Times Measured by Optical Array Probes in Ice Clouds, J. Atmos. Ocean. Tech., 23, 1357–1370, 2006.
Heymsfield, A. J. and Parrish, J. L.: Techniques employed in the processing of particle size spectra and state parameter data obtained with the T-28 aircraft platform (No. NCAR/TN-137+IA), University Corporation for Atmospheric Research, https://doi.org/10.5065/D6639MPN, 1979.
Heymsfield, A. J., Matrosov S. Y., and Wood, N.: Toward improving ice water content and snow-rate retrievals from radars. Part I: X and W bands, emphasizing CloudSat, J. Appl. Meteorol. Clim., 55, 2063–2090, https://doi.org/10.1175/JAMC-D-15-0290.1, 2016.
Hogan, R. J., Illingworth, A. J., and Sauvageot, H.: Measuring crystal size in cirrus using 35- and 94-GHz radars, J. Atmos. Ocean. Tech., 17, 27–37, 2000.
Kneifel, S., Kulie, M. S., and Bennartz, R: A triple-frequency approach to retrieve microphysical snowfall parameters, J. Geophys. Res., 116, D11203, https://doi.org/10.1029/2010JD015430, 2011.
Knollenberg, R. G.: Techniques for probing cloud microstructure, in: Clouds their Formation, Optical Properties, and Effects, edited by: Hobbs, P. V and Deepak, A., Elsevier, Amsterdam, ISBN 978-0-12-350720-4, 15–91, 1981.
Kollias, P., Bharadwaj, N., Widener, K., Jo, I., and Johnson, K.: Scanning ARM cloud radars. Part I: Operational sampling strategies, J. Atmos. Ocean. Tech., 31, 569–582, 2014.
Korolev, A. and Field, P. R.: Assessment of the performance of the inter-arrival time algorithm to identify ice shattering artifacts in cloud particle probe measurements, Atmos. Meas. Tech., 8, 761–777, https://doi.org/10.5194/amt-8-761-2015, 2015.
Korolev, A. and Heckman, I.: NRC Convair 580 Composite Liquid and Ice Size Distribution Data. Version 1.0, UCAR/NCAR – Earth Observing Laboratory [data set], https://doi.org/10.26023/7BZP-NGPY-WG0B, 2020a.
Korolev, A. and Heckman, I.: NRC Convair 580 Bulk Parameters. Version 0.4, UCAR/NCAR – Earth Observing Laboratory [data set], https://doi.org/10.26023/R6A2-G92Q-CF0S, 2020b.
Korolev, A. and Heckman, I.: NRC Convair 580 2DS Particle Images. Version 1.0, UCAR/NCAR – Earth Observing Laboratory [data set], https://doi.org/10.26023/DREN-VTHA-0N0E, 2020c.
Korolev, A. and Sussman, B.: A technique for habit classification of cloud particles, J. Atmos. Ocean. Tech., 17, 1047–1059, 2000.
Korolev, A., Shashkov, A., and Barker, H.: Calibrations and performance of the airborne Cloud Extinction Probe. J. Atmos. Ocean. Tech., 31, 326–345, 2014.
Lance, S., Brock, C. A., Rogers, D., and Gordon, J. A.: Water droplet calibration of the Cloud Droplet Probe (CDP) and in-flight performance in liquid, ice and mixed-phase clouds during ARCPAC, Atmos. Meas. Tech., 3, 1683–1706, https://doi.org/10.5194/amt-3-1683-2010, 2010.
Lawson, R. P., Baker, B. A., Schmitt, C. G., and Jensen, T. L.: An overview of microphysical properties of Arctic clouds observed in May and July 1998 during FIRE ACE, J. Geophys. Res.-Atmos., 106, 14989–15014, https://doi.org/10.1029/2000JD900789, 2001.
Lawson, R. P., O'Connor, D. C., Zmarzly, P., Weaver, K., Baker, B., Mo, Q., and Jonsson, H.: The 2D-S (Stereo) Probe: Design and preliminary tests of a new airborne, high speed, high-resolution particle imaging probe, J. Atmos. Ocean. Tech., 23, 1462–1477, https://doi.org/10.1175/JTECH1927.1, 2006.
Lawson, R. P., Gurganus, C., Woods, S., and Bruintjes, R.: Aircraft observations of cumulus microphysics ranging from the tropics to midlatitudes: Implications for a “new” secondary ice process, J. Atmos. Sci., 74, 2899–2920, https://doi.org/10.1175/JAS-D-17-0033.1, 2017.
Leinonen, J., Lebsock, M. D., Tanelli, S., Sy, O. O., Dolan, B., Chase, R. J., Finlon, J. A., von Lerber, A., and Moisseev, D.: Retrieval of snowflake microphysical properties from multifrequency radar observations, Atmos. Meas. Tech., 11, 5471–5488, https://doi.org/10.5194/amt-11-5471-2018, 2018.
Liao, L., R. Meneghini, T. Iguchi, and A. Detwiler: Use of dual-wavelength radar for snow parameter estimates, J. Atmos. Ocean. Tech., 22, 1494–1506, https://doi.org/10.1175/JTECH1808.1, 2005.
Mason, S. L., Hogan, R. J., Westbrook, C. D., Kneifel, S., Moisseev, D., and von Terzi, L.: The importance of particle size distribution and internal structure for triple-frequency radar retrievals of the morphology of snow, Atmos. Meas. Tech., 12, 4993–5018, https://doi.org/10.5194/amt-12-4993-2019, 2019.
Matrosov, S. Y.: Possibilities of cirrus particle sizing from dual-frequency radar measurements, J. Geophys. Res., 98, 20675–20683, https://doi.org/10.1029/93JD02335, 1993.
Matrosov, S. Y.: Variability of microphysical parameters in high altitude ice clouds: Results of the remote sensing method, J. Appl. Meteorol., 36, 617–626, https://doi.org/10.1175/1520-0450-36.6.633, 1997.
Matrosov, S. Y.: Potential for attenuation-based estimations of rainfall rate from CloudSat, Geophys. Res. Lett., 34, L05817, https://doi.org/10.1029/2006GL029161, 2007.
Matrosov, S. Y.: CloudSat studies of stratiform precipitation systems observed in the vicinity of the Southern Great Plains atmospheric radiation measurement site, J. Appl. Meteorol. Clim., 49, 1756–1765, https://doi.org/10.1175/2010JAMC2444.1, 2010.
Matrosov, S. Y. and Heymsfield, A. J.: Empirical relations between size parameters of ice hydrometeor populations and radar reflectivity, J. Appl. Meteorol. Clim., 56, 2479–2488, https://doi.org/10.1175/JAMC-D-17-0076.1, 2017.
Matrosov, S. Y., Mace G. G., Marchand, R., Shupe M. D., Hallar A. G., and McCubbin, I. B.: Observations of ice crystal habits with a scanning polarimetric W-band radar at slant linear depolarization ratio mode, J. Atmos. Ocean. Tech., 29, 989–1008, https://doi.org/10.1175/JTECH-D-11-00131.1, 2012.
Matrosov, S. Y., Kennedy, P. C., and Cifelli, R.: Experimentally based estimates of relations between X-band radar signal attenuation characteristics and differential phase in rain, J. Atmos. Ocean. Tech., 31, 2442–2450, https://doi.org/10.1175/JTECH-D-13-00231.1, 2014.
Matrosov, S. Y., Maahn, M., and de Boer, G.: Observational and modelling study of ice hydrometeor radar dual-wavelength ratios. J. Appl. Meteorol. Clim., 58, 2015–2017, https://doi.org/10.1175/JAMC-D-19-0018.1, 2019.
Mazin, I. P., Korolev, A. V., Heymsfield, A., Isaac, G., and Cober, S. G.: Thermodynamics of icing cylinder for measurements of liquid water content in supercooled clouds. J. Atmos. Ocean. Tech., 18, 543–558, 2001.
McFarquhar, G. M. and Heymsfield, A. J.: The definition and significance of an effective radius for ice clouds, J. Atmos. Sci., 55, 2039–2052, 1998.
Mitchell, D. L.: The use of mass- and area-dimensional power laws for determining precipitating particle terminal velocities, J. Atmos. Sci., 53, 1710–1723, 1996.
Mitchell, D. L., Lawson, R. P., and Baker, B.: Understanding effective diameter and its application to terrestrial radiation in ice clouds, Atmos. Chem. Phys., 11, 3417–3429, https://doi.org/10.5194/acp-11-3417-2011, 2011.
Mroz, K., Battaglia, A., Nguyen, C., Heymsfield, A., Protat, A., and Wolde, M.: Triple-frequency radar retrieval of microphysical properties of snow, Atmos. Meas. Tech., 14, 7243–7254, https://doi.org/10.5194/amt-14-7243-2021, 2021.
Nguyen, C. and Wolde, M.: NRC Convair 580 Airborne X-Band Radar Data and Imagery. Version 1.0, UCAR/NCAR – Earth Observing Laboratory [data set], https://doi.org/10.26023/KAGA-JH3J-0Y06, 2020a.
Nguyen, C. and Wolde, M.: NRC Convair 580 Airborne W-Band (NAW) Radar Data and Imagery. Version 1.0, UCAR/NCAR – Earth Observing Laboratory [data set], https://doi.org/10.26023/PBVG-0S4X-3D05, 2020b.
Nguyen, C. M., Wolde, M., Battaglia, A., Nichman, L., Bliankinshtein, N., Haimov, S., Bala, K., and Schuettemeyer, D.: Coincident in situ and triple-frequency radar airborne observations in the Arctic, Atmos. Meas. Tech., 15, 775–795, https://doi.org/10.5194/amt-15-775-2022, 2022.
Ryzhkov, A. Bukovcic, P., Murphy, A., Zhang, P., and McFarquhar, G.: Ice microphysical retrievals using polarimetric radar data, 10th European conference on radar in meteorology and hydrology, 1–6 July, Wageningen, Netherlands, pp. 494–504, https://edepot.wur.nl/454537 (last access: 25 May 2022), 2018.
Sassen, K., Matrosov, S., and Campbell, J.: CloudSat spaceborne 94 GHz radar bright band in the melting layer: An attenuation-driven upside-down lidar analog, Geophys. Res. Lett., 34, L16818, https://doi.org/10.1029/2007GL030291, 2007.
Schumann, U., Mayer, B., Gierens, K., Unterstrasser, S., Jessberger, P., Petzold, A., Voight, C., and Gayet, J. F.: Effective radius of ice particles in cirrus and contrails, J. Atmos. Sci., 68, 300–321, https://doi.org/10.1175/2010JAS3562.1, 2011.
Shupe, M. D., Matrosov, S. Y., and Uttal, T.: Arctic mixed-phase cloud properties derived from surface-based sensors at SHEBA, J. Atmos. Sci., 63, 697–711, https://doi.org/10.1175/JAS3659.1, 2006.
Tan, I. and Storelvmo, T.: Evidence of strong contributions from mixed-phase clouds to arctic climate change, Geophys. Res. Lett., 46, 2894–2902, https://doi.org/10.1029/2018GL081871, 2019.
Tridon, F., Battaglia, A., Chase, R. J., Turk, F. J., Leinonen, J., Kneifel, S., Mroz, K., Finlon, J., Bansemer, A., Tanelli, S., Heymsfield, A. J., and Nesbitt, S. W.: The microphysics of stratiform precipitation during OLYMPEX: Compatibility between triple-frequency radar and airborne in situ observations, J. Geophys. Res., 124, 8764–8792, https://doi.org/10.1029/2018JD029858, 2019.
Tyynelä, J. and Chandrasekar, V.: Characterizing falling snow using multifrequency dual-polarization measurements, J. Geophys. Res.-Atmos., 119, 8268–8283, https://doi.org/10.1002/2013JD021369, 2014.
Wolde, M. and Pazmany, A.: NRC dual-frequency airborne radar for atmospheric research, Proceedings of the 32 AMS conference on radar meteorology, P1R.9, Albuquerque, NM, 2005.
Wolde, M., Nguyen, C., Bastian, M., Korolev, A., and Heckman, I.: Characterization of the pilot X-band radar responses to the HIWC environment during the Cayenne HAIC-HIWC 2015 Campaign, American Institute of Aeronautics and Astronautics, https://doi.org/10.2514/6.2016-4201, 2016.
- Abstract
- Introduction
- Measurements
- A case study illustration
- Statistical relations between PSD characteristic sizes and radar parameters
- Relations among different definitions of PSD characteristic size
- Conclusions
- Data availability
- Author contributions
- Competing interests
- Disclaimer
- Financial support
- Review statement
- References