the Creative Commons Attribution 4.0 License.
the Creative Commons Attribution 4.0 License.
 | 09 Nov 2022
Reactive uptake coefficients for multiphase reactions determined by a dynamic chamber system
Guo Li
Uwe Kuhn
Guangjie Zheng
Lei Han
Fengxia Bao
Ulrich Pöschl
Dynamic flow-through chambers are frequently used to measure gas exchange rates between the atmosphere and biosphere on the Earth's surface such as vegetation and soils. Here, we explore the performance of a dynamic chamber system in determining the uptake coefficient γ of exemplary gases (O3 and SO2) on bulk solid-phase samples. After characterization of the dynamic chamber system, the derived γ is compared with that determined from a coated-wall flow tube system. Our results show that the dynamic chamber system and the flow tube method show a good agreement for γin the range of 10−8 to 10−3. The dynamic chamber technique can be used for liquid samples and real atmospheric aerosol samples without complicated coating procedures, which complements the existing techniques in atmospheric kinetic studies.
- Article
(4256 KB) - Full-text XML
-
Supplement
(540 KB) - BibTeX
- EndNote


Multiphase and heterogeneous chemical reactions can influence the formation and transformation of atmospheric trace gases and aerosols, and thus play a crucial role in atmospheric chemistry, climate, and human health (Su et al., 2020; Zheng et al., 2020; Pöschl and Shiraiwa, 2015; Kolb et al., 2010; Pöschl, 2005; Rossi, 2003; Jang et al., 2002; Gard et al., 1998). To evaluate their impacts, we need to understand the reaction kinetics of multiphase processes (Rossi, 2003; Kolb et al., 2010). Reactive uptake coefficients, commonly designated as γ, is an important parameter used to quantify uptake and reaction kinetics (Ravishankara, 1997; Davidovits et al., 2006; Seinfeld and Pandis, 2016a). Different experimental techniques have been developed to determine γ, such as droplet train flow reactors, Knudsen cells, flow tube reactors, and aerosol/smog chambers (Usher et al., 2003; Davidovits et al., 2006; Kolb et al., 2010; Crowley et al., 2010; Ammann et al., 2013).
Among these diverse techniques, flow tube reactors and aerosol/smog chambers are two of the most widely adopted measurement methods. Flow tube reactors can generally be classified as coated- and wetted-wall flow tubes as well as aerosol flow tubes. The coatings of coated-wall flow tube reactors can be solids or semi-solids including, for example, salts (Davies and Cox, 1998; Chu et al., 2002; Qiu et al., 2011), ice (Fernandez et al., 2005; McNeill et al., 2006; Petitjean et al., 2009; Symington et al., 2012; Hynes et al., 2002, 2001; Bartels-Rausch et al., 2005), mineral dust (El Zein and Bedjanian, 2012; Bedjanian et al., 2013), soot (McCabe and Abbatt, 2009; Khalizov et al., 2010; Monge et al., 2010), proteins (Shiraiwa et al., 2011), and soils (Stemmler et al., 2006; Wang et al., 2012; Donaldson et al., 2014a, b; VandenBoer et al., 2015; Li et al., 2016). Wetted-wall flow tube reactors employ thin liquid films such as water (Henstock and Hanratty, 1979; Hanson et al., 1992), sulfuric acid (Hanson et al., 1992; Hanson and Ravishankara, 1995), or other organic-containing liquids (Barcellos da Rosa et al., 2003; Thornberry and Abbatt, 2004). Additionally, aerosol flow tubes can be used to investigate the multiphase processes between gas phase and lab-generated liquid/solid particles, supposed to simulate realistic atmospheric conditions through laboratory studies (Davidovits et al., 2006; Kolb et al., 2010). On the other hand, large aerosol/smog chambers are commonly used for investigations of particles' formation and growth processes as well as the relevant formation kinetics under laboratory conditions (Shilling et al., 2008; Virtanen et al., 2010; Zhang et al., 2011; Nakao et al., 2012; Schobesberger et al., 2013; Wang et al., 2014; Zhang et al., 2015; McVay et al., 2016; Tiitta et al., 2016; Matsuoka et al., 2017).
Despite numerous uptake/reaction kinetic studies using flow tube reactors and aerosol/smog chambers, some constraints still need to be considered. Experiments using flow tubes can be challenging when (1) the influence of coating surface roughness on experiments for gas uptake and kinetic studies cannot be properly quantified (Li et al., 2018); (2) considering that measurements of ambient samples without changing their properties (e.g., aerosol mixing state) seem almost impossible to achieve; and (3) most of the insoluble/low-soluble components of the investigated substances, for example ambient aerosols, are not incorporated into solution-prepared coatings or films, which results in the derived γ unrepresentative of real atmospheric conditions. Considering the compositional complexity of ambient aerosols, the results obtained only through laboratory studies may not reflect the multiphase processes and respective synergetic effects occurring in the real world (Su et al., 2020). Chamber studies are usually limited to relatively fast uptake kinetics, while the signals of slow uptake will be buried by the competing wall loss effects for aerosols and gases of interest (Rossi, 2003).
In addition to applications in the field of atmospheric chemistry, the chamber technique has also been adopted to measure deposition velocities and further derive the reaction probabilities (i.e., γ) of ozone on surfaces of indoor material like carpets and clothing fabrics (Morrison and Nazaroff, 2000; Canoruiz et al., 1993; Coleman et al., 2008). However, the effectiveness of this technique in investigating uptake kinetics of different reactive trace gases on varying types of bulk samples, which are more relevant to atmospheric kinetic studies, still needs to be evaluated.
Thus, in this work, we developed a method to measure gas uptake coefficients, γ, which is suitable for (1) both surrogate aerosols and ambient aerosol samples from the real atmosphere; and (2) both solid and liquid samples. We explain the working principle of our approach based on dynamic chambers, and show how it can be applied to measure γ of various trace gases interacting with different reactive bulk samples. To validate our method, we compare the derived γ with those from the well-established coated-wall flow tube technique and literature data, which show a good agreement.
2.1 Working principle of the chamber method
2.1.1 Uptake coefficient determination
Dynamic flow-through chambers had been widely adopted in previous studies to measure trace gas exchange rates between the atmosphere and biosphere such as vegetation and soils (Pumpanen et al., 2001; Gut et al., 2002; Pape et al., 2009; Su et al., 2011; Breuninger et al., 2012; Oswald et al., 2013; Cowan et al., 2014; Almand-Hunter et al., 2015; Plake et al., 2015; Weber et al., 2015; Sun et al., 2016; Meusel et al., 2016, 2018; Wu et al., 2019). Similarly, in our chamber the flux J (in molecules s−1) of a gas reactant can be calculated from the mass balance by
where Q is the chamber flow rate (in m3 s−1), Cin is the supplied trace gas concentration at the chamber inlet (in molecules m−3), and Cout is the trace gas concentration at the outlet of the chamber containing a sample (in molecules m−3). Note that in Eq. (1) the difference between Cin and Cout can arise not only from gas uptake on the sample but also from its losses on the chamber wall. Here, as we only focus on gas uptake on samples, the chamber wall loss effect should be corrected beforehand. Thus, the flux Jsam caused solely by gas reactant at the sample surface is calculated as
where Cref (in molecules m−3) is the gas reactant concentration measured at the outlet of a blank chamber prior to the uptake experiment. Since our chamber system had a dynamic flow-through feature, a constant rate of wall loss (once existed) was observed, i.e., the ratio of Cref to Cin showed a fixed value during our uptake experiments (see Fig. 3). Thus, using Cref (instead of Cin) for flux calculation already accounted for gas losses on chamber walls. Before each gas uptake experiment, Cref was determined mimicking the chamber conditions (i.e., gas flow rate, gas mixing state, temperature, pressure and RH, and the speed of the mixing fan) of the following uptake experiments.
Assuming a well-mixed and steady-state condition in the chamber, the deposition velocity Vd (in m s−1) at the chamber outlet can be derived as (Seinfeld and Pandis, 2016b)
where A is the cross-sectional area at the chamber outlet (in m2), which equals the surface area of the chamber bottom.
The deposition velocity can be used to calculate the surface uptake/reaction kinetics. In analogy to electrical resistances under both ambient (Seinfeld and Pandis, 2016b) and chamber-modified conditions (Pape et al., 2009), the uptake process can be decomposed into two processes: transport to the surface and uptake on the surface. A simplified two-resistor model proposed by Canoruiz et al. (1993) is therefore used:
where Rt is the transport resistance (in s m−1), which equals the reciprocal of the transport-limited deposition velocity Vt (in m s−1); Rs is the surface uptake resistance (in s m−1), which is determined by the observed uptake coefficient γobs and the mean molecular speed ω of the gas reactant (in m s−1). Comparison between this two-resistor model and the resistance model (for dry deposition) proposed by Seinfeld and Pandis (2016b) reveals that the transport resistance Rt can be viewed as the sum of the aerodynamic resistance Ra and the quasi-laminar layer resistance Rb. Thus, Rt (or Vt) is dependent on the flow/mixing conditions in the chamber (accounting for Ra and Rb) and the molecular diffusivity of the gas reactant itself (accounting for Rb).
Based on Eq. (4), an expression for the observed/measured uptake coefficient γobs can be given as
After accounting for the sample mass ms, we can finally get the mass-independent uptake coefficient γBET,
where Ass is the sample specific surface area (in m2), which equals the sample mass ms (in g) times the sample specific BET surface area SBET (in m2 g−1). One should keep in mind that for liquid samples in a petri dish, Ass is equivalent to the geometric surface area of the petri dish. Moreover, adopting Ass for γBET calculation only holds when the whole sample coating contributes to uptake of the gas reactant within the experiment period. Using the method described in our previous study (Li et al., 2019), a maximum diffusion time of ∼5 min is estimated for penetrating through our solid samples, which is comparable to our uptake experiment timescale (i.e., reaction time of ∼ 5–10 min).
Vd can be calculated through Eq. 3 based on chamber flux measurements. Actually, Vt can be viewed as a special situation when Rs≪Rt (i.e., when γ is in the range of 10−2–1, is in the range of 10−4–10−2 s cm−1, which is 2 to 4 orders of magnitudes smaller than Rt, see Sect. 3.1.3. Note that at our experimental temperature of 23 ∘C, m s−1 and m s−1). Therefore, Vt can be obtained experimentally by finding a specific trace gas species with a γ on the order of 10−2 to 1. Saturated potassium iodide (KI) solutions and solid KI coatings have been demonstrated to be a perfect sink for O3 with a γ up to 10−2 (Galbally and Roy, 1980; Parmar and Grosjean, 1990; Rouvière et al., 2010) and have been used to obtain Vt (Morrison and Nazaroff, 2000; Coleman et al., 2008; Pape et al., 2009). Note that the determined Vt depends on the chamber setup and experimental conditions (i.e., gas flow rate, gas mixing state, temperature, pressure and RH, and the speed of the mixing fan). Because physical properties of samples can potentially influence Rb (e.g., the surface roughness of a sample can affect the thickness of the quasi-laminar layer above it) and hence Rt, the KI samples should also have the same or similar phase state and surface morphology as those of the investigated samples. Thus, in this study, Vt was determined by measuring O3 uptake on different types of KI substrates (i.e., saturated KI solutions, KI films/grains held in a petri dish, see Sect. 3.1.3) to check the effects of their phase state and surface morphology on Vt. On the other hand, when Rb is the limiting step for Vt, the determined Vt based on O3 uptake on KI cannot be directly used for other gas reactants. A correction is therefore necessary (Goldan et al., 1988):
where Vt,i is the transport-limited deposition velocity of gas reactant i (in m s−1), is the observed transport-limited deposition velocity of O3 (in m s−1), and Mi and are the molar mass of i and O3 (in g mol−1), respectively. Notably, turbulent diffusion is not affected by molecular weight, hence the Vt correction becomes exaggerated for cases where Ra≫Rb. We estimated Ra and Rb according to our chamber configuration and experimental conditions. Details about comparisons between Ra and Rb can be found in the Supplement. These results show that Ra is several times larger than Rb when solid oxide samples are used for uptake experiments. Herein, Vt measured by O3 uptake on KI can be used as a close approximation of Vt in uptake experiments of other reactive gases.
2.1.2 Upper limit estimation
As discussed above, when Rs≪Rt, the overall uptake is limited by the transport process (i.e., Vt). Under such conditions, a significant change in γ can only result in a minute alteration of the measured Vd. For example, Fig. 1 shows the variation trend of Vd of SO2 as a function of its γ at four different Vt conditions. All the curves display a linear increase at the lower γ region, and then evolve into a plateau at the higher γ region where Vd becomes non-sensitive to the change of γ. Within this non-sensitive region, a remarkable change of γ (e.g., in several orders of magnitudes) may be reflected by a small change in Vd. However, tiny changes of Vd can also arise from intrinsic measurement errors of the used instruments (see Eqs. 1–3), and these measurement uncertainties in Vd may bury those changes caused by variations of γ. This means that for a specific chamber measurement system there is an upper limit for the derived γ.
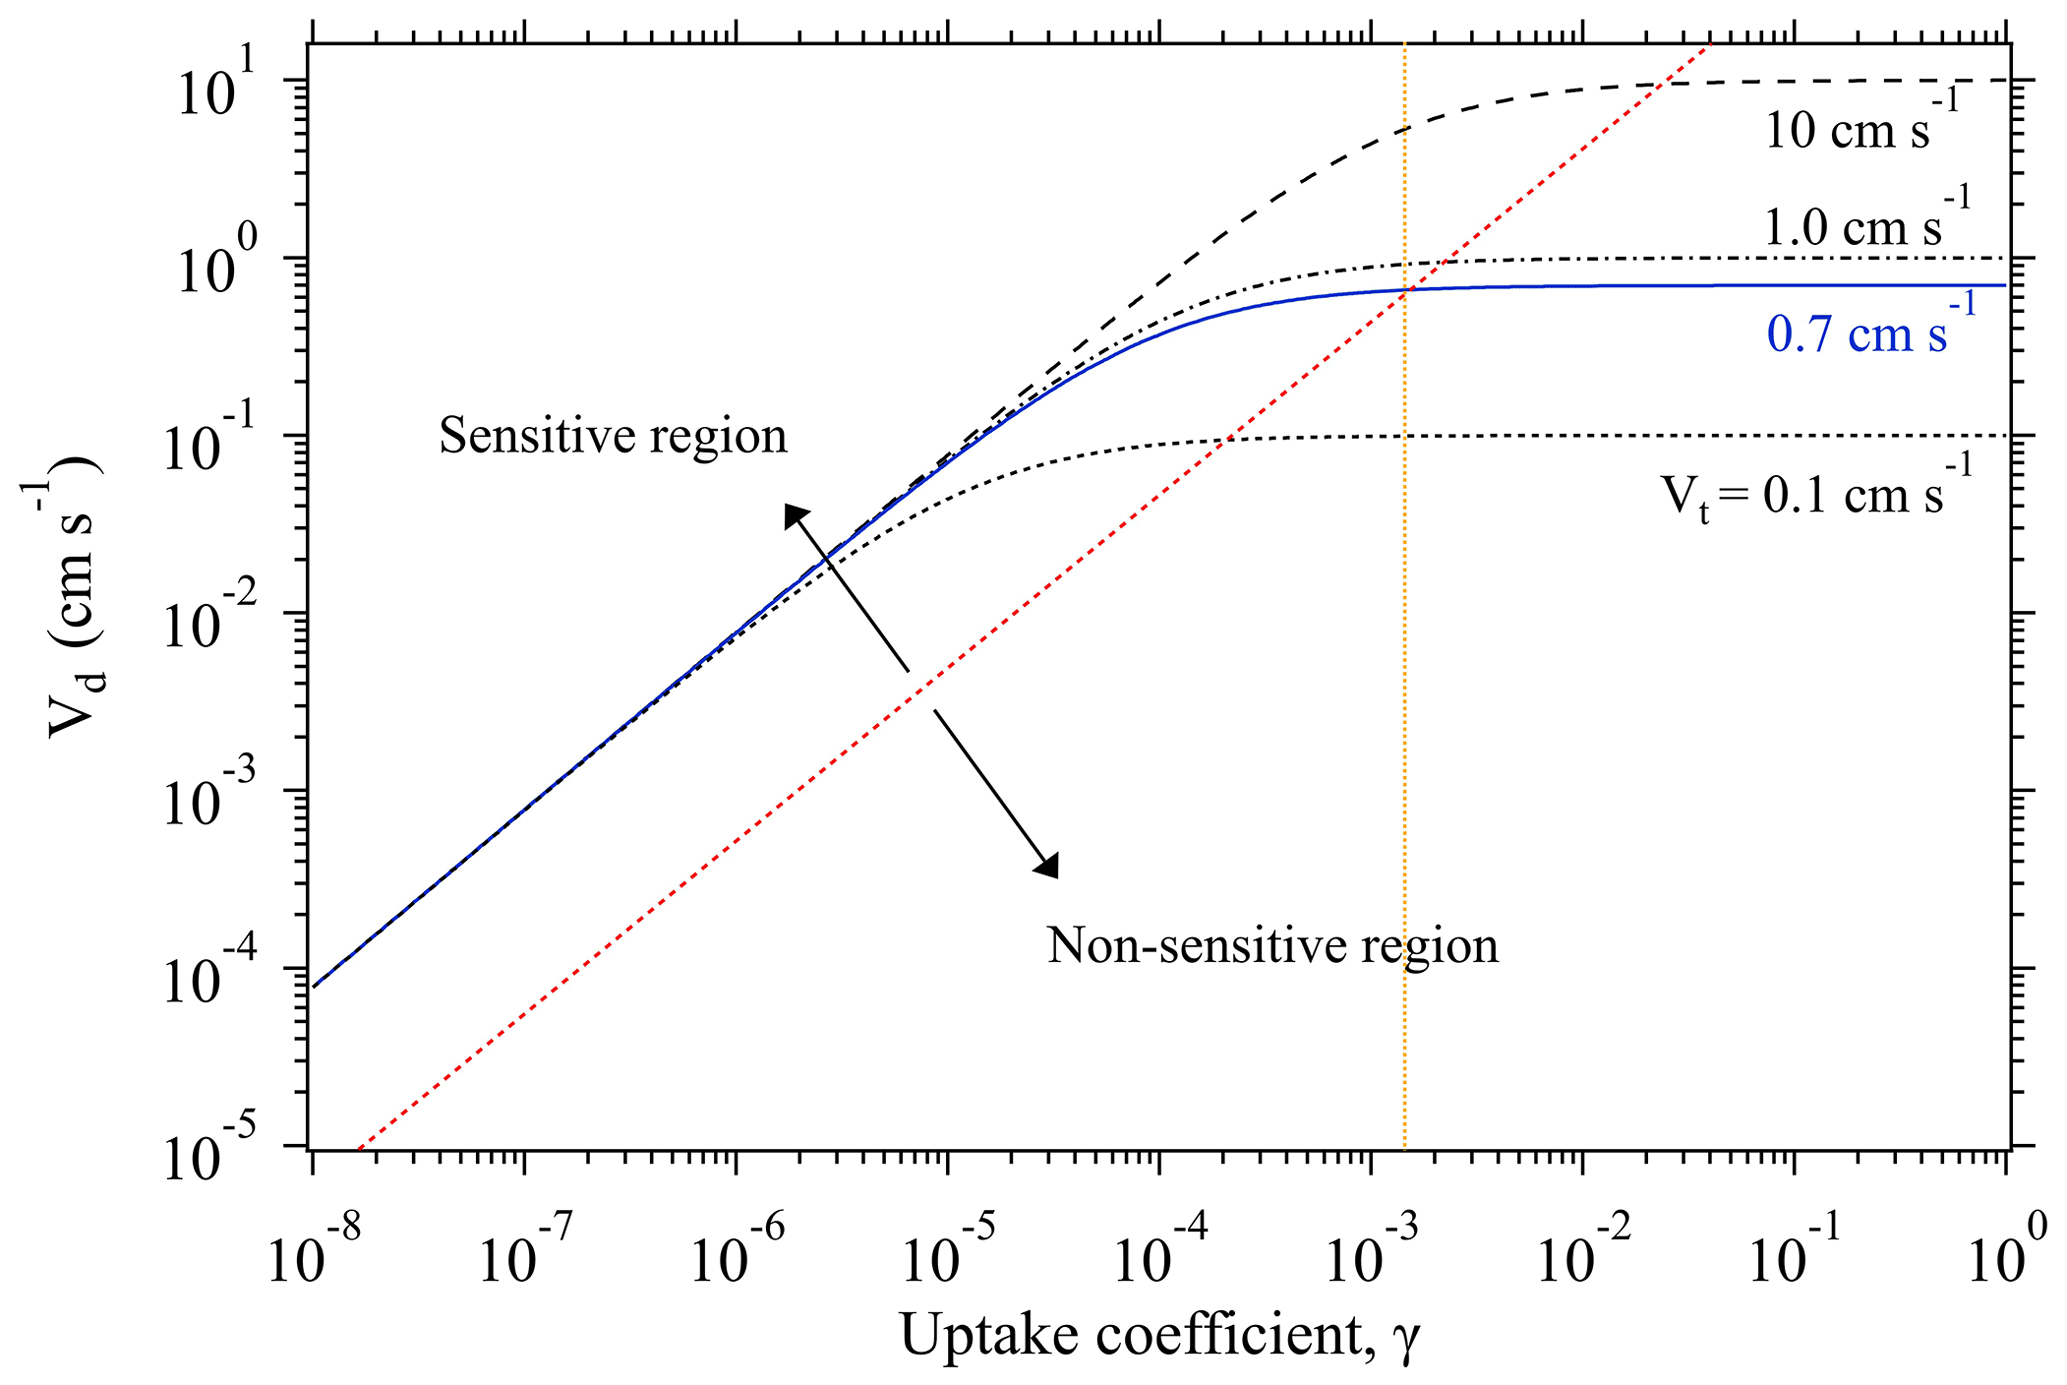
Figure 1Change of deposition velocity Vd of SO2 as a function of its uptake coefficient γ, at different transport-limited deposition velocity Vt conditions. The blue line shows the Vt obtained from our chamber measurements of O3 deposition on KI samples and used for γ derivation of the uptake experiments. The orange dotted line indicates the upper limit of the derivable γ by our chamber system. Based on the sensitivity of the change of Vd against the variation of γ, each function curve can be deemed to have two regions: sensitive and non-sensitive regions, as separated by the red dotted line. All the function curves correspond to the case with a constant experimental temperature of 296 K.
As shown in Fig. 1, Vd becomes non-sensitive to the change of γ when Vd is quite close to Vt. Here, to estimate the maximum value of the derived γ by our chamber method, we define an upper limit of γ corresponding to the case when Vd reaches 0.95Vt. With this definition, when a Vt is identified, the upper limit of the measurable γ can be calculated through Eq. (5). The identified Vt of our chamber system for the uptake experiments is ∼0.7 cm s−1, which allows for γ derivation with an upper limit of (indicated by the orange dotted line in Fig. 1).
For the lower limit of the derived γ by our method, as Vd is sensitive to the change of γ within the lower range, in principle there is no such a limit for our chamber system provided that the tiny concentration difference (caused by slow uptake processes) between chamber inlet and outlet can be recognized by the adopted gas analyzers.
2.2 Experiment overview
A chamber system (see Sect. 2.4.1 for details) was built and employed for uptake experiments under controlled laboratory conditions at a pressure of 1 atm and at room temperature of 296±1 K. After characterization and optimization of the chamber, the uptake of O3 and SO2 on different types of solid samples was measured to derive respective γ. To assess the performance of the dynamic chamber method, coated-wall flow tube experiments were also conducted. All uptake experiments were performed with pre-humidified (50±1 % relative humidity, RH) zero air. Details about the zero-air generation and humidification can be found in Sect. 2.4.1.
2.3 Sample preparation
Different solid-phase substrates including three types of oxide powders were used in this study. For flow tube experiments, solid-phase samples were coated onto the inner walls of the flow tubes. For uptake experiments applying the chamber technique, the samples were placed or coated into a glass petri dish, which was placed at the center of the chamber bottom.
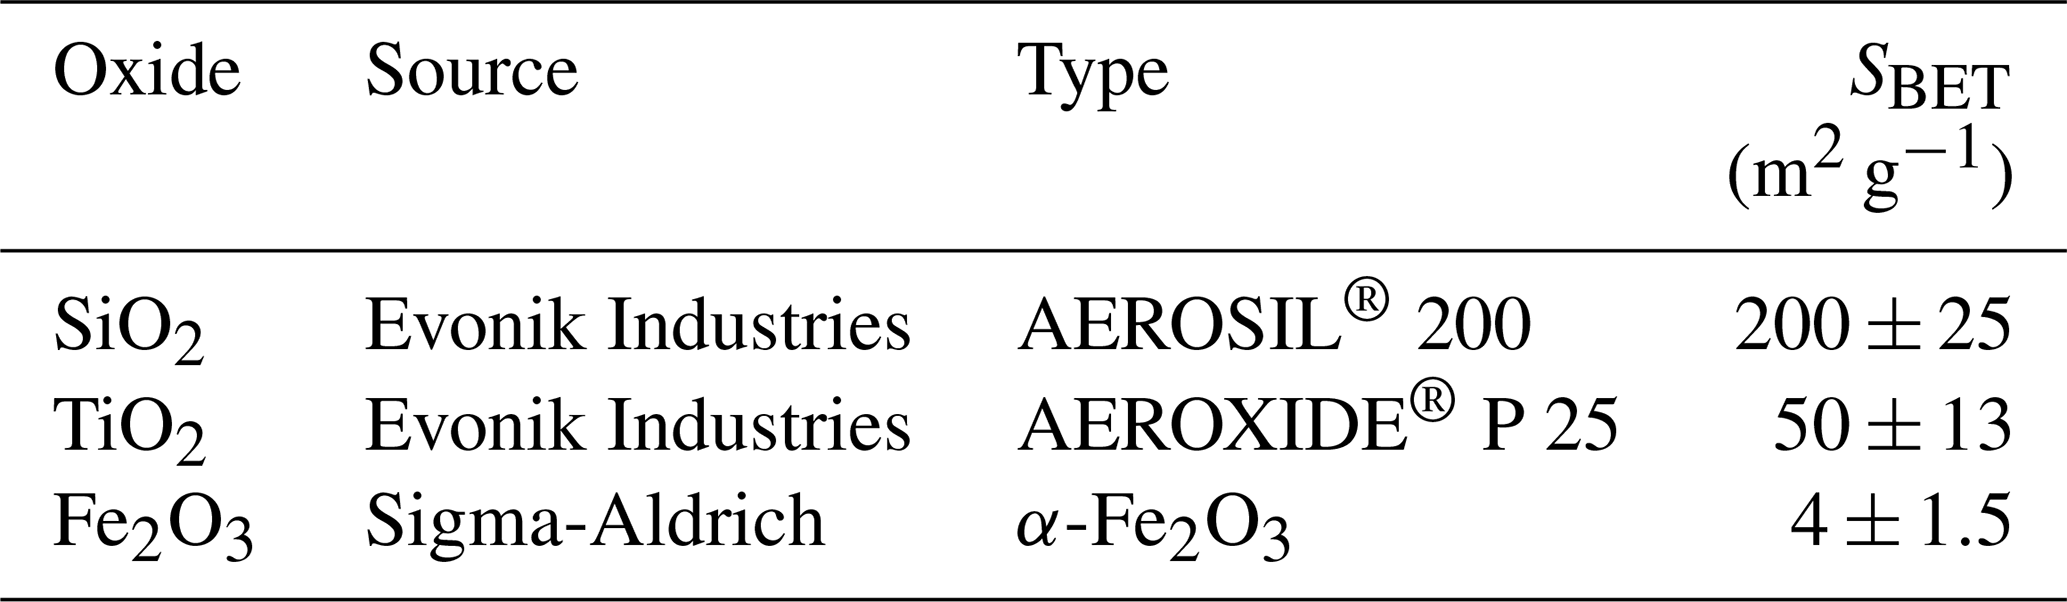
Commercially available oxide samples including SiO2, TiO2, and Fe2O3 (see Table 1 for details) were used in both chamber and flow tube uptake experiments. Their specific surface areas were measured using a water vapor adsorption method based on the Brunauer–Emmett–Teller (BET) adsorption theory (Brunauer et al., 1938). For calculation of the BET surface area, the mass of the adsorbed water on oxide sample after equilibrium with pre-defined RH levels was determined by a non-dispersive infrared (NDIR) gas analyzer (type: Li-6262, LI-COR Biosciences Inc.) operated in the differential mode. The flow tube coatings were prepared by first mixing with deionized water obtained from a Milli-Q system (18.2 MΩ cm−1, Millipore) to prepare hydrosols, and mixing Fe2O3 with ethanol (≥70 %, Roth, Germany) to prepare alcosol, respectively, and then coating the prepared onto the sand-blasted inner walls of the flow tubes. To obtain a homogeneous oxide coating, an air-dried continuous rotating coating tool (ACRO) was employed. Details about the ACRO can be found in our previous study (Li et al., 2016). After coating and drying, the coated oxide mass was ∼55 mg for SiO2, ∼35 mg for TiO2 and ∼500 mg for Fe2O3, respectively. The coating thickness was in the range of several micrometers to tens of micrometers depending on the coated mass. For chamber experiments, the oxides were coated onto the bottom of a glass petri dish (ID: 116 or 90 mm, height: 10 mm). These oxide coatings were dried overnight by placing the -containing petri dish into a small dynamic drying chamber purged with dry N2. The dried oxide coatings were smooth and homogeneous to the eye. To exclude potential effects of the coating thickness on uptake kinetics, we predetermined the mass of the oxide coating needed in the petri dish based on the dry-coating mass on the flow tube wall and the ratio between the coated geometric surface area of the flow tube inner wall (S1) and that of the petri dish bottom (S2). That is, as equals 0.5, then the coated-oxide mass in the petri dish should be 2 times of that in the flow tube, assuming the two different drying methods could result in even coatings with similar densities.
Table 1Commercial sources and physical properties of oxide samples used in this study.
2.4 Systems used for kinetic experiments
2.4.1 Chamber system
The chamber system can be divided into five units: (1) gas supply; (2) humidification; (3) chamber; (4) controlling and recording unit; and (5) detection unit (see Fig. 2). The gas supply provided different types of gases: i.e., purified compressed air (zero air) serving as carrier gas, and reactant gas either from the gas cylinder (i.e., SO2) or generated via a generator (i.e., O3). Compressed dry air was supplied by a compressor and was purified by a series of filter columns filled with glass wool (Merck, Germany), silica gel (2–5 mm, Merck, Germany), Purafil® (, Purafil Inc. USA), and activated charcoal (LS – labor service, Germany), respectively, producing an air flow free of O3 and SO2 (Sun et al., 2016). SO2 was supplied from a calibration gas cylinder (Westfalen AG, Germany; SO2 analytical value: 10.3 ppm, analytical accuracy: ±5.00 %) and O3 was generated in zero air by photolysis of O2 using a UV light (O3 generator SOG-2, Analytic Jena, USA). Gas humidification was achieved by a split (dry/wet) gas system regulated by PID-controlled mass flow controller unit (Bronkhorst® High-Tech, Netherland). A RH sensor was applied at the outlet of the humidifier as a reference for PID setpoint control. A similar humidification system had been tested earlier and showed a good stability in a previous study by Sun et al. (2016). Note that the addition of O3 and SO2 into the main gas flow was downstream of the humidification unit.
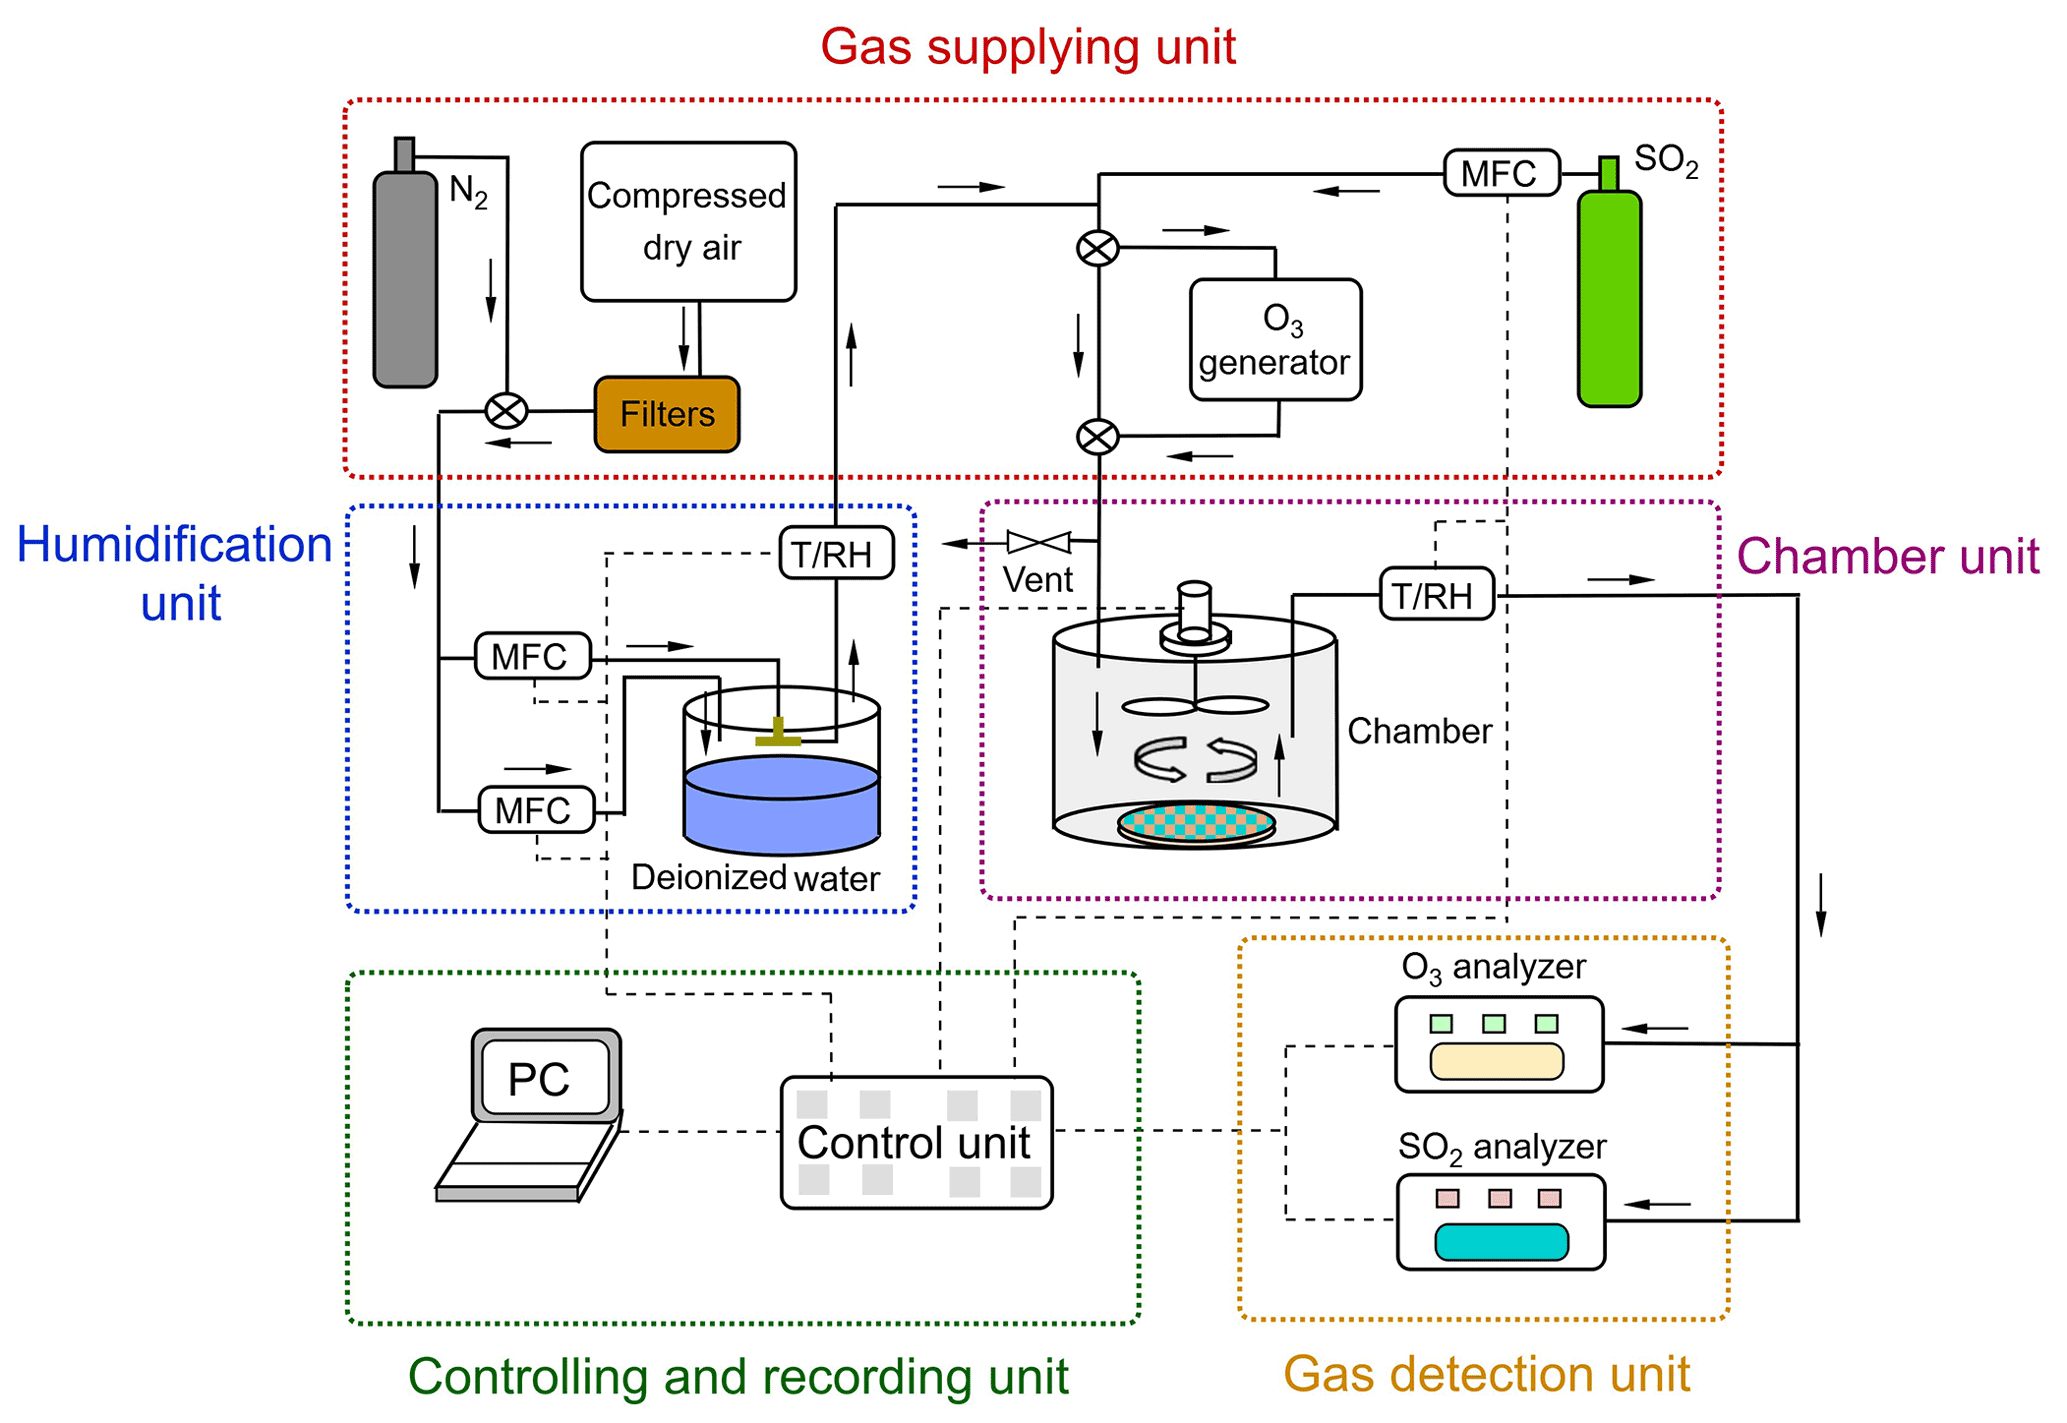
Figure 2Schematic of the chamber system. The N2 was only used to pre-condition the prepared samples at different RH and the filtered compressed air was used for uptake experiments.
One dynamic flow-through chamber was employed in our chamber measurement system. A petri dish was placed on the chamber bottom to hold the sample during the gas uptake experiments, as shown in Fig. 2. This chamber was 123 mm in diameter and 132 mm in height, which resulted in a chamber volume of ∼1.56 L. The chamber wall was made of FEP foil (Saint Gobain Performance Plastics Corporation, USA) to minimize the wall loss of reactive gas species. Possible sample gas losses due to chamber wall/gas-phase reactions were checked before each uptake experiment and this effect was corrected during the subsequent data analyses (see Sect. 3.1). A fan coated with Teflon® was installed at the center of the chamber lid to ensure well-mixed turbulent conditions inside the chamber. The gas inlet was positioned at the chamber lid. The effects of different chamber outlet locations on the measured uptake are discussed in Sect. 3.1. The total flow rate of supplied gas was a bit higher than the flow going through the dynamic chamber which was determined by the trace gas analyzers. The flow of the vent positioned upstream of the chamber could be adjusted by a needle valve. In this way, a small overpressure inside the chamber could be sustained, which avoided contaminations from lab air.
An O3 analyzer (Model 49i, Thermo Fisher Scientific, USA, lower detection limit: 1 ppbv) and a SO2 analyzer (Model 43i, Thermo Fisher Scientific, USA, lower detection limit: 1 ppbv) were used for reactive trace gas analysis. Before uptake experiments, we calibrated the SO2 analyzer by multi-stage dilution of a SO2 calibration gas (10.3 ppm, analytical accuracy: ±5.00 %, Westfalen AG, Germany). Results of the SO2 multi-point calibration can be found in the Supplement (Fig. S1). A time resolution of 10 s was used for trace gas analysis and data were recorded by a PC.
2.4.2 Flow tube system
A coated-wall flow tube system was used to investigate the uptake of SO2 and O3 on oxide coatings. Briefly, the system consisted of four parts: (1) a sample and a reference tube; (2) a reactant gas () supply; (3) a humidification unit; and (4) detection units. Two glass tubes (inner-wall surface sandblasted) with identical dimensions (ID: 17 mm, L: 100 mm) were employed, with one coated with the oxide samples (i.e., sample tube) and the other remained uncoated as a reference. Both tubes were maintained at a temperature of 296±0.5 K during the experiments. The same hardware components, except the chamber, were also used for the flow tube system (see Sect. 2.4.1).
A similar operation procedure of the flow tube experiments was described in our previous study (Li et al., 2016). For all the uptake experiments employing flow tubes, the flow rate in the sample tube was kept constant at 1.3 L STP min−1 and the Reynolds number (Re) was ∼113 to ensure laminar flow conditions. Moreover, a pre-tube/entrance region (ID: 17 mm, L: 300 mm) without sample coatings was added in front of the coated tube region to allow for the development of a laminar flow near the tube entrance and finally a well-developed laminar flow pattern within the entire coated section (Li et al., 2018). Calculations of γ were based on reactant gas concentration differences between the sample tube inlet and outlet (i.e., penetration). Note that the reactant gas concentrations at the sample tube inlet were equal to those at the reference tube outlet. Gas diffusion correction on γ was achieved by using a numerical Cooney–Kim–Davis (CKD) method (Murphy and Fahey, 1987), which provides results agreeing well with those by other analytical correction methods such as the Knopf–Pöschl–Shiraiwa (KPS) method (Knopf et al., 2015; Li et al., 2016).
3.1 Chamber characterization
3.1.1 Chamber equilibrium time
To perform uptake experiments using our chamber system, a petri dish holding the sample needs to be placed into the chamber (see Sect. 2.3). To achieve this, the procedure is as follows: (1) determine Cref of the blank chamber; (2) open the chamber lid; (3) put the sample-holding petri dish onto the chamber bottom; and (4) close the chamber lid. Opening the chamber lid to insert a sample disrupts the steady-state conditions achieved during Cref measurements. We here denote the time period needed to re-establish the steady-state condition as the chamber equilibrium time (Fig. 3).
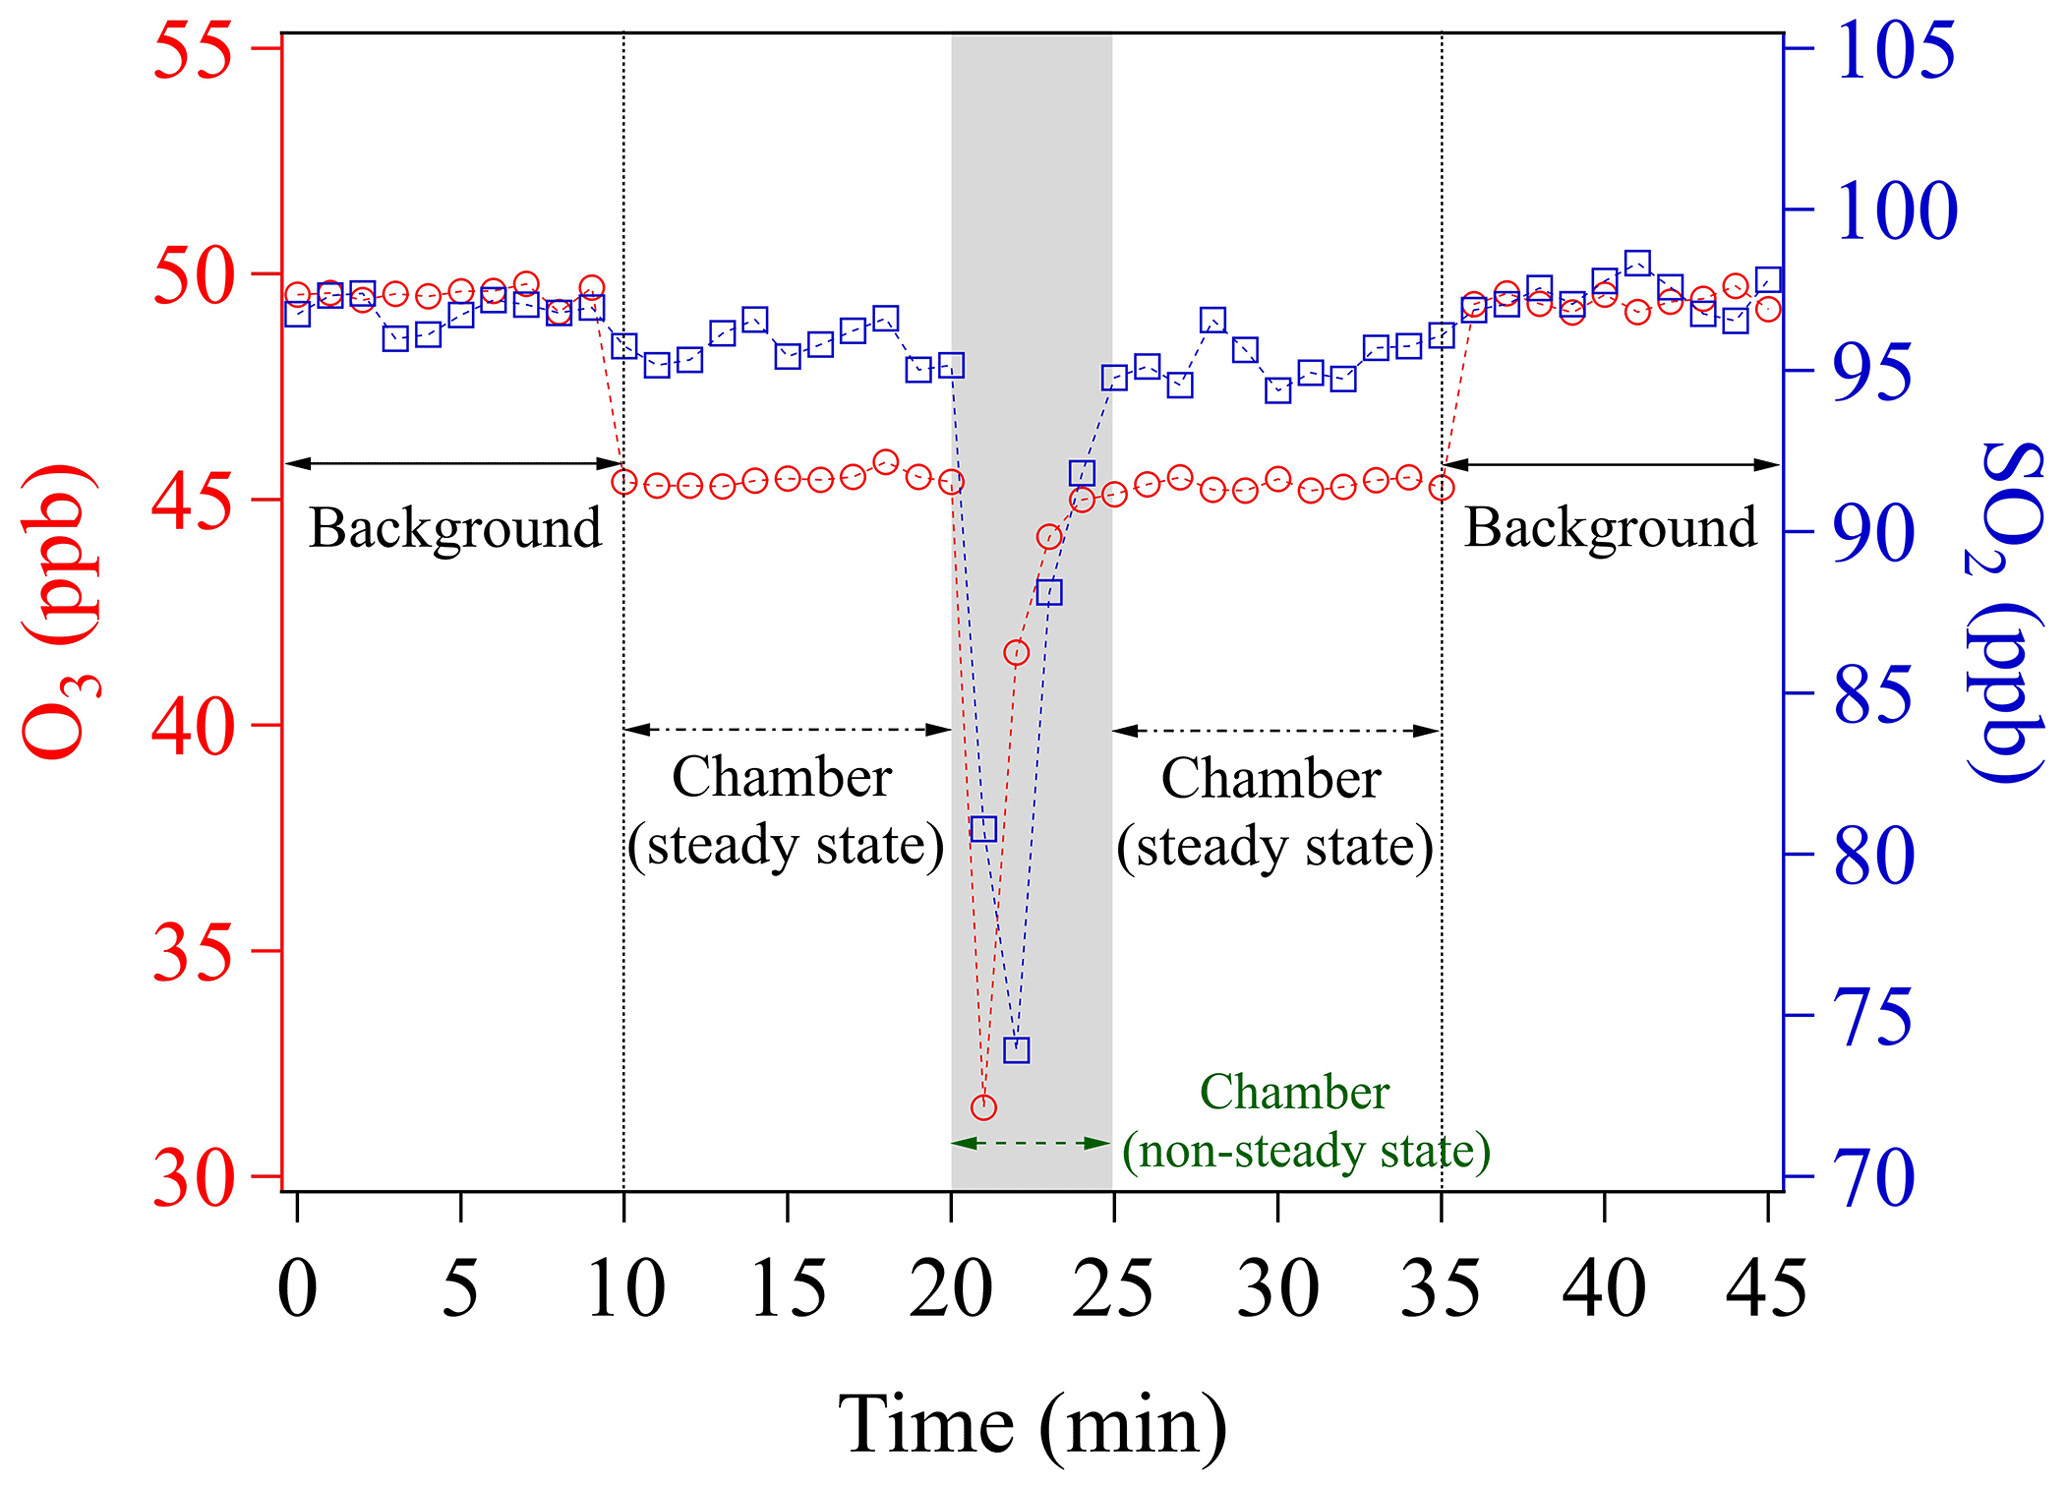
Figure 3Time course of O3 and SO2 mixing ratios while placing an empty sample petri dish into the chamber. The time span of the gray shaded area corresponds to the chamber equilibrium time, which is omitted in any data evaluation.
Figure 3 shows the evolutions of mixing ratios of O3 and SO2 in two individual experiments, respectively, due to insertion of a blank sample petri dish into the chamber. Please note that measurements of all the mixing ratios were achieved by using a fixed chamber outlet position (C, see Sect. 3.1.2). O3 and SO2 are first monitored upstream of the chamber (inlet) for 10 min, in order to obtain the mixing ratios in the supply gas (background), which is not influenced by the uptake in the chamber (i.e., excluding the effects of wall losses and potential chemical reactions inside the chamber). Note that during the background check the chamber is continuously flushed with these gas reactants. After 10 min (Fig. 3), the outlet concentrations of the blank chamber are measured for another 10 min. A slight decrease of mixing ratios (∼4 ppb) is found for O3, which can be assigned to a chamber wall-loss effect. To avoid this effect, the chamber could have been pre-conditioned by flushing with high O3 mixing ratios over a long time period (e.g., overnight). The wall-loss effect is not observed for SO2, though. Any observed wall-loss effect for O3 was considered and corrected during subsequent data analyses. This 10 min measurement is used to determine Cref, afterwards the chamber lid is opened and then closed mimicking the process in the uptake experiments. From Fig. 3, we can see that the lab air with low mixing ratios enters into the chamber, followed by slowly recovering to the steady-state concentration (Cref) after closing the chamber. From opening of the chamber lid to the point climbing back to Cref, the chamber is in a non-steady state. As shown in Fig. 3, a total time of ∼5 min (gray shaded area) is considered as the time required for reaching a steady state/dynamic equilibrium of gas reactants in all subsequent data processing. This equilibrium time is subject to (1) the time for the sample petri dish placement operation (1.5–2 min), (2) the flush-out time of diluted gases inside the chamber (here a purging flow rate of 1.78 L min−1 was used, which resulted in a residence time of ∼1 min in the chamber volume of ∼1.56 L), and (3) the time for gas analyzers' responses (1.5–2 min, based on the instrument specifications). Shorter equilibrium times, however, can be achieved by increasing the chamber purging flow rate and/or employing gas analyzers with faster response times. In fact, a shorter equilibrium time is required for rapid uptake kinetics or samples with low uptake capacity (i.e., fast surface saturation). For our uptake experiments, the freshly prepared samples were exposed to the gas reactants for 10 min and only uptake data in the second half of the exposure period (i.e., 6–10 min) were used for γ calculation. In order to measure γ at the initial stage of uptake, a modification may be needed for our chamber system. One easy solution would be adding a cover (chemically inert) on the sample-holding petri dish, which can be easily removed inside the chamber but without opening it. Then, a new introduction procedure can be designed as the following: (1) put the covered sample-holding petri dish onto the chamber bottom; (2) close the chamber lid; (3) feed gas reactant into the chamber until its concentration reaches a steady state; and (4) remove the petri dish cover inside the chamber to allow gas uptake on samples. The use of the cover could avoid uptake of gas reactants on samples before the steady-state concentration is reached in the chamber. We suggest that future chamber applications could consider use this way for gas kinetic studies.
Considering that γ can represent different uptake stages resulting from gradual surface saturation of a sample, two types of γ have been adopted (Hanisch and Crowley, 2003): the initial uptake coefficient γ0 and the steady-state uptake coefficient γss. γ0 is obtained at the very beginning or the first few minutes when the sample is exposed to a gas reactant but yet without occurrence of significant saturation. For example, Underwood et al. (2001) studied the heterogeneous reaction of nitric acid on oxide and mineral dust particles, and further calculated γ0 corresponding to a sample exposure time of ∼9.5 min. On the other hand, γss is used to reflect the uptake properties when uptake comes into a (quasi-) steady state; for example, after an exposure time of 3 h, Michel et al. (2003) found that the investigated samples (i.e., α-Al2O3 and α-Fe2O3) approached a steady-state uptake rate for O3. Note that even with the same exposure time, different samples can still have contrasting uptake stages (i.e., initial uptake versus steady-state uptake). With an exposure (uptake/reaction) timescale of 10 min without significant surface saturation, here for simplicity the determined uptake coefficients are all referred to as γ0.
3.1.2 Mixing in the chamber
Here, we used one mixing fan to achieve well-mixed flow conditions inside the chamber. To ensure that the incoming gas reactant was well mixed by the mixing fan prior to depositing on the sample (see Fig. 2), we tested its concentration profile by placing the outlet at different positions inside the chamber.
Measurements of O3 uptake on saturated KI solutions were performed for a series of chamber outlet positions and the observed Cout are presented in Fig. 4. All the mixing ratios shown in Fig. 4 were obtained when the chamber reached a steady state, i.e., the mixing ratio at any fixed outlet position remained constant over time (see Fig. 3). Please note that steady-state conditions do not necessarily mean homogeneous distribution of mixing ratios inside the whole chamber (see Fig. 4). As the ab/adsorbing sink is situated on the chamber bottom, a (small) vertical concentration gradient from top to bottom of the chamber might be established, of which the degree depends on the specific turbulent conditions (selection of the applied fan, flow rate, and volume) and deposition velocities of the gas reactant.
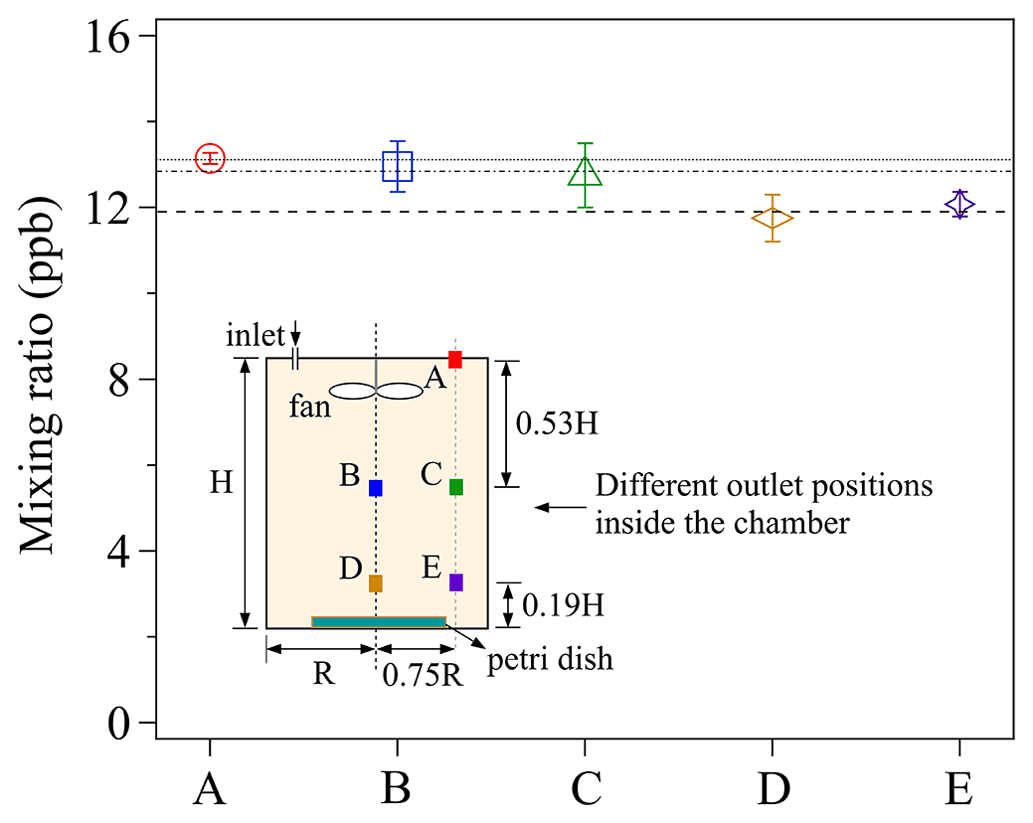
Figure 4The effects of different chamber outlet positions on observed Cout. The labels (A–E) of the x axis represent the different outlet positions shown in the chamber sketch, and the lines are the averaged mixing ratios at the three different vertical outlet heights (A; B/C; D/E). The error bars represent the standard deviation of three replicate experiments. For details, see the text.
Five different outlet positions, represented by the colored squares (i.e., A, B, C, D, and E) were chosen. For each experiment, 5 mL of newly prepared saturated KI solution, which formed a thin liquid film in a clean petri dish (ID: 90 mm) was exposed to a constant O3 mixing ratio of ∼46 ppb. As shown in Fig. 4, discernible differences of the measured Cout can be found among three outlet heights: lower height (D and E), medial height (B and C), and upper height (A). Cout decreases with lowering the outlet position height, implying the existence of a small vertical concentration gradient within the chamber: the measured maximum concentration difference between position D and A is 14 %. Cout at the same outlet heights, i.e., B and C, as well as D and E, show smaller horizontal concentration differences. This demonstrates the measured mixing ratio at outlet position C and E can respectively represent the mixing ratios on the horizontal cross-section where each outlet is located.
To check the concentration gradient conditions inside the same chamber with a larger sample covering almost the entire bottom plate, we used a larger petri dish (ID: 116 mm) holding 20 mL of newly prepared saturated KI solution for O3 (background mixing ratio: ∼105 ppb) uptake experiments, and respective concentration gradients are shown in Fig. S2. Similar concentration gradient conditions can also be found in Fig. S2. A t test between the measured mixing ratios at different outlet positions also confirms the existence of a vertical concentration gradient inside our chamber, especially when the large sink is situated on the chamber bottom (Table S1). The horizontal concentration gradient however can be much smaller due to the mixing effect of the fan. Therefore, in this study, the outlet position C was chosen for the uptake experiments to better represent the average concentration inside the chamber.
3.1.3 Effects of prepared KI coating surface state on Vt
As discussed above, the KI coating during the chamber characterization tests should have a similar surface phase state as the samples of interest. We therefore checked the effects of the surface phase-state/morphology of different KI coatings on the derived transport-limited deposition velocity Vt.
KI chemicals (≥99.0 %, Sigma-Aldrich, USA) were used as commercially purchased. Four types of KI coatings were applied for O3 uptake experiments and the subsequent Vt calculation, respectively: (A) KI film, which was prepared through dissolving ∼3.8 g of KI into deionized water in a petri dish (ID: 50 mm) followed by drying with pure N2 to form a thin solid film on the petri dish bottom; (B) KI grain, which was prepared by evenly spreading ∼3.8 g of KI grain (exactly the same as the original state of the obtained chemical, with particles' diameter around several tens of micrometers) in a petri dish and pre-humidified in a 50 % RH N2 environment for 30 min; (C) the same KI grain pre-humidified in a 73 % RH N2 environment for 30 min. The latter became deliquescent, as at room temperature the deliquescence point of KI is 67 % according to Kim et al. (2007) and Rouvière et al. (2010); and (D) saturated KI solution, which was prepared by evenly spreading ∼3.8 g of KI into a petri dish followed by adding several milliliters of deionized water to form a thin saturated-KI-liquid film. For these uptake experiments, the purging flow rate was 1.31 L min−1 and the other parameters were the same as those described in Sect. 3.1.1.
Figure 5 displays the four types of surface phase-state/morphology of the prepared KI coatings. Apparently, different preparation procedures generated distinct surface states/morphologies, especially among types I, II/III, and IV. Figure 6 shows the calculated Vt corresponding to these coating types. Vt derived for all these different KI surfaces are not significantly different from each other (with a t test p values as 0.62, 0.81, 0.52, and 0.84, respectively, for the measured Vt of types I, II, III, and IV), indicating that the KI surface characteristics have only a small impact on the calculated Vt and γ, respectively. The averaged Vt in Fig. 6 corresponds to a Rt of ∼1 s cm−1. And O3 uptake on KI coatings has a γ on the order of 10−2 (Rouvière et al., 2010) corresponding to a Rs of ∼0.01 s cm−1, which is 2 orders of magnitude smaller than Rt. This means that O3 uptake on KI coatings is very efficient (see Sect. 2.1.1) and the uptake is dominantly limited by transport processes (see Fig. 8 for more detailed illustration). Based on the results in Fig. 6, we can have different surface states of KI coatings to imitate those of the investigated samples at the most extent, and these operations can extend applications of the chamber system to a wide range of reactive bulk surfaces associated with uptake/reaction kinetics.
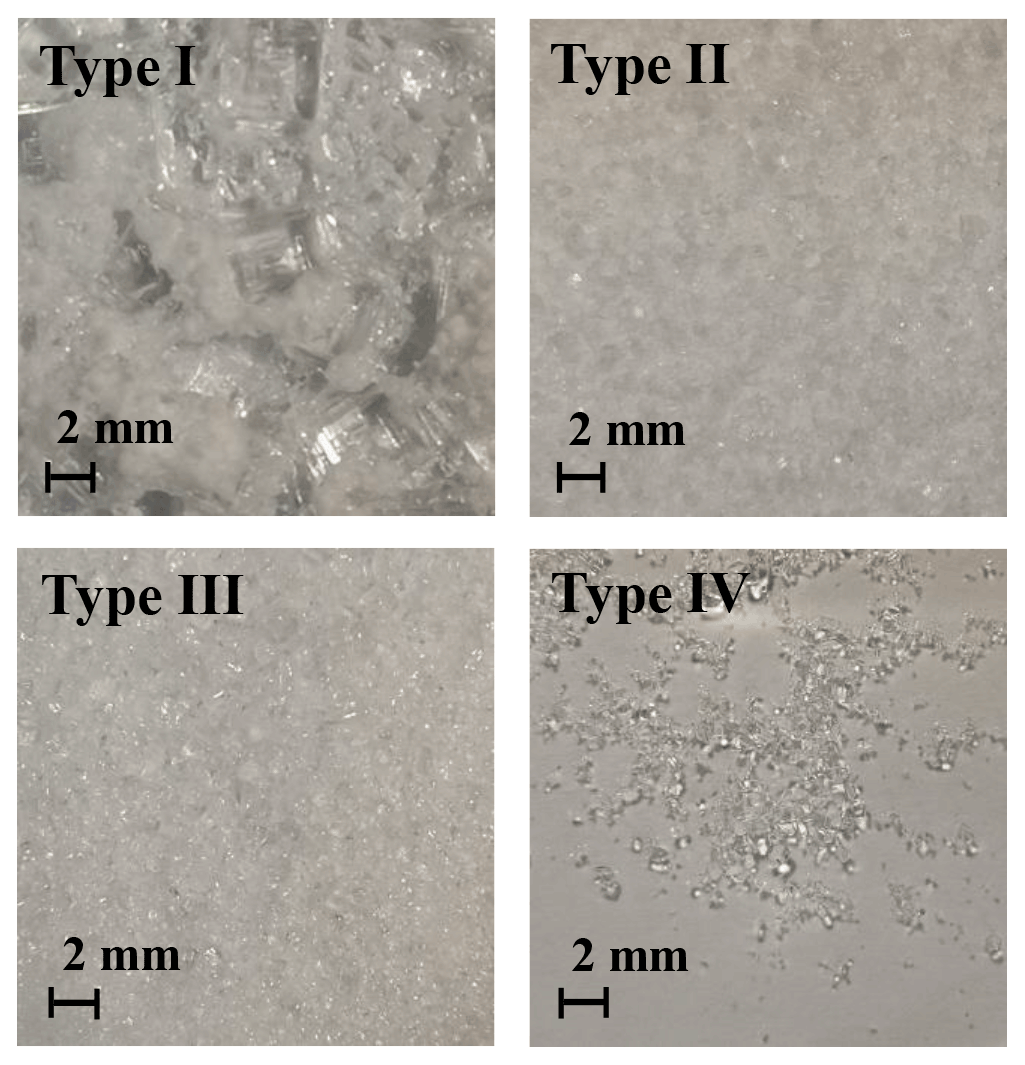
Figure 5Characteristic morphologies of coated KI (top view) observed by a mobile phone camera. Type I: KI film; type II: KI grain pre-humidified in a 50 % RH N2 environment for 30 min; type III: KI grain pre-humidified in a 73 % RH N2 environment for 30 min; type IV: saturated KI solution with deposited KI grains which cannot be further dissolved. Note that type IV has a smooth liquid surface.
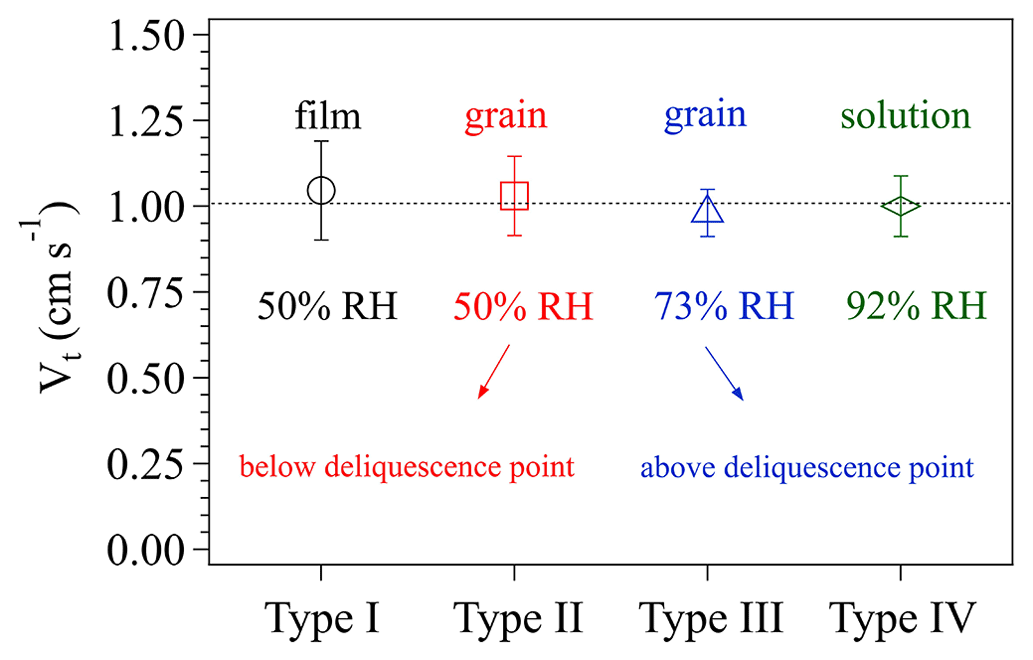
Figure 6The effects of different surface phase states of KI coatings on the transport-limited deposition velocity Vt. The four types of KI coatings are indicated on the x axis, and details of the coating preparation can be referred to in the text. The RH values represent the relative humidity conditions of the air in the chamber. The error bars represent the standard deviation of three to four replicate experiments.
3.2 Intercomparisons of uptake coefficients derived from chamber and flow tube techniques
To evaluate the reliability of the chamber system, γ of O3 and SO2 were also derived for three oxide samples by means of flow tube experiments. The flow tube sample preparation procedures and experimental configurations (e.g., flow rate, temperature, pressure, and RH) can be found in Sect. 2.
The derived mass-independent uptake coefficients, γBET, which were obtained based on the BET surface area of the investigated oxide samples (see Table 1), are presented in Fig. 7. Generally, the γBET determined by both techniques are in good agreement. Note that the chamber technique required a time interval for chamber equilibrium (5 min as shown in Sect. 3.1.1), during which the fresh sample had already been exposed to the gas reactant and sample surface saturation might occur to some extent. This may explain the general tendency of slightly lower γBET derived from the chamber measurements (red columns) than from the flow tube technique (blue columns). Under comparable experimental conditions (i.e., ambient pressure, temperature, and RH) as adopted in the current study, several previous kinetic studies reported γBET using various measurement techniques: aerosol chamber (Park et al., 2017; Chen et al., 2011; Mogili et al., 2006), coated-wall flow tube (Nicolas et al., 2009), and reaction chamber/cell coupled with diffuse reflectance infrared Fourier transform spectroscopy (Shang et al., 2010; Fu et al., 2007; Ullerstam et al., 2002). These reported values are also shown in Fig. 7 by different symbols. Most of the reported γBET are comparable with our chamber results, which demonstrates the reliability of our chamber technique in determining γ. However, there are still a few exceptions as represented by the brown diamond (Mogili et al., 2006) and the green hexagon (Fu et al., 2007). The much smaller γBET observed in the work of Mogili et al. (2006) may be due to the much higher O3 concentration used in their uptake experiments (i.e., 3 ppm versus ∼45 ppb in our study). A negative linear dependence of γ on O3 concentration has been reported by Ullerstam et al. (2002), where the uptake kinetics of O3 and SO2 on one type of mineral dust sample were investigated. Regarding the SO2 uptake on Fe2O3, the huge difference of γBET (4 orders of magnitude) between our study and Fu et al. (2007) may be attributed to the differences in surface and structure properties of the samples caused by the differing samples deployed and/or the preparation procedures (Ullerstam et al., 2003): the sample used by Fu et al. (2007) has a BET surface area of 10.2 m2 g−1 and a particle diameter of 39.7 nm compared to our sample with a BET surface area of 4 m2 g−1 and a diameter of <5 µm. In the work of Fu et al. (2007), ∼20 mg of oxide sample was prepared by pressing it into a pallet with a diameter of 13 mm, while in our study ∼500 mg of the sample were evenly coated onto the bottom of a glass petri dish (ID: 116 mm) resulting in a much larger geometric surface area for direct contact between SO2 and Fe2O3 compared to Fu et al. (2007). The samples with smaller particle sizes are expected to be quite porous and some parts may be less accessible to SO2 due to pore resistance, and thus the γBET reported by Fu et al. (2007) can be considered as a lower limit.
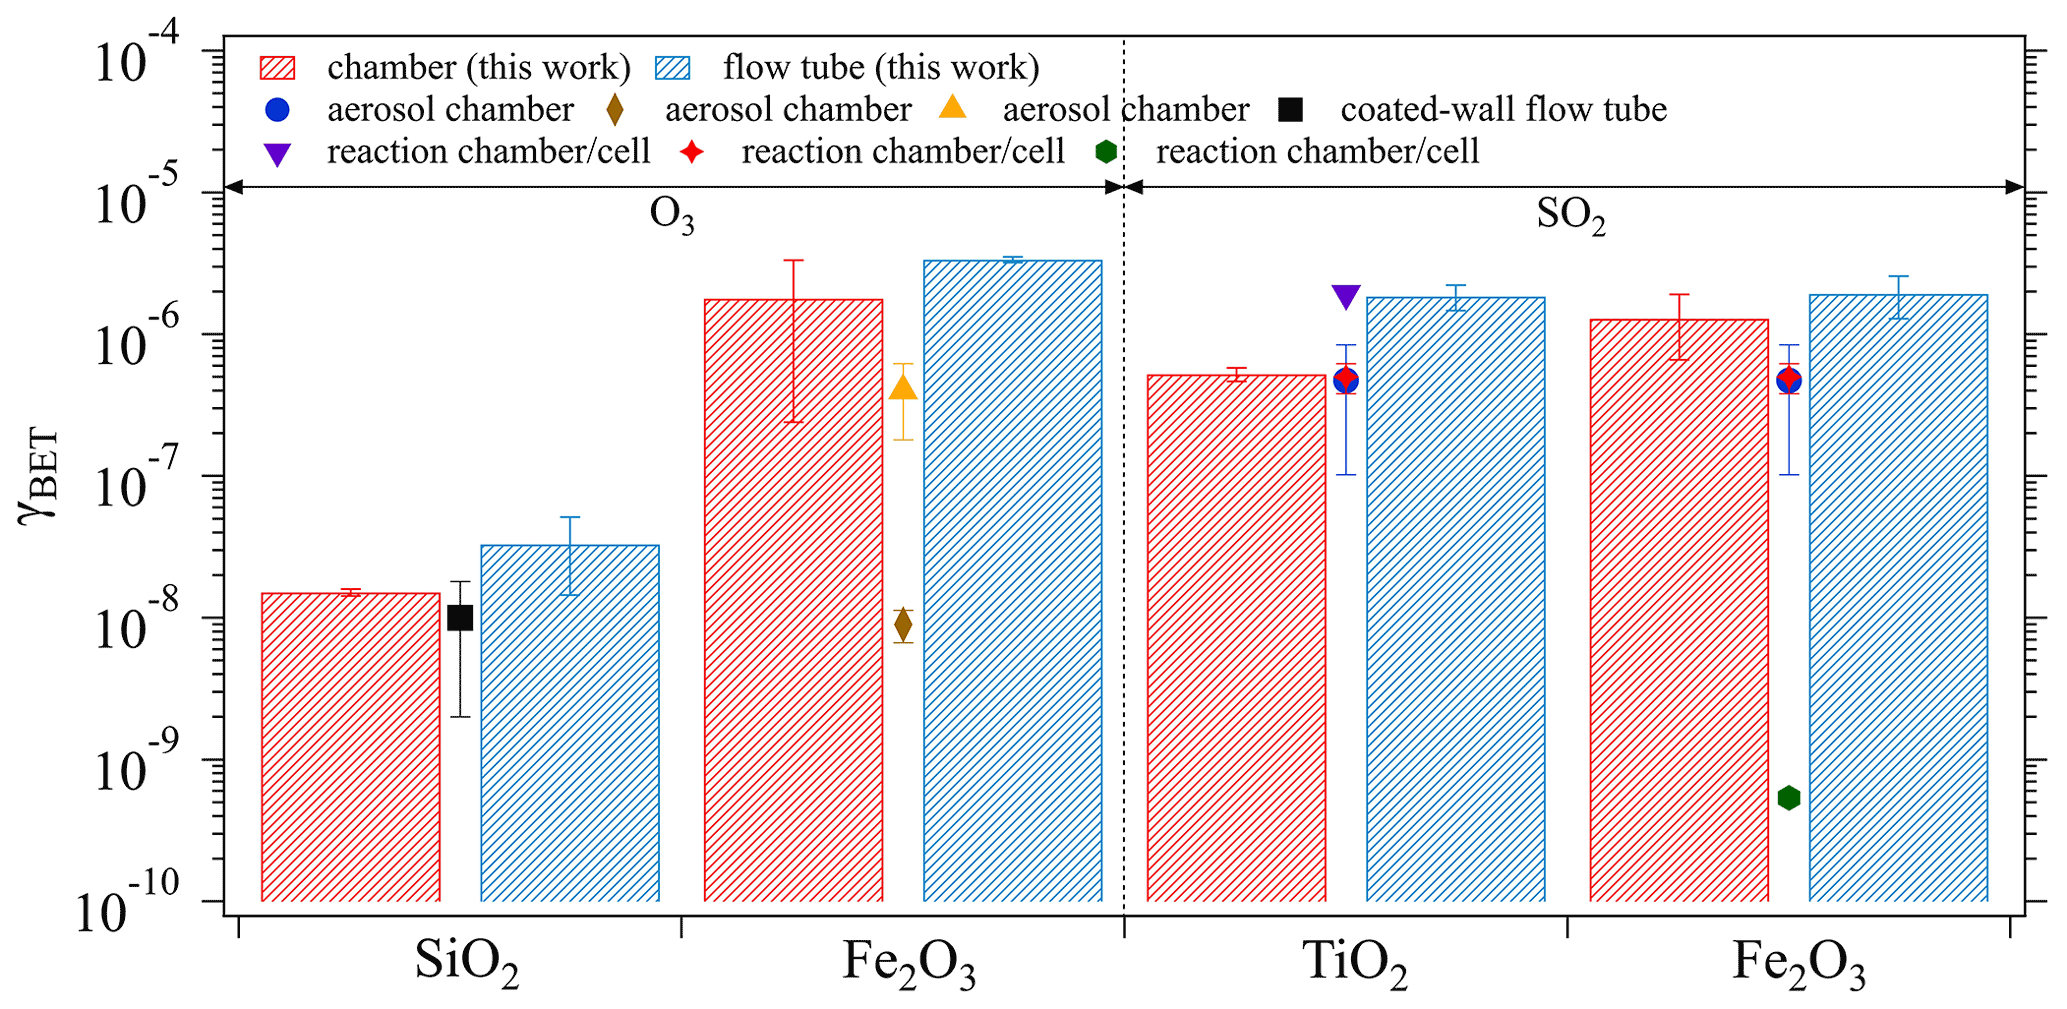
Figure 7Comparisons between the γBET derived from the chamber and the flow tube techniques, respectively, and from previous kinetic measurements. Previous studies summarized here are black square (Nicolas et al., 2009), orange triangle (Chen et al., 2011), brown diamond (Mogili et al., 2006), purple triangle (Shang et al., 2010), blue circle (Park et al., 2017), red star (Ullerstam et al., 2002), and green hexagon (Fu et al., 2007). The error bars of the columns represent the standard deviation of three replicate experiments and those of the symbols reflect the standard deviation of the measured γBET in previous studies.
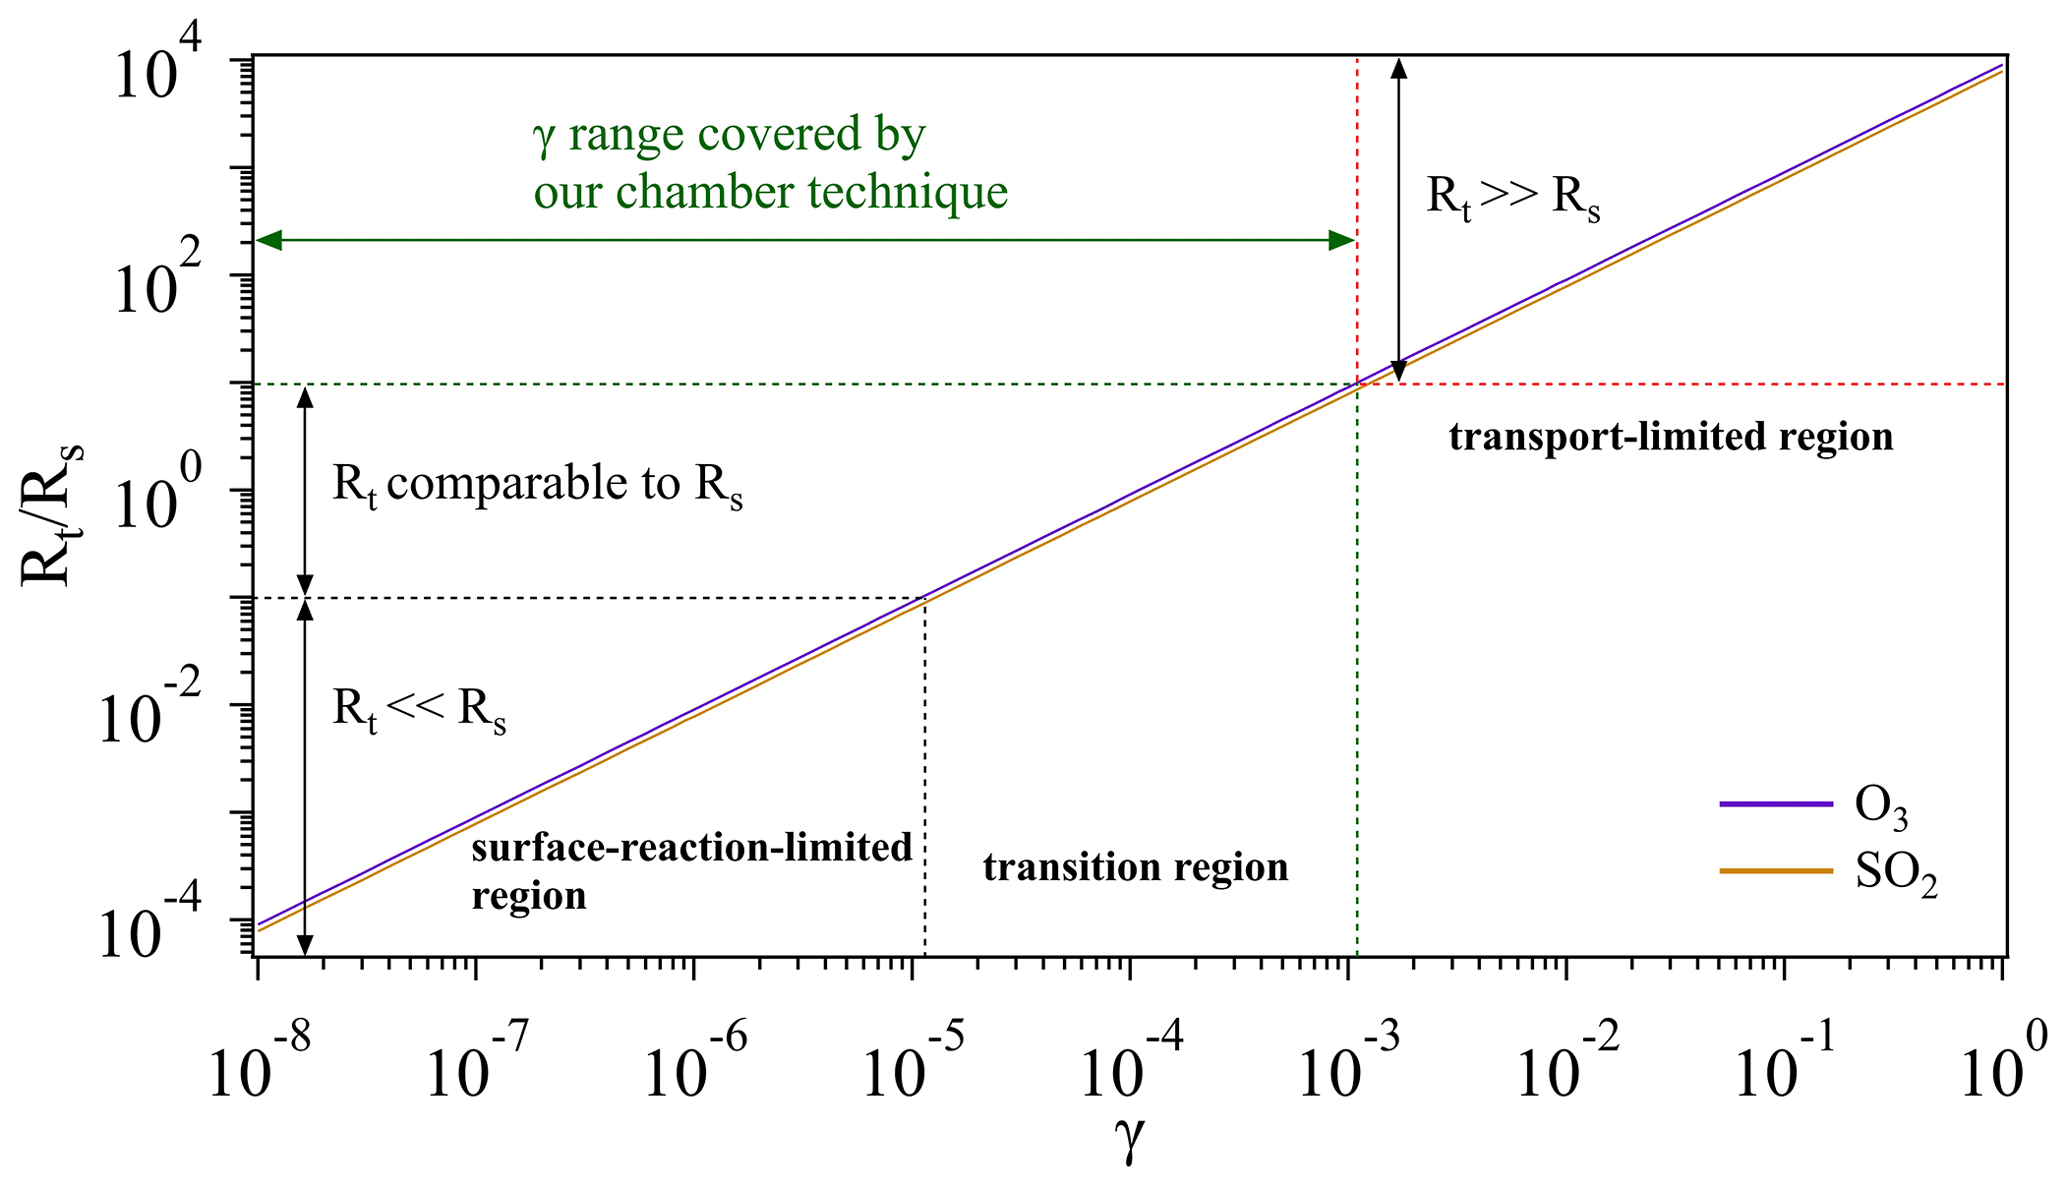
Figure 8Schematic of different regions for O3 and SO2 uptake. Note that we artificially define the case when (i.e., 1 order of magnitude lower) as the surface-reaction-limited region (Rt≪Rs) and the case when (i.e., 1 order of magnitude higher) as transport-limited region (Rt≫Rs). And the case in between is defined as the transition region, where Rt is comparable to Rs. The transport resistance Rt is calculated based on the measured average Vt (Sect. 3.1.3). Calculations for the surface resistance Rs are referred to conditions of room temperature (296 K) and 1 atm.
This study presents a chamber technique to determine uptake coefficients of reactive trace gases (O3 and SO2) onto bulk surface systems. Critical operational parameters of the chamber system, including equilibrium time, chamber outlet position, and the choice of various KI-coating surface state/morphology, were first examined. With these pre-defined parameters, the reliability of this technique to derive γBET during gas uptake on solid samples was proven through direct comparisons with a flow tube system. The chamber results agree well with those from the flow tube method and the literature data.
Figure 8 gives a schematic overview on how an overall uptake is influenced by mass transport (Rt) and reactions on sample surfaces (Rs). For a multiphase reaction (i.e., uptake process), normally a gas reactant first needs to be transported to the vicinity of a sample (solid or liquid phase), and then collides with the sample surface to trigger certain reactions. If a surface reaction has an extremely low rate (indicative of a very small γ, Rt≪Rs), the overall uptake process is determined by the surface reaction (surface-reaction-limited region). On the other hand, if transport takes a very long time (Rt≫Rs), the overall uptake will be limited by the transportation (transport-limited region). If these two processes have similar rates, both will play a critical role in determining the overall uptake (transition region). Given that the gas uptake includes both mass transport and surface reaction, its limiting step can be changing as a function of γ. As shown in Fig. 8, when gas uptake comes into the surface-reaction-limited and transition regions, the chamber system is sensitive to changes of γ and thus can be employed for the determination of γ within a range of 10−8 to 10−3.
The underlying research data can be accessed upon contact with Guo Li (guo.li@mpic.de).
The supplement related to this article is available online at: https://doi.org/10.5194/amt-15-6433-2022-supplement.
YC and HS conceived the study. GL performed experiments and data analysis. YC, HS, UP, UK, GZ, ML, LH, and FB discussed the results. GL, YC, and HS wrote the paper with inputs from all co-authors.
At least one of the (co-)authors is a member of the editorial board of Atmospheric Measurement Techniques. The peer-review process was guided by an independent editor, and the authors also have no other competing interests to declare.
Publisher’s note: Copernicus Publications remains neutral with regard to jurisdictional claims in published maps and institutional affiliations.
This study was supported by the Max Planck Society (MPG). Guo Li acknowledges the financial support from the China Scholarship Council (CSC).
This research has been supported by the National Natural Science Foundation of China (grant no. 41330635).
The article processing charges for this open-access publication were covered by the Max Planck Society.
This paper was edited by Anna Novelli and reviewed by two anonymous referees.
Almand-Hunter, B. B., Walker, J. T., Masson, N. P., Hafford, L., and Hannigan, M. P.: Development and validation of inexpensive, automated, dynamic flux chambers, Atmos. Meas. Tech., 8, 267–280, https://doi.org/10.5194/amt-8-267-2015, 2015.
Ammann, M., Cox, R. A., Crowley, J. N., Jenkin, M. E., Mellouki, A., Rossi, M. J., Troe, J., and Wallington, T. J.: Evaluated kinetic and photochemical data for atmospheric chemistry: Volume VI – heterogeneous reactions with liquid substrates, Atmos. Chem. Phys., 13, 8045–8228, https://doi.org/10.5194/acp-13-8045-2013, 2013.
Barcellos da Rosa, M., Behnke, W., and Zetzsch, C.: Study of the heterogeneous reaction of O3 with CH3SCH3 using the wetted-wall flowtube technique, Atmos. Chem. Phys., 3, 1665–1673, https://doi.org/10.5194/acp-3-1665-2003, 2003.
Bartels-Rausch, T., Huthwelker, T., Gaggeler, H. W., and Ammann, M.: Atmospheric pressure coated-wall flow-tube study of acetone adsorption on ice, J. Phys. Chem. A, 109, 4531–4539, 2005.
Bedjanian, Y., Romanias, M. N., and El Zein, A.: Interaction of OH Radicals with Arizona Test Dust: Uptake and Products, J. Phys. Chem. A, 117, 393–400, 2013.
Breuninger, C., Oswald, R., Kesselmeier, J., and Meixner, F. X.: The dynamic chamber method: trace gas exchange fluxes (NO, NO2, O3) between plants and the atmosphere in the laboratory and in the field, Atmos. Meas. Tech., 5, 955–989, https://doi.org/10.5194/amt-5-955-2012, 2012.
Brunauer, S., Emmett, P. H., and Teller, E.: Adsorption of Gases in Multimolecular Layers, J. Am. Chem. Soc., 60, 309–319, https://doi.org/10.1021/ja01269a023, 1938.
Canoruiz, J. A., Kong, D., Balas, R. B., and Nazaroff, W. W.: Removal of Reactive Gases at Indoor Surfaces – Combining Mass-Transport and Surface Kinetics, Atmos. Environ. A-Gen., 27, 2039–2050, 1993.
Chen, H., Stanier, C. O., Young, M. A., and Grassian, V. H.: A Kinetic Study of Ozone Decomposition on Illuminated Oxide Surfaces, J. Phys. Chem. A, 115, 11979–11987, https://doi.org/10.1021/jp208164v, 2011.
Chu, L. T., Diao, G. W., and Chu, L.: Kinetics of HOBr uptake on NaBr and NaCl surfaces at varying relative humidity, J. Phys. Chem. B, 106, 5679–5688, 2002.
Coleman, B. K., Destaillats, H., Hodgson, A. T., and Nazaroff, W. W.: Ozone consumption and volatile byproduct formation from surface reactions with aircraft cabin materials and clothing fabrics, Atmos. Environ., 42, 642–654, 2008.
Cowan, N. J., Famulari, D., Levy, P. E., Anderson, M., Reay, D. S., and Skiba, U. M.: Investigating uptake of N2O in agricultural soils using a high-precision dynamic chamber method, Atmos. Meas. Tech., 7, 4455–4462, https://doi.org/10.5194/amt-7-4455-2014, 2014.
Crowley, J. N., Ammann, M., Cox, R. A., Hynes, R. G., Jenkin, M. E., Mellouki, A., Rossi, M. J., Troe, J., and Wallington, T. J.: Evaluated kinetic and photochemical data for atmospheric chemistry: Volume V – heterogeneous reactions on solid substrates, Atmos. Chem. Phys., 10, 9059–9223, https://doi.org/10.5194/acp-10-9059-2010, 2010.
Davidovits, P., Kolb, C. E., Williams, L. R., Jayne, J. T., and Worsnop, D. R.: Mass Accommodation and Chemical Reactions at Gas–Liquid Interfaces, Chem. Rev., 106, 1323–1354, https://doi.org/10.1021/cr040366k, 2006.
Davies, J. A. and Cox, R. A.: Kinetics of the heterogeneous reaction of HNO3 with NaCl: Effect of water vapor, J. Phys. Chem. A, 102, 7631–7642, 1998.
Donaldson, M. A., Berke, A. E., and Raff, J. D.: Uptake of Gas Phase Nitrous Acid onto Boundary Layer Soil Surfaces, Environ. Sci. Technol., 48, 375–383, 2014a.
Donaldson, M. A., Bish, D. L., and Raff, J. D.: Soil surface acidity plays a determining role in the atmospheric-terrestrial exchange of nitrous acid, P. Natl. Acad. Sci. USA, 111, 18472–18477, 2014b.
El Zein, A. and Bedjanian, Y.: Reactive Uptake of HONO to TiO2 Surface: “Dark” Reaction, J. Phys. Chem. A, 116, 3665–3672, 2012.
Fernandez, M. A., Hynes, R. G., and Cox, R. A.: Kinetics of ClONO2 Reactive Uptake on Ice Surfaces at Temperatures of the Upper Troposphere, J. Phys. Chem. A, 109, 9986–9996, https://doi.org/10.1021/jp053477b, 2005.
Fu, H., Wang, X., Wu, H., Yin, Y., and Chen, J.: Heterogeneous Uptake and Oxidation of SO2 on Iron Oxides, J. Phys. Chem. C, 111, 6077–6085, https://doi.org/10.1021/jp070087b, 2007.
Galbally, I. E. and Roy, C. R.: Destruction of ozone at the earth's surface, Q. J. Roy. Meteor. Soc., 106, 599–620, https://doi.org/10.1002/qj.49710644915, 1980.
Gard, E. E., Kleeman, M. J., Gross, D. S., Hughes, L. S., Allen, J. O., Morrical, B. D., Fergenson, D. P., Dienes, T., E. Gälli, M., Johnson, R. J., Cass, G. R., and Prather, K. A.: Direct Observation of Heterogeneous Chemistry in the Atmosphere, Science, 279, 1184–1187, https://doi.org/10.1126/science.279.5354.1184, 1998.
Goldan, P. D., Fall, R., Kuster, W. C., and Fehsenfeld, F. C.: Uptake of COS by growing vegetation: A major tropospheric sink, J. Geophys. Res.-Atmos., 93, 14186–14192, https://doi.org/10.1029/JD093iD11p14186, 1988.
Gut, A., Scheibe, M., Rottenberger, S., Rummel, U., Welling, M., Ammann, C., Kirkman, G. A., Kuhn, U., Meixner, F. X., Kesselmeier, J., Lehmann, B. E., Schmidt, W., Müller, E., and Piedade, M. T. F.: Exchange fluxes of NO2 and O3 at soil and leaf surfaces in an Amazonian rain forest, J. Geophys. Res.-Atmos., 107, LBA 27-1–LBA 27-15, https://doi.org/10.1029/2001JD000654, 2002.
Hanisch, F. and Crowley, J. N.: Ozone decomposition on Saharan dust: an experimental investigation, Atmos. Chem. Phys., 3, 119–130, https://doi.org/10.5194/acp-3-119-2003, 2003.
Hanson, D. R. and Ravishankara, A. R.: Heterogeneous chemistry of bromine species in sulfuric acid under stratospheric conditions, Geophys. Res. Lett., 22, 385–388, https://doi.org/10.1029/94GL03379, 1995.
Hanson, D. R., Burkholder, J. B., Howard, C. J., and Ravishankara, A. R.: Measurement of hydroxyl and hydroperoxy radical uptake coefficients on water and sulfuric acid surfaces, J. Phys. Chem., 96, 4979–4985, https://doi.org/10.1021/j100191a046, 1992.
Henstock, W. H. and Hanratty, T. J.: Gas absorption by a liquid layer flowing on the wall of a pipe, AIChE Journal, 25, 122–131, https://doi.org/10.1002/aic.690250114, 1979.
Hynes, R. G., Mössinger, J. C., and Cox, R. A.: The interaction of HCl with water-ice at tropospheric temperatures, Geophys. Res. Lett., 28, 2827–2830, https://doi.org/10.1029/2000GL012706, 2001.
Hynes, R. G., Fernandez, M. A., and Cox, R. A.: Uptake of HNO3 on water-ice and coadsorption of HNO3 and HCl in the temperature range 210–235 K, J. Geophys. Res.-Atmos., 107, AAC 19-1–AAC 19-11, https://doi.org/10.1029/2001JD001557, 2002.
Jang, M., Czoschke, N. M., Lee, S., and Kamens, R. M.: Heterogeneous Atmospheric Aerosol Production by Acid-Catalyzed Particle-Phase Reactions, Science, 298, 814–817, https://doi.org/10.1126/science.1075798, 2002.
Khalizov, A. F., Cruz-Quinones, M., and Zhang, R. Y.: Heterogeneous Reaction of NO2 on Fresh and Coated Soot Surfaces, J. Phys. Chem. A, 114, 7516–7524, 2010.
Kim, H. S., Wivagg, C. N., Dotson, S. J., Broekhuizen, K. E., and Frohardt, E. F.: Phase Transitions and Surface Morphology of Surfactant-Coated Aerosol Particles, J. Phys. Chem. A, 111, 11013–11020, https://doi.org/10.1021/jp074848m, 2007.
Knopf, D. A., Pöschl, U., and Shiraiwa, M.: Radial Diffusion and Penetration of Gas Molecules and Aerosol Particles through Laminar Flow Reactors, Denuders, and Sampling Tubes, Anal. Chem., 87, 3746–3754, https://doi.org/10.1021/ac5042395, 2015.
Kolb, C. E., Cox, R. A., Abbatt, J. P. D., Ammann, M., Davis, E. J., Donaldson, D. J., Garrett, B. C., George, C., Griffiths, P. T., Hanson, D. R., Kulmala, M., McFiggans, G., Pöschl, U., Riipinen, I., Rossi, M. J., Rudich, Y., Wagner, P. E., Winkler, P. M., Worsnop, D. R., and O'Dowd, C. D.: An overview of current issues in the uptake of atmospheric trace gases by aerosols and clouds, Atmos. Chem. Phys., 10, 10561–10605, https://doi.org/10.5194/acp-10-10561-2010, 2010.
Li, G., Su, H., Li, X., Kuhn, U., Meusel, H., Hoffmann, T., Ammann, M., Pöschl, U., Shao, M., and Cheng, Y.: Uptake of gaseous formaldehyde by soil surfaces: a combination of adsorption/desorption equilibrium and chemical reactions, Atmos. Chem. Phys., 16, 10299–10311, https://doi.org/10.5194/acp-16-10299-2016, 2016.
Li, G., Su, H., Kuhn, U., Meusel, H., Ammann, M., Shao, M., Pöschl, U., and Cheng, Y.: Technical note: Influence of surface roughness and local turbulence on coated-wall flow tube experiments for gas uptake and kinetic studies, Atmos. Chem. Phys., 18, 2669–2686, https://doi.org/10.5194/acp-18-2669-2018, 2018.
Li, G., Cheng, Y., Kuhn, U., Xu, R., Yang, Y., Meusel, H., Wang, Z., Ma, N., Wu, Y., Li, M., Williams, J., Hoffmann, T., Ammann, M., Pöschl, U., Shao, M., and Su, H.: Physicochemical uptake and release of volatile organic compounds by soil in coated-wall flow tube experiments with ambient air, Atmos. Chem. Phys., 19, 2209–2232, https://doi.org/10.5194/acp-19-2209-2019, 2019.
Matsuoka, K., Sakamoto, Y., Hama, T., Kajii, Y., and Enami, S.: Reactive Uptake of Gaseous Sesquiterpenes on Aqueous Surfaces, J. Phys. Chem. A, 121, 810–818, https://doi.org/10.1021/acs.jpca.6b11821, 2017.
McCabe, J. and Abbatt, J. P. D.: Heterogeneous Loss of Gas-Phase Ozone on n-Hexane Soot Surfaces: Similar Kinetics to Loss on Other Chemically Unsaturated Solid Surfaces, J. Phys. Chem. C, 113, 2120–2127, 2009.
McNeill, V. F., Loerting, T., Geiger, F. M., Trout, B. L., and Molina, M. J.: Hydrogen chloride-induced surface disordering on ice, P. Natl. Acad. Sci. USA, 103, 9422–9427, 2006.
McVay, R. C., Zhang, X., Aumont, B., Valorso, R., Camredon, M., La, Y. S., Wennberg, P. O., and Seinfeld, J. H.: SOA formation from the photooxidation of α-pinene: systematic exploration of the simulation of chamber data, Atmos. Chem. Phys., 16, 2785–2802, https://doi.org/10.5194/acp-16-2785-2016, 2016.
Meusel, H., Kuhn, U., Reiffs, A., Mallik, C., Harder, H., Martinez, M., Schuladen, J., Bohn, B., Parchatka, U., Crowley, J. N., Fischer, H., Tomsche, L., Novelli, A., Hoffmann, T., Janssen, R. H. H., Hartogensis, O., Pikridas, M., Vrekoussis, M., Bourtsoukidis, E., Weber, B., Lelieveld, J., Williams, J., Pöschl, U., Cheng, Y., and Su, H.: Daytime formation of nitrous acid at a coastal remote site in Cyprus indicating a common ground source of atmospheric HONO and NO, Atmos. Chem. Phys., 16, 14475–14493, https://doi.org/10.5194/acp-16-14475-2016, 2016.
Meusel, H., Tamm, A., Kuhn, U., Wu, D., Leifke, A. L., Fiedler, S., Ruckteschler, N., Yordanova, P., Lang-Yona, N., Pöhlker, M., Lelieveld, J., Hoffmann, T., Pöschl, U., Su, H., Weber, B., and Cheng, Y.: Emission of nitrous acid from soil and biological soil crusts represents an important source of HONO in the remote atmosphere in Cyprus, Atmos. Chem. Phys., 18, 799–813, https://doi.org/10.5194/acp-18-799-2018, 2018.
Michel, A. E., Usher, C. R., and Grassian, V. H.: Reactive uptake of ozone on mineral oxides and mineral dusts, Atmos. Environ., 37, 3201–3211, https://doi.org/10.1016/S1352-2310(03)00319-4, 2003.
Mogili, P. K., Kleiber, P. D., Young, M. A., and Grassian, V. H.: Heterogeneous Uptake of Ozone on Reactive Components of Mineral Dust Aerosol: An Environmental Aerosol Reaction Chamber Study, J. Phys. Chem. A, 110, 13799–13807, https://doi.org/10.1021/jp063620g, 2006.
Monge, M. E., D'Anna, B., Mazri, L., Giroir-Fendler, A., Ammann, M., Donaldson, D. J., and George, C.: Light changes the atmospheric reactivity of soot, P. Natl. Acad. Sci. USA, 107, 6605–6609, 2010.
Morrison, G. C. and Nazaroff, W. W.: The rate of ozone uptake on carpets: Experimental studies, Environ. Sci. Technol., 34, 4963–4968, 2000.
Murphy, D. M. and Fahey, D. W.: Mathematical Treatment of the Wall Loss of a Trace Species in Denuder and Catalytic-Converter Tubes, Anal. Chem., 59, 2753–2759, 1987.
Nakao, S., Liu, Y., Tang, P., Chen, C.-L., Zhang, J., and Cocker III, D. R.: Chamber studies of SOA formation from aromatic hydrocarbons: observation of limited glyoxal uptake, Atmos. Chem. Phys., 12, 3927–3937, https://doi.org/10.5194/acp-12-3927-2012, 2012.
Nicolas, M., Ndour, M., Ka, O., D'Anna, B., and George, C.: Photochemistry of Atmospheric Dust: Ozone Decomposition on Illuminated Titanium Dioxide, Environ. Sci. Technol., 43, 7437–7442, https://doi.org/10.1021/es901569d, 2009.
Oswald, R., Behrendt, T., Ermel, M., Wu, D., Su, H., Cheng, Y., Breuninger, C., Moravek, A., Mougin, E., Delon, C., Loubet, B., Pommerening-Röser, A., Sörgel, M., Pöschl, U., Hoffmann, T., Andreae, M. O., Meixner, F. X., and Trebs, I.: HONO Emissions from Soil Bacteria as a Major Source of Atmospheric Reactive Nitrogen, Science, 341, 1233–1235, https://doi.org/10.1126/science.1242266, 2013.
Pape, L., Ammann, C., Nyfeler-Brunner, A., Spirig, C., Hens, K., and Meixner, F. X.: An automated dynamic chamber system for surface exchange measurement of non-reactive and reactive trace gases of grassland ecosystems, Biogeosciences, 6, 405–429, https://doi.org/10.5194/bg-6-405-2009, 2009.
Park, J., Jang, M., and Yu, Z.: Heterogeneous Photo-oxidation of SO2 in the Presence of Two Different Mineral Dust Particles: Gobi and Arizona Dust, Environ. Sci. Technol., 51, 9605–9613, https://doi.org/10.1021/acs.est.7b00588, 2017.
Parmar, S. S. and Grosjean, D.: Laboratory Tests of Ki and Alkaline Annular Denuders, Atmos. Environ. A-Gen., 24, 2695–2698, 1990.
Petitjean, M., Mirabel, P., and Le Calve, S.: Uptake Measurements of Acetaldehyde on Solid Ice Surfaces and on Solid/Liquid Supercooled Mixtures Doped with HNO3 in the Temperature Range 203–253 K, J. Phys. Chem. A, 113, 5091–5098, 2009.
Plake, D., Stella, P., Moravek, A., Mayer, J. C., Ammann, C., Held, A., and Trebs, I.: Comparison of ozone deposition measured with the dynamic chamber and the eddy covariance method, Agr. Forest Meteorol., 206, 97–112, https://doi.org/10.1016/j.agrformet.2015.02.014, 2015.
Pöschl, U.: Atmospheric aerosols: Composition, transformation, climate and health effects, Angew. Chem. Int. Edit., 44, 7520–7540, 2005.
Pöschl, U. and Shiraiwa, M.: Multiphase Chemistry at the Atmosphere–Biosphere Interface Influencing Climate and Public Health in the Anthropocene, Chem. Rev., 115, 4440–4475, https://doi.org/10.1021/cr500487s, 2015.
Pumpanen, J., Ilvesniemi, H., Keronen, P., Nissinen, A., Pohja, T., Vesala, T., and Hari, P.: An open chamber system for measuring soil surface CO2 efflux: Analysis of error sources related to the chamber system, J. Geophys. Res.-Atmos., 106, 7985–7992, https://doi.org/10.1029/2000JD900715, 2001.
Qiu, C., Wang, L., Lal, V., Khalizov, A. F., and Zhang, R. Y.: Heterogeneous Reactions of Alkylamines with Ammonium Sulfate and Ammonium Bisulfate, Environ. Sci. Technol., 45, 4748–4755, 2011.
Ravishankara, A. R.: Heterogeneous and Multiphase Chemistry in the Troposphere, Science, 276, 1058–1065, https://doi.org/10.1126/science.276.5315.1058, 1997.
Rossi, M. J.: Heterogeneous Reactions on Salts, Chem. Rev., 103, 4823–4882, https://doi.org/10.1021/cr020507n, 2003.
Rouvière, A., Sosedova, Y., and Ammann, M.: Uptake of Ozone to Deliquesced KI and Mixed KI/NaCl Aerosol Particles, J. Phys. Chem. A, 114, 7085–7093, https://doi.org/10.1021/jp103257d, 2010.
Schobesberger, S., Junninen, H., Bianchi, F., Lönn, G., Ehn, M., Lehtipalo, K., Dommen, J., Ehrhart, S., Ortega, I. K., Franchin, A., Nieminen, T., Riccobono, F., Hutterli, M., Duplissy, J., Almeida, J., Amorim, A., Breitenlechner, M., Downard, A. J., Dunne, E. M., Flagan, R. C., Kajos, M., Keskinen, H., Kirkby, J., Kupc, A., Kürten, A., Kurtén, T., Laaksonen, A., Mathot, S., Onnela, A., Praplan, A. P., Rondo, L., Santos, F. D., Schallhart, S., Schnitzhofer, R., Sipilä, M., Tomé, A., Tsagkogeorgas, G., Vehkamäki, H., Wimmer, D., Baltensperger, U., Carslaw, K. S., Curtius, J., Hansel, A., Petäjä, T., Kulmala, M., Donahue, N. M., and Worsnop, D. R.: Molecular understanding of atmospheric particle formation from sulfuric acid and large oxidized organic molecules, P. Natl. Acad. Sci. USA, 110, 17223–17228, https://doi.org/10.1073/pnas.1306973110, 2013.
Seinfeld, J. H. and Pandis, S. N.: Chemical Kinetics, in: Atmospheric Chemistry and Physics: from Air Pollution to Climate Change, 3rd edn., John Wiley & Sons, Inc., Hoboken, New Jersey, ISBN: 978-1-118-94740-1, 2016a.
Seinfeld, J. H. and Pandis, S. N.: Dry Deposition, in: Atmospheric Chemistry and Physics: from Air Pollution to Climate Change, 3rd edn., John Wiley & Sons, Inc., Hoboken, New Jersey, ISBN: 978-1-118-94740-1, 2016b.
Shang, J., Li, J., and Zhu, T.: Heterogeneous reaction of SO2 on TiO2 particles, Science China Chemistry, 53, 2637–2643, https://doi.org/10.1007/s11426-010-4160-3, 2010.
Shilling, J. E., Chen, Q., King, S. M., Rosenoern, T., Kroll, J. H., Worsnop, D. R., McKinney, K. A., and Martin, S. T.: Particle mass yield in secondary organic aerosol formed by the dark ozonolysis of α-pinene, Atmos. Chem. Phys., 8, 2073–2088, https://doi.org/10.5194/acp-8-2073-2008, 2008.
Shiraiwa, M., Ammann, M., Koop, T., and Pöschl, U.: Gas uptake and chemical aging of semisolid organic aerosol particles, P. Natl. Acad. Sci. USA, 108, 11003–11008, 2011.
Stemmler, K., Ammann, M., Donders, C., Kleffmann, J., and George, C.: Photosensitized reduction of nitrogen dioxide on humic acid as a source of nitrous acid, Nature, 440, 195–198, https://doi.org/10.1038/nature04603, 2006.
Su, H., Cheng, Y., Oswald, R., Behrendt, T., Trebs, I., Meixner, F. X., Andreae, M. O., Cheng, P., Zhang, Y., and Pöschl, U.: Soil Nitrite as a Source of Atmospheric HONO and OH Radicals, Science, 333, 1616–1618, https://doi.org/10.1126/science.1207687, 2011.
Su, H., Cheng, Y., and Pöschl, U.: New Multiphase Chemical Processes Influencing Atmospheric Aerosols, Air Quality, and Climate in the Anthropocene, Accounts Chem. Res., 53, 2034–2043, https://doi.org/10.1021/acs.accounts.0c00246, 2020.
Sun, S., Moravek, A., von der Heyden, L., Held, A., Sörgel, M., and Kesselmeier, J.: Twin-cuvette measurement technique for investigation of dry deposition of O3 and PAN to plant leaves under controlled humidity conditions, Atmos. Meas. Tech., 9, 599–617, https://doi.org/10.5194/amt-9-599-2016, 2016.
Symington, A., Leow, L. M., Griffiths, P. T., and Cox, R. A.: Adsorption and Hydrolysis of Alcohols and Carbonyls on Ice at Temperatures of the Upper Troposphere, J. Phys. Chem. A, 116, 5990–6002, https://doi.org/10.1021/jp210935b, 2012.
Thornberry, T. and Abbatt, J. P. D.: Heterogeneous reaction of ozone with liquid unsaturated fatty acids: detailed kinetics and gas-phase product studies, Phys. Chem. Chem. Phys., 6, 84–93, https://doi.org/10.1039/B310149E, 2004.
Tiitta, P., Leskinen, A., Hao, L., Yli-Pirilä, P., Kortelainen, M., Grigonyte, J., Tissari, J., Lamberg, H., Hartikainen, A., Kuuspalo, K., Kortelainen, A.-M., Virtanen, A., Lehtinen, K. E. J., Komppula, M., Pieber, S., Prévôt, A. S. H., Onasch, T. B., Worsnop, D. R., Czech, H., Zimmermann, R., Jokiniemi, J., and Sippula, O.: Transformation of logwood combustion emissions in a smog chamber: formation of secondary organic aerosol and changes in the primary organic aerosol upon daytime and nighttime aging, Atmos. Chem. Phys., 16, 13251–13269, https://doi.org/10.5194/acp-16-13251-2016, 2016.
Ullerstam, M., Vogt, R., Langer, S., and Ljungstrom, E.: The kinetics and mechanism of SO2 oxidation by O3 on mineral dust, Phys. Chem. Chem. Phys., 4, 4694–4699, https://doi.org/10.1039/B203529B, 2002.
Ullerstam, M., Johnson, M. S., Vogt, R., and Ljungström, E.: DRIFTS and Knudsen cell study of the heterogeneous reactivity of SO2 and NO2 on mineral dust, Atmos. Chem. Phys., 3, 2043–2051, https://doi.org/10.5194/acp-3-2043-2003, 2003.
Underwood, G. M., Li, P., Al-Abadleh, H., and Grassian, V. H.: A Knudsen Cell Study of the Heterogeneous Reactivity of Nitric Acid on Oxide and Mineral Dust Particles, J. Phys. Chem. A, 105, 6609–6620, https://doi.org/10.1021/jp002223h, 2001.
Usher, C. R., Michel, A. E., and Grassian, V. H.: Reactions on Mineral Dust, Chem. Rev., 103, 4883–4940, https://doi.org/10.1021/cr020657y, 2003.
VandenBoer, T. C., Young, C. J., Talukdar, R. K., Markovic, M. Z., Brown, S. S., Roberts, J. M., and Murphy, J. G.: Nocturnal loss and daytime source of nitrous acid through reactive uptake and displacement, Nat. Geosci., 8, 55–60, 2015.
Virtanen, A., Joutsensaari, J., Koop, T., Kannosto, J., Yli-Pirila, P., Leskinen, J., Makela, J. M., Holopainen, J. K., Pöschl, U., Kulmala, M., Worsnop, D. R., and Laaksonen, A.: An amorphous solid state of biogenic secondary organic aerosol particles, Nature, 467, 824–827, 2010.
Wang, L., Wang, W. G., and Ge, M. F.: Heterogeneous uptake of NO2 on soils under variable temperature and relative humidity conditions, J. Environ. Sci., 24, 1759–1766, https://doi.org/10.1016/S1001-0742(11)61015-2, 2012.
Wang, X., Liu, T., Bernard, F., Ding, X., Wen, S., Zhang, Y., Zhang, Z., He, Q., Lü, S., Chen, J., Saunders, S., and Yu, J.: Design and characterization of a smog chamber for studying gas-phase chemical mechanisms and aerosol formation, Atmos. Meas. Tech., 7, 301–313, https://doi.org/10.5194/amt-7-301-2014, 2014.
Weber, B., Wu, D., Tamm, A., Ruckteschler, N., Rodríguez-Caballero, E., Steinkamp, J., Meusel, H., Elbert, W., Behrendt, T., Sörgel, M., Cheng, Y., Crutzen, P. J., Su, H., and Pöschl, U.: Biological soil crusts accelerate the nitrogen cycle through large NO and HONO emissions in drylands, P. Natl. Acad. Sci. USA, 112, 15384–15389, https://doi.org/10.1073/pnas.1515818112, 2015.
Wu, D., Horn, M. A., Behrendt, T., Müller, S., Li, J., Cole, J. A., Xie, B., Ju, X., Li, G., Ermel, M., Oswald, R., Fröhlich-Nowoisky, J., Hoor, P., Hu, C., Liu, M., Andreae, M. O., Pöschl, U., Cheng, Y., Su, H., Trebs, I., Weber, B., and Sörgel, M.: Soil HONO emissions at high moisture content are driven by microbial nitrate reduction to nitrite: tackling the HONO puzzle, ISME J., 13, 1688–1699, https://doi.org/10.1038/s41396-019-0379-y, 2019.
Zhang, H., Surratt, J. D., Lin, Y. H., Bapat, J., and Kamens, R. M.: Effect of relative humidity on SOA formation from isoprene/NO photooxidation: enhancement of 2-methylglyceric acid and its corresponding oligoesters under dry conditions, Atmos. Chem. Phys., 11, 6411–6424, https://doi.org/10.5194/acp-11-6411-2011, 2011.
Zhang, X., McVay, R. C., Huang, D. D., Dalleska, N. F., Aumont, B., Flagan, R. C., and Seinfeld, J. H.: Formation and evolution of molecular products in α-pinene secondary organic aerosol, P. Natl. Acad. Sci. USA, 112, 14168–14173, https://doi.org/10.1073/pnas.1517742112, 2015.
Zheng, G., Su, H., Wang, S., Andreae, M. O., Pöschl, U., and Cheng, Y.: Multiphase buffer theory explains contrasts in atmospheric aerosol acidity, Science, 369, 1374–1377, https://doi.org/10.1126/science.aba3719, 2020.