the Creative Commons Attribution 4.0 License.
the Creative Commons Attribution 4.0 License.
 | 17 Nov 2022
Comparison of OCO-2 target observations to MUCCnet – is it possible to capture urban XCO2 gradients from space?
Maximilian Rißmann
Gregory Osterman
Xinxu Zhao
Florian Dietrich
Moritz Makowski
Frank Hase
Matthäus Kiel
In this paper, we compare Orbiting Carbon Observatory 2 (OCO-2) measurements of column-averaged dry-air mole fractions (DMF) of CO2 () and its urban–rural differences against ground-based remote sensing data measured by the Munich Urban Carbon Column network (MUCCnet). Since April 2020, OCO-2 has regularly conducted target observations in Munich, Germany. Its target-mode data provide high-resolution within a 15 km × 20 km target field of view that is greatly suited for carbon emission studies from space in cities and agglomerated areas. OCO-2 detects urban with a root mean square different (RMSD) of less than 1 ppm when compared to the MUCCnet reference site. OCO-2 target is biased high against the ground-based measurements. The close proximity of MUCCnet's five fully automated remote sensing sites enables us to compare spaceborne and ground-based in three urban areas of Munich separately (center, north, and west) by dividing the target field into three smaller comparison domains. Due to this more constrained collocation, we observe improved agreement between spaceborne and ground-based in all three comparison domains.
For the first time, gradients within one OCO-2 target field of view are evaluated against ground-based measurements. We compare gradients in the OCO-2 target observations to gradients captured by collocated MUCCnet sites. Generally, OCO-2 detects elevated in the same regions as the ground-based monitoring network. More than 90 % of the observed spaceborne gradients have the same orientation as the gradients measured by MUCCnet. During our study, urban–rural enhancements are found to be in the range of 0.1 to 1 ppm. The low urban–rural gradients of typically well below 1 ppm in Munich during our study allow us to test OCO-2's lower detection limits for intra-urban gradients. Urban gradients recorded by the OCO-2 instruments and MUCCnet are strongly correlated (R2=0.68) with each other and have an RMSD of 0.32 ppm. A case study, which includes a comparison of one OCO-2 target overpass to WRF-GHG modeled , reveals a similar distribution of enhanced CO2 column abundances in Munich. In this study, we address OCO-2's capability to detect small-scale spatial differences within one target observation. Our results suggest OCO-2's potential to assess anthropogenic emissions from space.
- Article
(8005 KB) - Full-text XML
- BibTeX
- EndNote


Constantly rising atmospheric mole fractions of greenhouse gases, such as carbon dioxide (CO2) and methane (CH4), make combating climate change mankind's most urgent global challenge. Even though stringent climate targets were formulated under the 2015 Paris Agreement aimed to limit the temperature increase to well below 2 ∘C, rising anthropogenic emissions are still causing global mean temperatures to surge to record highs, resulting in a growing number of severe and fatal weather events that can be linked to climate change (IPCC, 2019). The Annual Greenhouse Gas Index (AGGI), which is a measure for the radiative forcing of all anthropogenic greenhouse gases (GHGs) combined, reached an all-time high of 1.47 in 2021, indicating a 47 % increase in total radiative forcing since 1990 due to rising GHG mole fractions. Especially problematic is the atmospheric surge of CO2, which contributes about 80 % of this growth in radiative forcing (Montzka, 2021). Emissions from urban areas play a key role in this development as they are responsible for more than 70 % of global manmade GHG emissions, even though they cover less than 3 % of land area globally (Wu et al., 2016; Gurney et al., 2015). These numbers illustrate the importance of long-term observations of CO2 mole fractions, especially in large and middle-sized cities as well as closely monitoring short-term fluxes on a sub-city scale, which gives insights on anthropogenic emissions and can provide policy makers with the information needed to enact more efficient and improved emission reduction policies. The Total Column Carbon Observing Network (TCCON) is a global network of Fourier transform infrared (FTIR) spectrometers of the type Bruker IFS 125HR at 25 sites in a multitude of longitudinal and latitudinal zones (Wunch et al., 2011). It monitors the long-term atmospheric growth of , XCO, and along with other atmospheric trace gases. Regular calibrations against aircraft measurements make the TCCON sites currently the primary validation source for most space-based data products (GOSAT, GOSAT-2, OCO-3, TROPOMI). Other ground-based networks like the Collaborative Carbon Column Observing Network (COCCON) aim to improve spatial coverage by operating low-cost and portable Bruker EM27/SUN spectrometers, which are also well suited as ground-based references for OCO-2 validation efforts (Jacobs et al., 2020; Frey et al., 2019).
In recent years, EM27/SUN instruments have been used in measurement campaigns that aim to quantify urban anthropogenic emissions by combining differential column measurements (DCMs) and atmospheric transport models (Chen et al., 2016). Multiple field campaigns have been carried out in Berlin (Hase et al., 2015), Munich (Dietrich et al., 2021), Indianapolis (Jones et al., 2021), San Francisco Bay Area (Klappenbach et al., 2021), Poland (Luther et al., 2019, 2022), Chino (Chen et al., 2016), St. Petersburg (Makarova et al., 2021), and Hamburg (Chen et al., 2022). These studies show the potential of top-down emission estimates as they can help uncover unknown emission sources and constrain bottom-up emission inventories.
In addition to the increasing number of ground-based instruments, constantly improving spaceborne remote sensing systems drastically enhance the global coverage of precise measurements even in hard to reach, solitary areas. NASA's Orbiting Carbon Observatory instruments (OCO-2 and OCO-3) capture in four different measurements modes: nadir, glint, target, and snapshot area mode (SAM). OCO-2 captures on a 16 d ground-track repeat cycle (Osterman et al., 2020). Previous studies investigated urban to rural enhancements (Park et al., 2021) and extracted CO2 emission signals from OCO-2 nadir tracks (Wu et al., 2018; Shekhar et al., 2020). Recently, Kiel et al. (2021) compared OCO-3 SAM and target observations over the Los Angeles megacity against simulated from two different models. This study showed that spatially fine-scale satellite measurements have the potential to resolve differences on a sub-city scale. Even though OCO-2 and OCO-3 measurements are evaluated against TCCON observations on a regular basis, these comparisons are performed on a global scale and do not provide information about OCO-2's data quality on sub-city scales. In this study, for the first time, we test OCO-2's capability to determine sub-city differences within one target field (approx. 15 km × 20 km) by comparing OCO-2 target soundings against measurements of the Munich Urban Column Concentration network (MUCCnet). MUCCnet is a novel, fully automated, ground-based network that continuously measures CO2, CH4, and CO column concentrations at its five sites in and around Munich (see Fig. 1) (Dietrich et al., 2021). The close proximity of the ground-based instruments allows us to compare absolute OCO-2 in different parts of Munich and also lets us evaluate spaceborne enhancements. This way, we test the capability of OCO-2 to resolve small-scale urban fluxes in Munich and other cities from space, which is needed to study sector-dependent emissions in the future. Due to OCO-2's relatively small target size of around 300 km2 the instrument is best suited for spaceborne emission studies in smaller cities, while OCO-3's SAM measurements cover a wider field of view, which enables the assessment of larger agglomerated areas (Kiel et al., 2021).
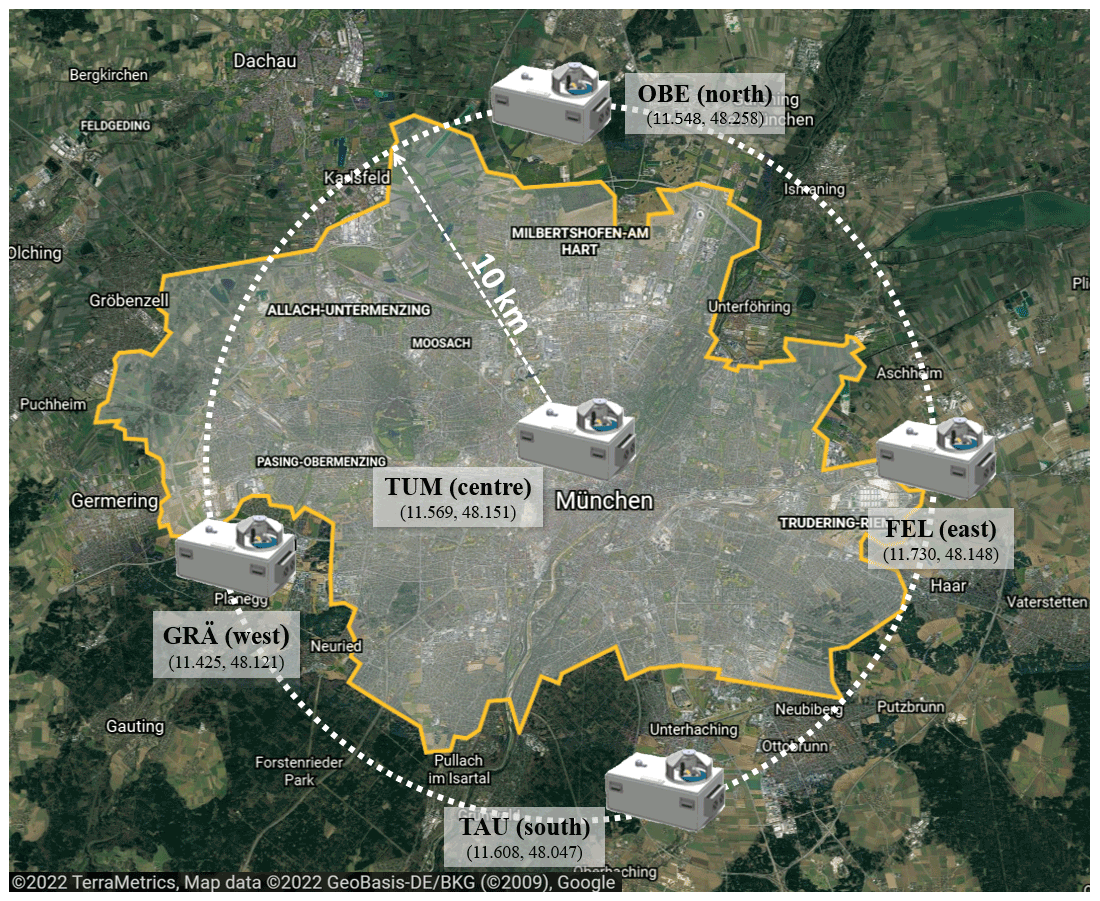
Figure 1Locations of EM27/SUN spectrometers in Munich. The center site is located on the roof of the TUM building in Munich. The other spectrometers are distributed around Munich in each compass direction.
2.1 MUCCnet data
The solar spectra that are acquired by the five MUCCnet EM27/SUN devices are evaluated by two retrieval algorithms (Dietrich et al., 2021): GGG2014 (Wunch et al., 2011; Hedelius et al., 2016) and PROFFAST (Frey et al., 2019; Alberti et al., 2022). In this study, we consider the outputs of the PROFFAST retrieval algorithm (Hase et al., 2004; Frey et al., 2015) that fits atmospheric CO2 by scaling a priori column profiles to match the solar spectra measured by the spectrometers (Frey et al., 2019). The software is developed and maintained by the Karlsruhe Institute of Technology (KIT). The PROFFAST algorithm considers the instrumental line shape (ILS) of the individual EM27/SUN devices to reduce systematic instrument-specific errors in the trace gas retrieval (Frey et al., 2015; Alberti et al., 2022). The ILS parameters, phase error (PE), and modulation efficiency (ME) of the instruments at the maximum optical path length (OPDmax) are derived from open-path measurements under controlled ambient conditions (Frey et al., 2019). The instrument-specific ILS parameters resulting from the open-path calibrations are stored in the spectra generated with the PROFFAST preprocessor and are subsequently used in the trace gas analysis (Gisi et al., 2012; Sha et al., 2020).
The remaining instrument- and gas-specific discrepancies are determined by analyzing side-by-side solar observations performed at the calibration facility of the COllaborative Carbon Column Observation Network (Frey et al., 2019). A reference COCCON instrument (serial number SN37) and a collocated TCCON spectrometer in Karlsruhe serve as standards of comparison. The resulting empirical corrections summarize all remaining unexplained instrument-specific corrections and are applied as instrument-specific calibration factors to the raw values generated by the PROFFAST retrieval code:
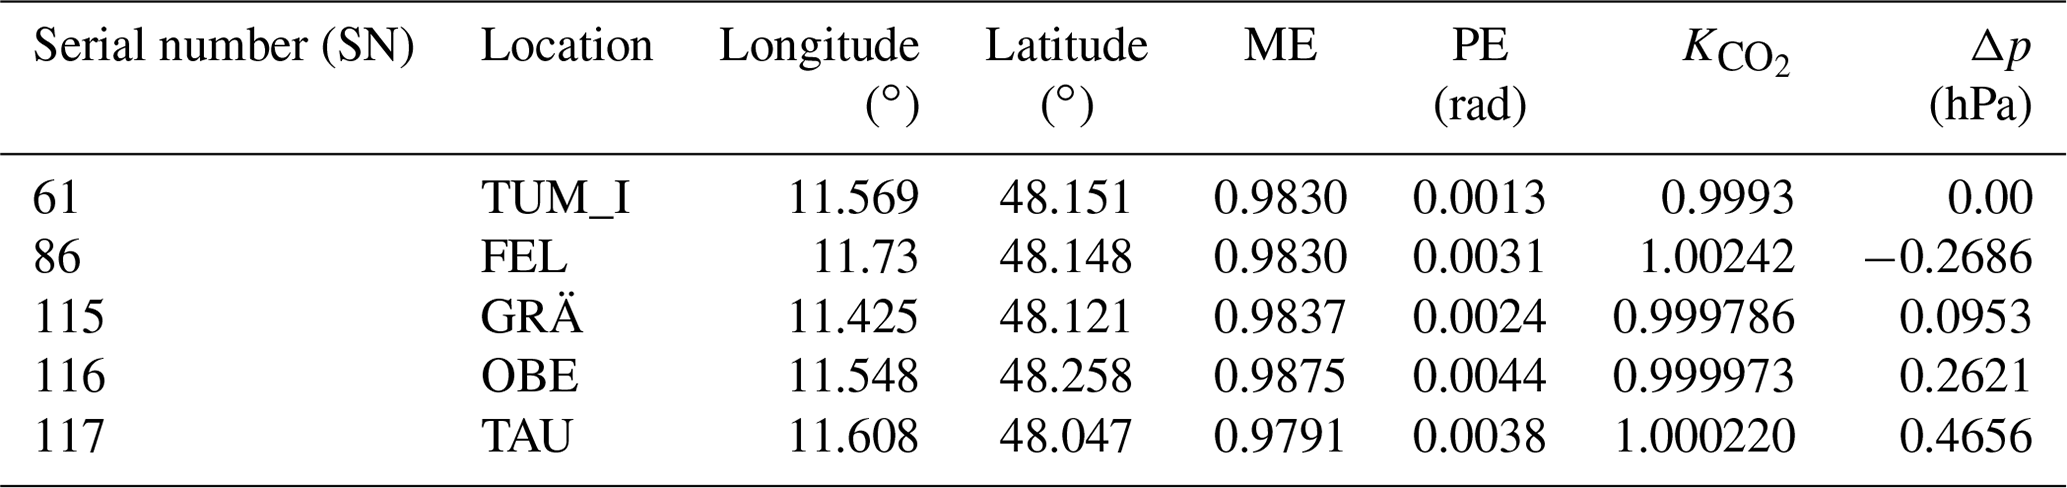
This indirectly ties the MUCCnet retrievals to the TCCON site in Karlsruhe since the COCCON reference device is calibrated against the TCCON site in Karlsruhe (Alberti et al., 2022; Frey and Gisi, 2021). Each MUCCnet spectrometer is protected by an enclosure, which is equipped with a multitude of sensors to fully automate the retrieval process (Heinle and Chen, 2018; Dietrich et al., 2021). Among others, the enclosures are equipped with a low-cost air pressure sensor (Model 61302, Young, 2009) that captures the ground-pressure inputs for the PROFFAST retrieval. The pressure sensor of the MUCCnet center site (TUM) is used to calibrate the other four in situ pressure sensors. The sensors are calibrated by subtracting constant offsets, which are determined in side-by-side measurements. Pressure calibration offsets, instrument-specific calibration factors, and the ILS parameters are listed in Table 1.
Table 1Enclosure positions and EM27/SUN input parameters that are used for calibrating PROFFAST outputs of the five MUCCnet measurement sites (Frey and Gisi, 2021; Dietrich et al., 2021).
A global post-correction factor that depends on the solar zenith angle (SZA) is applied to remove an erroneous low bias of the order of 0.5 ppm in the retrieval outputs of the current PROFFAST version (Dubravica and Hase, 2021, distributed before December, 2021). The following formula removes the low bias in the scaled retrievals:
We tested how this post-processing correction (see Eq. 2) impacts our validation results. We found that applying the post-correction to the PROFFAST retrieval effectively reduced the bias between MUCCnet and OCO-2. Hence, we can confirm that the preliminary measure is effective and should be used with PROFFAST outputs of the current software version (Dubravica and Hase, 2021). The post-correction will be removed in the new version of PROFFAST, which is already available to users as a beta version.
The PROFFAST retrieval and calibration process for individual devices ties the data to the COCCON network, and via its connection to TCCON it shares TCCON's WMO X2007 trace gas scale (Frey and Gisi, 2021). All results of this paper are based on the scaled and bias-corrected retrievals .
2.2 OCO-2 data
The OCO-2 instrument was developed by NASA and launched into space on 2 July 2014. It orbits the Earth as part of the afternoon satellite train (A-train) at an altitude of 705 km (Crisp, 2011). Its instruments capture solar radiance spectra in one of three observational modes: nadir, glint, and target mode. During OCO-2 target observations the instrument scans a certain area of interest, which is around 15 km × 20 km in size. To maximize the number of soundings during one overpass the instrument scans the target area for approximately 2 min. The instrument simultaneously captures eight spatially separated footprints every of a second, theoretically yielding around 4000 measurements per overpass (Crisp, 2011). One 1.29 km × 2.29 km OCO-2 footprint covers an area of just under 3 km2 (Osterman et al., 2020).
The captured solar radiance spectra are processed by the Atmospheric Carbon Observations from Space (ACOS) retrieval software. In this work we use the OCO-2 lite files that are processed with the latest version (v10) of the ACOS retrieval algorithm (O'Dell et al., 2018; Kiel et al., 2019). The corresponding files are publicly available and can be downloaded through the NASA Goddard Earth Science Data and Information Services Center (OCO-2 Science Team/Michael Gunson, Annmarie Eldering, 2020). Footprint-related biases and parametric biases are removed for retrievals in the OCO-2 lite files. A comprehensive overview of the OCO-2 and OCO-3 data products as well as the bias correction procedure is given in Osterman et al. (2020). Furthermore, a global scaling factor, derived from regular comparisons of OCO-2 target observations and 29 collocated TCCON sites, is applied to the lite file data. This ties the OCO-2 lite to the standard trace scale for atmospheric of the World Meteorological Organization (WMO scale) (Wunch et al., 2017; Osterman et al., 2017). The most recent comparisons of fully bias-corrected OCO-2 target and TCCON reveal superb agreement (rms = 0.86 ppm, R2=0.97) (Kiel, 2021). The data product contains a binary quality flag which flags low-quality soundings (qf=1). In the following, we solely consider good-quality retrievals (qf=0) (Osterman et al., 2020).
The results of this study are based on OCO-2 target observations that took place in recent years, starting from April 2020. From April 2020 to July 2021 OCO-2 successfully targeted MUCCnet 12 times. Figure 2 summarizes the target dates and the corresponding number of good-quality (qf=0) soundings. We include a target observation in our study if (1) the OCO-2 instrument gathers a minimum of 500 good-quality soundings during the overpass and (2) there are ground-based retrievals for at least one of the three sites within the target field of view. In comparison to other spaceborne remotely sensed data products, the relatively small size of the OCO-2 footprints results in a higher number of good-quality soundings per target observation even in cloudy conditions. One overpass, which took place on 4 September 2020, is removed from the comparison set, since only 86 good-quality soundings are retrieved. All remaining days had at least 800 good-quality soundings. Figure 3 shows the OCO-2 observations of the 12 remaining successful overpasses over Munich. Due to OCO-2's sun-synchronous orbit, target overpasses in Munich usually take place around 12:00 UTC. A typical distribution of soundings is shown in Fig. 4. Three of the five MUCCnet sites are within the target field of view. Thus, we can compare OCO-2 against collocated ground-based data in the center (TUM), north (Oberschleißheim), and west (Gräfelfing) of Munich.
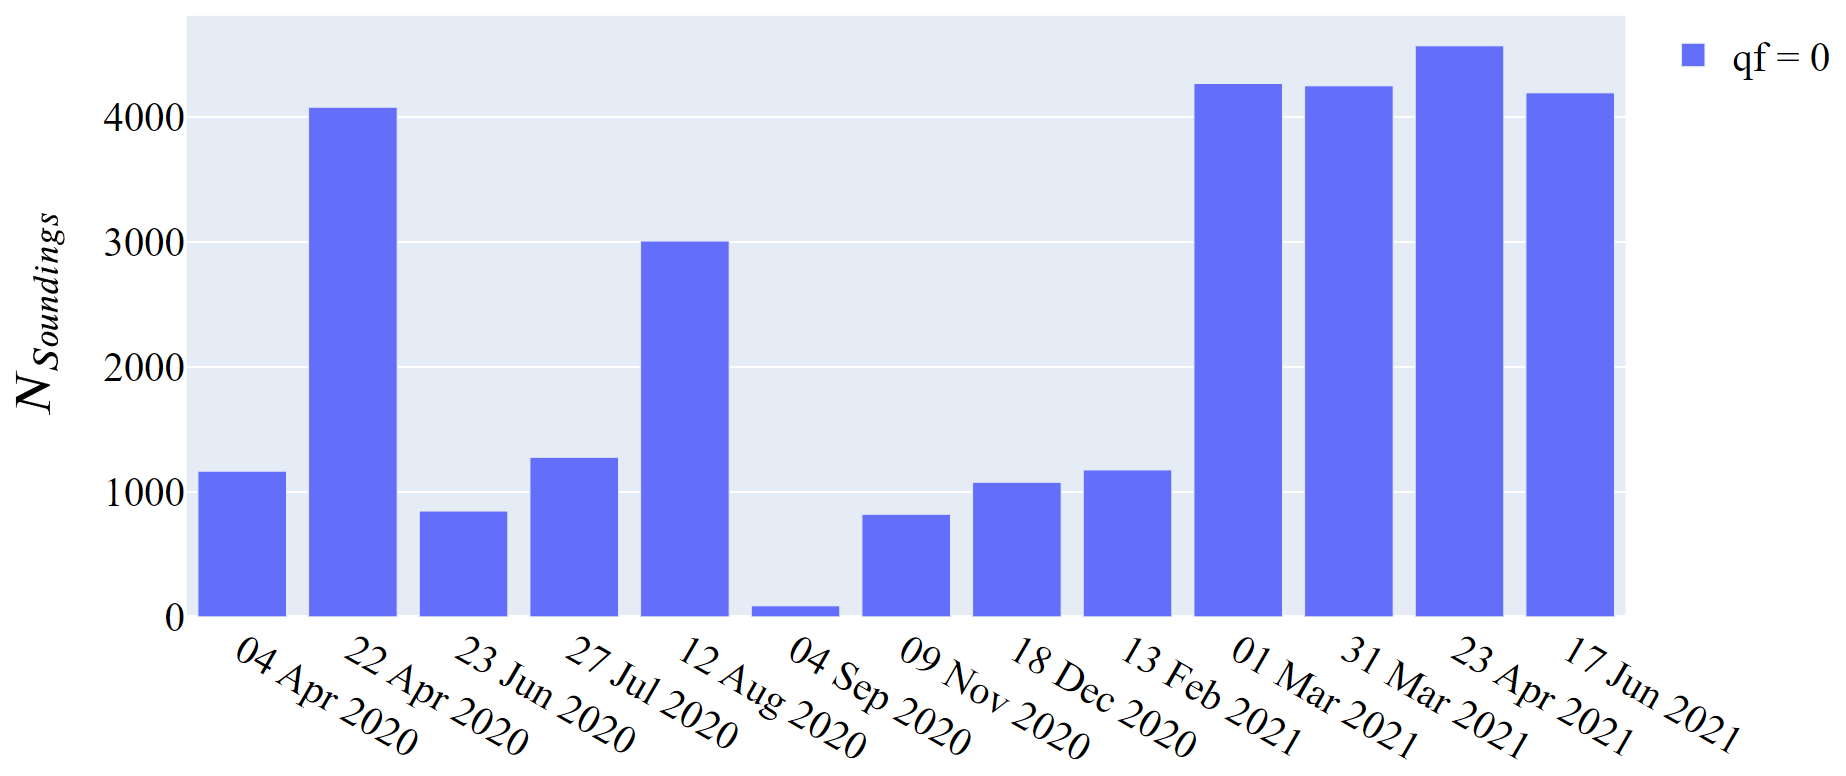
Figure 2Number of soundings for each of the OCO-2 target overpasses. On most days OCO-2 captured more than 1000 good-quality (qf=0) soundings per overpass. Usually a higher number of good-quality soundings corresponds to more robust and less sparse data. Thus, we remove overpasses with fewer than 500 good-quality soundings.

Figure 3Daily maps of OCO-2 target observations in Munich. MUCCnet spectrometer locations are highlighted on the map. The OCO-2 target-mode data are binned into 0.02∘ × 0.02∘ latitude–longitude grid cells. Map source: Esri, Maxar, Earthstar Geographics, and the GIS User Community.

Figure 4Histogram of the OCO-2 target sounding distribution in Munich. There are three MUCCnet sites with sufficient collocated data, which will be considered in this study. Ground-based instruments in Feldkirchen (FEL) and Taufkirchen (TAU) are not featured in this study.
2.3 WRF model setup
We compare the OCO-2 target observations to simulated CO2 column concentrations provided by a high-resolution modeling WRF-GHG framework designed for Munich with 45 vertical layers and a horizontal resolution of 400 m (Zhao et al., 2020b). This modeling framework is set up based on the Weather Research and Forecasting model (WRF) coupled with the biospheric flux model (Beck et al., 2011) to quantitatively understand the processes of the emission and consumption of CO2 and CH4 in and around Munich. The meteorological initial conditions and lateral boundary conditions in the modeled background concentrations are obtained from the Integrated Forecasting System (IFS) Cycle 47r1, implemented by the European Centre for Medium-Range Weather Forecasts (ECMWF) with a horizontal resolution of approximately 40 km. Near-surface emissions are initialized from the first version of the TNO-GHG and co-emitted species emission database (TNO_GHGco_v1.1; Super et al., 2020). The details on the model setup and related assessment can be found in Zhao et al. (2020a). in the study area is derived from the modeled concentration profile umod, which is smoothed with the OCO-2 averaging kernel a, following the method described in O'Dell et al. (2012):
Here, ai, hi, and uap,i denote the ith layer of the normalized averaging kernel vector, the pressure weighting vector, and the a priori profile, which can be found in the OCO-2 lite files. The resulting WRF-GHG is binned onto an latitude–longitude grid.
3.1 Target collocation
We use a methodology similar to Wunch et al. (2017) in order to evaluate the OCO-2 retrievals over Munich against MUCCnet. To compare both datasets we consider the mean of all good-quality OCO-2 soundings within the target area and the ground-based measurements of the MUCCnet center site (11.569∘ E, 48.151∘ N) that have been recorded within ±30 min of the spacecraft's overpass time. Target observations that had fewer than 500 good-quality soundings are not considered in the comparison process. Only the target observation on 4 September 2020 does not meet this requirement.
To account for differences in the MUCCnet and OCO-2 vertical sensitivities, we apply an averaging kernel correction following the approach of Wunch et al. (2011). Hereby, the ground-based is smoothed with the ACOSv10 column averaging kernel as described in Nguyen et al. (2014). We perform a York regression (York et al., 2004) to determine the best-fit line and slope (Wu and Zhen Yu, 2018).
3.2 By-site collocation
Due to the short distance of around 10 km between the MUCCnet instruments, three of the five MUCCnet sites are within the 15 km × 20 km OCO-2 target field of view. This lets us evaluate the spaceborne retrievals for different parts of the city. We compare subsets of OCO-2 soundings in each target observation to the measurements of the closest ground-based instrument.
For a collocation radius of rcol = 6 km around the spectrometer locations we achieve the highest number of collocated soundings for each site while having almost no overlap of collocated soundings between the sites (most soundings are collocated with only one MUCCnet site). This way, we segment the target observation data into three comparison domains – center, west, and north. A large comparison set of soundings also reduces the effect of random errors in our computed mean . We assume this relatively large comparison domain to best represent the actual around our ground-based measurement sites. For each domain we validate spaceborne measurements against data from the collocated MUCCnet spectrometers in Gräfelfing (west, GRÄ), Oberschleißheim (north, OBE), and the Munich city center (center, TUM). Figure 5 shows the OCO-2 target (taken on 31 March 2021) field of view (white square) and the footprint positions of soundings. The OCO-2 soundings are color-coded according to their comparison domain (center: green, west: blue, north: red). The same color coding is used for the validation results in Sect. 4.2.
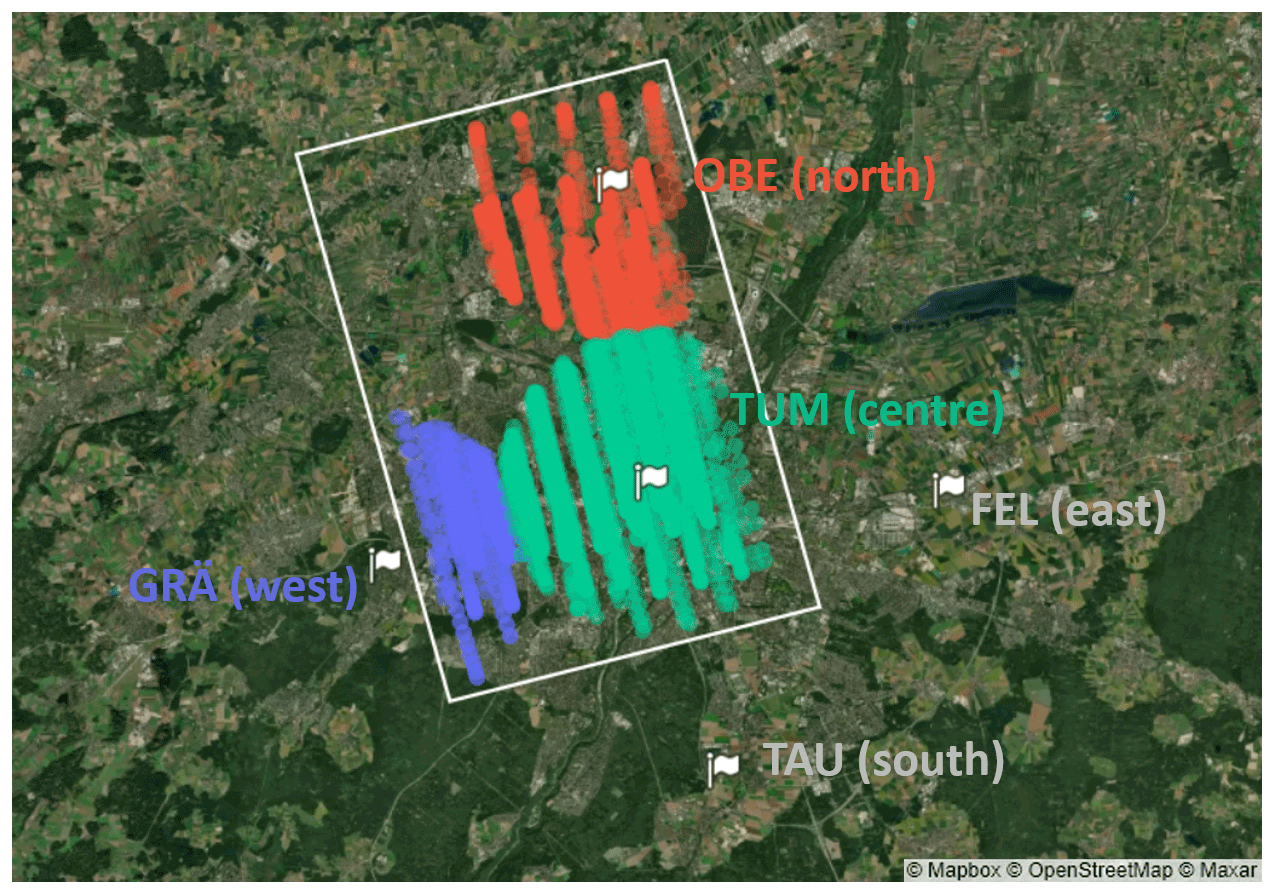
Figure 5This figure illustrates the collocation criteria for target overpass data captured on 31 March 2021. OCO-2 soundings within a radius of 6 km are compared to measurements of the collocated MUCCnet instrument. The OCO-2 target soundings are colored according to their collocated ground-based spectrometers.
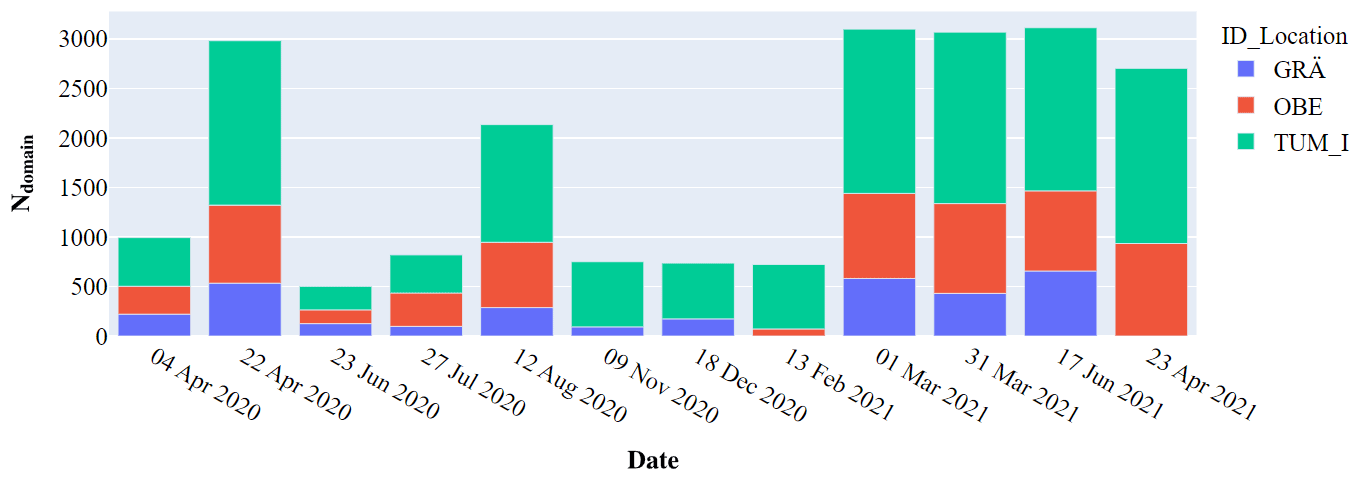
The mean of OCO-2 soundings in each domain is compared to measurements of the corresponding MUCCnet site within ±30 min of overpass time. Due to the smaller size of the by-site comparison domains we only consider comparison sets if (1) at least 70 spaceborne soundings are recorded within the collocation area around each MUCCnet site and (2) the collocated ground-based instrument captured at least 50 retrievals within ±30 min of the overpass. On 17 June 2021, we extended the collocation time for the northern site in Gräfelfing to ±60 min due to sparse ground-based measurements at the exact time of the overpass. The relatively long collocation time frame is chosen due to the low average wind speeds of 2.33±1.54 m s−1 during the overpasses featured in this study. This may, especially for higher wind speeds, introduce collocation error, which can be reduced by adjusting the collocation time frame according to the wind speed. Figure 6 shows the number of soundings collected by the OCO-2 instruments in each domain Ndomain for the 12 target observations investigated in this paper.
3.3 Gradient comparison
We evaluate spaceborne differences in the OCO-2 target field of view between the three separate domains (center, north, and west) against measurements of the collocated MUCCnet spectrometers. We compute the urban gradients present in the OCO-2 overpasses by subtracting the mean of soundings collocated with one of the MUCCnet sites (domain 1) from the mean of soundings captured in one of the other two comparison areas (domain 2):
This way, we compute three sets of spaceborne gradients that are present in the target observation: (1) west-center, (2) north-center, and (3) north-west. Spaceborne gradients are compared to the gradients of ground-based measurements of the collocated MUCCnet spectrometers. Ground-based gradients are computed by using data from the collocated MUCCnet sites:
Consequently, gradients computed between Munich center and Gräfelfing will also be referred to as “west-center” gradients, while those between the center site and Oberschleißheim are called “north-center” gradients. Positive gradients are obtained if site 1 captures higher than site 2. We compute the standard deviation of our gradients between the two domains as follows:
Rather than the standard error of the mean, SDdomain 1−domain 2 represents the combined spread of in the two domains. When compared to the by-site comparison process (Sect. 4.2), we apply stricter criteria to filter which overpasses are considered to be robust and suited for the gradient assessment. We exclude spaceborne gradients if the mean spaceborne in one of the domains is computed using fewer than Ndomain=100 soundings and if it has a standard deviation larger than σ=75 ppm. This criterion removes two of the gradients from the set (on 27 July and 9 November 2020). Second, we checked MODIS images taken at overpass time for high cloud coverage. On 23 June, the MODIS images and a high aerosol contamination point at challenging measurement conditions, causing a sparse distribution of converged soundings around the MUCCnet center site. Therefore, we do not consider urban gradients captured on 23 June 2020.
4.1 OCO-2 target validation
To test the agreement of OCO-2 and MUCCnet , we perform a York regression between the 12 OCO-2 target observations and the measurements of the MUCCnet reference instrument in the center of the OCO-2 target field of view. The results are shown in Fig. 7. For all target observations that are considered in this study, the root mean square difference is below 1 ppm (RMSD = 0.96 ppm). Furthermore, the coefficient of determination R2=0.93 reveals a very strong correlation. On average, the spaceborne is about 0.70 ppm higher than the collocated solar measurements taken by the MUCCnet reference device. This high bias is comparable to the observed bias when OCO-2 target data are compared to the Karlsruhe TCCON instrument (bias 0.80 ppm, RMSD = 0.91) to which MUCCnet is tied (as discussed in Sect. 2.1). The RMSD improves to 0.66 ppm when the bias between the space and ground-based measurements is not taken into account (Matthaeus Kiel, personal communication, 26 January 2022). The averaging kernel correction that we applied to the data improves the root mean square difference by 0.18 ppm. Similar effects of the averaging kernel correction are also observed in Kiel et al. (2021).

Figure 7Scatter plot of captured by the MUCCnet center site and OCO-2 target data. We consider all good-quality soundings within the target area. Each overpass is color-coded. The error bars represent the standard deviations of the samples in the corresponding domain.
Figure 8 shows the differences between spaceborne and ground-based retrievals for each individual overpass. Both observing systems capture a similar seasonal cycle of urban in Munich in the time period analyzed here. For 11 out of the 12 overpasses, OCO-2 measured the higher mole fractions, causing an average OCO-2 high bias of 0.7 ppm. For only one overpass (12 August 2020) did OCO-2 capture lower mean than MUCCnet. On two days a mean offset higher than 1.5 ppm is measured, which is likely caused by suboptimal measurement conditions. On 9 November 2020 more than 80 % of retrievals are low quality (qf=1), yielding just 816 usable soundings. In the study time, the bias in the satellite data does not show a noticeable temporal drift. The four overpasses in which the spaceborne offset deviates the most from the mean bias took place between 27 July and 18 December 2020.
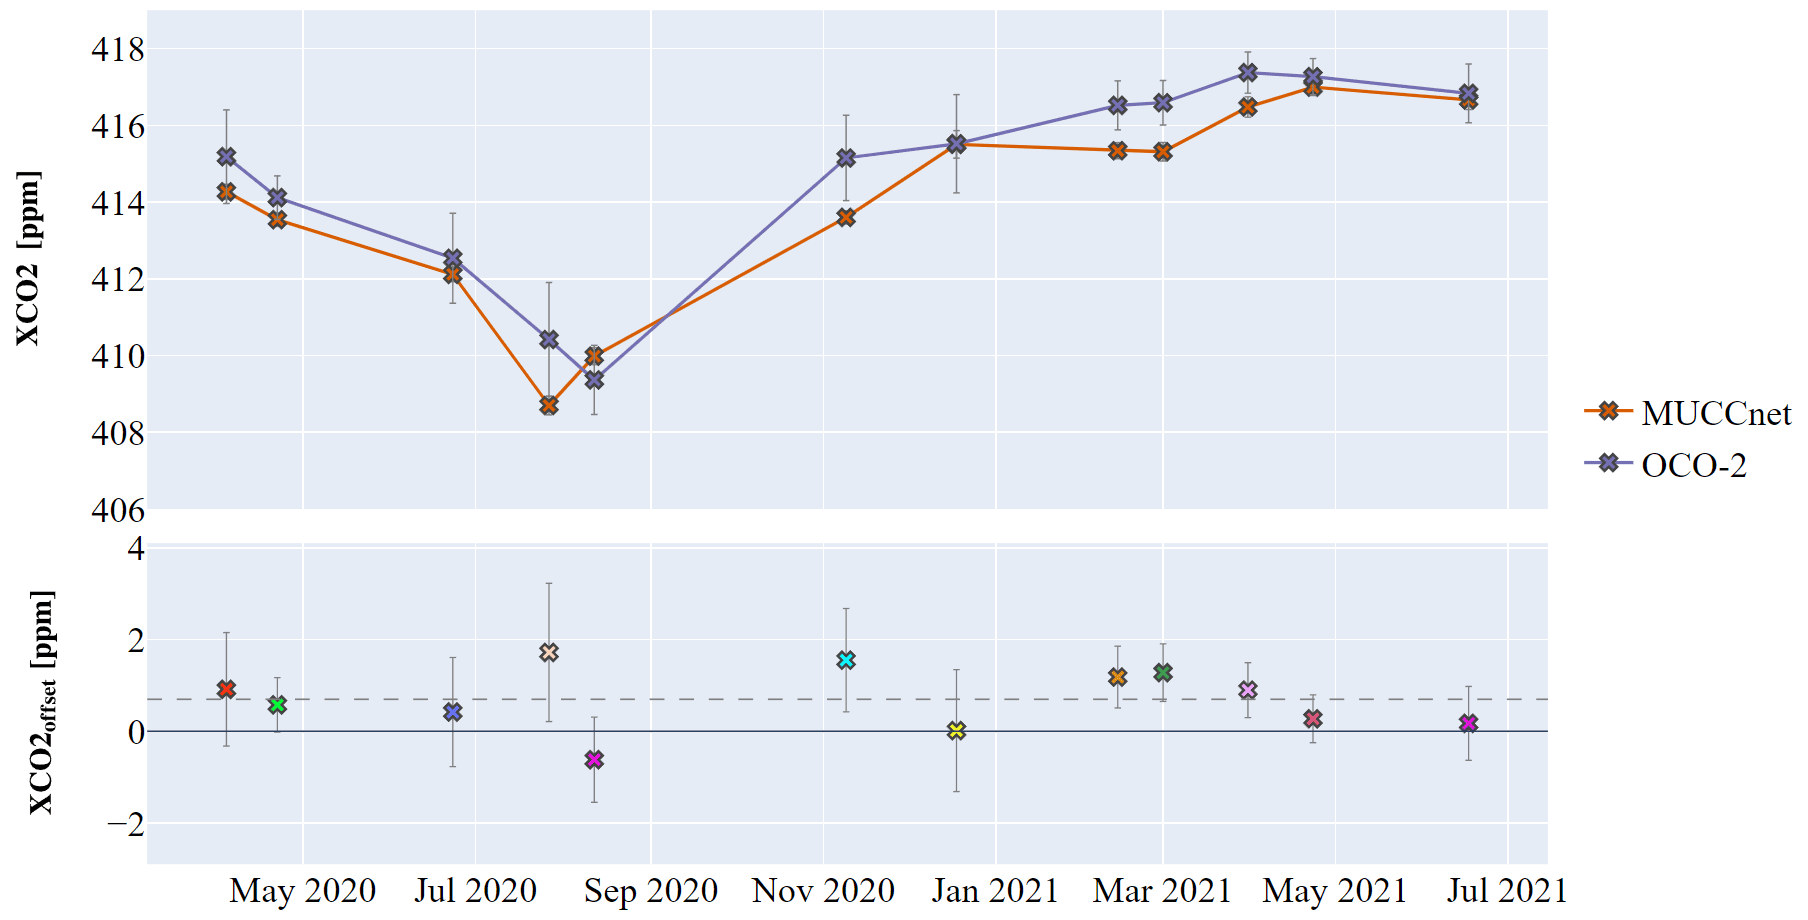
Figure 8Both observing systems detect the seasonal variations and growth in the study period. The lower panel shows the daily differences of satellite data and MUCCnet observations. The spaceborne observations are biased high by 0.7 ppm.
4.2 By-site validation
Dividing the OCO-2 target observations into spatially separated comparison domains allows us to validate the spaceborne in the north (OBE), center (TUM), and west (GRÄ) of Munich. In each domain we consider spaceborne soundings that are within a 6 km distance of the collocated MUCCnet instrument. The center domain usually has the highest number of spaceborne soundings because the northern and western instruments are closer to the edge of the target area. In contrast to the target comparison in Sect. 4.1 we consider a spatially more constrained subset of OCO-2 soundings. This improves the root mean square differences of OCO-2 and the MUCCnet center site to RMSDTUM=0.82 ppm. This improvement is caused by more specific collocation that reduces the effect of averaging over potential spatial gradients in the OCO-2 target observation. The scatter plots in Fig. 9 show the by-site comparison results for target observations in the study. Similar to the results in the center domain, for the two remaining MUCCnet sites, we find RMSD values of less than 1 ppm (RMSDGRÄ=0.61 ppm, and RMSDOBE=0.94 ppm) when compared to the collocated ground-based measurement sites. Furthermore, all three scatter plots show improved coefficients of determination (, and ) when compared to the target validation results in Sect. 4.1.
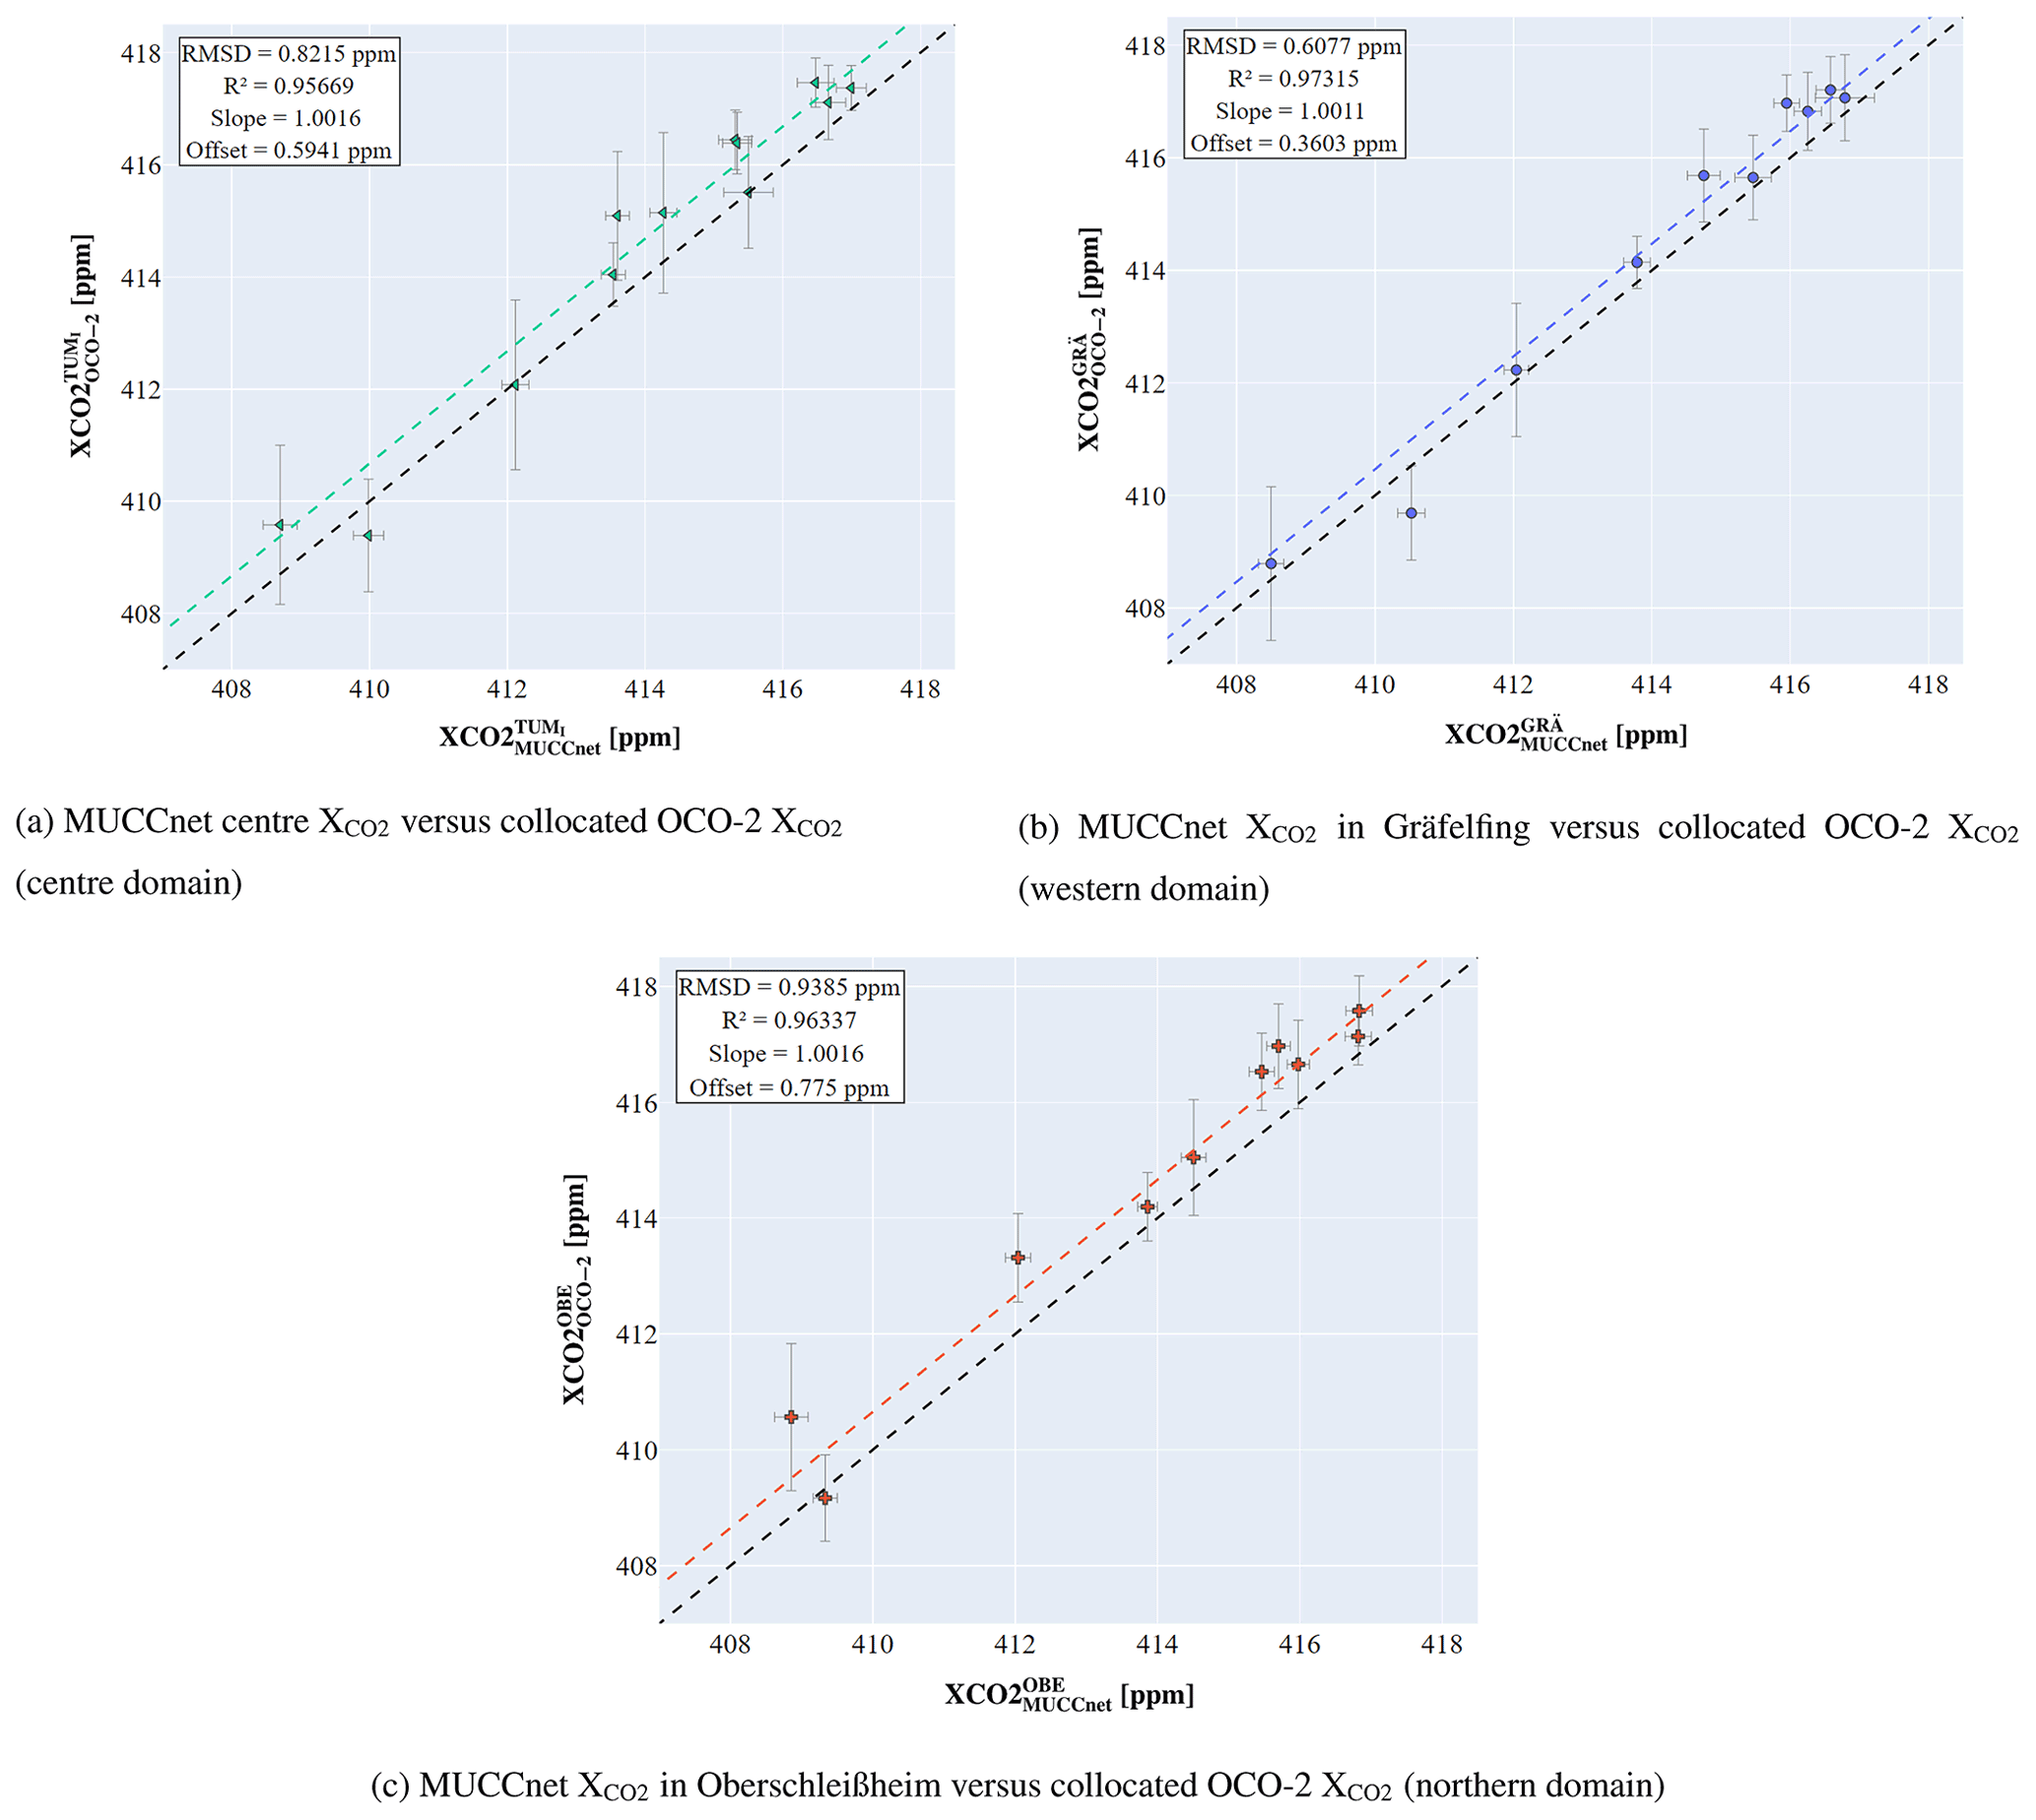
Figure 9By-site comparison results for the three comparison domains in the center (TUM), west (GRÄ), and north (OBE) of Munich. We use the same color coding as in Fig. 5. OCO-2 has the largest bias and RMSD in the northern domain when compared to the collocated MUCCnet . The error bars represent the standard deviations of the samples in the corresponding domain.
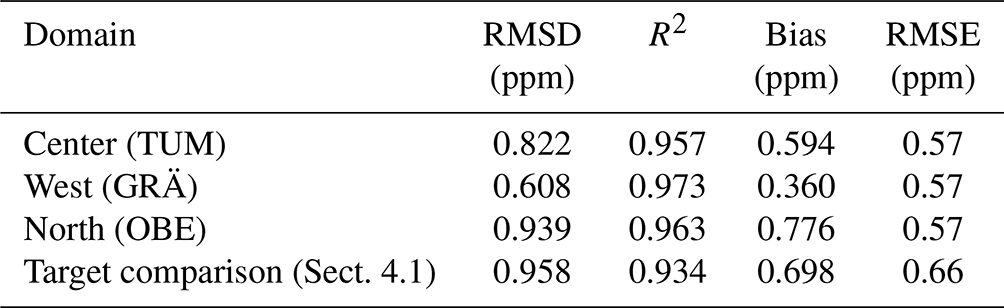
We computed a high bias of OCO-2 against the MUCCnet spectrometers in all three comparison domains ranging from bGRÄ=0.36 ppm over bTUM=0.59 ppm to bOBE=0.78 ppm. The differences in the relative location of the collocated OCO-2 soundings in the target field of view could impact the results due to changes in the viewing geometry of the spaceborne instruments. A larger sample size is required to make a more robust statement. The best-fit RMSE is nearly identical for all three comparison domains (RMSETUM=0.57 ppm, RMSEGRÄ=0.57 ppm, and RMSEOBE=0.57 ppm). A summary of the linear regression results for target and by-site validation is given in Table 2.
Table 2Regression results of collocated measured by MUCCnet and OCO-2 of by-site and target validation. In all domains OCO-2 is biased high against MUCCnet.
The daily offsets in each domain are depicted in Fig. 10. We assume that measurement uncertainties and the relatively small sample size of 11 overpass days cause the discrepancies in the computed mean biases of the three collocation domains. OCO-2 retrieves higher CO2 mole fractions than MUCCnet in all three domains during each overpass except for 12 August 2020. For most overpasses the by-site offsets are consistent in each of the three collocation areas. The largest discrepancies in daily offsets in the three domains could be observed on overpass days with a smaller than average number of good-quality soundings (e.g., 9 November and 27 July 2020). Target observations with a high number of good-quality soundings in general have smaller differences in daily by-site offsets.
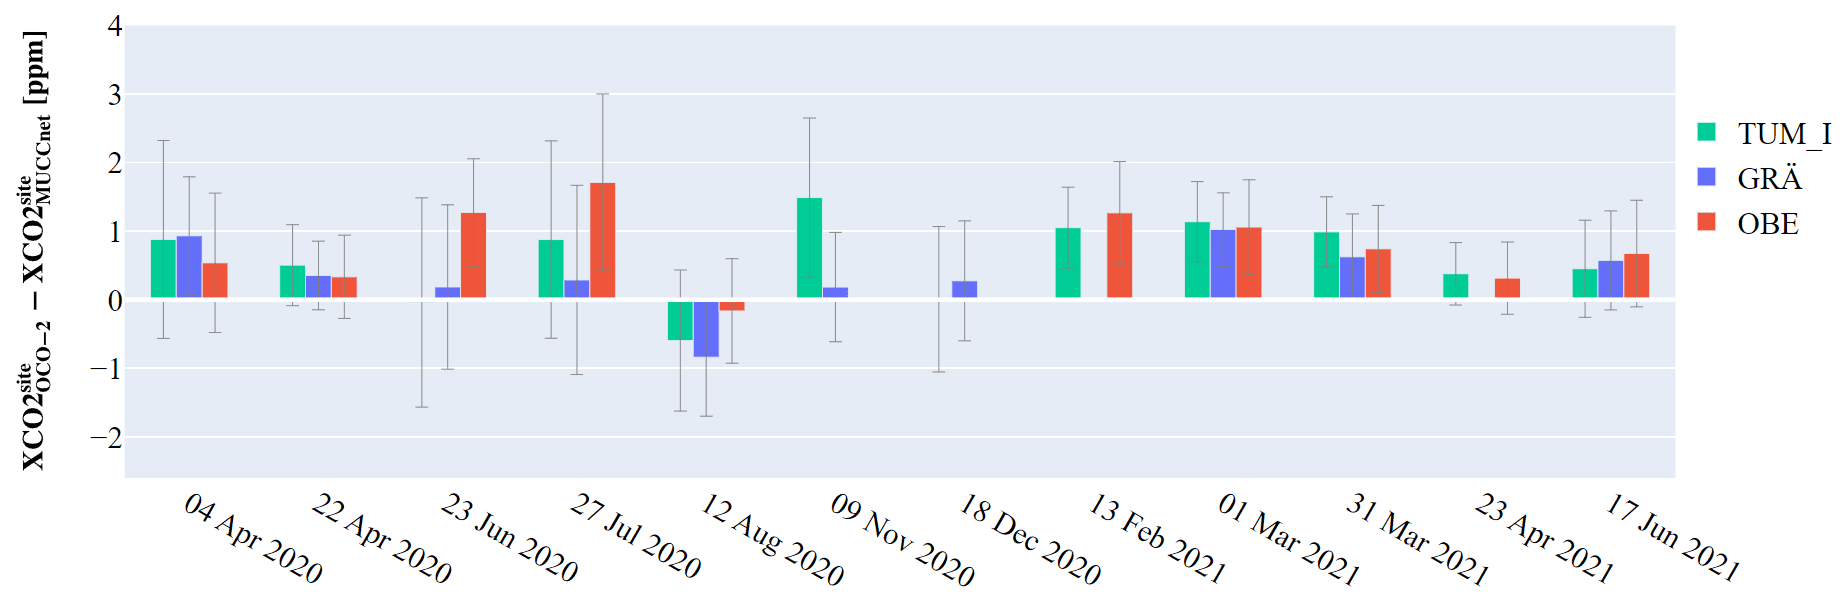
Figure 10Daily offsets of collocated captured by OCO-2 and MUCCnet in each comparison domain. During most overpasses the by-site offsets are alike for all comparison domains. However, during some overpasses (e.g., 23 June, 27 July, 9 November) we observe a higher level of intra-day variation of the daily by-site offsets, which can impede the detection of urban gradients.
Overall, we discover an improvement of RMSD and a higher correlation R2 in the by-site validation when compared to the target validation due to the smaller collocation radius. OCO-2 is capable of detecting well in the three domains in the center, west, and north of Munich. However, small differences in averaged bias are present in the three collocation areas.
4.3 Assessment of urban gradients measured from space
The adjusted collocation procedure also allows us to assess the spaceborne CO2 gradients in the OCO-2 target observations. This is the first time gradients within one OCO-2 target observations are evaluated against measurements of multiple ground-based measurements sites. We contrast the spaceborne against the differences measured by the collocated MUCCnet spectrometers during the overpass (see Fig. 11). This simple approach allows us to see how spatial gradients in the target observations compare to the differences captured by MUCCnet. We compute three sets of gradients (north-west, north-center, and west-center) for each overpass for which a sufficient amount of data is available.
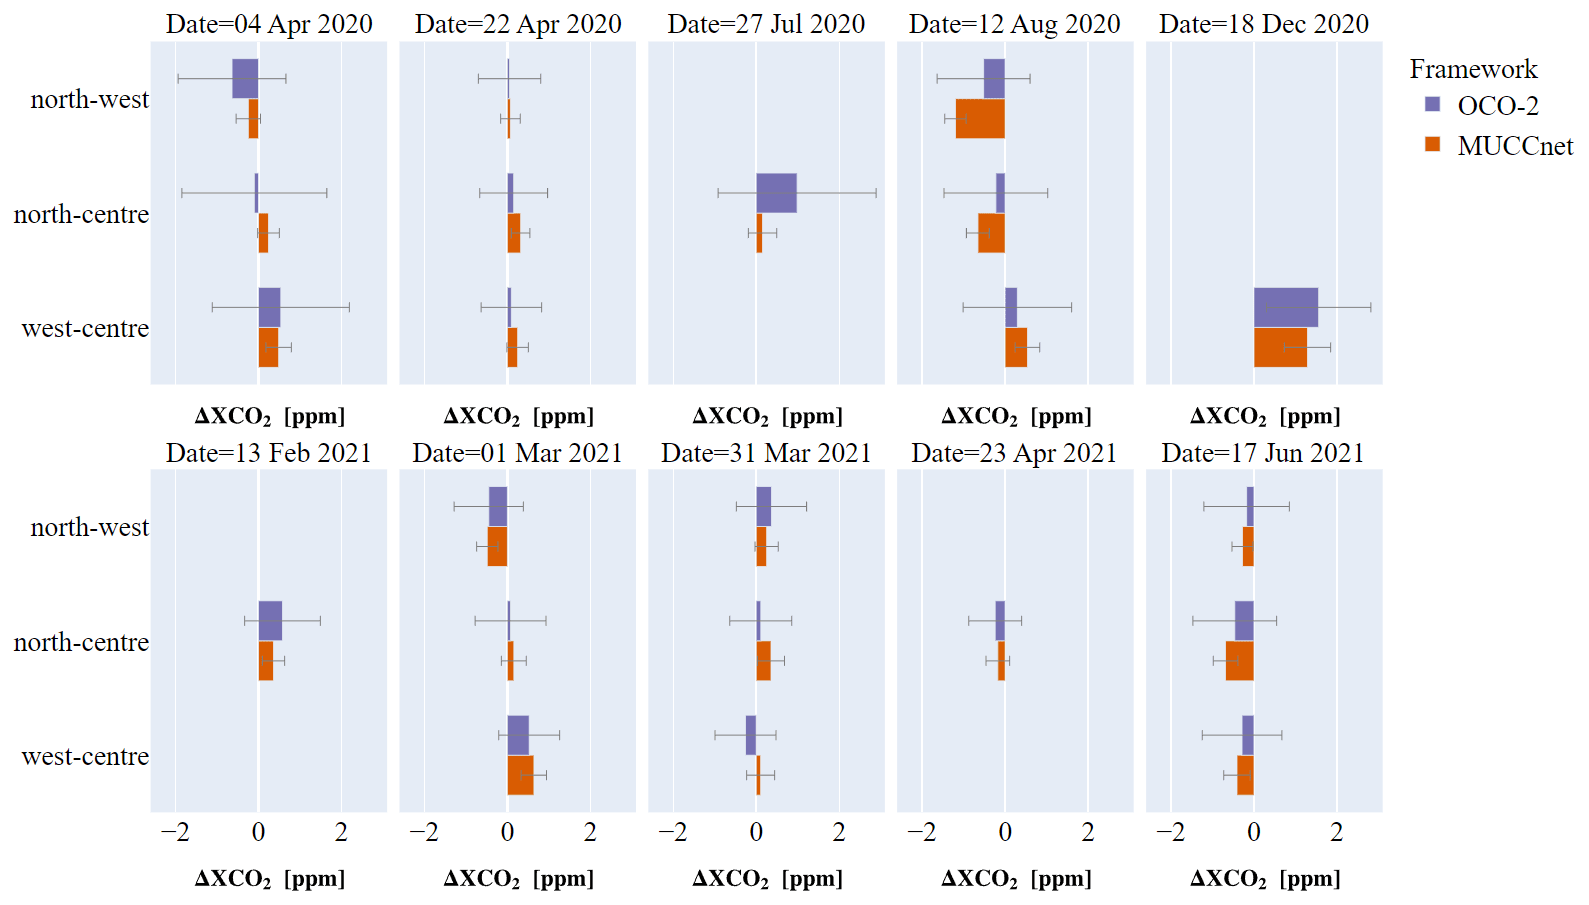
Figure 11 gradients in Munich on overpass days. Blue bars represent the gradients present in the OCO-2 target observations. Orange bars denote gradients captured by MUCCnet. On most days, OCO-2 sees elevated in the same region as the ground-based MUCCnet instruments. Error bars are computed using the combined standard deviations of the retrievals used for computing each gradient (see Eq. 6).
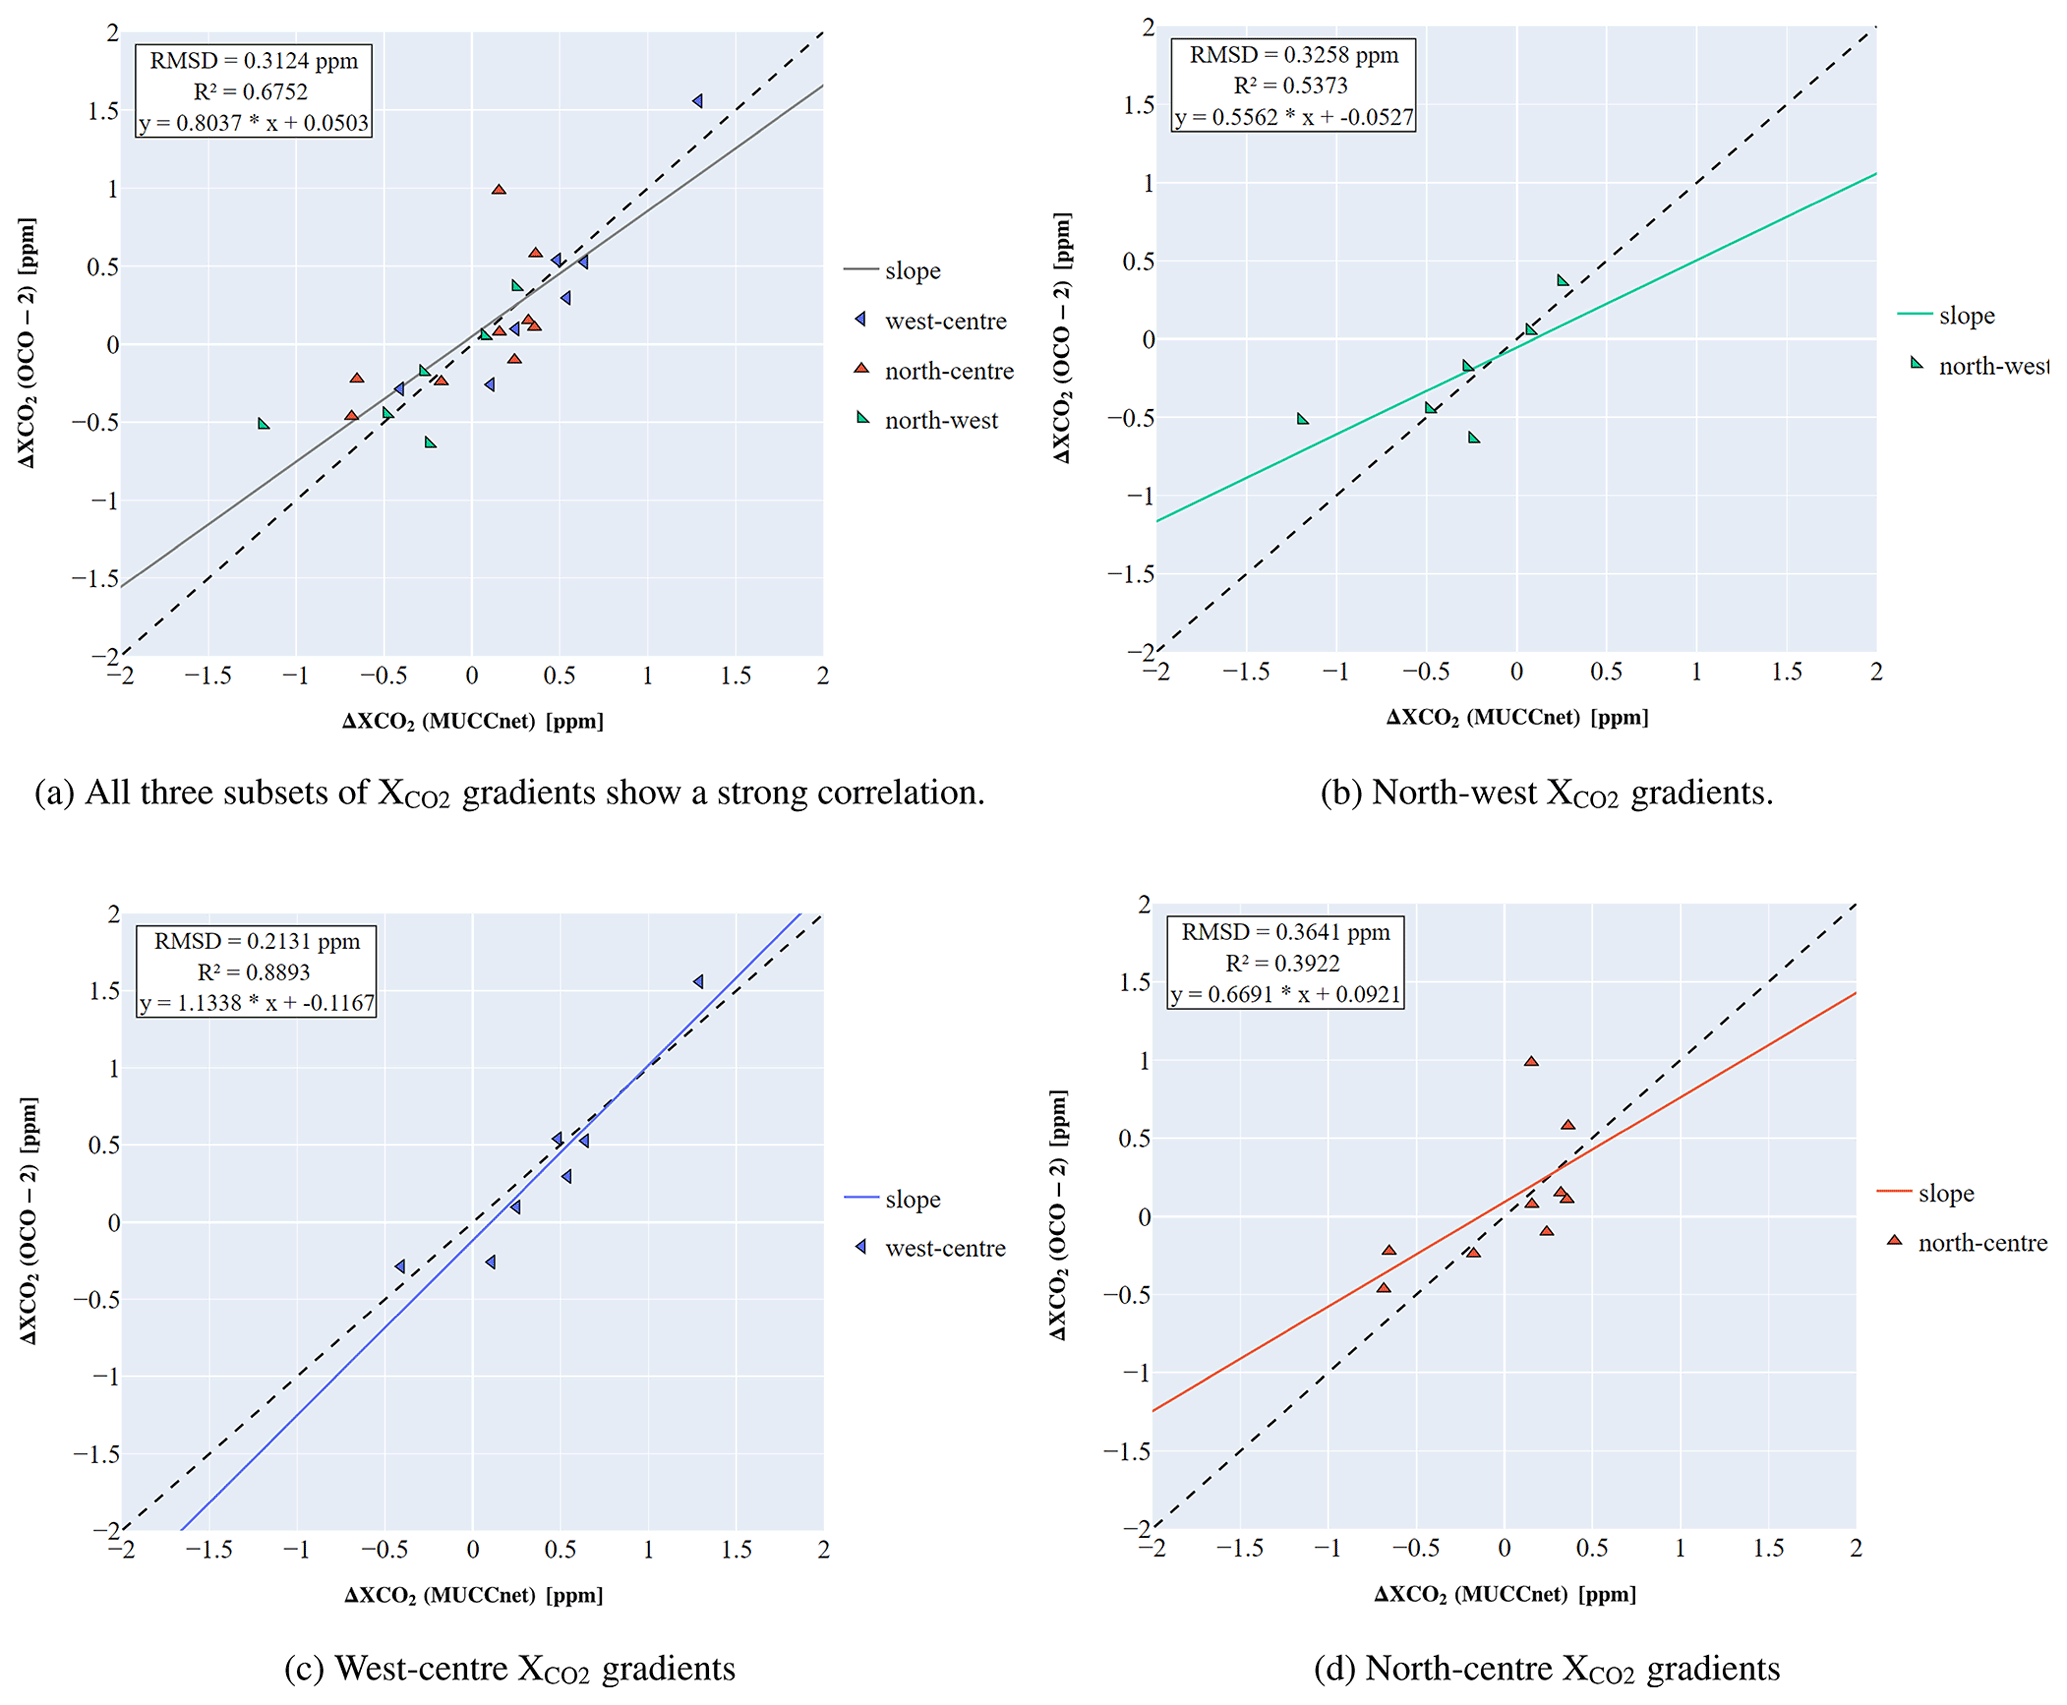
Figure 12Linear regression results of spaceborne and ground-based differences. Depending on the subset of gradients we observe moderate to very strong correlation between ground-based and spaceborne gradients. These differences in agreement are caused by single outliers, which impact the regression results due to the small sample size and low absolute gradients in Munich.
enhancements in Munich are usually in the range from 0.1 to 1.0 ppm during the overpasses featured in this study. This coincides with results of previous urban gradient assessments in Munich published in Dietrich et al. (2021). On average, the MUCCnet instruments measured site-to-site enhancements of 0.42 ppm. These rather low gradients allow us to test the lower detection limits of OCO-2 for resolving small-scale gradients.
Considering the rather small gradients in Munich, OCO-2 detects the elevated in the same domain as MUCCnet for 20 of the 22 computed gradients and therefore qualitatively determines the area of enhanced correctly in 91 % of cases. Furthermore, for 68 % () of the computed gradients, OCO-2 is within a margin of error of just 0.25 ppm when compared to the more precise MUCCnet measurements. For the entire set of gradients OCO-2 achieved an RMSD of 0.31 ppm and a linear correlation with a strong correlation of R2 = 0.68 between OCO-2 and the MUCCnet measurements.
In particular, for west-center gradients (between TUM and Gräfelfing) spaceborne and ground-based gradients are highly correlated ( = 0.89) with RMSD = 0.21 ppm. The spaceborne north-west and north-center gradients have higher RMSDs and are moderately correlated ( = 0.39, = 0.54) with the gradients measured by the MUCCnet spectrometers. For the north-west and north-center differences the RMSD is 0.33 and 0.36 ppm, respectively (compare Fig. 12). Due to the low sample size, the spaceborne gradients captured on 27 July and 12 August 2020 strongly impact the regression results for the north-west and north-center subsets. Here, north-west and north-center differences captured by OCO-2 are off by more than 0.5 ppm. During both overpasses, we observe a higher offset in the northern domain than in the other two domains (see Fig. 10). Due to the low absolute gradients that are captured during our study and the relatively low sample size, single-outlier overpasses have a strong impact on the regression results. Consequently, if we remove both outlier days of 27 July and 12 August, we achieve an overall improved RMSD and strong correlation for all subsets of gradients. These improved results are shown in Fig. B1 in the Appendix B. We expect more robust and definitive results for a larger sample size. It is important to be aware of the measurement context. Generally, we see better agreement in gradients for days with a high yield of good-quality soundings and good measurement conditions.
There is no tendency towards one observational method showing systematically higher or lower gradients than the other. On some days, MUCCnet measured greater enhancements in the suburban sites when compared to the OCO-2 observations, as is the case on 22 April 2020 and 1 March 2021. During the overpasses on 18 December 2020 and 2 February 2021, OCO-2 detected slightly higher gradients than MUCCnet.
The overall strong correlation shows that OCO-2 is capable of detecting similar mean differences as MUCCnet. Even though the spread of the spaceborne measurements in each domain is sometimes larger than the gradient itself, the means in each domain are robust enough to capture the small urban gradients between the domains from space. These results show that OCO-2 target observations capture valuable information about the spatial distribution of within one OCO-2 target field of view. If the measurement conditions are good, OCO-2 target mode can successfully capture urban gradients in Munich. It leads to the conclusion that OCO-2 is capable of detecting intra-urban fluxes and enhancements caused by anthropogenic activities on a sub-city scale. Hence, OCO-2 target observations could find more use in assessing area sources of CO2 from space.
4.4 enhancements on 18 December 2020
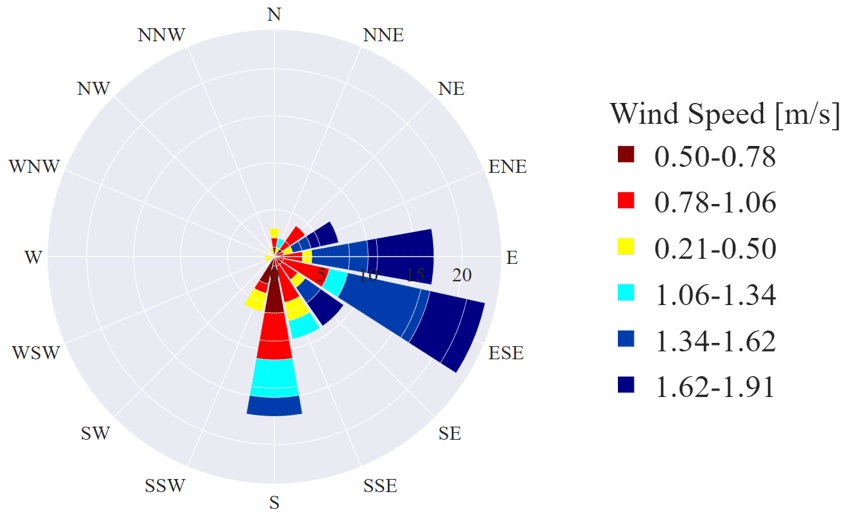
18 December 2020 was the only overpass day on which ground-based center-west enhancements are greater than 1 ppm. During the 1 h overpass collocation time, CO2 retrievals in Gräfelfing () exceeded the mean in the Munich city center by ppm. The center spectrometer measured ppm during the overpass. On this day the collocated OCO-2 is in good agreement with its ground-based counterpart (see Fig. 13). Hence, OCO-2 observes similarly large enhancements of ppm in the west of Munich. enhancements between an upwind and a downwind measurement site are caused by natural and anthropogenic emissions as well as the subsequent atmospheric transport (Chen et al., 2016). We use ERA5 wind data within ±2 h of the overpass time to evaluate which of the measurement sites are positioned downwind and upwind during the overpass. As can be seen in Fig. 14, on 18 December 2020 mostly east and east-southeast winds with relatively low wind speeds of less than 1.91 m s−1 are reported. Thus, convective transport of anthropogenic CO2 emissions in the urban center of Munich towards the west causes enhanced in the western comparison domain. Both ground-based and satellite measurements capture similar enhancements that are higher than usual.

The spatial distribution of in Munich is shown in Fig. 15. The lowest is measured in the southeast and north of Munich with increasingly higher mole fractions in the center. The highest is captured right at the western edge of the target field of view close to the MUCCnet site in Gräfelfing. Here, single soundings reach peak mole fractions of up to 418.6 ppm.
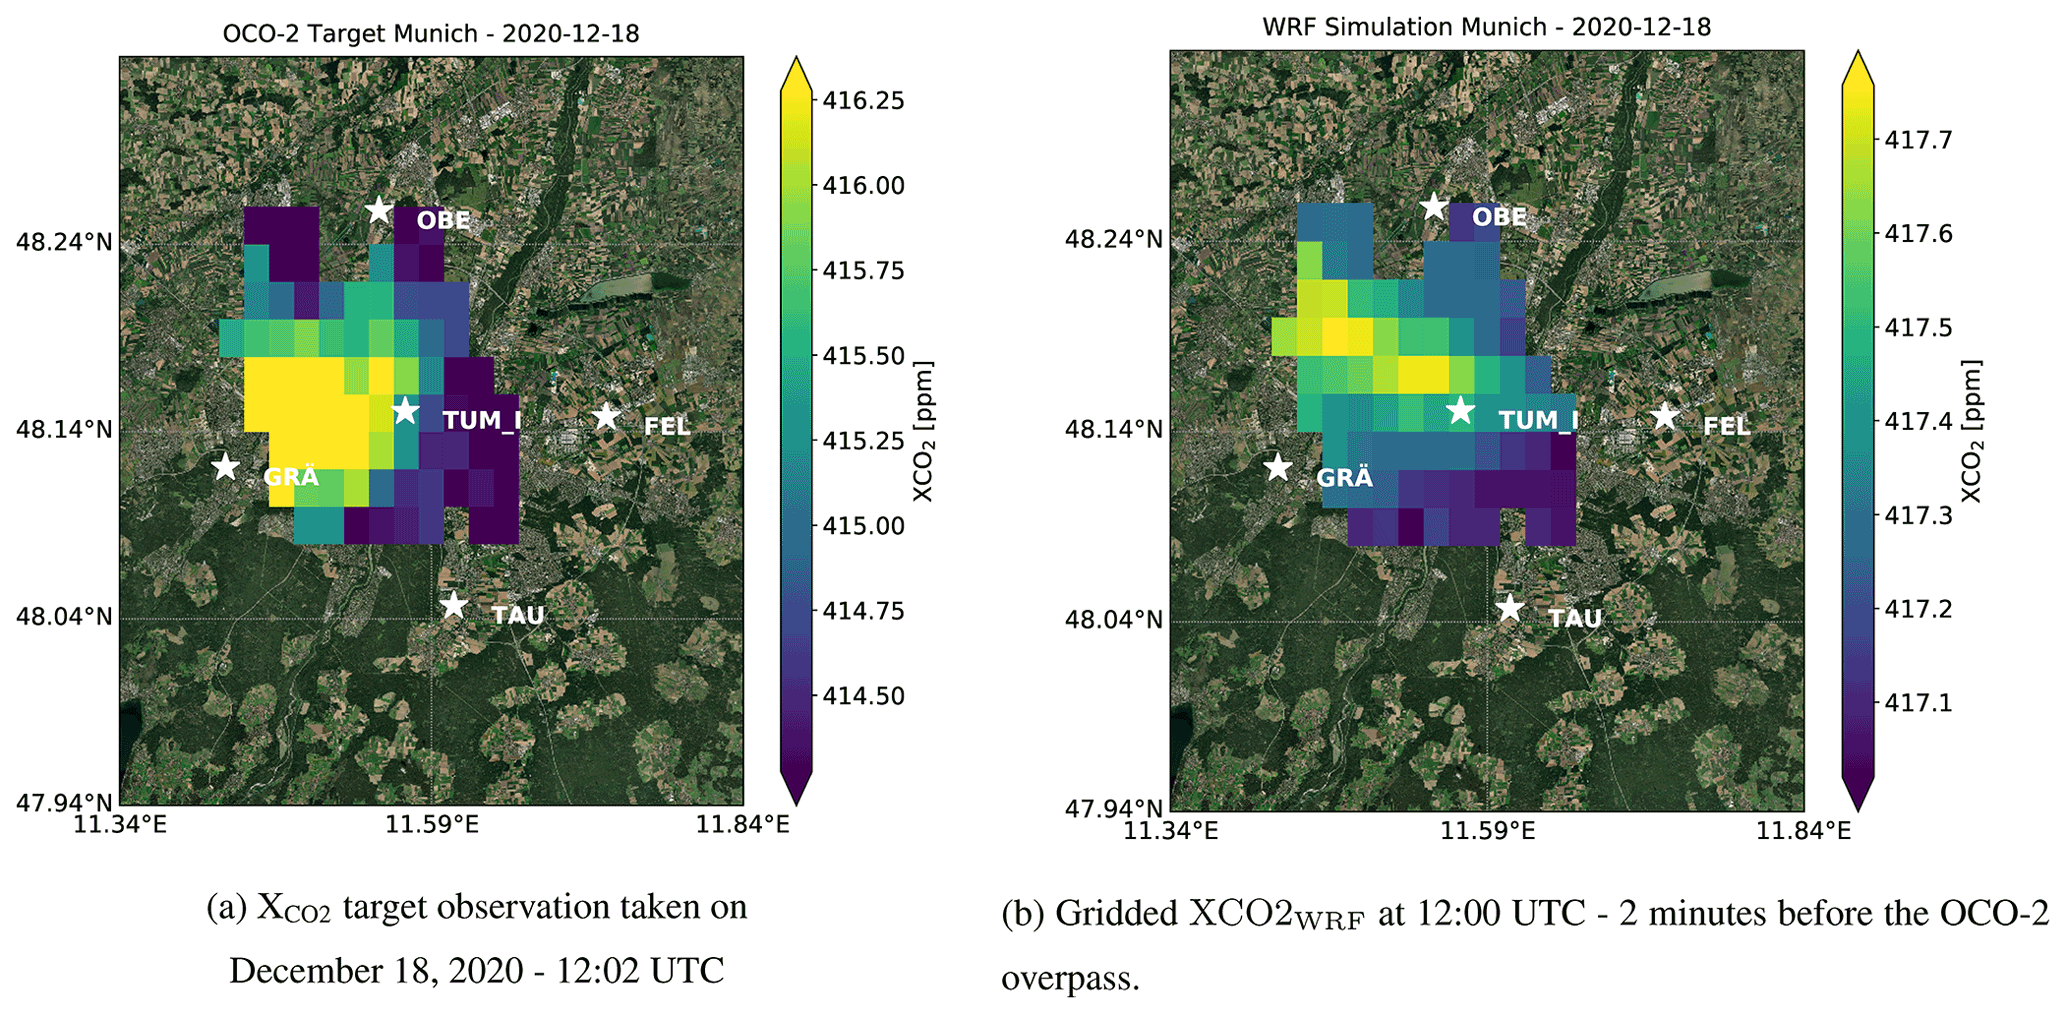
Figure 15Gridded WRF-GHG outputs and OCO-2 target observation for18 December 2020. Enhanced is predominantly captured in the center-west of Munich. Map source: Esri, Maxar, Earthstar Geographics, and the GIS User Community.
A qualitative comparison of the OCO-2 target overpass to the satellite retrievals shows that OCO-2 and the WRF-GHG produce a similar spatial distribution of urban during the overpass. The plots in Fig. 15 show both the captured by OCO-2 (left) and the generated via the WRF model (right). The gridded WRF results have an overall higher mean of ppm, while the satellite retrieves ppm. Nonetheless, both approaches have the highest CO2 mole fractions in the west. A plume-like shape originating in the center of Munich extends westwards. OCO-2 captures a broader spread of in contrast to the more distinct plume shape generated by the WRF-GHG model. The lowest mole fractions are modeled and retrieved in the southeast and northeast. The spread of mole fractions that is captured by OCO-2 is considerably higher than the outputs of the WRF-GHG simulation. We qualitatively compare the differences captured by OCO-2 and MUCCnet to the enhancements of the WRF-GHG simulation. A mismatch in model wind speed and direction causes the area of maximum enhancements to be shifted to the north in the model data (see Fig. 15). The enhancements measured by the satellite and MUCCnet ( = 1.55 ppm and = 1.23 ppm) are higher than the gradients in the WRF-GHG simulation. The plume of the model originating from the southeast shows enhancements of up to around 0.5 ppm in the center of the plume (compare Fig. 15a). The satellite observations resemble the precise retrievals measured by the MUCCnet instruments better than the WRF-GHG model. We assume this underestimation of gradients to be caused by uncertainties in the annual emission inventory and transport uncertainties. Furthermore, the in the target observation is notably higher than on other days, indicating unusually high emissions in Munich on 18 December 2020, which cannot be replicated by a yearly averaged bottom-up emission inventory, while the spatial distribution is reproduced rather accurately. We recognize the potential of spaceborne retrievals to reduce the mentioned uncertainties in the model transport and emission inventories. These results suggest that for high gradients and cloud-free measurement conditions, OCO-2 target observations can be utilized for an accurate assessment of urban and its spatial distribution.
Comparisons between OCO-2 target measurements over Munich, Germany, and ground-based measurements performed by MUCCnet's reference instrument agree well for the analyzed time period with an RMSD value of 0.96 ppm. On all days, OCO-2 appears to be biased high with a mean offset of 0.7 ppm. This bias is similar to comparisons between OCO-2 and the TCCON site in Karlsruhe. In the by-site comparison we find a improved correlation and reduced RMSDs in all three spatially separated comparison domains (center, west, north) due to the smaller collocation area, which reduces the impact of potential spatial gradients in the target field on the validation results.
For the first time, sub-city-scale variations in the OCO-2 target measurements were cross-compared against collocated ground-based gradients captured by multiple MUCCnet sites. Due to the relatively small spatial differences of mostly below 0.5 ppm in Munich we were able to test the lower detection limits for sub-city-scale gradients. Even though OCO-2's proclaimed precision of 1 ppm is larger than most gradients we captured during our study, we found moderate to strong agreement between MUCCnet and OCO-2 gradients as well as root mean square values of 0.21 to 0.36 ppm. For more than 90 % of the captured gradients, OCO-2 was able to detect the correct direction of the gradients. The overall low differences in Munich and the limited number of overpasses featured in this study make it hard to draw more definitive conclusions for now. We expect urban monitoring networks like MUCCnet to play a crucial role in validating spaceborne gradients of wide-swath CO2 monitoring missions in the future. It will be interesting to see how OCO-2 and OCO-3 will perform against similar setups in megacities and larger industrial areas.
Finally, the qualitative comparisons to WRF model data on 18 December 2020 reveal a matching spatial distribution of target and model . Emissions in the city center are transported westwards and cause enhanced close to the western MUCCnet site in Gräfelfing. This points to OCO-2's potential to locate highly potent emission sources and provide valuable insight for future model development.
All things considered, we see the potential of OCO-2 to provide vital information about urban gradients in cities, agglomerated areas, and other potent CO2 emitters around the globe that further improves the understanding of the relevance of anthropogenic urban emissions for our climate. We hope that the measurement of urban gradients from space will be a powerful tool for evaluating urban anthropogenic emission globally. Further comparisons of OCO-2 target observations to ground-based monitoring networks are beneficial to better understand OCO-2's capability to assess point and area sources from space.
Figure A1 shows the daily mean measured by OCO-2 in each comparison domain versus the collocated MUCCnet instrument. In target observations taken on 23 June and 27 July 2020 strong site-to-site differences are visible in the OCO-2 data, while MUCCnet observes little to no differences between its sites. On 12 August and 9 November, the opposite is true and MUCCnet captures higher enhancements than OCO-2.
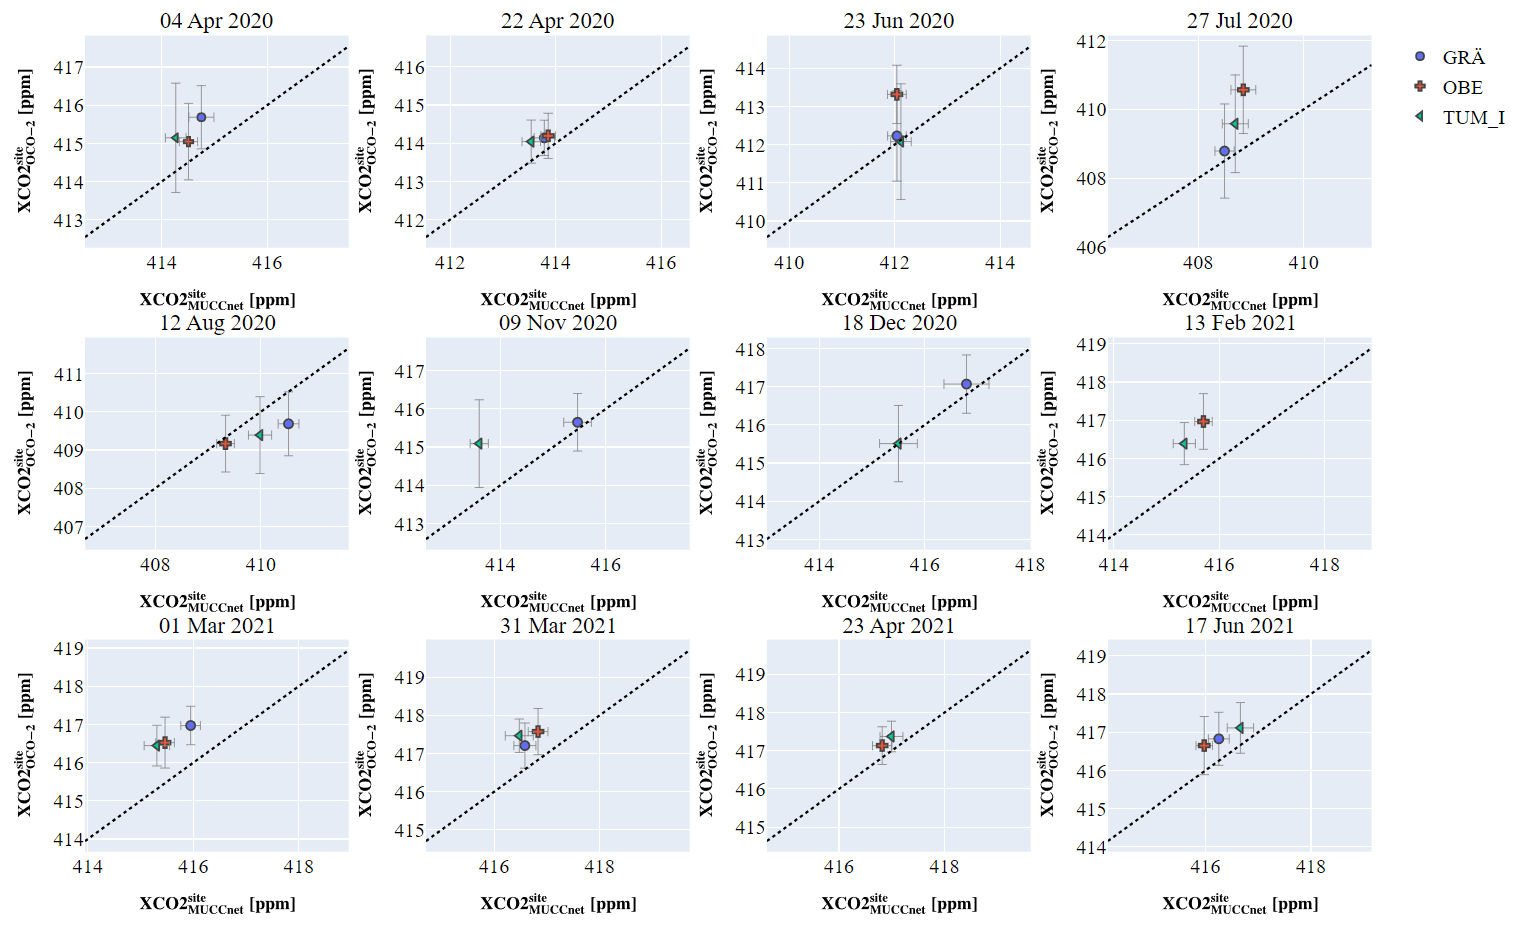
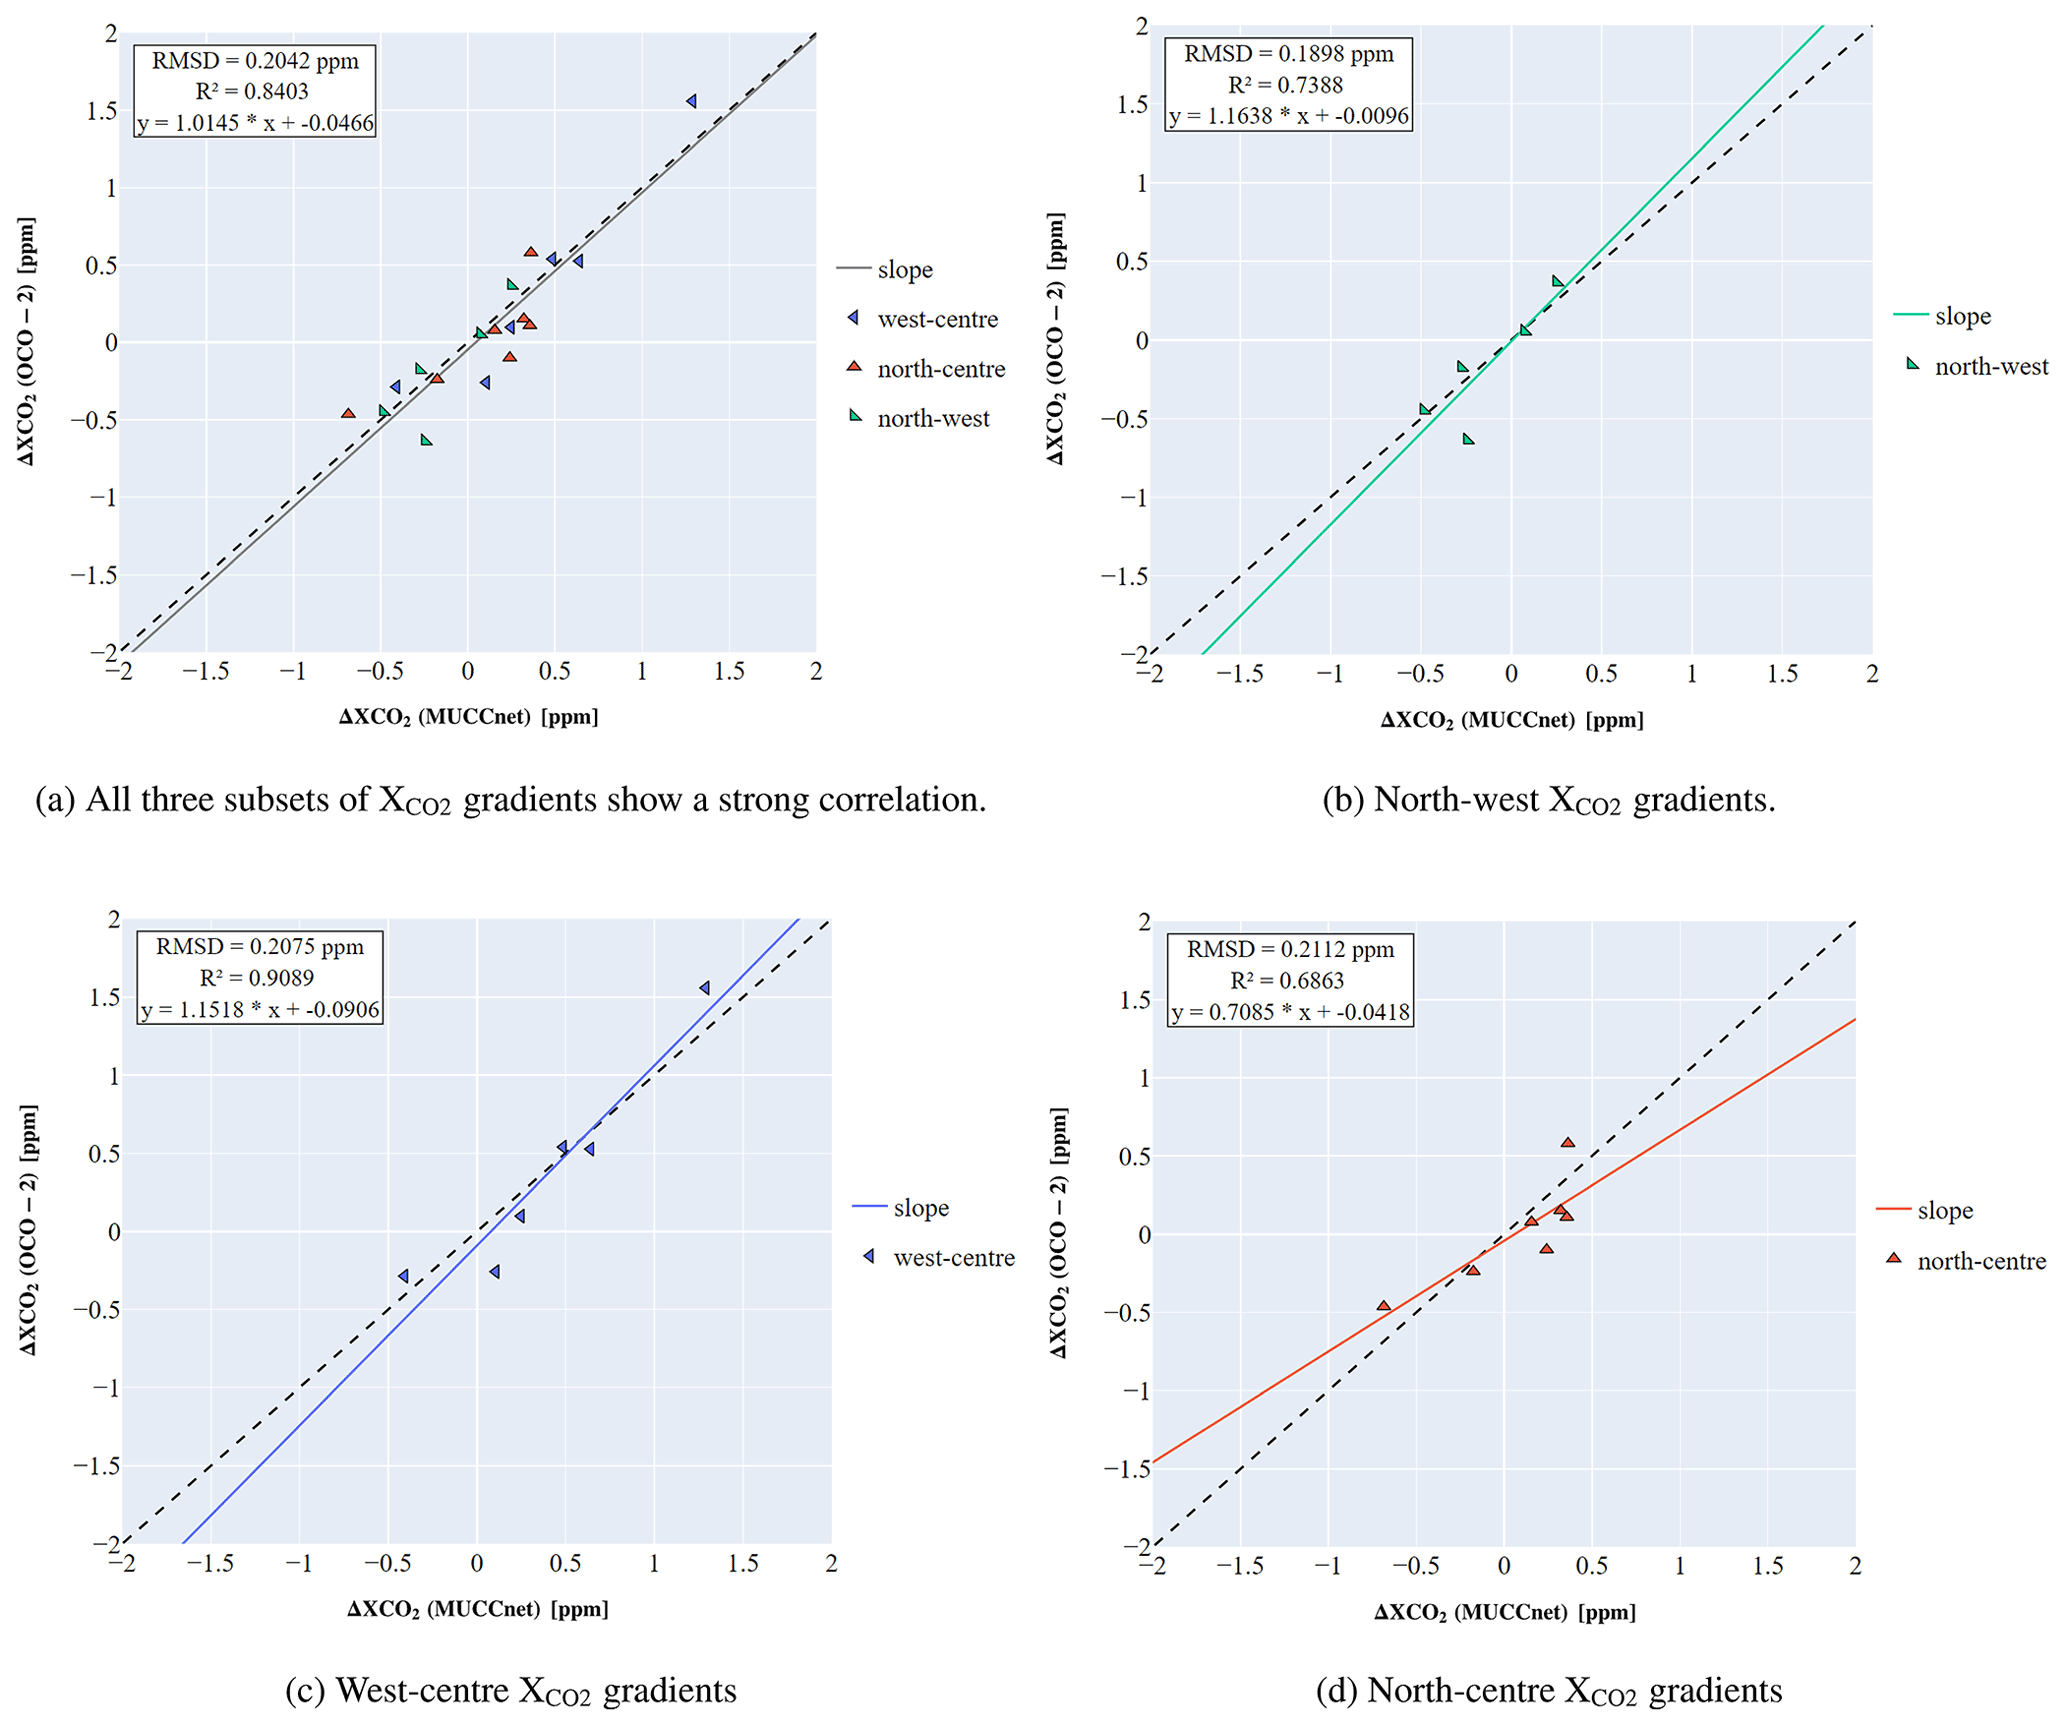
Figure B1Linear regression results of spaceborne and ground-based enhancements when gradients captured on 18 August and 27 June 2020 are removed from the set. When removing overpasses with a high difference in daily by-site offsets, which impedes the correct detection of urban gradients, we obtain a strong to very strong correlation between OCO-2 and MUCCnet gradients.
The following dataset was featured in our studies: https://doi.org/10.5067/E4E140XDMPO2 (OCO-2 Science Team/Michael Gunson, Annmarie Eldering, 2020). All PROFFAST retrieval files and WRF-GHG outputs are stored locally on the ESM cloud server and are available by request. Plots are generated using the Python plotly library.
MR wrote the paper in cooperation with JC. MK, XZ, FD, GO, and FH edited the paper. FD and JC set up the ground-based remote sensing network in Munich (MUCCnet) that provides the EM27/SUN datasets. MK and GO guided the research with their expertise on the OCO ACOSv10 datasets. MK provided up-to-date TCCON comparison results. XZ set up the WRF model framework in Munich and provided us with the WRF-GHG datasets. MM set up and automated the PROFFAST retrieval for all five measurement sites in Munich. MR conducted collocation and validation data processing as well as visualization of our results. FH provided us with valuable information about the PROFFAST retrieval and post-correction. JC, MK, and FD supervised the research.
The contact author has declared that none of the authors has any competing interests.
Publisher's note: Copernicus Publications remains neutral with regard to jurisdictional claims in published maps and institutional affiliations.
We thank Friedrich Klappenbach for his help setting up the PROFFAST retrieval locally for the five EM27/SUN instruments and Franziska Dobler for helping with the WRF-GHG data processing. Special thanks to our colleagues at the Jet Propulsion Laboratory (JPL) and their OCO-2 team for regularly targeting Munich as well as always being supportive and providing researchers with high-quality data and support. We also want to thank the editor of our paper, Joanna Joiner, for her contributions and handling of the review process. Finally, we are grateful to Chris O'Dell and the other reviewers for their valuable contributions that helped us to improve our paper significantly.
This work was supported by the German Research Foundation (DFG) and the Technical University of Munich (TUM) in the framework of the Open Access Publishing Program.
This paper was edited by Joanna Joiner and reviewed by three anonymous referees.
Alberti, C., Hase, F., Frey, M., Dubravica, D., Blumenstock, T., Dehn, A., Castracane, P., Surawicz, G., Harig, R., Baier, B. C., Bès, C., Bi, J., Boesch, H., Butz, A., Cai, Z., Chen, J., Crowell, S. M., Deutscher, N. M., Ene, D., Franklin, J. E., García, O., Griffith, D., Grouiez, B., Grutter, M., Hamdouni, A., Houweling, S., Humpage, N., Jacobs, N., Jeong, S., Joly, L., Jones, N. B., Jouglet, D., Kivi, R., Kleinschek, R., Lopez, M., Medeiros, D. J., Morino, I., Mostafavipak, N., Müller, A., Ohyama, H., Palmer, P. I., Pathakoti, M., Pollard, D. F., Raffalski, U., Ramonet, M., Ramsay, R., Sha, M. K., Shiomi, K., Simpson, W., Stremme, W., Sun, Y., Tanimoto, H., Té, Y., Tsidu, G. M., Velazco, V. A., Vogel, F., Watanabe, M., Wei, C., Wunch, D., Yamasoe, M., Zhang, L., and Orphal, J.: Improved calibration procedures for the EM27/SUN spectrometers of the COllaborative Carbon Column Observing Network (COCCON), Atmos. Meas. Tech., 15, 2433–2463, https://doi.org/10.5194/amt-15-2433-2022, 2022. a, b, c
Beck, V., Koch, T., Kretschmer, R., Marshall, J., Ahmadov, R., Gerbig, C., Pillai, D., and Heimann, M.: The WRF Greenhouse Gas Model (WRF-GHG) Technical Report, Max Planck Institute for Biogeochemistry, Jena, Germany, https://www.bgc-jena.mpg.de/bgc-systems/pmwiki2/uploads/Download/Wrf-ghg/WRF-GHG_Techn_Report.pdf (last access: 31 January 2022), 2011. a
Chen, J., Viatte, C., Hedelius, J. K., Jones, T., Franklin, J. E., Parker, H., Gottlieb, E. W., Wennberg, P. O., Dubey, M. K., and Wofsy, S. C.: Differential column measurements using compact solar-tracking spectrometers, Atmos. Chem. Phys., 16, 8479–8498, https://doi.org/10.5194/acp-16-8479-2016, 2016. a, b, c
Chen, J., Dietrich, F., Forstmaier, A., Bettinelli, J., Maazallahi, H., Schneider, C., Röckmann, T., Winkler, D., Zhao, X., Makowski, M., Klappenbach, F., van der Veen, C., Wildmann, N., Jones, T., Ament, F., Lange, I., Denier van der Gon, H., and Schwietzke, S.: Multi-scale measurements combined with inverse modeling for assessing methane emissions of Hamburg, EGU General Assembly 2022, Vienna, Austria, 23–27 May 2022, EGU22-11548, https://doi.org/10.5194/egusphere-egu22-11548, 2022. a
Crisp, D.: Measuring atmospheric carbon dioxide from space: The GOSAT and OCO-2 missions, Optics InfoBase Conference Papers, 2, jet Propulsion Laboratory/California Institute of Technology, https://doi.org/10.1364/e2.2011.ewc6, 2011. a, b
Dietrich, F., Chen, J., Voggenreiter, B., Aigner, P., Nachtigall, N., and Reger, B.: MUCCnet: Munich Urban Carbon Column network, Atmos. Meas. Tech., 14, 1111–1126, https://doi.org/10.5194/amt-14-1111-2021, 2021. a, b, c, d, e, f
Dubravica, D. and Hase, F.: Technical note on XCO2 bias in current PROFFAST distribution (10.08.2021), Karlsruhe Institute of Technology, p. 1, 2021. a, b
Frey, M. and Gisi, M.: Calibration of the EM27/SUN Instruments, Karlsruhe Institute of Technologies, https://www.imk-asf.kit.edu/downloads/Coccon/2021-04-30_Instrument-Calibration.pdf (last access: 31 January 2022), 2021. a, b, c
Frey, M., Hase, F., Blumenstock, T., Groß, J., Kiel, M., Mengistu Tsidu, G., Schäfer, K., Sha, M. K., and Orphal, J.: Calibration and instrumental line shape characterization of a set of portable FTIR spectrometers for detecting greenhouse gas emissions, Atmos. Meas. Tech., 8, 3047–3057, https://doi.org/10.5194/amt-8-3047-2015, 2015. a, b
Frey, M., Sha, M. K., Hase, F., Kiel, M., Blumenstock, T., Harig, R., Surawicz, G., Deutscher, N. M., Shiomi, K., Franklin, J. E., Bösch, H., Chen, J., Grutter, M., Ohyama, H., Sun, Y., Butz, A., Mengistu Tsidu, G., Ene, D., Wunch, D., Cao, Z., Garcia, O., Ramonet, M., Vogel, F., and Orphal, J.: Building the COllaborative Carbon Column Observing Network (COCCON): long-term stability and ensemble performance of the EM27/SUN Fourier transform spectrometer, Atmos. Meas. Tech., 12, 1513–1530, https://doi.org/10.5194/amt-12-1513-2019, 2019. a, b, c, d, e
Gisi, M., Hase, F., Dohe, S., Blumenstock, T., Simon, A., and Keens, A.: XCO2−measurements with a tabletop FTS using solar absorption spectroscopy, Atmos. Meas. Tech., 5, 2969–2980, https://doi.org/10.5194/amt-5-2969-2012, 2012. a
Gurney, K. R., Romero-Lankao, P., Seto, K. C., Hutyra, L. R., Duren, R., Kennedy, C., Grimm, N. B., Ehleringer, J. R., Marcotullio, P., Hughes, S., Pincetl, S., Chester, M. V., Runfola, D. M., Feddema, J. J., and Sperling, J.: Climate change: Track urban emissions on a human scale, Nature, 525, 179–181, https://doi.org/10.1038/525179a, 2015. a
Hase, F., Hannigan, J., Coffey, M., Goldman, A., Höpfner, M., Jones, N., Rinsland, C., and Wood, S.: Intercomparison of retrieval codes used for the analysis of high-resolution, ground-based FTIR measurements, J. Quant. Spectrosc. Ra., 87, 25–52, https://doi.org/10.1016/j.jqsrt.2003.12.008, 2004. a
Hase, F., Frey, M., Blumenstock, T., Groß, J., Kiel, M., Kohlhepp, R., Mengistu Tsidu, G., Schäfer, K., Sha, M. K., and Orphal, J.: Application of portable FTIR spectrometers for detecting greenhouse gas emissions of the major city Berlin, Atmos. Meas. Tech., 8, 3059–3068, https://doi.org/10.5194/amt-8-3059-2015, 2015. a
Hedelius, J. K., Viatte, C., Wunch, D., Roehl, C. M., Toon, G. C., Chen, J., Jones, T., Wofsy, S. C., Franklin, J. E., Parker, H., Dubey, M. K., and Wennberg, P. O.: Assessment of errors and biases in retrievals of X, XCH4, XCO, and X from a 0.5 cm−1 resolution solar-viewing spectrometer, Atmos. Meas. Tech., 9, 3527–3546, https://doi.org/10.5194/amt-9-3527-2016, 2016. a
Heinle, L. and Chen, J.: Automated enclosure and protection system for compact solar-tracking spectrometers, Atmos. Meas. Tech., 11, 2173–2185, https://doi.org/10.5194/amt-11-2173-2018, 2018. a
Jacobs, N., Simpson, W. R., Wunch, D., O'Dell, C. W., Osterman, G. B., Hase, F., Blumenstock, T., Tu, Q., Frey, M., Dubey, M. K., Parker, H. A., Kivi, R., and Heikkinen, P.: Quality controls, bias, and seasonality of CO2 columns in the boreal forest with Orbiting Carbon Observatory-2, Total Carbon Column Observing Network, and EM27/SUN measurements, Atmos. Meas. Tech., 13, 5033–5063, https://doi.org/10.5194/amt-13-5033-2020, 2020. a
Jones, T. S., Franklin, J. E., Chen, J., Dietrich, F., Hajny, K. D., Paetzold, J. C., Wenzel, A., Gately, C., Gottlieb, E., Parker, H., Dubey, M., Hase, F., Shepson, P. B., Mielke, L. H., and Wofsy, S. C.: Assessing urban methane emissions using column-observing portable Fourier transform infrared (FTIR) spectrometers and a novel Bayesian inversion framework, Atmos. Chem. Phys., 21, 13131–13147, https://doi.org/10.5194/acp-21-13131-2021, 2021. a
Kiel, M.: OCO-2 Science Team Telecon: A six year record of OCO-2 XCO2 measurements, NASA JPL, https://trs.jpl.nasa.gov/bitstream/handle/2014/54929/CL%2321-2020.pdf?sequence=1 (last access: 23 October 2022), 2021. a
Kiel, M., O'Dell, C. W., Fisher, B., Eldering, A., Nassar, R., MacDonald, C. G., and Wennberg, P. O.: How bias correction goes wrong: measurement of affected by erroneous surface pressure estimates, Atmos. Meas. Tech., 12, 2241–2259, https://doi.org/10.5194/amt-12-2241-2019, 2019. a
Kiel, M., Eldering, A., Roten, D. D., Lin, J. C., Feng, S., Lei, R., Lauvaux, T., Oda, T., Roehl, C. M., Blavier, J. F., and Iraci, L. T.: Urban-focused satellite CO2 observations from the Orbiting Carbon Observatory-3: A first look at the Los Angeles megacity, Remote Sens. Environ., 258, https://doi.org/10.1016/j.rse.2021.112314, 2021. a, b, c
Klappenbach, F., Chen, J., Wenzel, A., Forstmaier, A., Dietrich, F., Zhao, X., Jones, T., Franklin, J., Wofsy, S., Frey, M., Hase, F., Hedelius, J., Wennberg, P., Cohen, R., and Fischer, M.: Methane emission estimate using ground based remote sensing in complex terrain, EGU General Assembly 2021, online, 19–30 Apr 2021, EGU21-15406, https://doi.org/10.5194/egusphere-egu21-15406, 2021. a
Luther, A., Kleinschek, R., Scheidweiler, L., Defratyka, S., Stanisavljevic, M., Forstmaier, A., Dandocsi, A., Wolff, S., Dubravica, D., Wildmann, N., Kostinek, J., Jöckel, P., Nickl, A.-L., Klausner, T., Hase, F., Frey, M., Chen, J., Dietrich, F., Nȩcki, J., Swolkień, J., Fix, A., Roiger, A., and Butz, A.: Quantifying CH4 emissions from hard coal mines using mobile sun-viewing Fourier transform spectrometry, Atmos. Meas. Tech., 12, 5217–5230, https://doi.org/10.5194/amt-12-5217-2019, 2019. a
Luther, A., Kostinek, J., Kleinschek, R., Defratyka, S., Stanisavljević, M., Forstmaier, A., Dandocsi, A., Scheidweiler, L., Dubravica, D., Wildmann, N., Hase, F., Frey, M. M., Chen, J., Dietrich, F., Nȩcki, J., Swolkień, J., Knote , C., Vardag, S. N., Roiger, A., and Butz, A.: Observational constraints on methane emissions from Polish coal mines using a ground-based remote sensing network, Atmos. Chem. Phys., 22, 5859–5876, https://doi.org/10.5194/acp-22-5859-2022, 2022. a
Makarova, M. V., Alberti, C., Ionov, D. V., Hase, F., Foka, S. C., Blumenstock, T., Warneke, T., Virolainen, Y. A., Kostsov, V. S., Frey, M., Poberovskii, A. V., Timofeyev, Y. M., Paramonova, N. N., Volkova, K. A., Zaitsev, N. A., Biryukov, E. Y., Osipov, S. I., Makarov, B. K., Polyakov, A. V., Ivakhov, V. M., Imhasin, H. Kh., and Mikhailov, E. F.: Emission Monitoring Mobile Experiment (EMME): an overview and first results of the St. Petersburg megacity campaign 2019, Atmos. Meas. Tech., 14, 1047–1073, https://doi.org/10.5194/amt-14-1047-2021, 2021. a
Montzka, S.: The NOAA Annual Greenhous Gas Index (AGGI), NOAA (National Oceanic and Atmospheric Administration), https://gml.noaa.gov/aggi/aggi.html (last access: 31 January 2022), 2021. a
Nguyen, H., Osterman, G., Wunch, D., O'Dell, C., Mandrake, L., Wennberg, P., Fisher, B., and Castano, R.: A method for colocating satellite data to ground-based data and its application to ACOS-GOSAT and TCCON, Atmos. Meas. Tech., 7, 2631–2644, https://doi.org/10.5194/amt-7-2631-2014, 2014. a
OCO-2 Science Team/Michael Gunson, Annmarie Eldering: OCO-2 Level 2 bias-corrected XCO2 and other select fields from the full-physics retrieval aggregated as daily files, Retrospective processing V10r, Goddard Earth Sciences Data and Information Services Center (GES DISC) [data set], Greenbelt, MD, USA, https://doi.org/10.5067/E4E140XDMPO2, 2020. a, b
O'Dell, C. W., Connor, B., Bösch, H., O'Brien, D., Frankenberg, C., Castano, R., Christi, M., Eldering, D., Fisher, B., Gunson, M., McDuffie, J., Miller, C. E., Natraj, V., Oyafuso, F., Polonsky, I., Smyth, M., Taylor, T., Toon, G. C., Wennberg, P. O., and Wunch, D.: The ACOS CO2 retrieval algorithm – Part 1: Description and validation against synthetic observations, Atmos. Meas. Tech., 5, 99–121, https://doi.org/10.5194/amt-5-99-2012, 2012. a
O'Dell, C. W., Eldering, A., Wennberg, P. O., Crisp, D., Gunson, M. R., Fisher, B., Frankenberg, C., Kiel, M., Lindqvist, H., Mandrake, L., Merrelli, A., Natraj, V., Nelson, R. R., Osterman, G. B., Payne, V. H., Taylor, T. E., Wunch, D., Drouin, B. J., Oyafuso, F., Chang, A., McDuffie, J., Smyth, M., Baker, D. F., Basu, S., Chevallier, F., Crowell, S. M. R., Feng, L., Palmer, P. I., Dubey, M., García, O. E., Griffith, D. W. T., Hase, F., Iraci, L. T., Kivi, R., Morino, I., Notholt, J., Ohyama, H., Petri, C., Roehl, C. M., Sha, M. K., Strong, K., Sussmann, R., Te, Y., Uchino, O., and Velazco, V. A.: Improved retrievals of carbon dioxide from Orbiting Carbon Observatory-2 with the version 8 ACOS algorithm, Atmos. Meas. Tech., 11, 6539–6576, https://doi.org/10.5194/amt-11-6539-2018, 2018. a
Osterman, G., ODell, C., Eldering, A., Fisher, B., Crisp, D., Cheng, C., Frankenberg, C., Lambert, A., Gunson, M. R., Mandrake, L., and Wunch, D.: Orbiting Carbon Observatory-2 and 3 (OCO-2 and OCO-3): Data Product Users Guide, Operational Level 2 Data Versions 10 and Lite File Version 10 and VEarly, 3, NASA JPL, https://docserver.gesdisc.eosdis.nasa.gov/public/project/OCO/OCO2_OCO3_B10_DUG.pdf (last access: 23 October 2022), 2020. a, b, c, d
Osterman, G. B., Eldering, A., Mandrake, L., O'Dell, C., Wunch, D., Wennberg, P. O., Fisher, B., and Marchetti, Y.: OCO-2 XCO2 V8r Lite Products, Warn Levels, and Bias Correction, 2, NASA JPL, https://docserver.gesdisc.eosdis.nasa.gov/public/project/OCO/OCO2_XCO2_Lite_Files_and_Bias_Correction.pdf (last access: 30 September 2021), 2017. a
Park, C., Jeong, S., Park, H., Yun, J., and Liu, J.: Evaluation of the Potential Use of Satellite-Derived XCO2 in Detecting CO2 Enhancement in Megacities with Limited Ground Observations: A Case Study in Seoul Using Orbiting Carbon Observatory-2, Asia-Pac. J. Atmos. Sci., 57, 289–299, https://doi.org/10.1007/s13143-020-00202-5, 2021. a
Sha, M. K., De Mazière, M., Notholt, J., Blumenstock, T., Chen, H., Dehn, A., Griffith, D. W. T., Hase, F., Heikkinen, P., Hermans, C., Hoffmann, A., Huebner, M., Jones, N., Kivi, R., Langerock, B., Petri, C., Scolas, F., Tu, Q., and Weidmann, D.: Intercomparison of low- and high-resolution infrared spectrometers for ground-based solar remote sensing measurements of total column concentrations of CO2, CH4, and CO, Atmos. Meas. Tech., 13, 4791–4839, https://doi.org/10.5194/amt-13-4791-2020, 2020. a
Shekhar, A., Chen, J., Paetzold, J. C., Dietrich, F., Zhao, X., Bhattacharjee, S., Ruisinger, V., and Wofsy, S. C.: Anthropogenic CO2 emissions assessment of Nile Delta using XCO2 and SIF data from OCO-2 satellite, Environ. Res. Lett., 15, 095010, https://doi.org/10.1088/1748-9326/ab9cfe, 2020. a
IPCC: Climate Change and Land: an IPCC special report on climate change, desertification, land degradation, sustainable land management, food security, and greenhouse gas fluxes in terrestrial ecosystems, edited by: Shukla, P. R., Skea, J., Calvo Buendia, E., Masson-Delmotte, V., Pörtner, H.-O., Roberts, D. C., Zhai, P., Slade, R., Connors, S., van Diemen, R., Ferrat, M., Haughey, E., Luz, S., Neogi, S., Pathak, M., Petzold, J. Portugal Pereira, J., Vyas, P., Huntley, E., Kissick, K., Belkacemi, M., and Malley, J., IPCC, https://www.ipcc.ch/site/assets/uploads/2019/11/SRCCL-Full-Report-Compiled-191128.pdf (last access: 23 October 2022), 2019. a
Super, I., Dellaert, S. N. C., Visschedijk, A. J. H., and Denier van der Gon, H. A. C.: Uncertainty analysis of a European high-resolution emission inventory of CO2 and CO to support inverse modelling and network design, Atmos. Chem. Phys., 20, 1795–1816, https://doi.org/10.5194/acp-20-1795-2020, 2020. a
Wu, C. and Yu, J. Z.: Evaluation of linear regression techniques for atmospheric applications: the importance of appropriate weighting, Atmos. Meas. Tech., 11, 1233–1250, https://doi.org/10.5194/amt-11-1233-2018, 2018. a
Wu, D., Lin, J. C., Fasoli, B., Oda, T., Ye, X., Lauvaux, T., Yang, E. G., and Kort, E. A.: A Lagrangian approach towards extracting signals of urban CO2 emissions from satellite observations of atmospheric column CO2 (XCO2): X-Stochastic Time-Inverted Lagrangian Transport model (“X-STILT v1”), Geosci. Model Dev., 11, 4843–4871, https://doi.org/10.5194/gmd-11-4843-2018, 2018. a
Wu, L., Broquet, G., Ciais, P., Bellassen, V., Vogel, F., Chevallier, F., Xueref-Remy, I., and Wang, Y.: What would dense atmospheric observation networks bring to the quantification of city CO2 emissions?, Atmos. Chem. Phys., 16, 7743–7771, https://doi.org/10.5194/acp-16-7743-2016, 2016. a
Wunch, D., Toon, G. C., Blavier, J.-F. L., Washenfelder, R. A., Notholt, J., Connor, B. J., Griffith, D. W. T., Sherlock, V., and Wennberg, P. O.: The Total Carbon Column Observing Network, Philos. T. R. Soc. A, 369, 2087–2112, https://doi.org/10.1098/rsta.2010.0240, 2011. a, b, c
Wunch, D., Wennberg, P. O., Osterman, G., Fisher, B., Naylor, B., Roehl, C. M., O'Dell, C., Mandrake, L., Viatte, C., Kiel, M., Griffith, D. W. T., Deutscher, N. M., Velazco, V. A., Notholt, J., Warneke, T., Petri, C., De Maziere, M., Sha, M. K., Sussmann, R., Rettinger, M., Pollard, D., Robinson, J., Morino, I., Uchino, O., Hase, F., Blumenstock, T., Feist, D. G., Arnold, S. G., Strong, K., Mendonca, J., Kivi, R., Heikkinen, P., Iraci, L., Podolske, J., Hillyard, P. W., Kawakami, S., Dubey, M. K., Parker, H. A., Sepulveda, E., García, O. E., Te, Y., Jeseck, P., Gunson, M. R., Crisp, D., and Eldering, A.: Comparisons of the Orbiting Carbon Observatory-2 (OCO-2) measurements with TCCON, Atmos. Meas. Tech., 10, 2209–2238, https://doi.org/10.5194/amt-10-2209-2017, 2017. a, b
York, D., Evensen, N. M., Martinez, M. L., and Delgado, J. D. B.: Unified equations for the slope, intercept, and standard errors of the best straight line, Am. J. Phys., 72, 367–375, https://doi.org/10.1119/1.1632486, 2004. a
Young, C. R.: User Manual: Model 61302 Barometric Pressure Sensor, The Intergovernmental Panel on Climate Change (IPCC), 2801 Aero Park Drive, Traverse City, Michigan 49686 USA, 2009. a
Zhao, X., Chen, J., Marshall, J., Galkowski, M., Gerbig, C., Hachinger, S., Dietrich, F., Lan, L., Knote, C., and Denier van der Gon, H.: A semi-operational near-real-time Modelling Infrastructure for assessing GHG emissions in Munich using WRF-GHG, EGU General Assembly 2020, Online, 4–8 May 2020, EGU2020-13164, https://doi.org/10.5194/egusphere-egu2020-13164, 2020a. a
Zhao, X., Chen, J., Marshall, J., Galkowski, M., Gerbig, C., Hachinger, S., Dietrich, F., Lan, L., Knote, C., and Denier van der Gon, H.: A semi-operational near-real-time Modelling Infrastructure for assessing GHG emissions in Munich using WRF-GHG, EGU General Assembly 2020, Online, 4–8 May 2020, EGU2020-13164, https://doi.org/10.5194/egusphere-egu2020-13164, 2020b. a