the Creative Commons Attribution 4.0 License.
the Creative Commons Attribution 4.0 License.
 | 18 Nov 2022
Radio frequency interference detection and mitigation in the DWD C-band weather radar network
Maximilian Schaper
Michael Frech
David Michaelis
Cornelius Hald
Benjamin Rohrdantz
C-band weather radar data are commonly compromised by interference from external sources even though weather radars are the primary and therefore privileged user of this frequency band. This is also the case for the radar network of the German Meteorological Service (Deutscher Wetterdienst, DWD). Theoretically, dynamic frequency selection (DFS) by devices operating in the C band should prevent any disturbance of the primary user. In practice, this does not always work as intended under the current regulations. As it is not possible to separate a superimposed interference signal from measured weather radar data, the protection of the frequency band is of utmost importance. Currently, the only available option is to discard the compromised portions of the radar data. Therefore, the current best course of action is to shut down radio frequency interference (RFI) sources as quickly as possible. The automated RFI detection algorithm for the German C-band weather radar network, operational since July 2017, makes use of routinely measured radar moments. Built upon data gathered since 2017, an RFI classification with respect to the severity and duration of RFI sources was first implemented in 2019. An independent verification of the RFI detection algorithm was performed by using a commercially available Wi-Fi adapter, which is directly integrated into the radar receiver. Subsequently, a mitigation workflow was implemented to efficiently identify and shut down detected RFI sources by the German Federal Network Agency (Bundesnetzagentur, BNetzA). By following this workflow with great effort, the number of persistent RFI sources has been decreasing since October 2019, while a steady increase in short-lived RFI sources over the last 5 years also exists. In total, 11 889 RFI sources have been identified from July 2017 to May 2022. Most of these (94.8 %) are such short-lived sources that an unambiguous identification by the BNetzA is, in general, not feasible. However, as stated by the C-band regulations, any non-compliant transmitter compromising the operation of a weather radar has to be shut down. This is important, as even these short-lived RFI sources negatively affect meteorological product generation.
- Article
(8269 KB) - Full-text XML
- BibTeX
- EndNote


Data obtained by weather radars are a crucial element in today's forecasting and nowcasting tools (e.g. Besic et al., 2016; Steinert et al., 2021). Nowcasting applications and the analysis of local phenomena depend upon the high temporal and spatial resolution provided by weather radars. Many forecast models assimilate radar data, successfully improving their prediction skills. The spatial distribution of the precipitation amount, which is an essential element for a wide range of hydrological services, is only available if radar data are available. As such, the 17 operational C-band weather radars are a crucial part of the observation network operated by the German Meteorological Service (Deutscher Wetterdienst, DWD; Frech et al., 2013). Data gathered by weather radars have to be available at all times and satisfy strict quality criteria (Frech, 2013; Frech et al., 2017).
Weather radars are the primary and therefore privileged user of the 5600–5650 MHz frequency range of the C band in Germany and other countries (ETSI, 2012). A primary user must not be disturbed by other devices operating in this frequency band. The World Radiocommunication Conference in 2003 allowed Wi-Fi in the C band if a dynamic frequency selection (DFS) is implemented (ITU-R, 2003). In this paper, so-called Wi-Fi networks include radio local area networks (RLAN), wireless local area networks (WLAN) and wireless access systems (WAS) in the 5 GHz range. It was believed that a coexistence between weather radars and Wi-Fi devices would be possible. However, if a user checks, e.g. a current European weather radar composite, most of the time there will be regions with typical line-shaped reflectivity signals, which most commonly originate from Wi-Fi networks operating in the C band (Huuskonen et al., 2014). Weather radars are increasingly compromised by these active radio frequency interference (RFI) sources, which clearly indicates that the intended coexistence in the C band does not always work (Saltikoff et al., 2016; Palmer et al., 2021). The reason for this is often non-compliant devices on the market that do not have a properly working DFS, while in some cases the DFS is disabled entirely (ECC, 2014). It is the task of the national regulation agencies (NRAs) to enforce the proper coexistence. The German Federal Network Agency (BNetzA) acts upon an RFI source that is being actively reported. A field team is dispatched by the NRA to identify the RFI source, which in our case is done in close collaboration with the DWD radar team. The RFI source will be shut down by the NRA as soon as it has been identified by their field team, mitigating any further interference caused to the radar. A more detailed aggregation of the regulatory history and interference situation all over the world can be found in Saltikoff et al. (2016).
The efficient and objective detection and removal of external radio frequency (RF) transmitters that disturb radar data is an ongoing and time-consuming challenge (see also Saltikoff et al., 2016; Huuskonen et al., 2014; Carroll et al., 2010). The removal of an RFI source is essential because the raw meteorological information gets masked by an external interference and can not be properly recovered. This is especially true for quantitative products derived by fully automatic algorithms. At present there is no algorithm available that can separate the meteorological signal from a superimposed RFI signal in the raw radar data (IQ data) on the radar signal processor. On the other hand, algorithms to identify RFI signatures in the derived radar moments do exist and are in most cases somewhat able to increase data quality by applying strict filter methods (e.g. Cho, 2017; Peura, 2002).
This paper introduces the RFI detection algorithm developed and used by DWD to prioritise and mitigate as many RFI cases as possible. The algorithm utilises thresholds to determine if a specific ray is contaminated by an RFI and groups such contaminated rays in order to recognise RFI sources. The presented RFI detection algorithm is then verified by using a so-called “RHunt”, which is based on a commercially available Wi-Fi adapter (see Sect. 3). To make the verification as similar as possible to the operational weather radar measurement, the actual radar antenna is connected to the Wi-Fi adapter during measurements. By using the independent Wi-Fi adapter, this method provides a reference data set of potential RFI sources that operate at C band within view of the radar. The resulting RHunt data is then compared to automatically detected RFI sources based on actual weather radar data.
Section 2 describes the RFI detection algorithm which is used to identify and categorise RFI sources in the radar data to efficiently support the RFI mitigation process. These identified RFI sources are reported to the German NRA (BNetzA). In collaboration with DWD, a team of NRA technicians use the provided information to efficiently identify and shut down the RFI sources. This is still a time-consuming process, since an RFI source has to be identified unambiguously by measurements of the NRA field team before it can be shut down.
In addition to the RFI detection algorithm, we also provide an analysis into the number, frequency and severity of detected RFI sources encountered since July 2017 when the monitoring of RFI sources was operationally implemented for the German radar network (see Sect. 4). In the conclusion, we summarise the main outcome and provide an outlook on future steps.
Reliably identifying RFI sources within the radar data is the first step to getting rid of this impairment of data quality. Until 2019, the task of RFI identification and reporting was done by radar data users and customers. If an RFI had caused enough problems for a meteorological product it had to be reported manually. This required the users to identify the source of the problem as external interference and qualify the resulting impairment of the specific product subjectively by eye. As the data quality of raw measurements gained more weight, an automated and objective procedure was required. Therefore, the now operationally used RFI detection algorithm was developed, while also keeping the established procedure for users and customers to independently report RFI sources.
To identify interference within the radar data, we use the signal quality index (SQI) and normalised standard deviation of the received power (STD). This follows the approach used in the weather radar signal processor ENIGMA developed by GAMIC to identify interference in radar data (latest model GAMIC, 2022). SQI effectively quantifies the coherence of the received signal with the transmitted pulse and thereby indicates if the received signal originated from the transmitted radar pulse or from an external transmitter. STD is the normalised standard deviation of received power in a batch of pulses that are aggregated into the same ray. Typically, about 50 pulses are aggregated within one ray for each range gate (ray azimuthal width is 1∘). STD is evaluated in real time by the GAMIC signal processor for each range bin. Using a similar kind of measurement technique to detect interference has also been suggested by other studies (e.g. Rojas et al., 2012; Keränen et al., 2013; Cho, 2017). A large STD is indicative of a rapidly varying signal power, which can be related to pulsed communication signals from an external source. STD is low if there are only small continuous variations in signal power between received radar pulses.
A large STD and a small SQI in combination are indicative of an external Wi-Fi interference. When an external Wi-Fi is present, either a specific ray or a full sector of multiple rays may be disturbed by a single RFI source (see also Saltikoff et al., 2016). This depends on how the radar is picking up the Wi-Fi signal, which can either happen through the radar main lobe or even through sidelobes in cases with strong interference (see also Sect. 3.2). As a consequence, close or high-powered RFI sources most likely contaminate an entire sector rather than a single ray.
Figure 1 shows an example of compromised operational weather radar data including precipitation. It contains four PPIs from the same 0.5∘ elevation sweep. The sweep was taken at the DWD radar site at Isen (ISN) on 15 March 2022. In Fig. 1a uncorrected reflectivity (UZ) is shown, which is derived from the received power without applying a clutter filter or thresholding. One can clearly see the meteorological signals with a UZ of over 10 dB in Fig. 1a, an SQI greater than 0.6 (Fig. 1c) and a low STD of 0.3–0.5 (Fig. 1d). Dark red spots in UZ and pink speckle in STD south of the radar site are caused by a mountain range as ISN is located just north of the Alps. The sector in the southeast marked with black lines contains several RFI signatures. These RFI signatures are most visible in the STD (Fig. 1d) as linear structures. Looking at UZ (Fig. 1a) as well as the signal-to-noise ratio (SNR) (Fig. 1b) one can see that the signal strength for both the RFI and meteorological signal are on the same order of magnitude in the outer regions. Meanwhile, close to the radar site, the meteorological signal (up to 40 dB in strength) dominates over the external interference signal. One can also identify a localised decrease in SQI due to the RFI sources for a few rays, which overlaps with the effect of the staggering.
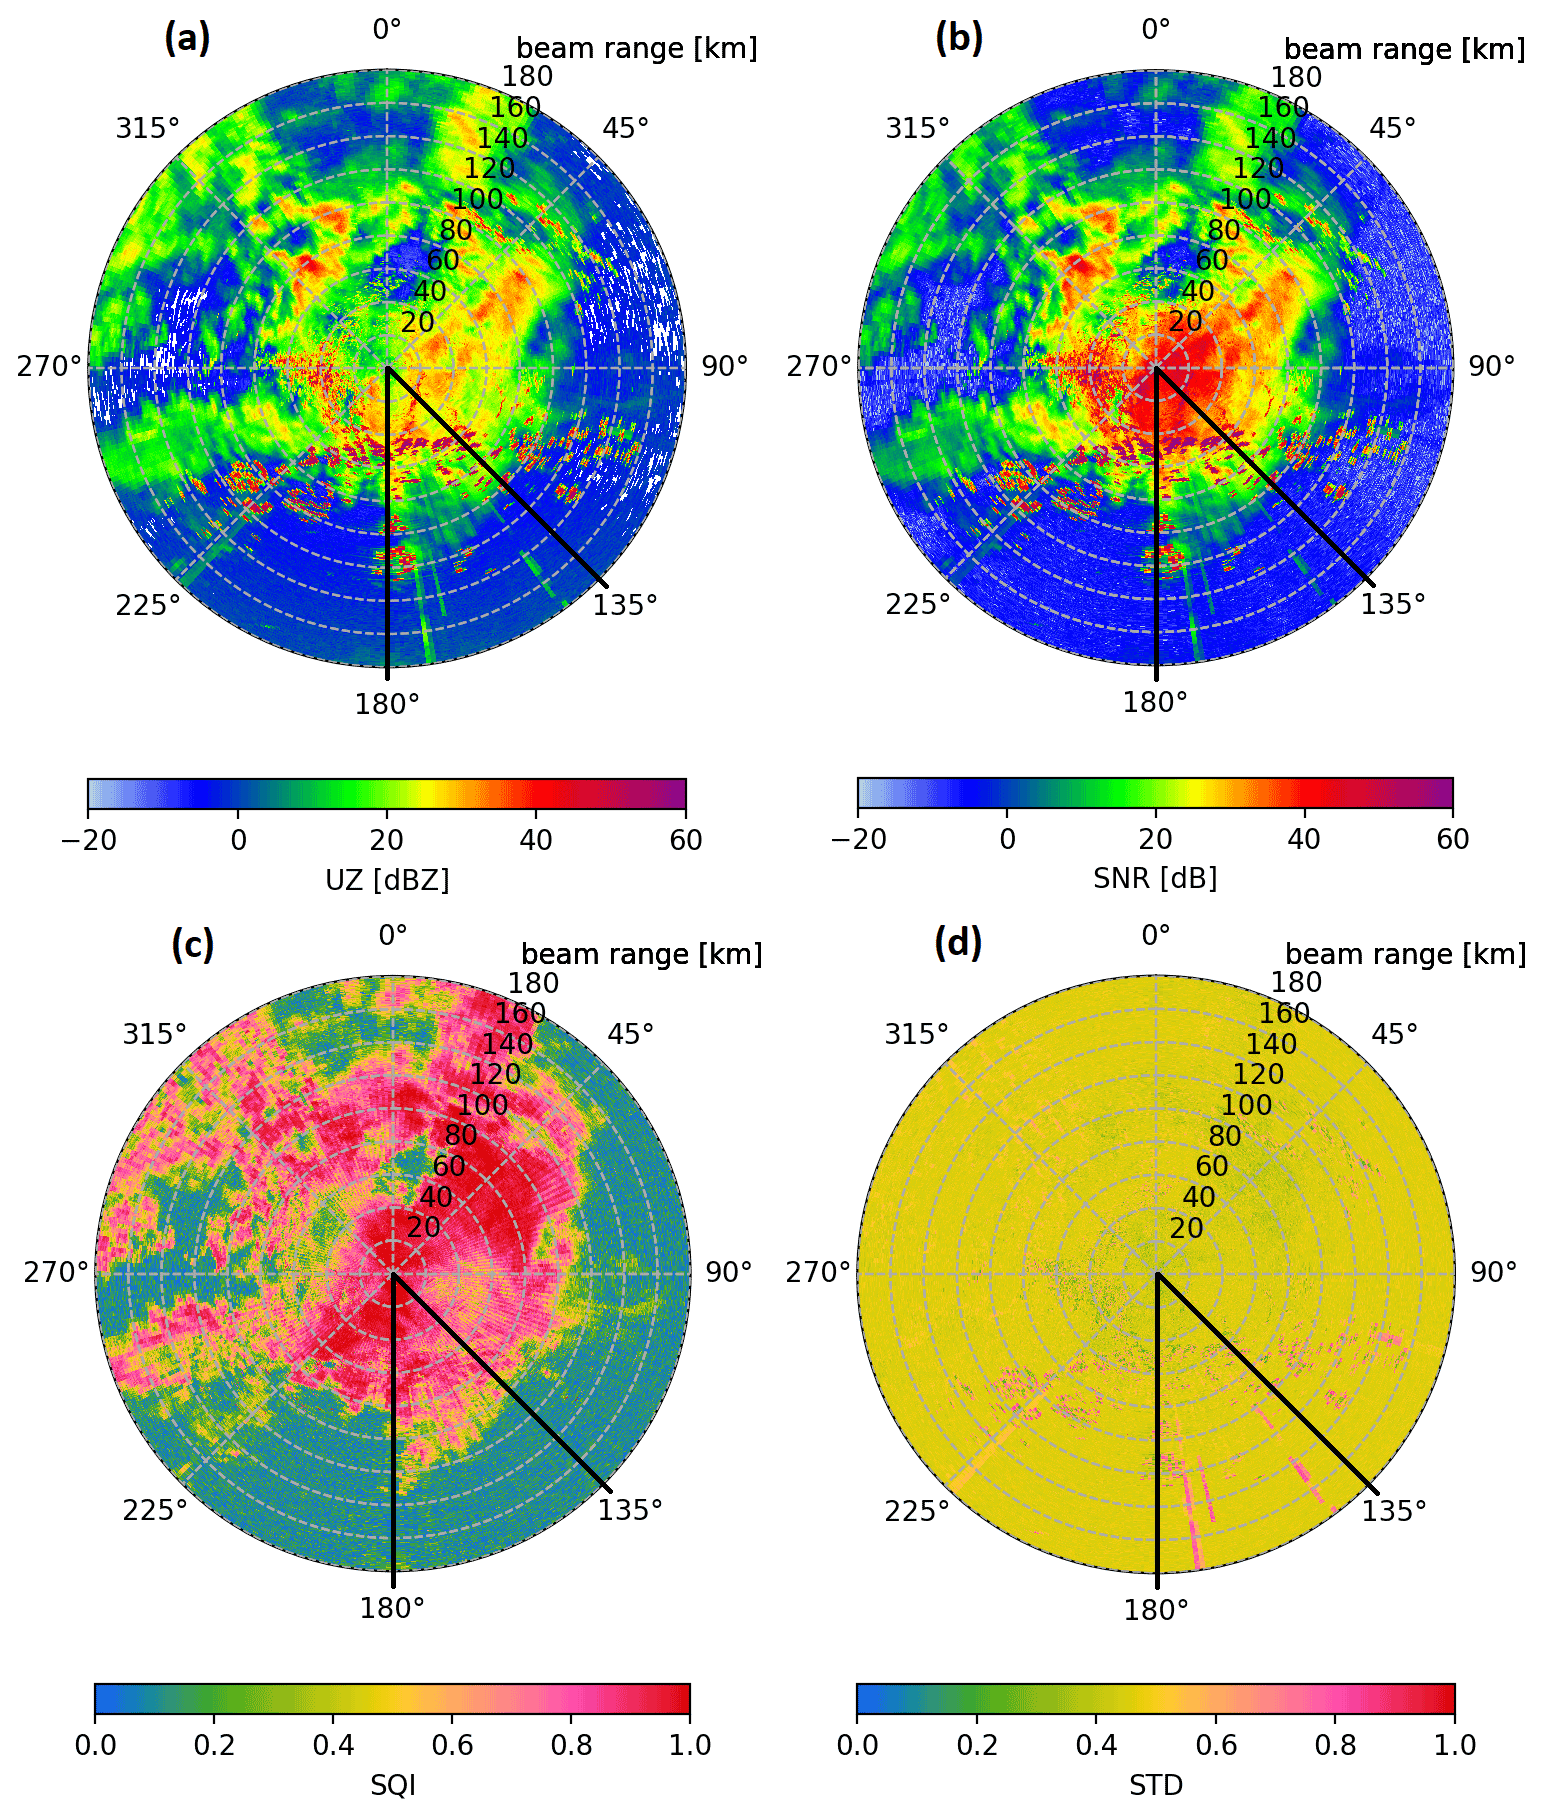
Figure 1Example PPIs from radar site at Isen of the 0.5∘ volume sweep on 15 March 2022 at 15:32 UTC. Shown are uncorrected reflectivity (UZ), signal-to-noise ratio (SNR), signal quality index (SQI) and pulse-based normalised standard deviation (STD). Within the azimuth section from 135 to 180∘ (marked by the black lines) multiple linear signatures caused by external interference can be seen in panels (a), (b) and (d). The effect of another weaker inference can be seen near 225∘.
To objectively identify if a ray is “disturbed” (containing interference from an external source) threshold values were chosen to characterise each ray. Using the above-mentioned radar moments, a ray is identified as disturbed if mean SQI is below 0.6 and mean STD is greater 0.6 over all range bins of the individual ray. These disturbed rays are collected and grouped to identify RFI sources, which are then reported to the NRA. Section 2.1 outlines the RFI detection algorithm, while further technical details of the algorithm can be found in Appendix A. Section 2.2 describes the information resulting from the RFI detection algorithm.
2.1 Processing disturbed rays to detect RFI sources
The first step to detect RFI sources is the identification of disturbed rays. As mentioned before, we identify a ray as disturbed (containing interference from an external source) if mean SQI is below 0.6 and mean STD is greater 0.6 over all range bins of the individual ray, which builds upon the interference detection of the GAMIC signal processor (latest model GAMIC, 2022). The identification of disturbed rays is carried out for the precipitation scan (DWD's terrain-following scan, dedicated to precipitation estimation) and the lowest three elevations of the volume scan (0.5, 1.5 and 2.5∘). Every 5 min, when one full scan cycle finishes, this identification is executed at each radar site. Hereby, all of the following parameters are stored for each ray, satisfying the described criteria: timestamp, azimuth, elevation, SQI, STD and SNR.
An aggregation of disturbed rays is then transferred to a central processing site, where they are evaluated once a day for all radar sites of the DWD radar network. Each site is evaluated individually. The main focuses of the mitigation process are the persistent RFI sources that potentially have the strongest impact on data quality and also have the highest chance to be successfully identified and removed by the NRA. To process the data, the following five steps are carried out (further technical details can be found in Sect. A).
-
Preparing the data. All disturbed rays within the last 30 d are collected.
-
Combining disturbed rays. Collected rays are grouped into small “RFI ray boxes” by proximity in time and azimuth for each radar site. Such an RFI box is defined by an upper and lower boundary in azimuth and a specific start and end time resulting from the outermost disturbed rays captured in the box. At this stage only disturbed rays in close proximity are grouped together, resulting in these initial RFI ray boxes.
-
Joining RFI boxes. The small RFI ray boxes are further joined in azimuth and time using an iterative process.
-
Characterising final RFI boxes. Final RFI boxes are classified and categorised (described in detail below).
-
Result visualisation and aggregation. The final RFI boxes each contain detailed information relating to a single RFI source. A scatter plot for the entire 30 d period is created for each radar site. It contains a dot for each disturbed ray, and relevant final RFI boxes are shown in red (see Fig. 3). In addition, an HTML table is generated containing detailed information about all relevant RFI sources for all sites. The table includes the characteristics of relevant RFI sources and the current processing status regarding their removal.
Table 1Three classifications that are used to describe an RFI are listed here. The classification is done by evaluating the most disturbed azimuth angle from the RFI box and determining if the fraction of these specific disturbed rays exceeds the specified threshold. An RFI may fall under multiple RFI classes. The sum of reference values uniquely identifies the combination of applicable RFI classes.
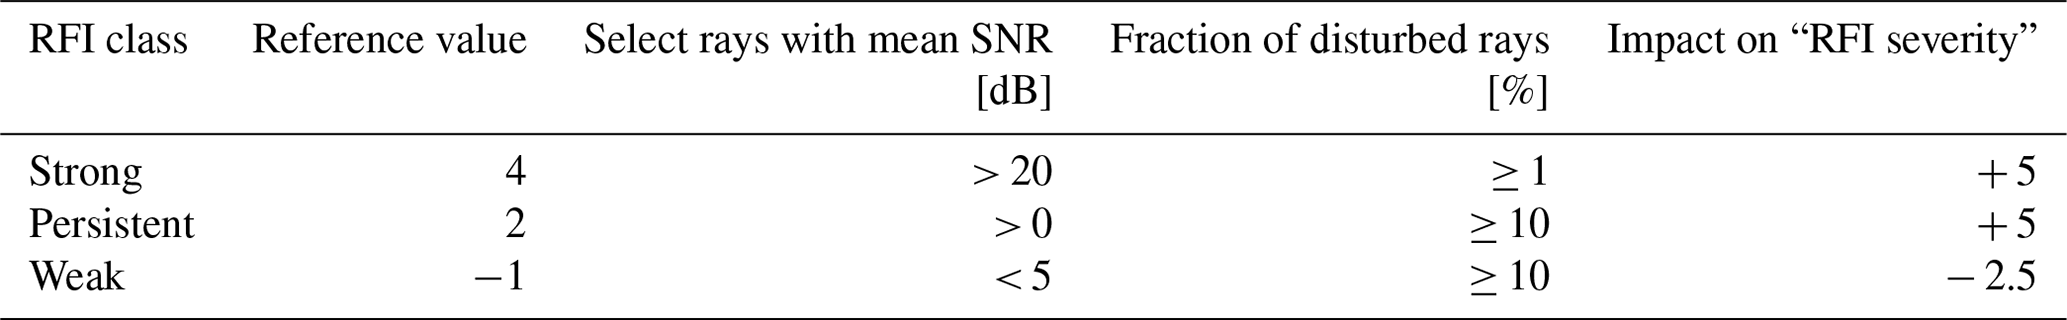
The final RFI boxes each describe a single RFI source. To allow for a simple interpretation of the final RFI boxes they are classified and categorised regarding their relative threat level to data quality. First, a classification of each RFI box is performed. The resulting “RFI class” characterises the rays contained within the RFI box. Table 1 lists the three possible categories and their numeric reference values. It can be any combination of strong, persistent and weak. Each RFI box is classified by evaluating the data from the most repeatedly disturbed (worst) azimuth direction contained within the RFI box. For example, “strong RFI” means that at least 1 % of the disturbed rays within the worst azimuth direction have a mean SNR over 20 dB. It is possible that an RFI is classified as strong and weak at the same time, which most likely indicates a varying signal power level emitted by the RFI source.
To further characterise and prioritise the detected RFI sources, another measure was developed: the “RFI severity”. The RFI severity is an empirical measure to automatically and objectively assign a priority to a detected RFI source for tracking and reporting. The relationship between the internal RFI box parameter and the resulting effect on the RFI severity is denoted as “severity impact”. Several internal parameters of a detected RFI are factored in to calculate the RFI severity. Each of these factors is evaluated regarding the specific severity impact (see Fig. 2). If an internal parameter exceeds the described range, the respective maximal or minimal severity impact is used. All of these factors are added up to arrive at the final RFI severity. The following is a description for each of these severity impact factors.
- Strong RFI
-
RFI class. This applies if there are a few rays with high SNR.
- Persistent RFI
-
RFI class. This applies if a considerable amount of rays are affected daily.
- Weak RFI
-
RFI class. This applies if a considerable amount of rays have low SNR.
- “Worst” SNR
-
Mean SNR of rays in the worst direction. The measured meteorological signal gets superimposed with the interference signal. Separating these signals back into their components is not possible. Therefore, the strength of the interference signal directly impacts the ability to recognise the valid meteorological signal in the presence of the interference. The keyword “worst” describes which rays are used to compute this parameter – rays from the most repeatedly disturbed azimuth direction contained within the RFI box.
- “Worst” disturbance
-
Mean disturbance fraction in the worst direction. To distinguish sporadic and persistent RFI sources, two severity impact regimes are defined for this parameter (see Fig. 2). These (at most) sporadic RFI sources get a high-severity penalty, as resolving the cause of such RFI sources with the NRA is unlikely. In addition, it is most likely that such sporadic RFI sources will disappear without any intervention.
- Mean disturbance
-
Mean disturbance fraction over all azimuth directions. To interpret this factor one has to consider the azimuthal width of RFI boxes. For example, a 1∘ wide interference with 100 % disturbance, which in a single time step also affects a neighbouring ray, will result in a final RFI box with an azimuthal width of 2∘. Therefore, the mean disturbance would be calculated to about 50 %. As this effect is common for most RFI sources, the mean disturbance is rather low in general.
- Number of rays
-
Total number of disturbed rays. The exact number of disturbed rays is more relevant for short-term RFI sources containing a few hundred rays than it is for long-term RFI sources containing several thousand rays. Therefore, this factor is only used to differentiate small RFI boxes from one another with a maximum of 576 rays (2 d worth of rays in a single direction), after which the maximum severity impact of 10 is applied.
- Azimuthal width
-
Width in azimuthal direction. This factor, regarding only the azimuthal width of an RFI, contributes little to the overall severity, as to not overrate wide, sporadic RFI sources. Wide RFI sources appear rarely and most likely in conjunction with a high mean disturbance if they pose a high threat to data quality.
- Duration
-
Duration for which the interference was active in days. The duration is one of the main characteristics in deciding whether or not the RFI is reported to the NRA. Most RFI sources are short-lived sources that disappear by themselves. Reporting these to the NRA as RFI sources to be traced is inefficient in the sense that the RFI source has a low chance of being found.
- Last activity
-
Time in days since the last disturbed ray was added. Similar to the duration, this factor helps in operational decision making to filter out RFI sources that already ceased to exist. This factor is excluded from the historical analysis, as it is irrelevant how long ago any specific RFI ceased to exist.
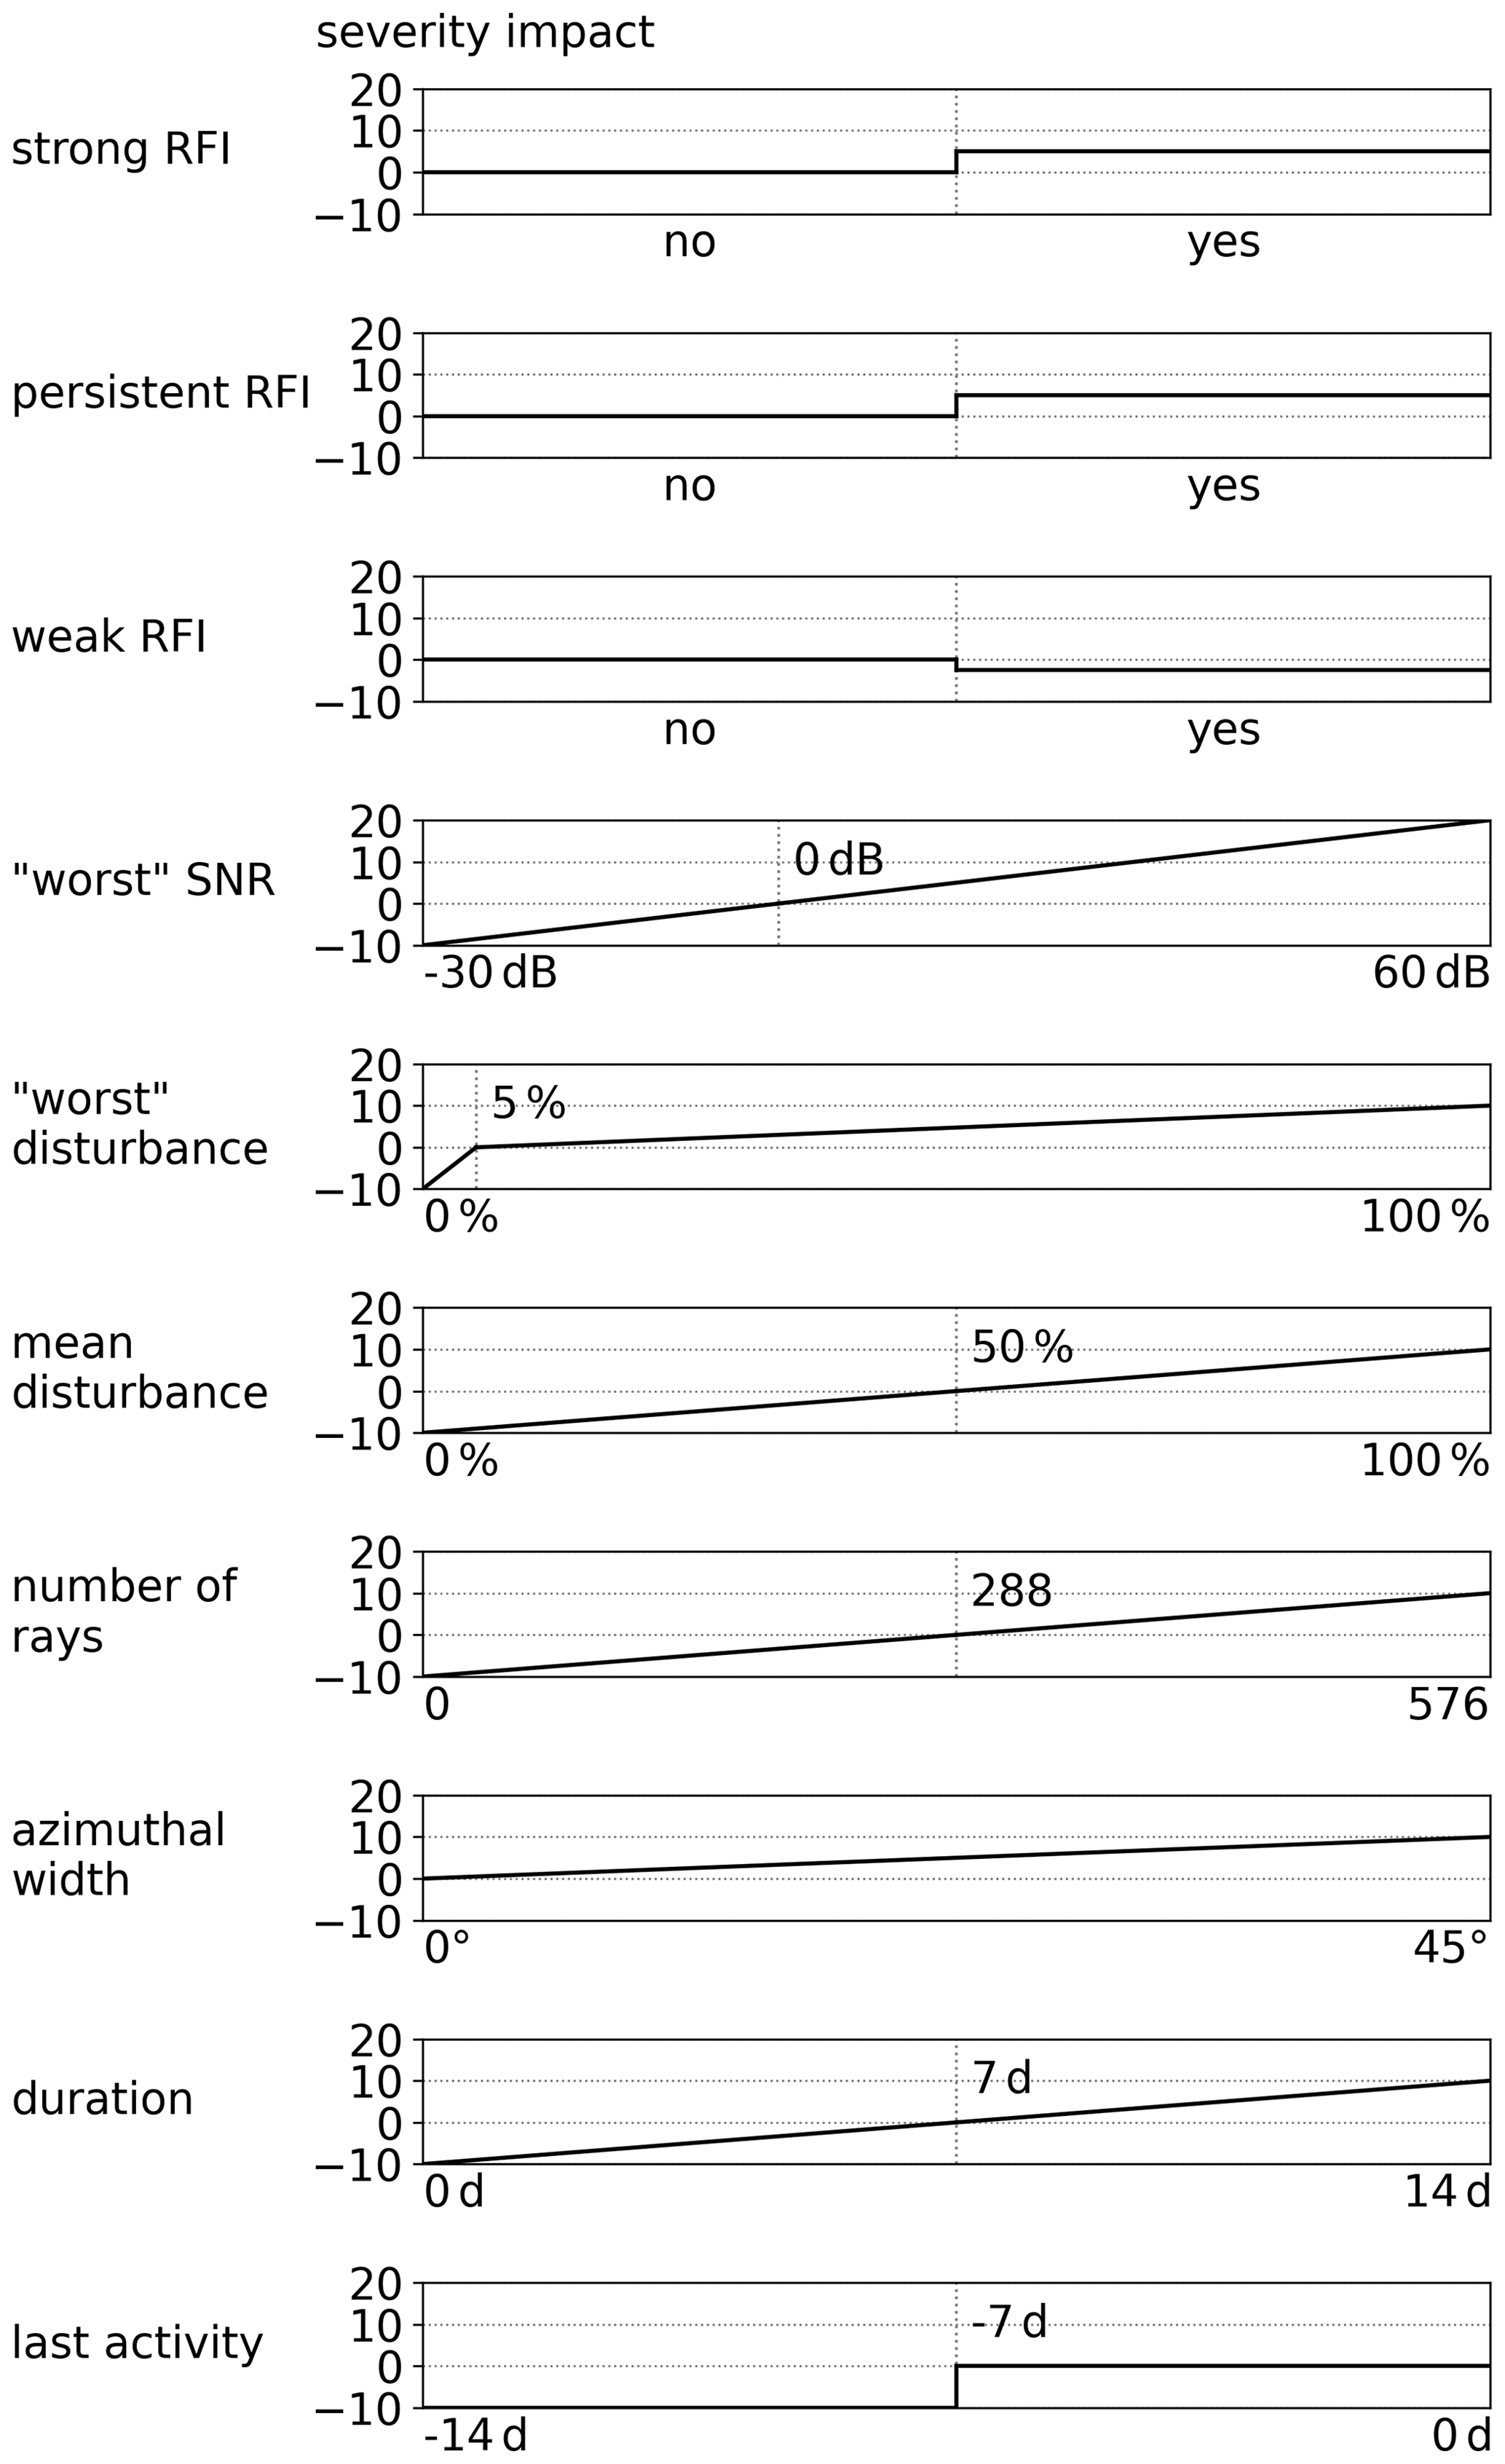
Figure 2A panel for each of the factors used to determine the overall RFI severity is shown. Each panel relates the underlying variable to a resulting severity impact. The top three panels relate to RFI classifications. All other panels relate to specific parameters of an individual RFI and contain minimum and maximum boundaries. Outside of the specified boundaries the last valid severity impact is used.
To given an example, one of these factors is the daily mean disturbance fraction, describing the fraction of disturbed to undisturbed rays. In our case (with a scan cycle repeating every 5 min), there will be 288 rays with the same azimuth and elevation during 1 d. Therefore, the factor is computed by mean number of daily disturbed rays with respect to 288 rays. This also means that if the radar was out of service, a mean disturbance of 100 % cannot be reached, as the service time is not accounted for and no disturbed rays could be measured during a maintenance period.
The severity impact of these factors is chosen to reflect the relative impact on data quality caused by the different aspects of individual RFI sources. In addition, the chosen severity impacts account for underlying differences resulting from short-term versus long-term interference. Another point to note is that some aspects of an RFI are reflected in multiple severity factors (e.g. the amount of disturbance caused by an RFI source).
By using the RFI severity, three “RFI categories” were defined: moderate, severe and critical. RFI sources with a severity greater than or equal to zero and less than 10 are considered to be moderate and have a noticeable impact on data quality. Any RFI with less than zero severity is not actively tracked by the DWD as there is, in general, no hope of a successful identification and removal by the NRA. Further details regarding this fact can be found in Sect. 4. RFI sources with a severity greater than or equal to 10 and less than 25 are considered to be severe, while an RFI with a severity greater than or equal to 25 is considered to be critical. Critical RFI sources are to be mitigated as soon as possible by direct communication with the NRA, while moderate RFI sources are tracked with a low priority in respect to other tasks of the DWD radar team.

Figure 3The operational RFI analysis from 18 March 2022. Included are disturbed rays from the previous 30 d. The top panel shows each disturbed ray as a dot in the scatter plot (colours of dots depict median SNR). All detected RFI sources with an RFI severity greater than or equal to zero are marked with a red box. At the bottom additional properties of each severe RFI are displayed. The data in both bottom panels are accumulated into 5 min bins according to the time of day (y axis). The bottom left panel shows SNR, and the bottom right panel shows the fraction of disturbed rays. Dashed lines in the bottom left panel correspond to RFI class SNR limits (persistent and strong). The mean azimuth, mean elevation and RFI severity of each severe RFI are displayed within the legend.
2.2 Data resulting from the RFI detection
After collecting all rays with an interference signal and joining them into RFI boxes, an automated visualisation and summary of the results had to be developed. These aggregated results are used by the technical DWD personnel and the NRA. Therefore, the main requirement was to provide an intuitive representation of the detected RFI sources to support quick decision making and the subsequent removal process of the RFI source in the field. An example of the final visualisation from the radar ISN is shown in Fig. 3. All of the relevant information for the radar technicians to support the mitigation process is summarised graphically. In the top panel of Fig. 3, each disturbed ray is plotted as a dot in time and at the respective azimuth. Each dot is colour coded, indicating the median SNR of a single disturbed ray. All relevant RFI sources (RFI boxes) above the zero RFI severity threshold are marked as red boxes. The lower two panels provide further quantitative information on the temporal variability and strength of the relevant RFI sources. Both bottom panels display the data in relation to the time of day on the y axis. This has been very valuable in setting up an on-site appointment with the NRA at a specific time of day to ensure that the RFI source is actually active and can be found by the NRA.
In this case, there are two persistent RFI sources present. One at a mean azimuth of 171.43∘ (blue in lower panels) with a SNR in the order of 7 dB, which is present about 25 % of the time, and another RFI at 143.12∘ with a SNR in the order of 13 dB, which is only present about 15 % of the time. There is no significant diurnal variation visible for either of the two RFI sources. Therefore, no specific time schedule is needed when the NRA is on site to identify the sources of interference. Both RFI sources are assigned a severity of exactly 21, which makes both of them severe RFI sources. This also shows how the differences in strength (bottom left) and persistence (bottom right) of both RFI sources balance one another regarding the resulting RFI severity.
Further explanations and details to get a better understanding of the RFI detection results can be found in Sect. 4. There, a statistical analysis over the nearly 5 years of DWD RFI data is performed, which offers a deeper understanding of the RFI severity, the chosen severity limits to categorise detected RFI sources and long-term trends.
For an independent verification of the RFI detection algorithm, a commercially available Wi-Fi adapter is integrated into the radar system. It was first built into DWD's research radar at the Hohenpeißenberg (MHP) site, where the first dedicated verification experiment was carried out. In addition, similar verification measurements have been carried out at the operational radar ISN, where the RFI detection algorithm identified two active RFI sources (see Fig. 3). The objective was to gather a full sweep of verification data at 0∘ elevation, record all visible Wi-Fi networks and identify those which operate at C band, as those are the most likely cause of radar interference. The gathered verification data are then compared to the results from the RFI detection algorithm and raw radar data. Results of two case studies are shown in Sect. 3.2 and 3.3. The practical experience from over 2 years of operation, which includes the removal of RFI sources by the NRA based on this methodology, indicates the good reliability of the RFI detection algorithm and classification approach.
3.1 RHunt setup and Wi-Fi regulations
The hardware setup to collect an independent data set is shown in Fig. 4. A commercially available Wi-Fi receiver from NETIS (WF2190 AC1200) is currently integrated into the radar receiver and can be turned on remotely. Instead of using the two supplied antennas (the Wi-Fi adapter has two antenna ports), each input port is connected to a directional coupler behind the low-noise amplifier (LNA) of the radar receiver and is therefore connected with the radar antenna. This has the advantage that the same analogue channel is in use for both the verification measurement and normal radar operation. The commercial Wi-Fi adapter is plugged into a Raspberry Pi 3, which is used to control and acquire the data stream. We call the combination of commercial Wi-Fi adapter and Raspberry Pi the “RHunt” (short for RLAN Hunter). The RHunt permanently remains in the radar receiver chain and is operated remotely. During normal radar operation the RHunt power supply (Acromag) is turned off to minimise potential self-inflicted interference from the integrated Wi-Fi transmitter. Details regarding the actual data acquisition process can be found in Appendix B.
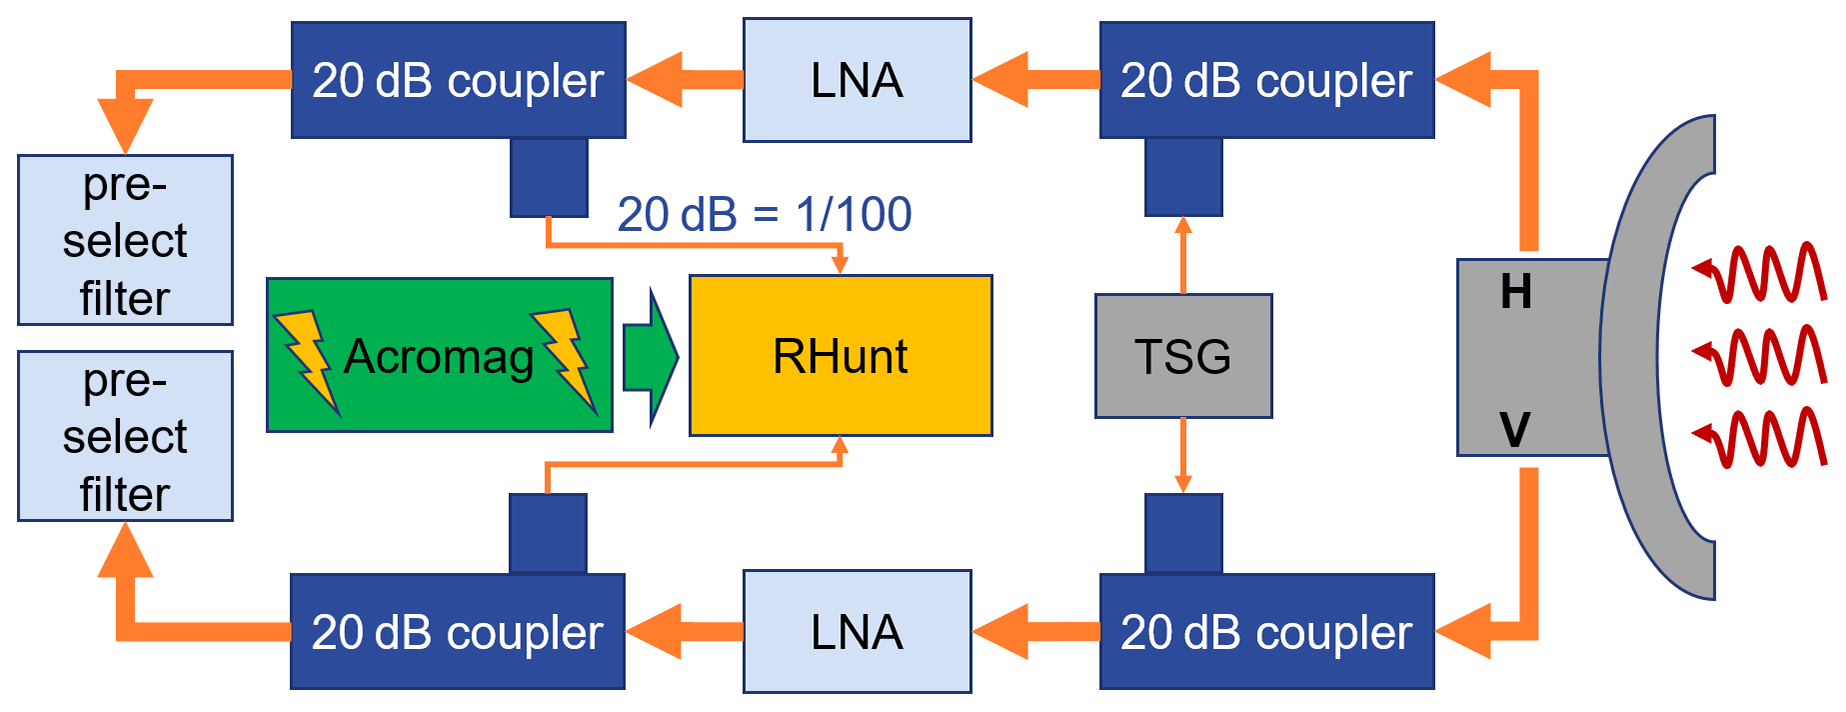
Figure 4Diagram of the RHunt setup within the DWD radar system. The RHunt is integrated into the analogue receive path of the weather radar after the low-noise amplifier (LNA) and connected in the horizontal (H) and vertical (V) through a 20 dB coupler in front of the pre-select filter. The Acromag serves as a remote-controlled power toggle. Also shown is the test signal generator (TSG), which is used to calibrate each receive path.
The positioning of the couplers connected to the Wi-Fi adapter in the radar receiver chain is critical. To minimise a negative impact on the SNR during normal radar operation, additional hardware components should not be installed before the LNA. Additionally, to obtain comparable results between the radar and Wi-Fi receiver the coupler should be placed as far down the receiver chain as possible, meaning right before the down converter (mixer). However, any filters integrated in the radar receiver chain may corrupt the Wi-Fi signal by cutting part of the used band away and thus render it impossible for the Wi-Fi adapter to identify any networks. In the case of the DWSR 5001 radar, a 22 MHz pre-select filter is in use, which already has a strong impact on Wi-Fi networks using up to 80 MHz of bandwidth. Hence, our coupler to the Wi-Fi adapter is integrated right before the pre-select filter but behind the LNA. This keeps a wide range of signals in the 5 GHz range available to the RHunt that have are picked up by the radar antenna.
The bandwidth of the utilised commercial Wi-Fi adapter covers 2.4–2.4835 and 5.18–5.825 GHz. In Germany, the commonly used weather radar frequencies 5.6–5.65 GHz lie within the C band (4–8 GHz). Since weather radars and Wi-Fi may share a common frequency band, a standardised channel allocation scheme was introduced for Wi-Fi access points ETSI (2012). The mandatory mechanism for Wi-Fi devices to prevent interference to weather radars is called dynamic frequency selection (DFS). Since the shared bands vary by country and jurisdiction, an exact geolocation is critical for the DFS to work properly. Upon startup, a Wi-Fi access point will first limit operation to “safe bands” and passively scan shared bands for radar signatures for a predefined time. The required period depends on the country and the actual radar scan intervals in use. If no radar is detected during this period, the shared bands can be used for Wi-Fi operations. These scans are continuously repeated during the Wi-Fi operation to ensure the continued use of radar-free frequency bands. Any frequency changes are communicated by the access point to all connected clients. Generally, the DFS mechanisms works well. However, in some cases DFS does not work as intended and interference arises, as in the following situations (see also Carroll et al., 2010; ECC, 2014):
-
DFS has been disabled,
-
the geolocation is deliberately or unintentionally set incorrectly (or the automatic setting is incorrect),
-
the Wi-Fi access point is mobile and thus not able to properly detect the radar,
-
the Wi-Fi access point is shielded from the radar (but the client is not),
-
sensitivity of the DFS mechanism to weather radar signals is insufficient,
-
the radar has a blanking sector (not transmitting) in the direction of the Wi-Fi access point (see Sect. 3.2).
Due to the fact that the RHunt is connected into the radar receiver instead of using the commercially supplied antennas, it is not possible to measure an absolute power value for the signal strength of the identified Wi-Fi networks. As the used Wi-Fi adapter already reports the signal strength of each identified Wi-Fi network in an arbitrary range of 0 to 100, that scale is used without further investigation.
However, the most crucial constraint in the RHunt setup is the fact that a Wi-Fi network is only reported by the RHunt if it is identifiable. This means the Wi-Fi adapter has to be able to recognise the Wi-Fi network as such based on the received signal. Considering that a Wi-Fi source can interfere with the radar measurement without being identifiable, the approach taken is to record all Wi-Fi networks identified by the commercial Wi-Fi adapter. Thereby, many Wi-Fi networks that are rather far away from the centre frequency of the radar are also included. These forced constraints have to be kept in mind during the following analysis.
3.2 RHunt results from Hohenpeißenberg (MHP)
The verification data collected with the RHunt contains identified Wi-Fi networks that operate in the 5 GHz C band at 5150–5725 MHz. For the interpretation of the RHunt results it is important to recognise that this band is split into three distinct frequency bands, which are defined by ETSI (2012). All frequency bands are split into 20 MHz channels which can be combined in order increase the bandwidth. The 5150–5250 MHz band is assigned to devices for indoor use which are limited in EIRP (transmitted power multiplied by antenna gain) to 200 mW. Similarly, the 5250–5350 MHz band is also assigned to devices for indoor use with the same maximum EIRP, the only difference being that DFS is required. For those two bands, the frequency block numbers are between 36 and 64. The third band (5470–5725 MHz) is considered for indoor and outdoor use. Maximum Wi-Fi EIRP is 1 W, and DFS functionality is required. Obviously, Wi-Fi transmitters in this band have the highest potential to interfere with weather radar measurements. Related frequency channel numbers are between 100 and 140.
The Hohenpeißenberg (MHP) radar is operating at a centre frequency of 5640 MHz. It is located at the top of a mountain that is about 200 m above the surrounding area. The nearest big cities are to the east and west of the radar site. A radio tower is located on the same mountain range in a direction of about 110∘ in azimuth from the radar, which requires a blanking sector (no radar transmission) of about 10∘ width in azimuth. In addition, two open Wi-Fi access points are present within the blanking sector 250 m east of the radar site as it is a common tourist attraction.
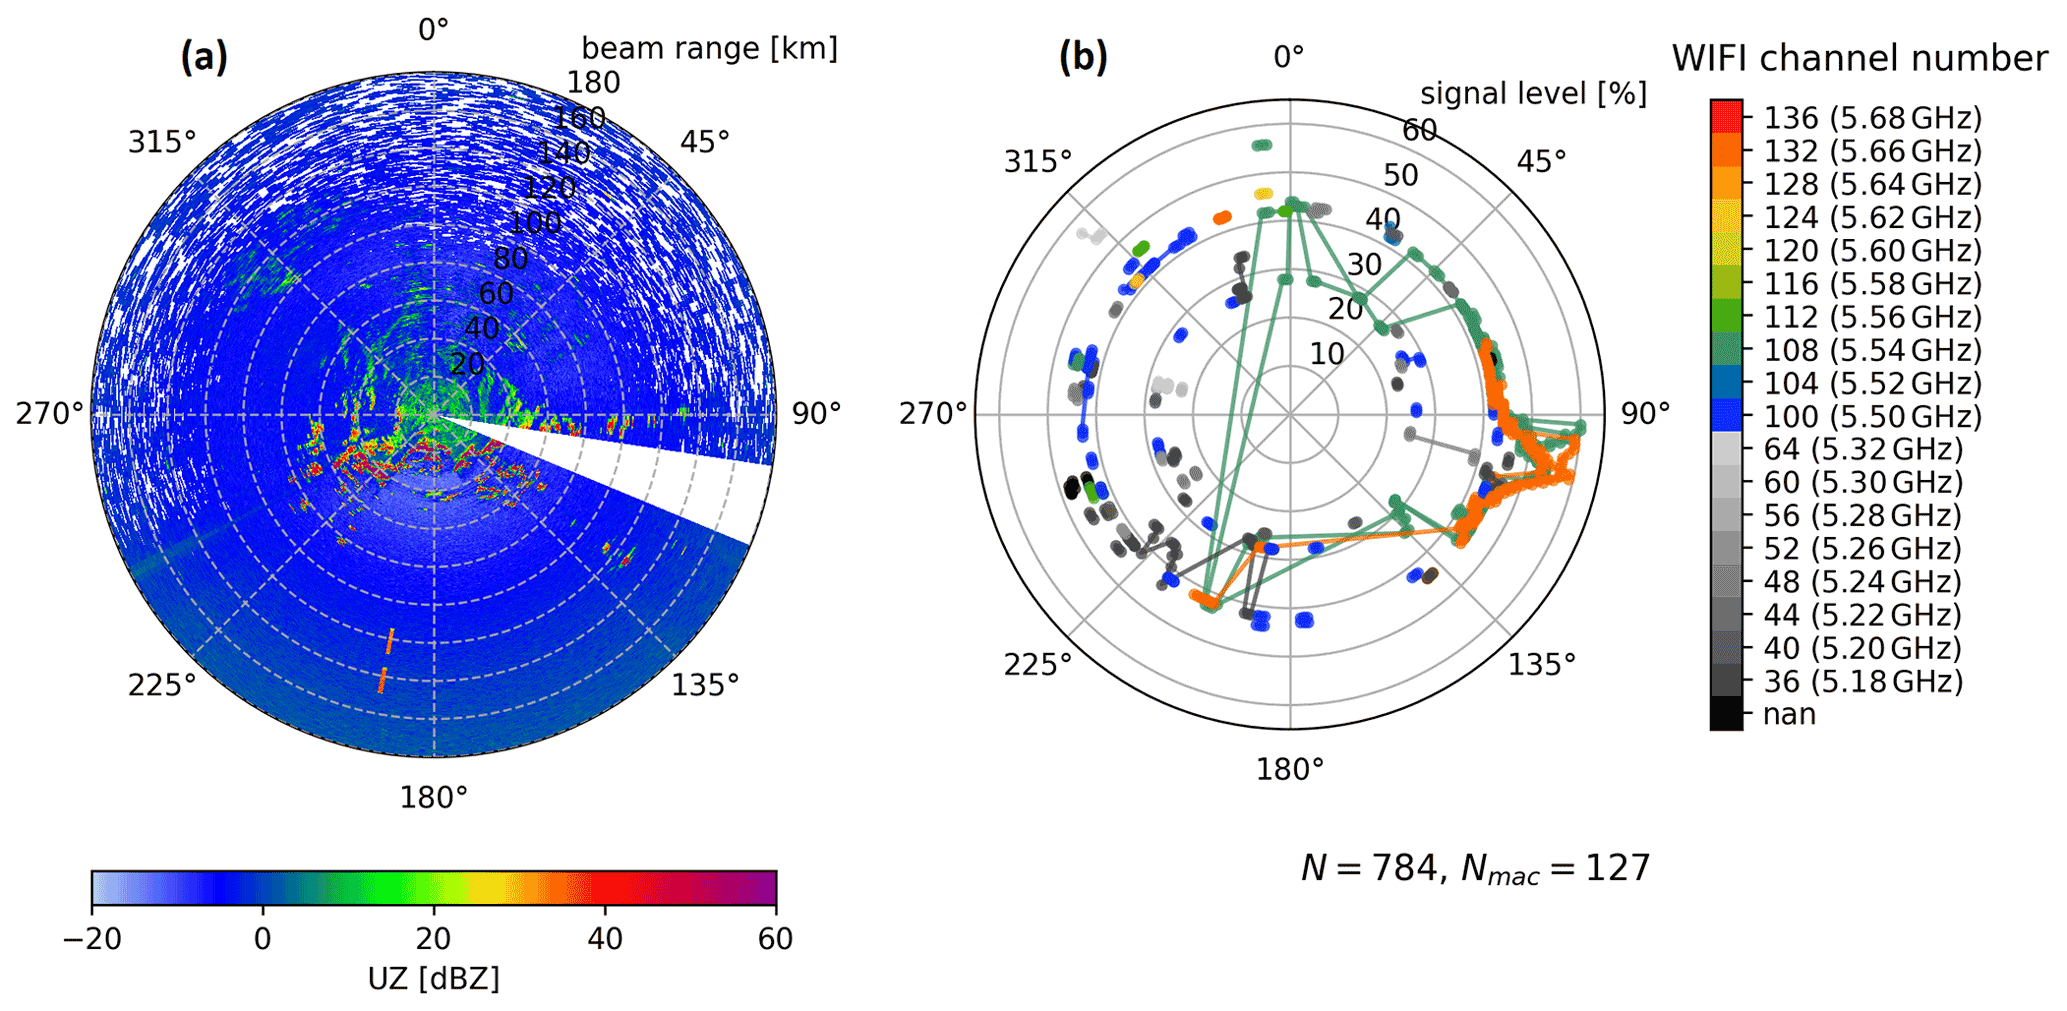
Figure 5An uncorrected reflectivity (UZ) PPI is shown in panel (a) from the radar site MHP. It was taken after the RHunt sweep on 22 September 2021 at 18:22 UTC. Panel (b) contains the identified Wi-Fi networks at their respective azimuth and signal level as dots. The Wi-Fi channel is colour coded. Channels above 100 (5500 MHz, allowed outdoor) are coloured, and others are in greyscale. Each line connects networks with the same MAC address. In total 784 Wi-Fi records (N) and 127 networks with unique MAC addresses (Nmac) were captured. Note the different variables on the radial axis.
The RHunt results from 22 September 2021 are shown in Fig. 5b. Every identified Wi-Fi is shown as a single dot at the respective azimuth position. The radial position of the dot indicates the signal strength on a scale of 0 to 100. This adds more context to the potential threat level of each Wi-Fi network. In addition, all Wi-Fi records above 5500 MHz (channel 100, allowed outdoors) are colour coded, while the rest of the Wi-Fi records are displayed in greyscale depending on their frequency. Lines connect the dots with the same MAC address and therefore originate from the same Wi-Fi source. This particular sweep shows a total of 784 recorded Wi-Fi identifications that showed 127 unique MAC addresses.
The Wi-Fi records in the azimuth range 90–115∘ stick out with an elevated signal level. Four of these (two turquoise and two orange) were detected over a large azimuth range at varying signal levels, evident by the connecting lines. Two of those networks belong to the mentioned public Wi-Fi access points located about 250 m away from the radar. As noted before, due to the sector blanking, the DFS of the Wi-Fi access points in this direction cannot see the radar and therefore does not switch away from the radar frequency band. As these Wi-Fi access points are close to the radar site, the networks are even identifiable through the sidelobes of the radar antenna.
Figure 5a shows the UZ PPI measured after the dedicated RHunt sweep. Most prominent is the sector blanking in which all of the collected data is discarded. One can also see an interference signature at about 190∘ azimuth. This signature coincides with RHunt detections of the previously mentioned Wi-Fi networks with elevated signal levels and relates to the known Wi-Fi access points at about 110∘ azimuth. These Wi-Fi networks must have been picked up by a sidelobe of the radar antenna and are the most likely cause of the visible interference. This showcases a prominent finding: strong or close RFI sources are also visible through sidelobes, which makes it hard to identify the true direction and therefore the source of some interference. However, we only see sporadic and rather infrequent interference in the operational MHP radar data mostly at an azimuth of 113∘, right at the edge of the sector blanking, where the signal level of the detected Wi-Fi networks is still elevated.
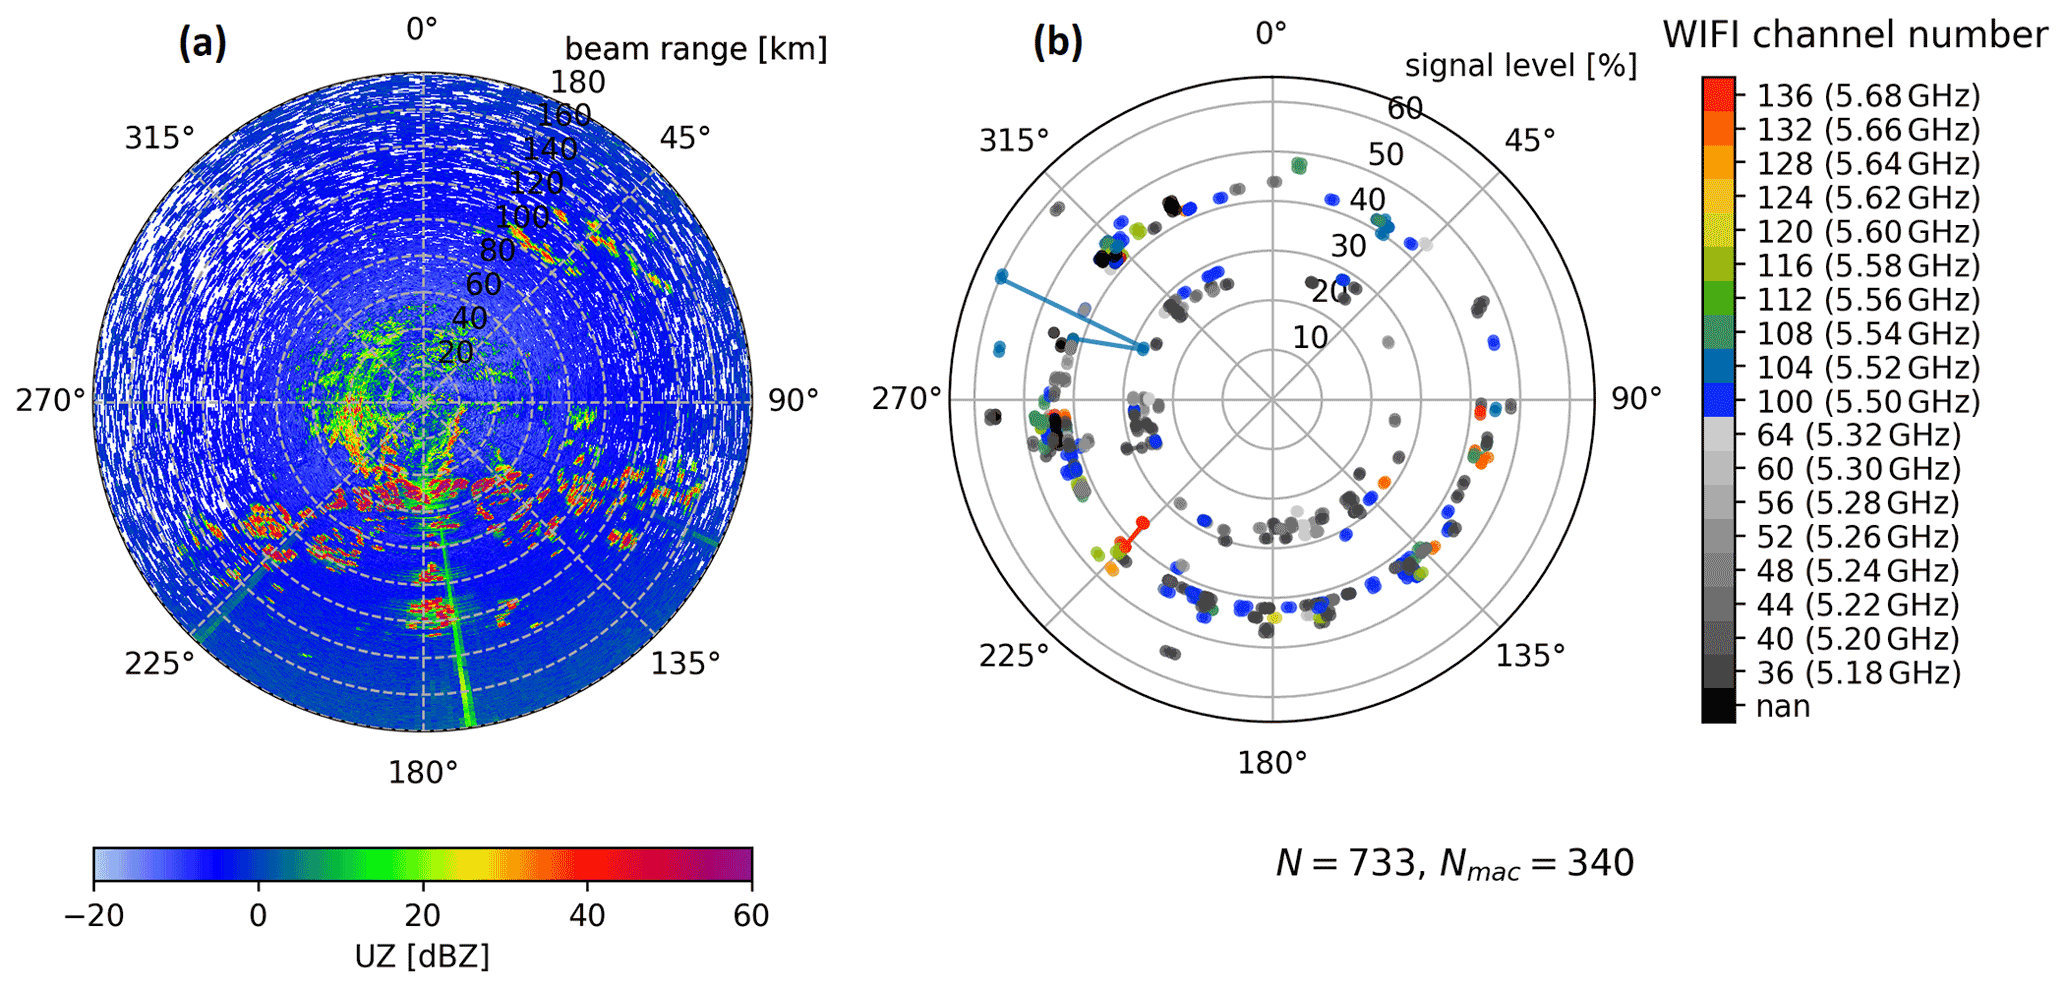
Figure 6An uncorrected reflectivity (UZ) PPI is shown in panel (a) from the radar site ISN. It was taken after the RHunt sweep on 6 April 2022 at 10:27 UTC. Panel (b) contains the identified Wi-Fi networks at their respective azimuth and signal level as dots. The Wi-Fi channel is colour coded. Channels above 100 (5500 MHz, allowed outdoor) are coloured, and others are in greyscale. Each line connects networks with the same MAC address. In total 733 Wi-Fi records (N) and 340 networks with unique MAC addresses (Nmac) were captured. Note the different variables on the radial axis.
3.3 RHunt results from Isen (ISN)
The radar site ISN is located in southeastern Germany and operates at a centre frequency of 5625 MHz. In the operational radar data from ISN, two persistent RFI sources were detected by the RFI detection algorithm. A RHunt measurement campaign was carried out on 6 April 2022 in order to make an assessment of the situation and to provide further information to the NRA. All detected Wi-Fi networks and a corresponding PPI are shown in Fig. 6 using the same layout as in Fig. 5. In ISN, a total of 733 Wi-Fi networks were identified that originated from 340 distinct Wi-Fi devices based on the MAC addresses. This is a considerably larger number of Wi-Fi networks than were found at the MHP radar site (127). The main reason for this may be attributed to the altitude at the MHP mountain site compared to the flat surroundings of ISN with its close proximity to Munich in the west (the third biggest city in Germany).
Two severe RFI sources were detected by the RFI detection algorithm at an azimuth of 143 and 171∘ (see Fig. 3). Only the RFI at 171∘ is visible in the PPI taken after the RHunt sweep as a linear signature (Fig. 6a). The average SNR of this RFI is about 13 dB. What makes it hard to remove is its sporadic nature. Only about 15 % of the sweeps at low elevations are affected, with a small peak in the evening hours. The sporadic nature causes less harm in terms of data quality, but on the other hand it impedes a quick mitigation by the NRA. Focusing on the azimuth range of this sporadic RFI, we find four Wi-Fi networks that have a channel number greater than 100 and might therefore be a likely cause for the interference. In contrast to the relevant networks at MHP, the signal level of these four is relatively low, suggesting that these are devices that are not in close proximity to the radar site. In addition, none of the four networks are visible over a greater azimuth range.
Even though there is no linear interference signature in the UZ PPI towards 143∘, there are multiple Wi-Fi networks recorded (Fig. 6). Here one has to know that this particular RFI already ceased to exist on 21 March, whereas the RHunt measurement was executed on 6 April. The RFI was reported to the NRA, but processing stopped shortly after as it ceased without any active intervention and before an on-site visit. However, this RFI can be seen in Fig. 1, which shows data from 15 March. This shows how rapidly a severe RFI may arise and disappear without any chance of a definitive identification of the interference source. Although the RFI was present for 26 d and reported to the NRA, the mitigation process for this RFI, with an RFI severity of only 11, was ultimately too slow for an identification of the interference cause.
3.4 Discussion of verification
The presented validation approach provides an independent assessment of the presence of Wi-Fi networks using a plug-and-play approach with minimal limitations to the operational scanning. Operational scanning has to be paused for about 1 h to gather a full sweep of verification data. By using the RHunt setup described in Sect. 3.1, there is no negative effect on radar data quality when the RHunt is powered off. However, the chosen approach has several shortcomings in regards to the collected verification data.
The main drawback of recording Wi-Fi networks from the RHunt setup is that it is only possible to detect networks with an identifiable signature (i.e. MAC address). Any signal that cannot be properly interpreted by the Wi-Fi adapter goes unnoticed. In addition, the reported properties of the Wi-Fi network are gathered from the received signal and do not necessarily reflect the precise frequency band in use by the Wi-Fi. In addition, in rare cases any electric installation may cause radio wave emissions visible to the sensitive weather radar. This was the case with an airport lighting installation interfering with the DWD radar site at Hanover (HNR). Only Wi-Fi transmitters not complying with DFS requirements or which have out-of-band emissions reaching into the C band will be found via the employed method.
Yet another limitation is the reported signal level. One would expect the signal level reported by the commercial Wi-Fi receiver to continuously vary between 0 % and 100 %. As Figs. 5 and 6 show, the actual signal level has two dominating levels at around 27 % and 42 %. Here, one has to note that this kind of Wi-Fi adapter is not meant for a detailed analysis of the received signal power but rather to relay the general information in a consumer-friendly manner.
To solve these critical limitations of the RHunt setup, a Wi-Fi spectrum analyser could be used. These are also commercially available as plug-and-play systems, and we are currently preparing to test three different devices. Utilising such a Wi-Fi spectrum analyser allows the detection of any external signal (including signal power and frequency) without the need to identify the transmitter as a common Wi-Fi in one of the expected frequency bands. However, our goal with this verification was to employ the most common hardware to capture the most likely interference sources. Although a detailed analysis of the spectrum could provide further information, the mitigation time might not decrease as the actual mitigation process currently requires the NRA to confirm the provided information via an on-site visit of NRA field technicians.
Even though the RHunt measurements have proven to be very helpful for the mitigation procedure with the NRA, this verification is ultimately inconclusive. If an RFI detection is followed up by the DWD radar technicians with RHunt measurements, one can nearly always see multiple Wi-Fi networks. However, the collected RHunt measurements do not allow a definitive connection to be drawn between identified Wi-Fi networks and the resulting interference. This fact is highlighted by the huge number of detected Wi-Fi networks on frequency bands close to the centre frequency of the radar that do not interfere with the radar (see Fig. 6b).
This section contains an assessment of the interference situation for the German weather radar network since July 2017, when the systematic interference detection over the entire network was first introduced. The RFI detection algorithm introduced here is retrospectively applied over the entire available time period. DWD service availability statistics show that the radar systems were, on average, up and running for over 97 % of this period. In addition, there is no significant year-to-year variability in radar availability for the analysed time period. Therefore (and for simplification purposes), the actual downtime of radar systems is ignored in this analysis, effectively increasing the time where no interference is recorded and a clean data collection is assumed. In particular, this section discusses characteristics of detected RFI sources in relation to their RFI severity and noticeable trends over the available time period.
Since July 2017, in total 11 889 RFI sources were detected by the presented RFI detection algorithm. Each RFI is automatically categorised according to its calculated RFI severity (see Sect. 2.1). In contrast to the operational RFI detection, the severity impact factor regarding the “last activity” of an RFI is not considered in this analysis as it is only relevant for the monthly analysis under operational circumstances. The RFI severity in this analysis can therefore theoretically reach values between −55 and +80.
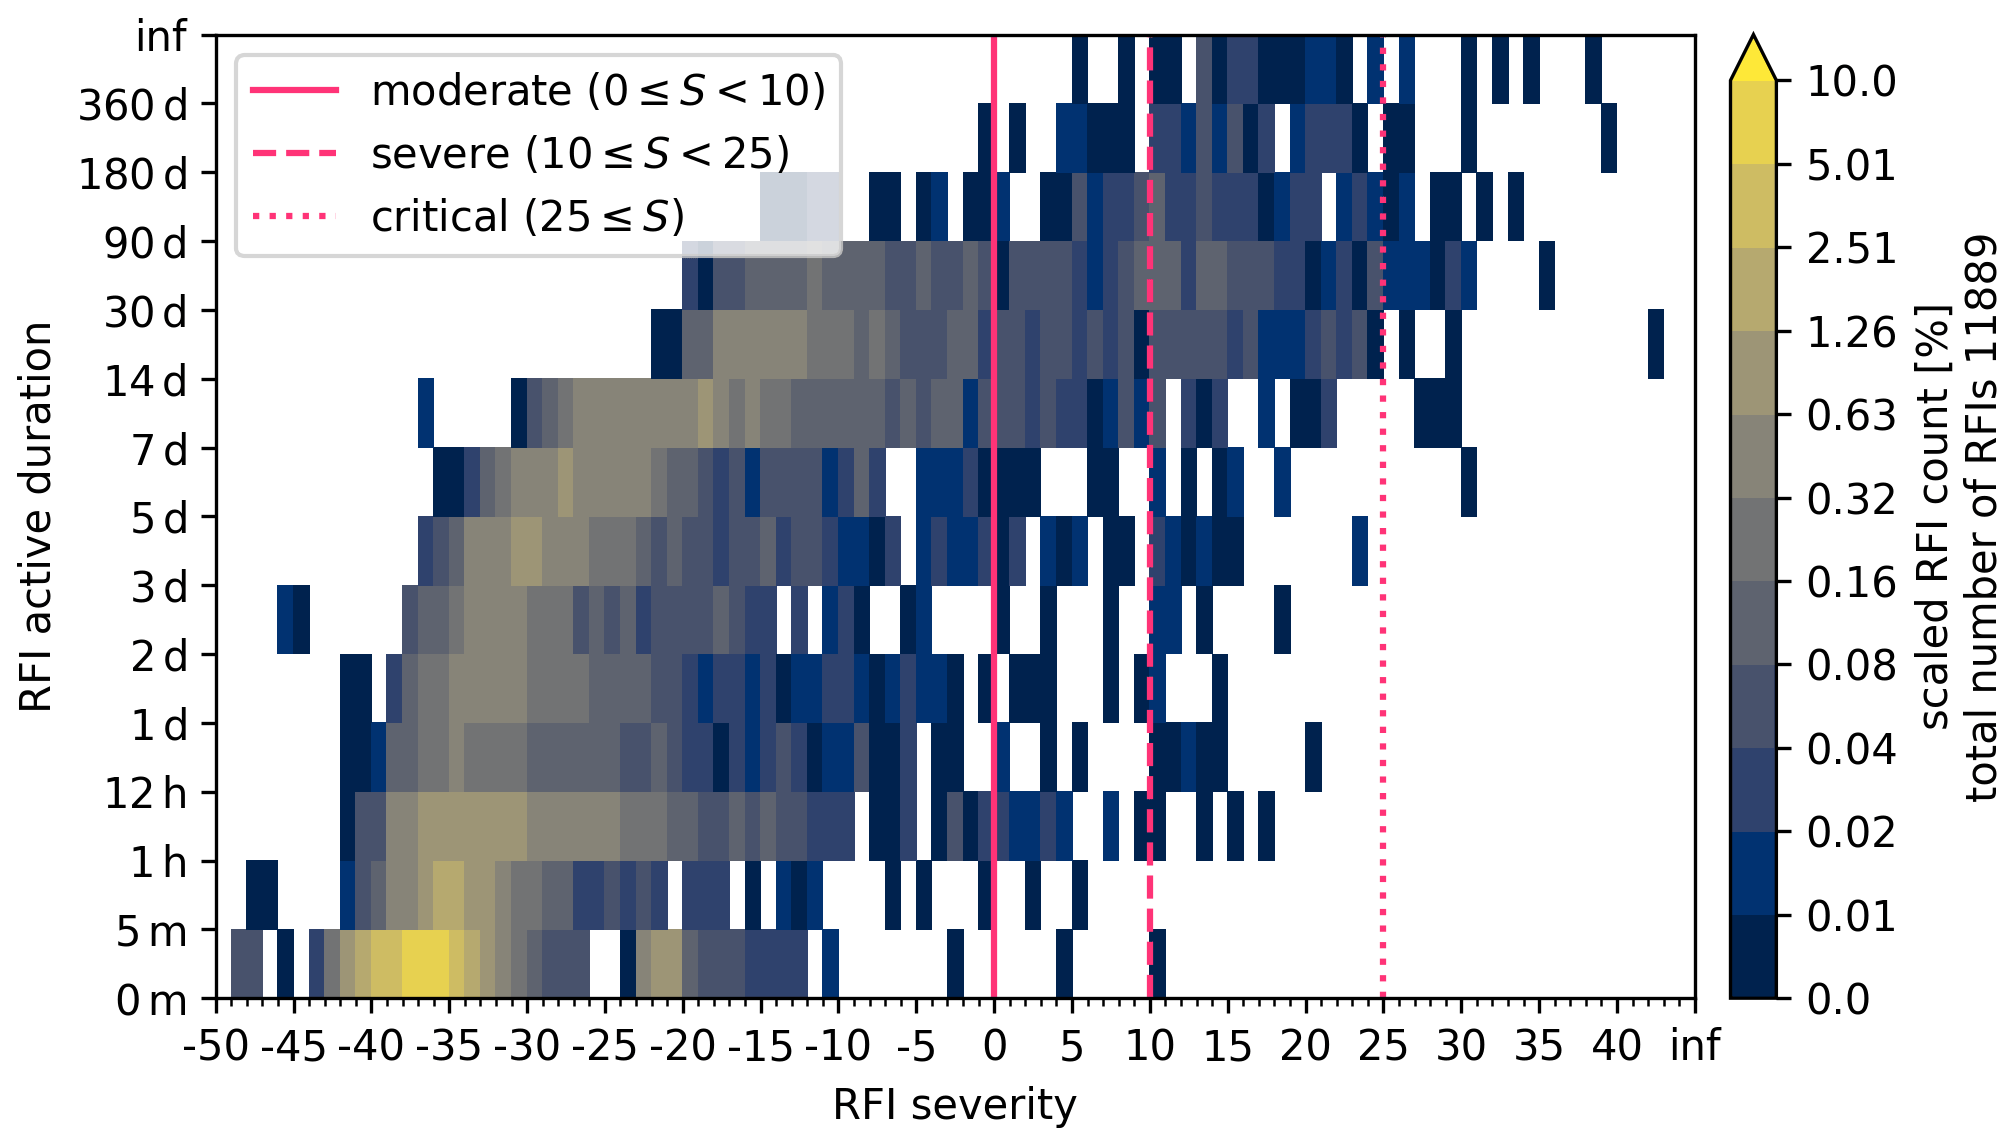
Figure 7Frequency distribution of all RFI sources from July 2017 to May 2022 with respect to the RFI severity and the active RFI duration. The number of RFI sources in each bin is scaled by the total amount of detected RFI sources (denoted on the right). Vertical lines mark RFI severity thresholds for moderate, severe and critical RFI sources.
The most important factor regarding a possible mitigation of a detected RFI is its active duration. A majority of the detected RFI sources persist for less than a day (61.58 %) and disappear without any need for an active intervention. Therefore, the relation between RFI severity and active duration of the RFI gives the best overview of the RFI situation in relation to the mitigation process with the NRA. A heatmap can be generated to visualise this relation by selecting relevant timescales from 5 min to 180 d and using discrete RFI severity bins (of width 1). Figure 7 shows the number of detected RFI sources in each bin scaled by the total number of detected RFI sources. The vertical lines at RFI severity values of 0, 10 and 25 mark the limits for those RFI sources that are treated in the mitigation process. All RFI sources with a severity below zero are not considered in the active mitigation process with the NRA. These untreated RFI sources amount to 94.8 %, which are mostly short-lived source that occur sporadically in time and azimuth. Moderate RFI sources amount to 1.9 %, severe ones amount to 2.9 % and critical ones amount to 0.3 % of all detected RFI sources. Here, the meaning of a detected RFI has to be emphasised. A single RFI can either be short lived (e.g. it may occur just once in a single sweep) or be active for over 360 d at a time. In particular, a persistent RFI that is continuously present for 360 d is still counted as one RFI in this figure.

Figure 8Heatmap of aggregated disturbance caused by RFI sources from July 2017 to May 2022 with respect to the RFI severity and the active RFI duration. The percentage of compromised rays aggregated in each bin is scaled by the total amount of caused disturbances (denoted on the right). Vertical lines mark RFI severity thresholds for moderate, severe and critical RFI sources.
In order to relate the pure number of detected RFI sources to an actual threat to data quality caused by them, the disturbance caused by each RFI source is evaluated as a daily mean fraction of disturbed rays. For the analysed time period, in total 0.051 % of all (expected) rays are disturbed by an RFI signal. This means that on average 52 compromised rays occur in the course of a day in each elevation (of the analysed four) for each radar site. Figure 8 shows the scaled contribution to the caused disturbance as a heatmap following the layout of Fig. 7. Integrating over all moderate RFI sources amounts to 2.5 % of the overall disturbance, severe RFI sources accumulate to 51.9 % and critical RFI sources to 42.1 %. Thereby, the chosen RFI severity categorisation, with an RFI severity greater than or equal to zero, captures 97 % of the overall disturbance, for which an active mitigation process is expected to identify the RFI source.
Table 2Historical trends and statistics of detected RFI sources by RFI category including data from July 2017 until May 2022 are given. The trends are also provided relative to the implementation date of the first automatic RFI detection in October 2019 (referenced as Oct19) The caused disturbance is given relative to the total amount of possible rays (288 rays in one direction during a day at each elevation for each site).
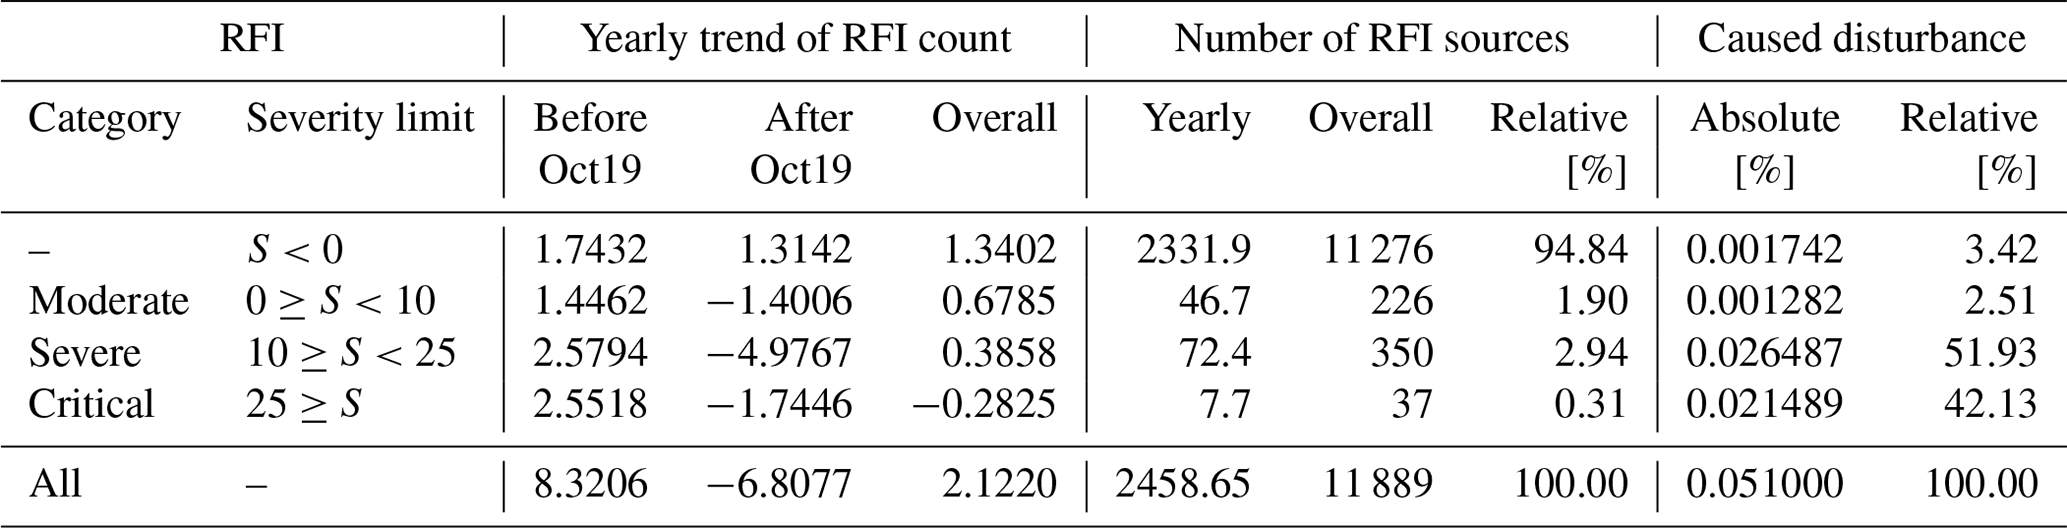
RFI sources with a severity below zero are the cause for only 3.4 % of the overall disturbed rays. These RFI sources are mostly short lived. However, and this is very critical, they alone account for 94.8 % of all detected RFI sources and have sometimes been active for more than 90 d. A detailed summary of the statistics can be found on the right side of Table 2.
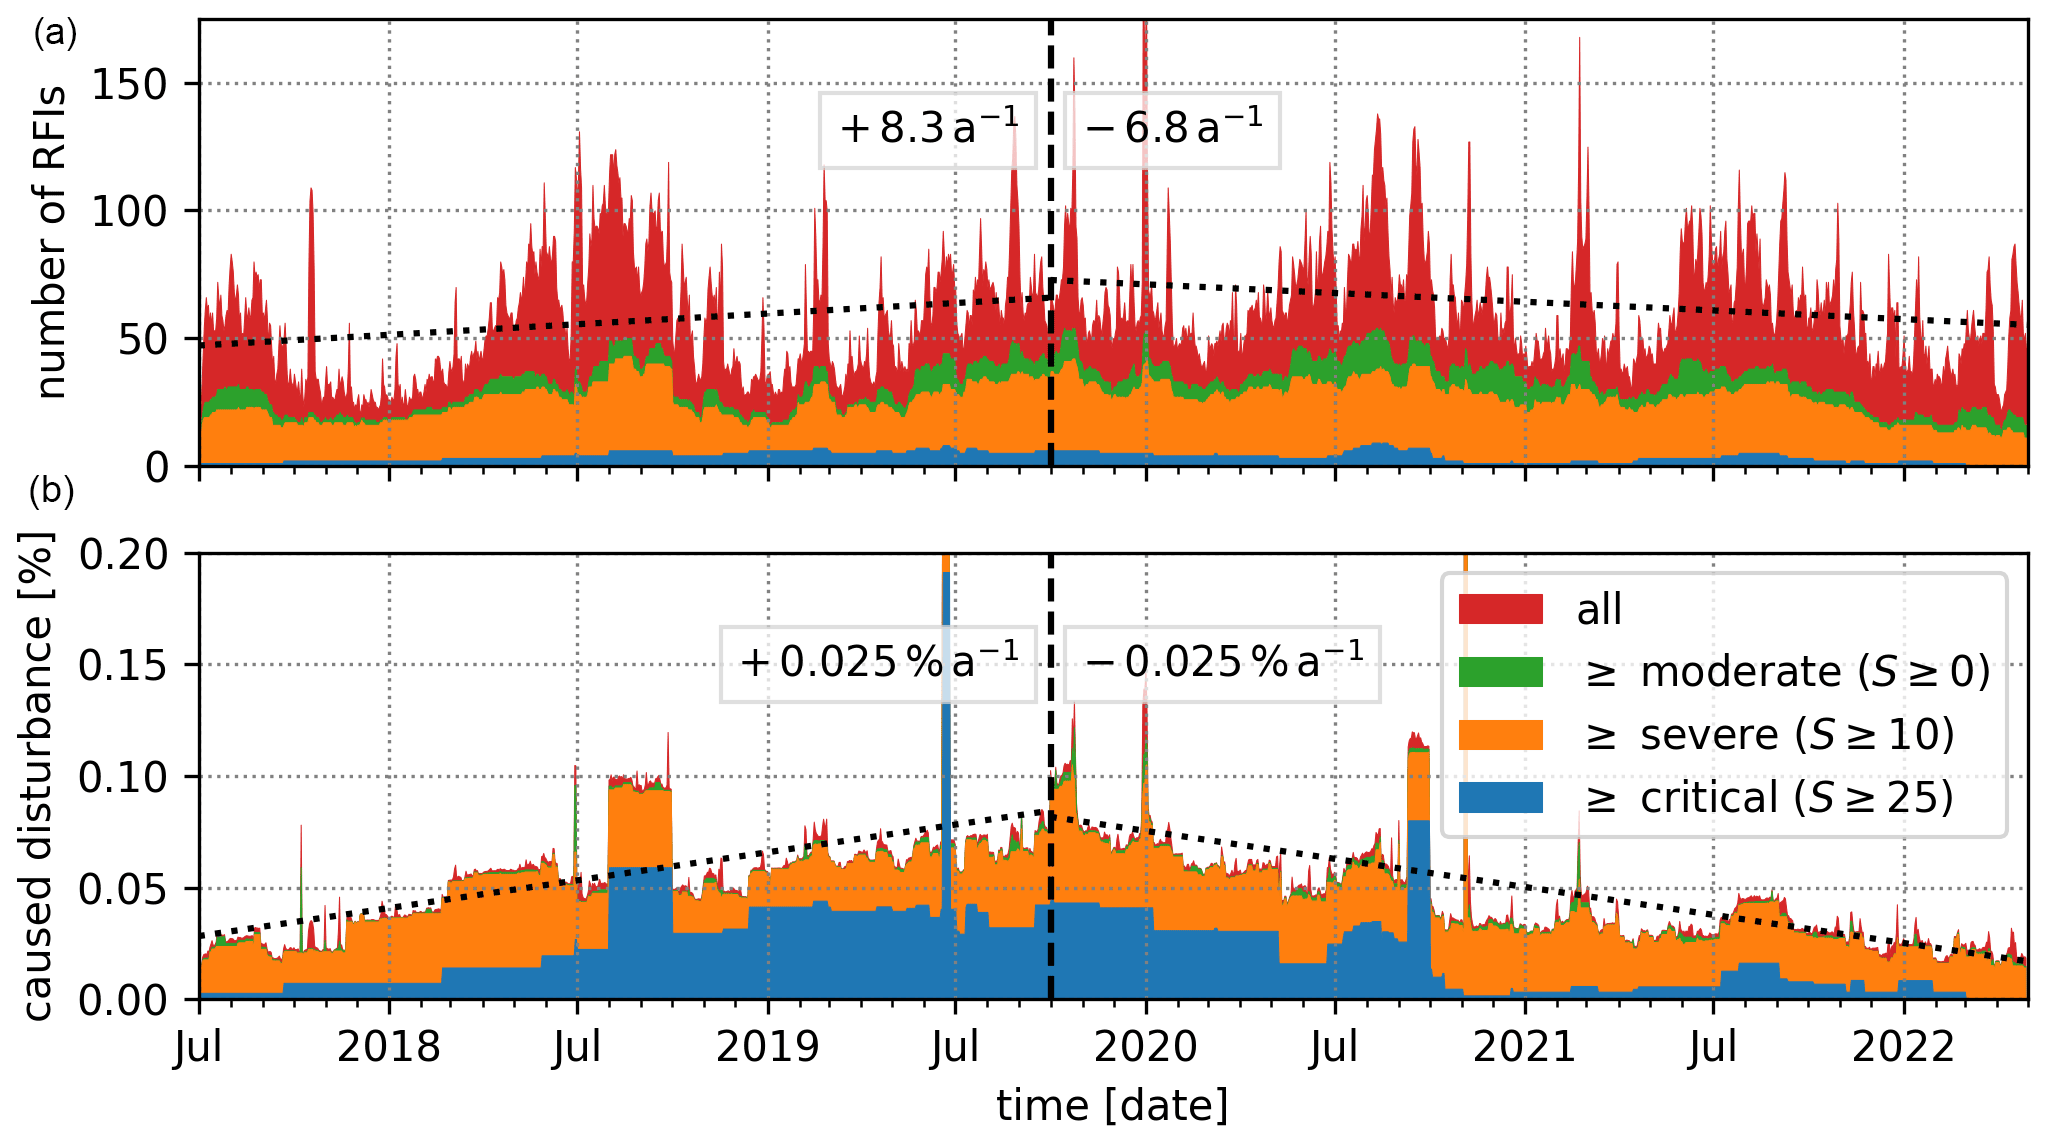
Figure 9Daily timeline of detected RFI sources over the entire DWD radar network (18 sites) from July 2017 to May 2022. Each RFI active during a particular day is added to the displayed statistics for that day. Panel (a) contains the number of detected RFI sources, while panel (b) contains the percentage of caused disturbance. The caused disturbance is given relative to the total amount of expected rays (288 rays in one direction during a day at each elevation for each site).
Another factor not captured by the heat maps is the temporal variability and trend of the detected RFI sources. Therefore, the detected RFI sources are evaluated daily based on the four RFI categories since July 2017 over the entire time period (see Fig. 9). The number of detected RFI sources (Fig. 9a) and the caused disturbance (Fig. 9b) are shown. For both data sets, two linear regressions are calculated including RFI sources of all categories. The linear regressions are fitted from the initial start of the data collection July 2017 to October 2019, when the first version of the RFI detection algorithm was introduced, and from there until May 2022. For each linear regression the change per year is noted in the respective section.
In both panels the effectiveness of the introduced RFI detection algorithm is clearly visible by comparing the slope of the regression lines before and after October 2019. In addition, the difference between the number of detected RFI sources in each category and the respective amount of caused disturbance is very prominently shown by the colour coding, following the findings discussed before. In the top panel, a seasonal variation in the number of detected RFI sources is visible, which is more prominent for the short-lived and thereby sporadic RFI sources below zero severity. The increase in RFI sources during summertime could be caused by increased human activity outdoors or changing atmospheric beam propagation.
Even though only a few critical RFI sources are active on any given day, the amount of caused disturbance is dominated by these critical RFI sources. It is particularly interesting to observe the block-like structures of these critical RFI sources in the lower panel of Fig. 9 before October 2019. These blocks are caused by single critical RFI sources that start to disturb the radar data, are present for up to a couple of months and finally get removed, which then causes the sharp drop in disturbance. By comparing these structures before and after the introduction of the RFI detection algorithm, one can see the most important benefit, which is the decreased removal time of critical RFI sources. In 2018, it took on average about 2 to 6 months to remove a critical RFI, while after the initial implementation of the RFI detection algorithm in October 2019 the average time to removal decreased to a few weeks.
The decreased time to shut down an RFI source has an important implication. As the active duration of an RFI increases, the RFI severity also increases, up to the 30 d maximum. An RFI which starts out as severe can be quickly removed and not even become critical, leading to less caused disturbance overall. This has to be kept in mind when looking at the daily timeline (Fig. 9) or the yearly trends in Table 2. In general, a faster removal of RFI sources cannot decrease the total number of observed RFI sources, only the caused disturbance, which can lead to a decrease in RFI severity.
To conclude, even though we have now established a procedure to shut down persistent RFI sources, their generally sporadic nature hinders a quick mitigation and compromises data quality. The mitigation process itself is still time consuming, requiring on average several weeks for each RFI, but it has been optimised by improving communication with the NRA in terms of available information on each RFI and reorganising the reporting process. Every year, the equivalent of one full-time position at DWD has to be committed to the mitigation process to continue the successful removal of RFI sources in the radar data.
Another crucial finding not clearly visible in the timeline is the steady increase in RFI sources with a severity below zero. Table 2 contains a detailed analysis of the yearly trend in the number of detected RFI sources for each of the RFI categories. Even after the introduction of the RFI detection algorithm, the number of those RFI sources increases by 1.3 each year, which might at first sight seem irrelevant with respect to the 11 276 RFI sources in this category. However, those mostly short-lived RFI sources cannot be included in the mitigation process, as there is no chance for the NRA to identify the source of these. In addition, it has to be emphasised that even though the detection of RFI sources in radar data works quite well (e.g. Cho, 2017), there are no filter methods either in hardware or software available that are able to separate a superimposed external RFI signal from the meteorological signal. Depending on the strength of the superimposed RFI signal, more or less of the meteorological information is inevitably lost.
C-band weather radars are primary and therefore privileged users in their frequency band, which is, however, shared with Wi-Fi services. Wi-Fi services are required to not disturb weather radars by selecting an appropriate operating frequency via DFS (ETSI, 2012). It is the task of the national NRA to enforce the proper coexistence between weather radar and Wi-Fi services. If a weather radar is disturbed, the NRA has to identify the Wi-Fi service and shut it down. To deal with the increasing number of disturbances in the DWD weather radar network, the approach presented in this paper has been introduced. An efficient and reliable radar-data-based detection algorithm for RFI sources has been implemented in 2017. The automated classification of the RFI sources was added in October 2019 and was subsequently improved further.
The current RFI detection algorithm provides all the necessary information for DWD service personnel and the NRA, meaning that they are able to efficiently trace persistent Wi-Fi sources, which are present for at least a few days. If a severe RFI is detected, which is present for about 14 d, the NRA is nearly always able to find the source of the interference and shut it down. Even with this optimised approach, many work hours have to be put into the mitigation process, which by now has significantly reduced the amount of disturbance caused by RFI sources. The main factor contributing to the reduced disturbance is the reduction in lifetime of severe and critical RFI sources. These RFI sources are now removed within days or weeks, rather than within months as before. However, the number of appearing RFI sources is still steadily increasing (excluding critical RFI sources, again partially because of the reduced lifetime directly reducing their severity). It is also crucial to note that most severe and critical RFI sources do not cease to exist without active intervention. Therefore, before the introduction of the automated RFI detection, they tended to accumulate over time.
A comparison between the radar-data-based RFI detection algorithm and so-called RHunt measurements was shown. To achieve this, we have implemented an automatic scanning tool for the RHunt to record all identifiable Wi-Fi networks that operate in the 5 GHz C band. By comparing the recorded list of Wi-Fi networks with the direction of detected RFI sources, further information on the most likely RFI sources is available for the mitigation process. However, an absolute validation of the RFI detection algorithm was not possible with the utilised RHunt setup because of the limitations introduced by the commercial Wi-Fi adapter.
With our almost 5-year-long data set of disturbed rays, we can show that, in the short term in particular, sporadic RFI sources are increasing each year. The steady increase of short-term RFI sources is especially concerning due to the fact that they can not be tracked, identified or controlled by DWD or by the NRA in the field. Their sporadic nature currently creates a circumstance where we have to hope that they will not reappear irregularly in weekly or monthly intervals; as such, RFI sources are nearly impossible to trace. But with the increasing implementation of outdoor Wi-Fi we especially expect these hard to mitigate RFI sources to occur more often. Keeping in mind that the compromised meteorological signal cannot be recovered, the need for strict regulatory measures to enforce the expected coexistence of Wi-Fi services and the privileged weather radar systems in the C band must be emphasised. While current observations, especially of short-term interference, indicate a growing contradiction for the expected peaceful coexistence. As Saltikoff et al. (2016) put it: “This [keeping Wi-Fi devices out of the radar frequency band] must be an ongoing effort on all levels, and we cannot rest and think 'case solved'.”
This appendix contains explanations about the inner workings of the RFI detection algorithm and an additional figure. First, the overall process is described, followed by a detailed description of how RFI boxes are joined together.
-
Preparing the data. All disturbed rays (mean SQI below 0.6 and mean STD above 0.6) within the last 30 d are collected.
-
Combining disturbed rays. All disturbed rays within fixed 2 h windows are grouped if they are no further than 5∘ apart in azimuth. A group of such disturbed rays is called an RFI ray box. An RFI box is defined by an upper and lower boundary in azimuth, as well as a specific start and end time, resulting from the outermost disturbed rays captured in the box. Here rays are combined regardless of their elevation. Thereby, combining data from all four used scans (precipitation/terrain scan, volume scan at 0.5, 1.5, and 2.5∘ elevation). Due to the 2 h window and the 360∘ azimuth there could be up to 12 960 RFI ray boxes within a 30 d period. As there are generally only a few specific azimuth directions affected by interference at any given time, the number of initial RFI ray boxes for all 17 DWD sites combined is usually about 6000 for the 30 d period.
-
Joining the RFI (ray) boxes. This step is the core of the presented RFI detection algorithm. Here, two processing steps are alternately repeated until all RFI boxes with similar properties are joined in time and azimuth. This results in a few final RFI boxes which capture the persistent and strong interference. These two processing steps are explained in detail below.
-
Characterising the RFI boxes. All final RFI boxes are classified by an RFI class and RFI severity which are both described in Sect. 2.1.
-
Result visualisation and aggregation. The final RFI boxes contain detailed information on each detected RFI source. More information on this can be found in Sect. 2.2. Additionally, Fig. A1 shows RFI detection results over 6 months. Here one can see final RFI boxes over a longer timescale, including RFI boxes for RFI sources with a severity below zero (blue in the top panel). Some blue boxes do partially overlap with the red RFI boxes without being joined, especially around 23 March at about 145∘ azimuth, as those RFI boxes are not similar enough to be joined (for more details see explanation below).

Figure A1An operational RFI analysis from the radar site Türkheim (TUR) on 1 October 2018. Included are disturbed rays over 6 months. Panel (a) shows each disturbed ray as a dot in the scatter plot (colour of dots depicts the median SNR). All detected RFI sources with an RFI severity greater than or equal to zero are marked with a red box, while blue boxes mark RFI sources with an RFI severity below zero. In (b) additional properties of each red RFI box are displayed. The data in both bottom panels are accumulated into 5 min bins according to the time of day (y axis). Panel (b) shows SNR, and (c) shows the fraction of disturbed rays. Within the legend, the mean azimuth, mean elevation and RFI severity of each red RFI box are displayed.
The process of joining all similar RFI boxes is composed of two main steps, here distinguished as “merging” (step one) and “connecting” (step two) the RFI boxes. These two steps are alternately repeated until no further changes occur. Carrying out either or both of these two steps is referred to as “joining” RFI boxes. To execute any kind of join between RFI boxes, all boxes, which can be joined to a specific box, are first identified, and the resulting connections are evaluated before the actual join is executed. Thereby, RFI boxes which are not to be joined directly can be joined via a third box within one step of the iteration. This is most common for the time dimension, as there is always a fixed constraint on how far in time two RFI boxes may be joined together. To execute a join of two RFI boxes, the outermost azimuth angles and times of either box are used to define the new box. Afterwards the different disturbance fractions of the resulting RFI box are recalculated. The following is a description of the algorithm used to join RFI boxes.
- Similar RFI boxes
-
Only RFI boxes fulfilling at least one of these criteria may be joined together. If none of these three properties are met, the two RFI boxes are most likely originating from two independent interference sources and will therefore not be joined directly.
-
The absolute difference in number of disturbed rays has to be smaller than 50. This is mainly applicable to short-term RFI sources and the initial RFI ray boxes.
-
The difference in mean disturbance fraction is smaller than 10 %. This is the most common similarity as the mean disturbance fraction of most RFI sources is on the order of 10 %.
-
The difference in the “worst” disturbance fraction is smaller than 10 %.
-
- Step 1: merging RFI boxes
-
Similar RFI boxes with matching azimuth boundaries are merged in a small time window.
-
The lower and upper azimuth boundaries of two RFI boxes have to line up within ±2∘.
-
The two RFI boxes may only be up to 24 h apart in time to be considered for merging.
-
- Fully enclosed RFI boxes
-
There can be some RFI boxes that are not merged and are fully enclosed after the merge step. This mostly happens if a 2 h ray box is enclosed by two neighbouring boxes that are much wider in azimuthal width (more than the allowed 2∘ on each edge). These fully enclosed boxes are dissolved into the RFI box enclosing them (without accounting for similarity). If an RFI box is fully enclosed by multiple other boxes, it is dissolved into the box with the best matching mean disturbance fraction.
- Step 2: connecting RFI boxes
-
Similar RFI boxes with a similar mean direction are connected bridging long time periods.
-
The mean azimuth (weighted by SNR of each ray) of two RFI boxes has to be within ± 4∘.
-
The difference in azimuthal width is explicitly limited to a maximum of 10∘.
-
The two RFI boxes may only be up to 7 d apart in time to be connected.
-
- Fully enclosed RFI boxes
-
These are again dissolved as described before.
Repeating these two steps ensures a consistent and formal way of identifying resulting RFI boxes and thereby RFI sources. In most cases, these two steps only have to be carried out once after which no further changes occur. When using this approach for long timescales (over years as in Sect. 4), some of the joined RFI boxes resulting from either of the two steps can have changed RFI box properties regarding the “similar RFI box” rule, which requires further iterations of the two steps.
During data acquisition, every detected Wi-Fi network is tagged with the respective azimuth position of the radar antenna. The following sequence of steps is carried out at 0∘ elevation to acquire the RHunt data.
-
Operational scanning is disabled.
-
The radar transmitter is set to operate with a pulse repetition frequency (PRF) of 600 Hz and a pulse length of 0.8 µs, as a transmitting radar is a prerequisite for the DFS of Wi-Fi transmitters to work properly.
-
The following steps are repeated until the full sweep is acquired.
- a.
The radar antenna is moved in 1∘ steps at a constant elevation of 0∘.
- b.
Before the actual data acquisition is started, the antenna is fully stopped.
- c.
All identifiable Wi-Fi sources are recorded with the RHunt, which takes about 10 s. Each record is tagged with a time stamp and the azimuth position and contains all information available from the commercial Wi-Fi receiver. This is done by using the Linux command “sudo iwlist wlan0 scan” on the Raspberry Pi and gathering all of the relayed information. This generally includes the MAC address, a signal power level, encryption method and an (possibly empty) ESSID. The exact information that can be collected depends not only on the used hardware and its capabilities but also on the used Linux drivers. It should also be noted that in order to get accurate real-time results, the scan must be executed with root permissions. Otherwise, the Linux kernel returns a cached result, which can be up to 1 min old.
- a.
-
After the data acquisition of the complete sweep, the radar immediately starts with operational scanning including the respective RFI detection, thereby enabling a direct comparison between the RHunt data and the raw radar data.
Python code used for the presented analysis is available upon request from the corresponding author. To obtain polarimetric DWD radar data, please contact DWD customer relations at kundenservice@dwd.de. Basic DWD radar data can be obtained via https://www.dwd.de (last access: 2 November 2022; German Meteorological Service, 2022).
MS implemented the RFI detection algorithm, the subsequent optimisations and the RHunt data processing and wrote this paper. MF set up the interference monitoring in 2017, supported the entire project, edited the text and provided mentoring, especially during the early drafting phase. DM implemented the hardware control for the RHunt measurements and added details regarding the RHunt data acquisition. CH contributed the basis for the PPI visualisations and helped edit the text. BR edited the text and added details regarding Wi-Fi regulations and the RHunt setup.
The DWD is a member of OPERA (the radar programme of EUMETNET). In OPERA, a European interference detection is currently being set up by Vera Meyer (ZAMG). The contact author has declared that none of the authors has any further competing interests.
Publisher's note: Copernicus Publications remains neutral with regard to jurisdictional claims in published maps and institutional affiliations.
The authors are very grateful for the valuable input from my colleagues at DWD whose contributions made this paper much more concise. The support of this group of people allows for a very motivating, goal-oriented and productive workflow. The presented RFI detection algorithm is based on the approach utilised in the GAMIC signal processor to use the STD moment and respective thresholds to reliably detect interference in radar data. The RHunt hardware setup was inspired by AustroControl, who use a similar setup in their radars. Contributions from Maximilian Schaper were supported by the DWD Innovation in Applied Research and Development (IAFE) programme under the project “VH 3.10 Radarmonitoring”.
This paper was edited by Gianfranco Vulpiani and reviewed by two anonymous referees.
Besic, N., Figueras i Ventura, J., Grazioli, J., Gabella, M., Germann, U., and Berne, A.: Hydrometeor classification through statistical clustering of polarimetric radar measurements: a semi-supervised approach, Atmos. Meas. Tech., 9, 4425–4445, https://doi.org/10.5194/amt-9-4425-2016, 2016. a
Carroll, J. E., Sanders, F. H., Sole, R. L., and Sanders, G. A.: Case Study: Investigation of Interference into 5 GHz Weather Radars from Unlicensed National Information Infrastructure Devices, Part I, Tech. Rep. TR-11-473, NTIA, https://its.ntia.gov/umbraco/surface/download/publication?reportNumber=11-473.pdf (last access: 2 November 2022), 2010. a, b
Cho, J. Y. N.: A New Radio Frequency Interference Filter for Weather Radars, J. Atmos. Ocean. Tech., 34, 1393–1406, https://doi.org/10.1175/JTECH-D-17-0028.1, 2017. a, b, c
ECC: Report 192; The Current Status of DFS (Dynamic Frequency Selection) In the 5 GHz frequency range, Tech. rep., European Conference of Postal and Telecommunications Administrations (CEPT), Electronic Communications Committee (ECC), Denmark, https://docdb.cept.org/download/729 (last access: 2 November 2022), 2014. a, b
ETSI: Broadband Radio Access Networks (BRAN); 5 GHz high performance RLAN; Harmonized EN covering the essential requirements of article 3.2 of the R&TTE directive, ETSI Rep. ETSI EN 301 893 V1.7.1 (2012-06), Tech. rep., ETSI, http://www.etsi.org/deliver/etsi_en/301800_301899/301893/01.07.01_60/en_301893v010701p.pdf (last access: 2 November 2022), 2012. a, b, c, d
Frech, M.: Monitoring the data quality of the new polarimetric weather radar network of the German Meteorological Service, in: 36th AMS Conf. on Radar Meteorology, Breckenridge, CO, USA, 16–20 September 2013, AMS, Abstract no. 9B.3, 16 pp., 2013. a
Frech, M., Lange, B., Mammen, T., Seltmann, J., Morehead, C., and Rowan, J.: Influence of a Radome on Antenna Performance, J. Atmos. Ocean. Tech., 30, 313–324, 2013. a
Frech, M., Hagen, M., and Mammen, T.: Monitoring the Absolute Calibration of a Polarimetric Weather Radar, J. Atmos. Ocean. Tech., 34, 599–615, https://doi.org/10.1175/JTECH-D-16-0076.1, 2017. a
GAMIC: Weather Radar Signal Processor ENIGMA V, Digitial Receiver and Signal Processor for enhanced Radar Data, data sheet, https://www.gamic.com/signal-processing/enigma-v, last access: 2 November 2022. a, b
German Meteorological Service (Deutscherwetterdienst, DWD): https://www.dwd.de, last access: 2 November 2022. a
Huuskonen, A., Saltikoff, E., and Holleman, I.: The Operational Weather Radar Network in Europe, B. Am. Meteorol. Soc., 95, 897–907, https://doi.org/10.1175/BAMS-D-12-00216.1, 2014. a, b
ITU-R: Resolution 229 [COM5/16] (WRC-03); Use of the bands 5150–5250 MHz, 5250–5350 MHz and 5470–5725 MHz by the mobile service for the implementation of wireless access systems including radio local area networks, Tech. rep., ITU, The World Radiocommunication Conference, Geneva, http://www.itu.int/oth/R0A0E00002E/en (last access: 2 November 2022), 2003. a
Keränen, R., Rojas, L., and Nyberg, P.: Progress in mitigation of WLAN interference at weather radar, in: Proceedings of 36th Conference on Radar Meteorology, 16–20 September, 2013, Vaisala Oyj and University of Helsinki, Breckenridge, CO, Amer. Meteor. Soc., P15.336, 8 pp., https://ams.confex.com/ams/36Radar/webprogram/Manuscript/Paper229098/AMS_36th_Radar_P15P336_Mitigation_WLAN_Interferences.pdf (last access: 2 November 2022), 2013. a
Palmer, R., Whelan, D., Bodine, D., Kirstetter, P., Kumjian, M., Metcalf, J., Yeary, M., Yu, T.-Y., Rao, R., Cho, J., Draper, D., Durden, S., English, S., Kollias, P., Kosiba, K., Wada, M., Wurman, J., Blackwell, W., Bluestein, H., Collis, S., Gerth, J., Tuttle, A., Wang, X., and Zrnić, D.: The Need for Spectrum and the Impact on Weather Observations, B. Am. Meteorol. Soc., 102, E1402–E1407, https://doi.org/10.1175/BAMS-D-21-0009.1, 2021. a
Peura, M.: Computer vision methods for anomaly removal, in: Proceedings of the 2nd European Conference on Radar Meteorology (ERAD), Finnish Meteorological Institute, Delft, the Netherlands, 312–317, https://www.copernicus.org/erad/online/erad-312.pdf (last access: 2 November 2022), 2002. a
Rojas, L. C., Moisseev, D. N., Chandrasekar, V., Sezler, J., and Keraenen, R.: Progress in mitigation of WLAN interference at weather radar, in: Proceedings of the 7th European conference on Radar in meteorology and hydrology (ERAD), Toulouse, France, Abstract no. 326, http://www.meteo.fr/cic/meetings/2012/ERAD/extended_abs/SP_326_ext_abs.pdf (last access: 2 November 2022), 2012. a
Saltikoff, E., Cho, J. Y. N., Tristant, P., Huuskonen, A., Allmon, L., Cook, R., Becker, E., and Joe, P.: The Threat to Weather Radars by Wireless Technology, B. Am. Meteorol. Soc., 97, 1159–1167, https://doi.org/10.1175/BAMS-D-15-00048.1, 2016. a, b, c, d, e
Steinert, J., Tracksdorf, P., and Heizenreder, D.: Hymec: surface precipitation type estimation at the German Weather Service, Weather Forecast., 36, 1611–1627, https://doi.org/10.1175/WAF-D-20-0232.1, 2021. a
- Abstract
- Introduction
- Identification of an RFI
- Validating the RFI detection algorithm
- Long-term interference statistics of the radar network
- Conclusions
- Appendix A: Technical details of the RFI detection
- Appendix B: RHunt data acquisition
- Code and data availability
- Author contributions
- Competing interests
- Disclaimer
- Acknowledgements
- Review statement
- References