the Creative Commons Attribution 4.0 License.
the Creative Commons Attribution 4.0 License.
 | 18 Nov 2022
A lightweight broadband cavity-enhanced spectrometer for NO2 measurement on uncrewed aerial vehicles
Caroline C. Womack
Steven S. Brown
Steven J. Ciciora
Ru-Shan Gao
Richard J. McLaughlin
Michael A. Robinson
Yinon Rudich
Rebecca A. Washenfelder
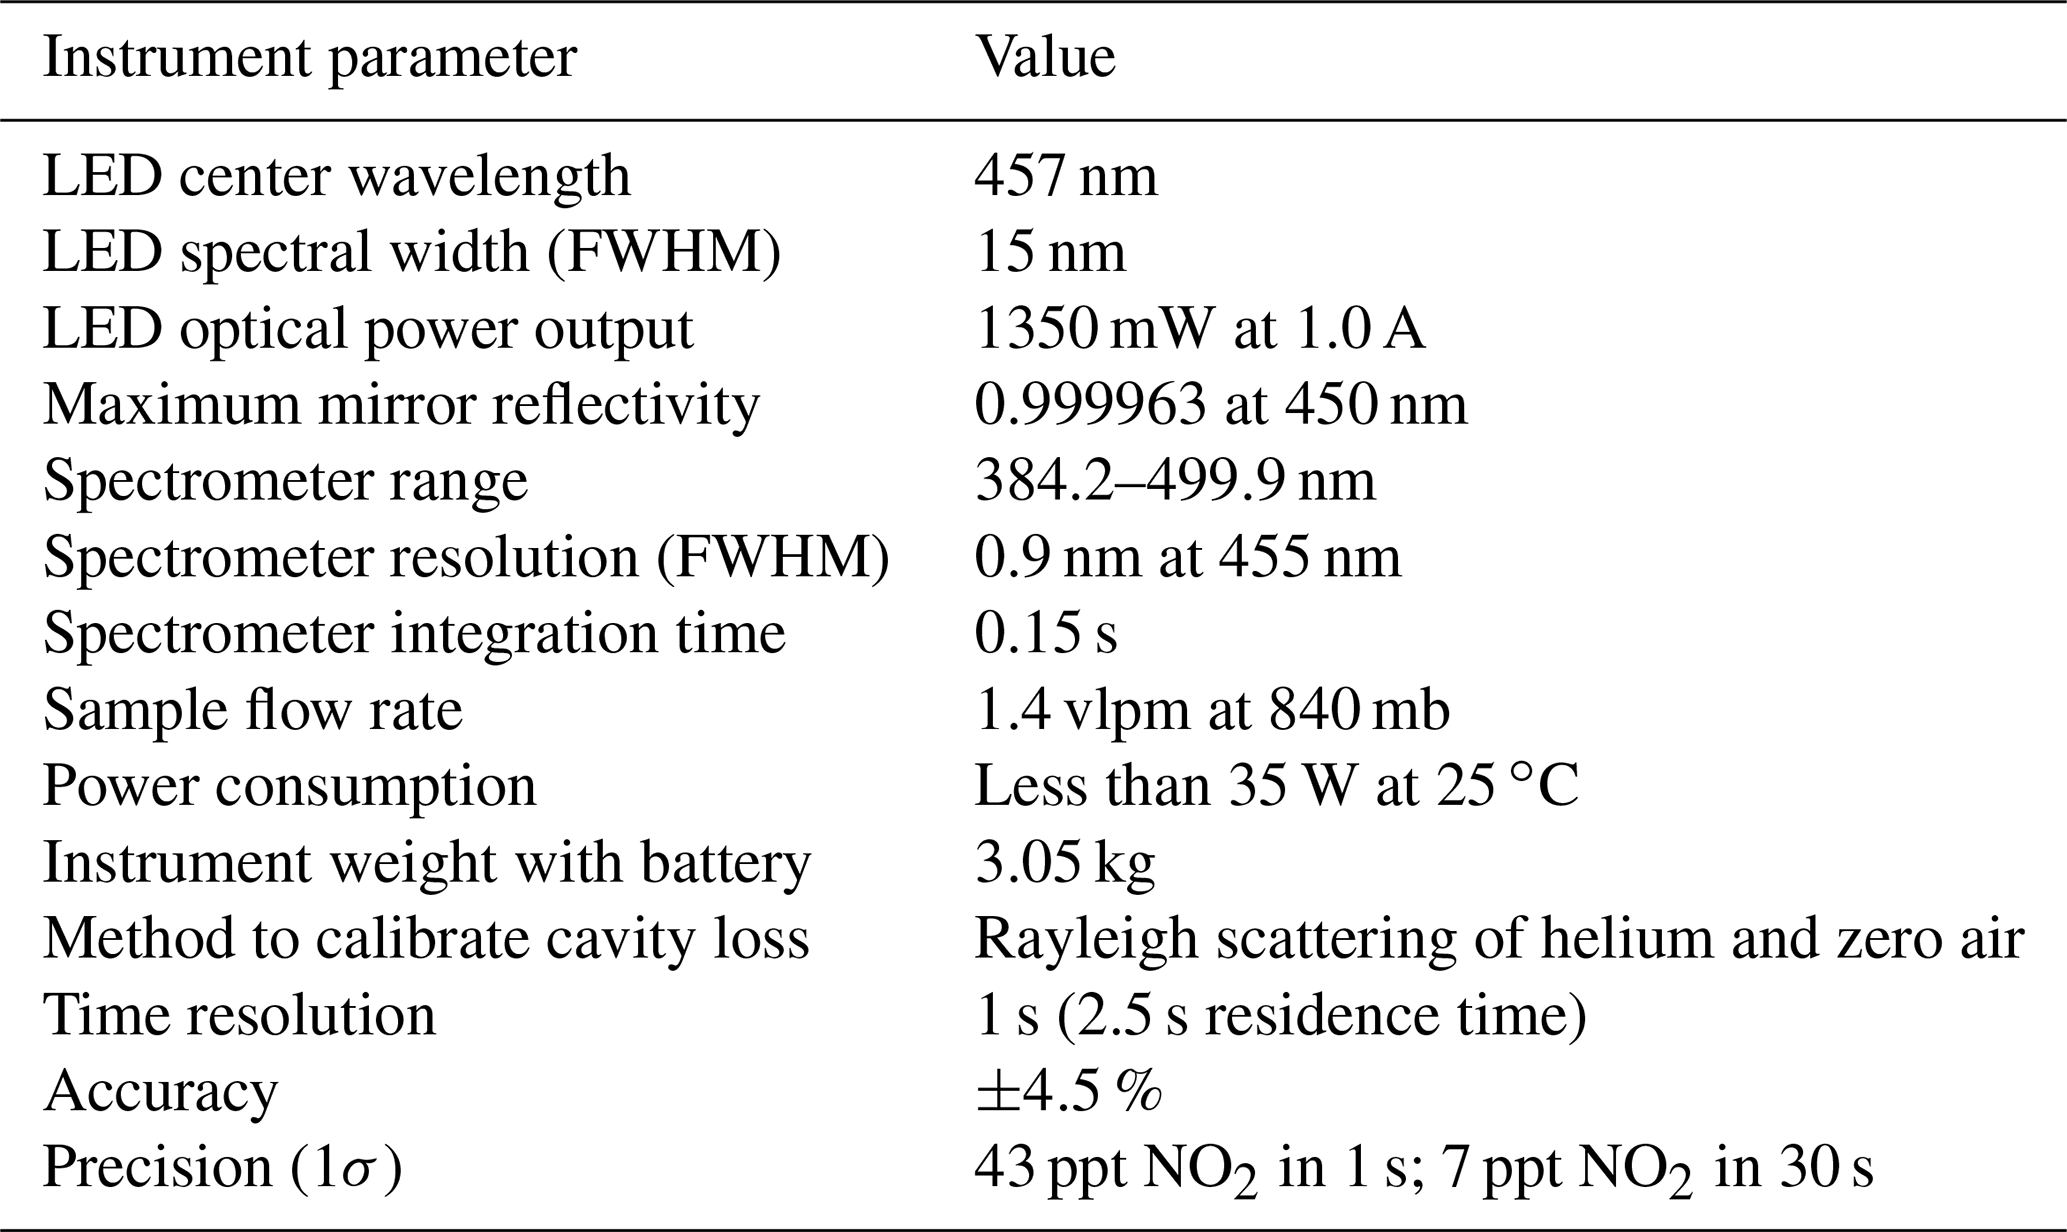
We describe the design and performance of a lightweight broadband cavity-enhanced spectrometer for measurement of NO2 on uncrewed aerial vehicles and light aircraft. The instrument uses a light-emitting diode (LED) centered at 457 nm, high-finesse mirrors (reflectivity =0.999963 at 450 nm), and a grating spectrometer to determine optical extinction coefficients between 430 and 476 nm, which are fit with custom spectral fitting software and published absorption cross sections. The instrument weighs 3.05 kg and has a power consumption of less than 35 W at 25 ∘C. A ground calibration unit provides helium and zero air flows to periodically determine the reflectivity of the cavity mirrors using known Rayleigh scattering cross sections. The precision (1σ) for laboratory measurements is 43 ppt NO2 in 1 s and 7 ppt NO2 in 30 s. Measurement of air with known NO2 mixing ratios in the range of 0–70 ppb agreed with the known values within 0.3 % (slope ; r2=0.99983). We demonstrate instrument performance using vertical profiles of the NO2 mixing ratio acquired on board an uncrewed aerial vehicle between 0 and 110 m above ground level in Boulder, Colorado.
- Article
(2756 KB) - Full-text XML
- BibTeX
- EndNote


The availability of uncrewed autonomous vehicles for land, air, and sea has the potential to improve environmental sampling by allowing better geographical and spatial coverage at lower cost than crewed platforms. Uncrewed aerial vehicles (UAVs) can be divided into five categories based on their weight, i.e., nano (<0.250 kg), micro (0.25–2 kg), small (2–25 kg), medium (25–150 kg), and large (>150 kg). Even the largest UAVs have limited payloads compared to crewed aircraft and require lightweight instruments with low power consumption.
Miniaturized research-grade atmospheric instruments that weigh less than ∼5 kg have important potential for deployment on small and medium UAV platforms. Lightweight sampling payloads have already been demonstrated for UAVs (Ramana et al., 2007; Telg et al., 2017). Existing miniaturized aerosol instruments include a condensation particle counter for aerosol size distribution (Model 9403; Brechtel Manufacturing Inc., Hayward, CA, USA) (Bates et al., 2013), an optical particle counter for aerosol size distribution (Gao et al., 2016), a sun photometer for solar irradiance and sky radiance (Murphy et al., 2016), and a three-wavelength absorption photometer for light absorption coefficients (Model 9406; Brechtel Manufacturing Inc., Hayward, CA, USA) (Bates et al., 2013). Many miniaturized gas-phase instruments exist, including for methane (e.g., Nathan et al., 2015), CO2 (Zhao et al., 2022), and ozone (e.g., Deshler et al., 2008; Kezoudi et al., 2021), with varying accuracy and detection limits depending on the detection technique.
Among the potential target gas species, accurate measurements of nitrogen oxide (NO) and nitrogen dioxide (NO2) concentrations are crucial due to their role in atmospheric photochemical oxidation. Most NO2 in the lower troposphere is oxidized from NO emitted from fossil fuel combustion and biomass burning, and NO2 and NO typically photochemically equilibrate within a few minutes (Masson-Delmotte et al., 2021). Smaller sources of tropospheric NOx (NO+NO2) include soils and lightning (Masson-Delmotte et al., 2021). Characterizing horizontal and vertical NO2 concentration gradients is important due to its heterogeneous sources and variable lifetime. Additionally, there is a need for in situ NO2 measurements to validate remote sensing methods, particularly those available from recent and planned satellite instruments, such as the TROPOspheric Monitoring Instrument (TROPOMI), the Geostationary Environmental Monitoring Spectrometer (GEMS), and Tropospheric Emissions Monitoring of Pollution (TEMPO).
NO2 instruments with parts-per-trillion by mole (ppt) precision, an accuracy of a few percent, a linear response over 2 to 3 orders of magnitude, and ∼1 s time response are needed for satellite validation, air quality monitoring, and atmospheric studies. Successful field instruments that meet these criteria use laser-induced fluorescence (e.g., Thornton et al., 2000), cavity-attenuated phase-shift spectroscopy (e.g., Kebabian et al., 2005), cavity ring-down spectroscopy (e.g., Wild et al., 2014), broadband cavity-enhanced spectroscopy (e.g., Min et al., 2016), or conversion to NO with subsequent detection by chemiluminescence (e.g., Ryerson et al., 2000) or laser-induced fluorescence. However, the current implementations of these instruments are too large and heavy to be deployed on board UAVs, and some have power consumption requirements that exceed what can be supplied by batteries. Small, lightweight electrochemical NO2 sensors exist but lack the desired precision, time response, and accuracy for scientific field studies and can be affected by chemical interferences, relative humidity, and temperature (Williams et al., 2014). Broadband cavity-enhanced spectroscopy and cavity ring-down spectroscopy have great potential for miniaturization due to their relative simplicity, small set of required components, and modest power and pump requirements. For example, a commercial cavity ring-down instrument for aerosol extinction has been developed recently that weighs 7.7 kg and measures 0.5 m × 0.3 m × 0.2 m (Optical Extinction Analyzer; Nikira Labs, Mountain View, CA, USA).
In this work, we describe the Miniature Airborne broadband Cavity-Enhanced Spectrometer (mACES) that weighs 3.05 kg and measures NO2 with a precision (1σ) of 43 ppt in 1 s. The instrument design and reduced weight allow it to be operated on board a small rotary-wing UAV to measure spatial distributions of NO2 in the lowest part of the troposphere. We present the precision and accuracy of the NO2 instrument along with measurements of ambient NO2 acquired between 0 and 110 m above ground level during test flights on board a DJI Matrice 600 Pro UAV. Finally, we discuss the use of this instrument in future field deployments and potential improvements to further reduce the instrument weight and improve the measurement precision.
Broadband cavity-enhanced spectrometers (BBCES) are used at visible and ultraviolet wavelengths to measure aerosol extinction or structured absorption by gases (Fiedler et al., 2003; Washenfelder et al., 2008). BBCES instruments consist of a broadband light source coupled to an optical cavity, with the output measured by a grating spectrometer. Field measurements of NO2 from the ground and aircraft using BBCES have been described previously (Kennedy et al., 2011; Washenfelder et al., 2011b; Min et al., 2016; Zarzana et al., 2017). We designed a miniaturized version of our aircraft BBCES instrument (Min et al., 2016) with reduced size and weight for operation on a UAV platform while maintaining measurement precision and accuracy. The weight of the instrument has been reduced to 3.05 kg with a power consumption of 15–35 W, depending on the ambient temperature and the cooling requirements for the light source and spectrometer. A summary of the instrument specifications is given in Table 1. The optical system, flow system, mechanical mounting, and data acquisition are described in detail below.
2.1 Optical system
The optical system is shown in Fig. 1a and consists of a light-emitting diode (LED), an off-axis parabolic mirror, an optical cavity, a bandpass filter, a collection lens, an optical fiber, and a grating spectrometer with a charge-coupled device (CCD) array detector. An LED centered at 457 nm with a full width at half maximum of 15 nm (LZ1-00B202; LEDEngin Inc., San Jose, CA, USA) is powered by a custom constant-current power supply (3.7 VDC at 1.0 A) and is temperature-controlled at 22.50±0.05 ∘C using a thermoelectric cooler (TEC; CP60233, CUI Devices, Tualatin, OR, USA). The LED light is collected with an off-axis parabolic mirror (50328AL, 2.0 cm effective focal length; Newport Corp., Irvine, CA, USA) and free-space-coupled into a 22.3 cm-long cavity formed by two 2.5 cm diameter, 0.5 m radius of curvature mirrors (FiveNines Optics, Boulder, CO, USA) with a measured reflectivity of 0.999963 at 450 nm. Light output from the cavity is filtered with a bandpass filter (FF01-452/45-25; Semrock Inc., Rochester, NY, USA) and coupled into a 1 m-long circular optical fiber (600 µm diameter; Ocean Insight Inc., Dunedin, FL, USA). Stray light is minimized using the bandpass filter and baffling. The optical system is initially rough-aligned using a small HeNe laser mounted on the laboratory bench. The mirror mounting plates are then finely aligned on their carbon support rods using fixed clamps with set screws to maximize cavity throughput before locking the mounting plates in their final position.
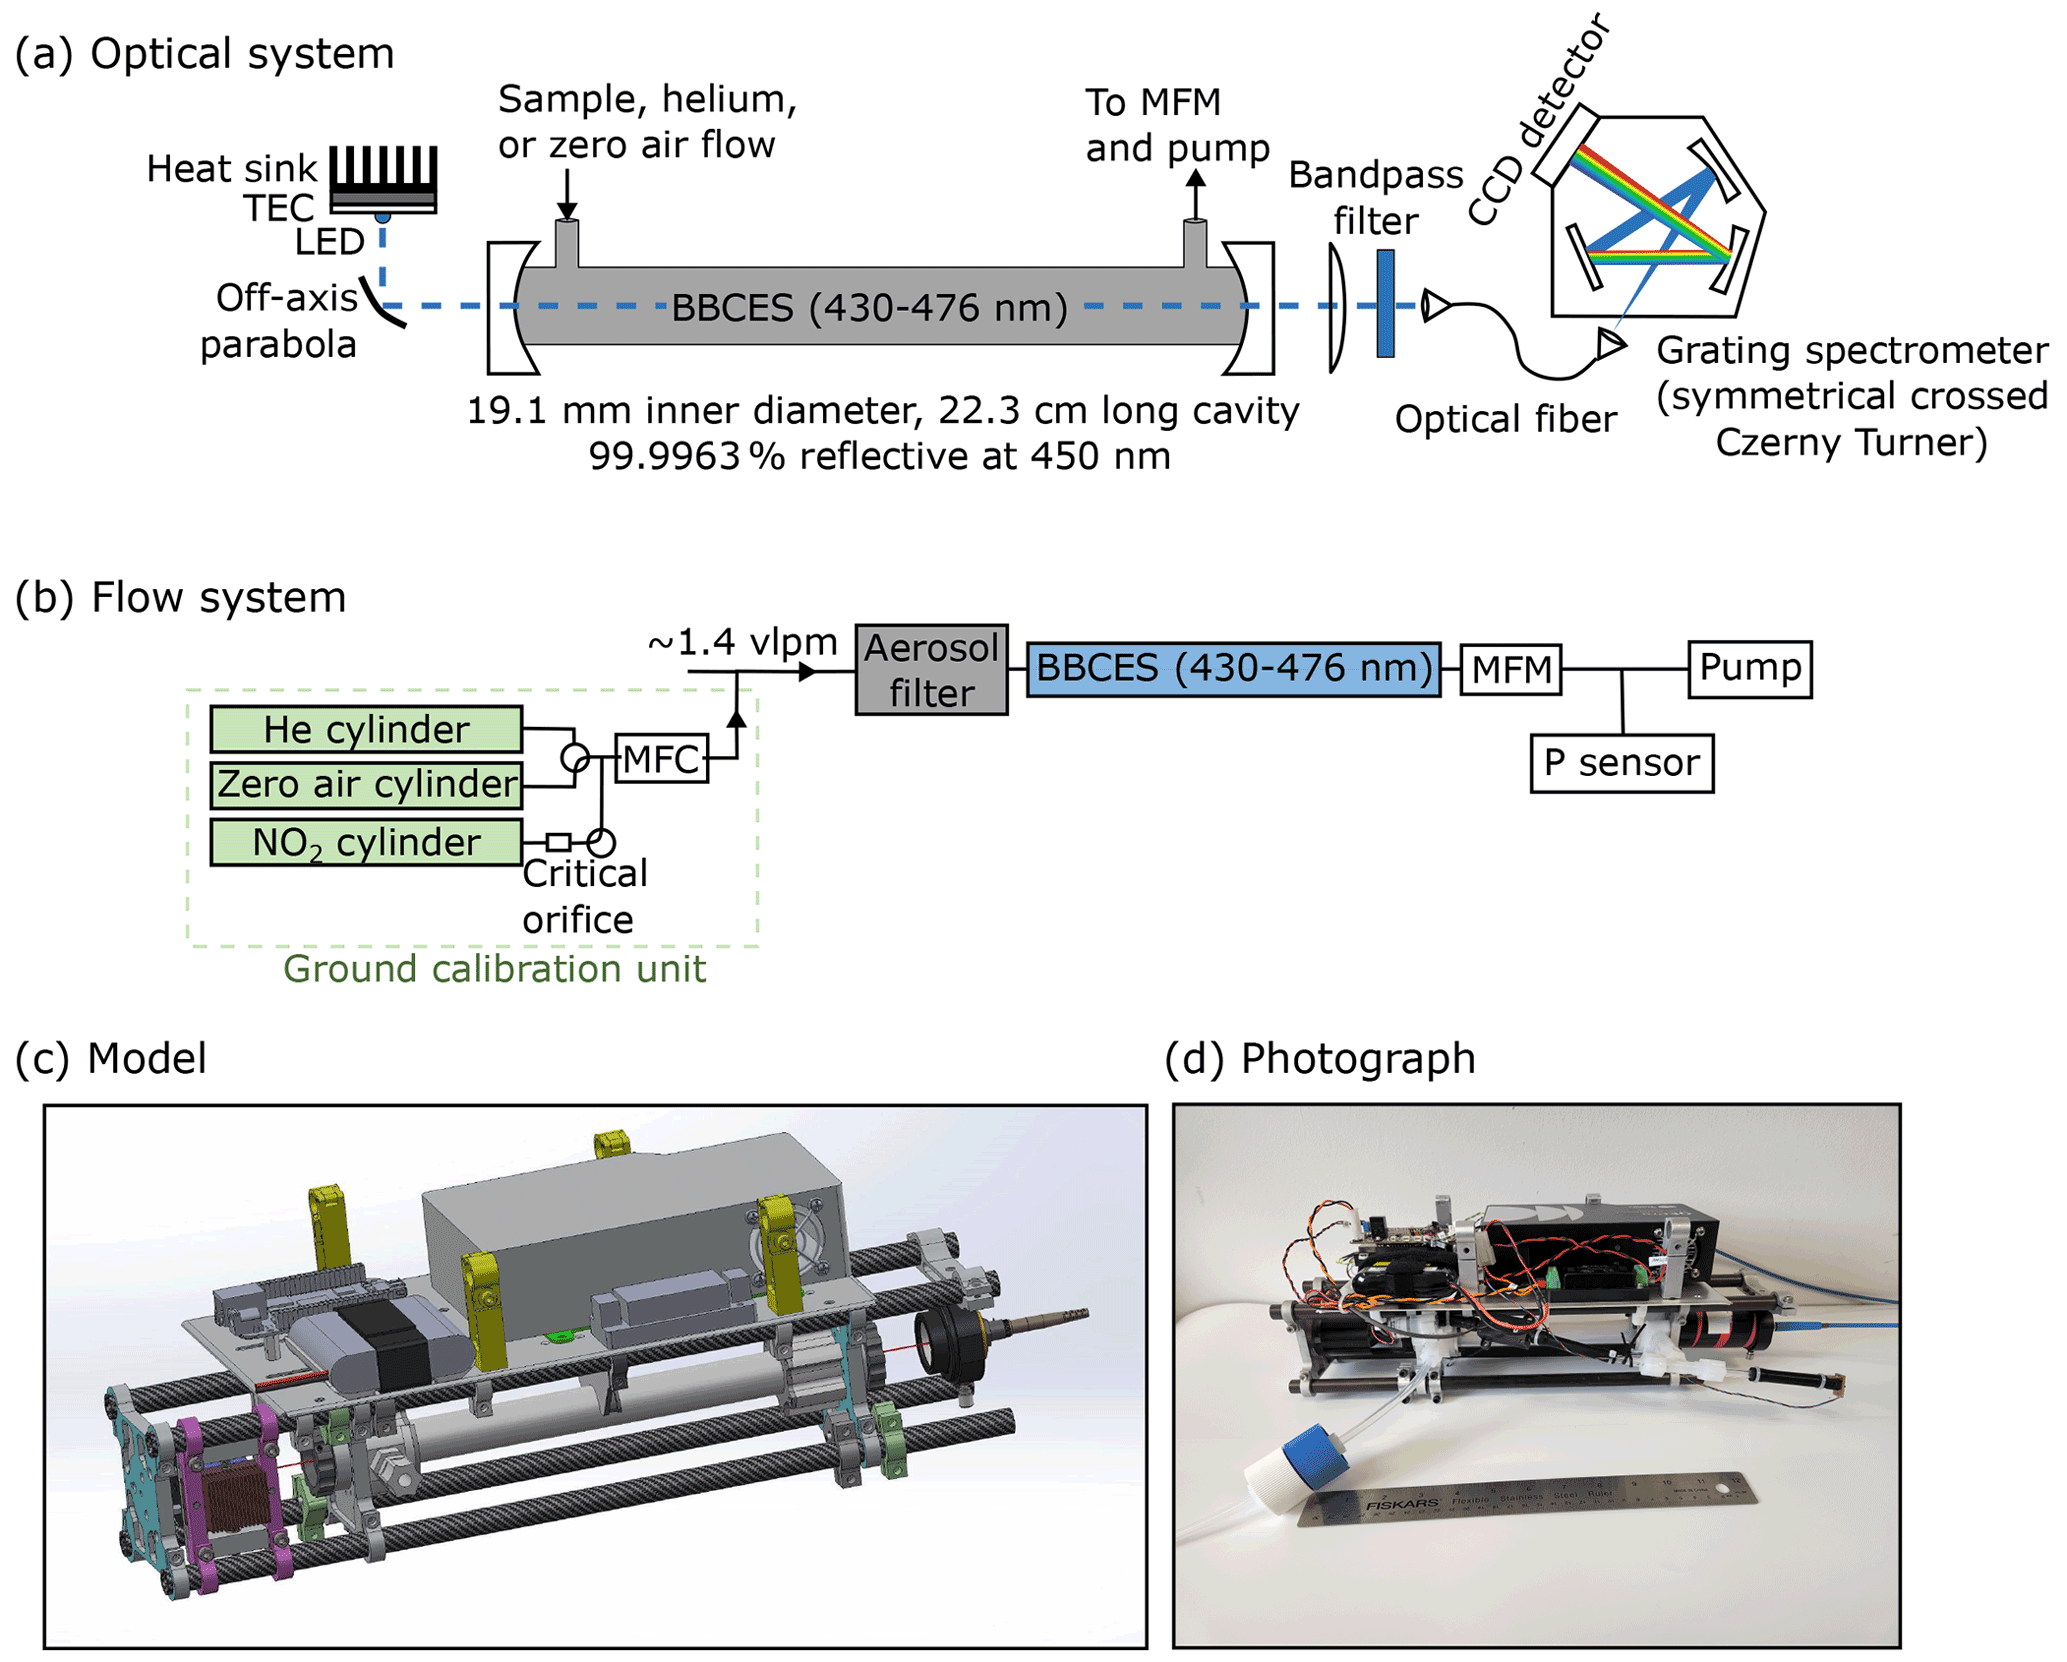
Figure 1(a) Schematic of the optical system, showing the LED, off-axis parabolic mirror, optical cavity, and spectrometer. (b) Block diagram of the flow system, showing the ground calibration unit, inlet filter, sample cell, mass flow meter (MFM), pressure sensor, and pump. (c) Model of the instrument, with quick-release clamps for mounting the instrument onto the drone highlighted in yellow. (d) Photograph of the instrument. The total dimensions of the instrument are approximately cm (length × width × height).
The spectrum is measured by a grating spectrometer (QE Pro; Ocean Insight Inc., Dunedin, FL, USA) with a 200 µm-wide entrance slit and a 1024×58 array of 18-bit pixels. The spectral region spans 384.3–499.9 nm with an average full-width at half-maximum (FWHM) resolution of 0.9 nm across the entire spectral region. The integration time for each spectrum is 0.15 s. The QE Pro is more limited in its spectral line shape and dark noise than the SP2150 spectrometer and PIXIS2KBUV CCD (Princeton Instruments, Trenton, NJ, USA) used in our aircraft instrument (Min et al., 2016). However, the QE Pro weighs only 1.15 kg compared to 6.8 kg, requires no physical shutter, and can read out the vertically integrated CCD in 0.002 s, allowing a spectrometer duty cycle of 99 % for a 0.15 s integration time.
2.2 Flow system
The flow system is shown in Fig. 1b and consists of a filter, an optical cavity, a pressure sensor, a flow sensor, and a pump. Aerosol particles are removed by a single-stage filter assembly (401-21-25-50-21-2; Savillex, Eden Prairie, MN, USA) with replaceable 0.45 µm-pore polytetrafluoroethylene (PTFE) filters (450-25-2; Savillex, Eden Prairie, MN, USA). During the test flights described here, the sampling inlet was a 0.635 cm OD Teflon tube that extended 0.2 m directly above the UAV rotors and was secured to the drone's antenna. The optical cavity is constructed from PTFE (1.90 cm ID), and the sample flow enters and exits through PTFE Teflon fittings. NO2 has negligible losses on Teflon (Fuchs et al., 2009; Min et al., 2016). The cavity mirrors are sealed using o-rings on their face and a mirror holder that compresses them against the mounting plate. Following the approach described in Min et al. (2016), mirror purges for the cavity mirrors are not used, as they require a bulky and relatively heavy zero air source. The lack of mirror purges makes maintaining mirror cleanliness, monitored using the measured mirror reflectivity (see Sect. 3), especially critical. Mirrors are removed and cleaned as necessary, approximately monthly, but may require more frequent cleaning when sampling in polluted atmospheres. Sample pressure is measured by a miniature pressure sensor (24PCCFA6A; Honeywell, Golden Valley, MN, USA). Sample flow is measured by a miniature flow sensor (D6F; Omron, Kyoto, Japan) that was calibrated from 0 to 2.0 volumetric liters per minute (vlpm) (DryCal; Mesa Laboratories Inc., Lakewood, CO 80228). The flow is pulled through the cavity using a small rotary vane pump (G 6/01-K-LCL; Gardner Denver Thomas GmbH, Fürstenfeldbruck, Germany) with a typical flow rate of 1.4 vlpm at 840 hPa. The volume of the cavity is 63 cm3, resulting in a residence time of 2.5 s. The residence time in the sampling inlet line is estimated as 0.2 s and therefore did not add significantly to the total residence time. Density inside the cavity is determined from the measured pressure and the ambient temperature measured by a thermistor mounted to the outside of the cavity tubing.
2.3 Electrical system
The maximum total power consumption of the instrument is 35 W but varies with ambient temperature because the LED and CCD are temperature-controlled. The instrument is powered by a 14.8 V, 2200 mAh rechargeable Li ion battery pack (31021; Tenergy Corp., Fremont, CA, USA). The major contributors to the power consumption are the LED, TEC for the LED, and spectrometer. The measured battery lifetime of the full system in the laboratory is 2 h 20 min but is shorter at higher operating temperatures.
2.4 Data acquisition hardware and software
The data acquisition system consists of a custom printed circuit board (PCB) that distributes power and acquires signals and a lightweight, single-board computer with the Linux operating system (BeagleBone Black Rev C; BeagleBoard.org, Oakland, MI, USA). The PCB acquires analog and digital inputs from two temperature sensors (measuring the cavity and ambient temperatures), a pressure sensor, and a flow sensor. The TEC is controlled by a PCB-mountable Peltier Controller module (TEC-1092, Meerstetter Engineering GmbH, Rubigen, Switzerland) and interfaces with the BeagleBone computer via serial connection to record LED temperature and TEC current. The data acquisition software is written in C/C and used the Ocean Insight SeaBreeze API v3.0.11 device driver for embedded platforms to interface with the spectrometer. LED temperature, ambient temperature, sample pressure, sample flow, and spectra are acquired at an integration time of 0.15 s and are later averaged to 1 s. However, the sample residence time of 2.5 s in the optical cavity is the limiting factor for the time resolution. On the ground, communication with the BeagleBone computer uses an HTML interface with the Linux operating system.
2.5 Mechanical system
The mechanical assembly of the instrument is shown in Fig. 1c. The optical, flow, and electrical components are mounted onto a cage system consisting of 1.27 cm diameter hollow carbon fiber rods (GR-CFR-TUBE-0.500OD; GraphiteStore, Northbrook, IL, USA). Optical components are attached to the rods using custom-designed aluminum plates (0.76 cm thick). The instrument performance depends on the stability of the optical alignment, and all mechanically adjustable components were secured by screws or other locking components. The BeagleBone computer, custom electronics board, spectrometer, and batteries are attached to a 0.16 cm-thick aluminum sheet. The instrument is attached to the underside of the Matrice 600 Pro UAV using four quick-release brackets that are secured with thumbscrews. No additional weather proofing is included in the instrument because the Matrice 600 Pro UAV is not designed to fly in rain, snow, fog, or wind speeds exceeding 8 m s−1. The total hardware cost of the mACES instrument is approximately USD 20 000 and is dominated by the cost of the spectrometer and the high-finesse cavity mirrors.
2.6 Matrice 600 Pro UAV
The Matrice 600 Pro is a small six-rotor UAV (DJI; Shenzhen, China) that weighs 10.0 kg without payload and has a maximum takeoff weight of 15.5 kg. The Matrice 600 Pro is powered by six Li ion (22.8 V, 5700 mAh) batteries that support a flight time equal to
which is equivalent to 27 min for the current instrument weight of 3.05 kg. The UAV is specified for operation at temperatures of −10–40 ∘C, wind speeds less than 8 m s−1, and dry conditions. Its maximum altitude is 2500 m above ground level, with maximum ascent and descent velocities of 5 and 3 m s−1 respectively, although current US FAA regulations restrict UAV flight in Class G airspace to 120 m above ground level unless a waiver is obtained. With the propellers and frame arms unfolded, it measures 1.7 m × 1.5 m × 0.7 m. An onboard computer records position, altitude, and auxiliary data. The Matrice 600 Pro is actively controlled by an operator with line-of-sight communication, although the onboard avionics allow for stability and landing.
The light extinction in the cavity, αext(λ), is calculated following the approach described in Min et al. (2016):
where λ is the wavelength of light, d is the cavity length, R(λ) is the mirror reflectivity, αRay, ZA(λ) is the Rayleigh scattering of zero air, IZA(λ) is the reference spectrum of zero air, and Isample(λ) is the measured spectrum of ambient air. The term ΔαRay(λ) is equal to and is needed to explicitly account for pressure differences between the Rayleigh scattering of the reference zero air spectrum, IZA(λ), acquired on the ground and the sample spectrum, Isample(λ), acquired on the UAV.
The mirror reflectivity, R(λ), in Eq. (2) can be determined using standard additions of known extinction. In this case, we use the known Rayleigh scattering of helium and zero air. These are added sequentially while the instrument is on the ground, using compressed helium and zero air with a mass flow controller (MC-5SLPM-D-DB15; Alicat Scientific Inc., Tucson, AZ, USA) to overflow the inlet. We use the Rayleigh scattering cross sections described in Min et al. (2016), which are based on work by Bodhaine et al. (1999), Shardanand and Rao (1977), and Sneep and Ubachs (2005).
The measured extinction, αext(λ), is equal to the sum of the contributing extinctions:
where σi(λ) and Ni are the absorption cross section and number density of the ith gas-phase absorber and p(λ) is a fourth-order polynomial that encompasses the broad features in the measured extinction that can be attributed to drifts in the light source intensity, pressure, and spectrometer optics. Values of σi(λ) were taken from high-resolution reference cross sections for CHOCHO (Volkamer et al., 2005), H2O (Harder and Brault, 1997), and O4 (Greenblatt et al., 1990) and convolved to the measured spectrometer resolution. To improve the quality of the spectral fit, a reference spectrum for was regularly determined by overflowing a small amount of NO2 from a cylinder (27.2 parts per million by mole, ppm, diluted in zero air to a mole mixing ratio of approximately 100 parts per billion by mole, ppb; Linde Gas & Equipment Inc., Bethlehem, PA, USA) into the cavity. This reference spectrum was scaled to the literature reference spectrum of Vandaele et al. (1998) and then used in the spectral fitting. This minimized the residual features in the fit and is similar to the process described in Liang et al. (2019). Additionally, this NO2 reference spectrum was used to adjust the spectrometer wavelength calibration and to determine the spectral line shape that was convolved with the other literature reference spectra.
The spectral fitting to determine Ni and p(λ) in Eq. (3) used custom software developed in Igor Pro (WaveMetrics Inc., Portland, OR, USA) and based on Levenberg–Marquardt least-squares linear fitting (Kraus, 2006; Platt et al., 2009). The fit was optimized between 430 and 476.5 nm, the maximum fitting window that also minimizes spectral features in the residual spectrum. The algorithm also used the measurement error variance as a wavelength-dependent weighting factor to prioritize the fit in the spectral region where the instrument performance was most precise.
We developed a standard vertical profile sampling sequence during test flights of the mACES instrument on board the Matrice 600 Pro UAV. First, we physically attach the mACES instrument to the Matrice 600 Pro underside carbon-fiber rectangular mounting frame using the four quick-release brackets shown in yellow in Fig. 1c. We then power on the instrument and record dark background spectra with no LED light. Using the ground calibration unit shown in Fig. 1b, we sequentially overflow the instrument inlet with 2.0 vlpm of helium and zero air for 15 s each. We then overflow the inlet with ∼100 ppb of NO2 in zero air to provide the NO2 reference spectra for Eq. (3). Finally, we disconnect the ground calibration unit for flight.
The sampling pattern consisted of vertical profiles ascending from 0 to 110 m, with 10 s hovering at a constant altitude at 10 m intervals. The ascent rate between intervals was 1.0 m s−1. The vertical descent was continuous at 0.5 m s−1. This sequence requires approximately 7 min, so a single UAV flight can include three vertical profiles for a total flight time of 21 min with a 25 % battery power margin for the UAV. Other flight patterns, such as horizontal sampling, targeted sampling near point sources, or shorter or longer flights are also possible but were not tested here.
Following the flight sequence, the instrument is again connected to the ground calibration unit to repeat the helium and zero air measurements. Data can be transferred from the BeagleBone computer for offline spectral fitting and data analysis. If multiple UAV flights are planned, the UAV batteries are replaced, which requires less than 5 min. Following this sequence, we would complete two flights with three vertical profiles each, for a total of six profiles per hour.
5.1 NO2 measurement accuracy calculated from propagated uncertainties
The instrument accuracy can be evaluated by propagating the uncertainties in Eq. (2). These include the uncertainty in the Rayleigh scattering cross section of zero air (±2 %), pressure (±0.1 %), temperature (±0.07 %), and absorption cross section of NO2 (±4 %). The contribution of the Rayleigh scattering cross section of He is negligible. Summing these errors in quadrature gives a total calculated uncertainty of ±4.5 % for NO2. This does not account for uncertainty imparted by the spectral fitting procedure or the scaling of the measured reference NO2 cross section, as described in Sect. 3.
5.2 NO2 measurement accuracy evaluated with standard additions
The instrument accuracy was also evaluated by comparison to standard additions of NO2. In the laboratory, O3 concentrations were generated and measured by a commercial O3 monitor (49i; ThermoFisher Scientific, Waltham, MA, USA) and subsequently reacted with an excess of 3 ppm NO to quantitatively convert O3 to NO2 (Washenfelder et al., 2011a), which was measured by the mACES instrument. Figure 2 shows a correlation plot for NO2 concentrations ranging from 0 to 70 ppb acquired for 1 min each. The slope is 0.997±0.007, and the intercept is 0.237±0.253 ppt. The r2 value is 0.99983, indicating excellent agreement between the NO2 standard additions and mACES measurements. Field measurements may show more variability than laboratory measurements, but this variability can be monitored during the regular zero air additions.
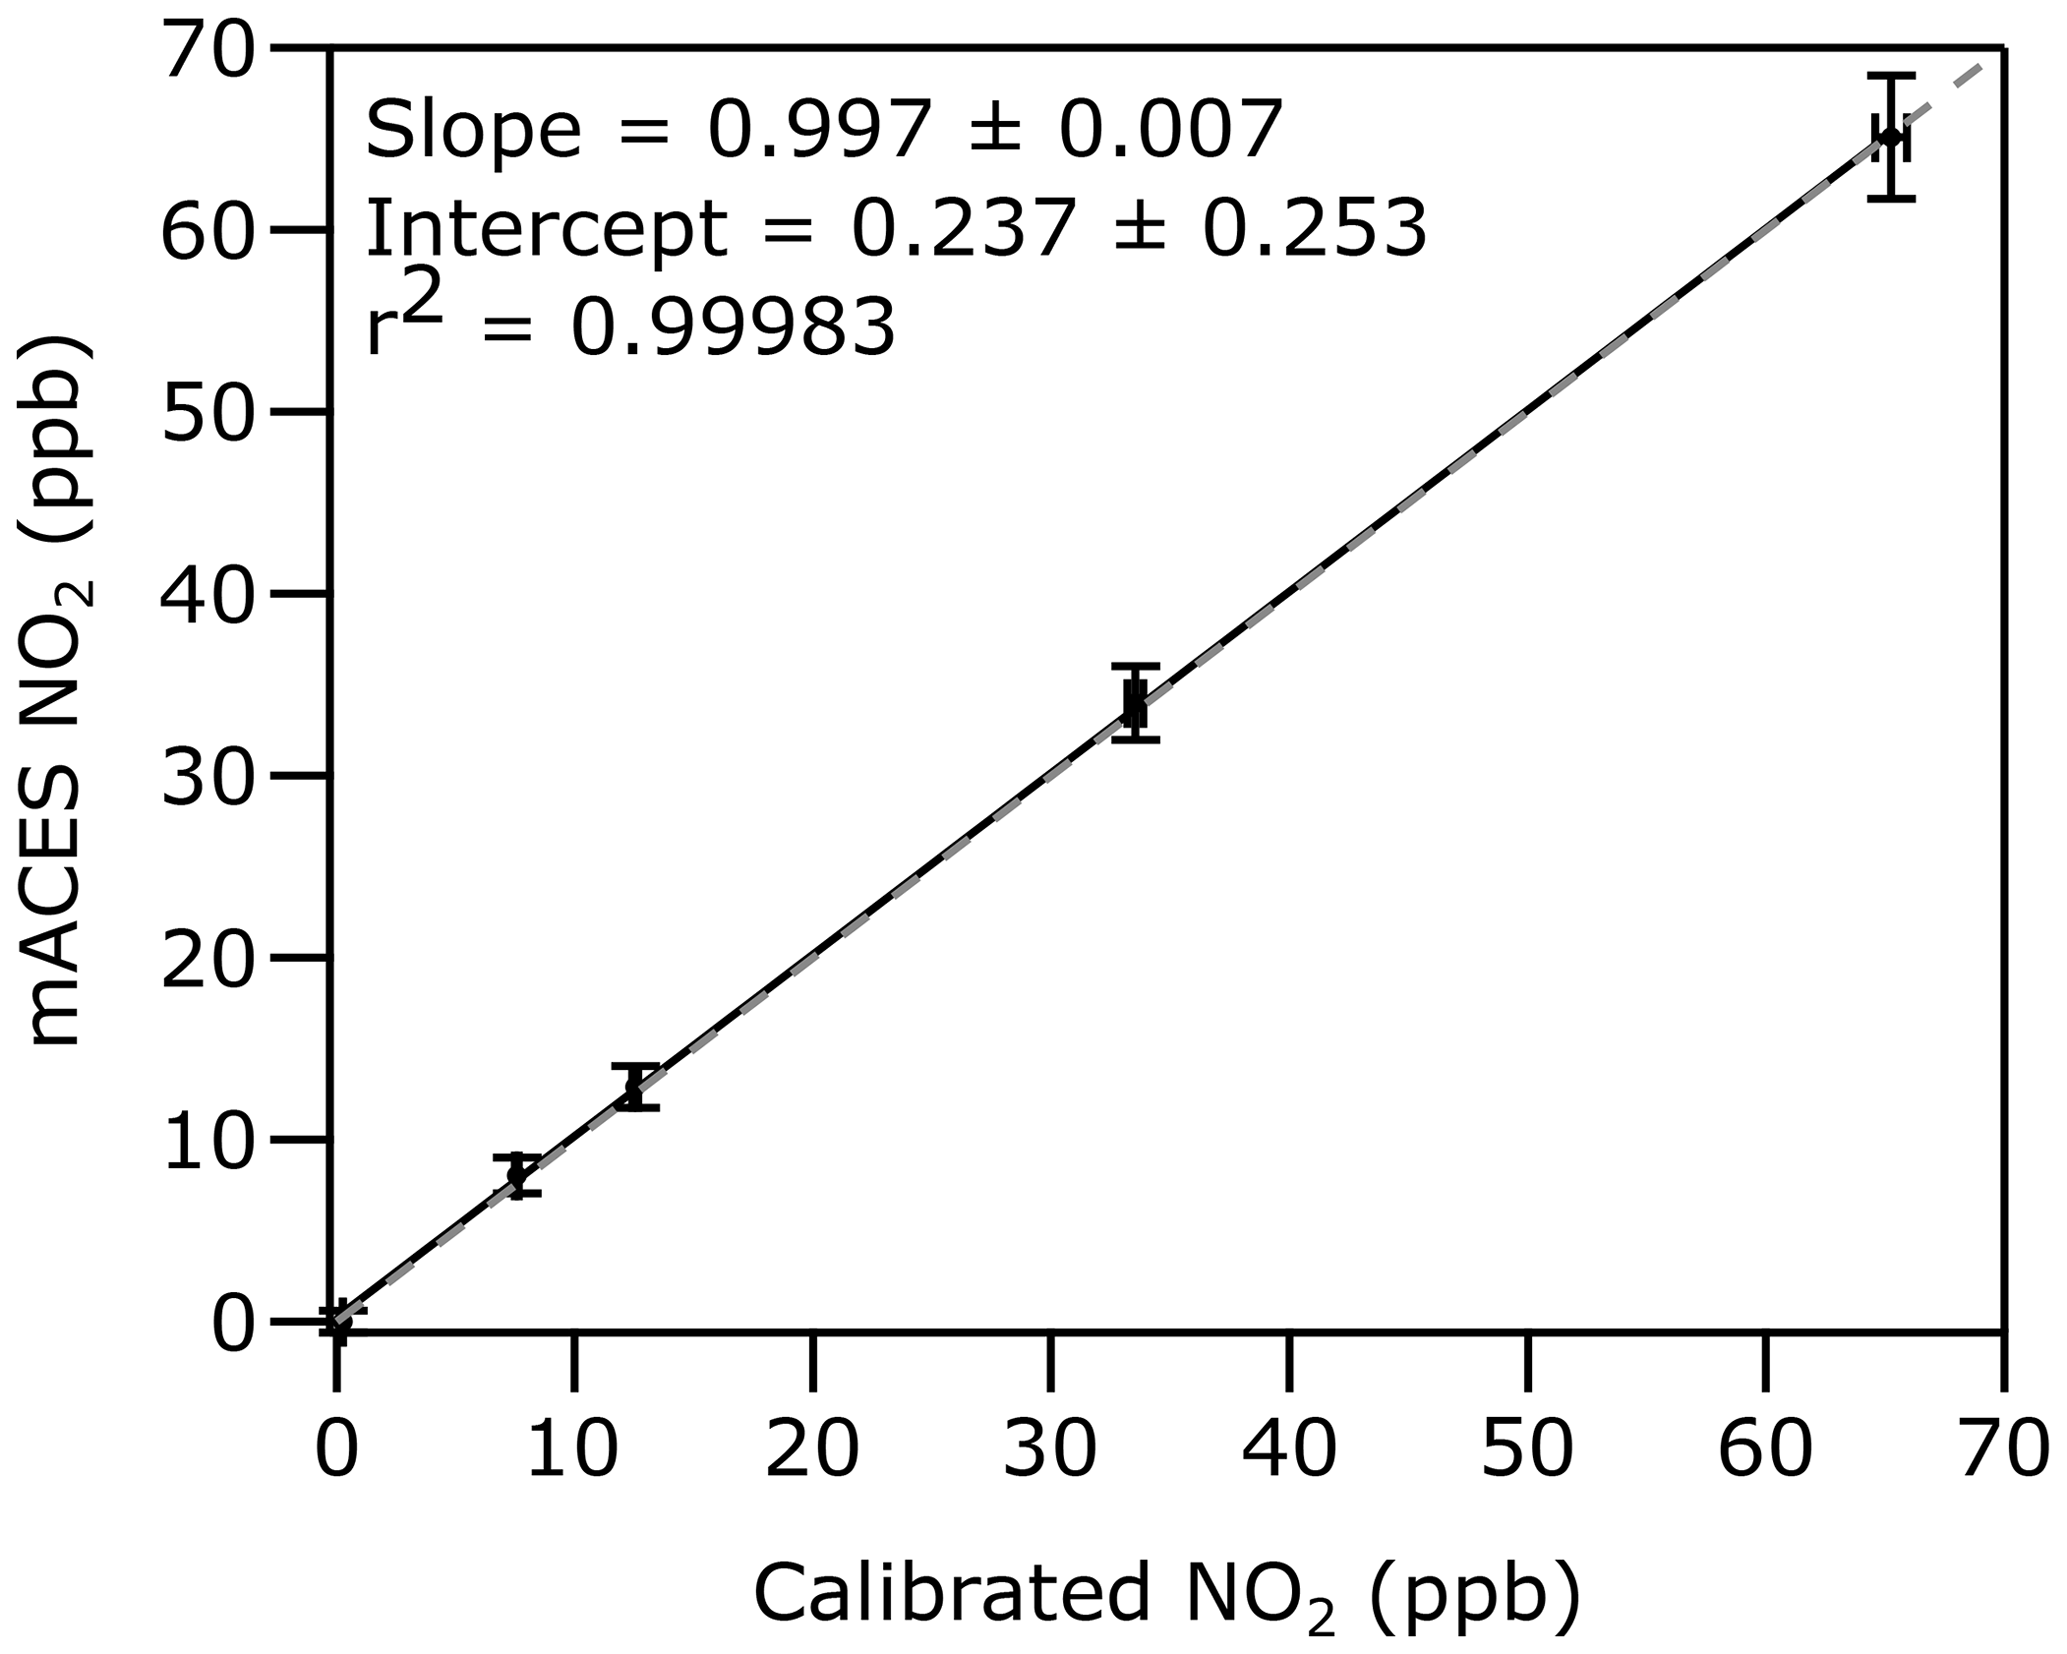
Figure 2Correlation plot showing mACES measurements of NO2 standards generated by quantitative reaction of known amounts of O3 with NO. The grey dashed line shows the 1:1 line.
5.3 NO2 measurement precision
The instrumental precision was evaluated by measuring zero air in the laboratory over 2 h, with measurements of mirror reflectivity, spectrometer dark counts, and the NO2 reference spectrum at the start of the measurement period. Allan deviation plots (Werle et al., 1993) were calculated for the retrieved NO2 concentrations to quantify the precision and drift as a function of time. Figure 3a and b show the Allan deviation and normalized histogram for the retrieved NO2 concentrations during the zero air measurements. The calculated precision (1σ) of the retrieved NO2 is 43 ppt at 1 s and 7 ppt at 30 s. Both the accuracy and precision are sufficient for most tropospheric measurements of NO2, including measurements of small spatial gradients and measurements in clean, remote locations.
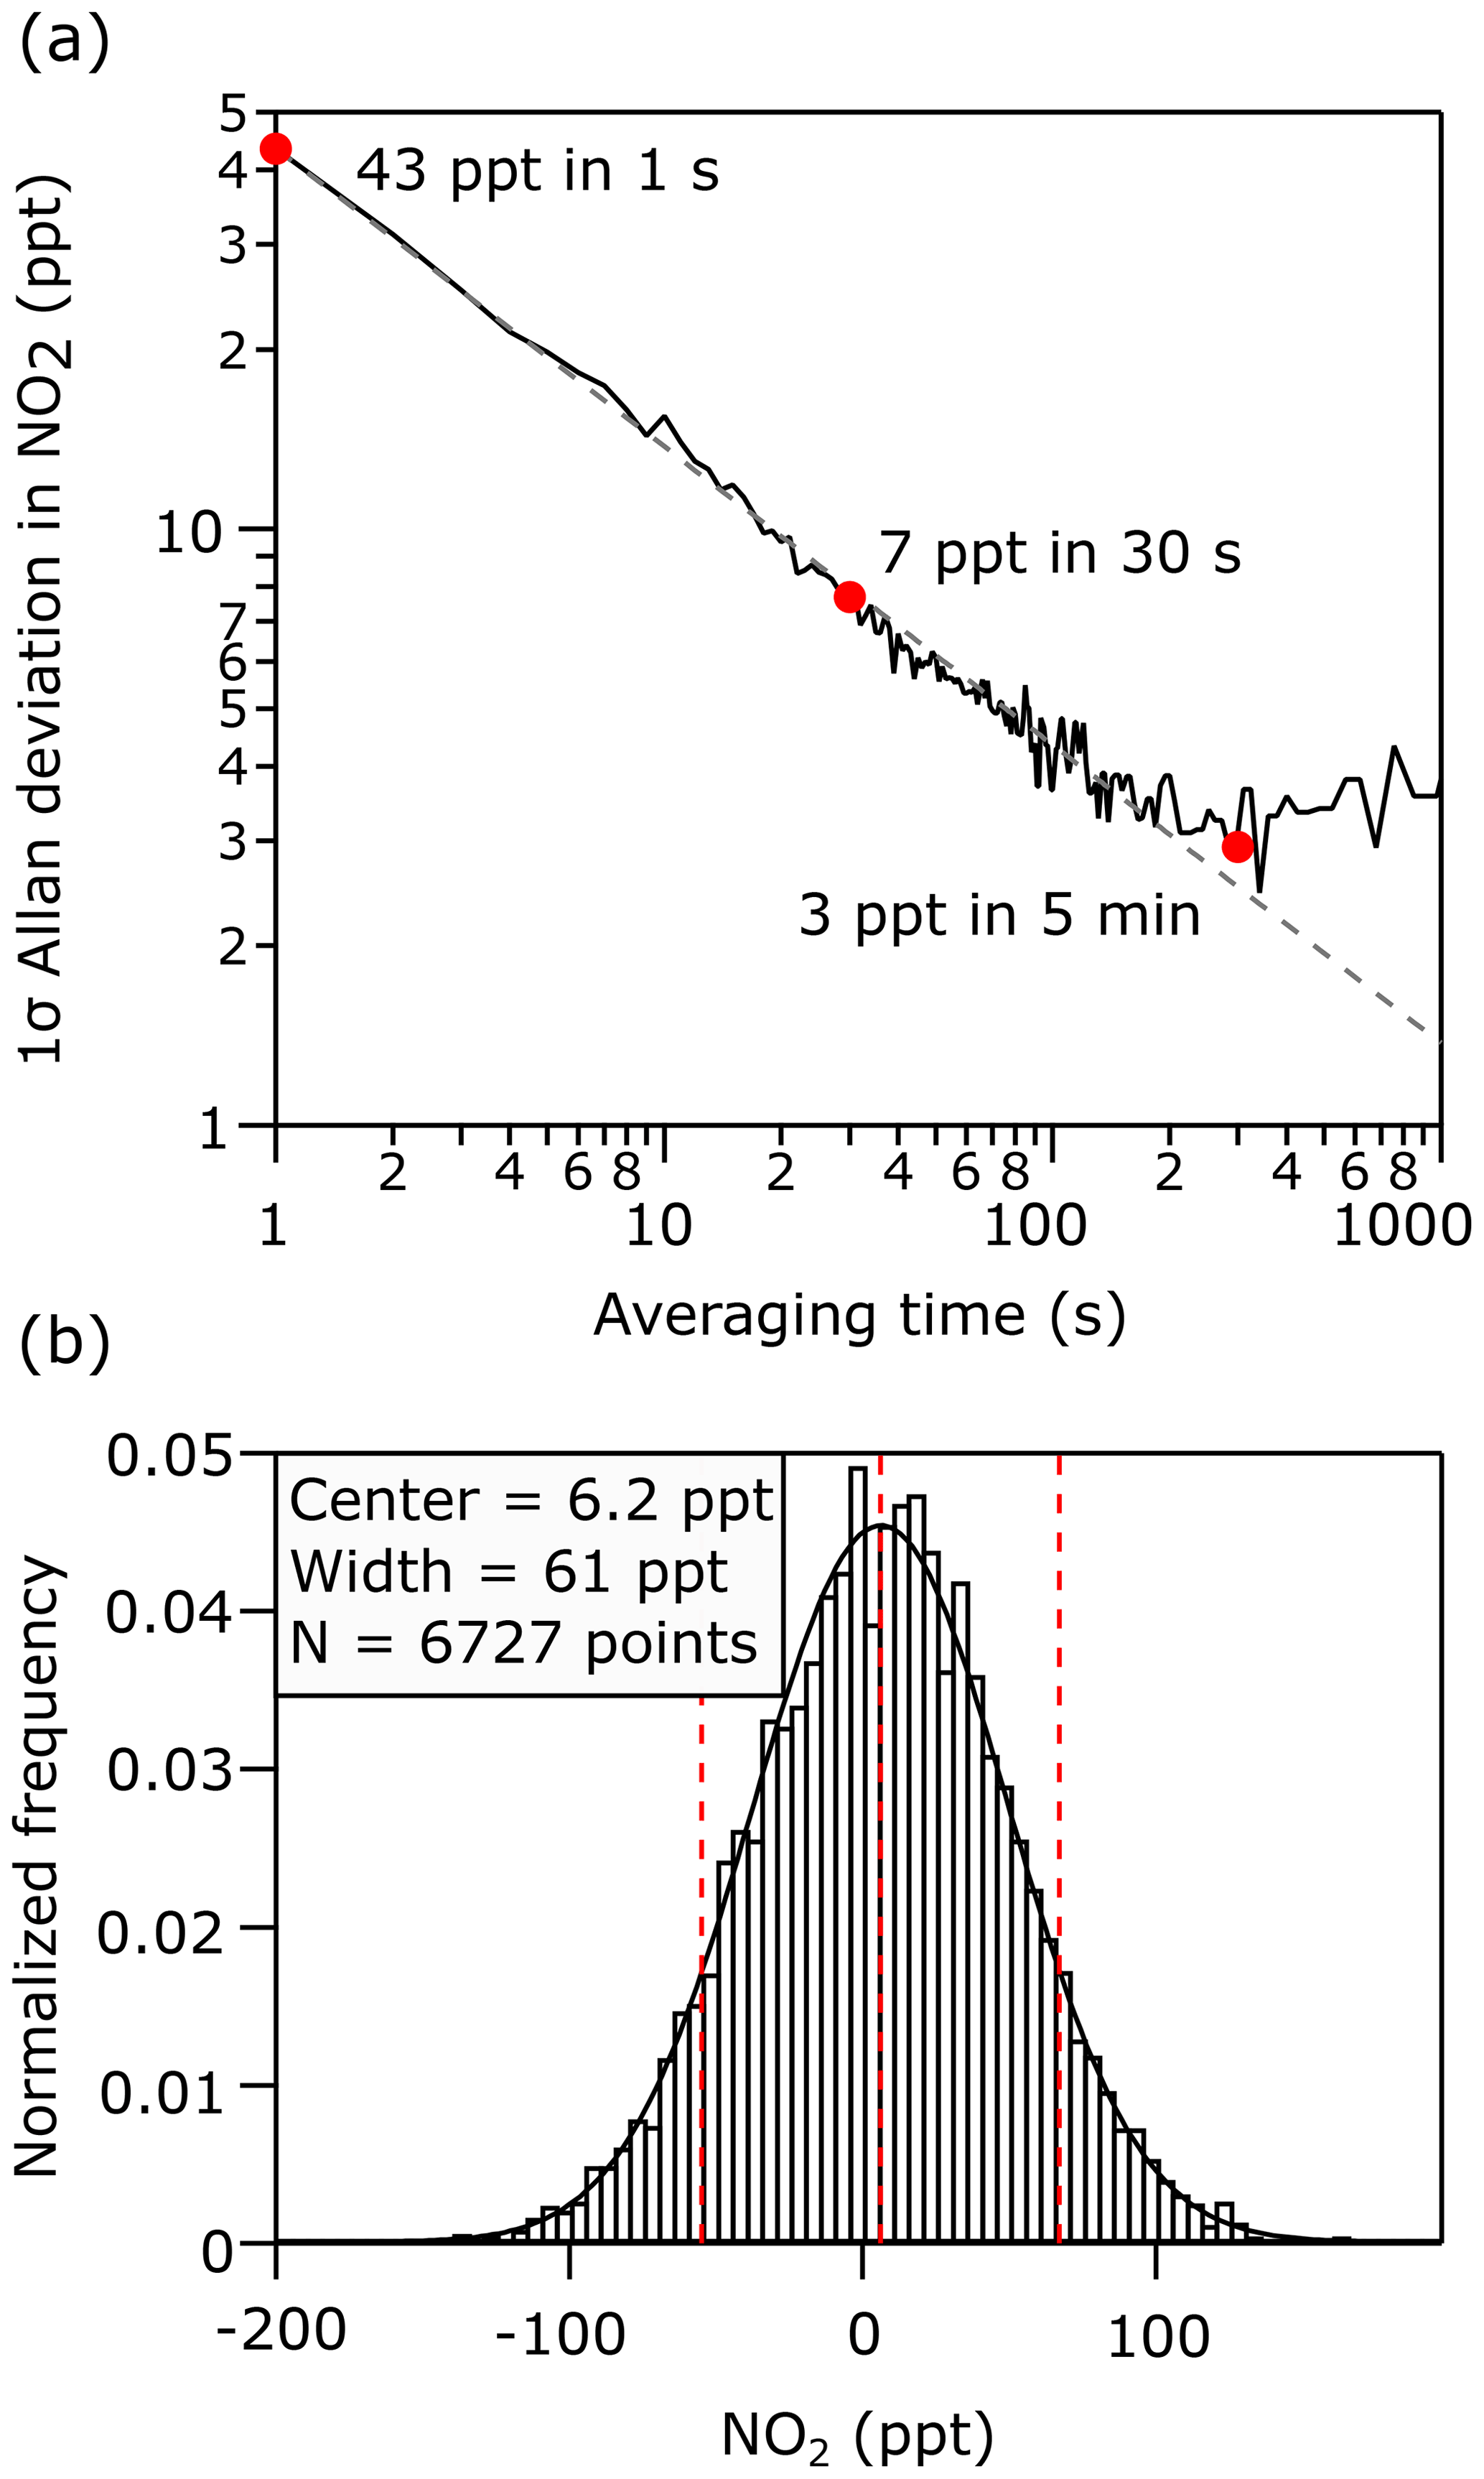
Figure 3(a) Allan deviation plot of the retrieved NO2 concentration during zero air addition to the cavity. (b) Normalized frequency distribution of the retrieved NO2 concentration during the same zero air measurement time period.
5.4 Vertical profiles acquired on board a UAV in Boulder, Colorado
Figure 4a shows the vertical profile of NO2 from 0 to 110 m above ground level measured by the mACES instrument near the NOAA David Skaggs Research Center in Boulder, Colorado (39.9905∘ N, 105.2629∘ W) between 24:00 and 24:30 mountain daylight time (MDT) on 26 May 2022. The operational sequence described in Sect. 4 was followed for the test flights. The 0.15 s spectral data have been averaged to 1 s prior to calculating the light extinction from Eq. (2), and the average and standard deviation for each 10 s period at constant altitude are also shown. The corresponding temperature profiles are shown in Fig. 4b.
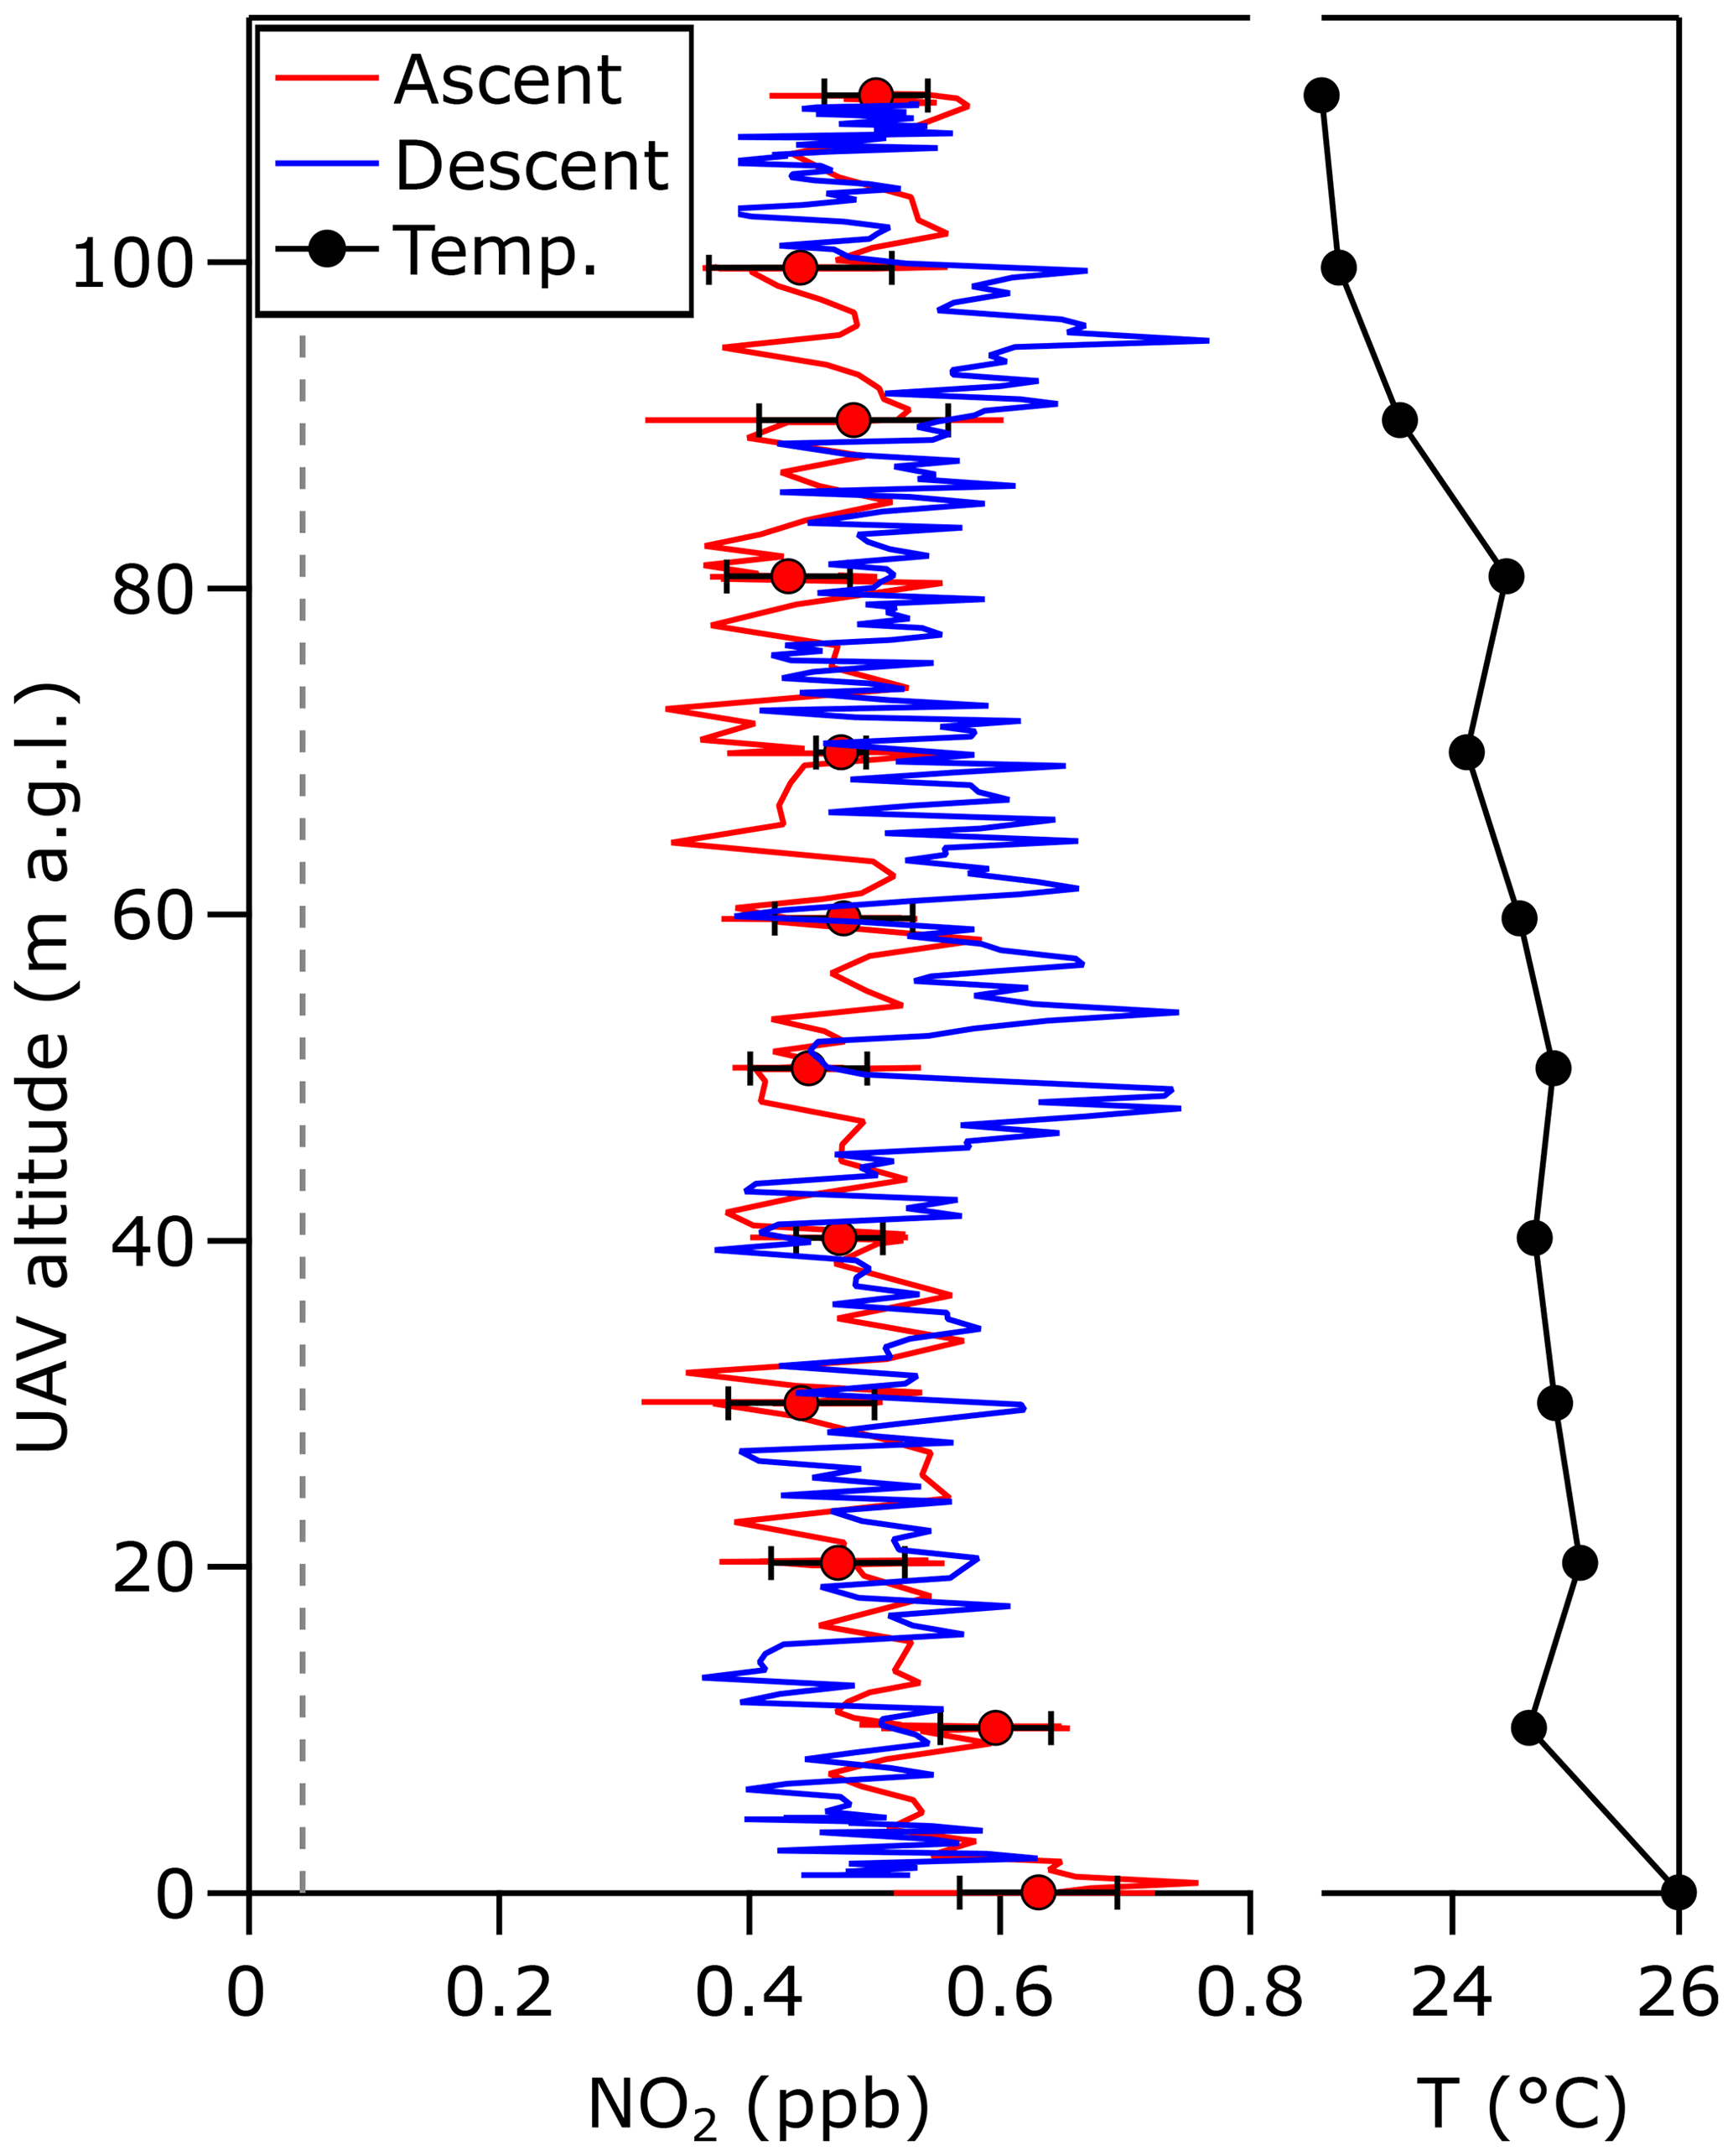
Figure 4Vertical profiles of NO2 during ascent (red) and descent (blue) measured during a UAV flight from 0 to 110 m in Boulder, Colorado. Filled circles and bars represent the average and standard deviation for measurements acquired for 10 s at each 10 m height during ascent, with a 1 m s−1 ascent rate between each level leg. During descent, the drone descended at a constant rate of 0.5 m s−1. The averaged vertical profile of ambient temperature is shown in black.
Detailed computational fluid dynamics (CFD) simulations have been completed for the DJI Matrice 600 Pro UAV and a sampler mounted below (McKinney et al., 2019). McKinney et al. (2019) determined that the propellers draw laminar flow from above the UAV, which is turbulently recirculated at the propellers and then ejected below the UAV. The authors estimate that the vertical mixing volume extends 7 m above the UAV, with a vertical bias of approximately −3 m between the physical position of the sampler and the measured air.
Similarly to the McKinney et al. (2019) study, the mACES instrument was mounted below the UAV. The total weight of our system was 12.65 kg (9.6 kg UAV and 3.05 kg payload) compared to 10.5 kg in McKinney et al. (2019; 9.6 kg UAV and 0.9 kg payload), which would require increased propeller speeds and may increase the vertical mixing volume. The mACES inlet was located vertically above the UAV in the region that is modeled to have approximately laminar flow. We estimate that each 1 s measurement of NO2 in Fig. 4 represents a vertically mixed sample that extends approximately 7 m above the UAV. If sampling outside the propeller wash is desired, a lightweight sideways-sampling inlet arm could be added to the payload.
The vertical NO2 measurements indicate that the boundary layer height exceeded 110 m with well-mixed NO2 concentrations, as expected for midday measurements acquired away from local point sources. Measured NO2 concentrations varied between 0.4 and 0.6 ppb. The measurement precision of 43 ppt NO2 in 1 s suggests that the observed variability within the vertical profile represents real NO2 variation, which is expected since the measurement site is 440 m from a busy road, and the ascent and descent profiles are displaced several minutes in time.
The reflectivity measurements at the beginning and end of the test flight were 0.999954 and 0.999953 at 450 nm, and the signal intensity on the spectrometer during zero air spectra changed by less than 1 % before and after the flight, indicating that the optical alignment of the mACES instrument was stable and unaffected by the vibration of the UAV during the flight.
We have demonstrated a miniaturized BBCES instrument that measures NO2 on board a small UAV. Laboratory measurements of standard NO2 concentrations by this instrument showed a high correlation (r2=0.99983) and an accuracy of 0.3 %, well within the 4.5 % calculated by propagating component uncertainties. The precision (1σ) during laboratory measurements of zero air was 43 ppt NO2 in 1 s. Measurements of mirror reflectivity and signal intensity before and after a UAV test flight from 0 to 110 m indicated that the optical system was not affected by physical vibrations. Future improvements in the precision and detection limit could be achieved with brighter LEDs, higher-reflectivity cavity mirrors, or improved LED temperature control.
Reducing the instrument weight would allow longer flight durations and the possibility of moving to lighter and cheaper UAV vehicles. Weight reductions in the onboard power system and electronics are possible, including eliminating a DC–DC power converter. Similarly, weight reductions in the flow system are possible, including the possibility of a custom particle filter assembly and smaller-diameter Teflon tubing and fittings. The weight of the optical cage system could potentially be reduced with smaller-diameter carbon fiber rods that allow reduced cage system dimensions or mounting plates constructed from carbon fiber or other materials that are less dense than aluminum. A custom-built spectrometer could also significantly reduce weight.
Some simple modifications could improve the robustness of the design. A custom, cladded fiber bundle coupled to the spectrometer would protect the optical fiber during flights and potentially improve the light collection. A weather-proof cover would allow flights on other UAVs that can operate in rain, snow, or mist.
An instrument with this accuracy, precision, size, and weight has the potential to measure onboard small UAVs as well as balloon sondes and to be deployed as a distributed network for low-cost monitoring. This NO2 instrument could be deployed together with a selected set of miniature gas, aerosol, or meteorological sensors, such as those described in Telg et al. (2017), for vertical sampling and atmospheric characterization. Further, changing the spectral region of the instrument by changing the LED, high-finesse cavity mirrors, bandpass filter, and spectrometer grating would allow different target analytes to be measured. These include nitrous acid, formaldehyde, sulfur dioxide, aerosol extinction, and other species that have previously been measured by BBCES. Despite its small size, the accuracy of this method is comparable to that of other spectroscopically based instruments (e.g., CRDS, Wild et al., 2014; LIF, Thornton et al., 2000) and of research-grade photolytic conversion of NO2 followed by detection of NO (Pollack et al., 2010). The versatility of mACES may facilitate intercomparisons of research grade and monitoring network NO2 and NOx instruments.
Code and data used are available upon request (caroline.womack@noaa.gov).
CCW, SSB, RSG, MAR, YR, and RAW conceptualized the instrument. RJM and MAR designed and fabricated the mechanical components. SJC designed and fabricated the electrical components. CCW and RAW assembled and tested the instrument, processed the data, and wrote the manuscript. All the authors contributed to editing the manuscript.
At least one of the (co-)authors is a member of the editorial board of Atmospheric Measurement Techniques. The peer-review process was guided by an independent editor, and the authors also have no other competing interests to declare.
Publisher’s note: Copernicus Publications remains neutral with regard to jurisdictional claims in published maps and institutional affiliations.
We thank Isaac Vimont and Chelsea Stockwell for their assistance with the UAV and its operation. We thank Laurel Watts, Dori Nissenbaum, and Ofir Shoshanim for helpful discussions. We thank Erin Bobby, Star Fassler, Jake Leicht, Lucas McMahan, Aquzana Mejia, and the University of Colorado Mechanical Engineering Senior Design program.
Caroline C. Womack and Michael A. Robinson have been supported by the Cooperative Institute for Research in Environmental Sciences (NOAA Cooperative Agreement – grant no. NA17OAR4320101), and Yinon Rudich and Steven S. Brown have been supported by the United States–Israel Binational Science Foundation (BSF; grant no. 2020055).
This paper was edited by Anna Novelli and reviewed by two anonymous referees.
Bates, T. S., Quinn, P. K., Johnson, J. E., Corless, A., Brechtel, F. J., Stalin, S. E., Meinig, C., and Burkhart, J. F.: Measurements of atmospheric aerosol vertical distributions above Svalbard, Norway, using unmanned aerial systems (UAS), Atmos. Meas. Tech., 6, 2115–2120, https://doi.org/10.5194/amt-6-2115-2013, 2013.
Bodhaine, B. A., Wood, N. B., Dutton, E. G., and Slusser, J. R.: On Rayleigh Optical Depth Calculations, J. Atmos. Ocean. Tech., 16, 1854–1861, https://doi.org/10.1175/1520-0426(1999)016<1854:ORODC>2.0.CO;2, 1999.
Deshler, T., Mercer, J. L., Smit, H. G. J., Stubi, R., Levrat, G., Johnson, B. J., Oltmans, S. J., Kivi, R., Thompson, A. M., Witte, J., Davies, J., Schmidlin, F. J., Brothers, G., and Sasaki, T.: Atmospheric comparison of electrochemical cell ozonesondes from different manufacturers, and with different cathode solution strengths: The Balloon Experiment on Standards for Ozonesondes, J. Geophys. Res.-Atmos., 113, D04307, https://doi.org/10.1029/2007JD008975, 2008.
Fiedler, S. E., Hese, A., and Ruth, A. A.: Incoherent broad-band cavity-enhanced absorption spectroscopy, Chem. Phys. Lett., 371, 284–294, https://doi.org/10.1016/s0009-2614(03)00263-x, 2003.
Fuchs, H., Dubé, W. P., Lerner, B. M., Wagner, N. L., Williams, E. J., and Brown, S. S.: A sensitive and versatile detector for atmospheric NO2 and NOx based on blue diode laser cavity ring-down spectroscopy, Environ. Sci. Technol., 43, 7831–7836, https://doi.org/10.1021/es902067h, 2009.
Gao, R. S., Telg, H., McLaughlin, R. J., Ciciora, S. J., Watts, L. A., Richardson, M. S., Schwarz, J. P., Perring, A. E., Thornberry, T. D., Rollins, A. W., Markovic, M. Z., Bates, T. S., Johnson, J. E., and Fahey, D. W.: A light-weight, high-sensitivity particle spectrometer for PM2.5 aerosol measurements, Aerosol Sci. Tech., 50, 88–99, https://doi.org/10.1080/02786826.2015.1131809, 2016.
Greenblatt, G. D., Orlando, J. J., Burkholder, J. B., and Ravishankara, A. R.: Absorption measurements of oxygen between 330 and 1140 nm, J. Geophys. Res.-Atmos., 95, 18577–18582, https://doi.org/10.1029/JD095iD11p18577, 1990.
Harder, J. W. and Brault, J. W.: Atmospheric measurements of water vapor in the 442-nm region, J. Geophys. Res.-Atmos., 102, 6245–6252, https://doi.org/10.1029/96JD01730, 1997.
Kebabian, P. L., Herndon, S. C., and Freedman, A.: Detection of Nitrogen Dioxide by Cavity Attenuated Phase Shift Spectroscopy, Anal. Chem., 77, 724–728, https://doi.org/10.1021/ac048715y, 2005.
Kennedy, O. J., Ouyang, B., Langridge, J. M., Daniels, M. J. S., Bauguitte, S., Freshwater, R., McLeod, M. W., Ironmonger, C., Sendall, J., Norris, O., Nightingale, R., Ball, S. M., and Jones, R. L.: An aircraft based three channel broadband cavity enhanced absorption spectrometer for simultaneous measurements of NO3, N2O5 and NO2, Atmos. Meas. Tech., 4, 1759–1776, https://doi.org/10.5194/amt-4-1759-2011, 2011.
Kezoudi, M., Keleshis, C., Antoniou, P., Biskos, G., Bronz, M., Constantinides, C., Desservettaz, M., Gao, R.-S., Girdwood, J., Harnetiaux, J., Kandler, K., Leonidou, A., Liu, Y., Lelieveld, J., Marenco, F., Mihalopoulos, N., Močnik, G., Neitola, K., Paris, J.-D., Pikridas, M., Sarda-Esteve, R., Stopford, C., Unga, F., Vrekoussis, M., and Sciare, J.: The Unmanned Systems Research Laboratory (USRL): A New Facility for UAV-Based Atmospheric Observations, Atmosphere, 12, 1042, https://doi.org/10.3390/atmos12081042, 2021.
Kraus, S. G.: DOASIS: A framework for DOAS, PhD thesis, University of Mannheim, Mannheim, Germany, ISBN-10: 3-8322-5452-8, ISBN-13: 978-3-8322-5452-0, 2006.
Liang, S., Qin, M., Xie, P., Duan, J., Fang, W., He, Y., Xu, J., Liu, J., Li, X., Tang, K., Meng, F., Ye, K., Liu, J., and Liu, W.: Development of an incoherent broadband cavity-enhanced absorption spectrometer for measurements of ambient glyoxal and NO2 in a polluted urban environment, Atmos. Meas. Tech., 12, 2499–2512, https://doi.org/10.5194/amt-12-2499-2019, 2019.
Masson-Delmotte, V., Zhai, P., Pirani, A., Connors, S. L., Péan, C., Berger, S., Caud, N., Chen, Y., Goldfarb, L., Gomis, M. I., Huang, M., Leitzell, K., Lonnoy, E., Matthews, J. B. R., Maycock, T. K., Waterfield, T., Yelekçi, O., Yu, R., and Zhou, B. (Eds.): Climate Change 2021: The Physical Science Basis. Contribution of Working Group I to the Sixth Assessment Report of the Intergovernmental Panel on Climate Change, Cambridge University Press, Cambridge, UK and New York, NY, USA, 2021.
McKinney, K. A., Wang, D., Ye, J., de Fouchier, J.-B., Guimarães, P. C., Batista, C. E., Souza, R. A. F., Alves, E. G., Gu, D., Guenther, A. B., and Martin, S. T.: A sampler for atmospheric volatile organic compounds by copter unmanned aerial vehicles, Atmos. Meas. Tech., 12, 3123–3135, https://doi.org/10.5194/amt-12-3123-2019, 2019.
Min, K.-E., Washenfelder, R. A., Dubé, W. P., Langford, A. O., Edwards, P. M., Zarzana, K. J., Stutz, J., Lu, K., Rohrer, F., Zhang, Y., and Brown, S. S.: A broadband cavity enhanced absorption spectrometer for aircraft measurements of glyoxal, methylglyoxal, nitrous acid, nitrogen dioxide, and water vapor, Atmos. Meas. Tech., 9, 423–440, https://doi.org/10.5194/amt-9-423-2016, 2016.
Murphy, D. M., Telg, H., Eck, T. F., Rodriguez, J., Stalin, S. E., and Bates, T. S.: A miniature scanning sun photometer for vertical profiles and mobile platforms, Aerosol Sci. Tech., 50, 11–16, https://doi.org/10.1080/02786826.2015.1121200, 2016.
Nathan, B. J., Golston, L. M., O'Brien, A. S., Ross, K., Harrison, W. A., Tao, L., Lary, D. J., Johnson, D. R., Covington, A. N., Clark, N. N., and Zondlo, M. A.: Near-Field Characterization of Methane Emission Variability from a Compressor Station Using a Model Aircraft, Environ. Sci. Technol., 49, 7896–7903, https://doi.org/10.1021/acs.est.5b00705, 2015.
Platt, U., Meinen, J., Pöhler, D., and Leisner, T.: Broadband Cavity Enhanced Differential Optical Absorption Spectroscopy (CE-DOAS) – applicability and corrections, Atmos. Meas. Tech., 2, 713–723, https://doi.org/10.5194/amt-2-713-2009, 2009.
Pollack, I. B., Lerner, B. M., and Ryerson, T. B.: Evaluation of ultraviolet light-emitting diodes for detection of atmospheric NO2 by photolysis – chemiluminescence, J. Atmos. Chem., 65, 111–125, https://doi.org/10.1007/s10874-011-9184-3, 2010.
Ramana, M. V., Ramanathan, V., Kim, D., Roberts, G. C., and Corrigan, C. E.: Albedo, atmospheric solar absorption and heating rate measurements with stacked UAVs, Q. J. Roy. Meteor. Soc., 133, 1913–1931, https://doi.org/10.1002/qj.172, 2007.
Ryerson, T. B., Williams, E. J., and Fehsenfeld, F. C.: An efficient photolysis system for fast-response NO2 measurements, J. Geophys. Res., 105, 26447–26461, https://doi.org/10.1029/2000jd900389, 2000.
Shardanand and Rao, A. D. P.: Absolute Rayleigh scattering cross sections of gases and freons of stratospheric interest in the visible and ultraviolet regions, NASA Technical Note D-8442, 1–37, 1977.
Sneep, M., and Ubachs, W.: Direct measurement of the Rayleigh scattering cross section in various gases, J. Quant. Spectrosc. Ra., 92, 293–310, https://doi.org/10.1016/j.jqsrt.2004.07.025, 2005.
Telg, H., Murphy, D. M., Bates, T. S., Johnson, J. E., Quinn, P. K., Giardi, F., and Gao, R.-S.: A practical set of miniaturized instruments for vertical profiling of aerosol physical properties, Aerosol Sci. Tech., 51, 715–723, https://doi.org/10.1080/02786826.2017.1296103, 2017.
Thornton, J. A., Wooldridge, P. J., and Cohen, R. C.: Atmospheric NO2: In situ laser-induced fluorescence detection at parts per trillion mixing ratios, Anal. Chem., 72, 528–539, https://doi.org/10.1021/ac9908905, 2000.
Vandaele, A. C., Hermans, C., Simon, P. C., Carleer, M., Colin, R., Fally, S., Mérienne, M. F., Jenouvrier, A., and Coquart, B.: Measurements of the NO2 absorption cross-section from 42 000 cm−1 to 10 000 cm−1 (238–1000 nm) at 220 K and 294 K, J. Quant. Spectrosc. Ra., 59, 171–184, https://doi.org/10.1016/S0022-4073(97)00168-4, 1998.
Volkamer, R., Spietz, P., Burrows, J., and Platt, U.: High-resolution absorption cross-section of glyoxal in the UV–vis and IR spectral ranges, J. Photoch. Photobio. A, 172, 35–46, https://doi.org/10.1016/j.jphotochem.2004.11.011, 2005.
Washenfelder, R. A., Langford, A. O., Fuchs, H., and Brown, S. S.: Measurement of glyoxal using an incoherent broadband cavity enhanced absorption spectrometer, Atmos. Chem. Phys., 8, 7779–7793, https://doi.org/10.5194/acp-8-7779-2008, 2008.
Washenfelder, R. A., Wagner, N. L., Dubé, W. P., and Brown, S. S.: Measurement of atmospheric ozone by cavity ring-down spectroscopy, Environ. Sci. Technol., 45, 2938–2944, https://doi.org/10.1021/es103340u, 2011a.
Washenfelder, R. A., Young, C. J., Brown, S. S., Angevine, W. M., Atlas, E. L., Blake, D. R., Bon, D. M., Cubison, M. J., de Gouw, J. A., Dusanter, S., Flynn, J., Gilman, J. B., Graus, M., Griffith, S., Grossberg, N., Hayes, P. L., Jimenez, J. L., Kuster, W. C., Lefer, B. L., Pollack, I. B., Ryerson, T. B., Stark, H., Stevens, P. S., and Trainer, M. K.: The glyoxal budget and its contribution to organic aerosol for Los Angeles, California, during CalNex 2010, J. Geophys. Res., 116, D00V02, https://doi.org/10.1029/2011jd016314, 2011b.
Werle, P., Mücke, R., and Slemr, F.: The limits of signal averaging in atmospheric trace-gas monitoring by tunable diode-laser absorption spectroscopy (TDLAS), Appl. Phys. B, 57, 131–139, https://doi.org/10.1007/BF00425997, 1993.
Wild, R. J., Edwards, P. M., Dubé, W. P., Baumann, K., Edgerton, E. S., Quinn, P. K., Roberts, J. M., Rollins, A. W., Veres, P. R., Warneke, C., Williams, E. J., Yuan, B., and Brown, S. S.: A measurement of total reactive nitrogen, NOy, together with NO2, NO, and O3 via cavity ring-down spectroscopy, Environ. Sci. Technol., 48, 9609–9615, https://doi.org/10.1021/es501896w, 2014.
Williams, R., Long, R., Beaver, M., Kaufman, A., Zeiger, F., Heimbinder, M., Hang, I., Yap, R., Acharya, B., Ginwald, B., Kupcho, K., Robinson, S., Zaouak, O., Aubert, B., Hannigan, M., Piedrahita, R., Masson, N., Moran, B., Rook, M., Heppner, P., Cogar, C., Nikzad, N., and Griswold, W.: Sensor Evaluation Report, EPA/600/R-614/143 (NTIS PB2015-100611), US Environmental Protection Agency, 21–28, https://ntrl.ntis.gov/NTRL/dashboard/searchResults.xhtml?searchQuery=PB2015-100611 (last access: 10 November 2022), 2014.
Zarzana, K. J., Min, K.-E., Washenfelder, R. A., Kaiser, J., Krawiec-Thayer, M., Peischl, J., Neuman, J. A., Nowak, J. B., Wagner, N. L., Dubè, W. P., St. Clair, J. M., Wolfe, G. M., Hanisco, T. F., Keutsch, F. N., Ryerson, T. B., and Brown, S. S.: Emissions of Glyoxal and Other Carbonyl Compounds from Agricultural Biomass Burning Plumes Sampled by Aircraft, Environ. Sci. Technol., 51, 11761–11770, https://doi.org/10.1021/acs.est.7b03517, 2017.
Zhao, T., Yang, D., Liu, Y., Cai, Z., Yao, L., Che, K., Ren, X., Bi, Y., Yi, Y., Wang, J., and Zhu, S.: Development of an Integrated Lightweight Multi-Rotor UAV Payload for Atmospheric Carbon Dioxide Mole Fraction Measurements, Atmosphere, 13, 855, https://doi.org/10.3390/atmos13060855, 2022.