the Creative Commons Attribution 4.0 License.
the Creative Commons Attribution 4.0 License.
Long-term validation of MIPAS ESA operational products using MIPAS-B measurements
Michael Höpfner
Hermann Oelhaf
Felix Friedl-Vallon
Anne Kleinert
Guido Maucher
Miriam Sinnhuber
Janna Abalichin
Angelika Dehn
Piera Raspollini
The Michelson Interferometer for Passive Atmospheric Sounding (MIPAS) was a limb-viewing infrared Fourier transform spectrometer that operated from 2002 to 2012 aboard the Environmental Satellite (ENVISAT). The final re-processing of the full MIPAS mission Level 2 data was performed with the ESA operational version 8 (v8) processor. This MIPAS dataset includes not only the retrieval results of pressure–temperature and the standard species H2O, O3, HNO3, CH4, N2O, and NO2 but also vertical profiles of volume mixing ratios of the more difficult-to-retrieve molecules N2O5, ClONO2, CFC-11, CFC-12 (included since v6 processing), HCFC-22, CCl4, CF4, COF2, and HCN (included since v7 processing). Finally, vertical profiles of the species C2H2, C2H6, COCl2, OCS, CH3Cl, and HDO were additionally retrieved by the v8 processor.
The balloon-borne limb-emission sounder MIPAS-B was a precursor of the MIPAS satellite instrument. Several flights with MIPAS-B were carried out during the 10-year operational phase of ENVISAT at different latitudes and seasons, including both operational periods when MIPAS measured with full spectral resolution (FR mode) and with optimised spectral resolution (OR mode). All MIPAS operational products (except HDO) were compared to results inferred from dedicated validation limb sequences of MIPAS-B. To enhance the statistics of vertical profile comparisons, a trajectory match method has been applied to search for MIPAS coincidences along the 2 d forward and backward trajectories running from the MIPAS-B measurement geolocations. This study gives an overview of the validation results based on the ESA operational v8 data comprising the MIPAS FR and OR observation periods. This includes an assessment of the data agreement of both sensors, taking into account the combined errors of the instruments. The differences between the retrieved temperature profiles of both MIPAS instruments generally stays within ±2 K in the stratosphere. For most gases – namely H2O, O3, HNO3, CH4, N2O, NO2, N2O5, ClONO2, CFC-11, CFC-12, HCFC-22, CCl4, CF4, COF2, and HCN – we find a 5 %–20 % level of agreement for the retrieved vertical profiles of both MIPAS instruments in the lower stratosphere. For the species C2H2, C2H6, COCl2, OCS, and CH3Cl, however, larger differences (within 20 %–50 %) appear in this altitude range.
- Article
(25628 KB) - Full-text XML
- BibTeX
- EndNote
Satellite measurements of stratospheric trace gases are essential for monitoring the distributions and trends of these species on a global scale (Hegglin et al., 2021). The Environmental Satellite (ENVISAT) of the European Space Agency (ESA) operated between 2002 and 2012. The Michelson Interferometer for Passive Atmospheric Sounding (MIPAS; Fischer et al., 2008) was one of three chemistry instruments aboard ENVISAT, alongside the Scanning Imaging Absorption Spectrometer for Atmospheric Chartography (SCIAMACHY; Bovensmann et al., 1999) and the Global Ozone Monitoring by Occultation of Stars (GOMOS) instrument (Bertaux et al., 1991). Validating instruments like MIPAS for the purpose of assessing measurement accuracy is an essential task. Stratospheric measurements with balloon instruments like MIPAS-B are particularly suitable for reaching this goal, since these instruments are able to sound the atmosphere with high vertical resolution (e.g. Wetzel et al., 2006; Cortesi et al., 2007; Ridolfi et al., 2007; Wang et al., 2007; Wetzel et al., 2007; Renard et al., 2008; Wetzel et al., 2008; Payan et al., 2009; Zhang et al., 2010; Sagawa et al., 2013; Wetzel et al., 2013a). The main logistical requirement that the satellite and the validating balloon instruments observe the same air masses has to be considered carefully when performing balloon campaigns. Two principal comparison methods are common: (1) direct matches, where the balloon instrument measures at the same time and location as those at which the satellite observation takes place, and (2) trajectory matches, where forward and backward trajectories are calculated from the balloon measurements' geolocation to search for appropriate satellite overpasses. Along with (1) and (2), there is a dynamical approach using potential vorticity and potential temperature field, as suggested by Manney et al. (2001). Several flights with the balloon version of MIPAS (Friedl-Vallon et al., 2004) were carried out during the operational time of ENVISAT. This study presents an overview of the 10 years of MIPAS observations based on the recent ESA processor version 8 (v8; released in 2021; ESA, 2021b; Dinelli et al., 2021) and provides an evaluation of the long-term performance of MIPAS, covering the complete set of atmospheric parameters (except HDO) that have been processed with the newest operational data version. In the following sections, validation activities, data analysis, and validation results are described in detail.
2.1 MIPAS operations and data version
The limb-viewing Fourier transform spectrometer MIPAS on ENVISAT (hereinafter also referred to as MIPAS-E to better distinguish from the balloon instrument MIPAS-B) has been designed to operate in the mid-infrared spectral region covering five spectral bands between 685 and 2410 cm−1 with a maximum optical path difference (MOPD) of 20 cm, equivalent to an unapodised full spectral resolution of 0.025 cm−1 (Fischer et al., 2008). The vertical instantaneous field of view (IFOV) was about 3 km. ENVISAT was launched into its sun-synchronous orbit by ESA on 1 March 2002, with 14.3 orbits per day and an Equator crossing local solar time of 10:00 (descending node). After the commissioning phase, MIPAS-E was run predominantly in its nominal measurement mode with full spectral resolution (called FR mode) from July 2002 until the end of March 2004. During each orbit, approximately 72 limb scans covering tangent altitudes between 6 and 68 km were recorded (in steps of 3 up to 42 km and at 47, 52, 60, and 68 km) in the FR mode. The majority of validation studies based on correlative measurements published so far addressed MIPAS-E data recorded during this first time period. These measurements were originally reprocessed by the ESA instrument processing facilities (IPF) v4.1 and v4.2, based on the optimised retrieval model (ORM) code described in Ridolfi et al. (2000) and in Raspollini et al. (2006), and covered pressure–temperature and the six constituents O3, H2O, CH4, N2O, HNO3, and NO2. The validation studies addressed these parameters and constituents: pressure–temperature (Ridolfi et al., 2007), O3 (Cortesi et al., 2007), HNO3 (Wang et al., 2007), NO2 (Wetzel et al., 2007), N2O and CH4 (Payan et al., 2009), and H2O (Wetzel et al., 2013a).
After an increasing frequency of problems with the interferometer drive system in late 2003 and the beginning of 2004 and upon subsequent detailed investigations, it was decided to suspend the nominal operations from March 2004 onwards for detailed investigations. From January 2005 onwards, the instrument was back in operation but at reduced MOPD (41 % of nominal) while maintaining the interferogram scan speed. During data processing, the interferograms were truncated to 8 cm MOPD, resulting in an unapodised spectral resolution of 0.0625 cm−1. The shorter acquisition time per interferogram led to the benefit of an equivalent improvement in the vertical and horizontal (along-track) sampling (nominal tangent altitudes: 6, 7.5, 9, 10.5, 12, 13.5, 15, 16.5, 18, 19.5, 21, 23, 25, 27, 29, 31, 34, 37, 40, 43, 46, 50, 54, 58, 62, 66, and 70 km). The duty cycle of this so-called optimised resolution (OR) mode (optimised in terms of a trade-off between spectral and spatial resolution, considering instrument operation safety aspects) was steadily increased from 30 % in January 2005 to 100 % from December 2007 onward. MIPAS-E was successfully operated with this full-duty cycle in the OR mode until 8 April 2012, when an ENVISAT anomaly occurred, resulting in the loss of communication between ground and satellite and, hence, the end of MIPAS-E observations (ESA, 2012). Details of the characteristics of the two MIPAS-E mission phases (FR and OR modes) in terms of instrument settings and atmospheric sampling are described in Raspollini et al. (2013) and Dinelli et al. (2021).
The coarser spectral but finer spatial sampling of MIPAS-E since 2005 along with the need for near real-time analysis demanded adaptations in the calibration scheme and the processing codes. This was realised in ESA Level (L) 2 processor version (v) 6 and explained by Raspollini et al. (2013), who also provide the diagnostics of the products, including the error budgets, as estimated by Dudhia et al. (2002). The whole MIPAS-E dataset, covering almost 10 years of observations, was re-processed with v6, v7, and v8. In addition, the number of retrieved constituents was extended to ClONO2, N2O5, CFC-11, and CFC-12 in ESA version 6.
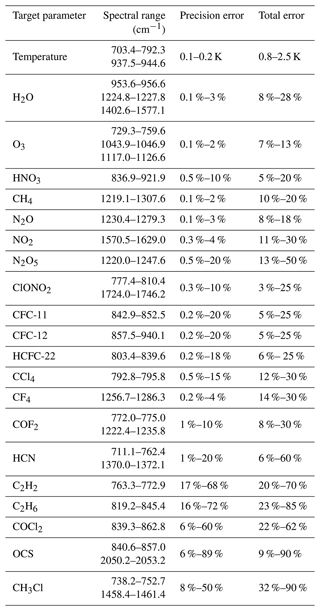
ESA version 7 data (released in 2015) also includes the species HCN, HCFC-22, CF4, COF2, and CCl4. The ESA L1v8/L2v8 diagnostic dataset (DDS) version was released in June 2018 followed by the L1v8 and L2v8 full mission (FM) data in June 2019. The new v8 data release (ESA, 2021b; Dinelli et al., 2021; Raspollini et al., 2022) comprises the additional molecules C2H2, C2H6, COCl2, OCS, CH3Cl, and HDO. For the final ESA reprocessing of MIPAS-E data, numerous improvements were implemented in the L2 processor optimised retrieval model (ORM) version 8.22 (v8) and its auxiliary data, including an update of the spectroscopic data used (Raspollini et al., 2022). An exemplary overview on the spectral regions used for the operational retrievals, together with typical errors (winter, OR mode), is given in Table 1. All molecules except HDO have been validated by comparison with observations of the MIPAS balloon instrument.
2.2 MIPAS-B dataset
The balloon-borne limb-emission sounder MIPAS-B can be regarded as a precursor of the MIPAS satellite instrument (Friedl-Vallon et al., 2004). Hence, a number of specifications, like spectral resolution and spectral coverage, are similar. The unapodised full spectral resolution is 0.0345 cm−1, which is slightly coarser than the FR mode resolution but higher than the OR mode resolution. However, for essential parameters, the MIPAS-B performance is superior in terms of NESR (noise-equivalent spectral radiance) and line-of-sight (LOS) stabilisation. The LOS is stabilised using an inertial navigation system supplemented with an additional star reference system which leads to an after-all knowledge of the tangent altitude of better than 50 m at the 1σ confidence limit (Wetzel et al., 2010). The MIPAS-B NESR is further improved by averaging multiple spectra recorded at the same elevation angle. The general data processing from interferograms to calibrated spectra, including instrument characterisation, is described in Friedl-Vallon et al. (2004) and references therein.
MIPAS-B measurements were typically recorded at a 1.5 km vertical tangent altitude grid. Retrieval calculations of temperature and atmospheric trace species were performed at a 1 km grid with a Gauss–Newton iterative method (Rodgers, 2000) using analytical derivative spectra calculated by the Karlsruhe Optimised and Precise Radiative transfer Algorithm (KOPRA; Stiller et al., 2002; Höpfner et al., 2002). To avoid retrieval instabilities due to oversampling of vertical grid points, a regularisation approach according to the method described by Tikhonov (1963) and Phillips (1962), constrained with respect to the first derivative of the a priori profile, was adopted. The resulting vertical resolution is typically between 2 and 5 km for the analysed atmospheric parameters and is therefore comparable to or slightly better than the vertical resolution of the MIPAS satellite instrument. Table 2 gives an overview of the spectral windows used for the MIPAS-B target parameter retrievals. Different spectral microwindows within mostly the same molecular bands were used for the MIPAS-E data analysis (Dinelli et al., 2021). Spectroscopic parameters for the calculation of the infrared emission spectra originate from the high-resolution transmission (HITRAN) molecular absorption database (Rothman et al., 2009) and a MIPAS-E dedicated spectroscopic database (Raspollini et al., 2022). For heavy molecules like CFC-11, CFC-12, HCFC-22, CCl4, and CF4, new and improved infrared absorption cross sections (Harrison, 2015, 2016; Harrison et al., 2017) were used for the calculation of radiative transfer (consistent with the MIPAS-E retrieval).
Table 2Overview of MIPAS-B spectral windows used for the analysis of atmospheric target parameters, together with typical precision errors and total errors.
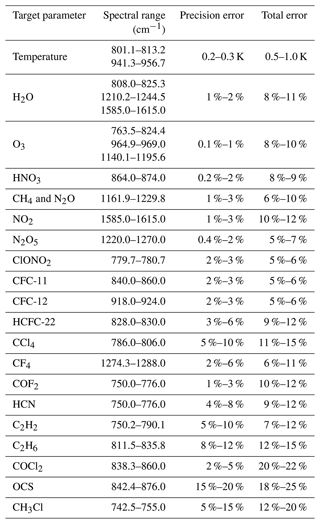
The MIPAS-B error budget includes random noise as well as covariance effects of the fitted parameters, temperature errors, pointing inaccuracies, errors of non-simultaneously fitted interfering species, and spectroscopic data errors (1σ). For further details on the MIPAS-B data analysis and error estimation, see Wetzel et al. (2012, 2015) and references therein. An overview of typical errors for the atmospheric parameter retrievals is given in Table 2.
2.3 Validation approach
A number of MIPAS balloon flights have been carried out as part of the validation programme of the chemistry instruments aboard ENVISAT. However, most of the MIPAS-B data used here were obtained during flights that were done in the framework of various scientific projects. MIPAS-B had a sophisticated pointing system so that the full freedom of a balloon-borne limb-emission sounder in terms of observation time, viewing direction, and sampling strategy could be used to get the best possible coincidence in time and space with the satellite overpass, even during balloon flights that were not primarily dedicated to satellite validation. If compliant with the scientific goal of the mission and with the weather conditions, the strategy was to launch the balloon in due time before an ENVISAT overpass and to optimise the azimuthal viewing direction and the vertical sampling at the time of the overpass. Except for two flights, a coincidence in space and time between both sensors could be achieved, such that the vertical profiles of both instruments could be directly compared. An overview of the MIPAS balloon flights used in this study is given in Table 3.
Table 3Overview of MIPAS balloon flights used for intercomparison with MIPAS-E. Distances and times between closest trace gas profile pairs observed by MIPAS-E and the validation instrument refer to an altitude of 20 km (Kiruna) and 30 km (Aire-sur-l'Adour and Teresina). In addition, the 2 d forward and backward trajectories were calculated for each balloon flight to search for further matches with the satellite sensor.
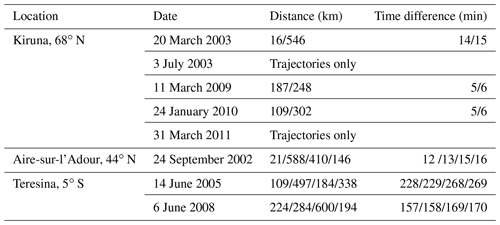
To enhance the statistics of profile comparisons, diabatic 2 d forward and backward trajectories were calculated by the Free University of Berlin using a trajectory model (Naujokat and Grunow, 2003; Grunow, 2009). The trajectories are based on the European Centre for Medium-Range Weather Forecasts (ECMWF) analyses and start at different altitudes at the geolocation of the balloon observation to search for a coincidence with the satellite measurement along the trajectory path within a match radius of 1 h and 500 km. The temperature and volume mixing ratio (VMR) of the satellite match has been interpolated to the trajectory match altitude, such that these values can be directly compared to the MIPAS-B data at the trajectory start point altitude. Altitude differences between the trajectory start and match point have to be taken into account in the case of temperature by means of an adiabatic correction. The handling of the diurnal variation of photochemically active species is discussed below.
The primary vertical coordinate of MIPAS-E is pressure, whereas for MIPAS-B, it is altitude. For all intercomparisons shown in this study, MIPAS-E pressure altitudes were logarithmically interpolated to the MIPAS-B hydrostatic pressure levels. Hence, vertical profiles refer to the MIPAS-B pressure–altitude grid. Differences between measured quantities of MIPAS-E and the validation instrument MIPAS-B are expressed in absolute and relative units. The mean difference Δxmean for N profile pairs of compared observations is given as
where xE and xB are data values of MIPAS-E and MIPAS-B at one altitude level, respectively. The mean relative difference Δxmean,rel of a number of profile pairs is calculated by dividing the mean absolute difference by the mean profile value of the reference instrument MIPAS-B:
Differences are displayed together with the combined errors σcomb of both instruments, which are defined as
where σE and σB are the precision, systematic, or total errors of MIPAS-E and MIPAS-B, respectively. All errors discussed here refer to the 1σ confidence limit.
Precision errors characterise the reproducibility of a measurement and correspond, in general, to random noise errors. Systematic errors used for the MIPAS-E data analysis have been assessed in corresponding studies (Dudhia et al., 2002; Raspollini et al., 2013; Dinelli et al., 2021). The uncertainty of the calculated mean difference (standard error of the mean, SEM) is given by , where σ is the standard deviation (SD). A bias between both instruments is considered significant if the SEM is smaller than the bias itself. The comparison between the VMR difference and the combined systematic error (for statistical comparisons) or total error (for single comparisons) is appropriate to identify unexplained relative biases in the MIPAS-E measurements when they exceed these combined error limits. Since the vertical resolution of the atmospheric parameter profiles of both instruments is of comparable magnitude, a smoothing by averaging kernels has not been applied to the observed profiles. The method described above was performed for each individual balloon flight comparison. A mean difference (with mean statistical parameters) for all flights was calculated by weighting the mean result of each individual flight equally.
Photochemically reactive gases like NO2 and N2O5 and, to a lesser extent, ClONO2 (mainly in the tropics) undergo a diurnal variation with changing solar zenith angle (SZA). For these gases, a photochemical correction taking into account differences in the SZA between the measurements of both sensors has been applied. The molecule NO2 exhibits the most pronounced temporal variation. The partitioning of NO, NO2, and N2O5 within the NOy family depends strongly on the SZA due to the rapid daytime photolysis of NO2 and the slower photolysis of N2O5. At sunset, NO is rapidly converted to NO2, mainly via the reaction with O3. During the night, NO2 is gradually decomposed to form N2O5. A one-dimensional model (Bracher et al., 2005) was constrained with NOy species measured by MIPAS-B and initialised with the output of a global two-dimensional model (Sinnhuber et al., 2003) to calculate SZA correction factors for the MIPAS-E data.
In the following subsections, we discuss the validation of all quantities delivered operationally by ESA's L1v8 and L2v8 FM processor on the basis of collocated MIPAS-B observations. Only MIPAS satellite data that have passed the a posteriori quality check (mainly retrieval convergence and size of maximum error; for details, see Raspollini et al., 2022) were used for the intercomparison. The analysis of all compared vertical profiles is regarded as the evaluation with the highest statistical evidence. Trajectory matches are based on diabatic 2 d forward and backward trajectories, with a collocation criterion of 1 h and 500 km, as described in Sect. 2.
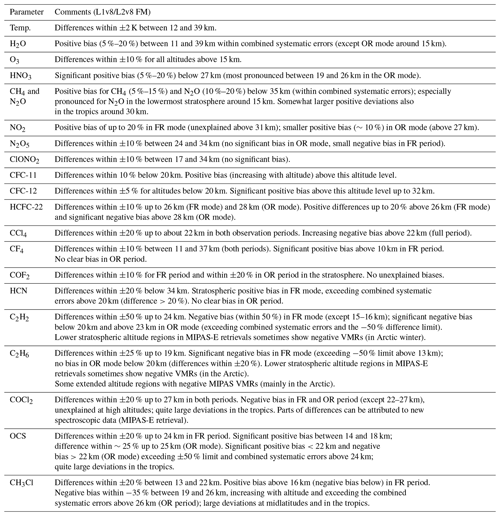
Since the balloon flights were performed between 2003 and 2011, they almost cover the full ENVISAT operational period of 2002 to 2012, i.e. both MIPAS-E mission phases (FR and OR modes), with distinctly different instrument settings. A compilation of all the vertical profiles of temperature and 20 species retrieved from MIPAS-B spectra is given in Fig. 1. We performed the intercomparison analysis separately, not only for different climatological regions but also for the periods 2002–2004 and 2005–2012. The following intercomparison is focused on these two periods when MIPAS-E was operated in the FR and OR mode, respectively. An overview of the most important findings of this intercomparison is listed in Table 4. A comprehensive MIPAS-E quality readme file, including not only the validation results related to MIPAS-B but also ground-based, ACE–FTS (Atmospheric Chemistry Experiment–Fourier Transform Spectrometer), lidar, radiosonde, and ozone sonde validation results, was published by Raspollini et al. (2020).
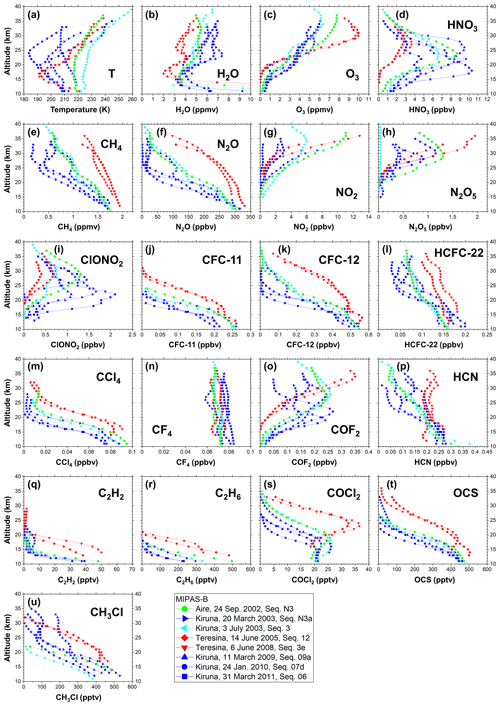
Figure 1Retrieved vertical profiles of temperature (a) and species (b–u) of Arctic winter (blue), Arctic summer (cyan), midlatitude (green), and tropical (red) MIPAS-B flights, as listed in Table 3.
Table 4Summary of MIPAS-E validation results (trajectory comparison to eight MIPAS-B flights). Mentioned atmospheric parameter differences refer to MIPAS-E minus the balloon instrument.
3.1 Temperature
Apart from its relevance as a primary atmospheric state parameter, the quality of temperature data is essential in the atmospheric emission limb sounding, since temperature profiles are generally retrieved prior to the trace gas retrievals. Hence, temperature errors propagate in subsequent retrievals of trace constituents. Our study shows that, above about 11 km, the mean differences between MIPAS-B and MIPAS-E are within ±2 K and within the combined systematic errors, although the standard deviations exceed the expected precision (see Fig. 2). In the lowermost stratosphere and around the tropopause, MIPAS-E exhibits a positive bias with respect to the balloon instrument in the OR mode and the tropics. Differences between both sensors are comparable to the findings of a comprehensive temperature validation study by Ridolfi et al. (2007) that addressed the FR mode period only using version 4.61 and 4.62 data. However, the large temperature differences between MIPAS-E and MIPAS-B in the tropical troposphere are not seen in a comparison to ground-based data (Hubert et al., 2020). A possible reason for this difference between both MIPAS sensors could be an inaccuracy in the altitude assignment (the tropopause altitude difference between both MIPAS instruments is up to 1 km), which has a particularly strong effect in combination with the strong vertical temperature gradient in the troposphere.
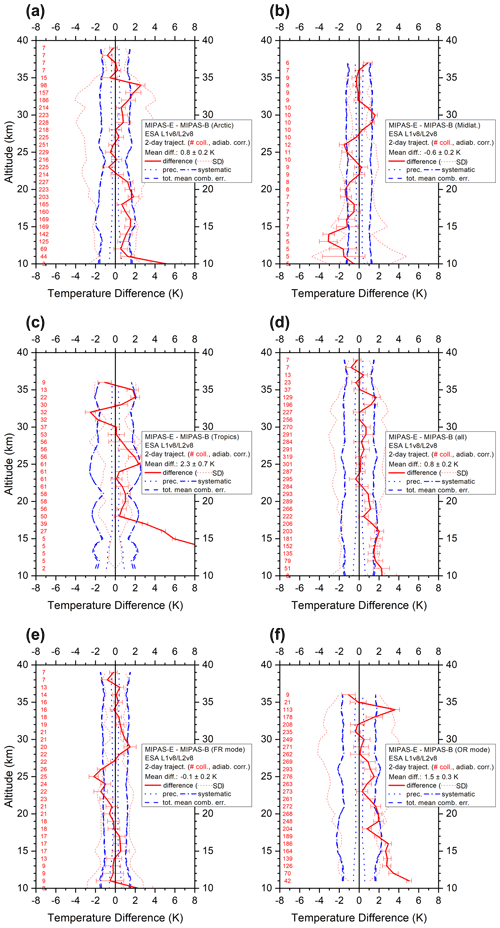
Figure 2Mean temperature difference (red solid line) of all trajectory match collocations (red numbers) between MIPAS-E and MIPAS-B, including standard deviation (red dotted lines) and standard error of the mean (plotted as error bars). Precision (blue dotted lines), systematic (blue dash-dotted lines), and total (blue dashed lines) mean combined errors are shown too. Arctic (a), midlatitude (b), tropics (c), all FR plus OR (d), FR mode (e), and OR mode (f) collocations. For details, see text.
3.2 H2O
In view of the ongoing debates on long-term trends of water vapour (e.g. Dessler et al., 2014; Lossow et al., 2018; Khosrawi et al., 2018), we carefully looked at the consistency of the validation results of the MIPAS-E FR phase with respect to the MIPAS-E OR phase. Figure 3 presents the intercomparison results. FR and OR mode comparisons show different vertical shapes of the differences between MIPAS-E and MIPAS-B. For a molecule like H2O with strong vertical VMR gradients, this might be at least partly explained by the fact that the MIPAS-E vertical resolution is somewhat higher in the OR mode compared to the FR phase (together with a larger retrieval error in the OR mode with respect to the FR phase), as shown by Dinelli et al. (2021). In the lowermost stratosphere and upper troposphere, MIPAS-E significantly overestimates H2O and exceeds the combined systematic error bars around 15 km in the OR mode. This general behaviour also remains in the statistical analysis of all collocations. In the middle and upper stratosphere, a positive bias of 5 %–20 % for MIPAS-E against MIPAS-B (increasing with altitude in the FR period) is visible, although the errors stay within the predicted error budget (except at 37 km). These findings are in line with the conclusions drawn from a comprehensive validation study of MIPAS-E (version 4.61) phase one (FR mode) observations by Wetzel et al. (2013a). The differences found in the FR and OR modes also agree with the discrepancies seen in the Stratosphere-troposphere Processes and their Role in Climate (SPARC) Data Initiative, where non-operational MIPAS-E data (von Clarmann et al., 2009) were compared to the multi-instrument mean of satellite sensors (Hegglin et al., 2021). No major differences were seen between MIPAS-E v7 (as used in the SPARC comparisons) and v8 data (Lossow et al., 2019). The pronounced deviation between both MIPAS sensors in the tropical troposphere may possibly be explained by an inaccuracy in the altitude assignment (the hygropause altitude difference between both MIPAS instruments is up to 1 km) in combination with the strong vertical H2O gradient in this altitude region.
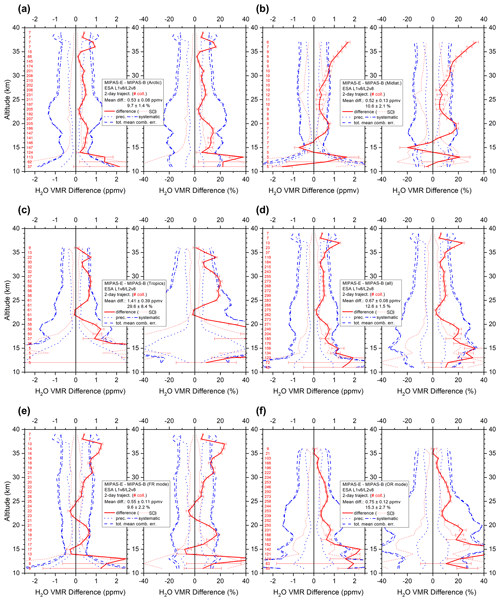
Figure 3Mean absolute and relative H2O VMR differences of all trajectory match collocations (red numbers) between MIPAS-E and MIPAS-B (red solid line), including standard deviation (red dotted lines) and standard error of the mean (plotted as error bars). Precision (blue dotted lines), systematic (blue dash-dotted lines), and total (blue dashed lines) mean combined errors are shown too. Arctic (a), midlatitude (b), tropics (c), all FR plus OR (d), FR mode (e), and OR mode (f) collocations. For details, see text.
3.3 O3
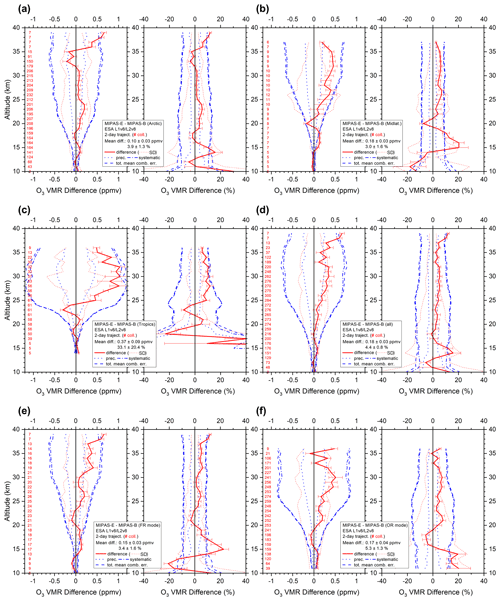
The monitoring of the expected recovery of the stratospheric ozone layer – and, in particular, the Antarctic ozone hole – still remains of great scientific interest (e.g. Carpenter et al., 2014; Dhomse et al., 2019). Hence, ozone was one of the key species during the ENVISAT mission. Comparisons based on the full statistics over all collocations show an agreement within ±10 % between the satellite and the balloon data above 15 km for this mainly stratospheric species (see Fig. 4). For most of the stratosphere (17–37 km), the mean relative difference between the data sets is always within ±5 %. Furthermore, differences of the combined FR plus OR mode are within the combined systematic error. Degradation in the quality of the agreement is observed in the lower stratosphere and upper troposphere, with deviations up to about 20 % in both observation periods. Generally, the statistical agreement between the two datasets is comparable to that reported by Cortesi et al. (2007) for the FR mode phase (v4.61/v4.62), as deduced from an extensive study using various kinds of correlative data.
3.4 HNO3
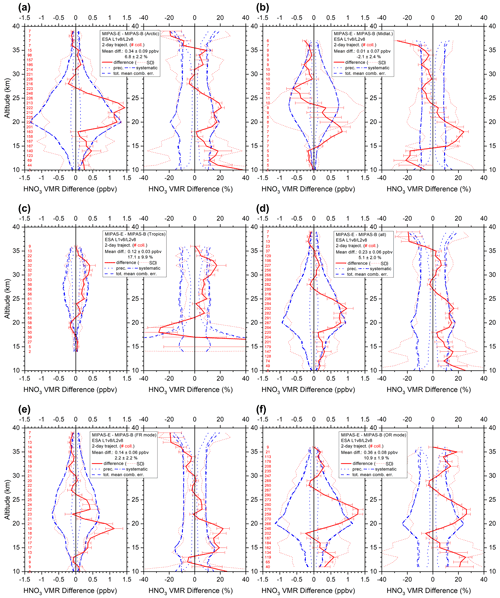
HNO3 is an important stratospheric nitrogen reservoir species (see, e.g. Brasseur and Solomon, 2005). VMR difference profiles of this trace gas are presented in Fig. 5. MIPAS-E tends to overestimate the HNO3 abundance when compared to MIPAS-B below about 27 km. This bias is most prominent in the OR mode data between 19 and 26 km around the altitude of the VMR maximum of the HNO3 profile. Biases are typically in the order of 5 %–20 % in relative units and are in line with the numbers reported by Wang et al. (2007), referring to the FR period (v4.61/v4.62). Positive biases of comparable magnitude between non-operational MIPAS-E data and the multi-instrument mean were also found at mid and high latitudes in the SPARC Data Initiative comparison (SPARC, 2017). Standard deviations clearly exceed the expected precision.
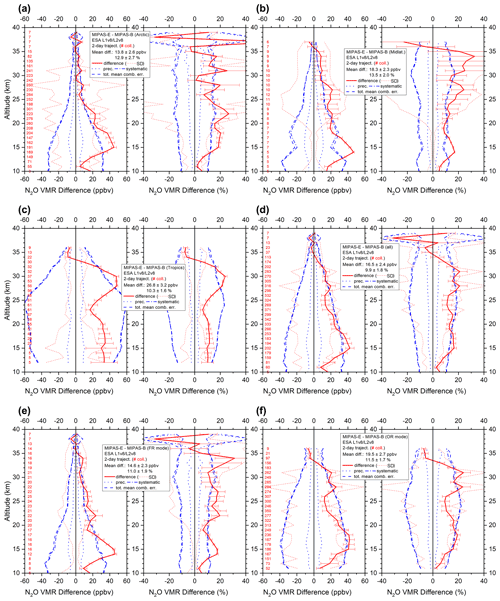
3.5 CH4 and N2O
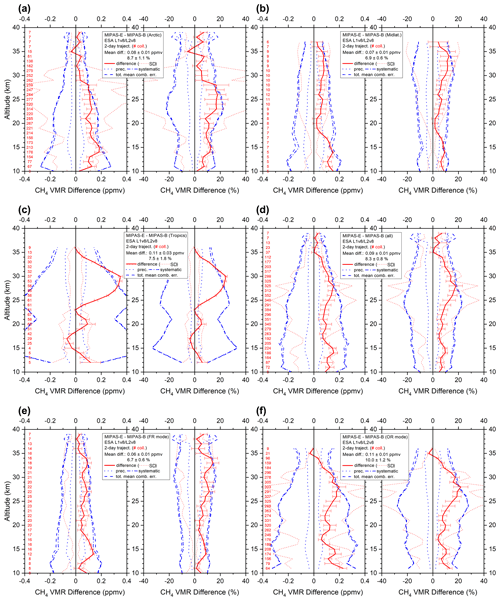
These two species are long-lived tracers of similar lifetimes and are therefore correlated to each other (see, e.g. Michelsen et al., 1998). Hence, they are discussed together in this study. Figures 6 and 7 present the results for these molecules based on the statistical trajectory analysis of all collocations available. Both species show quite a similar altitude-dependent behaviour in terms of the mean difference in absolute and relative quantities, while standard deviations exceed the expected precision. Below about 35 km, MIPAS-E tends to overestimate the abundance of both species in the stratosphere by 5 %–15 % (CH4) and 10 %–20 % (N2O), respectively. A similar positive bias has already been mentioned in the (FR mode, v4.61) validation study by Payan et al. (2009). A similar behaviour is found for non-operational products of other algorithms analysing MIPAS-E data in the SPARC Data Initiative comparison in the stratosphere and upper troposphere, especially in the FR mode period (SPARC, 2017). Somewhat larger positive deviations between both MIPAS instruments are visible around 30 km in the tropics.
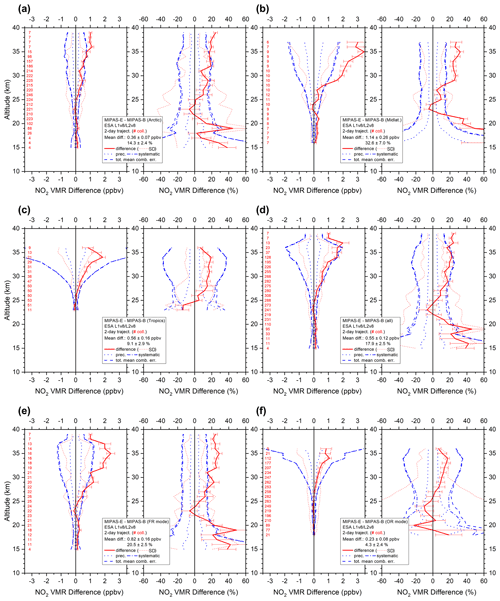
3.6 NO2
NO2 exhibits a strong diurnal variation in the stratosphere and is in photochemical equilibrium with NO and N2O5 (see, e.g. Brasseur and Solomon, 2005). This needs to be taken into account when comparing NO2 datasets of different SZA. For our study, a photochemical correction considering differences in the SZA between the measurements of both sensors has been applied, as described in more detail in Sect. 2. Figure 8 presents the statistical trajectory match analysis. It indicates a positive bias (up to 20 %, unexplained above 31 km) of MIPAS-E NO2 in the FR period that becomes increasingly significant from lower to higher altitudes. This is in line with the findings of the comprehensive NO2 validation study (FR mode) reported by Wetzel et al. (2007), referring to v4.61 MIPAS-E data. In the OR period, the positive bias (above 27 km) between both sensors is smaller and amounts to about 10 %. Differences recognised during the SPARC Data Initiative are quite time variable. However, differences between the MIPAS instruments, as shown here, stay within the standard deviation of the differences between non-operational MIPAS-E data and the multi-instrument mean of satellite sensors (SPARC, 2017).
3.7 Additional v6 products: N2O5, ClONO2, CFC-11, and CFC-12
Starting with processor v6, four additional target species – namely N2O5, ClONO2, CFC-11, and CFC-12 – have been operationally processed by ESA. A first validation study of these species was carried out by Wetzel et al. (2013b).
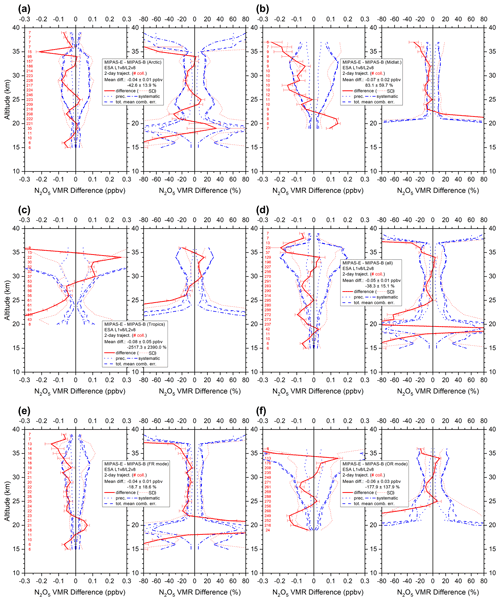
N2O5 is a temporary reservoir of reactive nitrogen in the stratosphere and exhibits a prominent diurnal variation, with maxima just before sunrise and minima just before sunset (see, e.g. Brasseur and Solomon, 2005). The general agreement between MIPAS-E and MIPAS-B is within ±10 % between 24 and 34 km for the mean of all collocations (see Fig. 9). Below 24 and above 34 km, mean differences at least partly exceed the systematic errors, suggesting the need for a more careful use of the MIPAS-E N2O5 data for scientific studies in these altitude regimes. No significant bias is visible in the OR mode, but a small negative bias is obvious in the FR period. The validation results are in line with the v6 comparison study by Wetzel et al. (2013b).
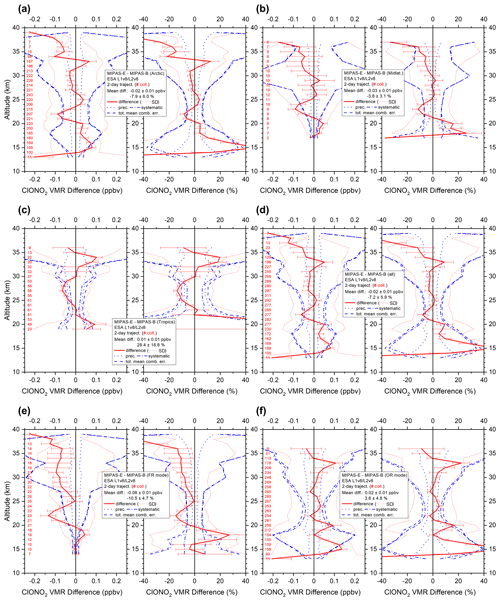
ClONO2 is a major reservoir of reactive chlorine in the stratosphere and is involved in heterogeneous chemistry in the context of ozone depletion at high latitudes (e.g. von Clarmann and Johansson, 2018, and references therein). It undergoes diurnal variations at higher altitudes during periods of stronger illumination; therefore, it had to be photochemically corrected there. Figure 10 presents the intercomparison results for all collocations. In the altitude region where ClONO2 concentrations are most relevant, both datasets are consistent. Differences are within ±10 % between 17 and 34 km, without a clear bias. Only at the upper and lower altitude edges of the comparisons do the mean differences exceed the combined systematic errors. However, standard deviations clearly exceed the expected precision. The v8 validation results are comparable to the outcome of the study performed by Wetzel et al. (2013b), referring to v6 data.
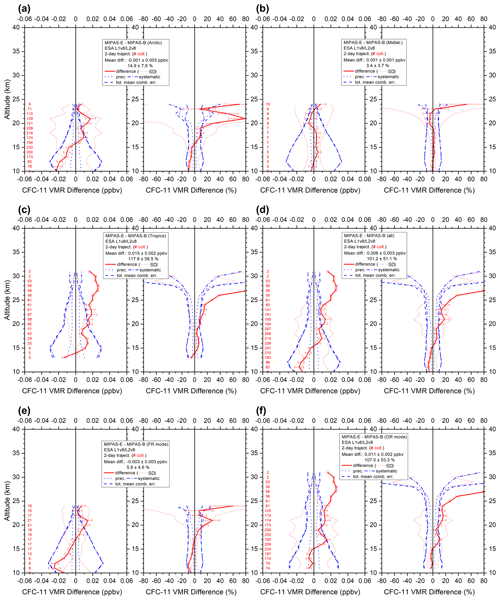
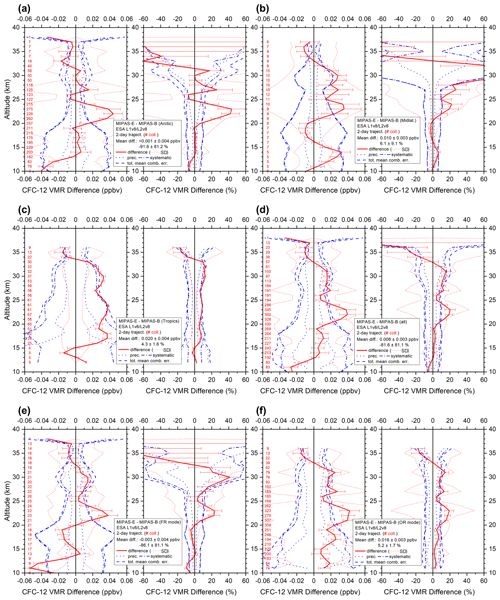
The gases CFC-11 (CCl3F) and CFC-12 (CCl2F2) are rather long-lived chlorofluorocarbons (Ko and Dak Sze, 1982). Results are shown in Figs. 11 and 12, respectively. In the case of CFC-12, mean differences remain within the combined errors and are within ±5 % (smaller than in previous versions, not shown in the plots) below 20 km. Above this altitude, a significant positive bias is visible (up to 32 km), and standard deviations exceed the expected precision. However, this bias is less pronounced than in the validation studies performed by Engel et al. (2016) and by Wetzel et al. (2013b), which were based on observations in comparison to MIPAS-E v6 data. Deviations for CFC-11 are somewhat larger than for CFC-12, up to ±10 % below 20 km. An increasing positive bias is obvious above this altitude level. However, CFC-11 differences between both MIPAS instruments are smaller compared to the differences shown in the previous validation study by Engel et al. (2016). The improvement in the quality of the CFC-11 v8 dataset compared to v6 is also clearly seen if one considers previous comparisons to the MIPAS balloon observations (Wetzel et al., 2013b).
3.8 Additional v7 products: HCFC-22, CCl4, CF4, COF2, and HCN
Five more species have been operationally processed by the v7 algorithm. To date, an intercomparison study is only available for CCl4 profiles (Valeri et al., 2017). It should be mentioned that these species are generally more difficult to retrieve than the gases described before. This also holds for the MIPAS-B retrieval, although these gases can be measured with higher accuracy (mainly due to lower spectral noise) compared to MIPAS-E. Hence, some unexplained features (exceeding combined systematic errors) in the VMR difference profiles are expected to occur more frequently when comparing these molecules.
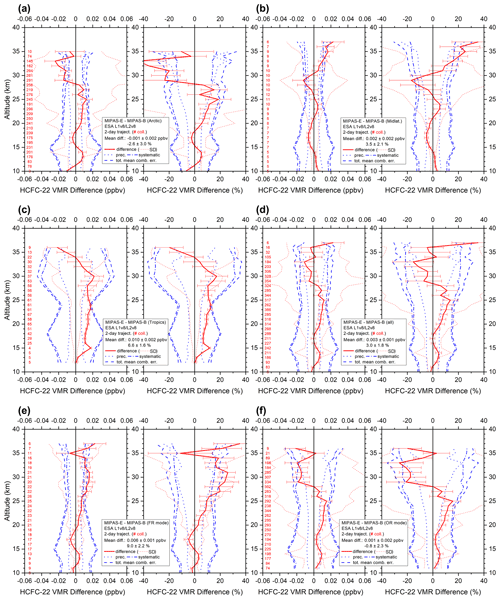
HCFC-22 (CHClF2) is a longer-lived hydrochlorofluorocarbon. Since HCFC-22 is often used as an alternative to the highly ozone-depleting CFC-11 and CFC-12, its tropospheric concentration is further increasing (e.g. Chirkov et al., 2016). Comparison results are depicted in Fig. 13. In the FR mode period, differences between both instruments remain within ±10 % up to 26 km, turning into a significant positive bias for MIPAS-E above this altitude. In the OR observation period, deviations stay within 10 % for altitudes up to 28 km, while a significant negative bias is visible in the MIPAS-E data above this altitude level. Standard deviations exceed the expected precision at higher altitudes (mainly OR phase).
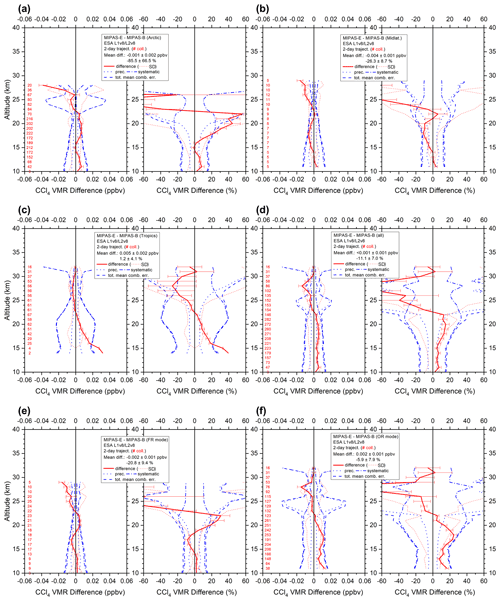
The tropospheric mixing ratio of the longer-lived source gas CCl4 has been clearly decreasing since the beginning of the 1990s (Prinn et al., 2000). However, estimated sources and sinks of this molecule are inconsistent with observations of its abundance (Carpenter et al., 2014). A significant negative bias shows up in the MIPAS-E CCl4 data (full period) above 22 km (see Fig. 14), which is close to the combined systematic error limits. A significant positive bias is visible below 21 km during the OR phase. However, differences stay within ±20 % up to about 22 km in both observation periods, which is in line with the deviations reported by Valeri et al. (2017), referring to v7 data.
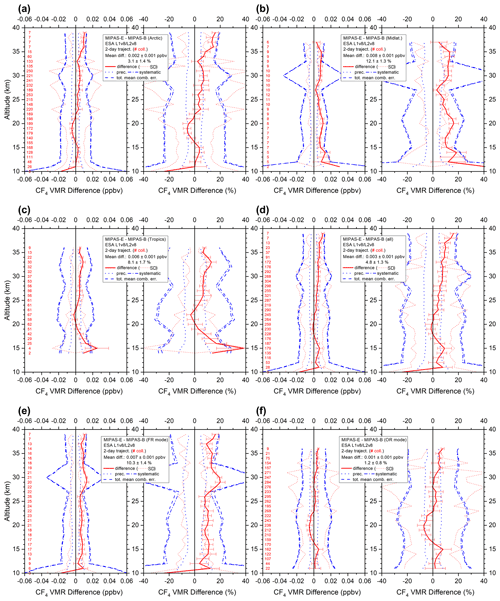
The fluorocarbon CF4 has an extremely long atmospheric lifetime of more than 50 000 years, and its atmospheric concentration is linearly increasing (Carpenter et al., 2014). Comparison results are shown in Fig. 15. Between 11 and 37 km, there is general agreement between both instruments (within ±10 % in both observation periods). In the FR phase, a significant positive bias above 10 km is visible. In contrast, no clear bias is obvious in the OR period, where differences stay within ±10 % at all altitudes. However, standard deviations exceed the expected precision in the OR phase.
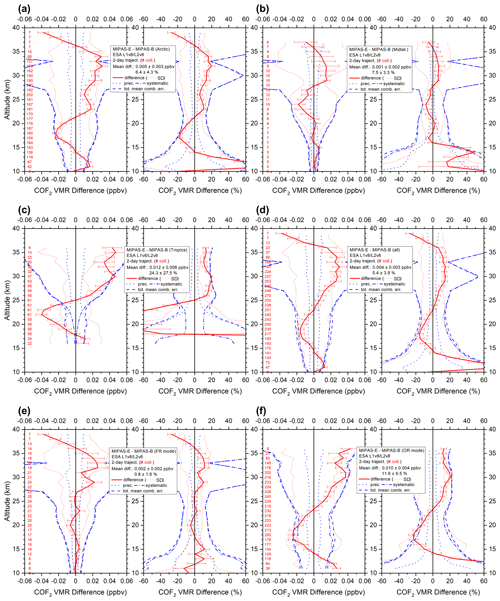
The molecule COF2 is a stratospheric reservoir species for fluorine (Harrison et al., 2014). The general profile shape (as measured by MIPAS-B) is reproduced by MIPAS-E (see Fig. 16). Stratospheric VMR differences stay within ±10 % in the FR period and ±20 % in the OR period. No unexplained biases (in terms of combined systematic error bars) are evident.
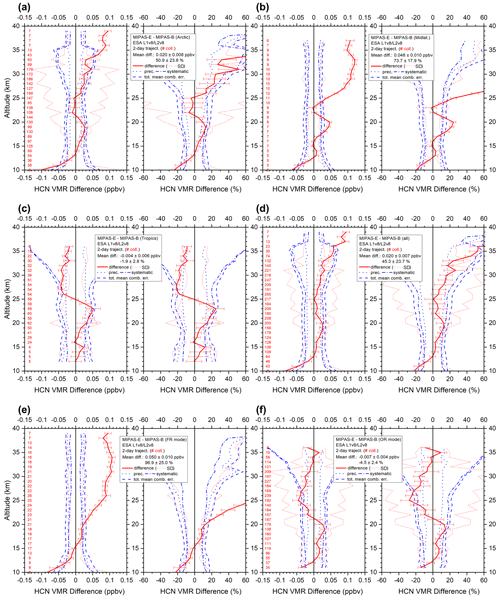
HCN is mainly produced by biomass burning and is hence considered to be an almost-unambiguous tracer for biomass burning events (e.g. Li et al., 2003). Differences are within ±20 % below 34 km (see Fig. 17). A significant positive bias (more than 20 %) is evident in the MIPAS-E profiles observed in the FR mode period, exceeding the combined systematic error limits above 20 km. This pronounced bias is visible in each comparison of the three MIPAS-B flights in the FR phase. No clear bias can be seen in the OR period. Between about 20 and 30 km, the standard deviation exceeds the estimated precision in the OR phase.
3.9 Additional v8 products: C2H2, C2H6, COCl2, OCS, and CH3Cl
Some more target molecules have been operationally processed by the v8 algorithm. To date, an intercomparison study is only available for COCl2 (Pettinari et al., 2021). Similar to the additional v7 gases, the emissions of spectral lines of the v8 molecules are also weak compared to the spectral signatures of the standard gases (before v7). Hence, retrievals of these additional species are challenging.
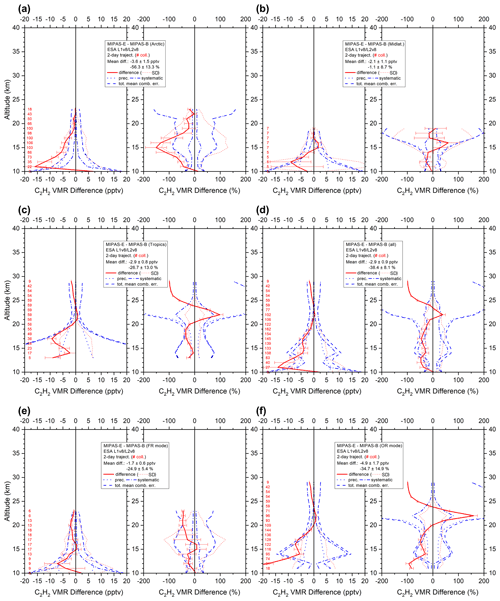
C2H2 is mainly produced by biomass burning and, to a lesser extent, by biofuel burning (e.g. Singh et al., 1996; Parker et al., 2011; Wiegele et al., 2012). Differences are within ±50 % up to 24 km (see Fig. 18). A significant negative bias (within −50 % difference limit) is evident in the FR mode (except for 15–16 km). A significant negative bias below 20 km and above 23 km can be seen in the OR mode (exceeding combined systematic errors and the −50 % difference limit). Lower stratospheric altitude regions in MIPAS-E retrievals sometimes show negative VMRs (in Arctic winter). Hence, this species should be used carefully in scientific studies.
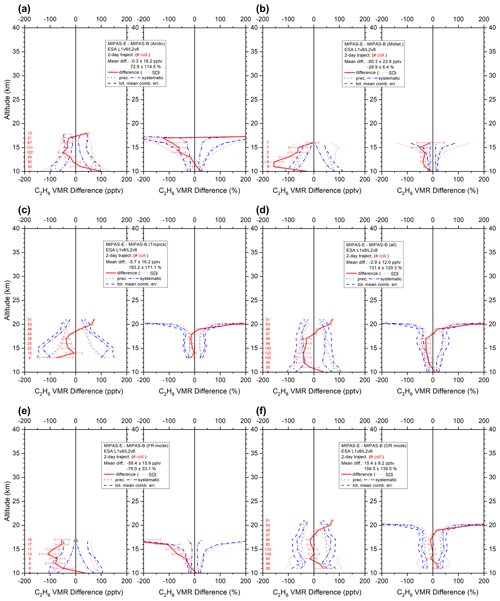
C2H6 is produced by biomass burning, natural gas losses, and fossil fuel production (e.g. Rudolph, 1995; Xiao et al., 2008; Glatthor et al., 2009). Differences are within ±25 % up to 19 km (see Fig. 19). While a significant negative bias in MIPAS-E is obvious in the FR period (exceeding the −50 % limit above 13 km), no bias is seen in the MIPAS-E data below 20 km in the OR mode, where differences are within a ±20 % range. Lower stratospheric altitude regions in MIPAS-E retrievals sometimes show negative VMRs (in the Arctic).
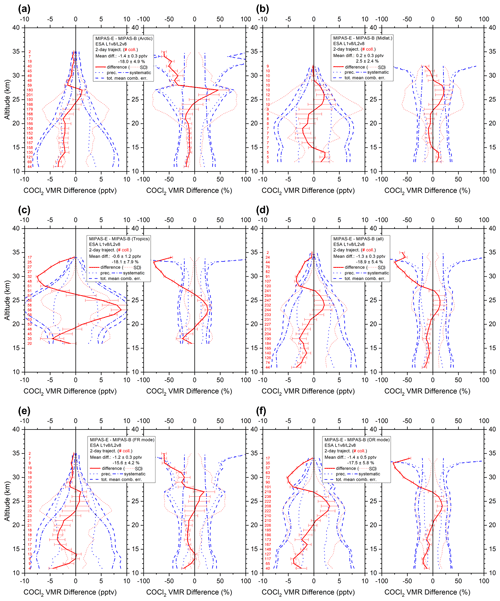
COCl2 is produced by chemical industries and OH-initiated oxidation of chlorinated hydrocarbons in the troposphere (Kindler et al., 1995; Fu et al., 2007; Valeri et al., 2016). Figure 20 shows that differences are within ±20 % up to 27 km in both observation periods, such that the general profile shapes (as measured by MIPAS-B) are reproduced by the satellite instrument. A negative bias is evident in the FR and OR period (except for 22–27 km), unexplained at high altitudes. Deviations in the tropics are quite large. The deviations are in line with the findings of Pettinari et al. (2021), who compared v8 data not only to MIPAS-B but also to observations from ACE-FTS. Pettinari et al. (2021) found that some of the differences between MIPAS-E and MIPAS-B can be attributed to the different spectroscopic data used (Toon et al., 2001, for MIPAS-B and Tchana et al., 2015, in the case of MIPAS-E).
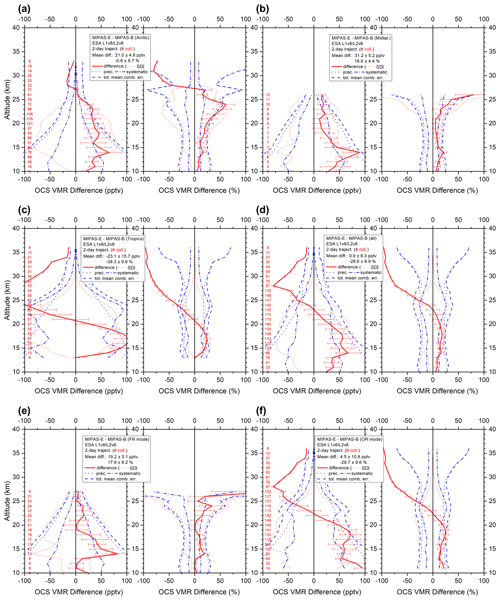
OCS is the most prevalent sulfur-containing species which is transported into the stratosphere, where it acts as a precursor for the stratospheric aerosol layer (Crutzen, 1976; Kremser et al., 2016; Glatthor et al., 2017). Differences are within ±20 % up to 24 km in the FR period and within ±25 % up to 25 km in the OR period (see Fig. 21). A significant positive bias is visible below 22 km, and a negative bias is visible above this altitude in the OR period, exceeding the ±50 % limit and the combined systematic errors above 24 km. The agreement between the VMR profiles of both sensors is better in the FR period. Here, a significant (positive) bias is only visible between 14 and 18 km. Deviations in the tropics are quite large.
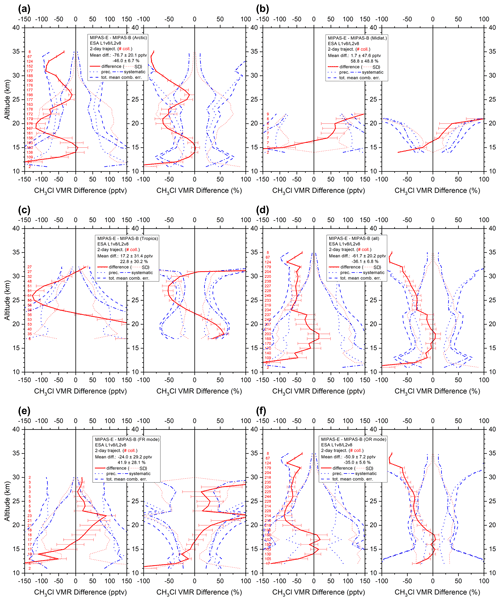
CH3Cl is the most abundant halocarbon in the atmosphere and originates from natural and anthropogenic sources (see, e.g. Yokouchi et al., 2000). Figure 22 shows that differences stay within ±20 % between 13 and 22 km (full observation period). However, the comparison reveals a positive bias above 16 km and a negative bias below this altitude in the FR period. A negative bias within −35 % between 19 and 26 km, increasing with altitude and exceeding the combined systematic errors above 26 km, is also visible in the OR period. Large deviations between both instruments occur at midlatitudes and in the tropics.
Vertical profiles of MIPAS balloon flights between 2002 and 2011, covering virtually the whole lifetime of MIPAS on ENVISAT, have been used for an intercomparison study of all operational parameters delivered by ESA (except HDO) – namely, temperature and 20 species, as listed in Table 1. The main findings of this intercomparison study are summarised in Table 4. The difference between the retrieved temperature profiles of both MIPAS instruments generally stays within ±2 K in the stratosphere. The MIPAS satellite observations of a large number of gases like H2O, O3, HNO3, CH4, N2O, NO2, N2O5, ClONO2, CFC-11, CFC-12, HCFC-22, CCl4, CF4, COF2, and HCN show an overall good agreement of 5 % to 20 % with the MIPAS balloon measurements in the lower stratosphere.
The intercomparison of the new MIPAS-E v8 products C2H2, C2H6, COCl2, OCS, and CH3Cl exhibits a somewhat poorer agreement with the MIPAS-B observations compared to the above-mentioned species. However, COCl2, OCS, and CH3Cl at least achieve a 20 % agreement in the extratropical upper troposphere and lower stratosphere.
Overall, it can be stated that the v8 operational MIPAS-E data can be recommended for scientific use. However, data users are strongly advised to consider the findings presented in this study in the respective sections and in Table 4 when using the MIPAS-E data. A comprehensive MIPAS-E quality readme file, including not only the validation results related to MIPAS-B but also the ground-based and ACE-FTS validation results, was published by Raspollini et al. (2020) and is recommended for data users who want to get more detailed information on the quality of the MIPAS satellite data.
MIPAS operational satellite data are available at the European Space Agency mission web page (https://doi.org/10.5270/EN1-c8hgqx4; ESA, 2021a). MIPAS balloon validation data are available upon request from the leading author of this study (gerald.wetzel@kit.edu).
GW wrote the paper and performed the bulk of the MIPAS balloon data analysis, with input from all co-authors. AK performed the MIPAS-B Level 1 data processing. MH provided the retrieval software. FFV and GM operated the balloon instrument during all campaigns. HO directed the research and flight planning. MS used a one-dimensional model for photochemical corrections. JA performed trajectory match calculations. PR had a leading role in evaluating and improving the MIPAS ESA data. AD was the head of the MIPAS Quality Working Group and coordinated the validation activities. All authors commented on and improved the manuscript.
The contact author has declared that none of the authors has any competing interests.
Publisher’s note: Copernicus Publications remains neutral with regard to jurisdictional claims in published maps and institutional affiliations.
This article is part of the special issue “MIPAS ESA Level 2 version 8 products: algorithms, product features and validation”. It is not associated with a conference.
Financial support of the MIPAS balloon flights by the DLR (project no. 50EE0020) and ESA is gratefully acknowledged. We thank the Centre National d'Etudes Spatiales (CNES) balloon launching team and the Swedish Space Corporation (SSC) Esrange team for the excellent balloon operations. An acknowledgement goes to the work performed by the Quality Working Group established by ESA for verification and monitoring of MIPAS products. A corresponding report on the validation activities was published by ESA (Wetzel et al., 2020). We acknowledge support from the Deutsche Forschungsgemeinschaft.
The article processing charges for this open-access publication were covered by the Karlsruhe Institute of Technology (KIT).
This paper was edited by Natalya Kramarova and reviewed by four anonymous referees.
Bertaux, J. L., Mégie, G., Widemann, T., Chassefière, E., Pellinen, R., Kyrola, E., Korpela, S., and Simon, P.: Monitoring of ozone trend by stellar occultations: the GOMOS instrument, Adv. Space Res., 11, 237–242, https://doi.org/10.1016/0273-1177(91)90426-K, 1991.
Bovensmann, H., Burrows, J. P., Buchwitz, M., Frerick, J., Noël, S., Rozanov, V. V., Chance, K. V., and Goede, A. P. H.: SCIAMACHY: Mission Objectives and Measurement Modes, J. Atmos. Sci., 56, 127–150, https://doi.org/10.1175/1520-0469(1999)056<0127:SMOAMM>2.0.CO;2, 1999.
Bracher, A., Sinnhuber, M., Rozanov, A., and Burrows, J. P.: Using a photochemical model for the validation of NO2 satellite measurements at different solar zenith angles, Atmos. Chem. Phys., 5, 393–408, https://doi.org/10.5194/acp-5-393-2005, 2005.
Brasseur, G. P. and Solomon, S.: Aeronomy of the Middle Atmosphere: Chemistry and Physics of the Stratosphere and Mesosphere, 3rd revised and enlarged edn., Atmospheric and Oceanographic Sciences Library, Vol. 32, Springer, Dordrecht, ISBN: 978-1-4020-3284-4, 2005.
Carpenter, L. J., Reimann, S., Burkholder, J. B., Clerbaux, C., Hall, B. D., Hossaini, R., Laube, J. C., and Yvon-Lewis, S. A.: Chapter 1: Update on Ozone-Depleting Substances (ODSs) and Other Gases of Interest to the Montreal Protocol, in: Scientific Assessment of Ozone Depletion, edited by: Ennis, C. A., World Meteorological Organization (WMO), 21–125, ISBN: 978-9966-076-01-4, 2014.
Chirkov, M., Stiller, G. P., Laeng, A., Kellmann, S., von Clarmann, T., Boone, C. D., Elkins, J. W., Engel, A., Glatthor, N., Grabowski, U., Harth, C. M., Kiefer, M., Kolonjari, F., Krummel, P. B., Linden, A., Lunder, C. R., Miller, B. R., Montzka, S. A., Mühle, J., O'Doherty, S., Orphal, J., Prinn, R. G., Toon, G., Vollmer, M. K., Walker, K. A., Weiss, R. F., Wiegele, A., and Young, D.: Global HCFC-22 measurements with MIPAS: retrieval, validation, global distribution and its evolution over 2005–2012, Atmos. Chem. Phys., 16, 3345–3368, https://doi.org/10.5194/acp-16-3345-2016, 2016.
Cortesi, U., Lambert, J. C., De Clercq, C., Bianchini, G., Blumenstock, T., Bracher, A., Castelli, E., Catoire, V., Chance, K. V., De Mazière, M., Demoulin, P., Godin-Beekmann, S., Jones, N., Jucks, K., Keim, C., Kerzenmacher, T., Kuellmann, H., Kuttippurath, J., Iarlori, M., Liu, G. Y., Liu, Y., McDermid, I. S., Meijer, Y. J., Mencaraglia, F., Mikuteit, S., Oelhaf, H., Piccolo, C., Pirre, M., Raspollini, P., Ravegnani, F., Reburn, W. J., Redaelli, G., Remedios, J. J., Sembhi, H., Smale, D., Steck, T., Taddei, A., Varotsos, C., Vigouroux, C., Waterfall, A., Wetzel, G., and Wood, S.: Geophysical validation of MIPAS-ENVISAT operational ozone data, Atmos. Chem. Phys., 7, 4807–4867, https://doi.org/10.5194/acp-7-4807-2007, 2007.
Crutzen, P. J.: The possible importance of CSO for the sulfate layer of the stratosphere, Geophys. Res. Lett., 3, 73–76, https://doi.org/10.1029/GL003i002p00073, 1976.
Dessler, A. E., Schoeberl, M. R., Wang, T., Davis, S. M., Rosenlof, K. H., and Vernier, J.-P.: Variations of stratospheric water vapor over the past three decades, J. Geophys. Res.-Atmos., 119, 12588–12598, https://doi.org/10.1002/2014JD021712, 2014.
Dhomse, S. S., Feng, W., Montzka, S. A., Hossaini, R., Keeble, J., Pyle, J. A., Daniel, J. S., and Chipperfield, M. P.: Delay in recovery of the Antarctic ozone hole from unexpected CFC-11 emissions, Nature Communications, 10, 5781, https://doi.org/10.1038/s41467-019-13717-x, 2019.
Dinelli, B. M., Raspollini, P., Gai, M., Sgheri, L., Ridolfi, M., Ceccherini, S., Barbara, F., Zoppetti, N., Castelli, E., Papandrea, E., Pettinari, P., Dehn, A., Dudhia, A., Kiefer, M., Piro, A., Flaud, J.-M., López-Puertas, M., Moore, D., Remedios, J., and Bianchini, M.: The ESA MIPAS/Envisat level2-v8 dataset: 10 years of measurements retrieved with ORM v8.22, Atmos. Meas. Tech., 14, 7975–7998, https://doi.org/10.5194/amt-14-7975-2021, 2021.
Dudhia, A., Jay, V. L., and Rodgers, C. D.: Microwindow selection for high-spectral-resolution sounders, Appl. Optics, 41, 3665–3673, https://doi.org/10.1364/AO.41.003665, 2002.
Engel, A., Bönisch, H., Schwarzenberger, T., Haase, H.-P., Grunow, K., Abalichin, J., and Sala, S.: Long-term validation of ESA operational retrieval (version 6.0) of MIPAS Envisat vertical profiles of methane, nitrous oxide, CFC11, and CFC12 using balloon-borne observations and trajectory matching, Atmos. Meas. Tech., 9, 1051–1062, https://doi.org/10.5194/amt-9-1051-2016, 2016.
ESA: ESA declares end of mission for Envisat, ESA, https://www.esa.int/Applications/Observing_the_Earth/Envisat/ESA_declares_end_of_mission_for_Envisat (last access: 12 July 2022), 2012.
ESA: Envisat MIPAS L2 – Temperature, pressure and atmospheric constituents profiles product, Version 8.22, ESA [data set], https://doi.org/10.5270/EN1-c8hgqx4, 2021a.
ESA: New Envisat MIPAS L2 dataset reprocessed with ORM v822 available – Earth Online, ESA [data set], https://earth.esa.int/eogateway/news/new-envisat- mipas-l2-dataset-reprocessed-with-orm-v822-available (last access: 12 July 2022), 2021b.
Fischer, H., Birk, M., Blom, C., Carli, B., Carlotti, M., von Clarmann, T., Delbouille, L., Dudhia, A., Ehhalt, D., Endemann, M., Flaud, J. M., Gessner, R., Kleinert, A., Koopman, R., Langen, J., López-Puertas, M., Mosner, P., Nett, H., Oelhaf, H., Perron, G., Remedios, J., Ridolfi, M., Stiller, G., and Zander, R.: MIPAS: an instrument for atmospheric and climate research, Atmos. Chem. Phys., 8, 2151–2188, https://doi.org/10.5194/acp-8-2151-2008, 2008.
Friedl-Vallon, F., Maucher, G., Seefeldner, M., Trieschmann, O., Kleinert, A., Lengel, A., Keim, C., Oelhaf, H., and Fischer, H.: Design and characterization of the balloon-borne Michelson Interferometer for Passive Atmospheric Sounding (MIPAS-B2), Appl. Optics, 43, p. 3335, https://doi.org/10.1364/AO.43.003335, 2004.
Fu, D., Boone, C. D., Bernath, P. F., Walker, K. A., Nassar, R., Manney, G. L., and McLeod, S. D.: Global phosgene observations from the Atmospheric Chemistry Experiment (ACE) mission, Geophys. Res. Lett., 34, L17815, https://doi.org/10.1029/2007GL029942, 2007.
Glatthor, N., von Clarmann, T., Stiller, G. P., Funke, B., Koukouli, M. E., Fischer, H., Grabowski, U., Höpfner, M., Kellmann, S., and Linden, A.: Large-scale upper tropospheric pollution observed by MIPAS HCN and C2H6 global distributions, Atmos. Chem. Phys., 9, 9619–9634, https://doi.org/10.5194/acp-9-9619-2009, 2009.
Glatthor, N., Höpfner, M., Leyser, A., Stiller, G. P., von Clarmann, T., Grabowski, U., Kellmann, S., Linden, A., Sinnhuber, B.-M., Krysztofiak, G., and Walker, K. A.: Global carbonyl sulfide (OCS) measured by MIPAS/Envisat during 2002–2012, Atmos. Chem. Phys., 17, 2631–2652, https://doi.org/10.5194/acp-17-2631-2017, 2017.
Grunow, K.: Anwendung von Trajektorien zur ENVISAT-Validierung und zur Untersuchung der Luftmassenherkunft in der Stratosphäre, PhD thesis, Free University Berlin, Berlin, Germany, ISBN: 978-3899599336, 2009.
Harrison, J. J.: New and improved infrared absorption cross sections for dichlorodifluoromethane (CFC-12), Atmos. Meas. Tech., 8, 3197–3207, https://doi.org/10.5194/amt-8-3197-2015, 2015.
Harrison, J. J.: New and improved infrared absorption cross sections for chlorodifluoromethane (HCFC-22), Atmos. Meas. Tech., 9, 2593–2601, https://doi.org/10.5194/amt-9-2593-2016, 2016.
Harrison, J. J., Chipperfield, M. P., Dudhia, A., Cai, S., Dhomse, S., Boone, C. D., and Bernath, P. F.: Satellite observations of stratospheric carbonyl fluoride, Atmos. Chem. Phys., 14, 11915–11933, https://doi.org/10.5194/acp-14-11915-2014, 2014.
Harrison, J. J., Boone, C. D., and Bernath, P. F.: New and improved infra-red absorption cross sections and ACE-FTS retrievals of carbon tetrachloride (CCl4), J. Quant. Spectrosc. Ra., 186, 139–149, https://doi.org/10.1016/j.jqsrt.2016.04.025, 2017.
Hegglin, M. I., Tegtmeier, S., Anderson, J., Bourassa, A. E., Brohede, S., Degenstein, D., Froidevaux, L., Funke, B., Gille, J., Kasai, Y., Kyrölä, E. T., Lumpe, J., Murtagh, D., Neu, J. L., Pérot, K., Remsberg, E. E., Rozanov, A., Toohey, M., Urban, J., von Clarmann, T., Walker, K. A., Wang, H.-J., Arosio, C., Damadeo, R., Fuller, R. A., Lingenfelser, G., McLinden, C., Pendlebury, D., Roth, C., Ryan, N. J., Sioris, C., Smith, L., and Weigel, K.: Overview and update of the SPARC Data Initiative: comparison of stratospheric composition measurements from satellite limb sounders, Earth Syst. Sci. Data, 13, 1855–1903, https://doi.org/10.5194/essd-13-1855-2021, 2021.
Höpfner, M., Oelhaf, H., Wetzel, G., Friedl-Vallon, F., Kleinert, A., Lengel, A., Maucher, G., Nordmeyer, H., Glatthor, N., Stiller, G., Clarmann, T. v., Fischer, H., Kröger, C., and Deshler, T.: Evidence of scattering of tropospheric radiation by PSCs in mid-IR limb emission spectra: MIPAS-B observations and KOPRA simulations, Geophys. Res. Lett., 29, 119-1–119-4, https://doi.org/10.1029/2001GL014443, 2002.
Hubert, D., Keppens, A., Granville, J., and Lambert, J.-C.: Validation report: comparison of MIPAS ORM 8.22 to ground-based data TN-BIRA-IASB-MultiTASTE-Phase-F-MIPAS-ORM8-Iss1-RevB, https://earth.esa.int/eogateway/documents/20142/37627/TN- BIRA-IASB-MultiTASTE-Phase-F-MIPAS-ORM8-Iss1-RevB.pdf (last access: 12 July 2022), 2020.
Khosrawi, F., Lossow, S., Stiller, G. P., Rosenlof, K. H., Urban, J., Burrows, J. P., Damadeo, R. P., Eriksson, P., García-Comas, M., Gille, J. C., Kasai, Y., Kiefer, M., Nedoluha, G. E., Noël, S., Raspollini, P., Read, W. G., Rozanov, A., Sioris, C. E., Walker, K. A., and Weigel, K.: The SPARC water vapour assessment II: comparison of stratospheric and lower mesospheric water vapour time series observed from satellites, Atmos. Meas. Tech., 11, 4435–4463, https://doi.org/10.5194/amt-11-4435-2018, 2018.
Kindler, T. P., Chameides, W. L., Wine, P. H., Cunnold, D. M., Alyea, F. N., and Franklin, J. A.: The fate of atmospheric phosgene and the stratospheric chlorine loadings of its parent compounds: CCl4, C2Cl4, C2HCl3, CH3CCl3, and CHCl3, J. Geophys. Res., 100, 1235–1251, https://doi.org/10.1029/94JD02518, 1995.
Ko, M. K. W. and Dak Sze, N.: A 2-D model calculation of atmospheric lifetimes for N2O, CFC-11 and CFC-12, Nature, 297, 317–319, https://doi.org/10.1038/297317a0, 1982.
Kremser, S., Thomason, L. W., Hobe, M. von, Hermann, M., Deshler, T., Timmreck, C., Toohey, M., Stenke, A., Schwarz, J. P., Weigel, R., Fueglistaler, S., Prata, F. J., Vernier, J.-P., Schlager, H., Barnes, J. E., Antuña-Marrero, J.-C., Fairlie, D., Palm, M., Mahieu, E., Notholt, J., Rex, M., Bingen, C., Vanhellemont, F., Bourassa, A., Plane, J. M. C., Klocke, D., Carn, S. A., Clarisse, L., Trickl, T., Neely, R., James, A. D., Rieger, L., Wilson, J. C., and Meland, B.: Stratospheric aerosol – Observations, processes, and impact on climate, Rev. Geophys., 54, 278–335, https://doi.org/10.1002/2015RG000511, 2016.
Li, Q., Jacob, D. J., Yantosca, R. M., Heald, C. L., Singh, H. B., Koike, M., Zhao, Y., Sachse, G. W., and Streets, D. G.: A global three-dimensional model analysis of the atmospheric budgets of HCN and CH3CN: Constraints from aircraft and ground measurements, J. Geophys. Res., 108, 8827, https://doi.org/10.1029/2002JD003075, 2003.
Lossow, S., Hurst, D. F., Rosenlof, K. H., Stiller, G. P., von Clarmann, T., Brinkop, S., Dameris, M., Jöckel, P., Kinnison, D. E., Plieninger, J., Plummer, D. A., Ploeger, F., Read, W. G., Remsberg, E. E., Russell, J. M., and Tao, M.: Trend differences in lower stratospheric water vapour between Boulder and the zonal mean and their role in understanding fundamental observational discrepancies, Atmos. Chem. Phys., 18, 8331–8351, https://doi.org/10.5194/acp-18-8331-2018, 2018.
Lossow, S., Khosrawi, F., Kiefer, M., Walker, K. A., Bertaux, J.-L., Blanot, L., Russell, J. M., Remsberg, E. E., Gille, J. C., Sugita, T., Sioris, C. E., Dinelli, B. M., Papandrea, E., Raspollini, P., García-Comas, M., Stiller, G. P., von Clarmann, T., Dudhia, A., Read, W. G., Nedoluha, G. E., Damadeo, R. P., Zawodny, J. M., Weigel, K., Rozanov, A., Azam, F., Bramstedt, K., Noël, S., Burrows, J. P., Sagawa, H., Kasai, Y., Urban, J., Eriksson, P., Murtagh, D. P., Hervig, M. E., Högberg, C., Hurst, D. F., and Rosenlof, K. H.: The SPARC water vapour assessment II: profile-to-profile comparisons of stratospheric and lower mesospheric water vapour data sets obtained from satellites, Atmos. Meas. Tech., 12, 2693–2732, https://doi.org/10.5194/amt-12-2693-2019, 2019.
Manney, G. L., Michelsen, H. A., Bevilacqua, R. M., Gunson, M. R., Irion, F. W., Livesey, N. J., Oberheide, J., Riese, M., Russell, J. M., Toon, G. C., and Zawodny, J. M.: Comparison of satellite ozone observations in coincident air masses in early November 1994, J. Geophys. Res., 106, 9923–9943, 2001.
Michelsen, H. A., Manney, G. L., Gunson, M. R., and Zander, R.: Correlations of stratospheric abundances of NOy, O3, N2O, and CH4 derived from ATMOS measurements, J. Geophys. Res., 103, 28347–28359, https://doi.org/10.1029/98JD02850, 1998.
Naujokat, B. and Grunow, K.: The stratospheric Arctic winter 2002/03: Balloon flight planning by trajectory calculations, in: 16th ESA Symposium on European Rocket and Balloon Programmes and Related Research, 2–5 June 2003, Sankt Gallen, Switzerland, edited by: Warmbein, B., ESA Publications Division, Noordwijk, ESA SP-530, ISBN 92-9092-840-9, 421–425, 2003.
Parker, R. J., Remedios, J. J., Moore, D. P., and Kanawade, V. P.: Acetylene C2H2 retrievals from MIPAS data and regions of enhanced upper tropospheric concentrations in August 2003, Atmos. Chem. Phys., 11, 10243–10257, https://doi.org/10.5194/acp-11-10243-2011, 2011.
Payan, S., Camy-Peyret, C., Oelhaf, H., Wetzel, G., Maucher, G., Keim, C., Pirre, M., Huret, N., Engel, A., Volk, M. C., Kuellmann, H., Kuttippurath, J., Cortesi, U., Bianchini, G., Mencaraglia, F., Raspollini, P., Redaelli, G., Vigouroux, C., De Mazière, M., Mikuteit, S., Blumenstock, T., Velazco, V., Notholt, J., Mahieu, E., Duchatelet, P., Smale, D., Wood, S., Jones, N., Piccolo, C., Payne, V., Bracher, A., Glatthor, N., Stiller, G., Grunow, K., Jeseck, P., Te, Y., and Butz, A.: Validation of version-4.61 methane and nitrous oxide observed by MIPAS, Atmos. Chem. Phys., 9, 413–442, https://doi.org/10.5194/acp-9-413-2009, 2009.
Pettinari, P., Barbara, F., Ceccherini, S., Dinelli, B. M., Gai, M., Raspollini, P., Sgheri, L., Valeri, M., Wetzel, G., Zoppetti, N., and Ridolfi, M.: Phosgene distribution derived from MIPAS ESA v8 data: intercomparisons and trends, Atmos. Meas. Tech., 14, 7959–7974, https://doi.org/10.5194/amt-14-7959-2021, 2021.
Phillips, D. L.: A technique for the numerical solution of certain integral equations of the first kind, J. ACM, 9, 84–97, https://doi.org/10.1145/321105.321114, 1962.
Prinn, R. G., Weiss, R. F., Fraser, P. J., Simmonds, P. G., Cunnold, D. M., Alyea, F. N., O'Doherty, S., Salameh, P., Miller, B. R., Huang, J., Wang, R. H. J., Hartley, D. E., Harth, C., Steele, L. P., Sturrock, G., Midgley, P. M., and McCulloch, A.: A history of chemically and radiatively important gases in air deduced from ALE/GAGE/AGAGE, J. Geophys. Res., 105, 17751–17792, https://doi.org/10.1029/2000JD900141, 2000.
Raspollini, P., Belotti, C., Burgess, A., Carli, B., Carlotti, M., Ceccherini, S., Dinelli, B. M., Dudhia, A., Flaud, J.-M., Funke, B., Höpfner, M., López-Puertas, M., Payne, V., Piccolo, C., Remedios, J. J., Ridolfi, M., and Spang, R.: MIPAS level 2 operational analysis, Atmos. Chem. Phys., 6, 5605–5630, https://doi.org/10.5194/acp-6-5605-2006, 2006.
Raspollini, P., Carli, B., Carlotti, M., Ceccherini, S., Dehn, A., Dinelli, B. M., Dudhia, A., Flaud, J.-M., López-Puertas, M., Niro, F., Remedios, J. J., Ridolfi, M., Sembhi, H., Sgheri, L., and von Clarmann, T.: Ten years of MIPAS measurements with ESA Level 2 processor V6 – Part 1: Retrieval algorithm and diagnostics of the products, Atmos. Meas. Tech., 6, 2419–2439, https://doi.org/10.5194/amt-6-2419-2013, 2013.
Raspollini, P., Piro, A., Hubert, D., Keppens, A., Lambert, J.-C., Wetzel, G., Moore, D., Ceccherini, S., Gai, M., Barbara, F., and Zoppetti, N.: Environmental Satellite (ENVISAT) Michelson Interferometer for Passive Atmospheric Sounding (MIPAS), ESA Level 2 version 8.22 products – product quality readme file, https://earth.esa.int/eogateway/documents/20142/37627/README_V8_issue_1.0_20201221.pdf (last access: 12 July 2022), 2020.
Raspollini, P., Arnone, E., Barbara, F., Bianchini, M., Carli, B., Ceccherini, S., Chipperfield, M. P., Dehn, A., Della Fera, S., Dinelli, B. M., Dudhia, A., Flaud, J.-M., Gai, M., Kiefer, M., López-Puertas, M., Moore, D. P., Piro, A., Remedios, J. J., Ridolfi, M., Sembhi, H., Sgheri, L., and Zoppetti, N.: Level 2 processor and auxiliary data for ESA Version 8 final full mission analysis of MIPAS measurements on ENVISAT, Atmos. Meas. Tech., 15, 1871–1901, https://doi.org/10.5194/amt-15-1871-2022, 2022.
Renard, J.-B., Berthet, G., Brogniez, C., Catoire, V., Fussen, D., Goutail, F., Oelhaf, H., Pommereau, J.-P., Roscoe, H. K., Wetzel, G., Chartier, M., Robert, C., Balois, J.-Y., Verwaerde, C., Auriol, F., François, P., Gaubicher, B., and Wursteisen, P.: Validation of GOMOS-Envisat vertical profiles of O3, NO2, NO3, and aerosol extinction using balloon-borne instruments and analysis of the retrievals, J. Geophys. Res., 113, A02302, https://doi.org/10.1029/2007JA012345, 2008.
Ridolfi, M., Carli, B., Carlotti, M., Clarmann, T. von, Dinelli, B. M., Dudhia, A., Flaud, J.-M., Höpfner, M., Morris, P. E., Raspollini, P., Stiller, G., and Wells, R. J.: Optimized forward model and retrieval scheme for MIPAS near-real-time data processing, Appl. Optics, 39, 1323–1340, https://doi.org/10.1364/AO.39.001323, 2000.
Ridolfi, M., Blum, U., Carli, B., Catoire, V., Ceccherini, S., Claude, H., De Clercq, C., Fricke, K. H., Friedl-Vallon, F., Iarlori, M., Keckhut, P., Kerridge, B., Lambert, J.-C., Meijer, Y. J., Mona, L., Oelhaf, H., Pappalardo, G., Pirre, M., Rizi, V., Robert, C., Swart, D., von Clarmann, T., Waterfall, A., and Wetzel, G.: Geophysical validation of temperature retrieved by the ESA processor from MIPAS/ENVISAT atmospheric limb-emission measurements, Atmos. Chem. Phys., 7, 4459–4487, https://doi.org/10.5194/acp-7-4459-2007, 2007.
Rodgers, C. D.: Inverse methods for atmospheric sounding, 2nd edn., World Scientific, ISBN: 978-981-02-2740-1, 2000.
Rothman, L. S., Gordon, I. E., Barbe, A., Benner, D., Bernath, P. F., Birk, M., Boudon, V., Brown, L. R., Campargue, A., Champion, J.-P., Chance, K., Coudert, L. H., Dana, V., Devi, V. M., Fally, S., Flaud, J.-M., Gamache, R. R., Goldman, A., Jacquemart, D., Kleiner, I., Lacome, N., Lafferty, W. J., Mandin, J.-Y., Massie, S. T., Mikhailenko, S. N., Miller, C. E., Moazzen-Ahmadi, N., Naumenko, O. V., Nikitin, A. V., Orphal, J., Perevalov, V. I., Perrin, A., Predoi-Cross, A., Rinsland, C. P., Rotger, M., Šimečková, M., Smith, M., Sung, K., Tashkun, S. A., Tennyson, J., Toth, R. A., Vandaele, A. C., and Vander Auwera, J.: The HITRAN 2008 molecular spectroscopic database, J. Quant. Spectrosc. Ra., 110, 533–572, https://doi.org/10.1016/j.jqsrt.2009.02.013, 2009.
Rudolph, J.: The tropospheric distribution and budget of ethane, J. Geophys. Res., 100, 11369–11381, https://doi.org/10.1029/95JD00693, 1995.
Sagawa, H., Sato, T. O., Baron, P., Dupuy, E., Livesey, N., Urban, J., von Clarmann, T., de Lange, A., Wetzel, G., Connor, B. J., Kagawa, A., Murtagh, D., and Kasai, Y.: Comparison of SMILES ClO profiles with satellite, balloon-borne and ground-based measurements, Atmos. Meas. Tech., 6, 3325–3347, https://doi.org/10.5194/amt-6-3325-2013, 2013.
Singh, H. B., Herlth, D., Kolyer, R., Chatfield, R., Viezee, W., Salas, L. J., Chen, Y., Bradshaw, J. D., Sandholm, S. T., Talbot, R., Gregory, G. L., Anderson, B., Sachse, G. W., Browell, E., Bachmeier, A. S., Blake, D. R., Heikes, B., Jacob, D., and Fuelberg, H. E.: Impact of biomass burning emissions on the composition of the South Atlantic troposphere: Reactive nitrogen and ozone, J. Geophys. Res., 101, 24203–24219, https://doi.org/10.1029/96JD01018, 1996.
Sinnhuber, M., Burrows, J. P., Chipperfield, M. P., Jackman, C. H., Kallenrode, M.-B., Künzi, K. F., and Quack, M.: A model study of the impact of magnetic field structure on atmospheric composition during solar proton events, Geophys. Res. Lett., 30, 1781, https://doi.org/10.1029/2003GL017265, 2003.
SPARC: The SPARC Data Initiative: Assessment of stratospheric trace gas and aerosol climatologies from satellite limb sounders, edited by: Hegglin, M. I. and Tegtmeier, S., SPARC Report No. 8, WCRP-5/2017, https://www.sparc-climate.org/publications/sparc-reports/ (last access: 22 September 2022), 2017.
Stiller, G. P., Clarmann, T. von, Funke, B., Glatthor, N., Hase, F., Höpfner, M., and Linden, A.: Sensitivity of trace gas abundances retrievals from infrared limb emission spectra to simplifying approximations in radiative transfer modelling, J. Quant. Spectrosc. Ra., 72, 249–280, https://doi.org/10.1016/S0022-4073(01)00123-6, 2002.
Tchana, F. K., Lafferty, W. J., Flaud, J.-M., Manceron, L., and Ndao, M.: High-resolution analysis of the ν1 and ν5 bands of phosgene 35Cl2CO and 35Cl37ClCO, Mol. Phys., 113, 3241–3246, https://doi.org/10.1080/00268976.2015.1015638, 2015.
Tikhonov, A. N.: On the solution of ill-posed problems and the method of regularization, Dokl. Acad. Nauk SSSR, 151, 501–504, 1963.
Toon, G. C., Blavier, J.-F., Sen, B., and Drouin, B. J.: Atmospheric COCl2 measured by solar occultation spectrometry, Geophys. Res. Lett., 28, 2835–2838, https://doi.org/10.1029/2000GL012156, 2001.
Valeri, M., Carlotti, M., Flaud, J.-M., Raspollini, P., Ridolfi, M., and Dinelli, B. M.: Phosgene in the UTLS: seasonal and latitudinal variations from MIPAS observations, Atmos. Meas. Tech., 9, 4655–4663, https://doi.org/10.5194/amt-9-4655-2016, 2016.
Valeri, M., Barbara, F., Boone, C., Ceccherini, S., Gai, M., Maucher, G., Raspollini, P., Ridolfi, M., Sgheri, L., Wetzel, G., and Zoppetti, N.: CCl4 distribution derived from MIPAS ESA v7 data: intercomparisons, trend, and lifetime estimation, Atmos. Chem. Phys., 17, 10143–10162, https://doi.org/10.5194/acp-17-10143-2017, 2017.
von Clarmann, T. and Johansson, S.: Chlorine nitrate in the atmosphere, Atmos. Chem. Phys., 18, 15363–15386, https://doi.org/10.5194/acp-18-15363-2018, 2018.
von Clarmann, T., Höpfner, M., Kellmann, S., Linden, A., Chauhan, S., Funke, B., Grabowski, U., Glatthor, N., Kiefer, M., Schieferdecker, T., Stiller, G. P., and Versick, S.: Retrieval of temperature, H2O, O3, HNO3, CH4, N2O, ClONO2 and ClO from MIPAS reduced resolution nominal mode limb emission measurements, Atmos. Meas. Tech., 2, 159–175, https://doi.org/10.5194/amt-2-159-2009, 2009.
Wang, D. Y., Höpfner, M., Blom, C. E., Ward, W. E., Fischer, H., Blumenstock, T., Hase, F., Keim, C., Liu, G. Y., Mikuteit, S., Oelhaf, H., Wetzel, G., Cortesi, U., Mencaraglia, F., Bianchini, G., Redaelli, G., Pirre, M., Catoire, V., Huret, N., Vigouroux, C., De Mazière, M., Mahieu, E., Demoulin, P., Wood, S., Smale, D., Jones, N., Nakajima, H., Sugita, T., Urban, J., Murtagh, D., Boone, C. D., Bernath, P. F., Walker, K. A., Kuttippurath, J., Kleinböhl, A., Toon, G., and Piccolo, C.: Validation of MIPAS HNO3 operational data, Atmos. Chem. Phys., 7, 4905–4934, https://doi.org/10.5194/acp-7-4905-2007, 2007.
Wetzel, G., Oelhaf, H., Friedl-Vallon, F., Kleinert, A., Lengel, A., Maucher, G., Nordmeyer, H., Ruhnke, R., Nakajima, H., Sasano, Y., Sugita, T., and Yokota, T.: Intercomparison and validation of ILAS-II version 1.4 target parameters with MIPAS-B measurements, J. Geophys. Res., 111, D11S06, https://doi.org/10.1029/2005JD006287, 2006.
Wetzel, G., Bracher, A., Funke, B., Goutail, F., Hendrick, F., Lambert, J.-C., Mikuteit, S., Piccolo, C., Pirre, M., Bazureau, A., Belotti, C., Blumenstock, T., De Mazière, M., Fischer, H., Huret, N., Ionov, D., López-Puertas, M., Maucher, G., Oelhaf, H., Pommereau, J.-P., Ruhnke, R., Sinnhuber, M., Stiller, G., Van Roozendael, M., and Zhang, G.: Validation of MIPAS-ENVISAT NO2 operational data, Atmos. Chem. Phys., 7, 3261–3284, https://doi.org/10.5194/acp-7-3261-2007, 2007.
Wetzel, G., Sugita, T., Nakajima, H., Tanaka, T., Yokota, T., Friedl-Vallon, F., Kleinert, A., Maucher, G., and Oelhaf, H.: Technical Note: Intercomparison of ILAS-II version 2 and 1.4 trace species with MIPAS-B measurements, Atmos. Chem. Phys., 8, 1119–1126, https://doi.org/10.5194/acp-8-1119-2008, 2008.
Wetzel, G., Oelhaf, H., Kirner, O., Ruhnke, R., Friedl-Vallon, F., Kleinert, A., Maucher, G., Fischer, H., Birk, M., Wagner, G., and Engel, A.: First remote sensing measurements of ClOOCl along with ClO and ClONO2 in activated and deactivated Arctic vortex conditions using new ClOOCl IR absorption cross sections, Atmos. Chem. Phys., 10, 931–945, https://doi.org/10.5194/acp-10-931-2010, 2010.
Wetzel, G., Oelhaf, H., Kirner, O., Friedl-Vallon, F., Ruhnke, R., Ebersoldt, A., Kleinert, A., Maucher, G., Nordmeyer, H., and Orphal, J.: Diurnal variations of reactive chlorine and nitrogen oxides observed by MIPAS-B inside the January 2010 Arctic vortex, Atmos. Chem. Phys., 12, 6581–6592, https://doi.org/10.5194/acp-12-6581-2012, 2012.
Wetzel, G., Oelhaf, H., Berthet, G., Bracher, A., Cornacchia, C., Feist, D. G., Fischer, H., Fix, A., Iarlori, M., Kleinert, A., Lengel, A., Milz, M., Mona, L., Müller, S. C., Ovarlez, J., Pappalardo, G., Piccolo, C., Raspollini, P., Renard, J.-B., Rizi, V., Rohs, S., Schiller, C., Stiller, G., Weber, M., and Zhang, G.: Validation of MIPAS-ENVISAT H2O operational data collected between July 2002 and March 2004, Atmos. Chem. Phys., 13, 5791–5811, https://doi.org/10.5194/acp-13-5791-2013, 2013a.
Wetzel, G., Oelhaf, H., Friedl-Vallon, F., Kleinert, A., Maucher, G., Nordmeyer, H., and Orphal, J.: Long-term intercomparison of MIPAS additional species ClONO2, N2O5, CFC-11, and CFC-12 with MIPAS-B measurements, Ann. Geophys., 56, 6329, https://doi.org/10.4401/ag-6329, 2013b.
Wetzel, G., Oelhaf, H., Birk, M., de Lange, A., Engel, A., Friedl-Vallon, F., Kirner, O., Kleinert, A., Maucher, G., Nordmeyer, H., Orphal, J., Ruhnke, R., Sinnhuber, B.-M., and Vogt, P.: Partitioning and budget of inorganic and organic chlorine species observed by MIPAS-B and TELIS in the Arctic in March 2011, Atmos. Chem. Phys., 15, 8065–8076, https://doi.org/10.5194/acp-15-8065-2015, 2015.
Wetzel, G., Höpfner, M., and Oelhaf, H.: CCN #2: Support to MIPAS level 2 processor verification and validation - Phase F: Report to MS6_2: L1v8/L2v8 FM comparison for GL1-GL3; Long-term validation of MIPAS ESA operational products using MIPAS-B measurements, https://earth.esa.int/eogateway/documents/20142/37627/kit_ccn_2_esa_tn-fr_2020_01.pdf (last access: 12 July 2022), 2020.
Wiegele, A., Glatthor, N., Höpfner, M., Grabowski, U., Kellmann, S., Linden, A., Stiller, G., and von Clarmann, T.: Global distributions of C2H6, C2H2, HCN, and PAN retrieved from MIPAS reduced spectral resolution measurements, Atmos. Meas. Tech., 5, 723–734, https://doi.org/10.5194/amt-5-723-2012, 2012.
Xiao, Y., Logan, J. A., Jacob, D. J., Hudman, R. C., Yantosca, R., and Blake, D. R.: Global budget of ethane and regional constraints on U.S. sources, J. Geophys. Res., 113, D21306, https://doi.org/10.1029/2007JD009415, 2008.
Yokouchi, Y., Noijiri, Y., Barrie, L. A., Toom-Sauntry, D., Machida, T., Inuzuka, Y., Akimoto, H., Li, H. J., Fujinuma, Y., and Aoki, S.: A strong source of methyl chloride to the atmosphere from tropical coastal land, Nature, 403, 295–298, https://doi.org/10.1038/35002049, 2000.
Zhang, G., Wetzel, G., Oelhaf, H., Friedl-Vallon, F., Kleinert, A., Lengel, A., Maucher, G., Nordmeyer, H., Grunow, K., and Fischer, H.: Validation of atmospheric chemistry measurements from MIPAS, SCIAMACHY, GOMOS onboard ENVISAT by observations of balloon-borne MIPAS-B, Sci, China Earth Sci., 53, 1533–1541, https://doi.org/10.1007/s11430-010-3059-3, 2010.


