the Creative Commons Attribution 4.0 License.
the Creative Commons Attribution 4.0 License.
 | 23 Nov 2022
New method to determine black carbon mass size distribution
Weilun Zhao
Gang Zhao
Nan Ma
Lizi Tang
Zirui Zhang
Chunsheng Zhao
Black carbon (BC) is an important atmospheric component with strong light absorption. Many attempts have been made to measure BC mass size distribution (BCMSD) for its significant impact on climate and public health. Larger-coverage BCMSD, ranging from upper submicron particles sizes to larger than 1 µm, contributes to a substantial proportion of total BC mass and absorption. However, the current time resolution of larger-coverage BCMSD measurement was limited to 1 d, which was insufficient to characterize variation of larger-coverage BCMSD. In this study, a new method to determine equivalent BCMSD (eBCMSD) was proposed from size-resolved absorption coefficient measured by an aerodynamic aerosol classifier in tandem with an aethalometer. The proposed method could measure larger-coverage eBCMSD with a time resolution as high as 1 h and was validated by comparing the measurement results with refractory BCMSD (rBCMSD) measured by a differential mobility analyzer in tandem with a single-particle soot photometer (DMA–SP2) for particle sizes larger than 300 nm during a field measurement in the Yangtze River Delta. Bulk refractory BC mass concentration (mrBC,bulk) by DMA–SP2 was underestimated by 33 % compared to bulk equivalent BC mass concentration (meBC,bulk) by this method because of the limited size range of measurement for DMA–SP2. Uncertainty analysis of this method was performed with respect to mass absorption cross-section (MAC), transfer function inversion, number fraction of BC-containing particle and instrumental noise. The results indicated that MAC was the main uncertainty source, leading to meBC,bulk values that varied from −20 % to 28 %. With the advantage of a wide size coverage up to 1.5 µm, high time resolution, easy operation and low cost, this method is expected to have wide applications in field measurement for better estimating the radiative properties and climate effects of BC.
- Article
(815 KB) - Full-text XML
-
Supplement
(1227 KB) - BibTeX
- EndNote


Atmospheric black carbon (BC) is emitted through incomplete combustion of carbon-based fuels (Bond, 2001), such as biomass burning and fossil fuel combustion (Bond et al., 2004). BC warms the atmosphere and is considered the third most important light absorber in the climate system after CO2 and CH4 (Bond et al., 2013). BC can induce respiratory and cardiovascular disease through inhalation (Highwood and Kinnersley, 2006). Plenty of studies have been devoted to BC for its significant impact on the climate and on public health.
Bulk BC mass concentration (mBC,bulk) is one of the essential parameters for modeling because radiative transfer models calculate BC absorption from mBC,bulk (Bond et al., 2013). A great deal of research has been dedicated to mBC,bulk measurement for both model assimilation and environmental monitoring (Castagna et al., 2019; Helin et al., 2018; Ran et al., 2016). A recent study indicated that the radiative effect of BC was extremely sensitive to its particle size (Matsui et al., 2018). Zhao et al. (2019) further revealed that the variation of BC mass size distribution (BCMSD), namely size-resolved BC mass concentration (mBC,size-resolved), led to substantial changes in the radiative effect of BC based on field measurement, highlighting the importance of BCMSD for modeling the radiative effect of BC rather than simply mBC,bulk. The size of BC affects the deposition rate of BC to the lungs (Highwood and Kinnersley, 2006), indicating that BCMSD is closely related to health. In ambient environments, BCMSD is influenced by emission sources. For instance, BCMSD of fossil fuel combustion differs obviously from that of biomass burning (Schwarz et al., 2008), implying that BCMSD is one of the characteristics of emission sources. The temporal variation of BCMSD can reflect the atmospheric aging of BC, during which BC undergoes remarkable change in size, accompanied by dramatic variation of BC optical properties (Zhang et al., 2008). Therefore, reliable measurement and understanding of BCMSD are highly necessary for estimating the impact of BC on both the earth energy budget and on public health (Moosmuller et al., 2009).
Quite a few efforts were made to measure BCMSD. The single-particle soot photometer (SP2) was developed using laser-induced incandescence (Schwarz et al., 2006) and measured refractory BCMSD (rBCMSD; Petzold et al., 2013) on a single-particle level. The soot particle aerosol mass spectrometer (SP-AMS) combined laser-induced incandescence and mass spectroscopy, which could determine not only rBCMSD, but also the chemical composition of BC-containing particles (Onasch et al., 2012). The SP2 and SP-AMS techniques were characterized by high time resolution and high accuracy but also high cost and complicated maintenance and therefore, as a result, not widely applied for routine measurement. A more convenient solution was required for wider and better characterization of BCMSD in different regions and emission sources. Elemental carbon mass size distribution (ECMSD; Petzold et al., 2013) could be sampled by a multi-stage cascade impactor (Viidanoja et al., 2002) combined with off-line analysis, such as a thermo-optical organic carbon–elemental carbon method (Chow et al., 2001). ECMSD sampled by a multi-stage cascade impactor had wide size coverage but low time resolution, usually from 24 h (Soto-García et al., 2011) to 48 h (Guo, 2015), which was too low to resolve aging of BC. A differential mobility analyzer (DMA) in tandem with a filter-based instrument (Hansen et al., 1984), for instance, a micro-aethalometer (MA) (Ning et al., 2013) or a particle soot absorption photometer (PSAP) (Tunved et al., 2021), was used to determine equivalent BCMSD (eBCMSD; Petzold et al., 2013) with a higher time resolution up to 2 h (W. Zhao et al., 2021). However, the multiple-charge correction and low flow rate of DMA imposed restrictions on the accuracy of the measured eBCMSD. The measured size range of DMA was limited to less than about 700 nm, resulting in incomplete measured eBCMSD. Current measurement of larger-coverage BCMSD, ranging from upper submicron particle sizes to larger than 1 µm, was limited in time resolution. Characteristics of larger-coverage BCMSD during atmospheric aging were still unclear. Wang et al. (2022) showed that BC larger than 1 µm could contribute to as large as 50 % of mBC,bulk, highlighting the importance of larger-coverage BCMSD. Therefore, it was imperative to measure larger-coverage BCMSD with a higher time resolution.
In this study, a new method to determine eBCMSD was proposed using a size-resolved absorption coefficient (σab,size-resolved) measured by an aerodynamic aerosol classifier (AAC; Cambustion, UK, Tavakoli and Olfert, 2013) in tandem with an aethalometer (model AE33, Magee, USA, Drinovec et al., 2015), combined with size-resolved number concentration (Nsize-resolved), simultaneously measured by a scanning mobility particle sizer (SMPS; TSI, USA) and an aerodynamic particle sizer (APS; TSI, USA). The proposed method for determining eBCMSD overcame the disadvantages and had the advantages of the above-mentioned methods, characterized by high cost-effectiveness, easy and convenient maintenance, a high time resolution to 1 h and a wide size range to up to 1.5 µm. The proposed method was validated in a field measurement in the Yangtze River Delta, and the uncertainty study was carried out based on the measured data.
2.1 Instrumental setup
Figure 1 illustrated the instrumental setup developed in this study, which could be split into two parts, namely the measurement setup and the validation setup. Ambient aerosol particles were drawn through a PM10 inlet (16.67 L min−1) and were dried to a relative humidity of less than 30 % by a silica gel diffusion dryer beforehand. An advanced flow splitter was used to split aerosol-laden flow into different instruments for isokinetic sampling. For the measurement setup, AAC in tandem with AE33 (AAC–AE33) measured σab,size-resolved at a flow rate of 3 L min−1. Since eBCMSD of larger size coverage was the main focus of this study, AAC was set to scan 12 particle sizes (Dp) logarithmically equally spaced from 200 to 1500 nm (200, 240, 288, 346, 416, 499, 600, 720, 865, 1039, 1248 and 1500 nm), and a smaller size was not scanned. Each size was scanned for 5 min, and 1 h was required for a complete cycle. It should be noted that Dp was the aerodynamic size in this study. Mobility size related to DMA was converted to aerodynamic size, assuming an effective density of 1.3 g cm−3 (Zhao et al., 2019; DeCarlo et al., 2004). AE33 measured absorption coefficient (σab) at seven wavelengths from 370 to 950 nm (Drinovec et al., 2015), at which 880 nm was adopted in this study because BC dominated particle absorption at 880 nm (Ramachandran and Rajesh, 2007). SMPS and APS measured Nsize-resolved for Dp less than and greater than about 800 nm at a flow rate of 0.3 and 5 L min−1, respectively.

For validation system, the tandem array of a neutralizer, DMA and SP2 (DMA–SP2) measured rBCMSD (rBCMSDDMA−SP2) at a flow rate of 0.12 L min−1 for the purpose of comparison with eBCMSD determined by the proposed method (eBCMSDAAC−AE33). Another AE33 measured the bulk absorption coefficient (σab,bulk) simultaneously at a flow rate of 2 L min−1 for a closure study with σab,size-resolved.
2.1.1 Aethalometer model AE33
The principle of obtaining σab was well developed for an aethalometer (Hansen et al., 1984) and is described here in brief. Ambient aerosol particles were drawn into an aethalometer at a flow rate F and collected on an area S of a filter. A light source illuminated the filter. The transmitted light signal was denoted as I (I0) for the light which passed through the particle-laden (particle-free) part of the filter. Light attenuation was defined as
ATN increased with decreasing I as aerosol particles were loaded on the filter continuously. Therefore, ATN reflected aerosol loading on the filter. If ATN increased ΔATN during time interval Δt, then the attenuation coefficient was defined as
The light attenuation was caused not only by particle absorption, but also scattering by the particle and filter matrix. A scattering parameter Cf was introduced to extract σab from σATN:
where Cf was set as 2.9 (Zhao et al., 2020b) in this study. Nonlinearity, termed the loading effect, became more and more significant with increasing aerosol loading; namely, for the same increase in aerosol loading, the corresponding increase in ATN was smaller for heavier aerosol loading. The “dual-spot” technique (Drinovec et al., 2015) was proposed to correct for the loading effect for AE33 and was used in this study. The σab measured by AE33 at a given particle size selected by AAC was termed binned σab (σab,binned) in this study to differentiate from σab,bulk.
2.1.2 Aerodynamic aerosol classifier
The principle of the AAC was illustrated detailedly by Tavakoli and Olfert (2013) and was introduced here concisely. The setup of the AAC could be simplified to two coaxial cylinders, where the inner radius, outer radius and length were denoted as ri, ro and L. Polydisperse particles flowed into the space between the inner cylinder and outer cylinder from one end of the inner cylinder at a flow rate of Qsample. Meanwhile, particle-free sheath flow streamed in the space between the inner cylinder and outer cylinder in the direction of the axis of the coaxial cylinders at a flow rate of Qsheath. The sheath flow carried the particles along the coaxial cylinders. At the same time, the two coaxial cylinders rotated with respect to their axis at a rotational speed of ω. Therefore, the particles migrated outwards across the sheath flow by the centrifugal force acting on them. Relaxation time (τ) was defined as
where Cc(Dp) was the Cunningham slip correction factor as a function of Dp (Kim et al., 2005), ρ0=1 g cm−3 was the reference density and μ was the gas viscosity. It could be seen that τ was directly related to Dp. Dynamic analysis proved that only particles with certain relaxation time τ, and hence certain Dp, could migrate to another end of the outer cylinder and emerge as monodisperse flow. τ was related to parameters of the AAC by
Therefore, by changing ω and Qsheath, monodisperse particles of desired Dp could be selected by the AAC. Unlike the DMA, particles did not need to be charged before entering the AAC. Consequently, the transmission efficiency (λΩ) of the AAC was about 4 times higher than that of the DMA, and multi-charge correction was not required for AE33 (Johnson et al., 2018).
2.1.3 A differential mobility analyzer in tandem with a single-particle soot photometer
Ambient particles were first drawn into a DMA, which could select monodispersed particles with Dp from the polydispersed ambient particles. Then the monodispersed particles flew into the SP2, which measured refractory black carbon (rBC) mass of BC-containing particles on a single-particle level. rBCMSDDMA−SP2 was measured by changing Dp selected by DMA and measuring rBC mass at different Dps. The SP2 alone could also determine rBCMSD (rBCMSDSP2). Considering that Dp of rBCMSDSP2 was calculated from Mie theory with assumed inputs (Taylor et al., 2015), and Dp of rBCMSDDMA−SP2 was directly measured by DMA, rBCMSDDMA−SP2 was used in this study.
Details of DMA–SP2 were described by G. Zhao et al. (2021) and introduced here concisely. The incandescence high-gain channel and the incandescence low-gain channel of SP2 were calibrated by Aquadag soot particles with an effective density of 1.8 g cm−3 before measurement. The DMA was set to scan Dp from 15 to 780 nm with 56 bins, and one scan cycle required 5 min. Therefore, time resolution and size range of the measured rBCMSDDMA−SP2 were 5 min and from 15 to 780 nm. Considering that the time resolution of eBCMSDAAC−AE33 was 1 h, the measured rBCMSDDMA−SP2 was time-averaged to a time resolution of 1 h for comparison. Given that the size range of eBCMSDAAC−AE33 was from 200 to 1500 nm, the size range of the measured rBCMSDDMA−SP2 was interpolated to that of eBCMSDAAC−AE33 for comparison. Consequently, the size range of rBCMSDDMA−SP2 used in this study was from 200 to 720 nm, corresponding to the first and eighth Dp of eBCMSDAAC−AE33, respectively. According to Zhao et al. (2020a), DMA–SP2 could not detect particle less than about 200 nm, consistent with the minimum Dp in this study.
The number distribution of BC-containing particles measured by DMA–SP2 could be considered a bivariate function , where NBC was the number concentration of BC-containing particles, and Dc was the core diameter assuming that BC-containing particles had a core–shell geometry. The asphericity of BC was not considered in this study. Dc was logarithmically equally distributed from 78 to 560 nm with 29 bins. At each Dc bin, the number distribution of BC-containing particle could be considered a univariate function . The multiple charging correction of 1-dimensional size distribution was developed by Knutson and Whitby (1975), which was adopted to correct . By correcting at each Dc bin, multiple charging correction of was achieved.
2.2 Field measurement
The proposed method was applied to a field measurement in Changzhou, Jiangsu Province, China (119∘36′ E, 31∘43′ N), located in the Yangtze River Delta, from 17 May to 3 June 2021. Changzhou is between two megacities, about 187 km to the northwest of Shanghai and about 82 km to the southeast of Nanjing, as shown in Fig. S1a in the Supplement. The area between Shanghai and Nanjing has undergone serious environmental pollution in the past few decades with the development of industrialization and urbanization. As shown in Fig. S1b, the pollution condition of Changzhou was overall representative of the regional background pollution in the Yangtze River Delta.
2.3 Size-resolved calculations
2.3.1 Size-resolved absorption coefficient
Tavakoli and Olfert (2013) formulated the ideal theoretical model for AAC transfer function inversion, which was adopted by this study to derive σab,size-resolved from σab,binned and presented here in short. The σab,size-resolved was given by
where β∗ was related to the ratio of Qsheath to Qsample, , through
Johnson et al. (2018) corrected the ideal inversion in Eq. (6) to take particle loss and spectral broadening into account by replacing β∗ with a nonideal :
where μΩ was the spectral broadening factor. Both λΩ and μΩ were dependent on Dp as well as flow, and this is discussed in detail in Sect. 4.2.
2.3.2 eBC mass size distribution measured by the aerodynamic aerosol classifier in tandem with the aethalometer model AE33
σab,size-resolved could be converted to eBCMSDAAC−AE33 through mass absorption cross-section (MAC) (Bond and Bergstrom, 2006), which was determined based on method proposed by W. Zhao et al. (2021). Briefly, a 2-dimensional lookup table of MAC with respect to Dp and Dc was simulated (MAC(Dp, Dc)) by Mie theory, assuming a core–shell geometry. At a given size bin centered at Dp, the corresponding σab and number concentration (N) at the size bin, denoted as σab(Dp) and N(Dp), could be derived by σab,size-resolved and Nsize-resolved:
where Δlog Dp was the logarithmic width of the size bin. The number concentration of BC-containing particles at the size bin NBC(Dp) was determined by
where fBC was the number fraction of BC-containing particles, which was assumed as a fixed value in this study, and the uncertainty of the fixed-fBC assumption is discussed in Sect. 4.3. An optimal Dc was found so that calculated σab at the size bin, denoted as , matched σab(Dp):
where ρBC was the density of BC and set as 1.8 g cm−3 (Bond and Bergstrom, 2006), consistent with the ρBC assumption when deriving rBCMSDDMA−SP2. Equivalent BC mass concentration (meBC) at the size bin, denoted as meBC(Dp), could be determined by
Then the eBCMSDAAC−AE33 at Dp, denoted by eBCMSDAAC−AE33(Dp), could be determined by
Figure 2 presents the time series of the measurement results. There were four pollution episodes during the measurement period: from about 12:00 on 17 May to about 00:00 on 20 May, from about 00:00 on 21 May to about 12:00 on 22 May, from about 00:00 on 24 May to about 12:00 on 26 May and from about 12:00 on 28 May to about 12:00 on 31 May, as shown in Fig. 2a. Both eBCMSDAAC−AE33 (Fig. 2b) and rBCMSDDMA−SP2 (Fig. 2c) recorded the four pollution episodes simultaneously, with higher BCMSD values than clean episodes. eBCMSDAAC−AE33 and rBCMSDDMA−SP2 were both integrated from 200 to 720 nm, which was the Dp range of measurement for DMA–SP2, and the results were denoted as and , respectively. As shown in Fig. 2a, compared well with m with a determination coefficient (R2), slope (b1) and intercept (b0) of 0.8 (accurate to one decimal place), 1.0 and 0.1 µg m−3 (Fig. S2a). R2 of 0.8 and b1 of 1.0 indicated that the proposed method was capable of capturing the variation of mBC,bulk. The mean and were 0.7±0.4 and 0.6±0.3 µg m−3, indicating was overall 0.1 µg m−3 higher than , consistent with b0 of 0.1 µg m−3. The reason for overall discrepancy of 0.1 µg m−3 in might be that DMA–SP2 could not detect rBC with Dc less than about 100 nm (Zhao et al., 2020a), resulting in an underestimated . eBCMSDAAC−AE33 was also integrated from 720 to 1500 nm, which was the Dp range that DMA–SP2 did not measure, and the result was denoted as . was correlated to to study whether BCMSD ranging from 720 to 1500 nm was connected to that ranging from 200 to 720 nm, as shown in Fig. S2b. R2 decreased to 0.2 between and , indicating these two size ranges were not well related, and both of them needed to be measured independently. Observation by transmission electron microscopy showed that these larger BC-containing particles could be coated with massive materials from secondary processes or super-aggregated BC with a fractal BC structure (Wang et al., 2022). The mean was 0.2±0.2 µg m−3, indicating that the DMA–SP2 overall underestimated mBC,bulk for ∼0.2 µg m−3 (∼33 %) in this field measurement considering that the DMA–SP2 did not measure BCMSD larger than 720 nm. Therefore, it is highly necessary to measure BCMSD with a wider Dp range for better estimation of mBC,bulk and deeper understanding of BC evolution in the atmosphere.
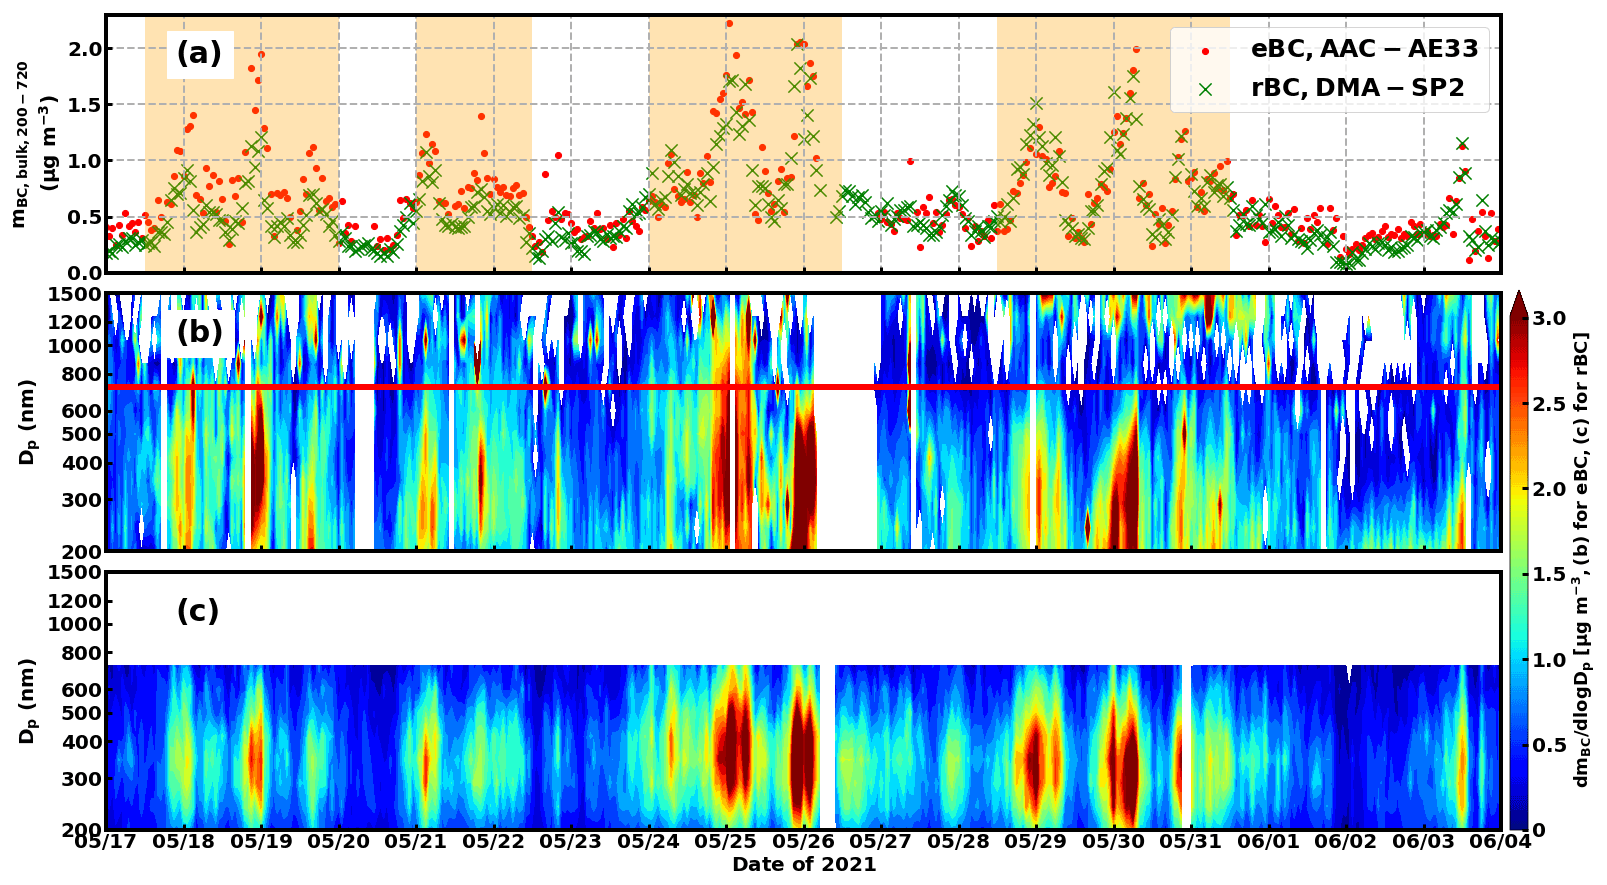
Figure 2Time series of (a) mBC,bulk from BCMSD integrated from 200 to 720 nm () determined by the proposed method (red dot, denoted as “eBC, AAC–AE33”) and the DMA–SP2 (green cross, denoted as “rBC, DMA–SP2”) and BCMSD determined by (b) the proposed method (eBC) and (c) the DMA–SP2 (rBC). The red line in panel (b) marks a particle size of 720 nm. The pollution episodes are shaded with orange in panel (a).
Figure 3 exhibited the mean eBCMSDAAC−AE33 () and mean rBCMSDDMA−SP2 () during the field measurement. It could be seen that when Dp was less than about 300 nm, was higher than . The higher may be due to particle diffusion at small Dp, which was not well corrected by Eq. (7) and underestimated MAC. When Dp was greater than 300 nm and less than 720 nm, was overall consistent with . When Dp was larger than 720 nm, where DMA–SP2 did not measure, decreased with increasing Dp when Dp was less than about 870 nm and increased with increasing Dp when Dp was larger than 870 nm. In the study by Yu et al. (2010), three modes of BCMSD were identified: the mode peaked at about 400, 1000 and 5000 nm, which were termed as the condensation mode, droplet mode and coarse mode, respectively. Following the nomenclature proposed by Yu et al. (2010), the increasing (decreasing) with increasing Dp for Dp larger (less) than 870 nm signified the lower (upper) end of the droplet mode (condensation mode). However, only identified the condensation mode, which clearly highlighted the necessity to measure BCMSD of a wider Dp range for better characterization of BCMSD. Both the proposed method and the DMA–SP2 showed that the temporal variation of BCMSD, expressed as standard deviation (SD) of BCMSD in Fig. 3, was as large as , reflecting complex mechanisms in the variability of BCMSD.
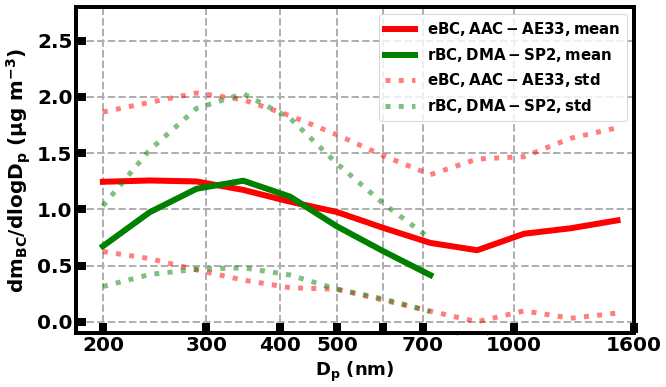
Figure 3Mean and SD of eBCMSDAAC−AE33 (green) and rBCMSDDMA−SP2 (red) during the measurement period. Mean BCMSD was denoted by the solid line. SD of BCMSD was denoted by the dotted line.
Uncertainty analysis was performed with respect to the MAC lookup table, transfer function inversion from σab,binned to σab,size-resolved, fBC and instrumental noise, respectively. The resulting uncertainty to eBCMSDAAC−AE33 is illustrated in Fig. 4 and to is shown in Table 1. It can be seen from Fig. 4 that the boundary between the condensation mode and the droplet mode was distinct, no matter how the uncertainty sources disturbed eBCMSDAAC−AE33.
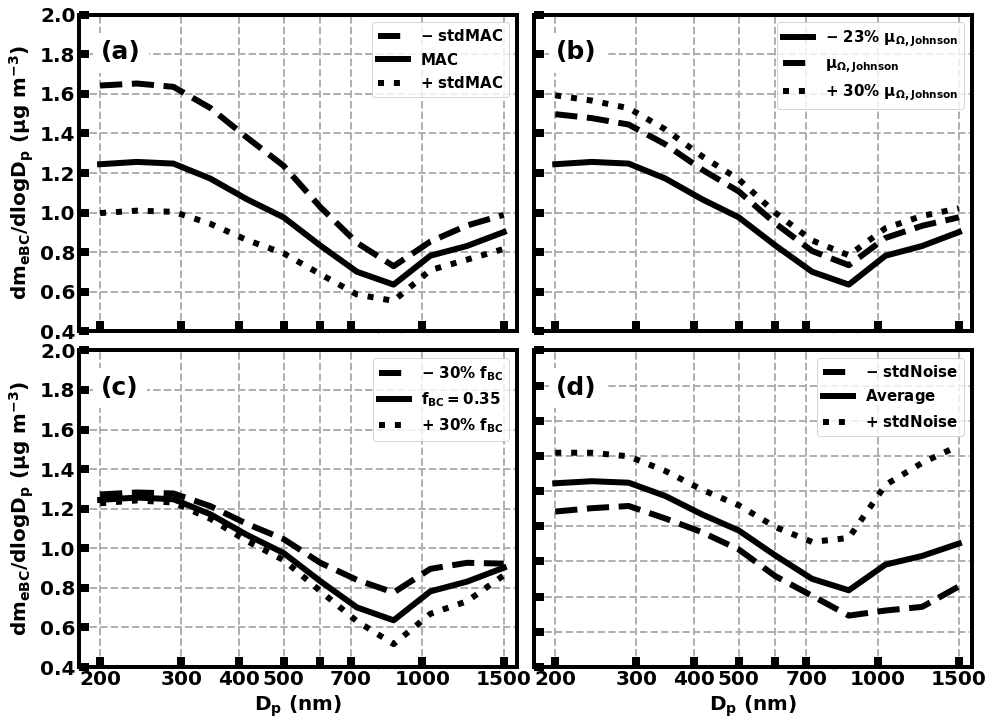
Figure 4Uncertainty in eBCMSDAAC−AE33 arising from (a) MAC lookup table, (b) transfer function inversion, (c) fBC and (d) instrumental noise. The solid lines in each panel were the same and were the mean eBCMSDAAC−AE33 during the measurement period. The dotted lines and dashed lines in each panel were mean eBCMSD standard deviation (SD) calculated from (a) MAC + SD of MAC and MAC − SD of MAC, (b) μΩ,Johnson and , (c) fBC of 35 % ×0.7 and 1.3, and (d) eBCMSD SD of instrumental noise and − SD of instrumental noise.
4.1 Uncertainty from mass absorption cross-section
According to W. Zhao et al. (2021), the variation in the refractive index (RI) dominated the uncertainty of the MAC lookup table. Therefore, the uncertainty from the MAC lookup table was analyzed with respect to RI. The real part of RI (Re[RI]) was reported to vary from 1.5 to 2.0 in general (Liu et al., 2018), and the imaginary part of RI (Im[RI]) ranged from 0.5 to 1.1 commonly (Bond and Bergstrom, 2006). Hence, Re[RI] (Im[RI]) was changed from 1.5 (0.5) to 2.0 (1.1) with step increase of 0.01, the resulting mean MAC () was the MAC lookup table used in this study (Fig. S3a) and the resulting SD divided by the was considered the uncertainty of the MAC lookup table (Fig. S3b). As shown in Fig. S3b, when Dc was larger than about 400 nm, the uncertainty was less than 10 % and influenced by both Dp and Dc. However, when Dc was less than 400 nm, the uncertainty increased rapidly with decreasing Dc and was dominated by Dc. The uncertainty increased to larger than 23 % when Dc was less than about 100 nm. When Dp was less than about 300 nm, the uncertainty varied from 14 % to 24 % with a mean value of 22 %, indicating large uncertainty in eBCMSDAAC−AE33 for Dp less than 300 nm.
The MAC lookup table was replaced with original minus its SD (−SDMAC) and plus its SD (+SDMAC). The resulting MAC lookup tables were taken into the method proposed by W. Zhao et al. (2021) and applied to the entire measurement period to study the influence of MAC variation on the eBCMSDAAC−AE33. and mean eBCMSDAAC−AE33 after ± SDMAC are shown in Fig. 4a. The uncertainty increased with decreasing Dp and reached a maximum when Dp was less than 300 nm, indicating the eBCMSDAAC−AE33 for Dp less than 300 nm might potentially have non-negligible uncertainty. The uncertainty in was from −20 % (+SDMAC) to +28 % (−SDMAC), which was the largest among the four uncertainty sources, as shown in Table 1.
Table 1The uncertainty in the that resulted from the MAC lookup table, transfer function inversion, fBC and instrumental noise.

4.2 Uncertainty from the transfer function inversion
As stated in Sect. 2.4.1, correction for particle loss and spectral broadening was required when σab,binned was converted to σab,size-resolved. λΩ was defined to correct particle loss where stood for total (no) particle loss. The relationships between λΩ and Dp as well as Qsample, as shown in Fig. S4a, were well developed (Karlsson and Martinsson, 2003) and consistent with experimental data of the AAC (Johnson et al., 2018). Qsample used in this study was 3.0 L min−1. Qsample was changed from −30 % (2.1 L min−1) to +30 % (3.9 L min−1), and the resulting λΩ was used to study the fluctuation of Qsample on λΩ. As shown in Fig. S4a, the variation of λΩ was less than 0.5 %, which was negligible.
Spectral broadening was caused by small-size particle diffusion as well as disturbance of sheath flow due to complicated rotation fluid dynamics inside the AAC and described by μΩ, where μΩ<1 (μΩ=1) was for (no) broadening. Johnson et al. (2018) found that behavior of μΩ with respect to Dp (μΩ(Dp)) depended on both Qsheath and Qsample and parameterized μΩ(Dp) (Fig. S4b) based on two case studies of Qsheath and Qsample, namely 3 L min−1 and 0.3 L min−1 and 15 L min−1 and 1.5 L min−1:
Qsheath and Qsample were 7.5 L min−1 and 3 L min−1 in this study, which might have led to uncertainty if μΩ,Johnson(Dp) had been directly used in this study. μΩ,Johnson(Dp) was varied from −23 % to +30 % to study the impact of μΩ on eBCMSDAAC−AE33. The resulting influence on the eBCMSDAAC−AE33 is shown in Fig. 4b. The uncertainty of μΩ did not exhibit a significant size dependence. Lower μΩ led to lower eBCMSDAAC−AE33, and vice versa. The difference in the was from −1 % (−23 % of μΩ,Johnson) to +21 % (+30 % of μΩ,Johnson), implying systematic overestimation of . Therefore, μΩ(Dp)=77 % μΩ,Johnson(Dp) was used in this study to offset the bias. The reason for the lower limit of μΩ set as −23 % rather than −30 % was that eBCMSDAAC−AE33 was invalid mathematically when μΩ was less than −23 % under the setting of (Qsheath, Qsample) used in this study. It should be pointed out that AAC–AE33 could still determine valid eBCMSD under the condition of μΩ(Dp)<77 % μΩ,Johnson(Dp) by increasing Qsheath. Qsheath was not changed in this study because desired μΩ(Dp) parameterization was found at μΩ(Dp)=77 % μΩ,Johnson(Dp).
σab,size-resolved (Fig. S5b) was integrated, and the result, denoted as , was compared to σab,bulk. As shown in Fig. S5a, was consistent with σab,bulk. R2, b1 and b0 between and σab,bulk were 0.9, 1.1 and 0.5 M m−1 (Fig. S6), respectively, which validated conversion from σab,binned to σab,size-resolved.
4.3 Uncertainty from number fraction of BC-containing particle
BC-containing aerosol particles had complicated mixing states. Even for internally mixed particles with the same Dp, the internal BC cores might have different Dc, which could not be resolved by AAC–AE33. Field measurement (Liu et al., 2010) revealed that fBC varied with time, Dc and Dp. This complexity was simplified to a parameterized fixed value of fBC in this study. A fixed fBC implied that only one Dc value corresponded to a given Dp and the size-resolved number concentration of BC-containing particle was determined by Nsize-resolved times fBC. W. Zhao et al. (2021) used a fBC value of 0.17 based on SP2 measurement. However, SP2-derived fBC could not represent the bulk fBC over the whole particle size spectrum due to the detection limit of SP2. And different regions might have different fBC. In this study, fBC was varied, and the resulting was compared with . fBC was set as 0.35 in this study because b1 was 1.0 between and when fBC was 0.35.
fBC was varied from 0.25 (−30 % of 0.35) to 0.46 (+30 % of 0.35) to analyze the influence of fBC on the eBCMSDAAC−AE33, as shown in Fig. 4c. eBCMSDAAC−AE33 was more influenced around 870 nm. The variation of fBC led to uncertainty of ±3 % in , indicating that simplification of fBC was a minor uncertainty source compared to MAC and transfer function inversion.
4.4 Uncertainty from instrumental noise
The instrumental noise stemmed from the fluctuation of the light source and flow of AE33, which was reflected as fluctuation in I, I0 and F, further leading to the fluctuation in ATN, σATN and σab. The instrumental noise was defined as the SD of σab,binned and is shown in Fig. S7b. It can be seen that the instrumental noise did not exhibit significant dependence on Dp. Comparing Fig. S7a and S7b, the instrumental noise was irrelevant to the value of σab,binned. Figure S7c illustrates that the instrumental noise was also not correlated to σab,bulk, with R2, b1 and b0 of 0.0, 0.0 and 0.1 M m−1, respectively, implying that the instrumental noise was not dependent on the pollution level.
The SD of instrumental noise was added to (subtracted from) σab,binned, and the derived eBCMSDAAC−AE33 was used to study the influence of instrumental noise on eBCMSDAAC−AE33. The mean result is shown in Fig. 4d. eBCMSDAAC−AE33 larger than 1000 nm was more influenced by the instrumental noise than eBCMSDAAC−AE33 smaller than 500 nm. σab,binned larger than 1000 nm was relatively small (about 0.3 M m−1) compared to σab,binned less than 870 nm (about 0.9 M m−1). The mean instrumental noise was 0.1 M m−1 and exhibited no significant dependence on Dp. Therefore, σab,binned larger than 1000 nm was more affected by the instrumental noise, resulting in distinct variation in eBCMSDAAC−AE33. The uncertainty in was not obvious, which varied from −2 % to −1 %, also minor compared to MAC and transfer function inversion.
Knowledge of bulk black carbon (BC) characteristics, such as bulk BC mass concentration (mBC,bulk), is not sufficient for deeper understanding of the influence of BC on radiation and health. BC mass size distribution (BCMSD) was one of the BC microphysical characteristics that could indicate the emission source, reflect atmospheric aging and effectively reduce uncertainty related to BC radiative effect. However, current BCMSD measurement, ranging from upper submicron particle sizes to larger than 1 µm, was insufficient in time resolution and sophisticated for routine measurement. In this study, a new method to determine eBCMSD was proposed characterized by a wide size range of measurement up to 1.5 µm, a high time resolution up to 1 h and convenience for extensive measurement. The eBCMSD was retrieved by the size-resolved absorption coefficient (σab,size-resolved) measured by an aerodynamic aerosol classifier in tandem with an aethalometer model AE33 (AAC–AE33), denoted as eBCMSDAAC−AE33. Size-resolved number concentration (Nsize-resolved) was measured concurrently by a scanning mobility particle sizer (SMPS) and an aerodynamic particle sizer (APS) to model the influence of size on mass absorption cross-section (MAC). Uncertainty analysis was performed with respect to MAC, transfer function inversion, number fraction of BC-containing particle (fBC) and instrumental noise, which led to 24 %, 11 %, 3 % and 0.5 % variation on the derived mBC,bulk, respectively.
The proposed method was applied to a field measurement in the Yangtze River Delta and validated by comparing the rBCMSD with that measured by a differential mobility analyzer in tandem with a single-particle soot photometer (DMA–SP2), denoted as rBCMSDDMA−SP2. The results showed that for a particle diameter (Dp) less than 300 nm, eBCMSDAAC−AE33 was higher than rBCMSDDMA−SP2, which might be caused by underestimated MAC using the method proposed by W. Zhao et al. (2021) or incomplete parameterization of spectral broadening of the AAC. eBCMSDAAC−AE33 was consistent with rBCMSDDMA−SP2 for Dp larger than 300 nm. mBC,bulk integrated over the size range that AAC–AE33 and DMA–SP2 both measured (200–720 nm), denoted as and , compared well with each other, with a determination coefficient (R2), slope (b1) and intercept (b0) of 0.8, 1.0 and 0.1 µg m−3, respectively. However, the DMA–SP2 did not measure Dp values larger than 700 nm, leading to 0.2 µg m−3 (33 %) underestimation of mBC,bulk, highlighting the necessity to measure BCMSD with a wider size range.
As mentioned above, MAC was the largest uncertainty source, leading to significant uncertainty for Dp less than 300 nm. Transfer function inversion was the second largest uncertainty source, which was induced by incomplete parameterization of spectral broadening. The uncertainty in the transfer function inversion led to systematic overestimation of , which was corrected in this study. Both fBC and instrumental noise were minor uncertainty sources and 1 order of magnitude less than MAC and transfer function inversion. fBC was a simplification of complicated BC mixing states, leading to relatively big uncertainty in eBCMSD at 870 nm, around the boundary between the condensation mode and droplet mode. The eBCMSD for Dp larger than 1000 nm was more sensitive to instrumental noise.
The code and measurement data involved in this study are available upon request to the authors.
The supplement related to this article is available online at: https://doi.org/10.5194/amt-15-6807-2022-supplement.
CZ determined the main goal of this study. WZ and GZ designed the methods. WZ carried experiments out and prepared the paper with contributions from all co-authors.
The contact author has declared that none of the authors has any competing interests.
Publisher’s note: Copernicus Publications remains neutral with regard to jurisdictional claims in published maps and institutional affiliations.
This research has been supported by the National Natural Science Foundation of China (grant no. 41961160728).
This paper was edited by Paolo Laj and reviewed by two anonymous referees.
Bond, T. C.: Spectral dependence of visible light absorption by carbonaceous particles emitted from coal combustion, Geophys. Res. Lett., 28, 4075–4078, https://doi.org/10.1029/2001GL013652, 2001.
Bond, T. C. and Bergstrom, R. W.: Light absorption by carbonaceous particles: An investigative review, Aerosol Sci. Tech., 40, 27–67, https://doi.org/10.1080/02786820500421521, 2006.
Bond, T. C., Streets, D. G., Yarber, K. F., Nelson, S. M., Woo, J. H., and Klimont, Z.: A technology-based global inventory of black and organic carbon emissions from combustion, J. Geophys. Res.-Atmos., 109, D14203, https://doi.org/10.1029/2003jd003697, 2004.
Bond, T. C., Doherty, S. J., Fahey, D. W., Forster, P. M., Berntsen, T., DeAngelo, B. J., Flanner, M. G., Ghan, S., Karcher, B., Koch, D., Kinne, S., Kondo, Y., Quinn, P. K., Sarofim, M. C., Schultz, M. G., Schulz, M., Venkataraman, C., Zhang, H., Zhang, S., Bellouin, N., Guttikunda, S. K., Hopke, P. K., Jacobson, M. Z., Kaiser, J. W., Klimont, Z., Lohmann, U., Schwarz, J. P., Shindell, D., Storelvmo, T., Warren, S. G., and Zender, C. S.: Bounding the role of black carbon in the climate system: A scientific assessment, J. Geophys. Res.-Atmos., 118, 5380–5552, https://doi.org/10.1002/jgrd.50171, 2013.
Castagna, J., Calvello, M., Esposito, F., and Pavese, G.: Analysis of equivalent black carbon multi-year data at an oil pre-treatment plant: Integration with satellite data to identify black carbon transboundary sources, Remote Sens. Environ., 235, 111429, https://doi.org/10.1016/j.rse.2019.111429, 2019.
Chow, J. C., Watson, J. G., Crow, D., Lowenthal, D. H., and Merrifield, T.: Comparison of IMPROVE and NIOSH Carbon Measurements, Aerosol Sci. Tech., 34, 23–34, https://doi.org/10.1080/02786820119073, 2001.
DeCarlo, P. F., Slowik, J. G., Worsnop, D. R., Davidovits, P., and Jimenez, J. L.: Particle Morphology and Density Characterization by Combined Mobility and Aerodynamic Diameter Measurements. Part 1: Theory, Aerosol Sci. Tech., 38, 1185–1205, https://doi.org/10.1080/027868290903907, 2004.
Drinovec, L., Močnik, G., Zotter, P., Prévôt, A. S. H., Ruckstuhl, C., Coz, E., Rupakheti, M., Sciare, J., Müller, T., Wiedensohler, A., and Hansen, A. D. A.: The “dual-spot” Aethalometer: an improved measurement of aerosol black carbon with real-time loading compensation, Atmos. Meas. Tech., 8, 1965–1979, https://doi.org/10.5194/amt-8-1965-2015, 2015.
Guo, Y. H.: Carbonaceous aerosol composition over northern China in spring 2012, Environ. Sci. Pollut. Res., 22, 10839–10849, https://doi.org/10.1007/s11356-015-4299-8, 2015.
Hansen, A. D. A., Rosen, H., and Novakov, T.: The aethalometer - an instrument for the real-time measurement of optical-absorption by aerosol-particles, Sci. Total Environ., 36, 191–196, https://doi.org/10.1016/0048-9697(84)90265-1, 1984.
Helin, A., Niemi, J. V., Virkkula, A., Pirjola, L., Teinila, K., Backman, J., Aurela, M., Saarikoski, S., Ronkko, T., Asmi, E., and Timonen, H.: Characteristics and source apportionment of black carbon in the Helsinki metropolitan area, Finland, Atmos. Environ., 190, 87–98, https://doi.org/10.1016/j.atmosenv.2018.07.022, 2018.
Highwood, E. J. and Kinnersley, R. P.: When smoke gets in our eyes: The multiple impacts of atmospheric black carbon on climate, air quality and health, Environ. Int., 32, 560–566, https://doi.org/10.1016/j.envint.2005.12.003, 2006.
Johnson, T. J., Irwin, M., Symonds, J. P. R., Olfert, J. S., and Boies, A. M.: Measuring aerosol size distributions with the aerodynamic aerosol classifier, Aerosol Sci. Tech., 52, 655–665, https://doi.org/10.1080/02786826.2018.1440063, 2018.
Karlsson, M. N. A. and Martinsson, B. G.: Methods to measure and predict the transfer function size dependence of individual DMAs, J. Aerosol Sci., 34, 603–625, https://doi.org/10.1016/s0021-8502(03)00020-x, 2003.
Kim, J. H., Mulholland, G. W., Kukuck, S. R., and Pui, D. Y. H.: Slip correction measurements of certified PSL nanoparticles using a nanometer differential mobility analyzer (nano-DMA) for Knudsen number from 0.5 to 83, J. Res. Natl. Inst. Stan., 110, 31–54, https://doi.org/10.6028/jres.110.005, 2005.
Knutson, E. O. and Whitby, K. T.: Aerosol classification by electric mobility: apparatus, theory, and applications, J. Aerosol Sci., 6, 443–451, https://doi.org/10.1016/0021-8502(75)90060-9, 1975.
Liu, C., Chung, C. E., Yin, Y., and Schnaiter, M.: The absorption Ångström exponent of black carbon: from numerical aspects, Atmos. Chem. Phys., 18, 6259–6273, https://doi.org/10.5194/acp-18-6259-2018, 2018.
Liu, D., Flynn, M., Gysel, M., Targino, A., Crawford, I., Bower, K., Choularton, T., Jurányi, Z., Steinbacher, M., Hüglin, C., Curtius, J., Kampus, M., Petzold, A., Weingartner, E., Baltensperger, U., and Coe, H.: Single particle characterization of black carbon aerosols at a tropospheric alpine site in Switzerland, Atmos. Chem. Phys., 10, 7389–7407, https://doi.org/10.5194/acp-10-7389-2010, 2010.
Matsui, H., Hamilton, D. S., and Mahowald, N. M.: Black carbon radiative effects highly sensitive to emitted particle size when resolving mixing-state diversity, Nat. Commun., 9, 3446, https://doi.org/10.1038/s41467-018-05635-1, 2018.
Moosmuller, H., Chakrabarty, R. K., and Arnott, W. P.: Aerosol light absorption and its measurement: A review, J. Quant. Spectrosc. Ra., 110, 844–878, https://doi.org/10.1016/j.jqsrt.2009.02.035, 2009.
Ning, Z., Chan, K. L., Wong, K. C., Westerdahl, D., Mocnik, G., Zhou, J. H., and Cheung, C. S.: Black carbon mass size distributions of diesel exhaust and urban aerosols measured using differential mobility analyzer in tandem with Aethalometer, Atmos. Environ., 80, 31–40, https://doi.org/10.1016/j.atmosenv.2013.07.037, 2013.
Onasch, T. B., Trimborn, A., Fortner, E. C., Jayne, J. T., Kok, G. L., Williams, L. R., Davidovits, P., and Worsnop, D. R.: Soot Particle Aerosol Mass Spectrometer: Development, Validation, and Initial Application, Aerosol Sci. Tech., 46, 804–817, https://doi.org/10.1080/02786826.2012.663948, 2012.
Petzold, A., Ogren, J. A., Fiebig, M., Laj, P., Li, S.-M., Baltensperger, U., Holzer-Popp, T., Kinne, S., Pappalardo, G., Sugimoto, N., Wehrli, C., Wiedensohler, A., and Zhang, X.-Y.: Recommendations for reporting “black carbon” measurements, Atmos. Chem. Phys., 13, 8365–8379, https://doi.org/10.5194/acp-13-8365-2013, 2013.
Ramachandran, S. and Rajesh, T. A.: Black carbon aerosol mass concentrations over Ahmedabad, an urban location in western India: Comparison with urban sites in Asia, Europe, Canada, and the United States, J. Geophys. Res.-Atmos., 112, D06211, https://doi.org/10.1029/2006jd007488, 2007.
Ran, L., Deng, Z. Z., Wang, P. C., and Xia, X. A.: Black carbon and wavelength-dependent aerosol absorption in the North China Plain based on two-year aethalometer measurements, Atmos. Environ., 142, 132–144, https://doi.org/10.1016/j.atmosenv.2016.07.014, 2016.
Schwarz, J. P., Gao, R. S., Fahey, D. W., Thomson, D. S., Watts, L. A., Wilson, J. C., Reeves, J. M., Darbeheshti, M., Baumgardner, D. G., Kok, G. L., Chung, S. H., Schulz, M., Hendricks, J., Lauer, A., Karcher, B., Slowik, J. G., Rosenlof, K. H., Thompson, T. L., Langford, A. O., Loewenstein, M., and Aikin, K. C.: Single-particle measurements of midlatitude black carbon and light-scattering aerosols from the boundary layer to the lower stratosphere, J. Geophys. Res.-Atmos., 111, D16207, https://doi.org/10.1029/2006jd007076, 2006.
Schwarz, J. P., Spackman, J. R., Fahey, D. W., Gao, R. S., Lohmann, U., Stier, P., Watts, L. A., Thomson, D. S., Lack, D. A., Pfister, L., Mahoney, M. J., Baumgardner, D., Wilson, J. C., and Reeves, J. M.: Coatings and their enhancement of black carbon light absorption in the tropical atmosphere, J. Geophys. Res.-Atmos., 113, D03203, https://doi.org/10.1029/2007jd009042, 2008.
Soto-García, L. L., Andreae, M. O., Andreae, T. W., Artaxo, P., Maenhaut, W., Kirchstetter, T., Novakov, T., Chow, J. C., and Mayol-Bracero, O. L.: Evaluation of the carbon content of aerosols from the burning of biomass in the Brazilian Amazon using thermal, optical and thermal-optical analysis methods, Atmos. Chem. Phys., 11, 4425–4444, https://doi.org/10.5194/acp-11-4425-2011, 2011.
Tavakoli, F. and Olfert, J. S.: An Instrument for the Classification of Aerosols by Particle Relaxation Time: Theoretical Models of the Aerodynamic Aerosol Classifier, Aerosol Sci. Tech., 47, 916–926, https://doi.org/10.1080/02786826.2013.802761, 2013.
Taylor, J. W., Allan, J. D., Liu, D., Flynn, M., Weber, R., Zhang, X., Lefer, B. L., Grossberg, N., Flynn, J., and Coe, H.: Assessment of the sensitivity of core / shell parameters derived using the single-particle soot photometer to density and refractive index, Atmos. Meas. Tech., 8, 1701–1718, https://doi.org/10.5194/amt-8-1701-2015, 2015.
Tunved, P., Cremer, R. S., Zieger, P., and Strom, J.: Using correlations between observed equivalent black carbon and aerosol size distribution to derive size resolved BC mass concentration: a method applied on long-term observations performed at Zeppelin station, Ny-Ålesund, Svalbard, Tellus B, 73, 1–17, https://doi.org/10.1080/16000889.2021.1933775, 2021.
Viidanoja, J., Kerminen, V.-M., and Hillamo, R.: Measuring the Size Distribution of Atmospheric Organic and Black Carbon Using Impactor Sampling Coupled with Thermal Carbon Analysis: Method Development and Uncertainties, Aerosol Sci. Tech., 36, 607–616, https://doi.org/10.1080/02786820252883847, 2002.
Wang, J. D., Wang, S. X., Wang, J. P., Hua, Y., Liu, C., Cai, J., Xu, Q. C., Xu, X. T., Jiang, S. Y., Zheng, G. J., Jiang, J. K., Cai, R. L., Zhou, W., Chen, G. Z., Jin, Y. Z., Zhang, Q., and Hao, J. M.: Significant Contribution of Coarse Black Carbon Particles to Light Absorption in North China Plain, Environ. Sci. Tech. Let., 9, 134–139, https://doi.org/10.1021/acs.estlett.1c00953, 2022.
Yu, H., Wu, C., Wu, D., and Yu, J. Z.: Size distributions of elemental carbon and its contribution to light extinction in urban and rural locations in the pearl river delta region, China, Atmos. Chem. Phys., 10, 5107–5119, https://doi.org/10.5194/acp-10-5107-2010, 2010.
Zhang, R. Y., Khalizov, A. F., Pagels, J., Zhang, D., Xue, H. X., and McMurry, P. H.: Variability in morphology, hygroscopicity, and optical properties of soot aerosols during atmospheric processing, P. Natl. Acad. Sci. USA, 105, 10291–10296, https://doi.org/10.1073/pnas.0804860105, 2008.
Zhao, G., Tao, J., Kuang, Y., Shen, C., Yu, Y., and Zhao, C.: Role of black carbon mass size distribution in the direct aerosol radiative forcing, Atmos. Chem. Phys., 19, 13175–13188, https://doi.org/10.5194/acp-19-13175-2019, 2019.
Zhao, G., Shen, C. Y., and Zhao, C. S.: Technical note: Mismeasurement of the core-shell structure of black carbon-containing ambient aerosols by SP2 measurements, Atmos. Environ., 243, 117885, https://doi.org/10.1016/j.atmosenv.2020.117885, 2020a.
Zhao, G., Yu, Y., Tian, P., Li, J., Guo, S., and Zhao, C.: Evaluation and Correction of the Ambient Particle Spectral Light Absorption Measured Using a Filter-based Aethalometer, Aerosol Air Qual. Res., 20, 1833–1841, https://doi.org/10.4209/aaqr.2019.10.0500, 2020b.
Zhao, G., Tan, T., Zhu, Y., Hu, M., and Zhao, C.: Method to quantify black carbon aerosol light absorption enhancement with a mixing state index, Atmos. Chem. Phys., 21, 18055–18063, https://doi.org/10.5194/acp-21-18055-2021, 2021.
Zhao, W., Tan, W., Zhao, G., Shen, C., Yu, Y., and Zhao, C.: Determination of equivalent black carbon mass concentration from aerosol light absorption using variable mass absorption cross section, Atmos. Meas. Tech., 14, 1319–1331, https://doi.org/10.5194/amt-14-1319-2021, 2021.