the Creative Commons Attribution 4.0 License.
the Creative Commons Attribution 4.0 License.
 | 09 Feb 2022
Analysis of improvements in MOPITT observational coverage over Canada
Heba S. Marey
James R. Drummond
Dylan B. A. Jones
Helen Worden
Merritt N. Deeter
John Gille
Debbie Mao
The Measurements of Pollution in the Troposphere (MOPITT) satellite instrument has been measuring global tropospheric carbon monoxide (CO) since March 2000, providing the longest nearly continuous record of CO from space. During its long mission, the data processing algorithms have been updated to improve the quality of CO retrievals and the sensitivity to the lower troposphere. Currently, MOPITT retrievals are only performed for clear-sky observations or over low clouds for ocean scenes. The cloud detection scheme was modified in the new V9 product, resulting in an improvement in observational coverage, especially over land. Comparison of the spatial and seasonal variations of the data coverage in V9 and V8 shows differences with significant geographical and temporal variability, with some regions such as Canada and the Amazon exhibiting a doubling of data in winter. Here we conducted an analysis of Moderate Resolution Imaging Spectroradiometer (MODIS) cloud heights and cloud mask products along with MOPITT retrieval cloud flag descriptors to understand the impact of cloud conditions on the MOPITT observational coverage, with a particular focus on observations over Canada. The MOPITT CO total column (TC) data were modified by turning off the cloud detection scheme to allow for a CO retrieval result, regardless of their cloud status. Analyses of the standard V8 CO TC product (cloud filtered) and non-standard product (non-cloud-masked) were conducted for selected days. Results showed some coherent structures that were observed frequently in the non-masked CO product that was not present in the V8 product and could potentially be actual CO features. Many times, these CO plumes were also seen in the Infrared Atmospheric Sounding Interferometer (IASI) CO TC product. The MODIS cloud height analysis revealed that a significant number of low-cloud CO retrievals were discarded in the V8 product. Most of the missed CO plumes in the V8 product are now detected in the new V9 product as a result of the dependence of the MOPITT radiance ratio (MRT) test over land. Comparisons of the MRT and MODIS cloud height data indicate a remarkable negative correlation. As a result of the modified V9 cloud detection algorithm, a significant portion of the low-cloud CO retrievals is now incorporated in the new V9 MOPITT product. Consequently, the observational coverage over Canada is significantly improved, which benefits analyses of regional CO variability, especially during extreme pollution events. We also conducted a comparison of MOPITT and IASI CO TC and found generally good agreement, with about a 5 %–10 % positive bias that is more pronounced in highly polluted scenes.
- Article
(43229 KB) - Full-text XML
- BibTeX
- EndNote


Carbon monoxide (CO) in the atmosphere has a medium lifetime (weeks to months), which is long enough to track atmospheric physical and chemical processes over a range of spatial scales from space (Jiang et al., 2011; Edwards et al., 2006; Duncan et al., 2007). Hence, satellite measurements of atmospheric CO are useful for studying both transported and local sources of pollution as well as atmospheric chemistry.
The Measurements of Pollution in the Troposphere (MOPITT) satellite instrument provides the longest dataset of CO from space. It has been measuring tropospheric CO using gas filter correlation radiometry (GFCR) since March 2000 (Drummond et al., 2010; Drummond and Mand, 1996; Deeter et al., 2017), with a footprint of 22 km × 22 km and global coverage every 3 d (Deeter et al., 2003). It is on board the Terra satellite, which is in a Sun-synchronous polar orbit at 705 km of altitude and crosses the Equator at 10:30 local time (Drummond and Mand, 1996). Furthermore, it is the only satellite instrument that measures CO in both the thermal infrared (TIR; 4.7 µm) and near-infrared (NIR; 2.3 µm). This long-term data record provides a unique opportunity for analyzing interannual variability and long-term trends in the distribution of CO, atmospheric transport, and tropospheric chemistry that are associated with human activity and climate change (Worden et al., 2013; Strode and Pawson, 2013; Buchholz et al., 2021).
During MOPITT's long mission, data processing algorithms have been updated considerably to improve the quality of the CO retrievals and their sensitivity to the lower troposphere. However, MOPITT cannot “see” through cloud, and this represents a significant obstruction to measurement spatial coverage. The current cloud detection algorithm, using both MOPITT and Moderate Resolution Imaging Spectroradiometer (MODIS) information (Warner et al., 2001), rejects pixels with a significant amount of cloud cover, thereby reducing the number of pixels retrieved. This leads to global maps with gaps in CO data where clouds are present.
Retrieving CO gas in cloudy conditions represents a major challenge. The presence of clouds in the observed scene enhances reflectivity and blocks the atmosphere below the clouds for cloudy scenes compared to cloud-free sky scenes. The albedo and in-cloud absorption effects enhance the sensitivity to trace gases above the clouds, while the shielding effect impacts the vertical sensitivity of the measurement, which results in an inaccurate estimation of the trace gas column. Various techniques have been proposed to cope with this problem depending on the spectral range of the measurements. These techniques can be grouped into the following four approaches.
The first approach is the threshold method, where only observations under clear-sky conditions or weakly cloud-contaminated scenes (determined using threshold-based algorithms to detect clouds and develop cloud masks) are considered (Ackerman et al., 1998; Deeter et al., 2003; Warner et al., 2001). The second approach, referred to as cloud clearing, is to reconstruct clear column radiances that would have been present if there were no clouds. Cloud clearing is used for Atmospheric Infrared Sounder (AIRS) atmospheric CO retrievals where a reconstructed pixel consisting of a 3 × 3 array (9 pixels are used) is produced, resulting in 45 km spatial resolution (Susskind et al., 2003; Li et al., 2005). Both of these approaches avoid the need for complex modeling of cloud effects but have the added complexity of characterizing errors resulting from un-modeled cloud fields. The third approach is to solve for the radiative effects of clouds directly in the inversion process. This approach is used for retrieving profiles (Kulawik et al., 2006) from measurements from the Tropospheric Emission Spectrometer (TES). The fourth approach is utilized for CO retrievals over land and ocean in the presence of low-altitude clouds from measurements from the TROPOspheric Monitoring Instrument (TROPOMI). In this approach, shortwave infrared (SWIR) measurements of methane total column (TC) are used to filter out observations with high and optically thick clouds to retrieve the trace gas information (Vidot et al., 2012; Landgraf et al., 2016).
For MOPITT, due to the lack of spectral information and collocated methane data, only the first two approaches are possible, and, unfortunately, the results of the reconstructed clear column radiances using two adjacent pixels are not sufficiently precise for viable retrievals. Consequently, adjustments to the current MOPITT cloud detection scheme are the only one of the four approaches that can be employed.
Deeter et al. (2021) recently made significant changes to the cloud detection scheme resulting in a new MOPITT product V9. These changes impacted the MOPITT coverage rate, especially over land. Hence, the aim of this study is to conduct an analysis of MODIS cloud heights and cloud mask products along with MOPITT retrieval cloud flag descriptors to understand the impact of cloud conditions on the MOPITT observational coverage, with a particular focus on observations over Canada.
This study uses data from three satellite instruments, MOPITT, IASI (Infrared Atmospheric Sounding Interferometer), and MODIS. MODIS and MOPITT are both on board the Terra satellite (with an equatorial crossing time of 10:30 LT), which facilitates the collocation of observations in space and time. IASI on MetOp-A has an equatorial crossing time of 09:30 LT.
2.1 MOPITT
The MOPITT instrument is on board the NASA Terra, which is a Sun-synchronous polar-orbiting satellite. It has a spatial resolution of 22 × 22 km with a swath width of 640 km which covers the globe every 3–4 d. MOPITT Version 8 and Version 9 (V8 and V9) Level 1 (L1) and Level 2 (L2) TIR products are used in this study. L1 data correspond to all of the radiance observations that are obtained in MOPITT swaths. They are used subsequently as input to the algorithms that retrieve the CO vertical profiles and total column (TC) amounts, which are referred to as L2 data. The MOPITT L2 products that are utilized here are the CO total column (TC) abundances and two cloud diagnostics contained in the MOPITT L2 files: the MOPITT cloud description index and the MODIS cloud diagnostics vector.
2.2 MODIS
The MODIS products used in this study are the Collection-6 1 km cloud mask (MOD35) and the cloud height 5 km resolution (MOD06) data. MODIS measures radiances at 36 wavelengths, including infrared and visible bands with spatial resolution from 250 m to 1 km. The MODIS cloud mask algorithm uses up to 19 MODIS spectral bands for better cloud detection (Ackerman et al., 2008, 1998). The MODIS cloud height is derived using five thermal infrared bands (both day and night) at 5 km spatial resolution.
2.3 IASI-A
IASI-A is a Fourier transform spectrometer on the European Space Agency (EPS)/MetOp-A satellite launched in 2006 with a spectral coverage range from 3.62 to 15.5 µm (645 to 2760 cm−1), including the CO 2140 cm−1 TIR band. It views the ground through a cross-track rotary scan mirror with a horizontal resolution of 12 km diameter at nadir, which increases at larger viewing angles. The width of the swath is ∼ 2200 km, with a total of 120 views. The IASI instrument takes measurements day and night, which gives a global coverage twice a day, with some gaps between orbits around the Equator. However, clouds in the field of view can obstruct the measurements and hence reduce the number of observations (Clerbaux et al., 2009). This study used L2 IASI-A CO TC values that were retrieved by LATMOS (Laboratoire Atmosphères, Milieux, Observations Spatiales) using a retrieval code, FORLI (Fast Optimal Retrievals on Layers for IASI), developed at ULB (Université Libre de Bruxelles) (https://iasi.aeris-data.fr/co/, last access: 20 December 2021). Data are retrieved for a cloud fraction of less than 25 % (Clerbaux et al., 2009).
The MOPITT retrieval algorithm only performs retrievals in clear-sky conditions. The MOPITT procedures for identifying clear-sky retrievals from cloud-contaminated pixels involve a threshold method that makes use of two independent tests, (1) a MOPITT radiance ratio threshold and (2) a MODIS cloud mask threshold within the MOPITT field of view (Warner et al., 2001; Deeter et al., 2011), which are described below.
The MOPITT radiance threshold. Radiance from the MOPITT 4.7 µm thermal channel radiance is compared to the a priori clear-sky radiance calculated by the MOPITT Operational Fast Forward Model (MOPFAS) (Edwards et al., 1999) for each pixel. If the measured/calculated radiance ratio is ≥ 1.0 for V8 and V9 and ≥ 0.955 for other versions (V7 and before), then the observation is considered “clear”. For this test however, the threshold value may be exceeded under temperature inversion conditions where clouds are warmer than the underlying surface. This threshold method is not applicable to polar regions due to the frequent temperature inversions at night and to avoid the effect of possible snow and ice coverage on the daytime signals (Warner et al., 2001).
The MODIS Cloud threshold. The MODIS swath (2330 km) is much wider than the MOPITT swath (640 km), so it provides complete overlap for MOPITT passes. The MODIS cloud mask (MOD35 L2) product (Ackerman et al., 2008) that is used here has 1 km horizontal resolution at nadir (Ackerman et al., 1998). Therefore, each MOPITT pixel can encompass ∼ 480 MODIS 1 × 1 km pixels. After collocation, relevant MODIS cloud mask parameters of the MODIS are gathered and averaged for each MOPITT pixel. MOD35_L2, containing data collected from the Terra platform, is used to get the cloud count at each MOPITT pixel, and if the MODIS cloud percent is less than 5 %, then the MOPITT pixel is considered clear.
In the previous MOPITT products (V8 and before), the MODIS test value supersedes the MOPITT value over land; i.e., if the MODIS test is “clear” and the MOPITT test is “cloudy”, then the MOPITT pixel will be considered “clear” (Warner et al., 2001; Marey and Drummond, 2018). However, if the MOPITT test identifies the pixel as clear and the MODIS test identifies the pixel as cloudy, then a low-cloud test is done. The low-cloud test exploits the MODIS IR and visible reflectance (Warner et al., 2001; Deeter et al., 2017). To assign low clouds for daytime observations, an averaged MODIS IR threshold test value should be ≥ 0.9, and an averaged MODIS visible reflectance test value should be ≤ 0.95. For nighttime observations, a MODIS IR temperature difference test value ≥ 0.9 is interpreted as low clouds (Warner et al., 2001; Marey and Drummond, 2018), while for ocean scenes, even if the low-cloud test did not pass, the pixel is considered clear based on either the MOPITT or MODIS test result (Deeter et al., 2017).
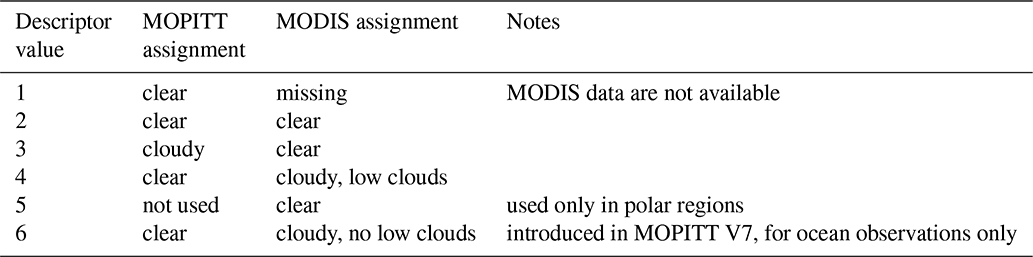
For the V9 product, the modified cloud detection algorithm (Deeter et al., 2021) allows CO retrievals over land when the MOPITT radiance ratio test indicates the pixel is clear although the MODIS cloud mask test assigns the pixel as cloudy. Hence, a cloud index value of 6 (Table 1) is now applied for both ocean and land areas (Deeter et al., 2017, 2021).
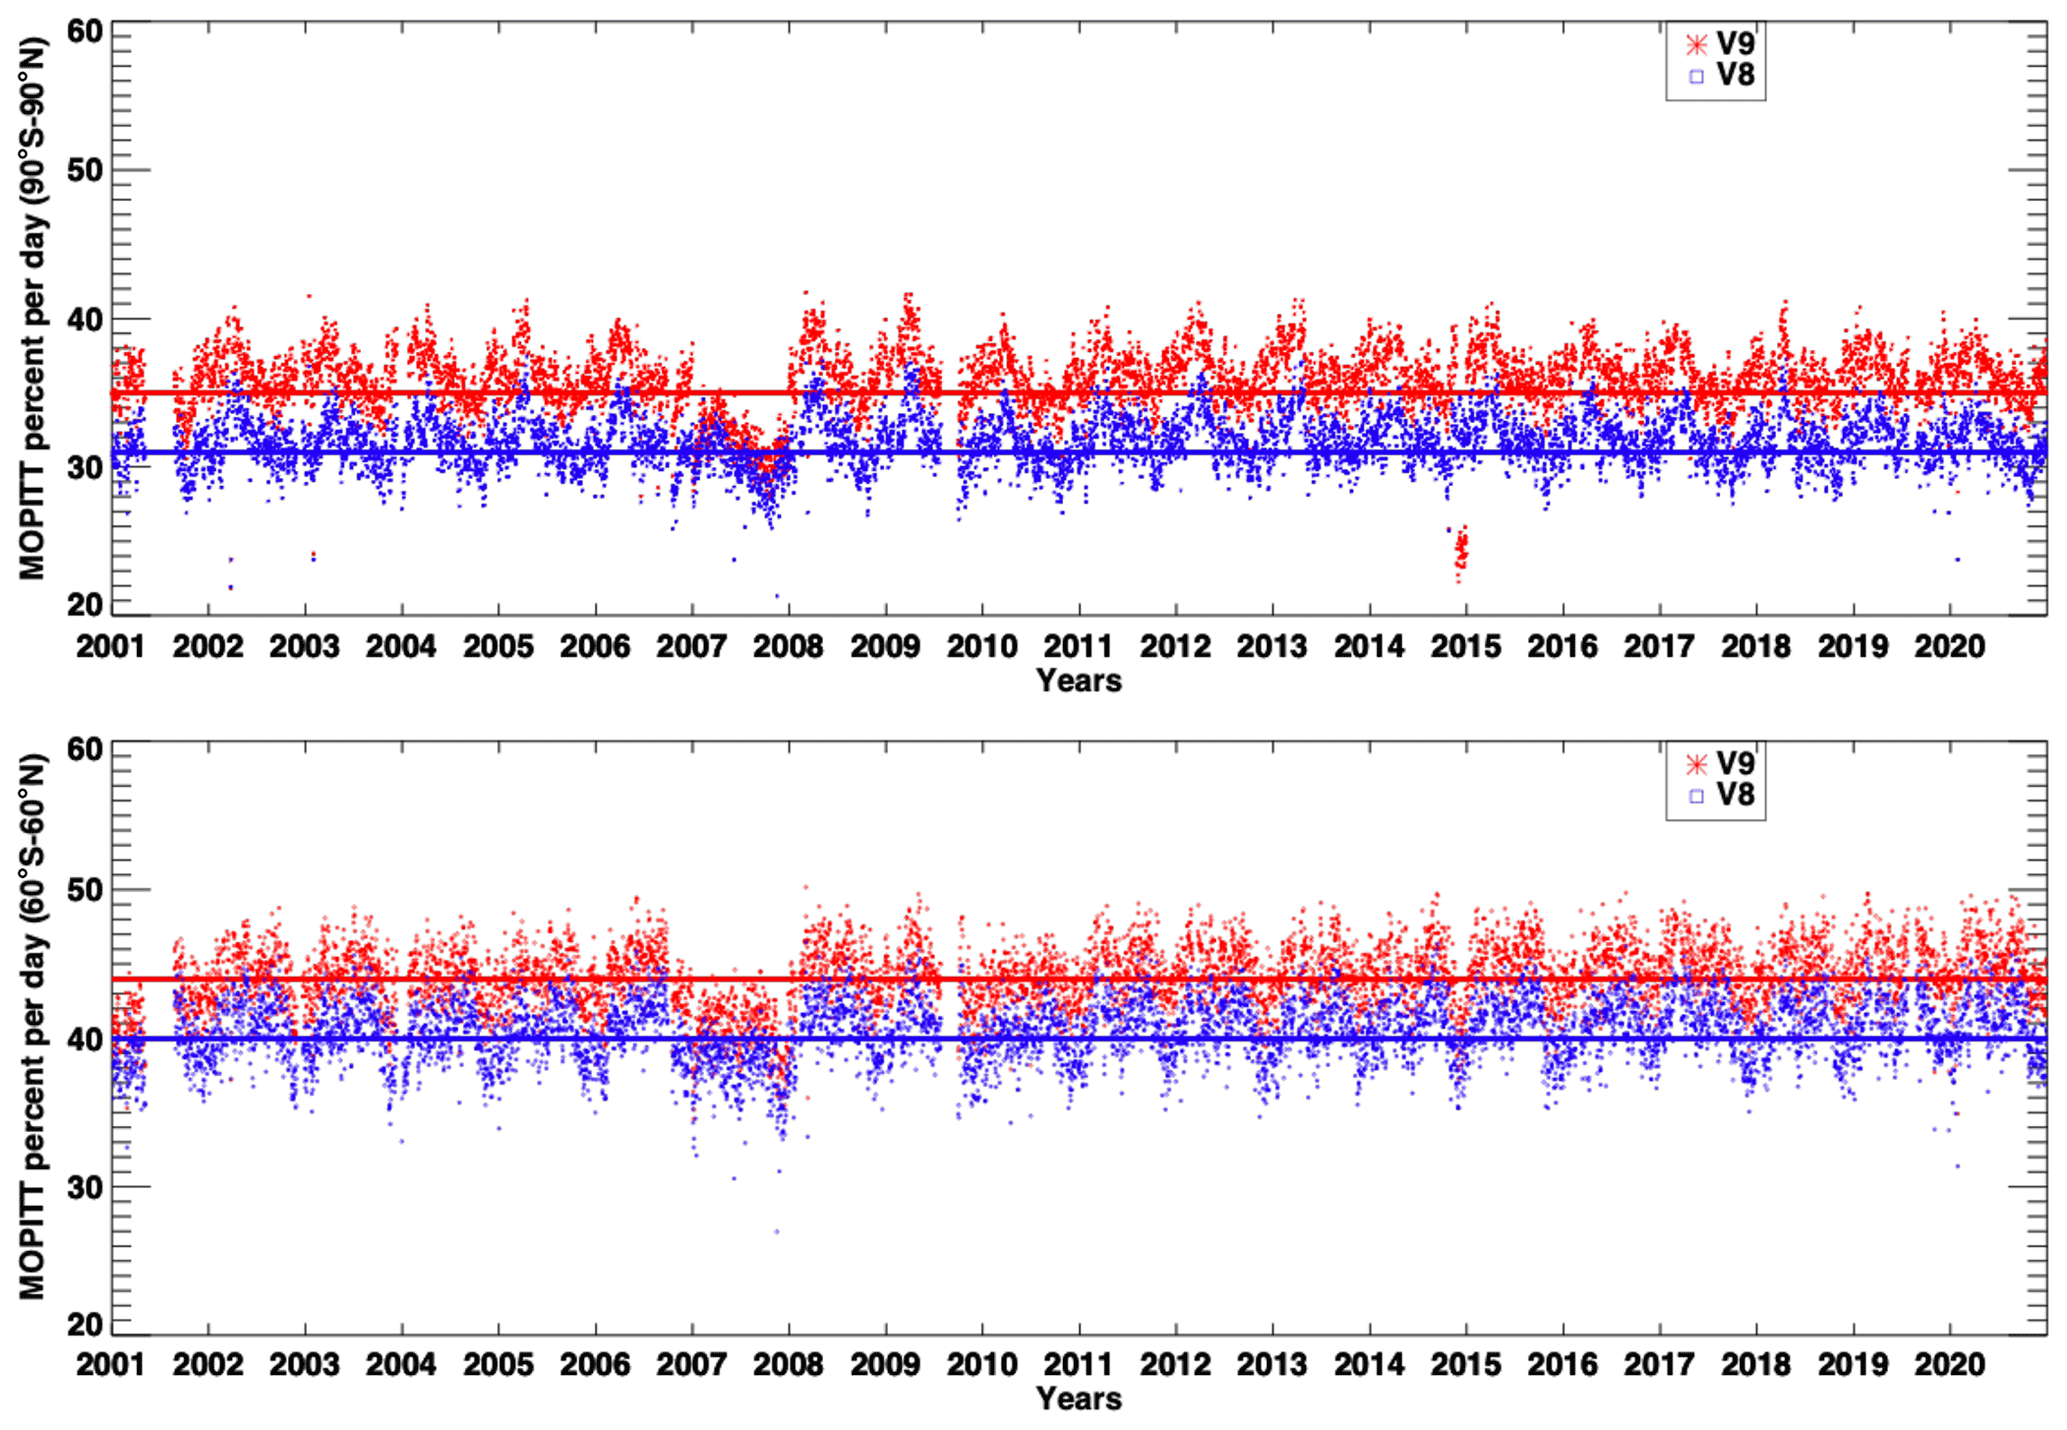
Figure 1The percentage of successful daily MOPITT retrievals between 90∘ S–90∘ N and 60∘ S–60∘ N from 2000 to 2020 for V9 and V8. The solid lines represent the average successful retrieval for the entire period.
The final clear/cloudy decision for each MOPITT pixel is based on a set of rules summarized in six cloud indices as follows. The pixel is assigned to be clear and hence retrieved if the following is true:
-
MODIS data are missing but the MOPITT radiance threshold is passed (rare).
-
MODIS data are clear, and the MOPITT radiance threshold is passed (most confidently clear).
-
MODIS data are clear, but the MOPITT radiance threshold is failed. The MODIS result overrides the MOPITT result.
-
MODIS data are cloudy, but the MOPITT radiance threshold is passed. In this case, the MODIS low-cloud test is applied, and in the case of a low cloud, the pixel is treated as clear (occurs mostly over ocean scenes).
-
For polar regions only (> 65∘ N or S latitude), MODIS data are clear. The MOPITT test is not used.
-
MODIS is assigned to be cloudy with no detected low clouds, and the MOPITT radiance threshold is passed. This was introduced in V7 for ocean scenes to correct for an observed degradation in MODIS cloud products (Moeller and Frey, 2017). However, for V9, it applies for both ocean and land scenes.
If the pixel does not pass any of these tests, then no retrieval is performed. The six cloud indices are reported in Level 2 MOPITT files in the “Cloud Description” diagnostic, as presented in Table 1.
4.1 Assessment of the successful MOPITT CO retrievals
To assess the successful MOPITT CO retrievals in terms of data coverage, the statistics of the L2 data from 2000 to 2020 for V9 and V8 are computed. Buchholz et al. (2017) recommended avoiding the use of MOPITT above 60∘ N as the sea ice may not be correctly accounted for in the retrievals. The fraction of daily valid data between 90∘ S–90∘ N and 60∘ S–60∘ N (for land and ocean combined) is shown in Fig. 1. The successful rate is calculated by taking the ratio of the number of daily CO data retrievals (L2) to the total number of daily radiance measurements (L1). For 90∘ S–90∘ N, the successful retrieval rate of V8 and V9 varies between 27 %–33 % and 35 %–40 %, respectively, while the 60∘ S–60∘ N domain has a successful retrieval rate between 34 %–42 % and 40 %–50 %, for V8 and V9 respectively. Therefore, the number of daytime V9 MOPITT retrievals has increased by 15 %–20 % for 90∘ S–90∘ N and 60∘ S–60∘ N relative to the Version 8 product. However, the gain in data coverage varies significantly on spatial level.
Figures 2–5 show the seasonal spatial coverage rate per day (the faction of the successful retrievals, L2, to the total number of radiance measurements, L1) using 2014 as a representative year gridded in 1∘ × 1∘ bins. The top and the bottom figures present V9 and V8 daily coverage rate, respectively, while the middle ones indicate V9–V8 percent. It is apparent that some regions exhibit high coverage rates (close to 100 %) in all seasons for both V8 and V9, such as northern Africa, so there are no added observations over such regions as is indicated by the middle panels (V9–V8), while other regions exhibit large gain in retrievals compared to V8 product, which varies seasonally. For example, in Canada, the data coverage of V8 (bottom panel of Fig. 4) reached 50 % in summer (e.g., Hudson Bay) but drops to less than 10 % in winter (bottom panel of Fig. 2) due to high cloud cover. Interestingly, V9 successful retrievals (top panels) for Canada demonstrated significant data enhancement, especially in winter (top panel of Fig. 2), where observations in some areas have doubled relative to V8 as shown in Fig. 2. Additionally, the Amazon region experienced significant data increase compared to V8, especially in JJA months as shown in Fig. 4. The increase in retrieval yield over the Amazon region has been investigated in more detail by Deeter et al. (2021).
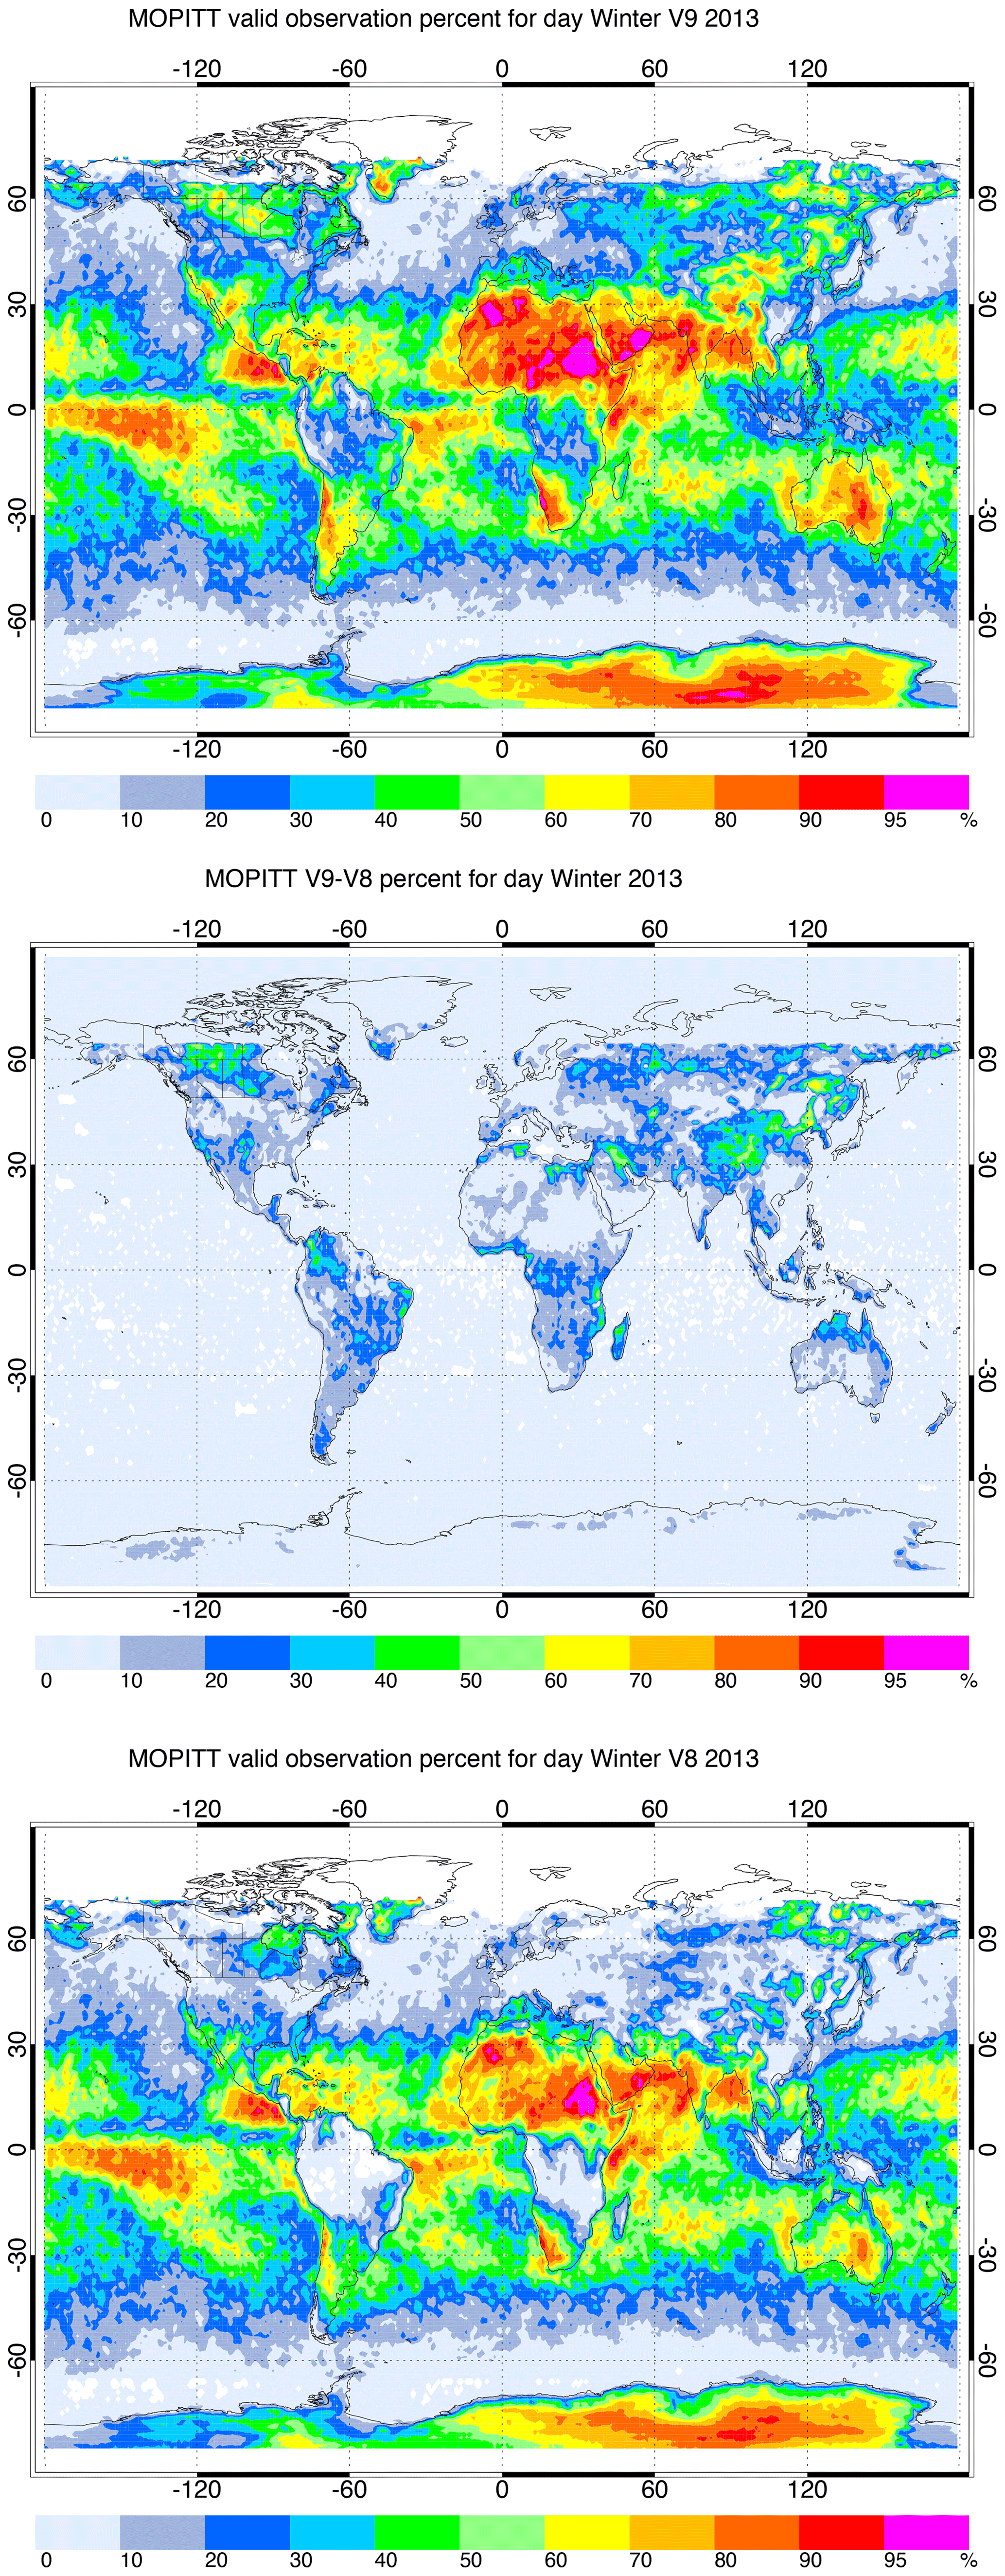
Figure 2Seasonally averaged spatial distribution of the successful MOPITT retrievals in winter 2013 for V9 (top panel), V8 (bottom panel) and V9–V8 (middle panel). Data were aggregated into 1∘ × 1∘ bins.
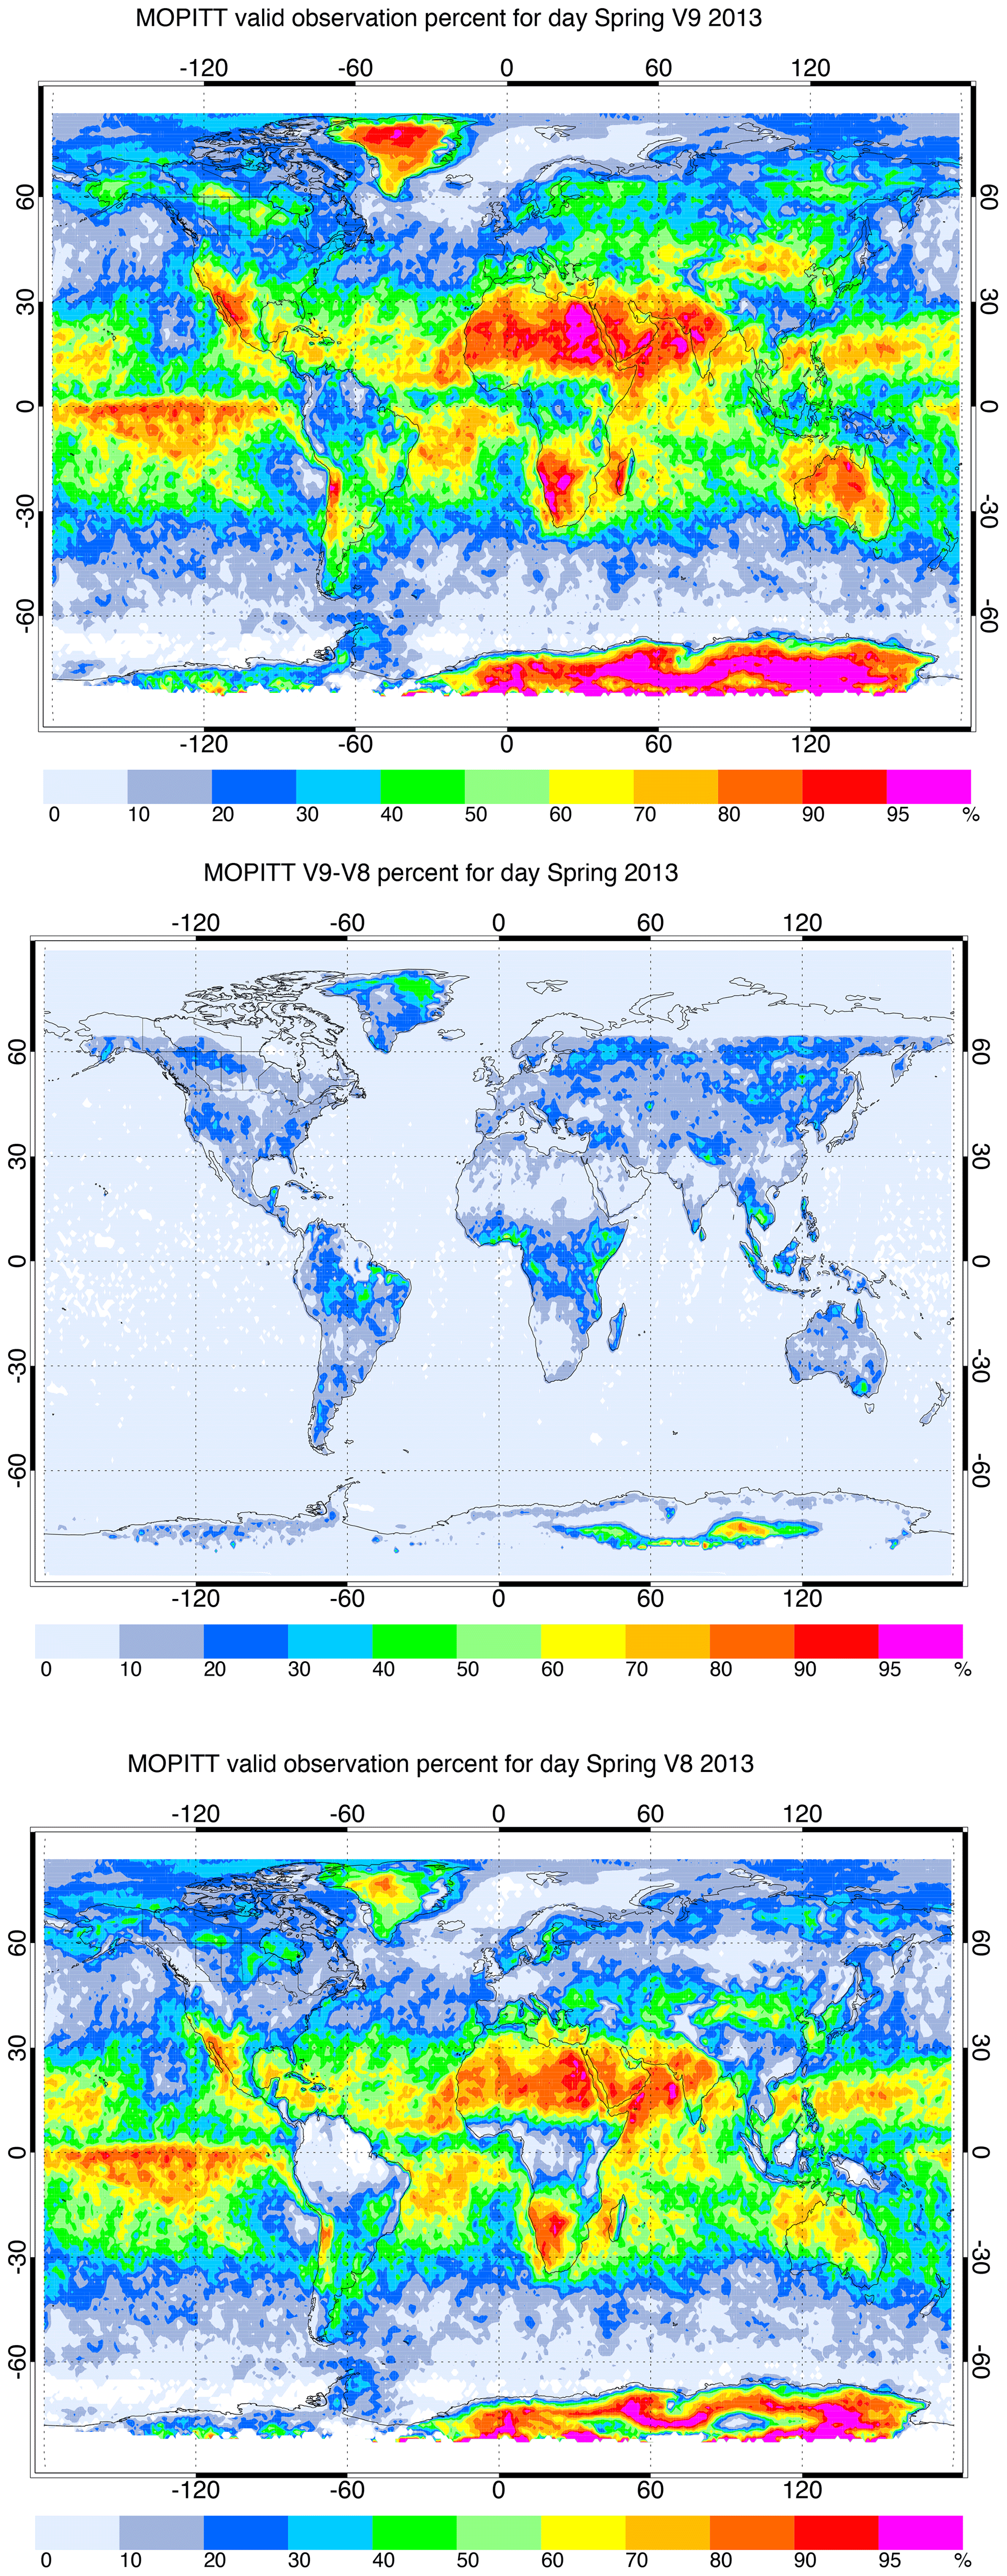
Figure 3The same as Fig. 2 but for the spring season.

Figure 4The same as Fig. 2 but for the summer season.
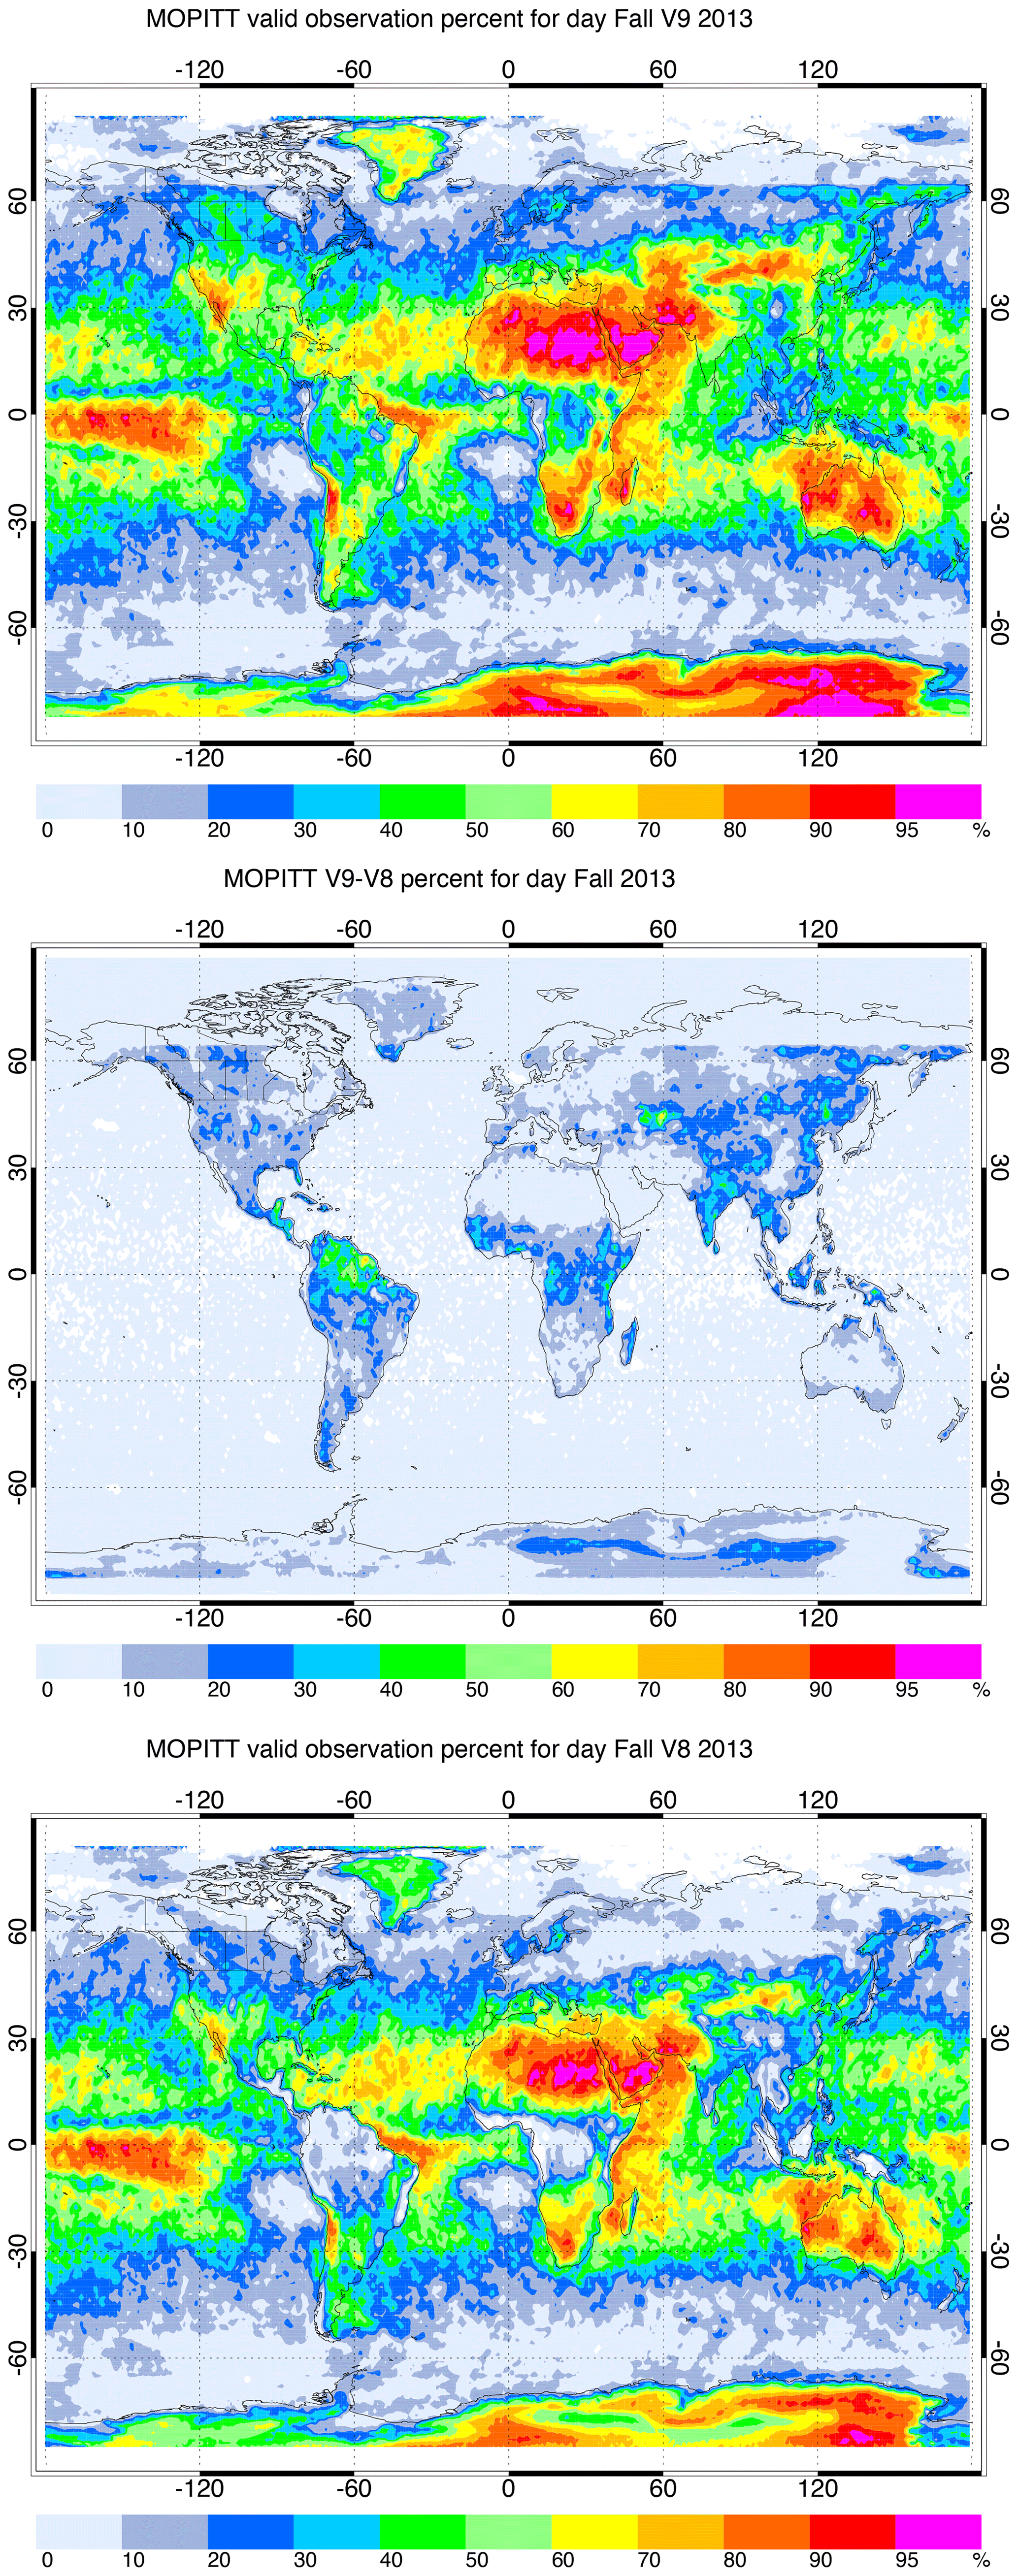
Figure 5The same as Fig. 2 but for the fall season.
Here we focus on daytime data, and therefore there is a cutoff at high northern latitudes in the Northern Hemisphere winter and at high southern latitudes in the Southern Hemisphere winter. In general, high-latitude regions (poleward of 65∘) have strong seasonal variations in data coverage, with the northern high latitudes showing the highest coverage rates for both V9 and V8 in June, July, and August and the southern high latitudes exhibiting the highest rates in December, January, and February as a result of less cloud in the summer. However, V9 successful retrievals of spring (February, March, and April) and fall (September, October, and November) seasons experienced a significant coverage gain in comparison to V8. Hence, the cloud detection scheme modifications in the new V9 product resulted in an improvement in observational coverage, especially over land (Deeter et al., 2021).
4.2 Analysis of standard and non-standard MOPITT product
In this section, we present an analysis of Moderate Resolution Imaging Spectroradiometer (MODIS) cloud heights and cloud mask products along with MOPITT retrieval cloud flag descriptors to understand the impact of cloud conditions on the MOPITT observational coverage, with a particular focus on observations over Canada.

Figure 6(a) Standard (cloud-masked), (b) non-standard (non-cloud-masked) CO TC, (c) IASI CO TC, (d) MOPITT cloud flag number, (e) MODIS cloud height, and (f) cloud mask on 16 August 2018. The faint black squares represent MOPITT pixels (22 km × 22 km) for all L1 observations.
CO TC data were retrieved for a selected number of dates and locations by suppressing the cloud detection scheme, so that all MOPITT L1 data were used to produce the L2 product regardless of the cloud conditions. This non-cloud-masked product will be referred to here as the non-standard product. Analyses of the CO TC V8 L2 standard (cloud-filtered) and non-standard product (non-cloud-masked) were performed for some selected cases. Figure 6a and b show the standard and non-standard CO product on 16 August 2018, respectively, over the region between 78–92∘ W and 44–60∘ N, which covers Ontario, Canada, near Hudson Bay. The standard (cloud-masked) product indicates that about 60 % of the data are missing. Comparing it to the non-standard (non-masked) product, some features can be observed in the non-standard product over the regions that were missing data in the V8 standard product. A coherent structure is present between 50–54∘ N (as indicated by pink and purple colors). The IASI TC for the same area and time was analyzed to corroborate whether the features in the non-cloud-masked product are actual CO plumes (Fig. 6c). Comparing IASI CO TC on 16 August 2018 (Fig. 6c) to the corresponding MOPITT (Fig. 6b) illustrates a strong CO plume around 50–55 ∘ N and −94 to −84∘ W that is apparent in both IASI and MOPITT. In the next section the MODIS cloud height product was used to diagnose the cause of the missing (not retrieved in the V8 standard product) CO features.
4.3 Regional analysis of MODIS cloud height and MOPITT data
The MODIS swath (2330 km) is much wider than the MOPITT swath (640 km), so it provides complete overlap for MOPITT passes. The MODIS cloud height (MOD6 L2) product (Ackerman et al., 2008) has 5 km horizontal resolution at nadir (Ackerman et al., 1998). Therefore, each MOPITT pixel can encompasses ∼ 20 MODIS 1 × 1 km pixels. After collocation, relevant MODIS cloud height values are gathered and averaged for each MOPITT pixel.

Figure 7The same as Fig. 3 but for 12 April 2010.
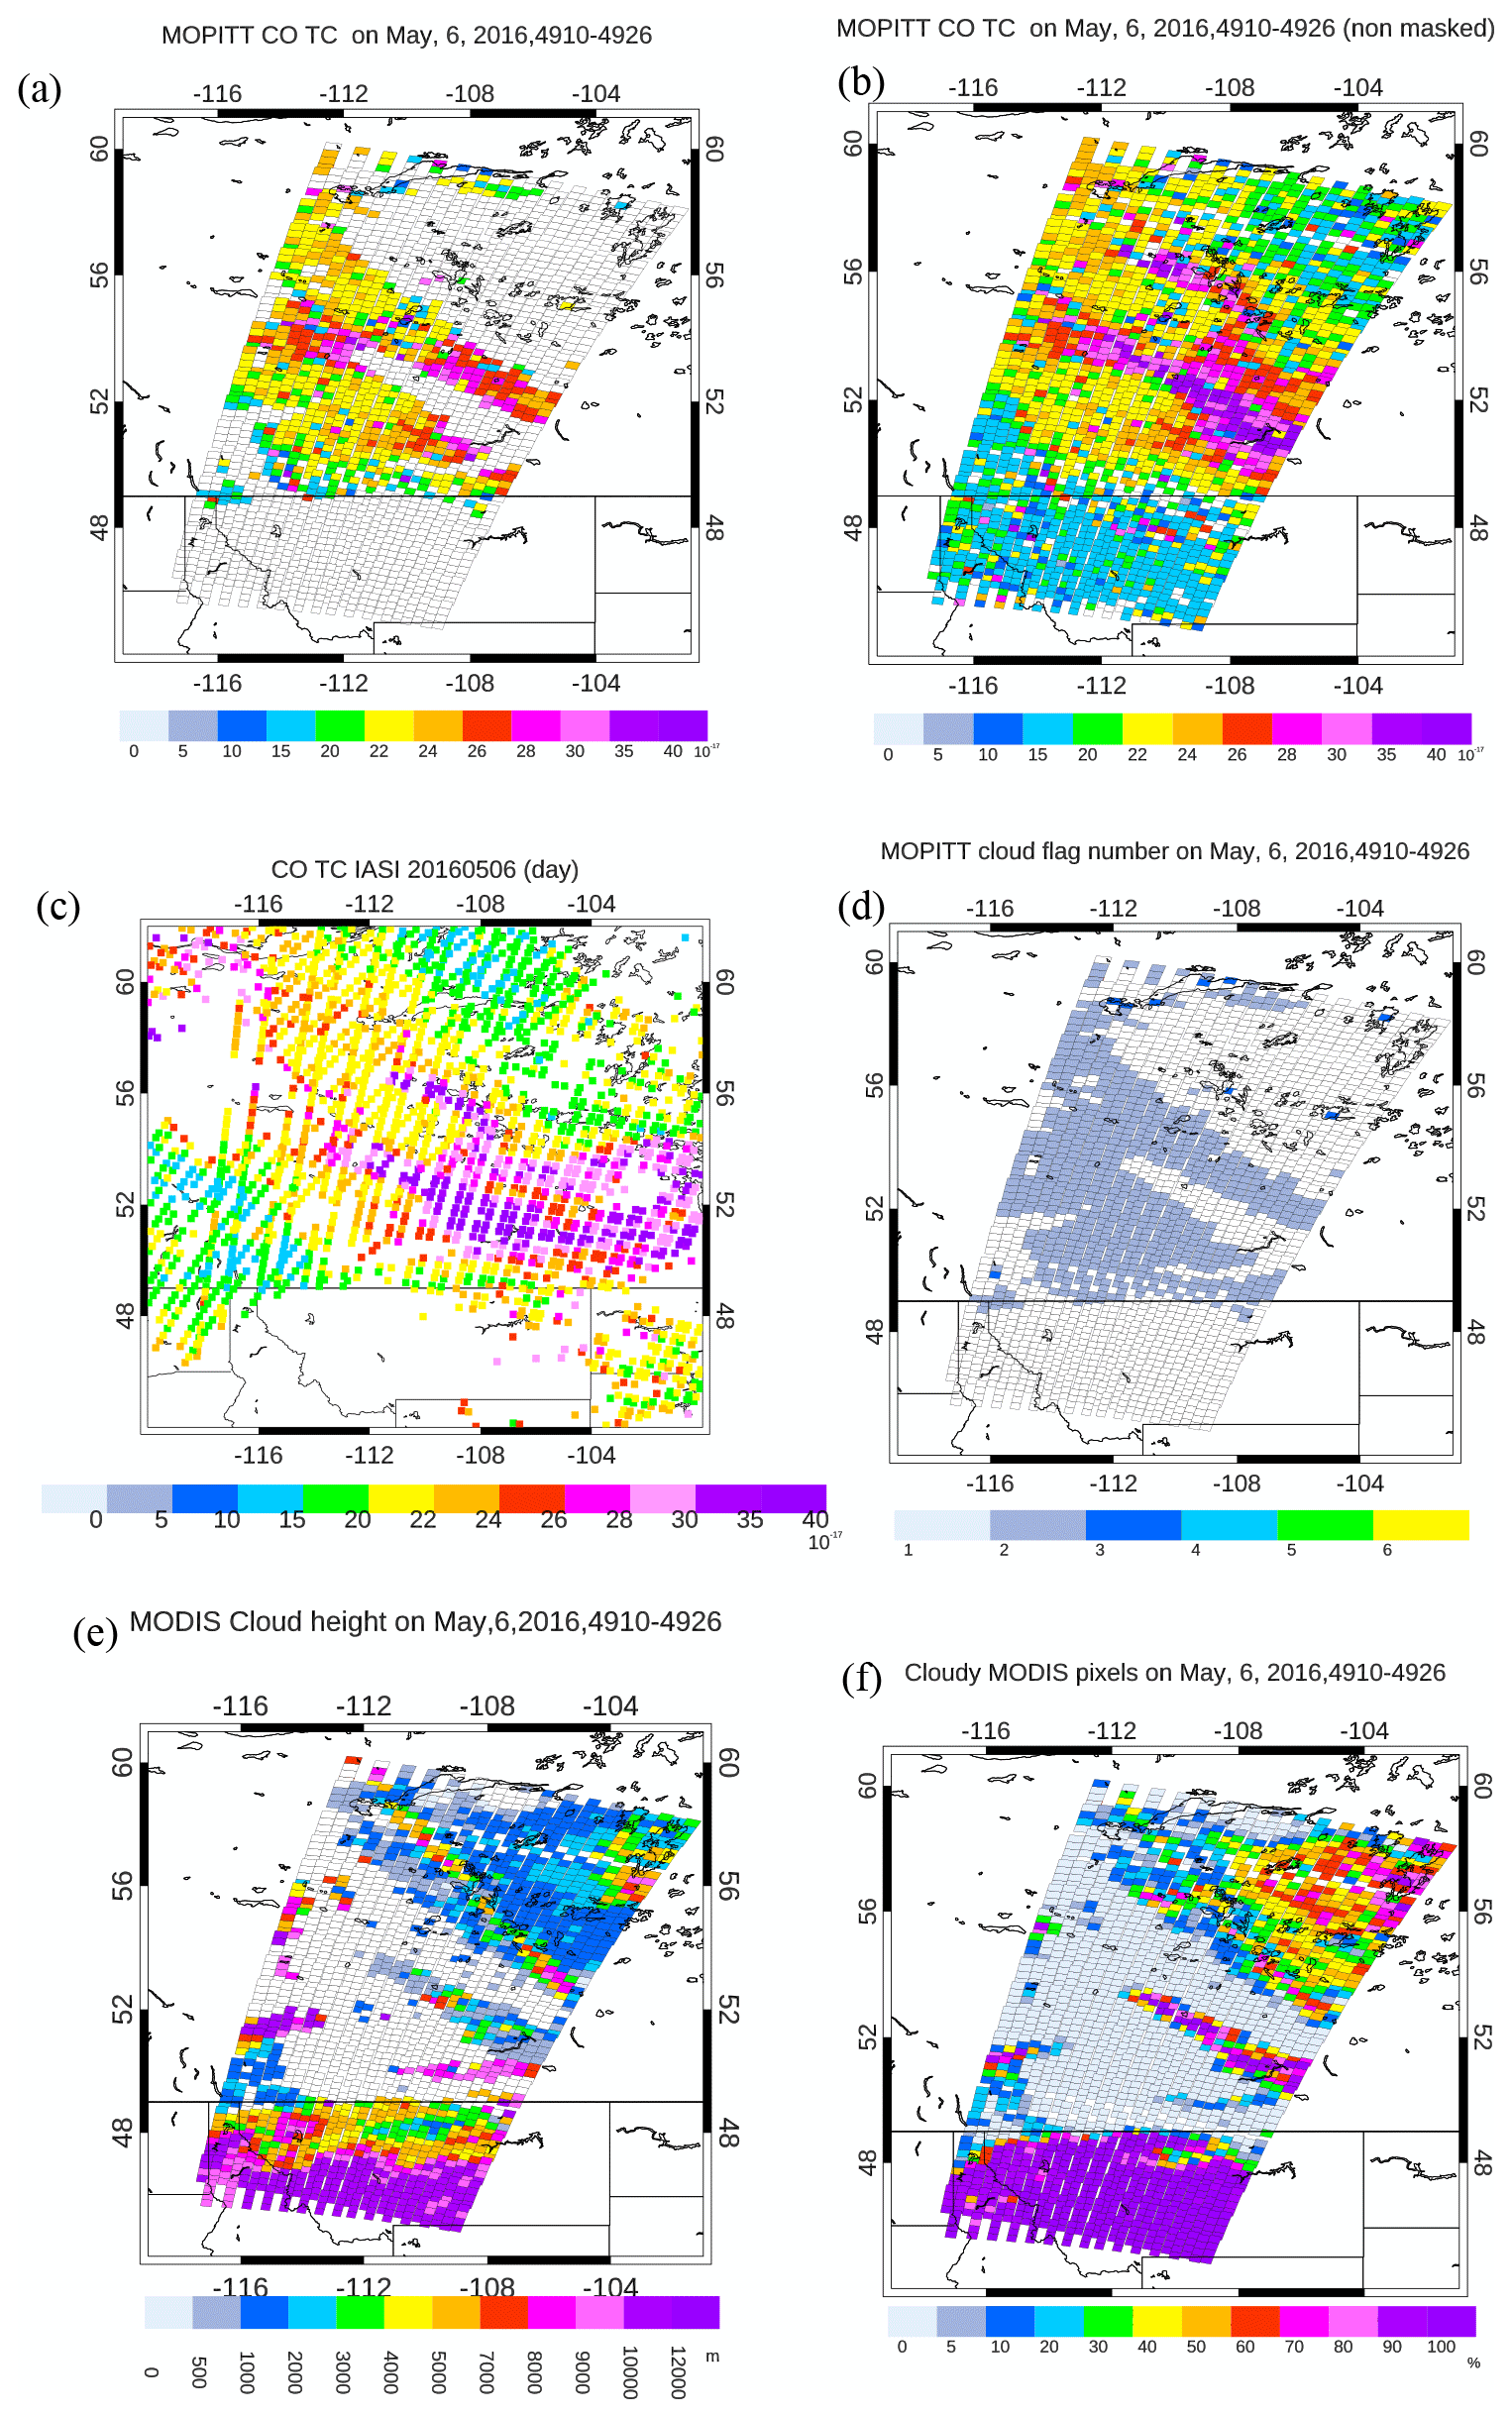
Figure 8The same as Fig. 3 but for 6 May 2016.
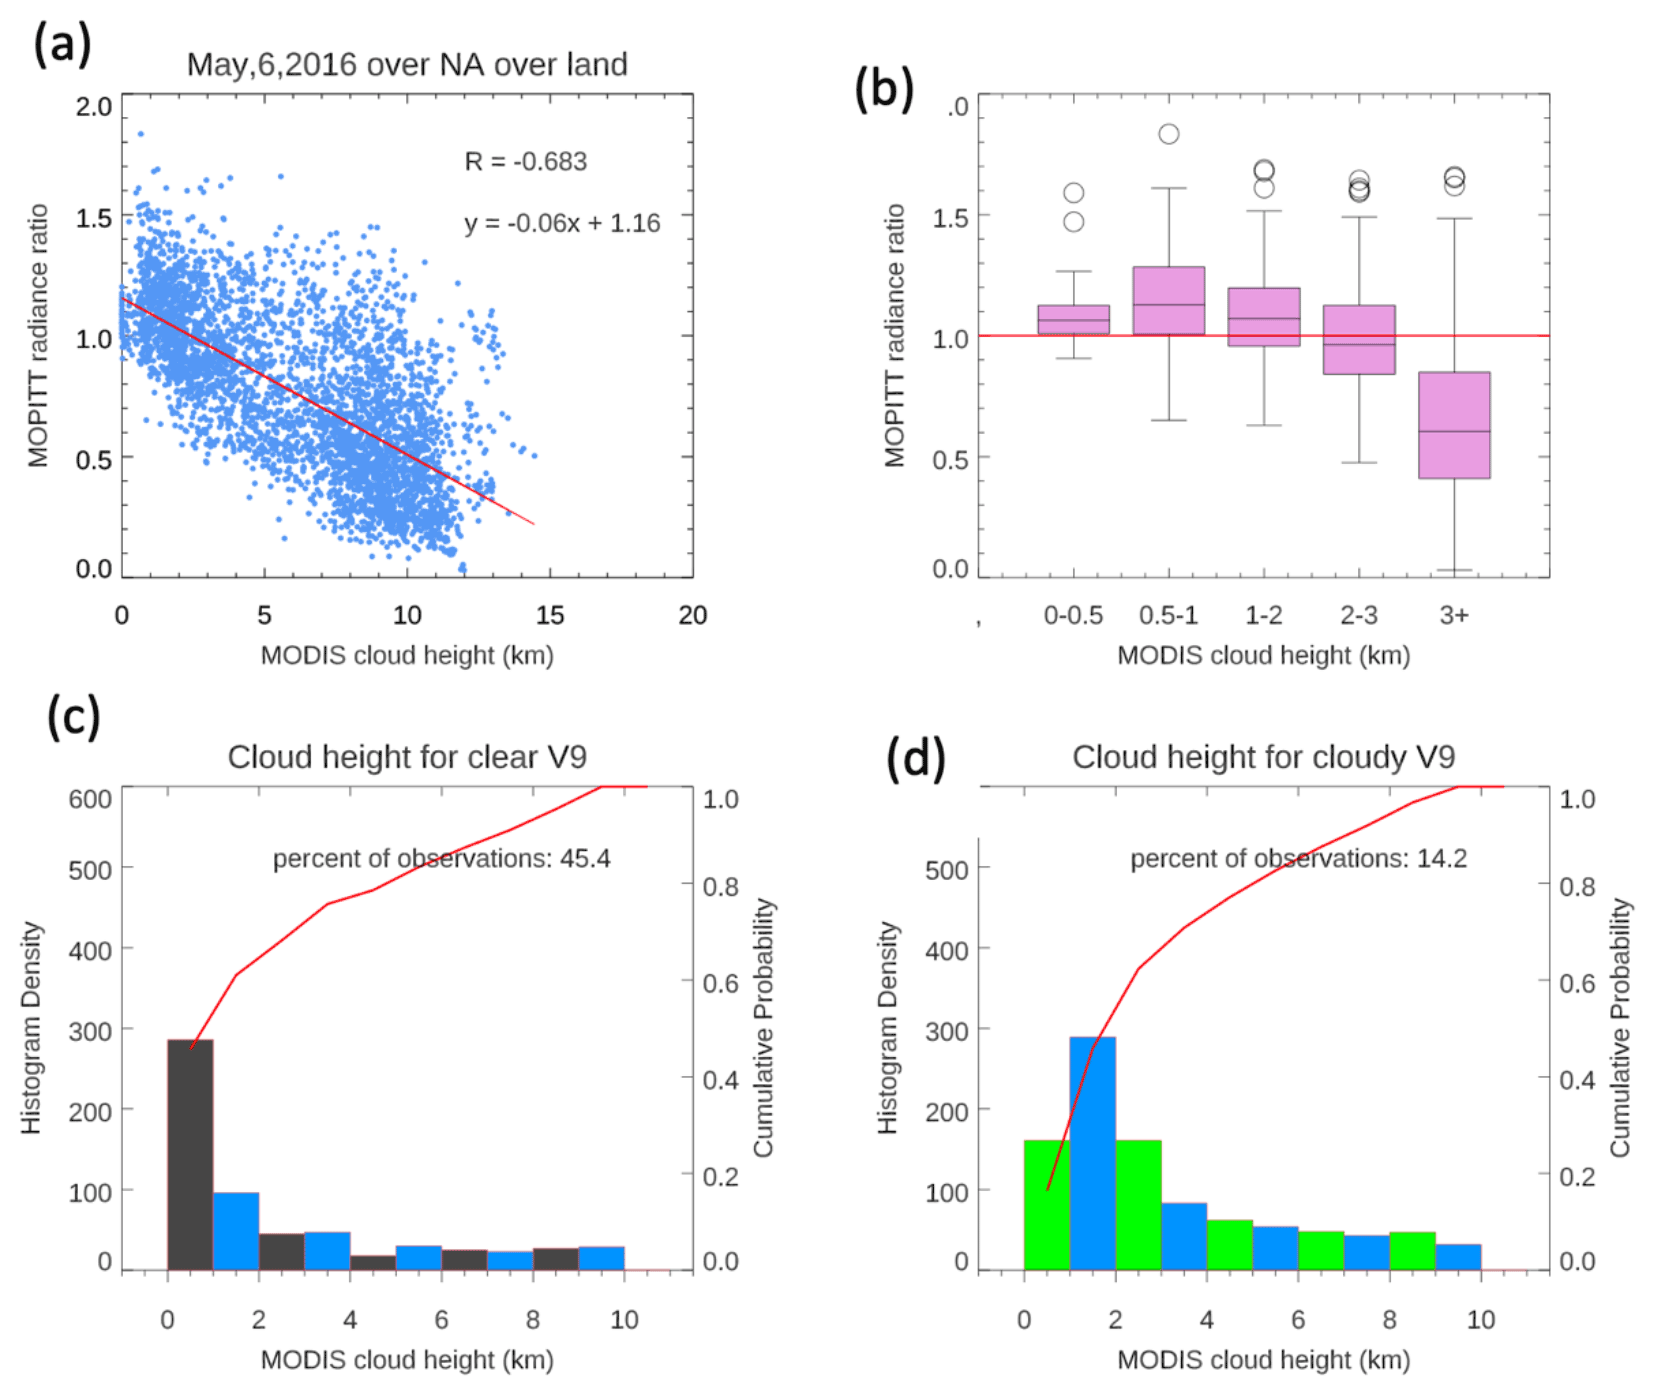
Figure 9(a) Scatter plot correlation between MOPITT radiance ratio (MRT) and MODIS cloud height, (b) a box-and-whisker plot of MRT and various MODIS cloud height groups, (c) the histogram density of MODIS cloud heights of MOPITT clear/MODIS clear observations, and (d) the histogram density of MODIS cloud heights of MOPITT clear/MODIS cloudy observations on 6 May 2016.
Figure 6d depicts the V8 MOPITT cloud index (see Table 1), for the case on 16 August 2018. Retrievals were assigned cloud index 2 (MODIS and MOPITT clear, grey color), 3 (MODIS clear and MOPITT cloudy, dark blue), and 4 (low clouds, cyan color). Figure 6d shows that the V8 L2 data on 16 August 2018 case were retrieved based on clear and low-cloud conditions as indicated by flag number 2 and flag number 4. Figure 6e displays the MODIS cloud height (and cloud mask for the same swath on 16 August 2018). Comparing the low-cloud retrieval area (cyan color) to the corresponding MODIS cloud height (Fig. 6e) and cloud mask (Fig. 6f), it can be seen that this area has cloud percent (the term “cloud” encompasses water clouds and aerosols) by more than 90 % and has cloud heights less than 1 km, as illustrated by the grey color (Fig. 6e). The MODIS cloud height also shows other areas that have low clouds (grey and blue colors) where there were no retrievals in the V8 standard product. Those pixels collocate with the coherent pattern region (between 52–54∘ N) that was shown in the non-masked product (Fig. 6b). Therefore, it appears that some of the potential retrievals were missed in the V8 standard retrieval due to misidentification of low-cloud pixels. It is necessary to examine additional cases using the same approach to determine whether these findings are widespread.
4.4 Analysis of V8 cases under different cloud and pollution conditions
In this section, additional cases are investigated by analyzing the cloud-filtered (V8 standard) and the non-cloud-masked along with the MODIS cloud height and cloud mask products. Figure 7 shows the results over Canada on 12 April 2010, and it indicates that about 70 % of the data are missing in the standard retrievals (Fig. 7a). However, the non-cloud-masked product (Fig. 7b) captures notable features between 54–56∘ N and 90–98∘ W (as indicated by the red colors in Fig. 7b). The MOPITT cloud flag description on 12 April 2010 (Fig. 7d) reveals that all L2 data were retrieved under clear conditions (MODIS cloud percent less than 5 %) as indicated by the flag number 2 (grey color) and the MOPITT diagnostics data (Fig. 7c). However, the corresponding MODIS cloud height (Fig. 7e) showed an area of very low cloud heights that are less than 500 m (around 54–56∘ N), where the MOPITT measurements were not retrieved completely in the V8 standard product as they were considered cloudy (with more than 5 % cloud cover; see Fig. 7f). Comparing this area to the collocated non-masked CO product (Fig. 7b), it can be noted that it exactly matches the coherent pattern that was observed between 54–56∘ N. Looking to IASI CO TC for the same time and location on 12 April 2010 (Fig. 7c), it can be seen that most of the CO features in the area of 52–56∘ latitude and −100 to −92∘ longitudes (Fig. 7b) are not captured as well due to their cloud detection scheme.
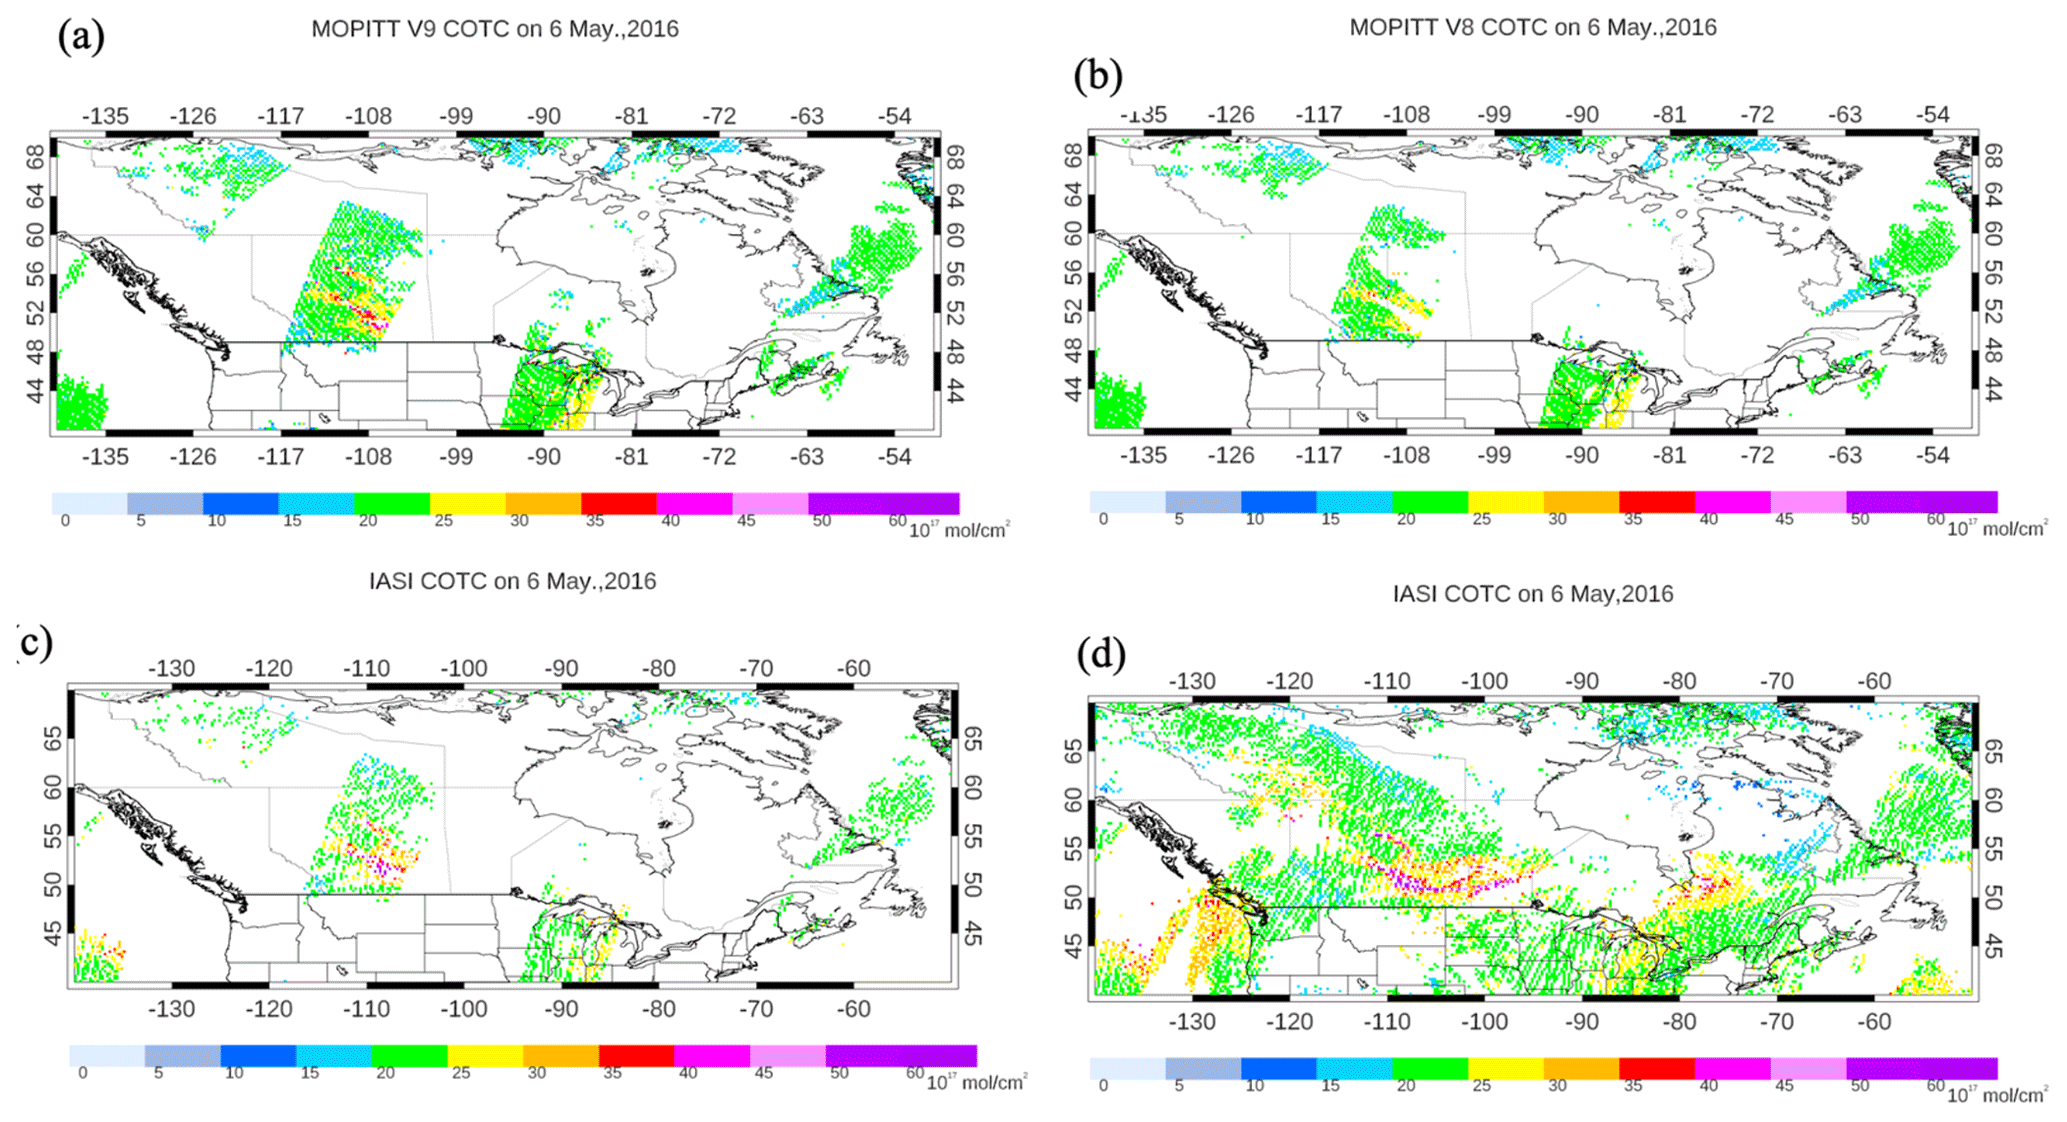
Figure 10MOPITT CO total column for V9 (a) and V8 (b). IASI CO total column observations of the corresponding with MOPITT (c) and the entire IASI CO retrievals (d) on 6 May 2016.
An unusually active forest fire season occurred in the vicinity of Fort McMurray, Alberta, in May 2016. Figure 8a and b display the V8 standard and non-standard CO TC on 6 May (day), respectively. Again, the non-standard CO product exhibits a notable coherent pattern over some areas that were not retrieved in the standard product. On 6 May 2016, there is a CO plume around 50–52∘ N and 108–112∘ W longitude that is indicated by the purple colors (Fig. 8b), and it is completely missed in the V8 standard product. On the other hand, IASI shows a consistency with the non-masked MOPITT product where a prominent CO plume was observed around 50–56∘ latitude and −112 to −104∘ longitude, which coincides with the corresponding MOPITT (Fig. 8b).
The elevated CO values on 6 May 2016 are likely to be a result of Fort McMurray fire emissions in northern Alberta (as indicated by MODIS fire images, not shown). Considering the low-cloud detection during the Fort McMurray fires, the MODIS cloud height data of the corresponding MOPITT pixels on 6 May 2016 (Fig. 8e) suggest that none of the low-cloud (blue colors) pixels were retrieved in the standard product, as is implied by the MOPITT flag number (Fig. 8d) (all values are 2).
4.5 MODIS height comparison with MOPITT radiance ratio
As is mentioned in Sect. 3, the MOPITT retrieval algorithm only retrieves CO in clear-sky conditions. The cloud detection scheme utilizes information from both the MODIS cloud mask product and MOPITT's thermal-channel radiances (Warner et al., 2001). Radiance from the MOPITT 4.7 µm thermal channel is compared to the calculated model for each pixel. If the measured/calculated radiance ratio is greater than the threshold (which is one for V8), then the observation is considered “clear”.
In MOPITT V8 and before, the MODIS test value supersedes the MOPITT test value over land; i.e., the MOPITT pixel will be considered “clear” if the MODIS test is “clear” and the MOPITT test is “cloudy”. However, the MOPITT pixel will be considered “cloudy” if the MOPITT test identifies the pixel as clear and the MODIS test identifies the pixel as cloudy. Hence V8 level 2 retrievals are processed over land just if the MODIS test is passed. For the MOPITT V9 product, Deeter et al. (2021) modified the cloud detection algorithm by allowing CO retrievals when the MOPITT radiance ratio (MRT) test indicates the pixel is clear although the MODIS cloud mask test assigns the pixel as cloudy. Deeter et al. (2021) modified the cloud detection algorithm by allowing CO retrievals when the MOPITT radiance ratio test indicates the pixel is clear although the MODIS cloud mask test assigns the pixel as cloudy.
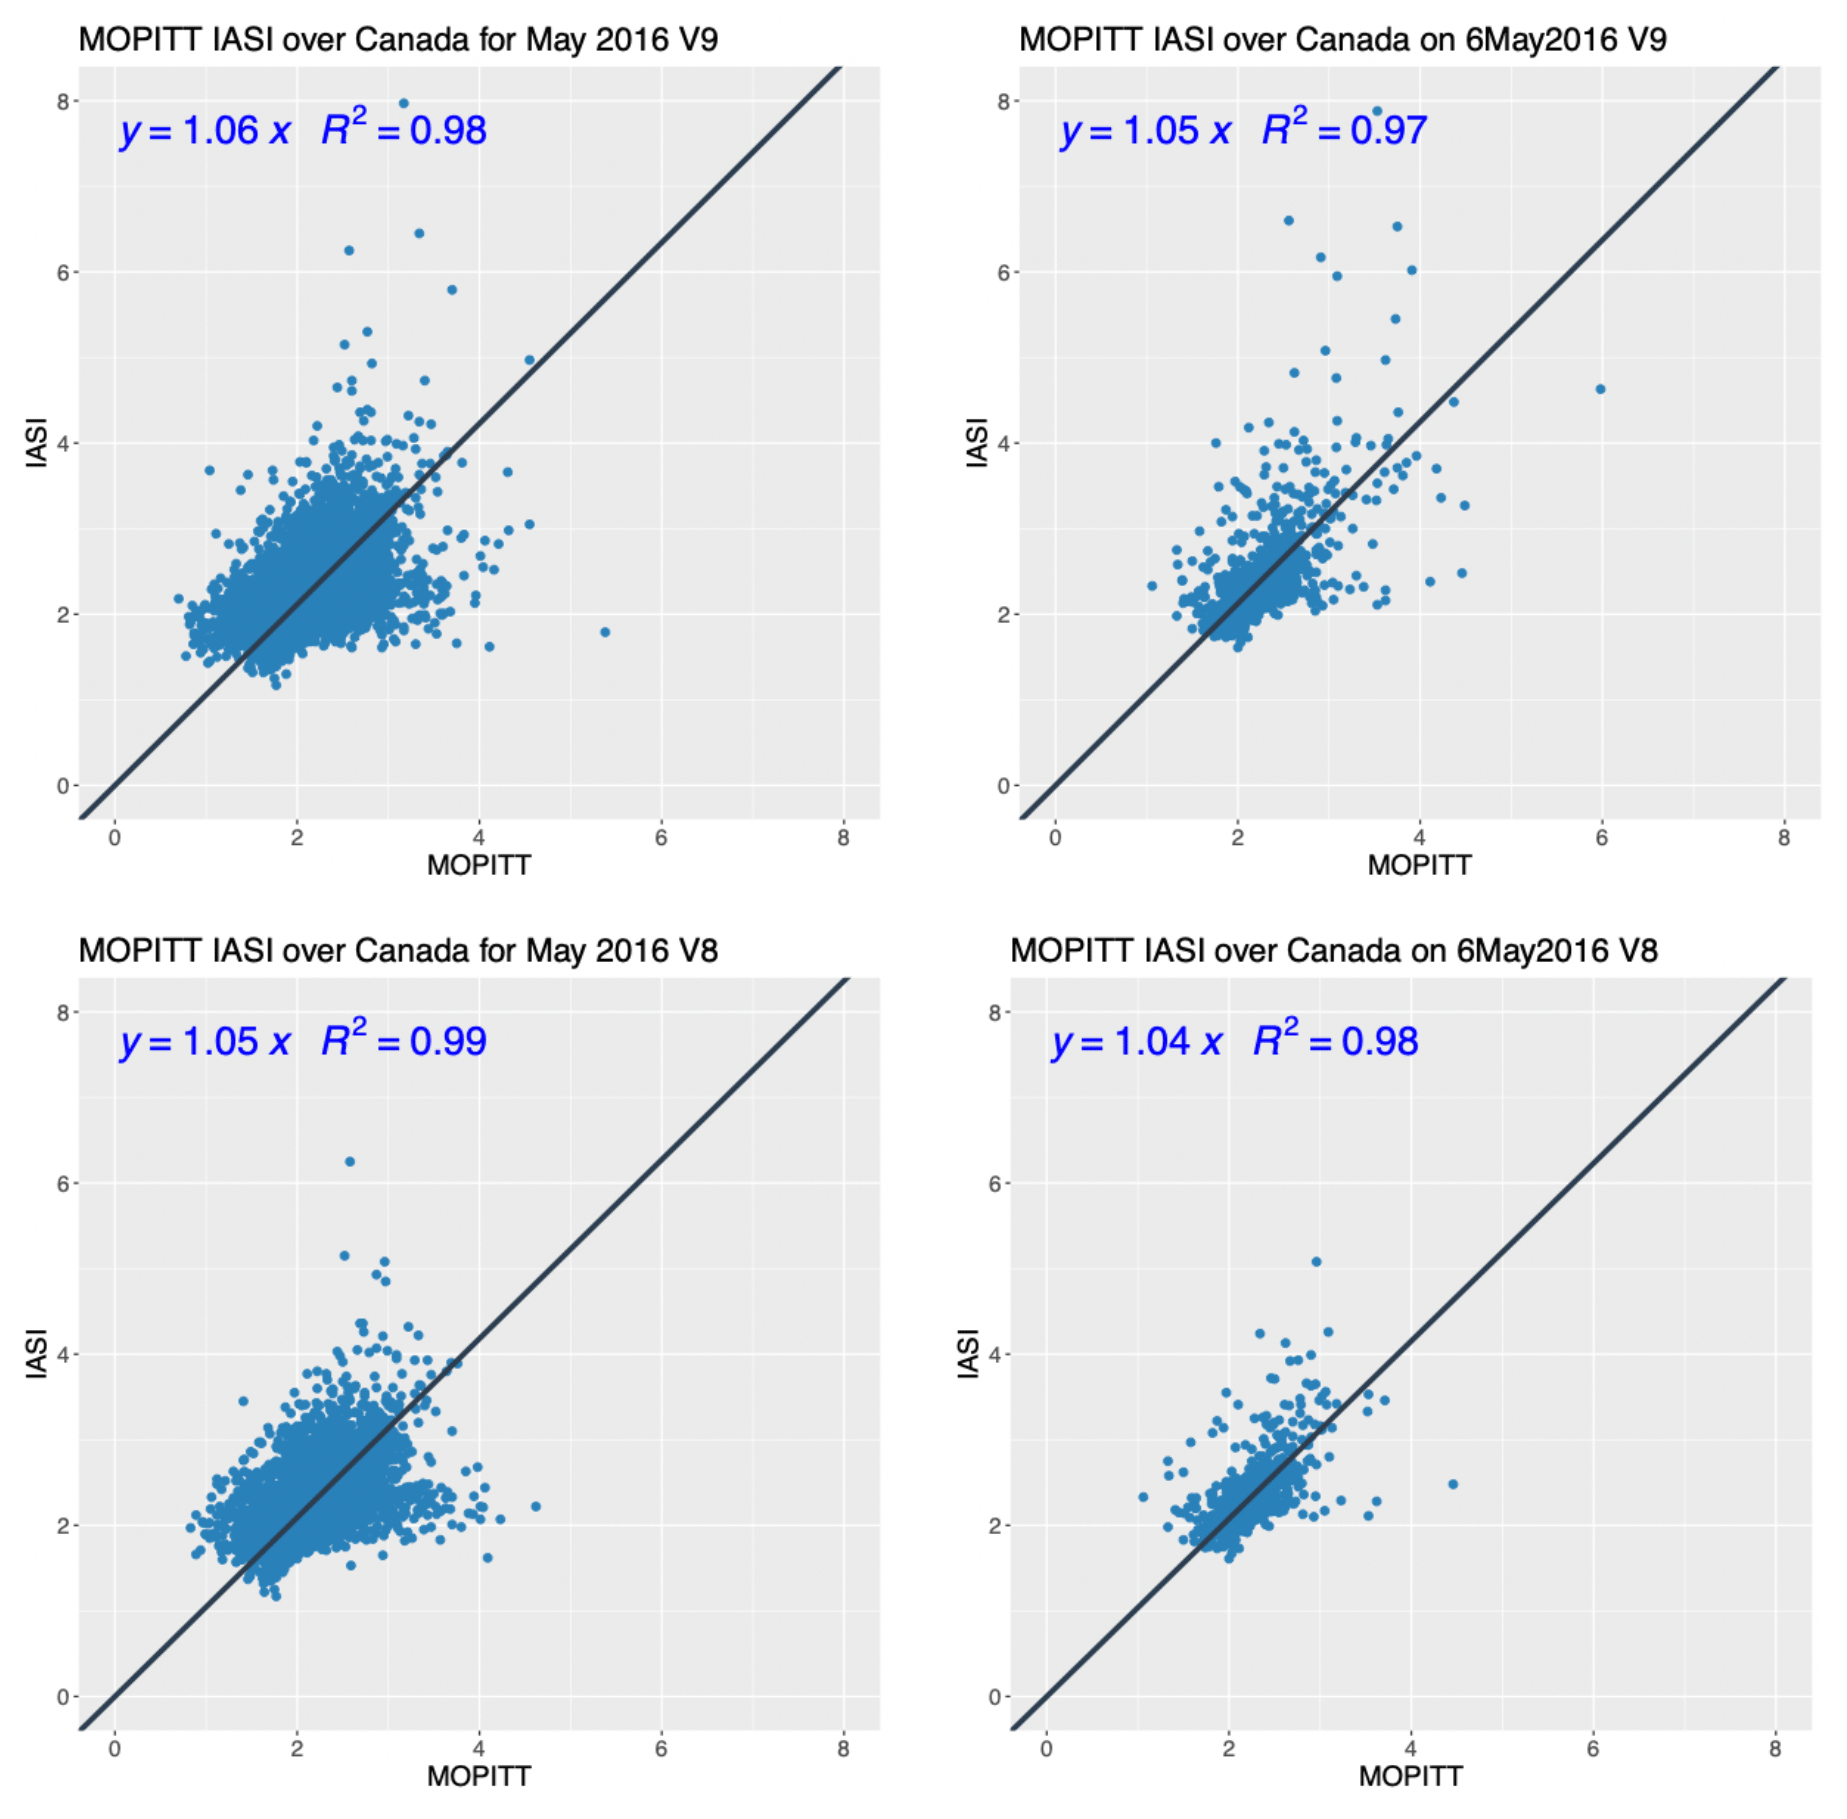
Figure 11Scatter plots of the IASI and MOPITT CO retrievals in 1018 molecules cm−2, for 6 May 2016 and the monthly averaged May 2016. The correlation coefficient and the regression slope are reported.
To understand how the new V9 cloud detection scheme improved the coverage rate, an analysis of the MRT and MODIS cloud height has been conducted for many cases over Canada. The data on 6 May 2016 are presented here as a case study and are shown in Fig. 9. It can be seen that there is a negative correlation between the MRT and MODIS cloud height, with a slope of −0.06 and a correlation of R = 0.68.
A box-and-whisker plot of MRT and the corresponding MODIS cloud heights for various groups are displayed in Fig. 9b. Since the modified cloud detection scheme of V9 relies on the MRT threshold test (the threshold value is 1), it is expected that most of the observations with cloud heights up to 3 km are incorporated in V9 retrievals, as illustrated in Fig. 9b.
Figure 9c and d depict the histogram density of MODIS cloud heights of the corresponding MOPITT clear/MODIS clear observations and MOPITT clear/MODIS cloudy, respectively on 6 May 2016. The successful retrievals using MOPITT clear/MODIS clear pixels and MOPITT clear/MODIS cloudy are 45.4 % and 14.2 %, respectively.
Since MRT correlates negatively with the low cloud heights (as indicated above in Fig. 9a), the low-cloud cases are included in V9 (Fig. 9d), with a high proportion of heights less than 3 km. Hence, adding low-cloud observations as a result of considering MRT values of greater than 1 enhances the MOPITT coverage percentage by 14.2 % compared to 45.4 % successful retrievals without considering the low-cloud cases. The total coverage rate is about 60 % with about a 30 % (14.2/45.4) gain in data coverage. Therefore, using the MRT cloud test independently in V9 cloud detection scheme resolved the problem of low-cloud miss-detection over land, which results in a significant data coverage increase, especially over the region of Canada.
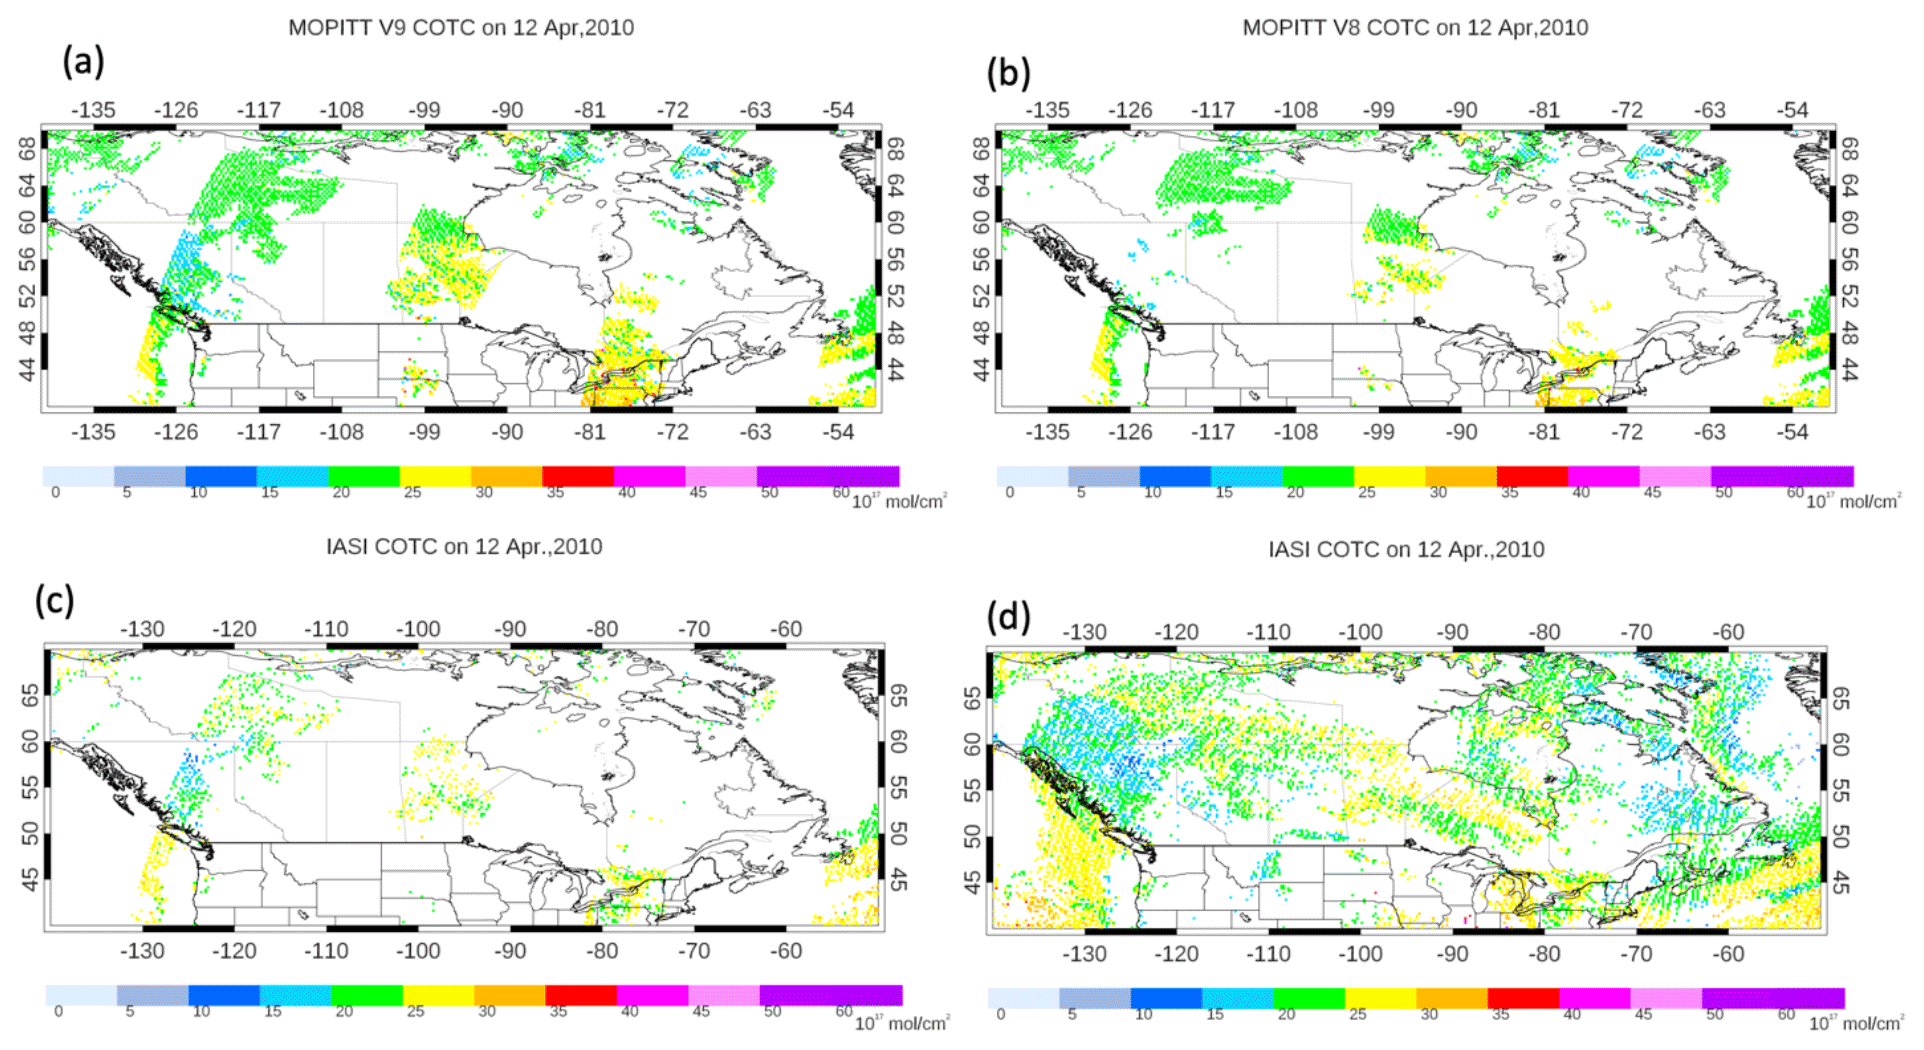
Figure 12The same as Fig. 10 but for 12 April 2010.
4.6 MOPITT and IASI comparison
We examine the impact of the increased observational coverage in the MOPITT TIR V9 product in comparison to IASI data over Canada for three case studies. The first and third cases are associated with biomass burning emissions (6 May 2016 and 16 August 2018), while the second case represents typical conditions with no extreme air pollution (12 April 2010). Figure 10 shows maps of 1 d/morning overpasses of CO total columns measured by MOPITT and IASI on 6 May 2016. Figure 10a and b show MOPITT V9 and V8 data, respectively, while Fig. 10c and d show the corresponding IASI data (collocated with MOPITT) and the entire IASI CO field (gridded in 0.25∘ × 0.25∘ bins), respectively. As seen in Fig. 10a and b, there is a gap with missing MOPITT data in V8 that extends across Alberta and Saskatchewan between 110 and 100∘ W, but the data are present in V9 as a result of the improved retrievals in low-cloud conditions (as indicated by the MODIS cloud heights in Fig. 8e). The high CO total column values that are added in the MOPITT V9 product coincide with the high aerosol optical depth (AOD) and OMI UV Aerosol Index (UVAI) values (not shown) from the Fort McMurray fire emissions. Smoke was transported from the eastern part of Alberta, moving into Saskatchewan and central Alberta in the vicinity of the high CO values. Interestingly, the added retrievals in V9 exhibit a pattern that is consistent with the IASI data (Fig. 10c). Since IASI has daily global coverage compared to MOPITT's 3 d global coverage, the entire smoke plume is captured by IASI (Fig. 10d).
Figure 11 depicts the scatter plots of IASI and MOPITT TIR V9 and V8 retrievals over Canada on 6 May 2016 and for the entire month of May 2016 (monthly average). IASI and MOPITT data are gridded in 0.25 × 0.25∘, and then the daily collocated data are selected for the analysis.
In general, IASI and MOPITT retrievals are consistent to a large extent with a correlation coefficient of 0.98–0.99 and 0.97–0.98 for V8 and V9, respectively. However, IASI has higher values than MOPITT over Canada, with the slope varying from 1.04 to 1.06. Total CO column biases for V9 are somewhat larger than for V8 products; with a slope for V9 of 1.05 and 1.06, whereas for V8 it is 1.04 and 1.05 for data on 6 May 2016 and for all of May 2016, respectively. These discrepancies occur at high CO values, and since the added data in V9 are mainly in heavily polluted regions, the IASI bias is greater for V9 than V8.
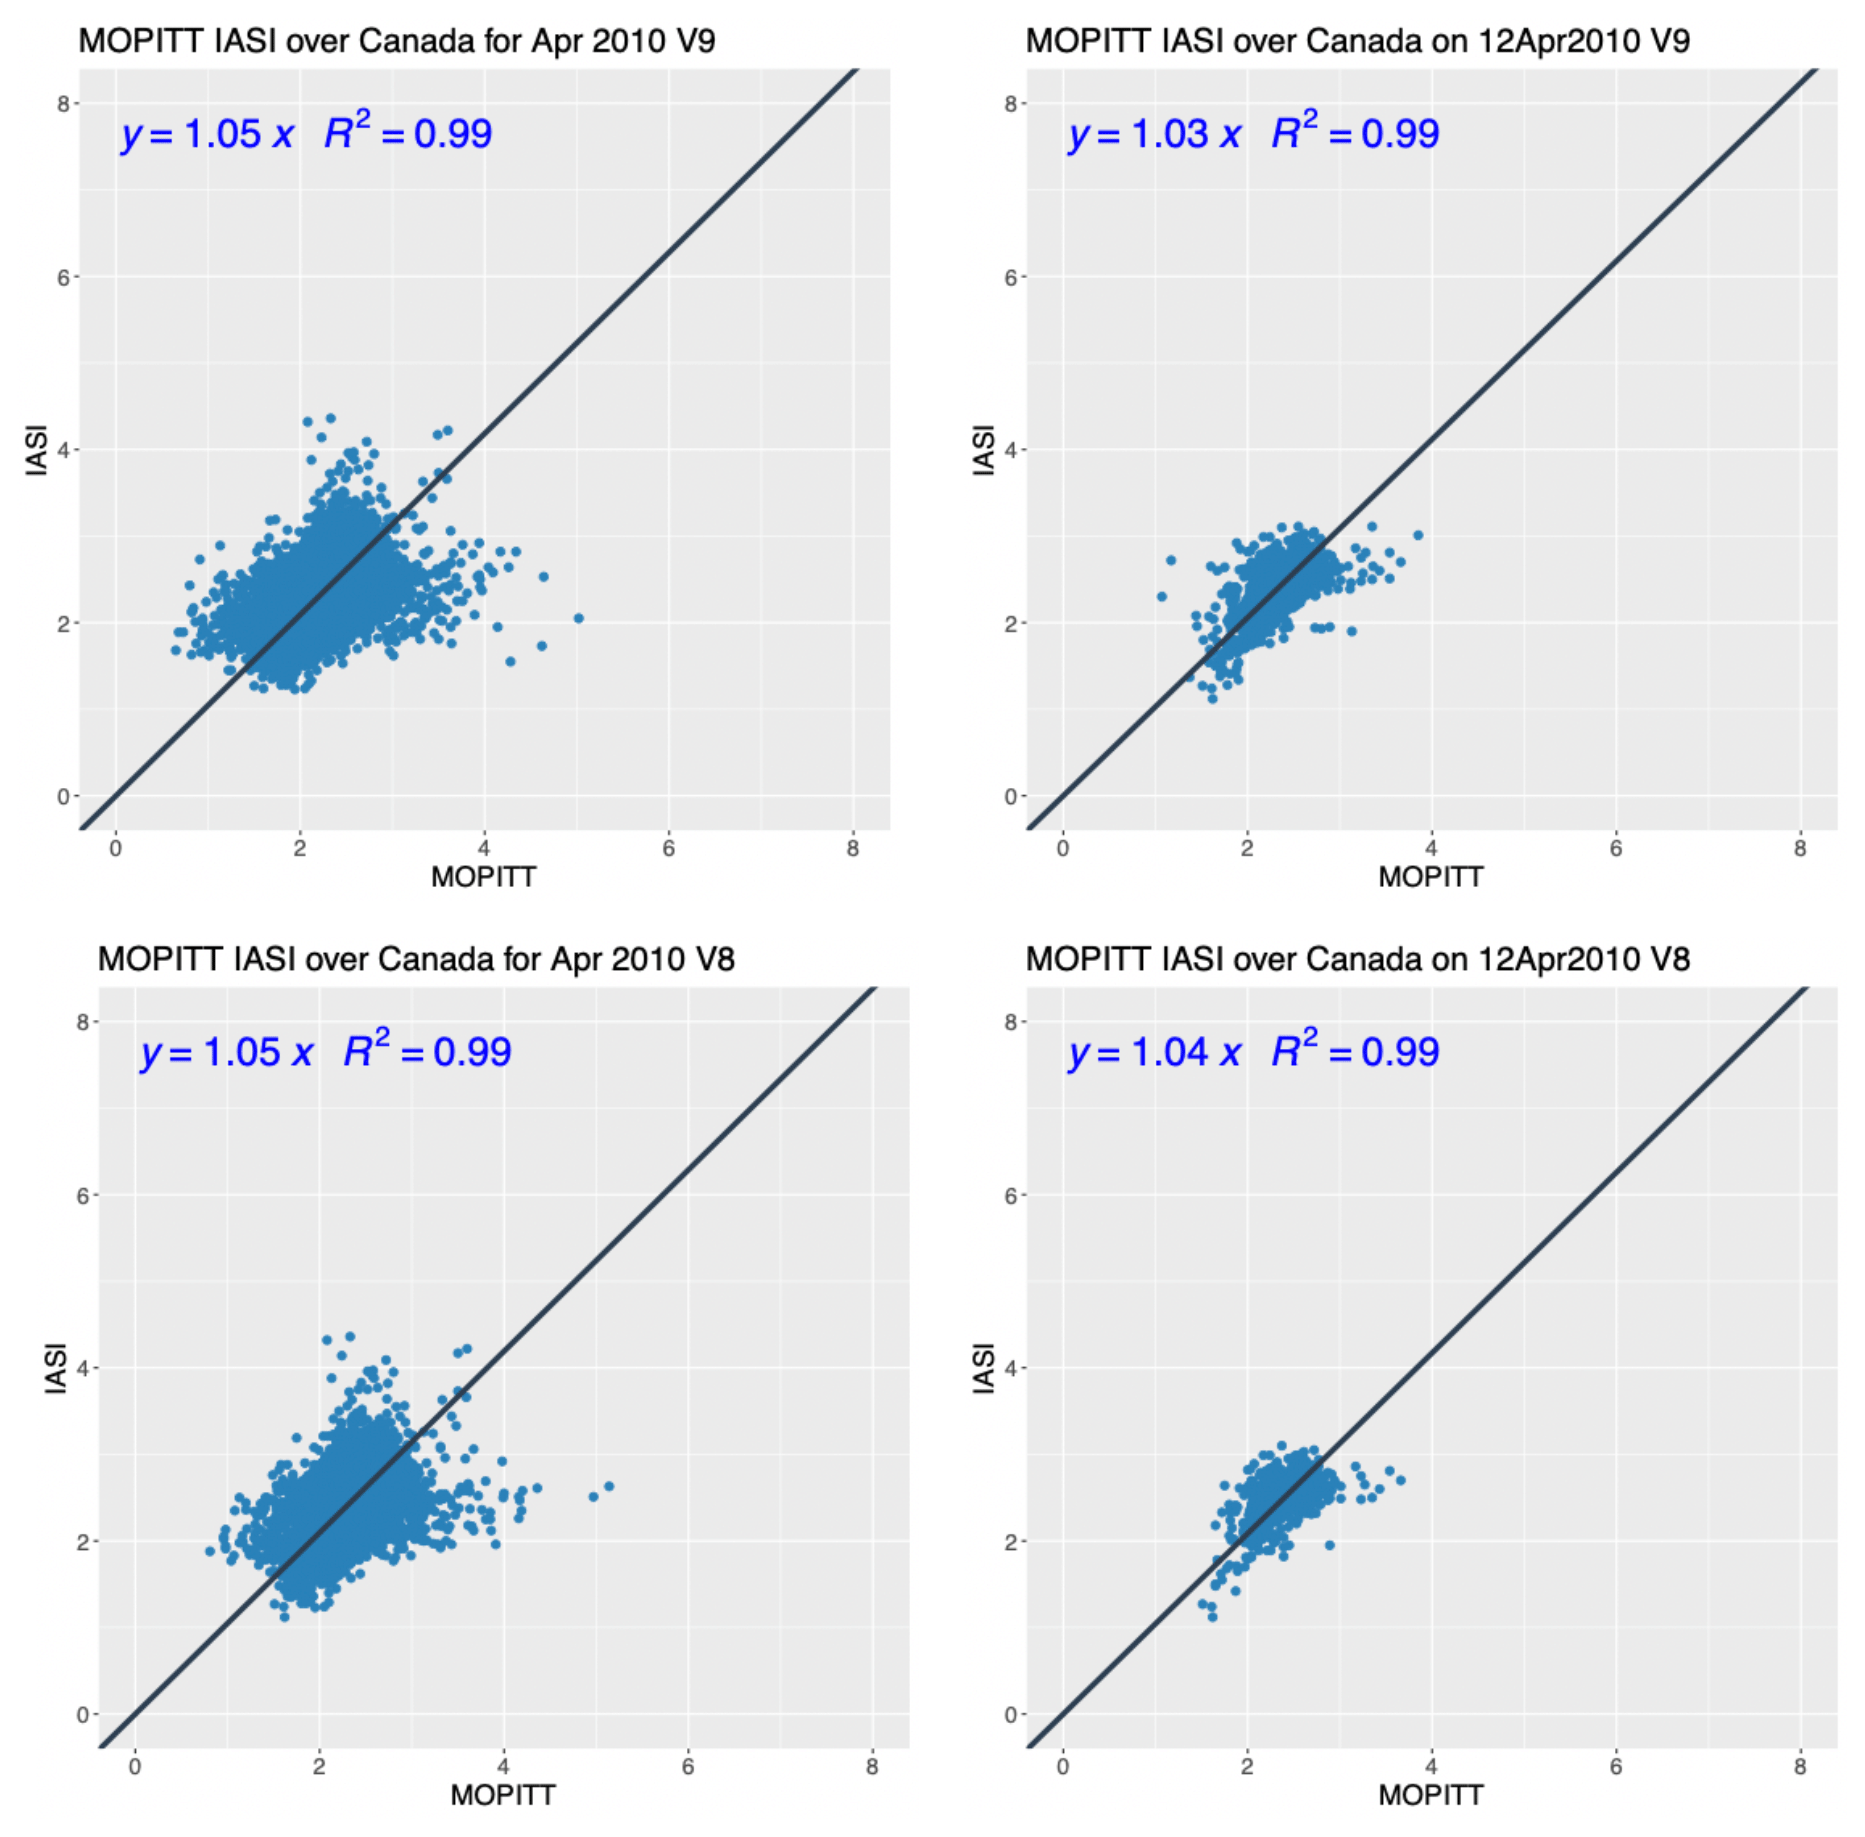
For the second case analysis on 12 April 2010, V9 (shown in Fig. 12a) exhibited greater data coverage relative to V8 (Fig. 12b) around 126∘ W, 56–60∘ N, 90∘ W, 56–60∘ N, and 80∘ W, 44∘ N as a result of retrievals of low cloud height pixels (Fig. 7e). Figure 12c shows generally good agreement between IASI CO total column values and corresponding MOPITT retrievals. As this time of year has no extreme air pollution sources (such as forest fire emissions), the CO total column values over land are in the range of 20–30 × 1017 molecules cm−2, which can be seen in the whole IASI CO total column field in Fig. 12d. Consequently, as shown in Fig. 13, the IASI biases with MOPITT V8 and V9 are generally similar, with comparable correlations and slopes.

Figure 14The same as Fig. 10 but for 16 August 2018.
Comparison of MOPITT V9 and V8 on 16 August 2018 over Canada, in Fig. 14, shows the greater number of successful MOPITT retrievals in V9 that were discarded in V8. The added data in V9 are around 80–90∘ W, 50–56∘ N and 100–117∘ W, 54–56∘ N. These regions are associated with cloudy areas of relatively low cloud heights, as indicated by the MODIS cloud mask and height (Fig. 6e and f). As shown in Fig. 14c, the IASI observational pattern is generally consistent with the corresponding MOPITT CO total columns. However, there is an apparent positive IASI bias around 80–90∘ W and 54∘ N where IASI CO values exceed 50 × 1017 molecules cm−2 compared to 30 × 1017 molecules cm−2 for MOPITT. These high CO values are associated with the dense pollution plume that extends across Canada as shown in the map in Fig. 14d with the whole IASI observational scene and in Fig. 15a with the MODIS Terra image overlaid with the thermal anomaly spots.
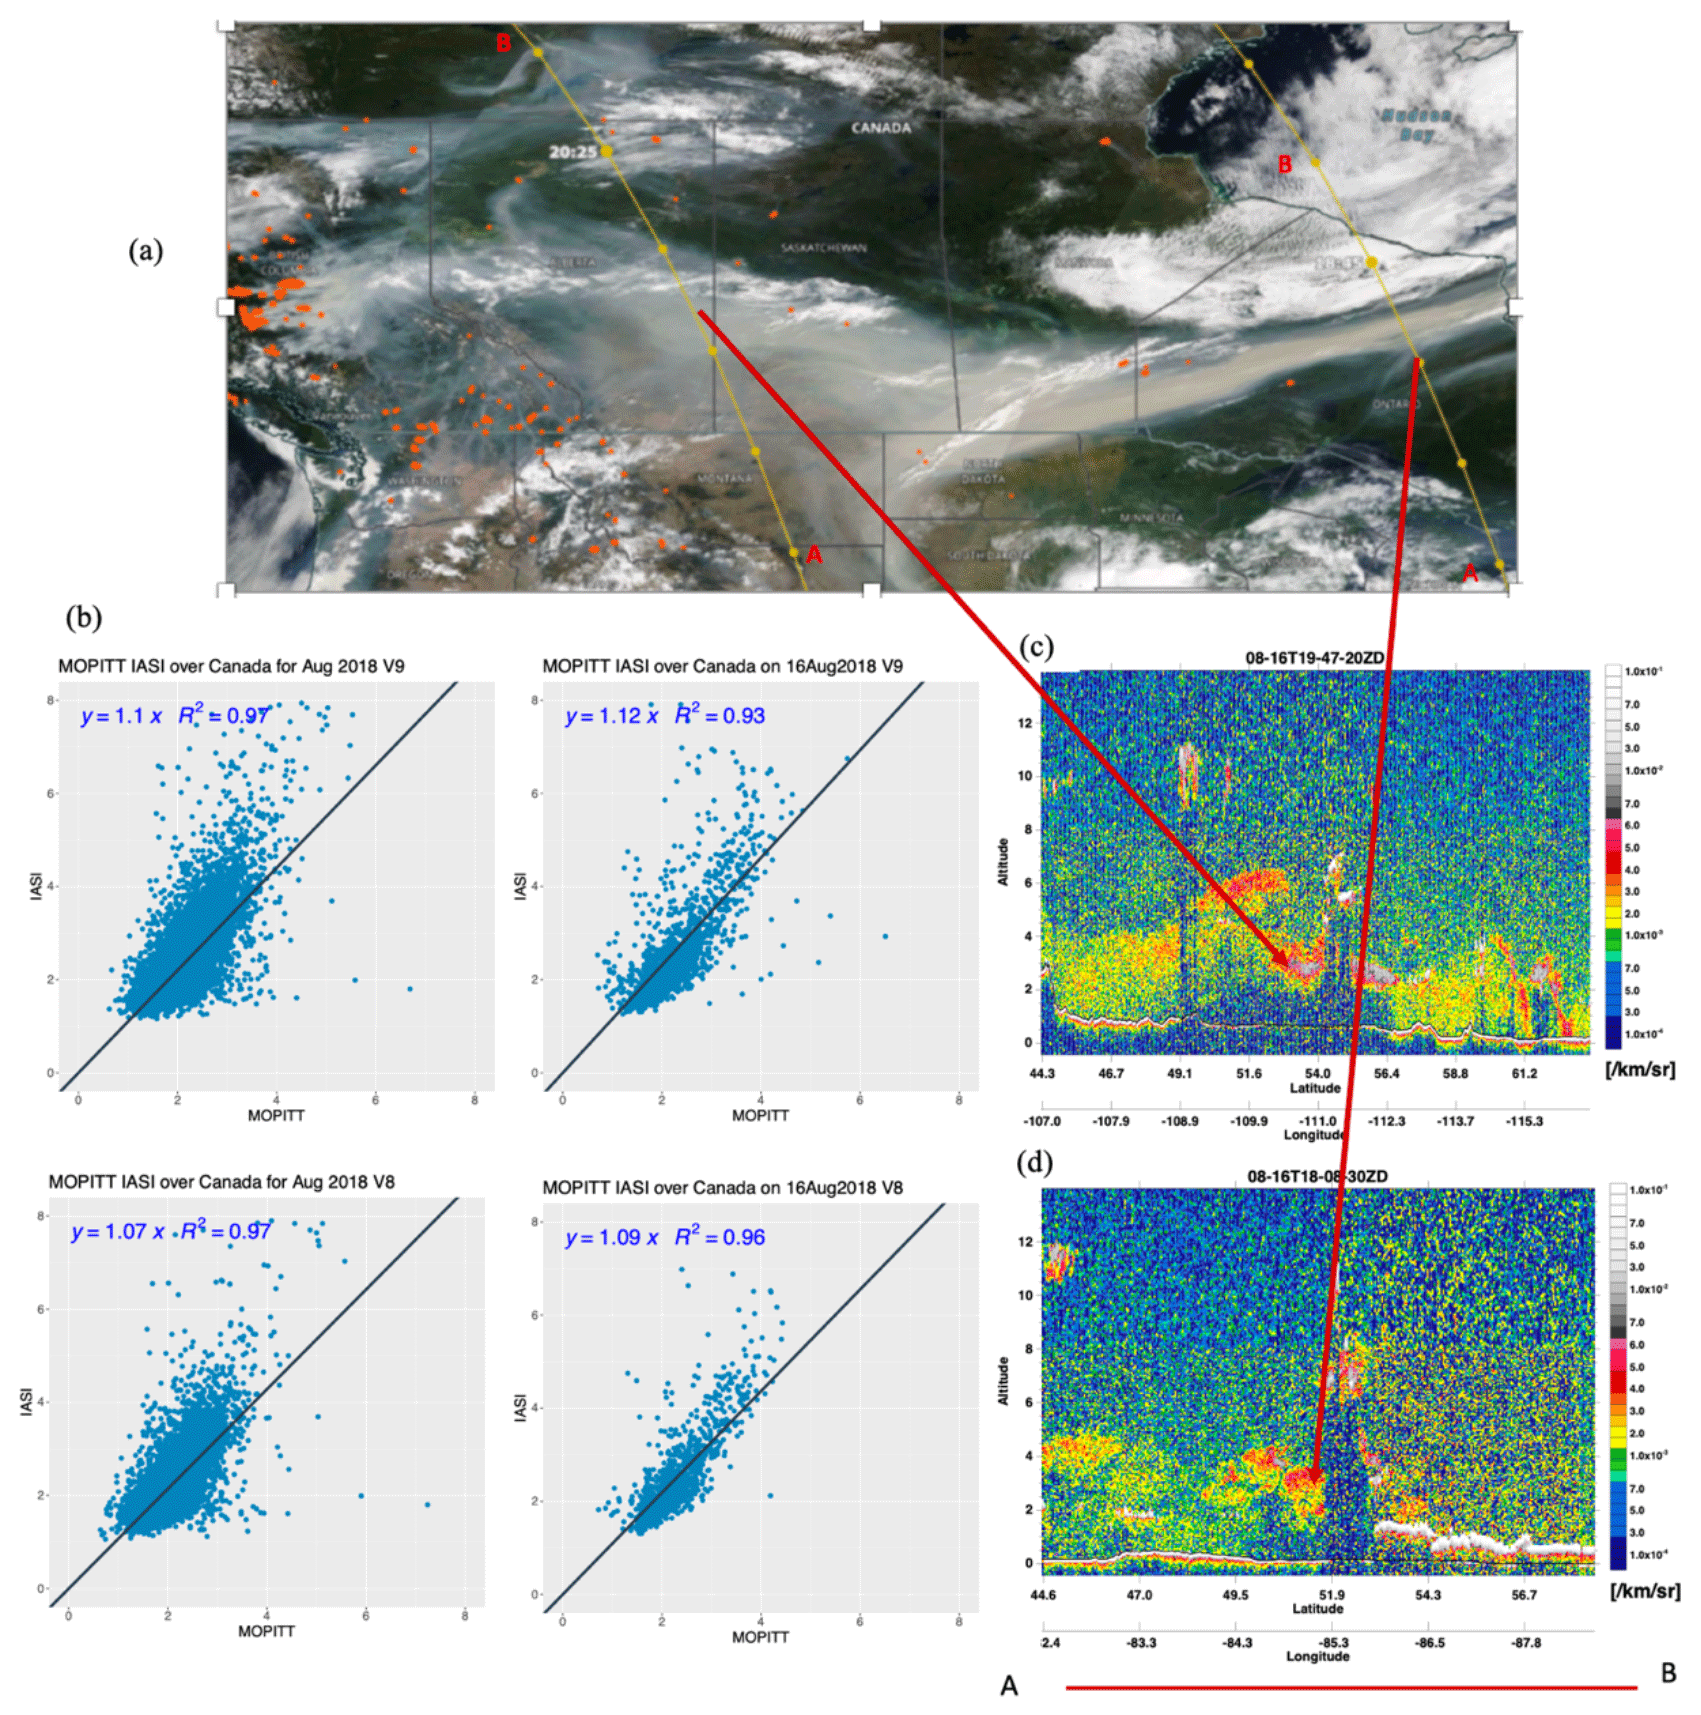
Figure 15(a) MODIS Terra overlaid with fire points (red points), (b) scatter plots between IASI and MOPITT TIR V9 and V8, and (c–d) daytime CALIPSO 532 nm total attenuated backscatter on 16 August 2018.
The scatter plots of CO total column values between IASI and MOPITT TIR V9 and V8 for August 2018 are shown in Fig. 15b. The slopes of the relationship between IASI and MOPITT V8 data on 16 August 2016 and for all of August are 1.09 and 1.07, respectively. Since the added MOPITT retrievals in V9 are associated with higher CO total column values, the slopes increase to 1.12 and 1.1, respectively, with smaller correlation coefficients. CALIPSO total attenuated backscatter at 532 nm on 16 August 2018 for the two yellow swaths shown in Fig. 15a are presented in Fig. 15c and d. The smoke aerosols were observed at altitudes between 2 and 6 km, as measured by CALIPSO, indicating that convective lofting may have elevated the fire emissions above the boundary layer into the free troposphere. The large CO enhancements observed by IASI around −80–90∘ W and 54∘ N (Fig. 14c) are collocated with the maximum aerosol backscatter coefficient at ∼ 3 km detected by the CALIPSO lidar (Fig. 15d). However, CO in this area is underestimated by MOPITT TIR relative to IASI (Fig. 14b), resulting in 12 % overall bias over Canada on 16 August 2018 (as indicated by the slope of 1.12).
Similar results were found by Turquety et al. (2009) as their study revealed that IASI CO is on average 35 % higher than MOPITT in regions of elevated CO concentrations during extreme fire events. There are many factors that could explain the discrepancies between IASI and MOPITT during pollution events. One of them is the different horizontal resolution of the two instruments (22 km × 22 km for MOPITT and a 12 km diameter for IASI), especially above inhomogeneous scenes. A second major factor that could contribute to the differences between the MOPITT and IASI retrievals is the a priori profile used in the retrievals. IASI uses a fixed a priori profile, while MOPITT has variable a priori profiles. George et al. (2015) examined the impact of the a priori profile on the IASI and MOPITT data and found that using the same a priori constraints slightly improved the correlation between the two datasets and reduced the large discrepancies (total column biases over 15 %) observed at some places by a factor of 2 to 2.5. However, other regions did not show any bias reduction. A third factor is the difference in vertical sensitivity between the two instruments, as reflected by their averaging kernel matrices (the sensitivity of the retrieval to the abundance of CO at different altitudes). The instruments have different degrees of freedom for signal (DOFS), which is given by the trace of the averaging kernel matrix; the DOFS of the MOPITT retrievals is lower than the corresponding IASI retrievals (not shown). Although both instruments in general have good sensitivity in the middle troposphere, IASI's averaging kernel indicates greater sensitivity in the upper troposphere as well. The difference in averaging kernels for the instruments can be attributed to instrumental and retrieval factors (George et al., 2015). For example, surface emissivity and water vapor are treated differently in the two retrieval algorithms. The MOPITT algorithm retrieves emissivity simultaneously with CO but uses a fixed water vapor profile from NOAA/National Centers for Environmental Prediction (NCEP), while IASI assumes a fixed emissivity but estimates the water vapor amount (Barré et al., 2015). Understanding how the factors discussed here, as well as others, potentially contribute to the discrepancies between MOPITT and IASI will be further investigated in future work.
In this study, an analysis has been performed to understand the improvements in observational coverage over Canada in the new MOPITT V9 product. Temporal and spatial analysis of V9 indicates a general coverage gain of 15 %–20 % relative to V8, which varies regionally and seasonally. For example, the number of successful MOPITT retrievals in V9 was doubled over Canada in winter.
The standard (cloud-filtered) V8 CO TC (L2) product was compared with a non-standard (non-cloud-masked) version of the retrievals for selected days to understand the observation gain in V9 relative to V8. The results reveal some coherent structures of CO plumes that were observed frequently in the non-cloud-masked product but which were missing in the standard the V8 product. Those features are not captured in the V8 standard product because the cloud detection scheme did not properly detect many low-cloud cases over land.
The modified V9 cloud detection scheme utilizes the MRT test (threshold value of 1) individually, which allows CO retrievals when the MRT test indicates the pixel is clear, although the MODIS cloud mask test assigns the pixel as cloudy. Since MRT correlates negatively with the low cloud heights, most of the low-cloud observations (up to 3 km) are included in V9 L2 retrievals. Hence, the incorporation of the MRT test over land will resolve the low-cloud detection issue, as is demonstrated by MODIS cloud height correlation. Hence, adding low-cloud observations as a result of considering MRT values of greater than 1 enhances the MOPITT coverage percentage.
The improved V9 cloud detection scheme benefits regions that are often characterized by high aerosol concentrations (e.g., biomass burning emissions). An analysis of MOPITT and IASI CO is conducted for three cases. The first and third cases are associated with biomass burning emissions, while the second case represents typical conditions with no extreme air pollution. The added retrievals in V9 exhibit a pattern that is generally consistent with the corresponding IASI data. In general, the IASI MOPITT comparison indicated discrepancies at high CO values. Since the added data in V9 are mainly characterized by high aerosol load (low-cloud cases) that are usually associated with high CO values as a result of fire emissions, the IASI bias is greater for V9 than V8. So, IASI MOPITT CO TC comparison indicated generally good agreement with about 5 %–10 % positive bias, which increases in highly polluted scenes.
The MOPITT Version 8 and Version 9 products are available from NASA through the Earthdata portal (https://earthdata.nasa.gov/, last access: 1 February 2022) or directly from the ASDC archive (https://asdc.larc.nasa.gov/data/MOPITT/, last access: 1 February 2022, login required). CALIPSO aerosol profiles are available at https://www-calipso.larc.nasa.gov/tools/data_avail/ (last access: 1 February 2022; Trepte, 2022). MODIS data are available at https://asdc.larc.nasa.gov/data/MODIS/ (last access: 1 February 2022, login required). IASI CO total column Level 2 data are publicly available via the following link: https://iasi.aeris-data.fr/CO/ (last access: 1 February 2022; Clerbaux, 2022). IDL codes used to create any of the figures and/or to create the underlying data are available on request.
This study was designed by HSM, JRD, and DBAJ. HW, MND, and JG contributed to the data interpretation. DM contributed by producing MOPITT data that were used in the study. The analysis was performed by HSM and JRD. The paper was prepared by HSM with contributions from all authors.
At least one of the (co-)authors is a member of the editorial board of Atmospheric Measurement Techniques. The peer-review process was guided by an independent author, and the authors also have no other competing interests to declare.
Publisher’s note: Copernicus Publications remains neutral with regard to jurisdictional claims in published maps and institutional affiliations.
The authors would like to thank the CSA (Canadian Space Agency) for their financial support of this research. NCAR (National Center for Atmospheric Research) is sponsored by the National Science Foundation and operated by the University Corporation for Atmospheric Research. The NCAR MOPITT project is supported by the National Aeronautics and Space Administration (NASA) Earth Observing System (EOS) Program. The MOPITT team acknowledges support from the Canadian Space Agency (CSA), the Natural Sciences and Engineering Research Council (NSERC), and Environment Canada and the contributions of COMDEV (the prime contractor) and ABB BOMEM. The authors acknowledge the AERIS infrastructure (http://www.aeris-data.fr, last access: 20 December 2021) for providing access to the IASI CO data.
This research has been supported by the Canadian Space Agency (grant no. 16SUASMODE, “MOPITT Data Enhancements through Improved Cloud Clearing”).
This paper was edited by Andre Butz and reviewed by two anonymous referees.
Ackerman, S. A., Stabala, K. I., Menzel, W. P., Frey, R. A., Moeller, C., and Gumley, L. E.: Discriminating clear sky from clouds with MODIS, J. Geophys. Res., 103, 32141–32157, https://doi.org/10.1029/1998JD200032, 1998.
Ackerman, S. A., Holz, R. E., Frey, R., Eloranta, E. W., Maddux, B., and McGill, M. J.: Cloud detection with MODIS: Part II. Validation, J. Atmos. Ocean. Tech., 25, 1073–1086, 2008.
Barré, J., Gaubert, B., Arellano, A. F., Worden, H. M., Edwards, D. P., Deeter, M. N., Anderson, J. L., Raeder, K., Collins, N., Tilmes, S., Clerbaux, C., Emmons, L. K., Pfister, G. G., Francis, G., and Hurtmans, D.: Assessing the impacts of assimilating IASI and MOPITT CO retrievals using CESM-CAM-chem and DART, J. Geophys. Res.-Atmos., 120, 10–501, 2015.
Buchholz, R. R., Deeter, M. N., Worden, H. M., Gille, J., Edwards, D. P., Hannigan, J. W., Jones, N. B., Paton-Walsh, C., Griffith, D. W. T., Smale, D., Robinson, J., Strong, K., Conway, S., Sussmann, R., Hase, F., Blumenstock, T., Mahieu, E., and Langerock, B.: Validation of MOPITT carbon monoxide using ground-based Fourier transform infrared spectrometer data from NDACC, Atmos. Meas. Tech., 10, 1927–1956, https://doi.org/10.5194/amt-10-1927-2017, 2017.
Buchholz, R. R., Worden, H. M., Park, M., Francis, G., Deeter, M. N., Edwards, D. P., Emmons, L. K., Gaubert, B., Gille, J., Martínez-Alonso, S., Tang, W., Kumar, R., Drummond, J. R., Clerbaux, C., George, M., Coheurf, P.-F., Hurtmansf, D., Bowman, K. W., Luo, M., Payne, V. H., Worden, J. R., Chin, M., Levy, R. C., Warnerj, J., Wei, Z., and Kulawik, S. S.: Air pollution trends measured from Terra: CO and AOD over industrial, fire-prone, and background regions, Remote Sens. Environ., 256, 112275, https://doi.org/10.1016/j.rse.2020.112275, 2021.
Clerbaux, C.: IASI CO total column Level 2 data, AERIS [data set], https://iasi.aeris-data.fr/CO/, last access: 1 February 2022.
Clerbaux, C., Boynard, A., Clarisse, L., George, M., Hadji-Lazaro, J., Herbin, H., Hurtmans, D., Pommier, M., Razavi, A., Turquety, S., Wespes, C., and Coheur, P.-F.: Monitoring of atmospheric composition using the thermal infrared IASI/MetOp sounder, Atmos. Chem. Phys., 9, 6041–6054, https://doi.org/10.5194/acp-9-6041-2009, 2009.
Deeter, M. N., Emmons, L. K., Francis, G. L., Edwards, D. P., Gille, J. C., Warner, J. X., Khattatov, B., Ziskin, D., Lamarque, J.-F., Ho, S.-P., Yudin, V., Attie, J.-L., Packman, D., Chen, J., Mao, D., and Drummond, J. R.: Operational carbon monoxide retrieval algorithm and selected results for the MOPITT instrument, J. Geophys. Res.-Atmos., 108, 4399, https://doi.org/10.1029/2002JD003186, 2003.
Deeter, M. N., Worden, H. M., Gille, J. C., Edwards, D. P., Mao, D., and Drummond, J. R.: MOPITT multispectral CO retrievals: Origins and effects of geophysical radiance errors, J. Geophys. Res.-Atmos., 116, D15303, https://doi.org/10.1029/2011JD015703, 2011.
Deeter, M. N., Edwards, D. P., Francis, G. L., Gille, J. C., Martínez-Alonso, S., Worden, H. M., and Sweeney, C.: A climate-scale satellite record for carbon monoxide: the MOPITT Version 7 product, Atmos. Meas. Tech., 10, 2533–2555, https://doi.org/10.5194/amt-10-2533-2017, 2017.
Deeter, M. N., Mao, D., Martínez-Alonso, S., Worden, H. M., Andreae, M. O., and Schlager, H.: Impacts of MOPITT cloud detection revisions on observation frequency and mapping of highly polluted scenes, Remote Sens. Environ., 262, 112516, https://doi.org/10.1016/j.rse.2021.112516, 2021.
Drummond, J. R. and Mand, G. S.: The Measurements of Pollution in the Troposphere (MOPITT) instrument: Overall performance and calibration requirements, J. Atmos. Ocean. Tech., 13, 314–320, 1996.
Drummond, J. R., Zou, J., Nichitiu, F., Kar, J., Deschambaut, R., and Hackett, J.: A review of 9-year performance and operation of the MOPITT instrument, Adv. Space Res., 45, 760–774, 2010.
Duncan, B. N., Logan, J. A., Bey, I., Megretskaia, I. A., Yantosca, R. M., Novelli, P. C., Jones, N. B., and Rinsland, C. P.: Global budget of CO, 1988–1997: Source estimates and validation with a global model, J. Geophys. Res.-Atmos., 112, D22301, https://doi.org/10.1029/2007JD008459, 2007.
Edwards, D. P., Halvorson, C. M., and Gille, J. C.: Radiative transfer modeling for the EOS Terra satellite Measurement of Pollution in the Troposphere (MOPITT) instrument, J. Geophys. Res.-Atmos., 104, 16755–16775, 1999.
Edwards, D. P., Emmons, L. K., Gille, J. C., Chu, A., Attié, J. L., Giglio, L., Wood, S. W., Haywood, J., Deeter, M. N., Massie, S. T., Ziskin, D. C., and Drummond, J. R.: : Satellite-observed pollution from Southern Hemisphere biomass burning, J. Geophys. Res.-Atmos., 111, D14312, https://doi.org/10.1029/2005JD006655, 2006.
George, M., Clerbaux, C., Bouarar, I., Coheur, P.-F., Deeter, M. N., Edwards, D. P., Francis, G., Gille, J. C., Hadji-Lazaro, J., Hurtmans, D., Inness, A., Mao, D., and Worden, H. M.: An examination of the long-term CO records from MOPITT and IASI: comparison of retrieval methodology, Atmos. Meas. Tech., 8, 4313–4328, https://doi.org/10.5194/amt-8-4313-2015, 2015.
Jiang, Z., Jones, D. B., Kopacz, M., Liu, J., Henze, D. K., and Heald, C.: Quantifying the impact of model errors on top-down estimates of carbon monoxide emissions using satellite observations, J. Geophys. Res.-Atmos., 116, D15306, https://doi.org/10.1029/2010JD015282, 2011.
Kulawik, S. S., Worden, J., Eldering, A., Bowman, K., Gunson, M., Osterman, G. B., Zhang, L., Clough, S., Shephard, M. W., and Beer, R.: Implementation of cloud retrievals for Tropospheric Emission Spectrometer (TES) atmospheric retrievals: part 1. Description and characterization of errors on trace gas retrievals, J. Geophys. Res., 111, D24204, https://doi.org/10.1029/2005JD006733, 2006.
Landgraf, J., aan de Brugh, J., Scheepmaker, R., Borsdorff, T., Hu, H., Houweling, S., Butz, A., Aben, I., and Hasekamp, O.: Carbon monoxide total column retrievals from TROPOMI shortwave infrared measurements, Atmos. Meas. Tech., 9, 4955–4975, https://doi.org/10.5194/amt-9-4955-2016, 2016.
Li, J., Liu, C. Y., Huang, H. L., Schmit, T. J., Wu, X., Menzel, W. P., and Gurka, J. J.: Optimal cloud-clearing for AIRS radiances using MODIS, IEEE T. Geosci. Remote, 43, 1266–1278, 2005.
Marey, H. and Drummond, J.: Analysis of MOPITT Cloud-Clearing Algorithm V3-V7. Internal report for “MOPITT Data Enhancements through Improved Cloud Clearing” project, Canadian Space Agency, 2018.
Moeller, C. and Frey, R.: Terra MODIS Collection 6.1 Calibration and Cloud Product Changes, Version 1.0, available at: https://modis-atmosphere.gsfc.nasa.gov/sites/default/files/ModAtmo/C6.1_Calibration_and_Cloud_Product_Changes_UW_frey_CCM_1.pdf (last access: 16 March 2021), 2017.
Strode, S. A. and Pawson, S.: Detection of carbon monoxide trends in the presence of interannual variability, J. Geophys. Res.-Atmos., 118, 12–257, 2013.
Susskind, J., Barnet, C. D., and Blaisdell, J. M.: Retrieval of atmospheric and surface parameters from AIRS/AMSU/HSB data in the presence of clouds, IEEE T. Geosci. Remote, 41, 390–409, 2003.
Trepte, C. R.: CALIPSO aerosol profiles, NASA [data set], https://www-calipso.larc.nasa.gov/tools/data_avail/, last access: 1 February 2022.
Turquety, S., Hurtmans, D., Hadji-Lazaro, J., Coheur, P.-F., Clerbaux, C., Josset, D., and Tsamalis, C.: Tracking the emission and transport of pollution from wildfires using the IASI CO retrievals: analysis of the summer 2007 Greek fires, Atmos. Chem. Phys., 9, 4897–4913, https://doi.org/10.5194/acp-9-4897-2009, 2009.
Vidot, J., Landgraf, J., Hasekamp, O. P., Butz, A., Galli, A., Tol, P., and Aben, I.: Carbon monoxide from shortwave infrared reflectance measurements: A new retrieval approach for clear sky and partially cloudy atmospheres, Remote Sens. Environ., 120, 255–266, 2012.
Warner, J. X., Gille, J. C., Edwards, D. P., Ziskin, D. C., Smith, M. W., Bailey, P. L., and Rokke, L.: Cloud detection and clearing for the Earth Observing System Terra Satellite Measurements of Pollution in the Troposphere (MOPITT) experiment, Appl. Optics, 40, 1269–1284, 2001.
Worden, H. M., Deeter, M. N., Frankenberg, C., George, M., Nichitiu, F., Worden, J., Aben, I., Bowman, K. W., Clerbaux, C., Coheur, P. F., de Laat, A. T. J., Detweiler, R., Drummond, J. R., Edwards, D. P., Gille, J. C., Hurtmans, D., Luo, M., Martínez-Alonso, S., Massie, S., Pfister, G., and Warner, J. X.: Decadal record of satellite carbon monoxide observations, Atmos. Chem. Phys., 13, 837–850, https://doi.org/10.5194/acp-13-837-2013, 2013.