the Creative Commons Attribution 4.0 License.
the Creative Commons Attribution 4.0 License.
 | 06 Dec 2022
Direct measurement of N2O5 heterogeneous uptake coefficients on ambient aerosols via an aerosol flow tube system: design, characterization and performance
Xiaorui Chen
Tianyu Zhai
Chunmeng Li
An improved aerosol flow tube system coupled with a detailed box model was developed to measure N2O5 heterogeneous uptake coefficients (γ(N2O5)) on ambient aerosols directly. This system features sequential measurements of N2O5 concentrations at both the entrance and exit of the flow tube to ensure an accurate retrieval of N2O5 loss in the flow tube. Simulation and laboratory tests demonstrate that this flow tube system is able to overcome the interference from side reactions led by varying reactants (e.g., NO2, O3 and NO) and to improve the robustness of results with the assistance of the box model method. Factors related to γ(N2O5) derivation – including particle transmission efficiency, mean residence time in the flow tube and the wall loss coefficient of N2O5 – were extensively characterized for normal operating conditions. The measured γ(N2O5) on (NH4)2SO4 model aerosols were in good agreement with literature values over a range of relative humidity (RH). The detection limit of γ(N2O5) was estimated to be 0.0016 at a low aerosol surface concentration (Sa) condition of 200 µm2 cm−3. Given the instrument uncertainties and potential fluctuation of air mass between successive sampling modes, we estimate the overall uncertainty of γ(N2O5) as ranging from 16 % to 43 % for different ambient conditions. This flow tube system was then successfully deployed for field observations at an urban site of Beijing that is influenced by anthropogenic emissions. The performance in field observations demonstrates that the current setup of this system is capable of obtaining robust γ(N2O5) amid the switch of air mass.
- Article
(4487 KB) - Full-text XML
- BibTeX
- EndNote


Dinitrogen pentoxide (N2O5), forming from the reaction of nitrogen dioxide (NO2) and nitrate radicals (NO3), acts as an important reservoir of atmospheric nitrogen. The N2O5 can undergo either thermal dissociation (back to NO2 and NO3; photolysis of NO3 also generates NO2) to release NO2 or hydrolysis (both homogeneous and heterogeneous) to remove nitrogen oxides from the atmosphere (Brown and Stutz, 2012; Chang et al., 2011). Among the budgets of N2O5, the uptake on aerosol particles is a highly efficient pathway for the production of nitrate aerosols in some regions (Fu et al., 2020; Wang et al., 2019; H. Wang et al., 2017c; Baasandorj et al., 2017; McDuffie et al., 2019; Prabhakar et al., 2017; H. Wang et al., 2018a; Chen et al., 2020) and for the activation of chlorine via ClNO2 formation (Bertram and Thornton, 2009; Osthoff et al., 2008; Tham et al., 2018; Thornton et al., 2010; Z. Wang et al., 2017; Riedel et al., 2012a, 2013; Gaston and Thornton, 2016; Mitroo et al., 2019). The N2O5 uptake coefficient (γ(N2O5)) is critical in determining the uptake reaction rate of N2O5 on aerosols in addition to aerosol surface area (Sa). It represents the fraction of collisions between gaseous N2O5 molecules and particle surfaces that resulted in a loss of N2O5. Model simulation showed that the variations in γ(N2O5) can significantly influence the fate of NOx, O3 and OH radicals on a regional (Li et al., 2016; Sarwar et al., 2012; Lowe et al., 2015) and global scale (Dentener and Crutzen, 1993; Evans and Jacob, 2005; Macintyre and Evans, 2010; Murray et al., 2021). However, ambient data of direct observations of γ(N2O5) are still scarce. It is thereby necessary to develop an accurate piece of equipment or method to quantify this parameter on ambient aerosols.
Extensive laboratory experiments have been conducted to derive the values of γ(N2O5) on aerosols and to understand the mechanism of N2O5 uptake by means of various methods, to derive the values γ(N2O5) on aerosols, and various methods have been used to understand the mechanism of N2O5 uptake, including an aerosol flow reactor (Kane et al., 2001; Mozurkewich and Calvert, 1988; Hu and Abbatt, 1997; Thornton and Abbatt, 2005; Thornton et al., 2003; Tang et al., 2014; Bertram and Thornton, 2009; Cosman et al., 2008; Escoreia et al., 2010; Gaston et al., 2014; Folkers et al., 2003), droplet train reactor (Van Doren et al., 1990; Schweitzer et al., 1998), Knudsen flow reactor (Karagulian et al., 2006) and smog chamber (Wahner et al., 1998; Wu et al., 2020). Using these laboratory methods under controllable conditions, the γ(N2O5) was found to be highly variable and dependent on particle chemical composition, acidity, size and phase state as well as the presence of organic coating (Badger et al., 2006; Bertram et al., 2011; Fried et al., 1994; Griffiths et al., 2009; Gross et al., 2009; Hallquist et al., 2000; McNeill et al., 2006; Mentel et al., 1999; Riemer et al., 2003; Gaston and Thornton, 2016; Escoreia et al., 2010; Gaston et al., 2014; Thornton et al., 2003). While laboratory results have contributed to recognizing the mechanism of N2O5 uptake and to developing γ(N2O5) parameterizations (Anttila et al., 2006; Bertram and Thornton, 2009; Davis et al., 2008; Griffiths et al., 2009; Riemer et al., 2009), issues might emerge when quantitatively extended to ambient conditions due to the discrepancy between laboratory conditions and real air mass. For example, the much higher reactant and particle concentrations usually used in laboratory experiments might induce surface saturation or secondary reactions in a short time period, which may lead to the bias of the reaction rate used in ambient conditions (Thornton et al., 2003). In addition, the physicochemical properties of ambient aerosols are much more complicated than the model aerosol used in laboratory studies, which means that it is difficult for the laboratory results to accurately represent what happens on the atmospheric aerosols (Royer et al., 2021; Mitroo et al., 2019).
There have been several methods implemented for field campaigns to indirectly derive γ(N2O5) – these have been based on observations of ambient NO3, N2O5, NO2, O3, ClNO2, pNO (particulate nitrate) and other auxiliary parameters and have not required special equipment to capture the decay of N2O5, as in the laboratory-based methods. These include the following: (1) the linear fit between N2O5 (NO3) lifetime and the product of NO2 and Sa concentration according to steady-state equations (Brown et al., 2002, 2006, 2009; Platt et al., 1984; H. Wang et al., 2017b; X. Wang et al., 2017; Tham et al., 2016; Z. Wang et al., 2017; Brown et al., 2016); (2) the analysis of the production rates of products (pNO and ClNO2) resulting from N2O5 uptake under a stable condition (Mielke et al., 2013; Phillips et al., 2016; H. Wang et al., 2018b); and (3) box model simulations with an iterative approach to reproducing the evolution of NO3–N2O5 chemistry within each separate air mass after sunset (McDuffie et al., 2018; Wagner et al., 2013; H. Wang et al., 2020a; Yun et al., 2018). All these methods contain some specific assumptions and are only applicable in a few special cases.
To directly determine the γ(N2O5) on ambient aerosols, Bertram et al. (2009a) firstly designed an entrained aerosol flow reactor to adapt to low atmospheric Sa concentrations with easy operation. By switching between filtered and bypass sampling mode, the N2O5 concentration at the exit of the flow tube can be measured in the presence and absence of aerosols, respectively. The pseudo-first-order rate coefficients for N2O5 loss on aerosols is thereby derived from the ratio of measured N2O5 concentrations in these two modes within a duty cycle according to Eq. (1):
where the Δt is the mean residence time of the flow tube, and the and are the measured N2O5 concentrations at the exit of the flow tube in filtered and bypass mode, respectively. Assuming the gas-phase diffusion effect is negligible for atmospheric particles and low reaction probability (γ<0.1) (Fuchs and Sutugin, 1970), γ(N2O5) can then be calculated from Eq. (2):
This method was deployed to measure γ(N2O5) on ambient particles during two field campaigns (Bertram et al., 2009b; Riedel et al., 2012b) and on aerosols generated in the laboratory (Ahern et al., 2018). While values of γ(N2O5) were determined to be robust in laboratory experiments, most of the data would be dropped under ambient conditions due to the variations of wall loss coefficients (dominated by RH), fresh NO emission, N2O5 regeneration and flow pattern inside the flow tube. Based on the above measurement system, W. Wang et al. (2018) added NOx, O3 and Sa measurements upon exit of the flow tube and introduced an iterative box model to minimize the potential influences from changing air mass and non-linear responses of interference reactions. With the assumption of the equilibrium between NO3 and N2O5, the box model runs backwards and forwards iteratively to obtain the N2O5 loss rate constant in the absence () and presence () of aerosols, respectively. The difference between these two parameters can finally derive the γ(N2O5) according to Eq. (3), assuming the wall loss effect stays consistent.
This iterative approach was demonstrated to be able to buffer against certain fluctuations of air mass and to measure γ(N2O5) in the polluted atmosphere (Yu et al., 2020).
Until now, only a few direct measurements of γ(N2O5) on ambient aerosols have been conducted during field campaigns (Bertram et al., 2009b; Riedel et al., 2012b; Yu et al., 2020). Despite being combined with datasets from indirect approaches (e.g., steady-state approximations), it is still challenging to characterize the temporal and spatial distributions of γ(N2O5) on ambient aerosols. To better investigate the reactive uptake of N2O5 on aerosols in different environments, we develop an aerosol flow tube system with newly designed gas circuit and data acquisition procedures to quantify γ(N2O5) on ambient aerosols. In the following sections, the setup of this system and laboratory characterizations for each part are described in detail. Procedures of acquiring and processing data are compared to previous methods and discussed with attention to potential uncertainties. Laboratory tests on model aerosols and field observations are presented to demonstrate the system's performance under varying ambient conditions.
A schematic of the aerosol flow tube system is shown in Fig. 1. The ambient air enters the system from the sampling manifold, mixes with the gaseous N2O5 source in a Y-tee and flows to the aerosol flow tube and detection instruments, as indicated by the arrows in the figure. The design of the sampling module and aerosol flow tube in this work follows previous work for measuring γ(N2O5) on ambient aerosols (e.g., Bertram et al., 2009aThe major improvements of this system in comparison to previous work are the continuous monitoring of NOx and O3 concentrations before the inlet of the flow tube (after the sample air is mixed with the N2O5 source) and the sequential measurements of N2O5 concentrations at both the inlet and the exit of the flow tube within a duty cycle. To achieve the programmed cyclic measurement of these key parameters, we adopted a new design of Y-tee, with a static mixer inside and cyclic measurement setup.
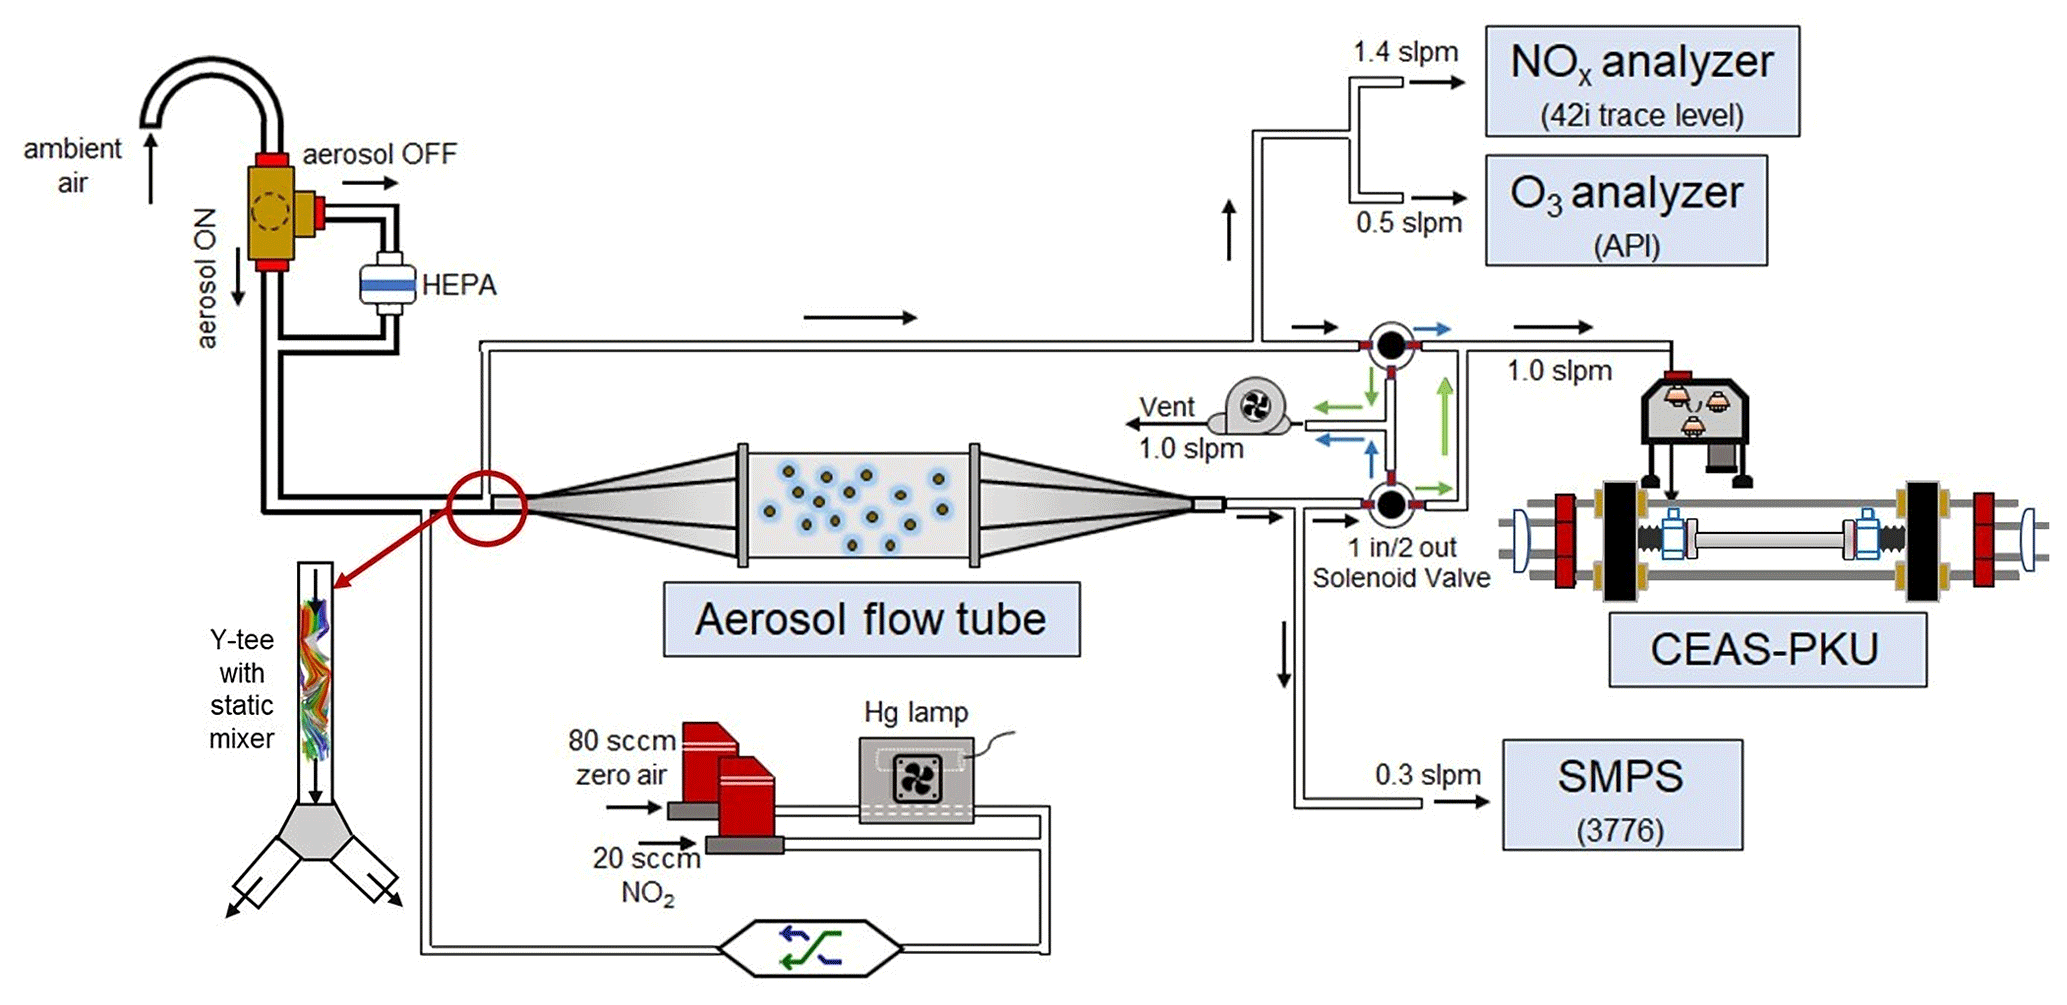
Figure 1Overall schematic of aerosol flow tube system. The arrows alongside the tube show the flow directions. The black arrows indicate the flow directions consistent during the measurements, green arrows indicate the flow directions active in measuring the exit N2O5 and blue arrows indicate the flow directions active in measuring the inlet N2O5.
2.1 Sampling manifold
The sampling tube is made of aluminum tubing that is 50 cm long with a half inch outside diameter (OD), with a curve tip (10 cm radius of curvature) turning the inlet straight down in order to avoid precipitation. The ambient air is then passed through a three-way, stainless-base solenoid ball valve, which is controlled by a time relay either to allow the air to flow directly into a following Y-tee (filter bypass mode) or to divert the air to a HEPA (high-efficiency particulate air filter, Whatman) to remove particles (filter inline mode). The HEPA can retain particles at a high efficiency (>99.9 %), with low pressure drop and RH difference between filter inline and bypass mode.
2.2 Gaseous N2O5 generation
A homemade, temperature-controlled gas generator is used to generate gaseous N2O5 in situ via the reaction of O3 with NO2 (Reaction R1) and the subsequent reaction of produced NO3 with NO2 (Reaction R2).
NO2 is delivered from a compressed gas cylinder (20 ppmv in N2 diluent gas, Jinghao Corp.). O3 is generated from the photolysis of O2 in compressed, ultra-pure, synthetic zero air at 254 nm, using a commercial mercury lamp (UVP, the USA) fixed inside the generator. The produced O3 is then mixed with NO2 in a Teflon chamber for about 2 min under the temperature of 15 ∘C, stabilized by a Peltier cooler controlled by a proportion–integration–differentiation algorithm. A PFA tube with polyethylene foam was used to transmit the synthesized N2O5 to the sampling stream and to minimize the influence of ambient temperature variations on the N2O5 level. The flow rates of NO2 (20 sccm) and of zero air (80 sccm) are controlled separately by mass flow controller at a total of 100 sccm. By changing the flow rate ratio between NO2 and zero air, the generator can produce N2O5 concentrations varying from 1 to 6 ppbv (after dilution in zero air at a sampling flow rate of 4.5 slpm). Under the typical measurement condition, an excess of NO2 concentration is applied to shift the equilibrium towards N2O5 production (Reaction R2) and to suppress the NO3 concentration to less than 30 pptv, which is expected to decrease the uncertainty of varying NO3 reactivity (NO, VOCs (volatile organic compounds) and heterogeneous loss). The resultant initial N2O5 concentration was 4.0 ppbv at the inlet of the aerosol flow tube, together with around 50 ppbv of NO2 and 15 ppbv of O3. A stability test on the N2O5 source showed that the variation was within 1 % for a 24 h continuous operation, with the ambient temperature ranging from 0 to 15 ∘C.
2.3 Aerosol flow tube
Air flow enters and exits the flow tube via two identical conical diffuser caps at a diffuser angle of 45∘. A 35 cm × 14 cm inner diameter (ID) cylindrical tube is mounted in the middle of the two caps, flanged with screws and nitrile rubber O-rings. All sections of this aerosol flow tube are made of stainless steel, with an electro-polished and FEP-coated inside. The exterior of the flow tube is insulated with aluminum-coated polyethylene foam, 3 cm thick, to minimize thermal eddy fluctuations of ambient temperature. The mechanic design of this flow tube follows that used in Bertram et al. (2009a), with different length and diffuser angles particularly designed for our typical flow rate. Under the typical flow rate of 2.1 slpm in the flow tube, the axial velocity in the cylindrical tube section is 0.23 cm s−1, which produces a Reynolds number (Re) of 22, well below the threshold of laminar flow (Re<2100).
In front of the flow tube, the synthesized N2O5 source is introduced perpendicular to the ambient air sampling stream, and the mixture then enters a stainless-steel Y-tee for further mixing. The inner surface of the Y-tee is electro-polished and coated with SilcoNert 2000 (Silotek Corp.), a technique commonly applied in the semiconductor industry, to maintain the transmission efficiency of particles and to minimize the loss of N2O5 in the meantime. A 10 cm-long, stainless-steel static mixer is mounted inside the Y-tee in order to swirl the flow and therefore to facilitate the mixing between the sampling stream and the N2O5 source in a relatively short distance. The presence of the static mixer in front of the inlet also helps to improve the flow expansion after entering the flow tube by minimizing the recirculation zone, which decreases the wall loss of N2O5 and particles (Huang et al., 2017). After passing through the static mixer, the mixture of ambient air and N2O5 source is split into two flows at the same flow rate, one of which straightly enters the aerosol flow tube, while the other one is diverted to measurements of NOx, O3 and N2O5. We measured the concentrations of NOx, O3, N2O5 and Sa at both the exits of the Y-tee under a typical flow rate for three repeated experiments (Fig. 2). Similar gaseous concentrations and particle distributions at both exits of the Y-tee demonstrate that the N2O5 source has been well mixed with the sampling flow.
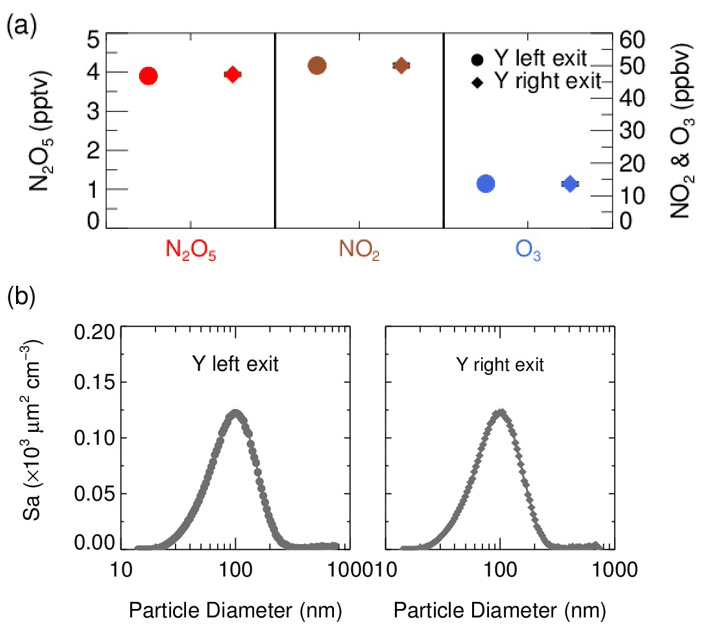
Figure 2(a) The concentrations of N2O5, NO2 and O3 in the mixture of the N2O5 source and sampling aerosols measured at each exit of the Y-tee; (b) the size distribution of Sa concentration in the mixture of the N2O5 gas source and sampling aerosols measured at each exit of the Y-tee.
2.4 Detection instruments
Instruments used in this system are listed in Table 1. A portable cavity-enhanced absorption spectrometer (CEAS) is used to measure N2O5 concentrations (H. Wang et al., 2017a) at both the inlet and exit of the aerosol flow tube by automatically switching the flow directions (see details in Sect. 2.5). Briefly, the N2O5 is thermally decomposed to NO3 by heating up to 130 ∘C and then quantified according to the extinction coefficient caused by NO3 absorption in the wavelength window (from 640 to 680 nm). A Teflon polytetrafluoroethylene (PTFE) membrane is placed in front of the CEAS to remove particles; this will be replaced with a new one every 2 h by a self-designed membrane auto-changer. Laboratory tests have been conducted to quantify the transmission efficiency of N2O5 over the membrane (92±3 %), of the sampling tube of CEAS (99.7 %) and of the inside of CEAS (93.6 %). The use of a filter upstream of the CEAS and the procedures of membrane changing have been successfully applied in many field campaigns to measure ambient N2O5 (Brown et al., 2016; Kennedy et al., 2011; H. Wang et al., 2017a, b, 2018a). The loss of N2O5 on the membrane filter, the sampling tube and the detection chamber inside the CEAS was corrected according to transmission efficiency. The detection limit of N2O5 was determined to be 2.7 pptv (1σ, 60 s), with the measurement uncertainty of 19 %. The CEAS has been successfully applied to measure ambient N2O5 concentrations in several field campaigns and laboratory studies (Chen et al., 2020; H. Wang et al., 2020a, 2017b, 2018b, 2020b; Wang et al., 2022).
Table 1Performance of related instruments incorporated in the flow tube system.
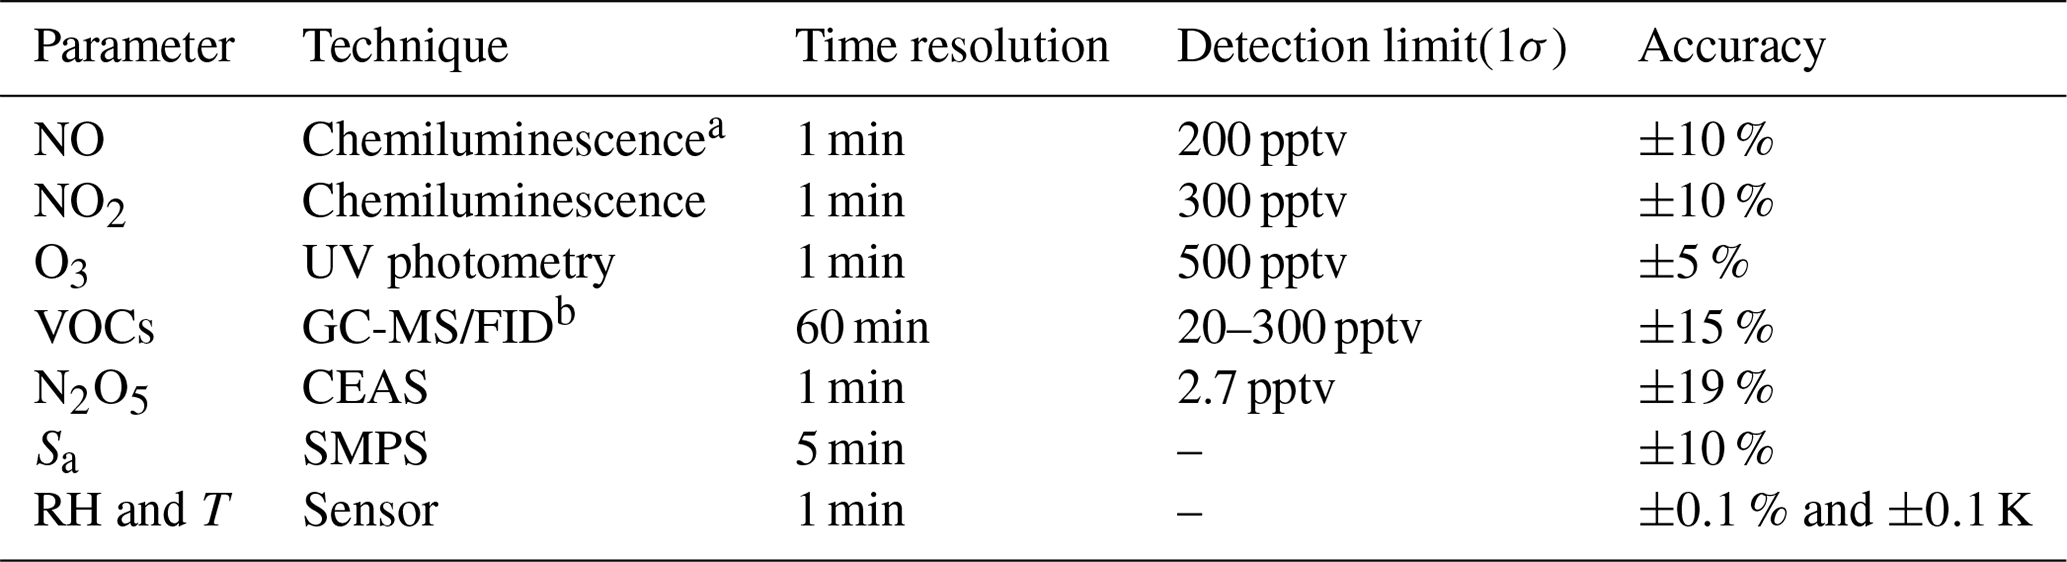
a Photolytic conversion to NO through blue light before detection. b Gas chromatography equipped with a mass spectrometer and a flame ionization detector.
At the inlet of flow tube, NOx concentration is measured via a chemiluminescence method, equipped with a blue-light photolytic converter (Thermo, Model 42i), and O3 concentration is also measured via a chemiluminescence method by adding excessive NO (Teledyne API, Model T265). Both NOx and O3 concentrations are averaged to a one-minute time resolution. The size distribution of the particle number density is measured at the exit of the flow tube using a scanning mobility particle sizer (SMPS, TSI 3776), which determines the total Sa concentration covering the range of 13–730 nm. According to our previous field measurements (Chen et al., 2020), particles larger than this range usually contributed less than 5 % of the total Sa; this is included in the uncertainty analysis (see Sect. 5). A cycle of size scanning is set to around 5 min, and the derived Sa concentration is then interpolated into 1 min for further calculation. Aerosols pass through a Nafion tubing (MD-700) before entering into the SMPS to reduce RH to less than 30 %. The dry-state Sa is therefore corrected to wet state by the RH inside the flow tube for particle hygroscopicity. The growth factor, , used for correction is valid only when RH is within the range of 30 %–90 % (Liu et al., 2013). The RH and temperature of flow are continuously measured by commercial sensors, both before entering and after leaving the flow tube (Rotronic, Model HC2A-S). The averages of the values obtained at both locations are used to represent the RH and temperature inside the flow tube. In addition, ambient volatile organic compounds (VOCs) are measured in situ alongside the aerosol flow tube system using an online gas chromatograph mass spectrometer coupled with a flame ionization detector (GCMS-FID) to derive the NO3 reactivity to VOCs () in the flow tube.
2.5 Procedures of data acquisition
The N2O5 concentration is acquired at both the inlet and exit of the flow tube within a duty cycle via a CEAS instrument, which is different from that only at the exit of the flow tube in previous studies (Bertram et al., 2009a; W. Wang et al., 2018). Each duty cycle consists of one HEPA inline mode for measuring kwall of N2O5 and one HEPA bypass mode for retrieving the N2O5 loss on aerosols. The procedure that measures N2O5 first at the inlet of flow tube and then at the exit is executed within each mode. An exemplary case obtained during a field campaign is shown in Fig. 3 to explain this procedure. Within the HEPA inline mode, N2O5 data are firstly acquired at the inlet of the flow tube, and then acquisition is switched to the exit of the flow tube. The , which is the kwall of N2O5, can be derived from a box model constrained by these N2O5 data (see Sect. 3 for the model description and data processing). The same procedures are executed in the HEPA bypass mode, except the γ(N2O5) is derived according to Eq. (2). Two three-way valves controlled by a time relay were implemented to realize this procedure in order to avoid the changes of flow condition in the flow tube that could have been caused. As indicated in Fig. 1, the blue arrows show the flow directions when measuring the N2O5 concentration at the inlet of flow tube, while the green arrows show the flow directions for the exit of flow tube. It should be noted that, during the operation, the concentrations of NOx and O3 are always acquired at the inlet of the flow tube and the Sa concentration always at the exit of the flow tube.
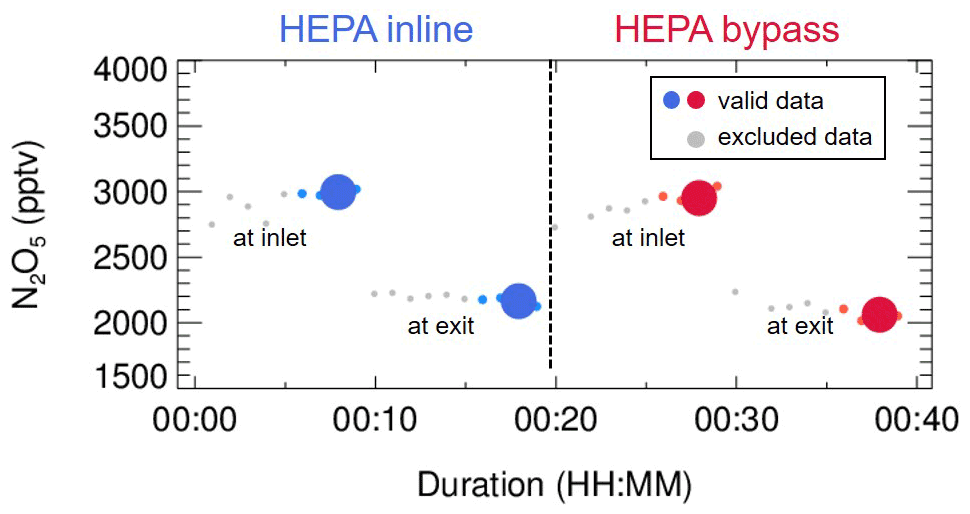
Figure 3An exemplary case of measured N2O5 concentrations within a duty cycle. This case was observed on the night of 13 December 2020, with average ambient Sa of 320 µm2 cm−3. The derived kwall of N2O5 and γ(N2O5) was 0.0023 s−1 and 0.035, respectively. The blue dots indicate N2O5 concentrations measured under the HEPA inline mode, either at the inlet or exit of the flow tube (denoted as texts); the respective averages (blue dots of larger size) are used for deriving kwall (blue square). The red dots indicate N2O5 concentrations measured under the HEPA bypass mode, either at the inlet or exit of the flow tube; the respective averages (red dots of larger size) are used for deriving the overall rate constant of N2O5 loss on the wall and aerosols. The data points in gray are excluded from calculation due to unstable conditions in the flow tube.
In addition, laboratory tests were conducted to determine a suitable duration for each duty cycle. During a duty cycle, the duration for each mode should last long enough to develop a stable flow condition for particles or empty particles, while a much longer duration could decrease the measurement time resolution and lead to a large uncertainty due to the fluctuations within a long time period. We measured Sa and N2O5 concentrations continuously at the exit of flow tube when sampling (NH4)2SO4 aerosols. As shown in Fig. 4, when our system underwent mode switches, it took about 15 min for particles to rise from none to a stable level or to decrease from a certain level to none. The periodical variation of N2O5 concentration was consistent with the particles. The residence time distribution (RTD) profiles (see in Sect. 4.2) also demonstrated that a pulse injection of NO2 requires 10–15 min to be fully drained out of the flow tube, which, to some extent, supports the 15 min time required for complete mixing of N2O5. As a result, a typical duty cycle duration is composed of 40 min, with 20 min for each mode, which is similar to that in Bertram et al. (2009a). The N2O5 measurement at the exit of the flow tube in the last 5 min of each mode is able to represent valid decays of N2O5 under this mode and satisfies the requirements of further data processing.
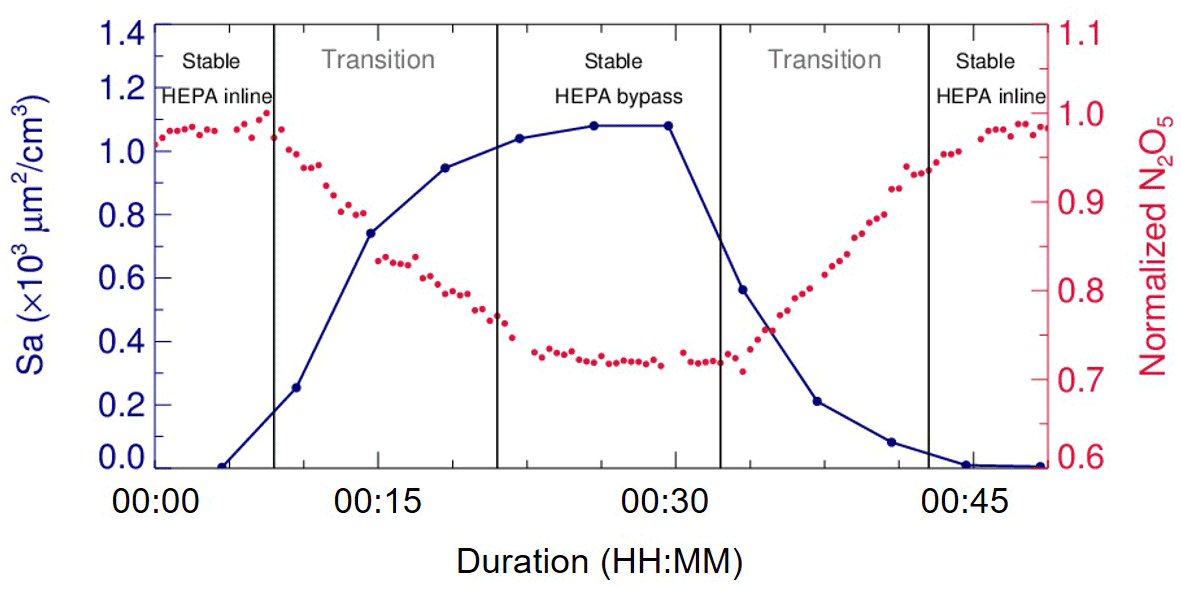
Figure 4Variations of Sa and N2O5 concentrations (normalized to peak values) measured at the exit of flow tube when switching the sampling mode. The phases of species concentrations in the flow tube approaching stable after a mode switch are denoted as the transition phases.
3.1 Method description
In a previous flow tube study (Bertram et al., 2009a), large uncertainties were found in retrieving γ(N2O5) on ambient particles according to Eq. (1) due to the dependence of homogeneous reaction rates on sampling modes and the atmospheric variations of parameters related to NO3–N2O5 chemistry (e.g., NO, NO2, O3, VOCs and RH). To minimize these influences, a time-dependent box model constrained by the measurement of N2O5 concentrations and other auxiliary parameters is applied to calculate the loss rate coefficients of N2O5 under the HEPA inline and bypass modes, respectively. The model is able to simulate the reactions related to budgets of NO3–N2O5 chemistry in a dark condition, including Reactions (R1), (R2) and the follows:
The rate constants for Reactions (R1) to (R3) refer to the IUPAC database. The reaction of VOCs and NO3 is treated as pseudo first order, with a rate constant of , which is the sum of rate constants for reactions of NO3 with each VOC scaled by the concentration of VOCs measured by GC-FID. In this work, there are 30 kinds of measured VOCs having known reaction rate constants with NO3 included in the model (Table A1). Due to the low time resolution of VOC measurements (1 h), the is kept constant for each derivation of γ(N2O5). The suppressed NO3 concentration is expected to attenuate the influence resulting from the uncertainty of (see discussion in Sect. 5). The Reaction R5 represents the loss of N2O5 only on the wall in the HEPA inline mode or on both the wall and particles in the HEPA bypass mode. The rate constant of Reaction (R5) is also treated as pseudo first order, and it is adjustable among different runs.
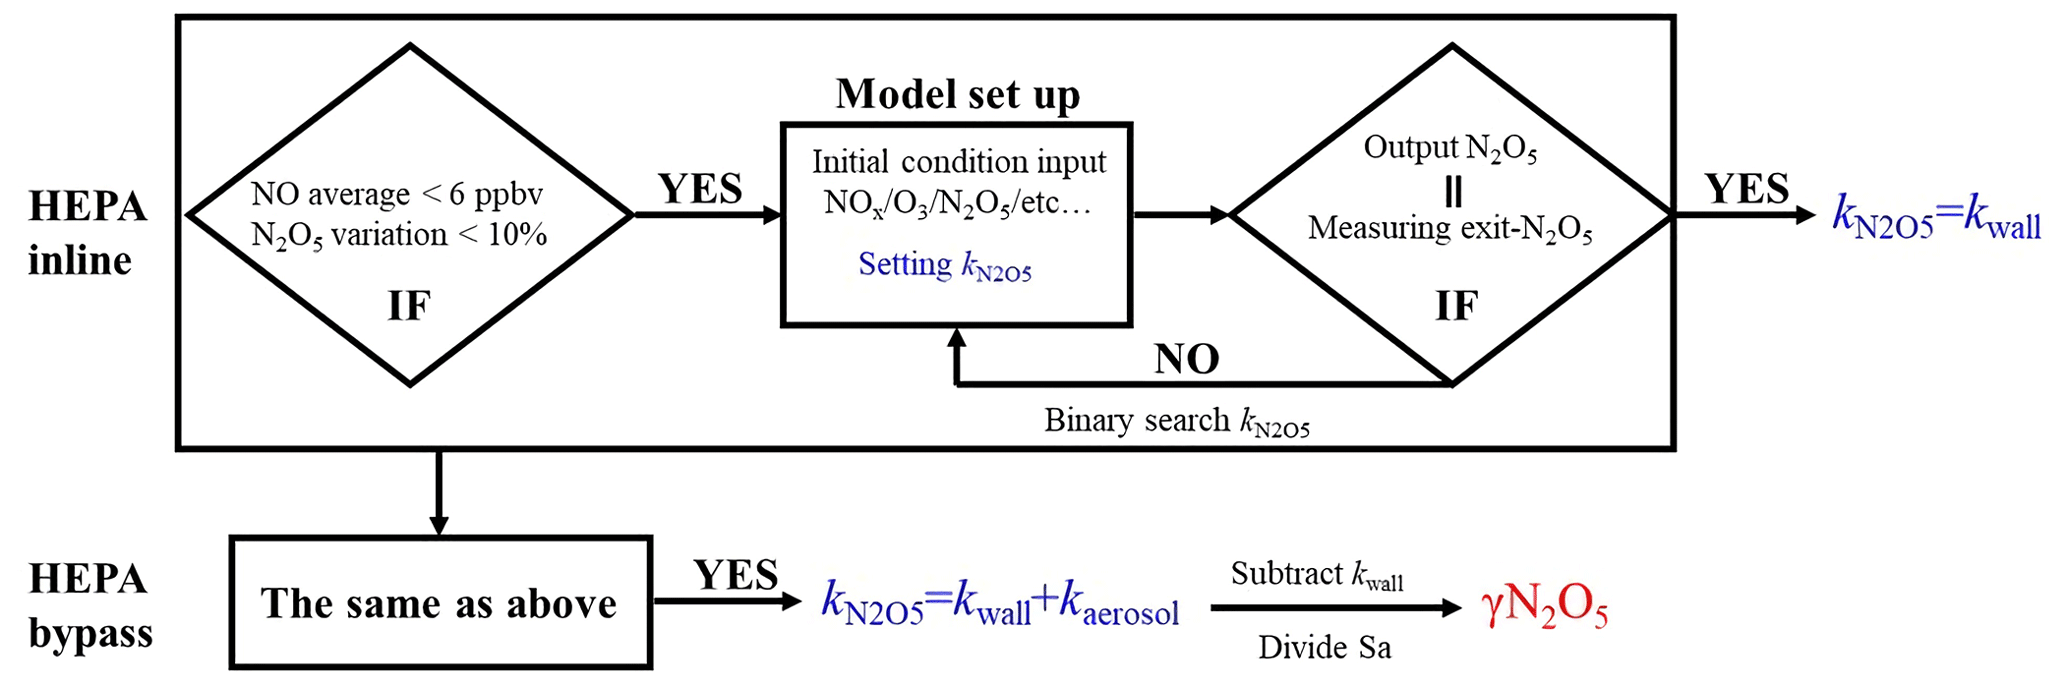
The same procedures of data screening and model operation are applied to both the sampling and bypass modes, as shown in Fig. 5. For example, in the HEPA inline mode, the average of NO concentrations less than 6 ppbv and the variations of less than 10 % of N2O5 measured at the inlet of the flow tube should be validated prior to the following model operation. Under the typical concentrations of the N2O5 source we used in this flow tube system, the exit concentration of N2O5 is detected to be under the triple-detection limit, with initial NO large than 6 ppbv according to our laboratory tests. In ambient conditions, a high level of NO is usually also accompanied by rapid variations due to fresh emission, which disturbs the decay of N2O5 in the flow tube and leads to a large uncertainty in deriving its loss rate coefficient. Excluding the cases in which N2O5 measured at the inlet of flow tube varies by more 10 % can further minimize the uncertainty of the N2O5 loss rate coefficient resulting from the rapid change of NO3 reactants (NO, VOCs). If the measured data within the duration of a sampling mode satisfy the criteria for data screening, as described above, then based on these data, the model can simulate the reactions starting from the entrance of flow tube and lasting for 156 s (mean residence time). The initial concentrations of [NO]t=0, [NO2]t=0, [O3]t=0 and [N2O5]t=0 are the averages of the last-five-minute values measured at the inlet of the flow tube. The RH and temperature are constrained by the mean values during this sampling mode. By tuning the loss rate coefficient of N2O5 () in the way of a binary search, we optimized an appropriate to ensure that the N2O5 concentration output from the simulation is consistent with the last-five-minute average of N2O5 concentrations measured at the exit of the flow tube within 1 pptv. As a result, this derived (a.k.a. ) is expected to be the kwall of N2O5. The same procedures as above are then applied to the data obtained in the HEPA bypass mode, except that the derived (a.k.a. ) contains the loss rate coefficients of N2O5 on both the wall and the particles. It should be noted that the above calculation for the obtained data is only valid under the variation of RH that is below 2 % within a duty cycle, and the kwall of N2O5 can then be reasonably assumed to be constant between two successive sampling modes. Therefore, the γ(N2O5) can be retrieved by means of Eq. (3), where the last-five-minute average of the Sa concentrations in the HEPA bypass mode is used.
3.2 Evaluation of the box model method
The box model method is introduced to our flow tube system to overcome the influence of homogeneous reactions and variations of air mass on γ(N2O5) retrieval. A series of scenarios was provided to evaluate the performance of the box model method by means of both simulations and laboratory experiments. We allow NO, NO2 and O3 in the mixture of sampling air at the entrance of the flow tube to vary within a reasonable range in order to develop the scenarios of different gradients of NO concentrations and NO3 production rates (PNO3). The levels of PNO3 were adjusted by NO2 and O3 concentrations (O3 ranging from 10 to 80 ppbv and NO2 ranging from 50 to 160 ppbv) under a temperature of 283 K and RH of 30 %. In simulation studies, the exit concentration of N2O5 would be obtained from the simulated N2O5 evolutions with and without particles in the flow tube. To corroborate the results estimated by simulations, laboratory tests were performed on (NH4)2SO4 aerosols to measure the exit concentration of N2O5 under varying NO concentrations. The γ(N2O5) on particles are then calculated according to Eqs. (1) and (2) or by the box model method described above.
As shown in Fig. 6a, the exit concentration method (γ(N2O5) exit conc., derived directly by Eqs. 1–2) underestimates γ(N2O5), and the extent of underestimation increases with PNO3 levels in simulation tests. Similarly, the exit concentration method underestimates γ(N2O5) by 50 %–60 %, with PNO3 of 1.0 ppbv h−1 in the laboratory tests (Fig. 6b). It is noted that the γ(N2O5) was determined by the box model method to be around 0.01 over the NO range of 0–6 ppbv, which agrees well, within uncertainty, with previous laboratory observation of γ(N2O5) on (NH4)2SO4 aerosols (Badger et al., 2006; Hallquist et al., 2003; Kane et al., 2001). The cause of γ(N2O5) exit conc. underestimation is mainly due to the in situ N2O5 production in the flow tube. With a continuous production of NO3 via the reaction of NO2 and O3 and the rapid heterogeneous loss of N2O5 in the flow tube, the equilibrium between NO3 and N2O5 always shifts to the production of N2O5 and masks he actual amount of N2O5 removal. In the HEPA bypass mode, the N2O5 consumes faster than in the other mode due to the addition of particles, which further facilitates the N2O5 formation through the equilibrium. Previous studies also found similar impacts from N2O5 production on retrieving γ(N2O5) in the aerosol flow tube (Bertram et al., 2009a; W. Wang et al., 2018). However, the discrepancy of γ(N2O5) derived by these two methods is much less dependent on the NO concentration, at least within the prescribed range, due to the relatively small ratio of in the N2O5 source. The absence of a dependence between NO concentration and γ(N2O5) also indicates that this aerosol flow tube system can buffer against NO within the range of 0–6 ppbv under typical operating conditions. However, this is not always the case when there is a rapid fluctuation of NO in a real atmosphere, which might lead to intractable uncertainty and is therefore excluded from further analysis according to the criteria of data screening.
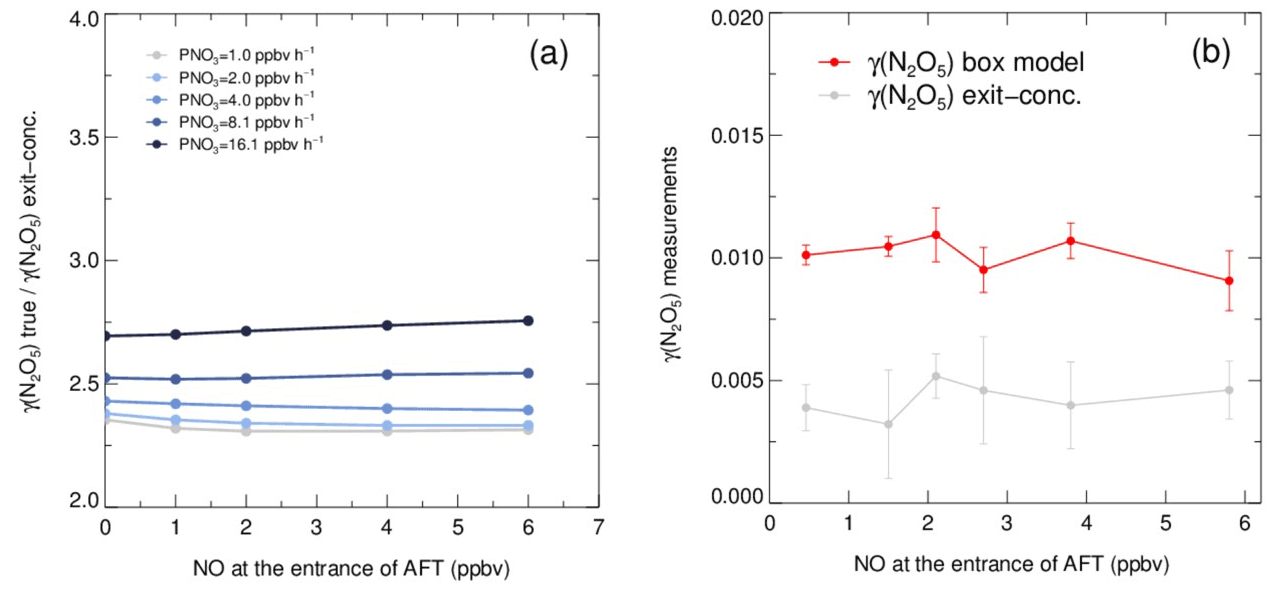
Figure 6Simulated and laboratory tests on the performance of the box model method and exit concentration method for γ(N2O5) derivation. (a) The ratios of given γ(N2O5) (γ(N2O5) true) over exit concentration-derived γ(N2O5) (γ(N2O5) exit conc.) determined from simulated scenarios. The γ(N2O5) derived by the box model method is exactly the same as γ(N2O5) true. The ratios vary with NO concentration, and the lines are color coded by PNO3 values. Both NO concentration and PNO3 represent the values at the entrance of the aerosol flow tube. (b) γ(N2O5) measurements on laboratory-generated (NH4)2SO4 aerosols under different gradients of NO with a constant RH of 50 % and PNO3 typically generated from our N2O5 source. The red line shows the γ(N2O5) derived by the box model method, and the gray line shows the γ(N2O5) derived by the exit concentration method. The NO concentrations are measured at the entrance of the aerosol flow tube.
In comparison to the work by Bertram et al. (2009a) and W. Wang et al. (2018), the combination of the above box model method and the improved flow tube system in this study has made progress in the following aspects. First, the dynamic quantification of kwall of N2O5 within each duty cycle based on the constraint of sequentially measured N2O5 sources is helpful to provide accurate data for both kwall and γ(N2O5) retrieval. The kwall in ambient conditions could deviate from the results of laboratory tests (Fig. B1) due to temperature variations and particle adsorption, which leads to large uncertainty when calculating γ(N2O5) without the frequent determination of kwall. While the kwall was also determined frequently in the flow tube of W. Wang et al. (2018), the N2O5 source they used for kwall and γ(N2O5) retrieval is an assumed stable value instead of an observed one. Second, in this work, the concentrations of initial NO, NO2, O3 and N2O5 at the entrance of the flow tube and the exit N2O5 are obtained through programmed cyclic measurements, which can reduce the uncertainties by adding the model constraints. It is different from the iterative box model used in W. Wang et al. (2018), as we enable a straightforward simulation of NO3-N2O5 chemistry occurring in the flow tube instead of estimating the initial NO2 and O3, with an assumed NO profile and stable N2O5 source based on backward simulations. In ambient conditions, the initial N2O5 concentration can be largely influenced by air mass conditions (especially NO concentration and temperature). Figure B2a presents a box whisker plot of N2O5 and NO concentrations at the flow tube entrance during a field campaign, which shows a much larger variation of N2O5 than in laboratory conditions (<1 %). As a result, the box model would underestimate γ(N2O5) by using a fixed initial N2O5 concentration under certain circumstances (Fig. B2b). Third, we simulate the NO3–N2O5 relationship via specific reactions rather than by approximating it in equilibrium and introducing the equilibrium coefficient (Keq) into the calculation. Calculating NO3 or N2O5 concentrations by means of Keq could induce a large bias (up to 90 %) under the high aerosol loading and low temperature (Chen et al., 2022).
4.1 Particle transmission efficiency
The transmission efficiency of particles in the sampling module and flow tube are estimated respectively in Fig. 7. In the laboratory, pure ammonia nitrate ((NH4)2SO4) aerosols were generated from an atomizer loaded with 0.1 M (NH4)2SO4 solution. The RH and concentration of the produced aerosol flow were conditioned in a glass bottle (∼2 L) by introducing a humidified dilution flow of ultrahigh-purity N2. As a result, aerosols in different concentrations (1000–4500 µm2 cm−3) and under a range of RH (20 %–70 %) were applied to test the transmission efficiency. Figure 7a shows that the loss of total Sa concentrations in the sampling module and flow tube are 8±1 % and 10±2 % on average, respectively. We found that the fraction of particle loss is mainly caused by particles smaller than 100 nm. This is most likely due to the turbulence generated by the static mixer and the recirculation in the flow tube. Large particles are prone to stay within the main flow direction, whereas small particles readily adsorb on the walls by the entrainment of turbulence or recirculation. In addition, the particle distribution measured at the exit of the flow tube with the HEPA inline (gray line in Fig. 7a) demonstrated its capability of removing almost all particles (>99.5 %) at the typical flow rate. The same transmission efficiency as that on laboratory-generated aerosols was also found on ambient aerosols (Fig. 7b). The results we obtained from the above particle transmission experiments are similar to the findings of Bertram et al. (2009a).
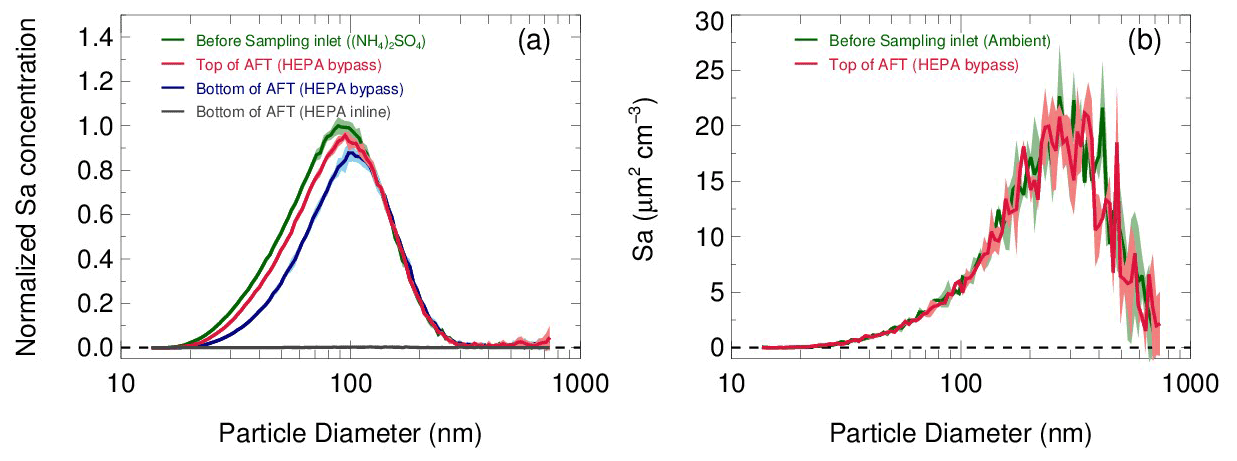
Figure 7(a) Particle transmission determined by sampling laboratory-generated (NH4)2SO4 aerosols. Aerosols at different concentrations and RH levels are used in experiments, and the size distributions of Sa concentrations are normalized to the peak values. The normalized size distributions of Sa concentrations measured before the sampling inlet (green line), at the inlet of the flow tube with the HEPA bypass (red line) and at the bottom of the flow tube with the HEPA bypass (blue line) are shown respectively. Under the HEPA inline mode, the Sa concentration was almost zero at the bottom of flow tube (gray line). The shadows indicate the standard deviations of the normalized Sa concentrations for all experiments. (b) Particle transmission determined by sampling ambient particles.
4.2 Residence time in the flow tube
The method of residence time distribution (RTD) was applied to estimate the average reaction time of the gas species in the flow tube (residence time). In comparison to ideal plug flow, the RTD method can better describe the actual behavior of the flow in practice and determine the mean residence time more accurately (Danckwerts, 1953). Several studies have also used this RTD method to determine the residence time in the flow tube (Huang et al., 2017; W. Wang et al., 2018; Lambe et al., 2011).
The RTD profiles were obtained by introducing a two-second pulse of NO2 gas diluted in N2 into the flow tube under RH less than 1 %. NO2 is relatively inert against the flow tube wall coated with FEP and was measured at the exit of the flow tube by a CEAS (Li et al., 2021) at a high time resolution (2 Hz). A three-way solenoid valve combined with a time relay was implemented to control the pulse in order to avoid the disturbance of the flow condition by the injection. Experiments were performed under typical operation. The mean residence time (tave) can be derived from each RTD profile according to Eq. (4):
where the Ci is the concentration of the NO2 recorded at the time step ti. From the RTD profiles of NO2 injection experiments in Fig. 8, the determined tave was 156±3 s. This value is 19 % less than the space time (τspace, flow tube volume divided by operation flow rate, 192.6 s). It has also been found that the assumption of ideal plug flow overestimated the residence time in previous flow tube experiments (Lambe et al., 2011; Huang et al., 2017; W. Wang et al., 2018), which could lead to the underestimation of the derived . The residence time of the current setup is designed for investigating γ(N2O5) in typical episode days with medium to high aerosol loadings (a Sa concentration usually larger than 500 µm2 cm−3) in polluted regions. As shown in Sect. 5, the detection limit of this system is with Sa of 500 µm2 cm−3, which is well below most of the previous ambient γ(N2O5) results ranging from to >0.1 in polluted regions of China (H. Wang et al., 2020a; X. Wang et al., 2017; Z. Wang et al., 2017; Xia et al., 2019). The residence time determined in this work is also slightly higher than the 149 s reported in a previous work focused on investigating γ(N2O5) in polluted regions (W. Wang et al., 2018). In addition, the residence time for this flow tube can be extended to over 300 s to satisfy the γ(N2O5) measurement requirements under low Sa by reducing the flow rate of air passing through, which is controlled by an extra pump.
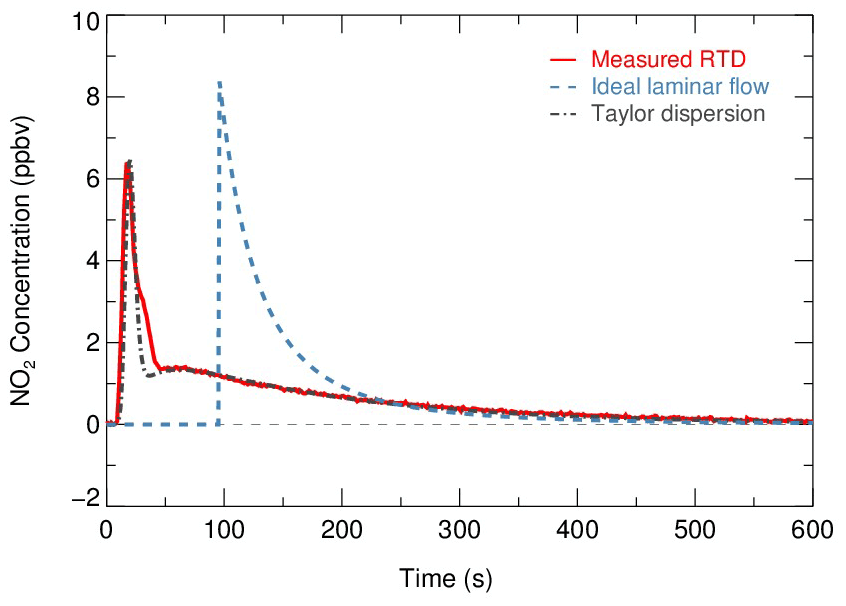
Figure 8Residence time distribution derived by sampling NO2 gas. Red solid line indicates the measured RTD profiles. The calculated RTD of ideal laminar flow (without dispersions) and the Taylor dispersion model fitted to measurements are shown as a blue dashed line and dot-dash line, respectively.
Two theoretical RTDs were calculated – namely, ideal laminar flow and Taylor diffusion – besides the measured RTD, intended to reflect the fluid field inside the flow tube. The ideal laminar flow describes the flow without dispersion. The velocity profile of the ideal laminar flow is parabolic, with the fluid in the center of the tube moving the fastest. According to the following Eq. (5), the RTD of the ideal laminar flow is scaled by the integrated concentration of NO2 and is presented as the blue dashed line in Fig. 8.
While the determined Re is well within the laminar flow threshold, the measured RTD occurs earlier than the theoretical laminar flow condition and exhibits a broadened distribution. The discrepancy between them indicates that the dispersions or potential secondary flows could dominate the flow regime. Instead, an improved Taylor dispersion model (shown as the gray dot-dash line in Fig. 8) is able to reproduce the measured RTD, which was previously implemented in the characterization of photooxidation flow reactors (Lambe et al., 2011). Two flow patterns with distinct effective diffusivities (0.02 and 0.51, derived from best fit) were considered in this dispersion model. An implication from the characteristics of the model is that the flow regime consists of two flow components: a direct flow path through the flow tube with less diffusion and a secondary flow path representing the recirculation in the dead zone that is induced by temperature gradient and significant diffusions (Huang et al., 2017).
4.3 N2O5 wall loss
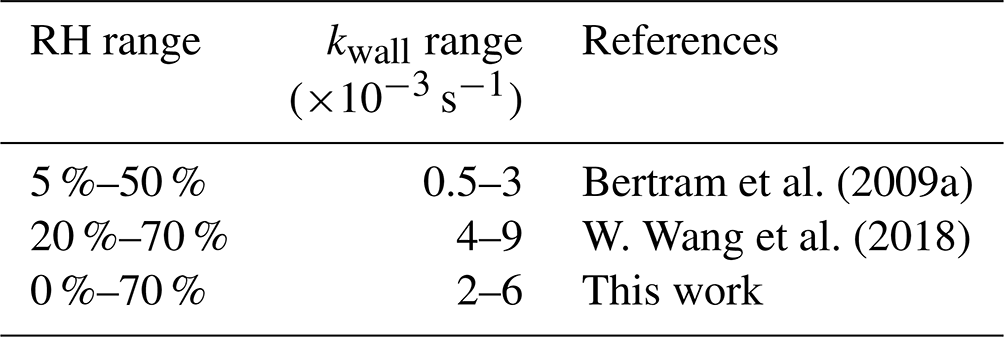
Laboratory tests were conducted to quantify the kwall of N2O5 under different levels of RH with the HEPA inline. As shown in Fig. 9, the kwall of N2O5 gradually increases from 0.002 s−1 in a dry condition to 0.006 s−1 when RH is 70 %. The level of kwall is less than the result of W. Wang et al. (2018) but higher than the result of Bertram et al. (2009a), as indicated in Table 2. In addition, the flow tube was rinsed with deionized water every week during the field campaigns to remove the build-up of particles, which might increase the hygroscopicity of the internal surface and thus the kwall of N2O5 in a wet condition. Uncertainty in γ(N2O5) derivation that resulted from the variation of kwall related to RH is discussed in Sect. 5.
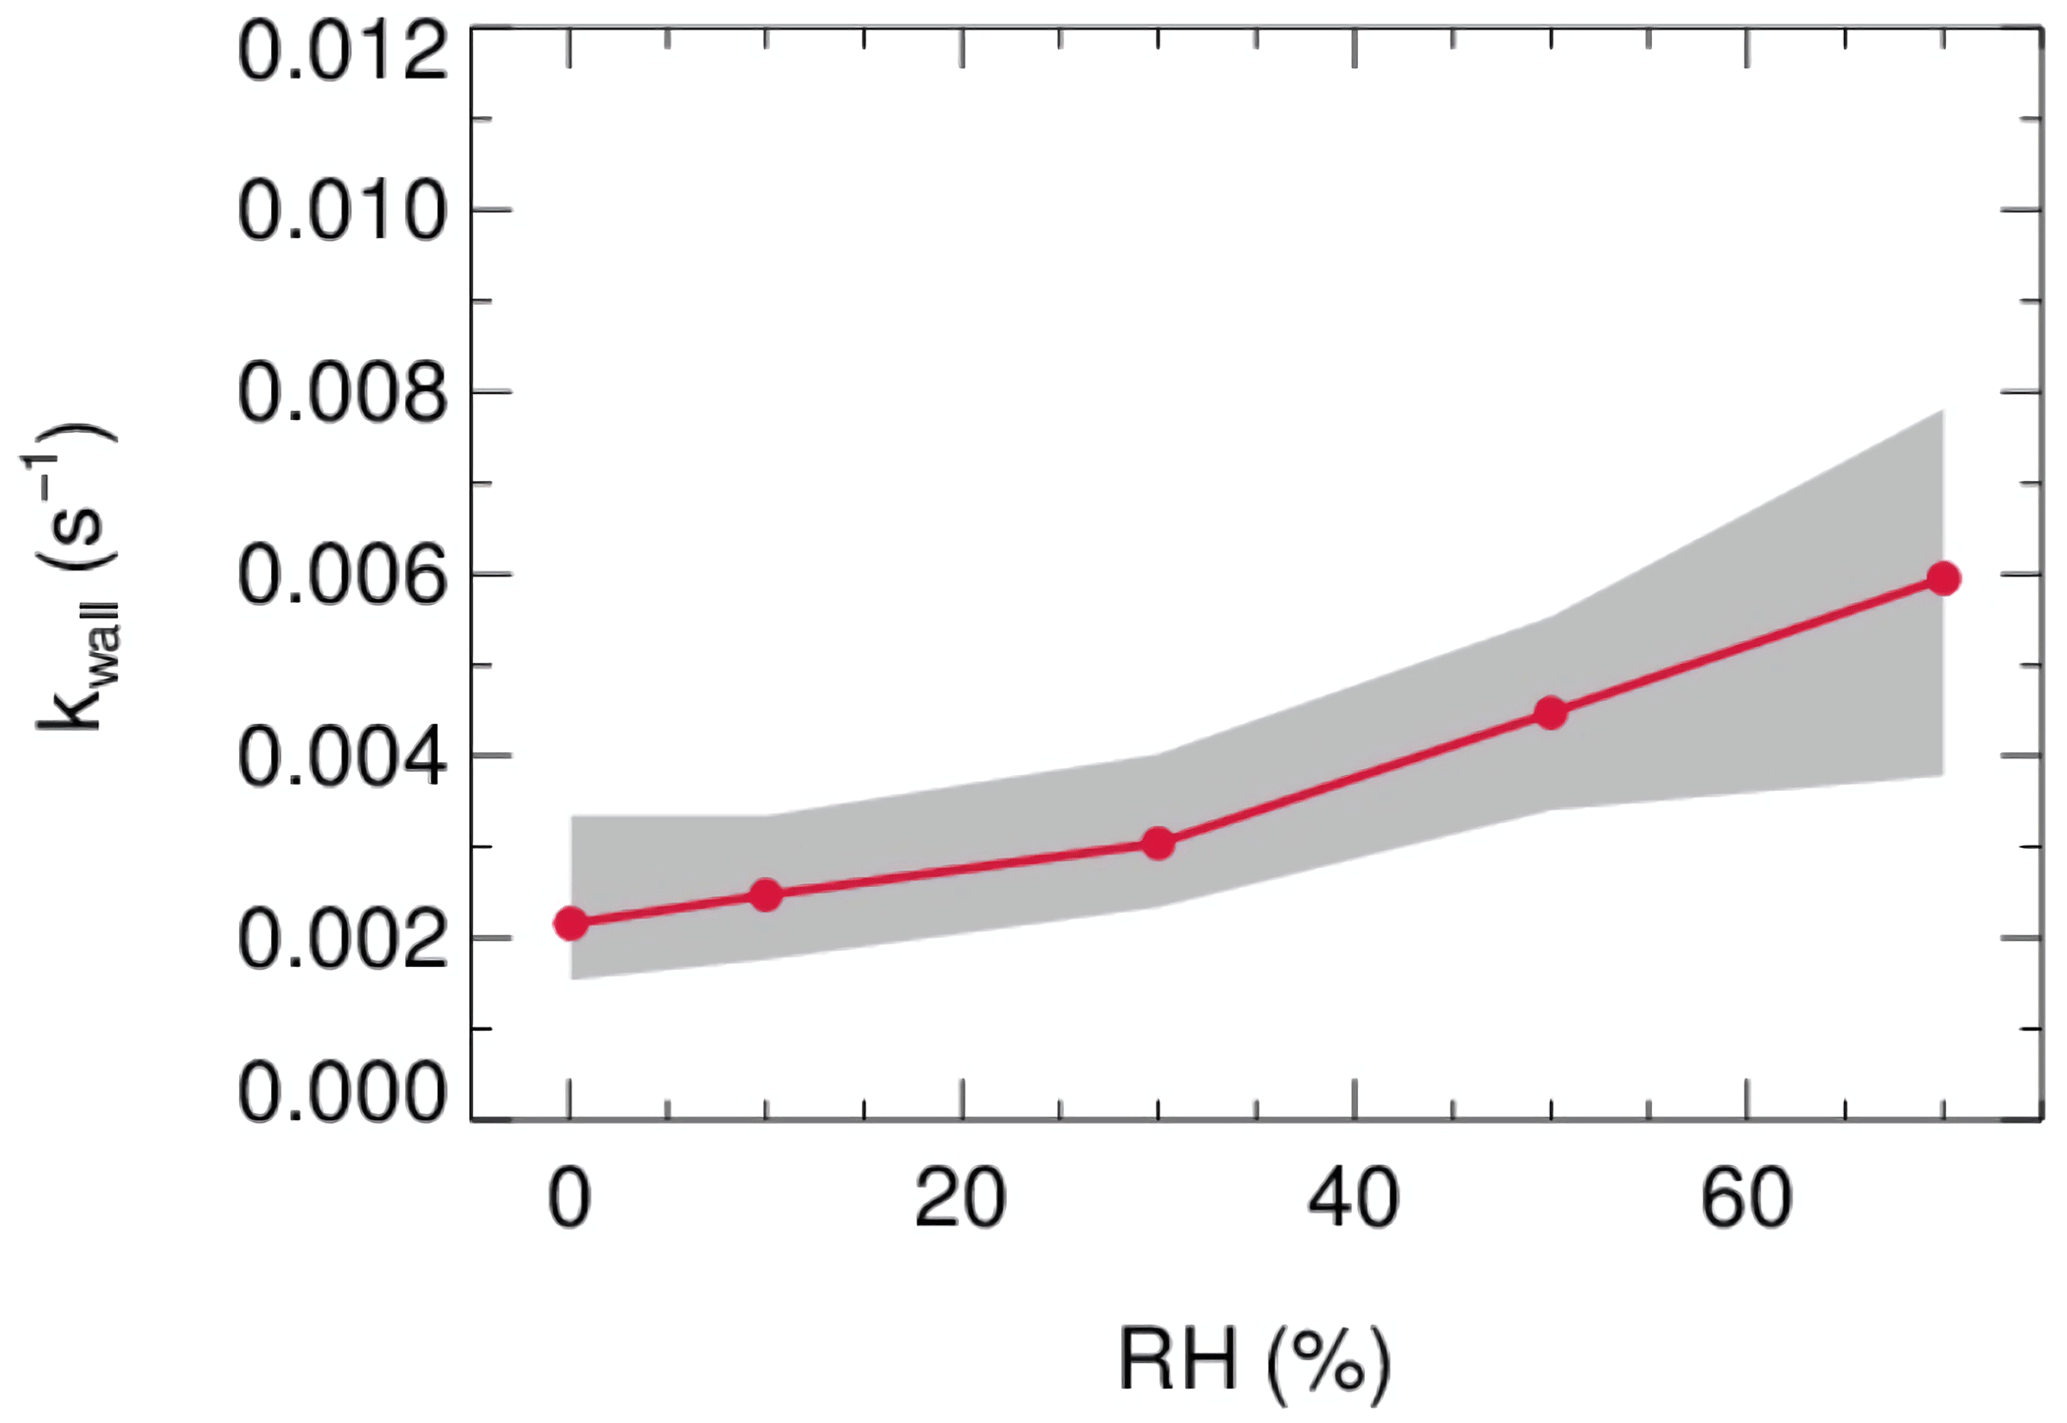
Figure 9The dependence of the pseudo-first-order wall loss coefficient (kwall) on N2O5 in the FEP-coated aerosol flow tube.
Table 2Summary of the kwall of N2O5 for the existing aerosol flow tube deployed in field campaigns.
4.4 Demonstration of γ(N2O5) measurements on model particles
Measurements of γ(N2O5) made by the current aerosol flow tube system equipped with a box model method were performed on laboratory-generated (NH4)2SO4 aerosols over a range of RH. The system was operated at room temperature of 295K with an N2O5 concentration of 4.0 ppbv at the entrance of flow tube. We conditioned the RH of generated aerosols by introducing dry N2 gas dilution, which could decrease the RH level down to 10 %–55 %, starting from over 95 %, where (NH4)2SO4 aerosols are expected to be in aqueous state. The resulting Sa concentrations of aerosols were around 600 µm2 cm−3. As shown in Fig. 10, the observed γ(N2O5) values were below 0.01 when RH was within 40 % and significantly rose up to 0.02 with higher RH. The dependence of γ(N2O5) on RH and the exact values are consistent with previous laboratory results on (NH4)2SO4 aerosols (Badger et al., 2006; Hallquist et al., 2003; Hu and Abbatt, 1997; Kane et al., 2001; Mozurkewich and Calvert, 1988), which shows that the setup of our instrument has good practicability. A large standard deviation of γ(N2O5) found at RH of 39 % is possibly due to the unstable phase transition of (NH4)2SO4 particles, as its efflorescence RH is reportedly from 35 % to 48 % (Martin, 2000).
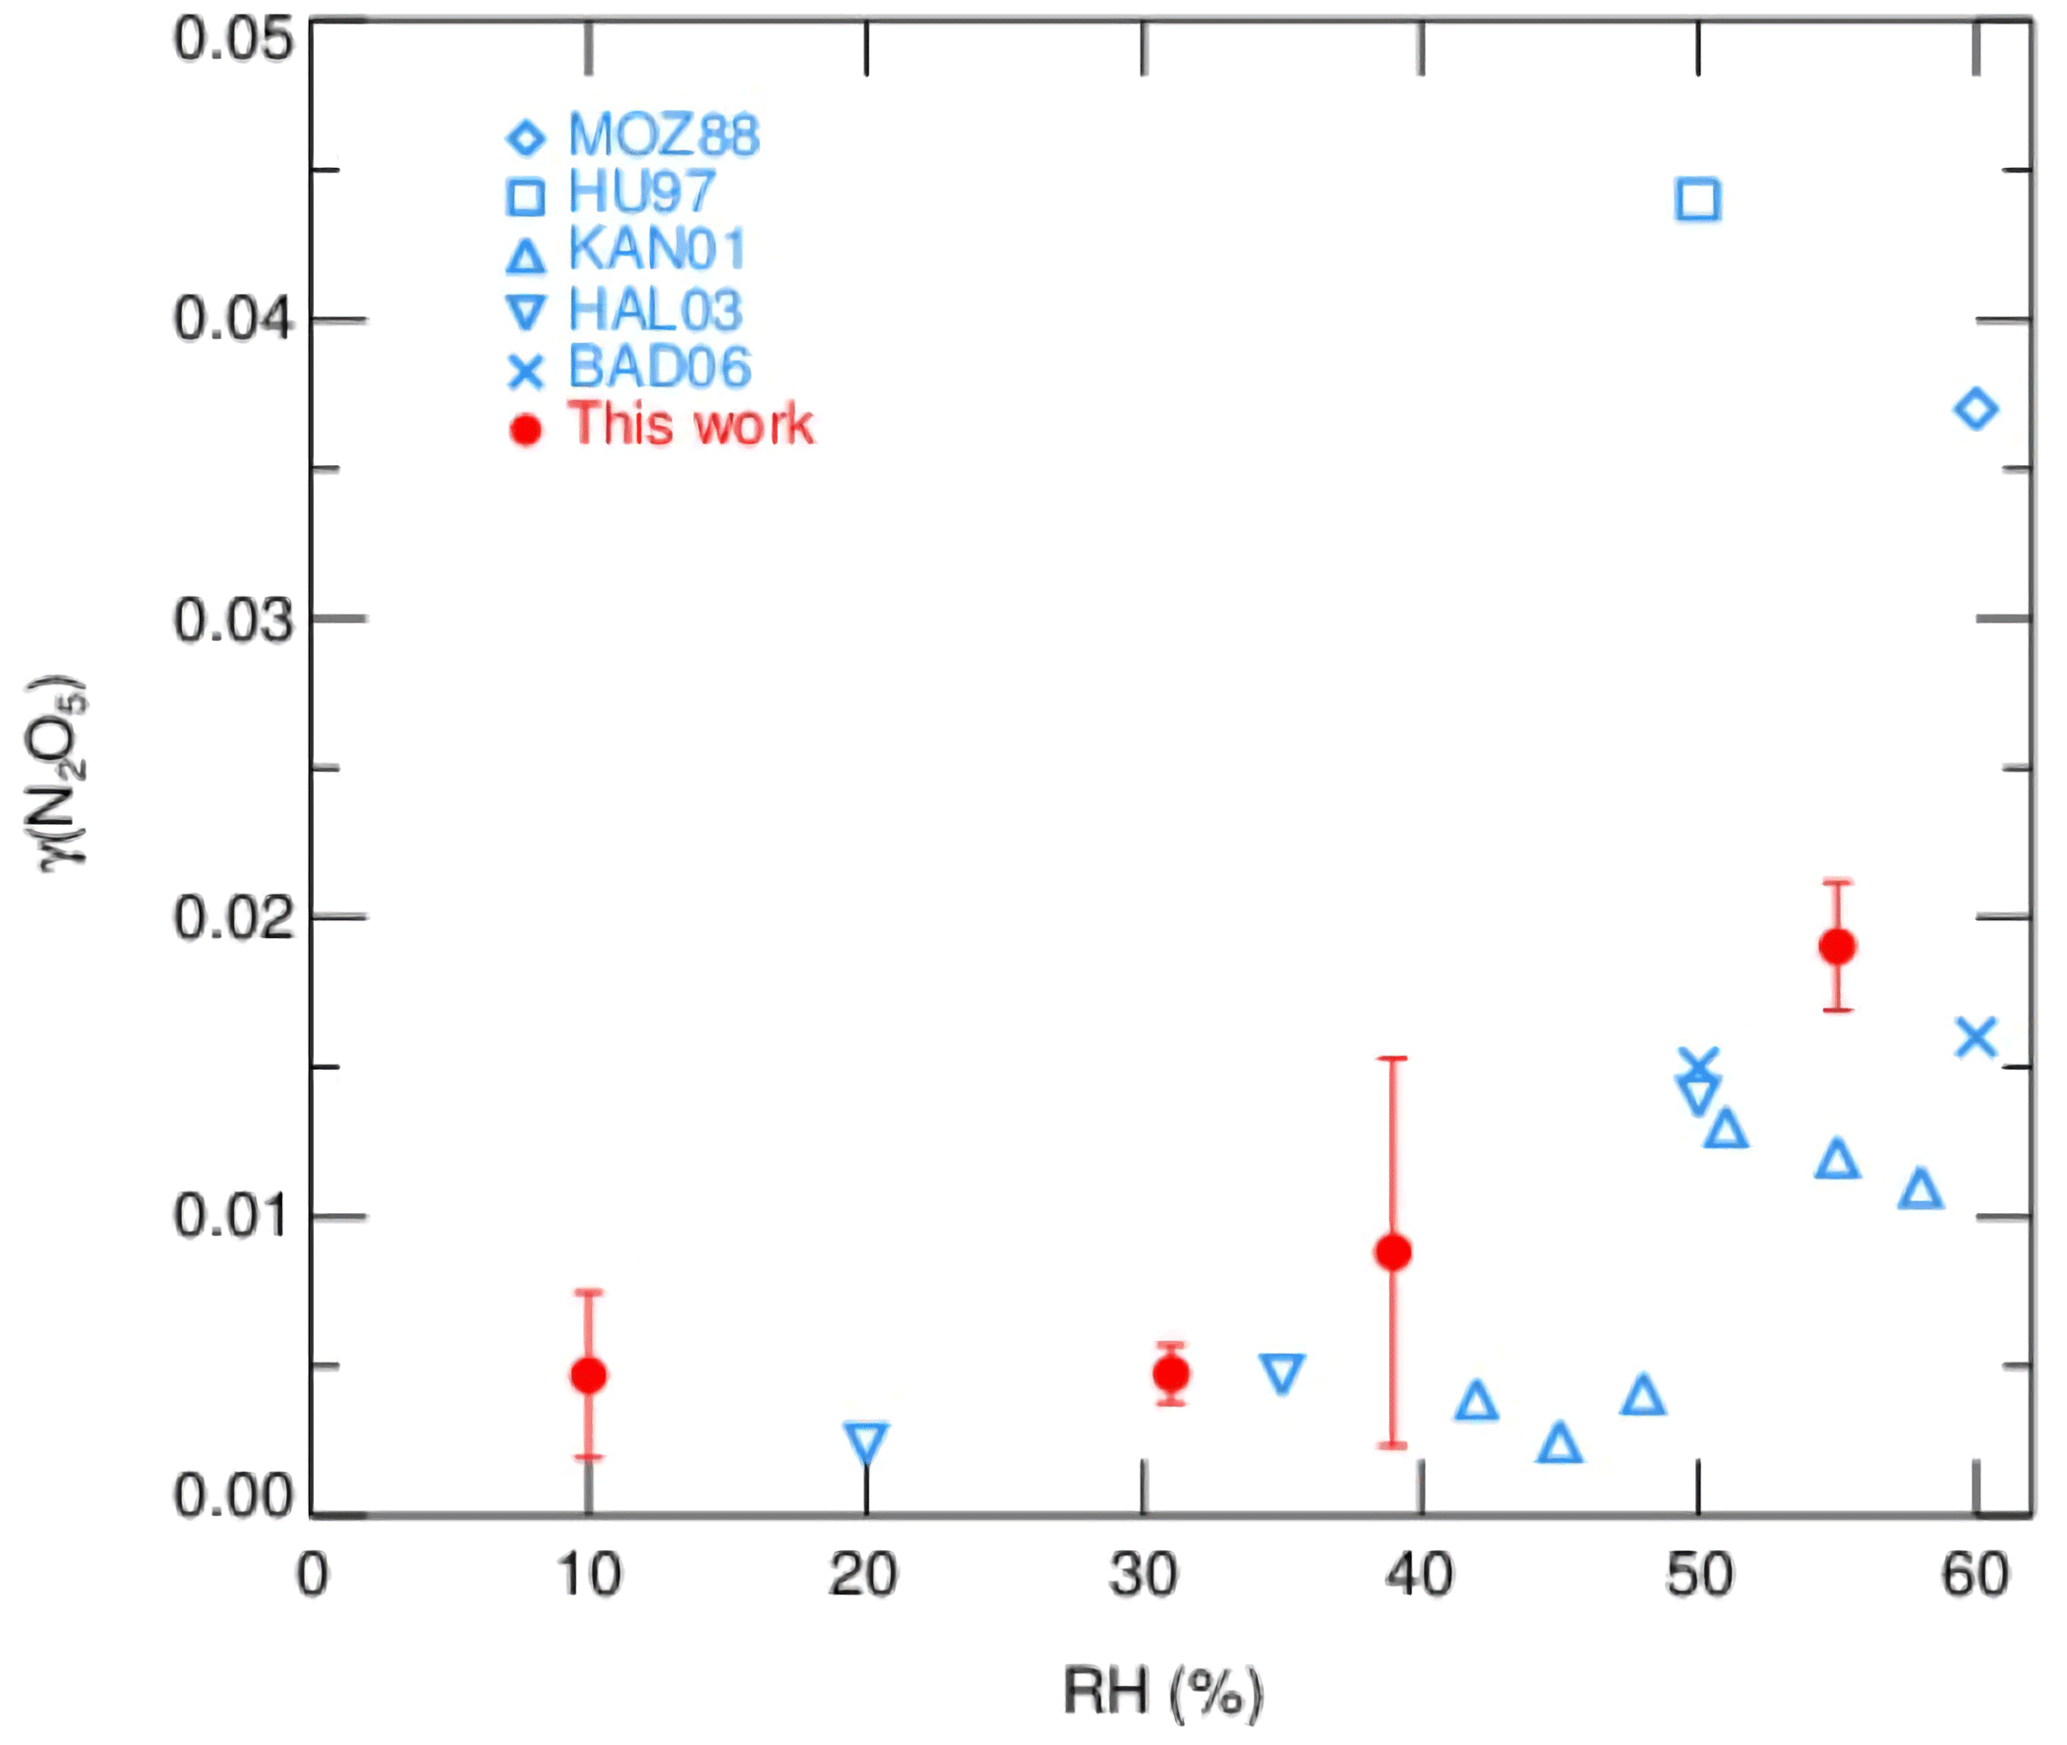
Figure 10The dependence of γ(N2O5) on RH for laboratory-generated (NH4)2SO4 aerosols. The red points with standard deviations represent the values measured by the current aerosol flow tube system in this work. Previously reported values are indicated in blue marks.
The uncertainty of γ(N2O5) is relevant to the measurement uncertainties of each instrument and the rapid fluctuations of various parameters. As outlined before, the five-minute averages of N2O5 concentrations measured at the inlet and exit of the flow tube were used for calculating γ(N2O5) via the box model method. The potential variations within these selected time periods would therefore lead to relative errors. For example, the variations of N2O5 concentrations result majorly from the rapid changes of ambient NO and less from variations of VOCs, NO2, O3 as well as the N2O5 gas source itself (1 % in 24 h). A cutoff of 10 % for N2O5 variation was implemented to filter out the air mass that was too unstable for valid analysis according to our prescribed criteria of data screening. It consequently leads to 10 % uncertainty in the average of N2O5 and can translate into a deviation of 2 % in γ(N2O5), with the γ(N2O5) at 0.02, Sa at 800 µm2 cm−3 and other parameters (shown in Table 3) representing the typical inlet values measured during the field campaign (described in Sect. 6). Similarly, cases that demonstrate over 2 % variation in RH between the HEPA inline and bypass modes are excluded from analysis owing to the significant influence of RH on kwall of N2O5 in the flow tube. By assuming a consistent kwall in successive sampling modes, the potential variations in RH could lead to uncertainty in γ(N2O5), from at RH of 20 % to at RH of 70 %, respectively, with the Sa at 800 µm2 cm−3. In addition, the is treated as constant in a duty cycle due to the limit of the time resolution of VOC measurements. A variation of ±0.01 s−1 in only induces less than ±1 % uncertainty in γ(N2O5) for more than 95 % of the cases obtained during the field campaign. All the impacts from inherent instrument uncertainties and variations of different parameters are thereby considered in Monte Carlo simulations to assess the overall uncertainty of γ(N2O5). The basic simulation is initialized, with the typical conditions measured at the inlet of the flow tube during the field campaign, and repeatedly performs the procedures of determining γ(N2O5) via the box model method 1000 times. In each run, all parameters were allowed to vary independently within a prescribed range. The basic simulation condition and variation ranges are presented in Table 3.
Table 3Parameters involved in the Monte Carlo simulations.
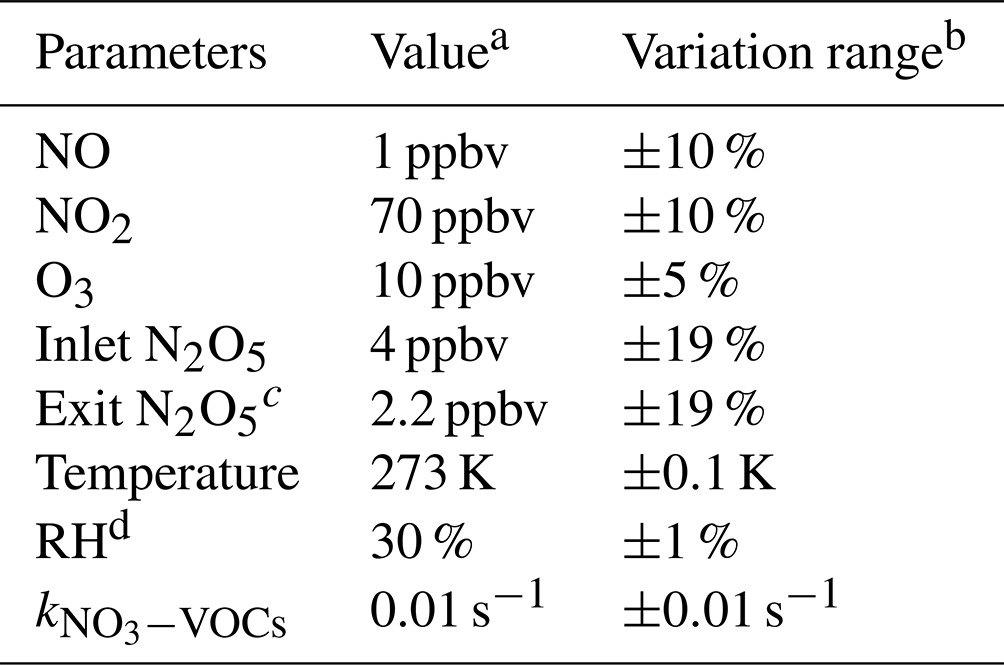
a Values used for initializing Monte Carlo simulations in a basic scenario. b Ranges within which each parameter can vary independently. c Determined from the case in which γ(N2O5) is at 0.02 and Sa is at 800 µm2 cm−3; other parameters are shown in this table. d The RH and its variation can be transformed into values in kwall of N2O5 via the fitting function derived from Fig. 9.
The resulting γ(N2O5) values from Monte Carlo simulations under the basic scenario are shown as frequency distributions in Fig. 11a. This distribution can be fitted by a Gaussian function, and the standard deviation (1σ) of Gaussian distribution is regarded as the overall uncertainty of γ(N2O5), which is (4.5 % relative to true γ(N2O5)). The uncertainty of Sa measurements and unmeasured particles larger than 730 nm (usually less than 5 % of the total Sa) would, together, introduce an extra 16 % uncertainty to γ(N2O5).
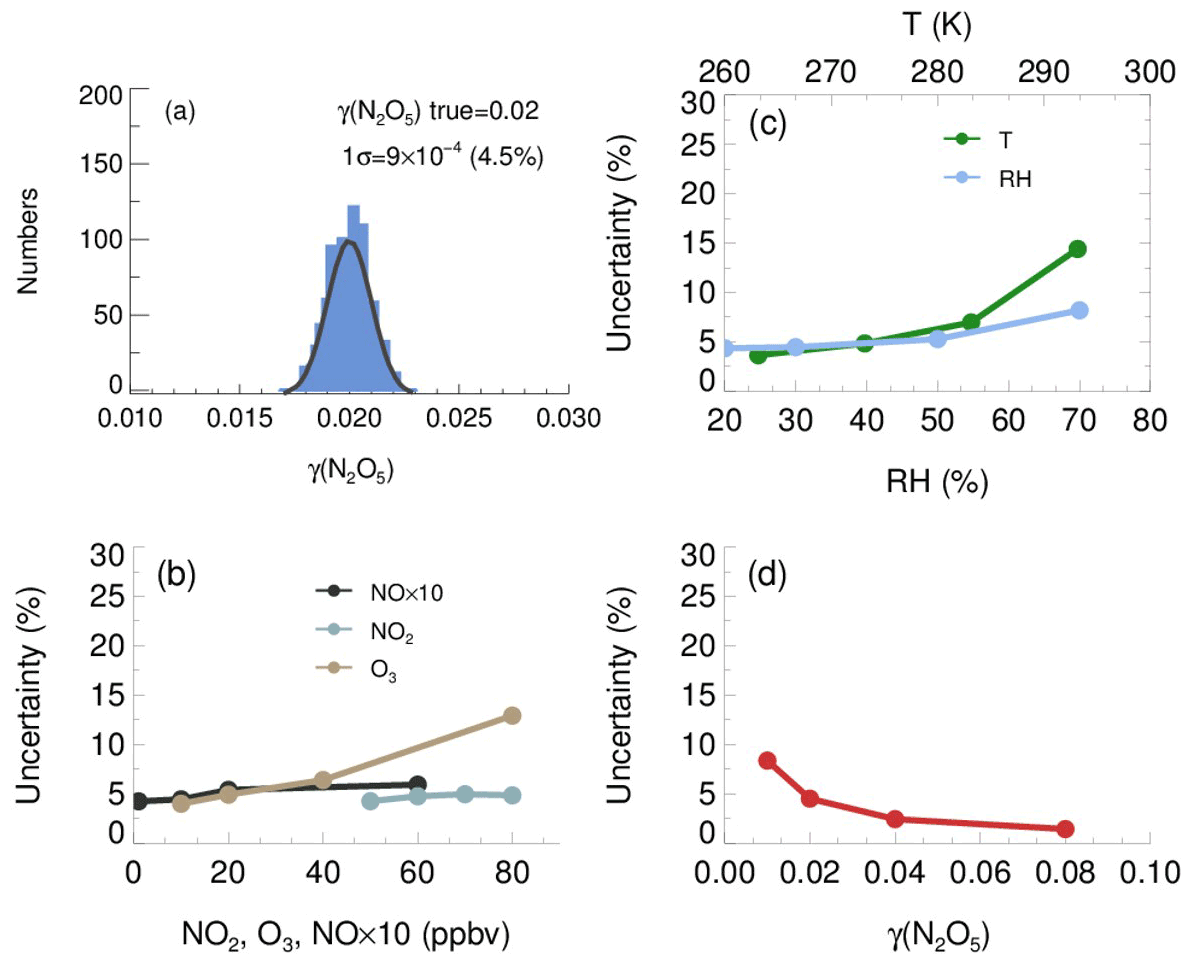
Figure 11The uncertainty of γ(N2O5) determined from the Monte Carlo simulations. (a) Histogram distribution of γ(N2O5) generated from a Monte Carlo simulation (1000 single runs) in the basic scenario (shown in Table 3), where the overall uncertainty of γ(N2O5) was determined to be ; (b) dependence of the uncertainty of γ(N2O5) on NO, NO2 and O3; (c) dependence of the uncertainty of γ(N2O5) on RH and T; (d) dependence of the γ(N2O5) uncertainty on γ(N2O5) level.
We further found that the uncertainty of γ(N2O5) could be sensitive to the measurement conditions. With higher O3, potential variations of NO and will induce larger uncertainty of γ(N2O5) (Fig. 11b), as it enhances the abundance of NO3 and N2O5. In comparison, the low O3 in the basic scenario suppressed the side formation of NO3 in the flow tube, limiting the aggravation of γ(N2O5) uncertainty as a result of the increase of NO and NO2. The γ(N2O5) uncertainty is also positively correlated with RH and T. As discussed before, the kwall of N2O5 increases with RH level, which can amplify the potential bias of kwall at a higher RH level. The equilibrium between NO3 and N2O5 shifts towards the decomposition of N2O5 at higher T, leading to larger uncertainty of γ(N2O5), caused by potential variations of NO and . The overall uncertainty of γ(N2O5) therefore rises to 8.2 % at the RH of 70 % and to 14.4 % at the temperature of 293 K (Fig. 11c), with NO, NO2, O3, γ(N2O5) and Sa staying the same as the basic scenario. In addition, Monte Carlo simulations were also performed for different γ(N2O5) values ranging from 0.01 to 0.08. The uncertainty of γ(N2O5) clearly decreased with the γ(N2O5) (Fig. 11d). A lower γ(N2O5) weakened the impact that N2O5 uptakes has on the budgets of NO3 and N2O5, which causes the γ(N2O5) derivation to be more susceptible to the uncertainties of other parameters and then increases the uncertainty of γ(N2O5).
In addition, the mean residence time used in the box model method could bias the retrieved γ(N2O5) due to the non-normal distribution of the residence time with a discernable tail. The reactants entrained by those slower streamlines close to the wall will take a much longer time to reach the exit of the flow tube than those by the centerline. In order to evaluate the uncertainty caused by the distribution of residence time, we first performed simulations of N2O5 decay in the flow tube under the basic scenarios and calculated the exit N2O5 concentration according to the probability distribution function derived from the RTD profile. Then, the γ(N2O5) can be retrieved from the box model method running for the duration of the mean residence time, constrained by this calculated exit N2O5 concentration. The result shows that the use of mean residence time produces a 32 % underestimation of γ(N2O5) in the basic scenario. The extent of underestimation is most sensitive to the level of γ(N2O5) and RH. In short, when taking all the factors and their corresponding varying ranges discussed above into consideration, the overall uncertainty of γ(N2O5) determined from Monte Carlo simulations is in the range of 16 %–43 %. To directly compare with previous studies, at 0.03 γ(N2O5) with 1000 µm2 cm−3 Sa, the uncertainty is calculated to be 19 %, which is lower than the ∼24 % in Bertram et al. (2009a) and than the range of 37 %–40 % in W. Wang et al. (2018).
In order to determine the detection limit of the current aerosol tube system, the continuous blank measurements in zero air were performed with settled operation procedures. Within each duty cycle (40 min), one kwall of N2O5 and one γ(N2O5) can be derived in a pair. In total, we obtained 56 sets of results. The detection limit of on aerosols is s−1, derived from 1σ of the Gaussian function fitted to this distribution. It is equivalent to 0.0016 for the detection limit of γ(N2O5), with a low Sa condition of 200 µm2 cm−3 (Fig. 12a), and 0.00064 for the detection limit of γ(N2O5), with a moderate Sa condition of 500 µm2 cm−3 (Fig. 12b). This result indicates that the flow tube system is capable of quantifying γ(N2O5) for most cases, even under a low aerosol-loading environment.
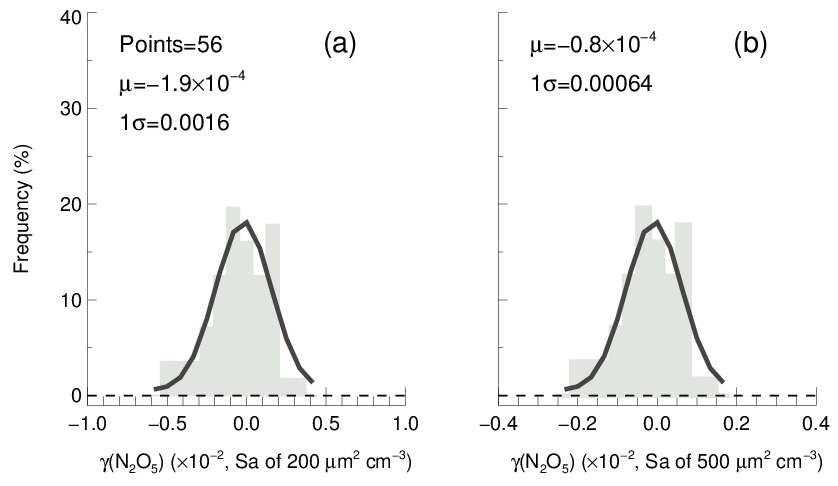
Figure 12The γ(N2O5) derived from blank measurements in a histogram distribution plot. The γ(N2O5) was calculated from by means of Eq. (2) with Sa of (a) 200 µm2 cm−3 and (b) 500 µm2 cm−3, respectively, under the temperature of 293 K. The Gaussian function is fitted to the distribution and plotted in a black line. The 1σ from the Gaussian fit is regarded as the detection limit.
The aerosol flow tube system was successfully deployed to measure γ(N2O5) on ambient aerosols in Beijing, lasting for 20 d during December 2020. The sampling site was at the campus of Peking University, which is located in the city center of Beijing, surrounded by major roads with heavy traffic. Therefore, this site represents an area with a large amount of fresh emissions of NOx and other anthropogenic sources. The system was mounted on the top floor of a building about 15 m in height above the ground. The sampling manifold was placed in open air, and the ambient aerosols could directly enter the inlet of the manifold without additional sampling tubes. During the period of measurement, the averages of ambient temperature, RH, NO, NO2, O3 and Sa were 273±3 K, 25±12 %, 23±36 ppbv, 23±12 ppbv, 16±15 ppbv and 409±249 µm2 cm−3, respectively. The NO and Sa levels could vary by 2 orders of magnitude due to the periodical switch between clean air mass from the north and pollutants accumulated by local emissions.
A total of 99 valid γ(N2O5) values were determined from the measurements based on the criteria of data screening described in Sect. 3.1. We found that γ(N2O5) was 0.042±0.026, on average, with a median of 0.035, ranging from 0.0045 to 0.12 (Fig. 13). These results are comparable to that previously determined in the north of China using various different methods (H. Wang et al., 2017b, 2018b; X. Wang et al., 2017; Z. Wang et al., 2017; Xia et al., 2019; Yu et al., 2020). The kwall of N2O5 corresponding to valid γ(N2O5) measurements was rather stable at an average of 0.0021±0.0007 s−1, which was consistent with the values determined at similar RH levels in the laboratory tests. It somehow reflected the robustness of the status of the flow tube system and the derived results.

In the current system, the N2O5 concentrations measured at both the entrance and exit of the flow tube are sensitive to the NO fluctuations within the timescale of one sampling mode, which can induce large uncertainty in calculating γ(N2O5). With our stringent criteria of data screening, the cases of drastic NO fluctuations were excluded from the analysis. Hence, the majority of valid γ(N2O5) for this campaign were obtained during the periods of the NO below 2 ppbv, when the clean air mass was dominant at this urban site. Meanwhile, the Sa concentrations within clean episodes were lower than during other periods, with an average of 159 µm2 cm−3. The derived ranged from to s−1, well above the detection limit, which demonstrated the robustness of results, even subject to low ambient Sa conditions. In order to improve the applicability of γ(N2O5) measurements, future development is suggested to give priority to removing NO (at least the fluctuation of NO) in the sampling system before the entrance of the flow tube without the cost of particle transmission efficiency.
We report the new development of an aerosol flow tube system coupled with a detailed box model to derive γ(N2O5) on ambient aerosols directly. The unique feature of this system is that the sequential N2O5 measurement at both ends of the flow tube was applied to improve the accuracy in quantifying γ(N2O5) by taking it as a constraint for the box model to reproduce the decay of introduced N2O5 gas sources in the flow tube. With the consideration of detailed chemistry related to N2O5, the proposed approach was testified to refrain from the interference of side reactions (induced by the additional N2O5 generation), NO titration in the flow tube and variations of air masses between successive sampling modes.
A series of laboratory tests were performed to characterize factors affecting γ(N2O5) derivation and to demonstrate the system's applicability to (NH4)2SO4 aerosols. The uncertainties associated with the instruments used in the system and potential fluctuations of various parameters were thoroughly discussed in the uncertainty analysis, and we estimated the overall uncertainty of γ(N2O5) to be 16 %–43 %, which is subject to NO, NO2, O3, meteorological parameters, residence time and the γ(N2O5) value itself. The detection limit of γ(N2O5) was quantified to be 0.0016 at the aerosol surface concentration (Sa) of 200 µm2 cm−3. We deployed this system for field observations of γ(N2O5) at an urban site in Beijing, where strong anthropogenic emissions and frequent switches of air mass were encountered. The obtained γ(N2O5) was comparable to previously reported values in northern China and demonstrated the robustness of this system during low NO episodes. Further investigations by the introduced approach on N2O5-heterogeneous chemistry for both laboratory-generated and ambient particles are also available.
A total of 59 kinds of VOCs were measured by GC-FID-MS in this work, half of which had known rate constants that can be used to parameterize the reaction of NO3 with VOCs (mainly composed of alkenes and aromatics) in γ(N2O5) retrieval by the box model method (see also Sect. 3). Their rate constants were obtained from MCM331 or IUPAC, and the values at 298 K are listed in Table A1.
Table A1VOCs used to calculate NO3 reactivity () in the box model method.
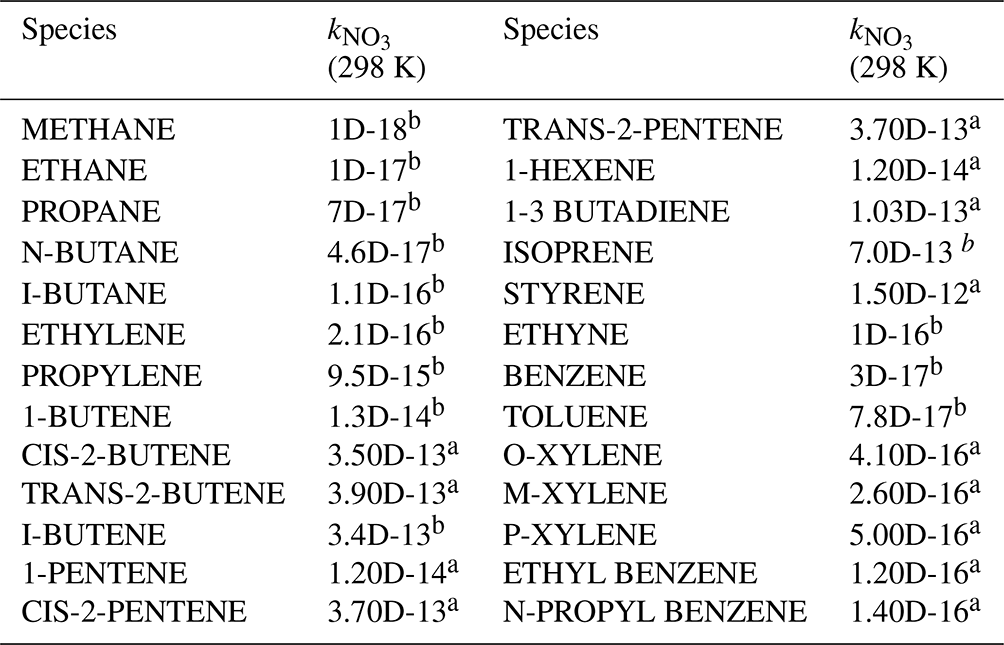
Note: a MCM; b IUPAC.
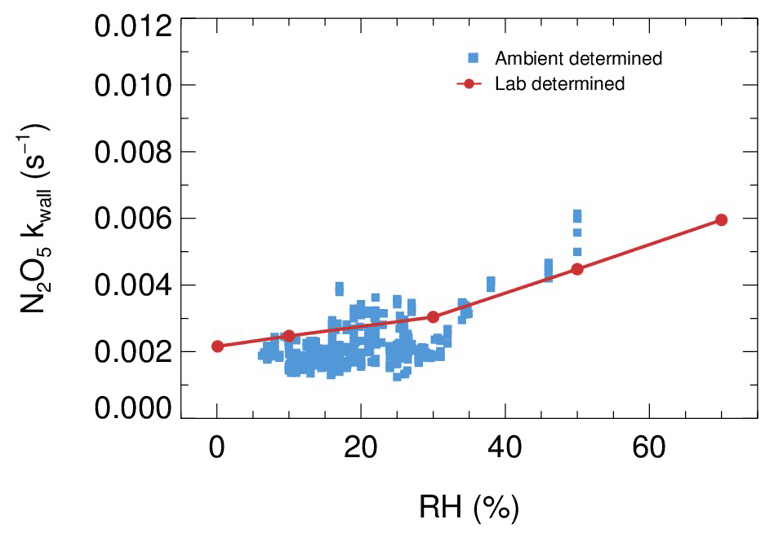
Figure B1The derived dependence of N2O5 wall loss on RH under laboratory conditions (red dots) and in field measurements (blue square).
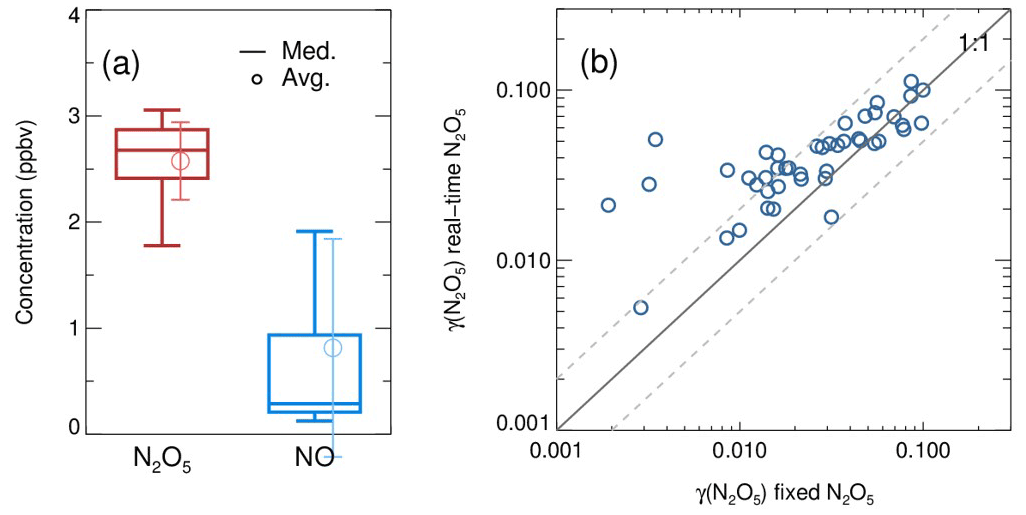
Figure B2(a) The box whisker of N2O5 source and NO measured before the entrance; (b) the intercomparison of derived N2O5 uptake coefficients by using a fixed initial N2O5 and a dynamic measured N2O5 at the flow tube entrance in the iterative box model.
The datasets used in this study are available from the corresponding author upon request (wanghch27@mail.sysu.edu.cn, k.lu@pku.edu.cn).
KDL and HCW designed the study. XRC and HCW analyzed the data and wrote the paper with input from KDL.
At least one of the (co-)authors is a member of the editorial board of Atmospheric Measurement Techniques. The peer-review process was guided by an independent editor, and the authors also have no other competing interests to declare.
Publisher’s note: Copernicus Publications remains neutral with regard to jurisdictional claims in published maps and institutional affiliations.
Thanks is given to the field campaign team for the data contributed.
This research has been supported by the National Natural Science Foundation of China (grant nos. 21976006 and 42175111), the Beijing Municipal Natural Science Foundation (grant no. JQ19031), the State Environmental Protection Key Laboratory of Sources and Control of Air Pollution Complex (grant no. CX2020080578), the National Key Basic Research Program For Youth (grant nos. DQGG0103-01 and 2019YFC0214800), and the special fund of the State Key Joint Laboratory of Environment Simulation and Pollution Control (grant no. 21K02ESPCP).
This paper was edited by Cheng Liu and reviewed by four anonymous referees.
Ahern, A. T., Goldberger, L., Jahl, L., Thornton, J., and Sullivan, R. C.: Production of N2O5 and ClNO2 through Nocturnal Processing of Biomass-Burning Aerosol, Environ. Sci. Technol., 52, 550–559, https://doi.org/10.1021/acs.est.7b04386, 2018.
Anttila, T., Kiendler-Scharr, A., Tillmann, R., and Mentel, T. F.: On the reactive uptake of gaseous compounds by organic-coated aqueous aerosols: Theoretical analysis and application to the heterogeneous hydrolysis of N2O5, J. Phys. Chem. A, 110, 10435–10443, https://doi.org/10.1021/jp062403c, 2006.
Baasandorj, M., Hoch, S. W., Bares, R., Lin, J. C., Brown, S. S., Millet, D. B., Martin, R., Kelly, K., Zarzana, K. J., Whiteman, C. D., Dube, W. P., Tonnesen, G., Jaramillo, I. C., and Sohl, J.: Coupling between Chemical and Meteorological Processes under Persistent Cold-Air Pool Conditions: Evolution of Wintertime PM2.5 Pollution Events and N2O5 Observations in Utah's Salt Lake Valley, Environ. Sci. Technol., 51, 5941–5950, https://doi.org/10.1021/acs.est.6b06603, 2017.
Badger, C. L., Griffiths, P. T., George, I., Abbatt, J. P. D., and Cox, R. A.: Reactive uptake of N2O5 by aerosol particles containing mixtures of humic acid and ammonium sulfate, J. Phys. Chem. A, 110, 6986–6994, https://doi.org/10.1021/jp0562678, 2006.
Bertram, A. K., Martin, S. T., Hanna, S. J., Smith, M. L., Bodsworth, A., Chen, Q., Kuwata, M., Liu, A., You, Y., and Zorn, S. R.: Predicting the relative humidities of liquid-liquid phase separation, efflorescence, and deliquescence of mixed particles of ammonium sulfate, organic material, and water using the organic-to-sulfate mass ratio of the particle and the oxygen-to-carbon elemental ratio of the organic component, Atmos. Chem. Phys., 11, 10995–11006, https://doi.org/10.5194/acp-11-10995-2011, 2011.
Bertram, T. H. and Thornton, J. A.: Toward a general parameterization of N2O5 reactivity on aqueous particles: the competing effects of particle liquid water, nitrate and chloride, Atmos. Chem. Phys., 9, 8351–8363, https://doi.org/10.5194/acp-9-8351-2009, 2009.
Bertram, T. H., Thornton, J. A., and Riedel, T. P.: An experimental technique for the direct measurement of N2O5 reactivity on ambient particles, Atmos. Meas. Tech., 2, 231–242, https://doi.org/10.5194/amt-2-231-2009, 2009a.
Bertram, T. H., Thornton, J. A., Riedel, T. P., Middlebrook, A. M., Bahreini, R., Bates, T. S., Quinn, P. K., and Coffman, D. J.: Direct observations of N2O5 reactivity on ambient aerosol particles, Geophys. Res. Lett., 36, L19803, https://doi.org/10.1029/2009gl040248, 2009b.
Brown, S. S. and Stutz, J.: Nighttime radical observations and chemistry, Chem. Soc. Rev., 41, 6405–6447, https://doi.org/10.1039/c2cs35181a, 2012.
Brown, S. S., Stark, H., Ciciora, S., McLaughlin, R., and Ravishankara, A. R.: Simultaneous in situ Detection of Atmospheric NO3 and N2O5 via Cavity Ring-down Spectroscopy, Rev. Sci. Instrum., 73, 3291–3301, https://doi.org/10.1063/1.1499214, 2002.
Brown, S. S., Ryerson, T. B., Wollny, A. G., Brock, C. A., Peltier, R., Sullivan, A. P., Weber, R. J., Dube, W. P., Trainer, M., Meagher, J. F., Fehsenfeld, F. C., and Ravishankara, A. R.: Variability in nocturnal nitrogen oxide processing and its role in regional air quality, Science, 311, 67–70, https://doi.org/10.1126/science.1120120, 2006.
Brown, S. S., Dube, W. P., Fuchs, H., Ryerson, T. B., Wollny, A. G., Brock, C. A., Bahreini, R., Middlebrook, A. M., Neuman, J. A., Atlas, E., Roberts, J. M., Osthoff, H. D., Trainer, M., Fehsenfeld, F. C., and Ravishankara, A. R.: Reactive uptake coefficients for N2O5 determined from aircraft measurements during the Second Texas Air Quality Study: Comparison to current model parameterizations, J. Geophys. Res., 114, D00F10, https://doi.org/10.1029/2008jd011679, 2009.
Brown, S. S., Dubé, W. P., Tham, Y. J., Zha, Q., Xue, L., Poon, S., Wang, Z., Blake, D. R., Tsui, W., Parrish, D. D., and Wang, T.: Nighttime chemistry at a high altitude site above Hong Kong, J. Geophys. Res.-Atmos., 121, 2457–2475, https://doi.org/10.1002/2015jd024566, 2016.
Chang, W. L., Bhave, P. V., Brown, S. S., Riemer, N., Stutz, J., and Dabdub, D.: Heterogeneous atmospheric chemistry, ambient measurements, and model calculations of N2O5: A review, Aerosol Sci. Technol., 45, 665–695, 2011.
Chen, X., Wang, H., Lu, K., Li, C., Zhai, T., Tan, Z., Ma, X., Yang, X., Liu, Y., Chen, S., Dong, H., Li, X., Wu, Z., Hu, M., Zeng, L., and Zhang, Y.: Field Determination of Nitrate Formation Pathway in Winter Beijing, Environ. Sci. Technol., 54, 9243–9253, https://doi.org/10.1021/acs.est.0c00972, 2020.
Chen, X., Wang, H., and Lu, K.: Interpretation of NO3–N2O5 observation via steady state in high-aerosol air mass: the impact of equilibrium coefficient in ambient conditions, Atmos. Chem. Phys., 22, 3525–3533, https://doi.org/10.5194/acp-22-3525-2022, 2022.
Cosman, L. M., Knopf, D. A., and Bertram, A. K.: N2O5 reactive uptake on aqueous sulfuric acid solutions coated with branched and straight-chain insoluble organic surfactants, J. Phys. Chem. A, 112, 2386–2396, https://doi.org/10.1021/jp710685r, 2008.
Danckwerts, P. V.: Continuous flow systems: distribution of residence times, Chem. Eng. Sci., 2, 1–13, 1953.
Davis, J. M., Bhave, P. V., and Foley, K. M.: Parameterization of N2O5 reaction probabilities on the surface of particles containing ammonium, sulfate, and nitrate, Atmos. Chem. Phys., 8, 5295–5311, https://doi.org/10.5194/acp-8-5295-2008, 2008.
Dentener, F. J. and Crutzen, P. J.: Reaction Of N2O5 On Tropospheric Aerosols – Impact On The Global Distributions Of NOx, O3, And OH, J. Geophys. Res. Atmos., 98, 7149–7163, 1993.
Escoreia, E. N., Sjostedt, S. J., and Abbatt, J. P. D.: Kinetics of N2O5 Hydrolysis on Secondary Organic Aerosol and Mixed Ammonium Bisulfate-Secondary Organic Aerosol Particles, J. Phys. Chem. A, 114, 13113–13121, https://doi.org/10.1021/jp107721v, 2010.
Evans, M. and Jacob, D. J.: Impact of new laboratory studies of N2O5 hydrolysis on global model budgets of tropospheric nitrogen oxides, ozone, and OH, Geophys. Res. Lett., 32, L09813, https://doi.org/10.1029/2005GL022469, 2005.
Folkers, M., Mentel, T. F., and Wahner, A.: Influence of an organic coating on the reactivity of aqueous aerosols probed by the heterogeneous hydrolysis of N2O5, Geophys. Res. Lett., 30, 1644, https://doi.org/10.1029/2003gl017168, 2003.
Fried, A., Henry, B. E., Calvert, J. G., and Mozurkewich, M.: The reaction probability of N2O5 with sulfuric acid aerosols at stratospheric temperatures and compositions, J. Geophys. Res.-Atmos., 99, 3517–3532, https://doi.org/10.1029/93jd01907, 1994.
Fu, X., Wang, T., Gao, J., Wang, P., Liu, Y., Wang, S., Zhao, B., and Xue, L.: Persistent Heavy Winter Nitrate Pollution Driven by Increased Photochemical Oxidants in Northern China, Environ. Sci. Technol., 54, 3881–3889, https://doi.org/10.1021/acs.est.9b07248, 2020.
Fuchs, N. A. and Sutugin, A. G.: HIGH-DISPERSED AEROSOLS, in: Topics in Current Aerosol Research, edited by: Hidy, G. M., and Brock, J. R., Pergamon, 1, https://doi.org/10.1016/B978-0-08-016674-2.50006-6, 1971.
Gaston, C. J. and Thornton, J. A.: Reacto-Diffusive Length of N2O5 in Aqueous Sulfate- and Chloride-Containing Aerosol Particles, J. Phys. Chem. A, 120, 1039–1045, https://doi.org/10.1021/acs.jpca.5b11914, 2016.
Gaston, C. J., Thornton, J. A., and Ng, N. L.: Reactive uptake of N2O5 to internally mixed inorganic and organic particles: the role of organic carbon oxidation state and inferred organic phase separations, Atmos. Chem. Phys., 14, 5693–5707, https://doi.org/10.5194/acp-14-5693-2014, 2014.
Griffiths, P. T., Badger, C. L., Cox, R. A., Folkers, M., Henk, H. H., and Mentel, T. F.: Reactive Uptake of N2O5 by Aerosols Containing Dicarboxylic Acids. Effect of Particle Phase, Composition, and Nitrate Content, J. Phys. Chem. A, 113, 5082–5090, https://doi.org/10.1021/jp8096814, 2009.
Gross, S., Iannone, R., Xiao, S., and Bertram, A. K.: Reactive uptake studies of NO3 and N2O5 on alkenoic acid, alkanoate, and polyalcohol substrates to probe nighttime aerosol chemistry, Phys. Chem. Chem. Phys., 11, 7792–7803, https://doi.org/10.1039/b904741g, 2009.
Hallquist, M., Stewart, D. J., Baker, J., and Cox, R. A.: Hydrolysis of N2O5 on submicron sulfuric acid aerosols, J. Phys. Chem. A, 104, 3984–3990, https://doi.org/10.1021/jp9939625, 2000.
Hallquist, M., Stewart, D. J., Stephenson, S. K., and Anthony Cox, R.: Hydrolysis of N2O5 on sub-micron sulfate aerosols, Phys. Chem. Chem. Phys., 5, 3453, https://doi.org/10.1039/b301827j, 2003.
Hu, J. H. and Abbatt, J. P. D.: Reaction probabilities for N2O5 hydrolysis on sulfuric acid and ammonium sulfate aerosols at room temperature, J. Phys. Chem. A, 101, 871–878, https://doi.org/10.1021/jp9627436, 1997.
Huang, Y., Coggon, M. M., Zhao, R., Lignell, H., Bauer, M. U., Flagan, R. C., and Seinfeld, J. H.: The Caltech Photooxidation Flow Tube reactor: design, fluid dynamics and characterization, Atmos. Meas. Tech., 10, 839–867, https://doi.org/10.5194/amt-10-839-2017, 2017.
Kane, S. M., Caloz, F., and Leu, M. T.: Heterogeneous uptake of gaseous N2O5 by (NH4)2SO4, NH4HSO4, and H2SO4 aerosols, J. Phys. Chem. A, 105, 6465–6470, https://doi.org/10.1021/jp010490x, 2001.
Karagulian, F., Santschi, C., and Rossi, M. J.: The heterogeneous chemical kinetics of N2O5 on CaCO3 and other atmospheric mineral dust surrogates, Atmos. Chem. Phys., 6, 1373–1388, https://doi.org/10.5194/acp-6-1373-2006, 2006.
Kennedy, O. J., Ouyang, B., Langridge, J. M., Daniels, M. J. S., Bauguitte, S., Freshwater, R., McLeod, M. W., Ironmonger, C., Sendall, J., Norris, O., Nightingale, R., Ball, S. M., and Jones, R. L.: An aircraft based three channel broadband cavity enhanced absorption spectrometer for simultaneous measurements of NO3, N2O5 and NO2, Atmos. Meas. Tech., 4, 1759–1776, https://doi.org/10.5194/amt-4-1759-2011, 2011.
Lambe, A. T., Ahern, A. T., Williams, L. R., Slowik, J. G., Wong, J. P. S., Abbatt, J. P. D., Brune, W. H., Ng, N. L., Wright, J. P., Croasdale, D. R., Worsnop, D. R., Davidovits, P., and Onasch, T. B.: Characterization of aerosol photooxidation flow reactors: heterogeneous oxidation, secondary organic aerosol formation and cloud condensation nuclei activity measurements, Atmos. Meas. Tech., 4, 445–461, https://doi.org/10.5194/amt-4-445-2011, 2011.
Li, C., Wang, H., Chen, X., Zhai, T., Chen, S., Li, X., Zeng, L., and Lu, K.: Thermal dissociation cavity-enhanced absorption spectrometer for measuring NO2, RO2NO2, and RONO2 in the atmosphere, Atmos. Meas. Tech., 14, 4033–4051, https://doi.org/10.5194/amt-14-4033-2021, 2021.
Li, Q., Zhang, L., Wang, T., Tham, Y. J., Ahmadov, R., Xue, L., Zhang, Q., and Zheng, J.: Impacts of heterogeneous uptake of dinitrogen pentoxide and chlorine activation on ozone and reactive nitrogen partitioning: improvement and application of the WRF-Chem model in southern China, Atmos. Chem. Phys., 16, 14875–14890, https://doi.org/10.5194/acp-16-14875-2016, 2016.
Liu, X., Gu, J., Li, Y., Cheng, Y., Qu, Y., Han, T., Wang, J., Tian, H., Chen, J., and Zhang, Y.: Increase of aerosol scattering by hygroscopic growth: Observation, modeling, and implications on visibility, Atmos. Res., 132, 91–101, 2013.
Lowe, D., Archer-Nicholls, S., Morgan, W., Allan, J., Utembe, S., Ouyang, B., Aruffo, E., Le Breton, M., Zaveri, R. A., Di Carlo, P., Percival, C., Coe, H., Jones, R., and McFiggans, G.: WRF-Chem model predictions of the regional impacts of N2O5 heterogeneous processes on night-time chemistry over north-western Europe, Atmos. Chem. Phys., 15, 1385–1409, https://doi.org/10.5194/acp-15-1385-2015, 2015.
Macintyre, H. L. and Evans, M. J.: Sensitivity of a global model to the uptake of N2O5 by tropospheric aerosol, Atmos. Chem. Phys., 10, 7409–7414, https://doi.org/10.5194/acp-10-7409-2010, 2010.
Martin, S. T.: Phase transitions of aqueous atmospheric particles, Chem. Rev., 100, 3403–3454, 2000.
McDuffie, E. E., Fibiger, D. L., Dubé, W. P., Lopez-Hilfiker, F., Lee, B. H., Thornton, J. A., Shah, V., Jaeglé, L., Guo, H., Weber, R. J., Michael Reeves, J., Weinheimer, A. J., Schroder, J. C., Campuzano-Jost, P., Jimenez, J. L., Dibb, J. E., Veres, P., Ebben, C., Sparks, T. L., Wooldridge, P. J., Cohen, R. C., Hornbrook, R. S., Apel, E. C., Campos, T., Hall, S. R., Ullmann, K., and Brown, S. S.: Heterogeneous N2O5 Uptake During Winter: Aircraft Measurements During the 2015 WINTER Campaign and Critical Evaluation of Current Parameterizations, J. Geophys. Res.-Atmos., 123, 4345–4372, https://doi.org/10.1002/2018jd028336, 2018.
McDuffie, E. E., Womack, C. C., Fibiger, D. L., Dube, W. P., Franchin, A., Middlebrook, A. M., Goldberger, L., Lee, B. H., Thornton, J. A., Moravek, A., Murphy, J. G., Baasandorj, M., and Brown, S. S.: On the contribution of nocturnal heterogeneous reactive nitrogen chemistry to particulate matter formation during wintertime pollution events in Northern Utah, Atmos. Chem. Phys., 19, 9287–9308, https://doi.org/10.5194/acp-19-9287-2019, 2019.
McNeill, V. F., Patterson, J., Wolfe, G. M., and Thornton, J. A.: The effect of varying levels of surfactant on the reactive uptake of N2O5 to aqueous aerosol, Atmos. Chem. Phys., 6, 1635–1644, https://doi.org/10.5194/acp-6-1635-2006, 2006.
Mentel, T. F., Sohn, M., and Wahner, A.: Nitrate effect in the heterogeneous hydrolysis of dinitrogen pentoxide on aqueous aerosols, Phys. Chem. Chem. Phys., 1, 5451–5457, https://doi.org/10.1039/a905338g, 1999.
Mielke, L. H., Stutz, J., Tsai, C., Hurlock, S. C., Roberts, J. M., Veres, P. R., Froyd, K. D., Hayes, P. L., Cubison, M. J., Jimenez, J. L., Washenfelder, R. A., Young, C. J., Gilman, J. B., de Gouw, J. A., Flynn, J. H., Grossberg, N., Lefer, B. L., Liu, J., Weber, R. J., and Osthoff, H. D.: Heterogeneous formation of nitryl chloride and its role as a nocturnal NOx reservoir species during CalNex-LA 2010, J. Geophys. Res.-Atmos., 118, 10638–610652, https://doi.org/10.1002/jgrd.50783, 2013.
Mitroo, D., Gill, T. E., Haas, S., Pratt, K. A., and Gaston, C. J.: CINO2 Production from N2O5 Uptake on Saline Playa Dusts: New Insights into Potential Inland Sources of CINO2, Environ. Sci. Technol., 53, 7442–7452, https://doi.org/10.1021/acs.est.9b01112, 2019.
Mozurkewich, M. and Calvert, J. G.: Reaction probability of N2O5 on aqueous aerosols, J. Geophys. Res.-Atmos., 93, 15889–15896, https://doi.org/10.1029/JD093iD12p15889, 1988.
Murray, L. T., Fiore, A. M., Shindell, D. T., Naik, V., and Horowitz, L. W.: Large uncertainties in global hydroxyl projections tied to fate of reactive nitrogen and carbon, P. Natl. Acad. Sci. USA, 118, e2115204118, https://doi.org/10.1073/pnas.2115204118, 2021.
Osthoff, H. D., Roberts, J. M., Ravishankara, A. R., Williams, E. J., Lerner, B. M., Sommariva, R., Bates, T. S., Coffman, D., Quinn, P. K., Dibb, J. E., Stark, H., Burkholder, J. B., Talukdar, R. K., Meagher, J., Fehsenfeld, F. C., and Brown, S. S.: High levels of nitryl chloride in the polluted subtropical marine boundary layer, Nat. Geosci., 1, 324–328, https://doi.org/10.1038/ngeo177, 2008.
Phillips, G. J., Thieser, J., Tang, M., Sobanski, N., Schuster, G., Fachinger, J., Drewnick, F., Borrmann, S., Bingemer, H., Lelieveld, J., and Crowley, J. N.: Estimating N2O5 uptake coefficients using ambient measurements of NO3, N2O5, ClNO2 and particle-phase nitrate, Atmos. Chem. Phys., 16, 13231–13249, https://doi.org/10.5194/acp-16-13231-2016, 2016.
Platt, U. F., Winer, A. M., Biermann, H. W., Atkinson, R., and Pitts, J. N.: Measurement of nitrate radical concentrations in continental air, Environ. Sci. Technol., 18, 365–369, https://doi.org/10.1021/es00123a015, 1984.
Prabhakar, G., Parworth, C. L., Zhang, X., Kim, H., Young, D. E., Beyersdorf, A. J., Ziemba, L. D., Nowak, J. B., Bertram, T. H., Faloona, I. C., Zhang, Q., and Cappa, C. D.: Observational assessment of the role of nocturnal residual-layer chemistry in determining daytime surface particulate nitrate concentrations, Atmos. Chem. Phys., 17, 14747–14770, https://doi.org/10.5194/acp-17-14747-2017, 2017.
Riedel, T. P., Bertram, T. H., Crisp, T. A., Williams, E. J., Lerner, B. M., Vlasenko, A., Li, S. M., Gilman, J., de Gouw, J., Bon, D. M., Wagner, N. L., Brown, S. S., and Thornton, J. A.: Nitryl Chloride and Molecular Chlorine in the Coastal Marine Boundary Layer, Environ. Sci. Technol., 46, 10463–10470, https://doi.org/10.1021/es204632r, 2012a.
Riedel, T. P., Bertram, T. H., Ryder, O. S., Liu, S., Day, D. A., Russell, L. M., Gaston, C. J., Prather, K. A., and Thornton, J. A.: Direct N2O5 reactivity measurements at a polluted coastal site, Atmos. Chem. Phys., 12, 2959–2968, https://doi.org/10.5194/acp-12-2959-2012, 2012b.
Riedel, T. P., Wagner, N. L., Dube, W. P., Middlebrook, A. M., Young, C. J., Ozturk, F., Bahreini, R., VandenBoer, T. C., Wolfe, D. E., Williams, E. J., Roberts, J. M., Brown, S. S., and Thornton, J. A.: Chlorine activation within urban or power plant plumes: Vertically resolved ClNO2 and Cl2 measurements from a tall tower in a polluted continental setting, J. Geophys. Res.-Atmos., 118, 8702–8715, https://doi.org/10.1002/jgrd.50637, 2013.
Riemer, N., Vogel, H., Vogel, B., Schell, B., Ackermann, I., Kessler, C., and Hass, H.: Impact of the heterogeneous hydrolysis of N2O5 on chemistry and nitrate aerosol formation in the lower troposphere under photosmog conditions, J. Geophys. Res.-Atmos., 108, 4144, https://doi.org/10.1029/2002jd002436, 2003.
Riemer, N., Vogel, H., Vogel, B., Anttila, T., Kiendler-Scharr, A., and Mentel, T. F.: Relative importance of organic coatings for the heterogeneous hydrolysis of N2O5during summer in Europe, J. Geophys. Res., 114, D17307, https://doi.org/10.1029/2008jd011369, 2009.
Royer, H. M., Mitroo, D., Hayes, S. M., Haas, S. M., Pratt, K. A., Blackwelder, P. L., Gill, T. E., and Gaston, C. J.: The Role of Hydrates, Competing Chemical Constituents, and Surface Composition on CINO2 Formation, Environ. Sci. Technol., 55, 2869–2877, https://doi.org/10.1021/acs.est.0c06067, 2021.
Sarwar, G., Simon, H., Bhave, P., and Yarwood, G.: Examining the impact of heterogeneous nitryl chloride production on air quality across the United States, Atmos. Chem. Phys., 12, 6455–6473, https://doi.org/10.5194/acp-12-6455-2012, 2012.
Schweitzer, F., Mirabel, P., and George, C.: Multiphase chemistry of N2O5, ClNO2, and BrNO2, J. Phys. Chem. A, 102, 3942–3952, 1998.
Tang, M. J., Telford, P. J., Pope, F. D., Rkiouak, L., Abraham, N. L., Archibald, A. T., Braesicke, P., Pyle, J. A., McGregor, J., Watson, I. M., Cox, R. A., and Kalberer, M.: Heterogeneous reaction of N2O5 with airborne TiO2 particles and its implication for stratospheric particle injection, Atmos. Chem. Phys., 14, 6035–6048, https://doi.org/10.5194/acp-14-6035-2014, 2014.
Tham, Y. J., Wang, Z., Li, Q., Yun, H., Wang, W., Wang, X., Xue, L., Lu, K., Ma, N., Bohn, B., Li, X., Kecorius, S., Größ, J., Shao, M., Wiedensohler, A., Zhang, Y., and Wang, T.: Significant concentrations of nitryl chloride sustained in the morning: investigations of the causes and impacts on ozone production in a polluted region of northern China, Atmos. Chem. Phys., 16, 14959–14977, https://doi.org/10.5194/acp-16-14959-2016, 2016.
Tham, Y. J., Wang, Z., Li, Q., Wang, W., Wang, X., Lu, K., Ma, N., Yan, C., Kecorius, S., Wiedensohler, A., Zhang, Y., and Wang, T.: Heterogeneous N2O5 uptake coefficient and production yield of ClNO2 in polluted northern China: roles of aerosol water content and chemical composition, Atmos. Chem. Phys., 18, 13155–13171, https://doi.org/10.5194/acp-18-13155-2018, 2018.
Thornton, J. A. and Abbatt, J. P. D.: N2O5 reaction on submicron sea salt aerosol: Kinetics, products, and the effect of surface active organics, J. Phys. Chem. A, 109, 10004-10012, https://doi.org/10.1021/jp054183t, 2005.
Thornton, J. A., Braban, C. F., and Abbatt, J. P. D.: N2O5 hydrolysis on sub-micron organic aerosols: the effect of relative humidity, particle phase, and particle size, Phys. Chem. Chem. Phys., 5, 4593–4603, https://doi.org/10.1039/b307498f, 2003.
Thornton, J. A., Kercher, J. P., Riedel, T. P., Wagner, N. L., Cozic, J., Holloway, J. S., Dube, W. P., Wolfe, G. M., Quinn, P. K., Middlebrook, A. M., Alexander, B., and Brown, S. S.: A large atomic chlorine source inferred from mid-continental reactive nitrogen chemistry, Nature, 464, 271–274, https://doi.org/10.1038/nature08905, 2010.
Van Doren, J. M., Watson, L. R., Davidovits, P., Worsnop, D. R., Zahniser, M. S., and Kolb, C. E.: Temperature dependence of the uptake coefficients of nitric acid, hydrochloric acid and nitrogen oxide (N2O5) by water droplets, J. Phys. Chem., 94, 3265–3269, 1990.
Wagner, N. L., Riedel, T. P., Young, C. J., Bahreini, R., Brock, C. A., Dubé, W. P., Kim, S., Middlebrook, A. M., Öztürk, F., Roberts, J. M., Russo, R., Sive, B., Swarthout, R., Thornton, J. A., VandenBoer, T. C., Zhou, Y., and Brown, S. S.: N2O5 uptake coefficients and nocturnal NO2 removal rates determined from ambient wintertime measurements, J. Geophys. Res.-Atmos., 118, 9331–9350, https://doi.org/10.1002/jgrd.50653, 2013.
Wahner, A., Mentel, T. F., Sohn, M., and Stier, J.: Heterogeneous reaction of N2O5 on sodium nitrate aerosol, J. Geophys. Res., 103, 31103–31112, https://doi.org/10.1029/1998jd100022, 1998.
Wang, H., Chen, J., and Lu, K.: Development of a portable cavity-enhanced absorption spectrometer for the measurement of ambient NO3 and N2O5: experimental setup, lab characterizations, and field applications in a polluted urban environment, Atmos. Meas. Tech., 10, 1465–1479, https://doi.org/10.5194/amt-10-1465-2017, 2017a.
Wang, H., Lu, K., Chen, X., Zhu, Q., Chen, Q., Guo, S., Jiang, M., Li, X., Shang, D., Tan, Z., Wu, Y., Wu, Z., Zou, Q., Zheng, Y., Zeng, L., Zhu, T., Hu, M., and Zhang, Y.: High N2O5 Concentrations Observed in Urban Beijing: Implications of a Large Nitrate Formation Pathway, Environ. Sci. Tech. Let., 4, 416–420, https://doi.org/10.1021/acs.estlett.7b00341, 2017b.
Wang, H., Lu, K. D., Chen, X. R., Zhu, Q. D., Chen, Q., Guo, S., Jiang, M. Q., Li, X., Shang, D. J., Tan, Z. F., Wu, Y. S., Wu, Z. J., Zou, Q., Zheng, Y., Zeng, L. M., Zhu, T., Hu, M., and Zhang, Y. H.: High N2O5 Concentrations Observed in Urban Beijing: Implications of a Large Nitrate Formation Pathway, Environ. Sci. Tech. Let., 4, 416–420, https://doi.org/10.1021/acs.estlett.7b00341, 2017c.
Wang, H., Lu, K., Chen, X., Zhu, Q., Wu, Z., Wu, Y., and Sun, K.: Fast particulate nitrate formation via N2O5 uptake aloft in winter in Beijing, Atmos. Chem. Phys., 18, 10483–10495, https://doi.org/10.5194/acp-18-10483-2018, 2018a.
Wang, H., Lu, K., Guo, S., Wu, Z., Shang, D., Tan, Z., Wang, Y., Le Breton, M., Lou, S., Tang, M., Wu, Y., Zhu, W., Zheng, J., Zeng, L., Hallquist, M., Hu, M., and Zhang, Y.: Efficient N2O5 uptake and NO3 oxidation in the outflow of urban Beijing, Atmos. Chem. Phys., 18, 9705–9721, https://doi.org/10.5194/acp-18-9705-2018, 2018b.
Wang, H., Chen, X., Lu, K., Tan, Z., Ma, X., Wu, Z., Li, X., Liu, Y., Shang, D., Wu, Y., Zeng, L., Hu, M., Schmitt, S., Kiendler-Scharr, A., Wahner, A., and Zhang, Y.: Wintertime N2O5 uptake coefficients over the North China Plain, Sci. Bull., 65, 765–774, https://doi.org/10.1016/j.scib.2020.02.006, 2020a.
Wang, H., Chen, X. R., Lu, K. D., Hu, R. Z., Li, Z. Y., Wang, H. L., Ma, X. F., Yang, X. P., Chen, S. Y., Dong, H. B., Liu, Y., Fang, X., Zeng, L. M., Hu, M., and Zhang, Y. H.: NO3 and N2O5 chemistry at a suburban site during the EXPLORE-YRD campaign in 2018, Atmos. Environ., 224, 117180, https://doi.org/10.1016/j.atmosenv.2019.117180, 2020b.
Wang, H., Peng, C., Wang, X., Lou, S., Lu, K., Gan, G., Jia, X., Chen, X., Chen, J., Wang, H., Fan, S., Wang, X., and Tang, M.: N2O5 uptake onto saline mineral dust: a potential missing source of tropospheric ClNO2 in inland China, Atmos. Chem. Phys., 22, 1845–1859, https://doi.org/10.5194/acp-22-1845-2022, 2022.
Wang, W., Wang, Z., Yu, C., Xia, M., Peng, X., Zhou, Y., Yue, D., Ou, Y., and Wang, T.: An in situ flow tube system for direct measurement of N2O5 heterogeneous uptake coefficients in polluted environments, Atmos. Meas. Tech., 11, 5643–5655, https://doi.org/10.5194/amt-11-5643-2018, 2018.
Wang, X., Wang, H., Xue, L., Wang, T., Wang, L., Gu, R., Wang, W., Tham, Y. J., Wang, Z., Yang, L., Chen, J., and Wang, W.: Observations of N2O5 and ClNO2 at a polluted urban surface site in North China: High N2O5 uptake coefficients and low ClNO2 product yields, Atmos. Environ., 156, 125–134, https://doi.org/10.1016/j.atmosenv.2017.02.035, 2017.
Wang, Y. L., Song, W., Yang, W., Sun, X. C., Tong, Y. D., Wang, X. M., Liu, C. Q., Bai, Z. P., and Liu, X. Y.: Influences of atmospheric pollution on the contributions of major oxidation pathways to PM2.5 nitrate formation in Beijing, J. Geophys. Res.-Atmos., 124, 4174–4185, 2019.
Wang, Z., Wang, W., Tham, Y. J., Li, Q., Wang, H., Wen, L., Wang, X., and Wang, T.: Fast heterogeneous N2O5 uptake and ClNO2 production in power plant and industrial plumes observed in the nocturnal residual layer over the North China Plain, Atmos. Chem. Phys., 17, 12361–12378, https://doi.org/10.5194/acp-17-12361-2017, 2017.
Wu, C., Zhang, S., Wang, G., Lv, S., Li, D., Liu, L., Li, J., Liu, S., Du, W., and Meng, J.: Efficient heterogeneous formation of ammonium nitrate on the saline mineral particle surface in the atmosphere of East Asia during dust storm periods, Environ. Sci. Technol., 54, 15622–15630, 2020.
Xia, M., Wang, W., Wang, Z., Gao, J., Li, H., Liang, Y., Yu, C., Zhang, Y., Wang, P., Zhang, Y., Bi, F., Cheng, X., and Tao, W.: Heterogeneous Uptake of N2O5 in Sand Dust and Urban Aerosols Observed during the Dry Season in Beijing, Atmosphere, 10, 204, https://doi.org/10.3390/atmos10040204, 2019.
Yu, C., Wang, Z., Xia, M., Fu, X., Wang, W., Tham, Y. J., Chen, T., Zheng, P., Li, H., Shan, Y., Wang, X., Xue, L., Zhou, Y., Yue, D., Ou, Y., Gao, J., Lu, K., Brown, S. S., Zhang, Y., and Wang, T.: Heterogeneous N2O5 reactions on atmospheric aerosols at four Chinese sites: improving model representation of uptake parameters, Atmos. Chem. Phys., 20, 4367–4378, https://doi.org/10.5194/acp-20-4367-2020, 2020.
Yun, H., Wang, T., Wang, W. H., Tham, Y. J., Li, Q. Y., Wang, Z., and Poon, S. C. N.: Nighttime NOx loss and ClNO2 formation in the residual layer of a polluted region: Insights from field measurements and an iterative box model, Sci. Total Environ., 622, 727–734, https://doi.org/10.1016/j.scitotenv.2017.11.352, 2018.
- Abstract
- Introduction
- The aerosol flow tube system
- Box model for determination of loss rate coefficients of N2O5
- Laboratory characterizations
- Uncertainty analysis and detection limit
- Performance in the field campaign
- Summary and conclusion
- Appendix A: Measured VOCs used to calculate NO3 reactivity in the box model method
- Appendix B: Evaluations of box model method by ambient data
- Data availability
- Author contributions
- Competing interests
- Disclaimer
- Acknowledgements
- Financial support
- Review statement
- References