the Creative Commons Attribution 4.0 License.
the Creative Commons Attribution 4.0 License.
 | 05 Jan 2022
Design and characterization of a semi-open dynamic chamber for measuring biogenic volatile organic compound (BVOC) emissions from plants
Jianqiang Zeng
Huina Zhang
Wei Song
Zhenfeng Wu
With the accumulation of data about biogenic volatile organic compound (BVOC) emissions from plants based on branch-scale enclosure measurements worldwide, it is vital to assure that measurements are conducted using well-characterized dynamic chambers with good transfer efficiencies and less disturbance on natural growing microenvironments. In this study, a self-made cylindrical semi-open dynamic chamber with a Teflon-coated inner surface was characterized both in the lab with standard BVOC mixtures and in the field with typical broadleaf and coniferous trees. The lab simulation with a constant flow of standard mixtures and online monitoring of BVOCs by proton transfer reaction time-of-flight mass spectrometry (PTR-ToF-MS) revealed lower real-time mixing ratios and shorter equilibrium times than theoretically predicted due to wall loss in the chamber and that larger flow rates (shorter residence times) can reduce the adsorptive loss and improve the transfer efficiencies. However, even when flow rates were raised to secure residence times of less than 1 min, transfer efficiencies were still below 70 % for heavier BVOCs like α-pinene and β-caryophyllene. Relative humidity (RH) impacted the adsorptive loss of BVOCs less significantly when compared to flow rates, with compound-specific patterns related to the influence of RH on their adsorption behaviour. When the chamber was applied in the field to a branch of a Mangifera indica tree, the ambient–enclosure temperature differences decreased from 4.5±0.3 to 1.0±0.2 ∘C and the RH differences decreased from 9.8 ± 0.5 % to 1.2±0.1 % as flow rates increased from 3 L min−1 (residence time ∼4.5 min) to 15 L min−1 (residence time ∼0.9 min). At a medium flow rate of 9 L min−1 (residence time ∼1.5 min), field tests with the dynamic chamber for Mangifera indica and Pinus massoniana branches revealed enclosure temperature increase within +2 ∘C and CO2 depletion within −50 ppm when compared to their ambient counterparts. The results suggested that substantially higher air circulating rates would benefit by reducing equilibrium time, adsorptive loss, and the ambient–enclosure temperature and RH differences. However, even under higher air circulating rates and with inert Teflon-coated inner surfaces, the transfer efficiencies for monoterpene and sesquiterpene species are not so satisfactory, implying that emission factors for these species might be underestimated if they are obtained by dynamic chambers without certified transfer efficiencies and that further efforts are needed for field measurements to improve accuracies and narrow the uncertainties of the emission factors.
- Article
(3683 KB) - Full-text XML
-
Supplement
(1122 KB) - BibTeX
- EndNote


-
A dynamic chamber for measuring branch-scale BVOC emissions is characterized.
-
Higher circulating air flow rate increases transfer efficiency and decreases equilibrium time.
-
Higher circulating air flow rates reduce ambient–enclosure environmental differences.
-
Transfer efficiencies of monoterpene and sesquiterpene species are below 70 %.
Plants can emit a wide range of low molecular volatile organic compounds (VOCs), including isoprene, monoterpenes (MTs), sesquiterpenes (SQTs), oxygenated VOCs (OVOCs, e.g. methanol, acetone), and other reactive VOCs (Guenther et al., 2012). These compounds can be signal molecules for communication within plants, between plants, and between plants and insects (Laothawornkitkul et al., 2009; Šimpraga et al., 2016; Douma et al., 2019), and they are useful tools for plants to protect against biotic (e.g. herbivory) and abiotic (e.g. ozone, drought, heat) stresses (Loreto and Schnitzler, 2010; Holopainen et al., 2017). When emitting into the atmosphere, these biogenic volatile organic compounds (BVOCs) can contribute substantially to the formation of ozone and secondary organic aerosol (SOA) and influence the budget of oxidants, including hydroxyl radicals (Atkinson and Arey, 2003; de Souza et al., 2018; Di Carlo et al., 2004), and thereby directly and/or indirectly impact air quality and climate on a regional and even global scale (Peñuelas et al., 2009; Kleist et al., 2012; Gu et al., 2017; Scott et al., 2017). Due to vital roles played by BVOCs in atmospheric chemistry, their emission inventory has become an indispensable part of air quality and climate models. Global annual emissions of BVOCs are estimated over 1 Pg (1015 g) (Guenther et al., 1995), yet these estimations may have large uncertainties (Simpson et al., 1999; Guenther et al., 2006; Y. Zhang et al., 2020) and inaccurate emission factors are among the most important contributors to the uncertainties either regionally or globally (Wang et al., 2011; Guenther et al., 2012; Situ et al., 2014). Therefore, well-designed fieldwork is essential and urgently needed to narrow the uncertainty (Niinemets et al., 2011).
Emissions of BVOCs from plants can be measured on leaf, branch, and canopy scales. Although flux measurements above canopies by relaxed eddy accumulation or eddy covariance can obtain ecosystem-scale emission fluxes (Spirig et al., 2005; Rinne et al., 2007; Bai et al., 2017), enclosures on leaf and branch scales are the most convenient and widely used approaches of measuring BVOC emissions from plants (Chen et al., 2019; Huang et al., 2020). These enclosures can be static and dynamic. Static enclosure isolates leaves or branches from the ambient air completely, and environmental parameters (e.g. temperature, relative humidity (RH), CO2 concentration) in the enclosure may deviate far from the ambient. Temperature in the enclosure is likely to increase due to greenhouse effects, humidity increases because of leaf transpiration, and CO2 concentration depletes as a result of photosynthetic consumption by leaves (Kesselmeier et al., 1996; Aydin et al., 2014). These will change the physiological state of plants and cause abnormal emissions (Ortega and Helmig, 2008). For this reason, static or semi-static enclosures are considered to be screening tools to verify emitters and non-emitters (Niinemets et al., 2011; Li et al., 2019). Unlike static enclosure, dynamic enclosure introduces circulating air and can reduce the differences in environmental parameters between the enclosure and the ambient to a great extent. Therefore, dynamic enclosure is more reliable and preferred for measuring emissions of BVOCs from plants (Ortega and Helmig, 2008; Pape et al., 2009; Kolari et al., 2012). However, large differences still exist for dynamic enclosure if air exchange is slow. For example, temperature deviation of more than 10 ∘C between enclosure and the ambient was observed when using dynamic enclosure for field studies (Aydin et al., 2014). In this way the measured emission reflects that under a temperature-disturbed environment and therefore might not represent real situations well. In addition to deviations of environmental parameters in enclosures, adsorption of terpenes can occur on most parts of the enclosure system, including chamber walls, gasket surfaces, and system tubing (Niinemets et al., 2011). The materials used to construct enclosures, like neoprene and low-density polyethylene polymers, are thought to have potentially significant adsorption of VOCs (Niinemets et al., 2011 for a review), resulting in underestimation of emission rates.
An ideal dynamic enclosure for measuring emissions of BVOCs from plants should be one without changing the physiological state of the enclosed plant parts and without introducing pollution or causing systematic losses. Ortega et al. (2008) used an ice water bath and a copper tube to drop the temperature and humidity of the circulating air, thereby reducing the deviations of enclosure environmental parameters from the ambient. Aydin et al. (2014) also used circulating cooling water to reduce the temperature of the circulating air, but the temperature inside the enclosure is still much higher than that of the ambient. Kolari et al. (2012) evaluated the performance of the dynamic chamber in uncontrolled field environment; the results indicate that the systematic losses of VOCs are higher in a wet environment or under high RH. Lüpke et al. (2017) tested the chamber wall effects of an environmentally controlled dynamic chamber using Δ2-carene in the laboratory. Their results demonstrated that there were no chamber wall effects for Δ2-Carene but that there were background contaminations for some other compounds. To date, although there are a variety of dynamic chambers, including sophisticated enclosures designed for laboratory measurements (Copolovici and Niinemets, 2010; Lüpke et al., 2017; Mozaffar et al., 2017) and simple and user-friendly enclosures for field measurements (Matsunaga et al., 2011; Helmig et al., 2013; Wiß et al., 2017), the performance and wall effect of most dynamic enclosures, particularly those used in the field, are not systematically characterized, and this would lead to difficulties in comparing results from various field measurements. Therefore, in order to pool together the measurement results worldwide to generate a quality dataset that can be shared by the scientific community, it is imperative to get the dynamic enclosures systematically characterized before they are used in the field to measure emissions of BVOCs.
This paper describes a semi-open dynamic chamber for measuring BVOC emissions from plants. The purpose of this work is to present a protocol demonstrating how the performance of a dynamic chamber can be characterized and optimized for measuring branch-scale emissions of BVOCs. To obtain more accurate BVOC emission rates from plants grown in the field, some important aspects, including ambient–enclosure differences in environmental parameters (light, temperature, and RH), equilibrium time, and wall effects, are assessed and discussed in this study.
2.1 Design of the semi-open dynamic chamber system
The semi-open dynamic chamber is a cylindrical structure (Fig. 1) made of polymethyl methacrylate, and its inner surface is coated with fluorinated ethylene propylene (FEP) Teflon film (FEP 100, Type 200A; DuPont, USA). It has a volume of 13.7 L with a diameter of 250 mm and a height of 280 mm. Ambient air is drawn into the enclosure with a pump at a constant flow through the front panel, whose inner-chamber surface is coated with FEP Teflon film (air inlet). A customized PTFE Teflon fan (Shenzhen Shuangmu Plastic Material Co. Ltd, China) that is driven by an electric motor (BLDC4260, Shenzhen Mingyang Motor Co. Ltd, China) is secured in the middle of inner side of the inlet panel to establish homogeneous chamber conditions, and small holes (5 mm I.D.) are drilled at the edge so that ambient air entering from the small holes can flush the inner wall of the chamber and thus reduce the possible occurrence of water condensation on the inner wall. The outlet is covered by a polymethyl methacrylate panel that is also coated with FEP Teflon film at the inner-chamber side and joined to the main chamber body by screw. Four holes (Fig. 1) are drilled on the panel: the hole (10 mm I.D.) in the middle is used to seal the branch around the trunk side; hole “1” (10 mm I.D.) is used to connect temperature and RH sensor (HC2A-S, Rotronic, Switzerland); hole “2” (10 mm I.D.) is used to connect to adsorption cartridges for sampling BVOCs for offline analysis; and hole “3” (10 mm I.D.) is used to connect to the air pump and online analysers. In order to avoid artificial disturbance to branches when installing the chamber, the polymethyl methacrylate board is cut into two pieces (Fig. 1), which are spliced together after branches are enclosed in the chamber. The gaps between the hole and the trunk are sealed by FEP Teflon tapes. All the tube lines ( in. O.D.) used in the system are made of PTFE while the Swagelok tube fittings are made of polyfluoroalkoxy (PFA). An air pump (MPU2134-N920-2.08, KNF, Germany) equipped with a mass flow controller (Alicat Scientific, Inc., Tucson, AZ, USA) is used to maintain the constant flow rate (F1) of the main airflow. Concentrations of CO2 and H2O inside and outside the chamber are monitored by infrared gas analyser (Li-7000; Li-Cor Inc., Lincoln, USA). A proton transfer reaction time-of-flight mass spectrometer (PTR-ToF-MS; Ionicon Analytik GmbH, Innsbruck, Austria), which has time resolution of less than 1 s, is used to monitor the real-time mixing ratios of BVOCs inside the chamber. More detail descriptions about the determination of BVOCs by the PTR-ToF-MS can be found elsewhere (Wang et al., 2014; Huang et al., 2016; H. Zhang et al., 2020). Airflow for online analysers was shunted from the main airflow through hole 3. Flow rates of online analysers (F2, 200 mL min−1 for PTR-ToF-MS and F3, 500 mL min−1 for Li-7000) and automatic sampler (F4, 200 mL min−1) are controlled by their built-in mass flow controllers (MFCs), and total flow rate () of circulating air is the sum of these flows and is used to calculate emission rates. In addition, the accurate flow rate () through hole 3 is measured by a soap membrane flowmeter (Gilian Gilibrator-2, Sensidyne, USA) before and after each measurement in the field. Temperature and relative humidity (RH) are measured by sensors (HC2A-S, Rotronic, Switzerland), one is installed inside of the chamber, and the other is installed outside. Four thermocouples (HTK305000, OMEGA, USA) are used to monitor air temperature inside the chamber, and another two thermocouples (ST-50, RKC, Japan) are used to monitor leaf temperature. Temperature and humidity data are recorded by a data logger (HR7000, Zhejiang Jiangheng Instrument Equipment Co. Ltd, China). A light sensor (Li-1500; Li-Cor Inc., Lincoln, USA) is installed on the top of the chamber to monitor the photosynthetically active radiation (PAR). After each measurement, branches in the enclosure are harvested and brought back to the lab to determine the dry mass of leaves after heating in an oven at 60 ∘C for 48 h.
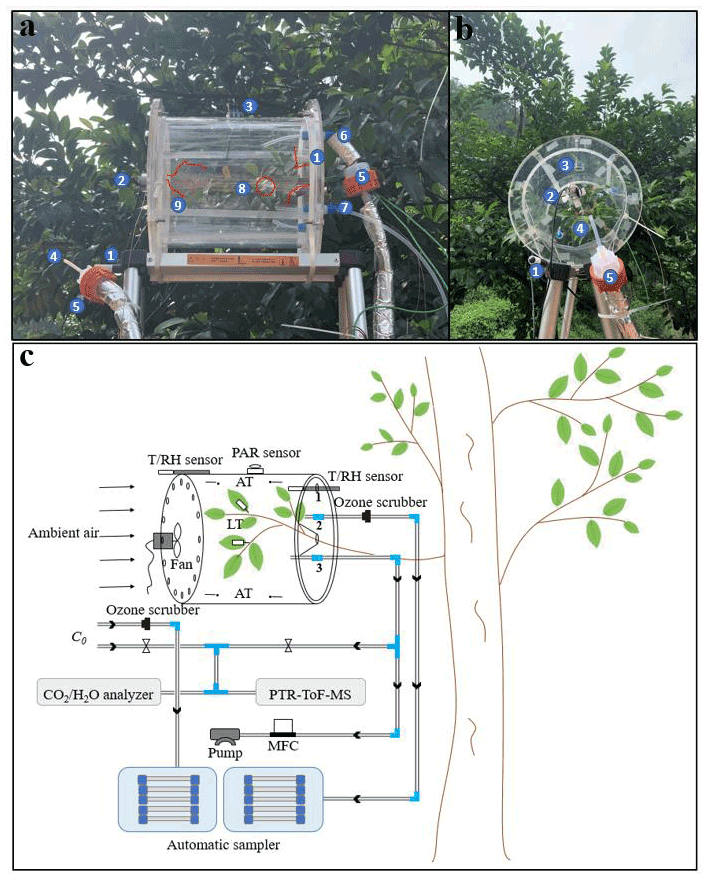
Figure 1Photographs and schematic diagram of the semi-open dynamic chamber system for field measurements of BVOCs from plant leaves. Panels (a) and (b) are photographs of the chamber in the field: (1) sensors, (2) Teflon fan and electric motor, (3) PAR sensor, (4) Teflon tube for sampling ambient air, (5)ozone scrubber, (6) Teflon tube for sampling chamber air, (3) Teflon tube for main airflow, (8) thermocouples (red circle) for leaf temperature, and (9) thermocouples (red lines) for chamber air temperature. (c) Schematic diagram of the chamber system. MFC refers to mass flow controller. LT and AT refer to leaf temperature and air temperature, respectively.
2.2 Collection of offline BVOCs samples and lab analysis
Apart from online measurement by PTR-ToF-MS, offline BVOC samples are also collected since PTR-ToF-MS cannot differentiate isomers of MTs and SQTs. The air is drawn through an ozone scrubber followed by solid adsorbent cartridges (Tenax TA/Carbograph 5TD, Markes International Ltd, UK) using an automatic sampler (JEC921, Jectec Science and Technology Co., Ltd, Beijing, China) at a flow rate of 200 mL min−1 for 10 min (Fig. 1). Samples of ambient air near the inlet are collected concurrently in the same way with another automatic sampler to determine the background concentration (C0) (Fig. 1). The collected samples are stored in a portable refrigerator at 4 ∘C in the field and at −20 ∘C after being brought back to the lab. In the lab, these samples are analysed by an automatic thermal desorption system (TD-100, Markes International Ltd, UK) coupled to a model 7890 gas chromatography (GC) device with a mode 5975 mass selective detector (MSD) (Agilent Technologies, Inc., California, USA). The adsorbent cartridges are thermally desorbed by the TD-100 at 280 ∘C for 10 min and then the desorbed analytes are transferred by pure helium into a cryogenic trap (U-T11PGC-2S, Markes International Ltd, UK) at −10 ∘C. Following this, the trap is rapidly heated to transfer the analytes to the GC–MSD system with a capillary column (Agilent, HP-5MS, 30 m × 0.25 mm ×0.25 µm). The GC oven temperature is programmed to be initially at 35 ∘C (held for 3 min), then increase to 100 ∘C at 5 ∘C min−1 and hold for 3 min, to 150 ∘C at 10 ∘C min−1 and hold for 3 min, and then to 280 ∘C with a final hold time of 2.5 min. The MSD is operated in selected ion monitoring (SIM) mode, and the ionization method is electron impacting. The calibration standards were prepared by dissolving the pure liquid standards (Table S1 in the Supplement) into an n-hexane solution (Kajos et al., 2013; Fang et al., 2021) and diluted to six concentration levels. A total of 1 µ L of each standard solution with specific concentration was injected into an adsorbent cartridge and swept with pure helium at 100 mL min−1 for 2 min to scavenge n-hexane and then run the same way as real samples by the TD-GC–MSD system. The chromatogram of standards is given in Fig. S1 in the Supplement. Six-point calibration curves (Figs. S2, S3) were used to quantify the compounds of interest. Method detection limits (MDLs) were determined by seven parallel analyses of the lowest concentration of calibration standards. The MDLs varied from 5 to 17 ng m−3 for MTs and from 1 to 8 ng m−3 for SQTs. The MDL for isoprene was 56 ng m−3 (Table S1).
2.3 Ozone scavenging
Ozone (O3) may impact emissions of BVOCs from plants (Feng et al., 2019). While many dynamic enclosures use purified air as circulating air (Chen et al., 2020; Jing et al., 2020), the semi-open dynamic chamber, using ambient air as circulating air in order to reflect BVOC emission from plants in real atmosphere, needs to take the effect of ozone into consideration. On the other hand, the highly reactive BVOCs in the atmosphere can be oxidized by oxidants like ozone, especially for MTs and SQTs (Atkinson and Arey, 2003). For our semi-open dynamic chamber with a volume of 13.7 L, when the flow rate is set to be 9–12 L min−1, the residence time of circulating air will be within 1.5 min, far below the lifetimes of some important BVOCs in the atmosphere, which vary from tens of minutes to tens of hours when reacting with ozone (Atkinson and Arey, 2003). Therefore, losses of BVOCs due to reaction with ozone in the chamber can be ignored according to some previous studies (Kolari et al., 2012; Bourtsoukidis et al., 2012; Helin et al., 2020). However, for the sorbent cartridges used to take BVOCs samples for offline analysis (Chen et al., 2019; Aydin et al., 2014), ozone will be adsorbed together with BVOCs, resulting in losses of BVOCs due to reaction with ozone in the cartridges during the delivery and storage of the cartridges before lab analysis (Pollmann et al., 2005; Ortega and Helmig, 2008).
Potassium iodide (KI) and sodium thiosulfate (Na2S2O3) are widely used for ozone removal during sampling BVOCs with adsorbent tubes (Helmig et al., 2006, 2007; Aydin et al., 2014; Yaman et al., 2015; Chen et al., 2020). In this study, four types of ozone scrubbers, a KI filter, Na2S2O3 filter, KI tube, and Na2S2O3 tube, were prepared. The KI or Na2S2O3 filters were prepared by cutting quartz fibre filter (23.4 × 17.6 cm2; Whatman) into circles, getting them soaked in saturated KI or Na2S2O3 solution, and then drying them at 50 ∘C. The KI/Na2S2O3 tube filters were prepared with copper tubes ( in. in I.D. × 50 cm length) by injecting 5 mL saturated KI/Na2S2O3 solution and then swept to dry with nitrogen. As shown in Fig. S4, air flow with an ozone concentration of about 100 ppb, which is the daytime peak level that can occur in our study area (the Pearl River Delta region), was generated by an ozone generator and passed through the ozone scrubbers. An ozone analyser (EC9810, Ecotech, Australia) was used to monitor ozone concentration before and after passing through the scrubbers. All of the ozone scrubbers have ∼100 % ozone removal efficiency, which means that all of them can effectively scavenge ozone. Aside from this, to test if any losses of BVOCs happened in the scrubbers, a mixture of BVOCs (∼20 ppb in nitrogen) was passed through the ozone scrubbers at the same flow rate of 200 mL min−1 as normal field sampling, and the concentrations of BVOCs were monitored before and after passing through the scrubber using the PTR-ToF-MS (Fig. S5). The results revealed that the recoveries of BVOCs on average were 10.05 %, 100.89 %, 100.63 %, and 66.70 % for the KI filter, Na2S2O3 filter, KI tube, and Na2S2O3 tube, respectively (Table S2). Therefore, both the Na2S2O3 filter and KI tube can be used to scavenge ozone with good recoveries. Here Na2S2O3 filters were used to scavenge ozone as in previous studies (Helmig et al., 2006, 2007).
2.4 Optimization of flow rates
The air flow rate is the most important parameter that influences the equilibrium time, the transfer efficiency, the ambient–enclosure differences in temperature and RH, and the steady state concentration of BVOCs as well. Firstly, we tested equilibrium time and transfer efficiency using standard mixtures in the laboratory under 25 ∘C. The standard mixtures contained representative species emitted from plants, including acetonitrile, acrylonitrile, acrolein, acetone, isoprene, methylacrolein, α-pinene, and β-caryophyllene (Table S3); they were prepared in pure nitrogen with mixing ratios of 300–600 ppbv and compressed into a stainless steel canister with a pressure of 40–50 bar in the same way as in Rhoderick and Lin (2013) and Mermet et al. (2019). As shown in Fig. 2, this standard gas mixture was released into the chamber at a constant flow rate to simulate the emission of VOCs from enclosed plant branches with a constant emission factor. While the equilibrium time was tested at flow rates of 3, 6, 9, 12, and 15 L min−1 (dry air, RH = 0 %) in the lab, the transfer efficiency was further tested in the lab with flow rates of 3, 6, 9, 12, and 15 L min−1 and under RH of 20 %, 40 %, 60 %, 80 %, and 100 %, respectively. The RH of circulating air was adjusted by mixing dry air (RH = 0 %) with humidified air (RH = 100 %). All the flow rates were controlled by mass flow controllers (MFCs) (Alicat Scientific, Inc., Tucson, AZ, USA) and calibrated by a soap-membrane flowmeter (Gilian Gilibrator-2, Sensidyne, USA). Mixing ratios of each compound in the standard mixture stored in the stainless steel canister were initially measured by PTR-ToF-MS. The standard mixture was mixed with pure dry air and the mixing ratio of each compound (C1) in this mixed air was measured by PTR-ToF-MS. This mixed air was switched into the camber at a constant flow to simulate BVOC emissions from enclosed plant branches, and the steady-state mixing ratio of each compound (C2) in the chamber was again measured by PTR-ToF-MS. Transfer efficiency (%) of each compound was then calculated as the ratio of . Mixing ratios of acetonitrile, acrylonitrile, acrolein, acetone, isoprene, methylacrolein, α-pinene, and β-caryophyllene were determined by PTR-ToF-MS with 42.019, 45.015, 57.073, 59.052, 69.060, 71.040, 137.072, and 204.986, respectively.
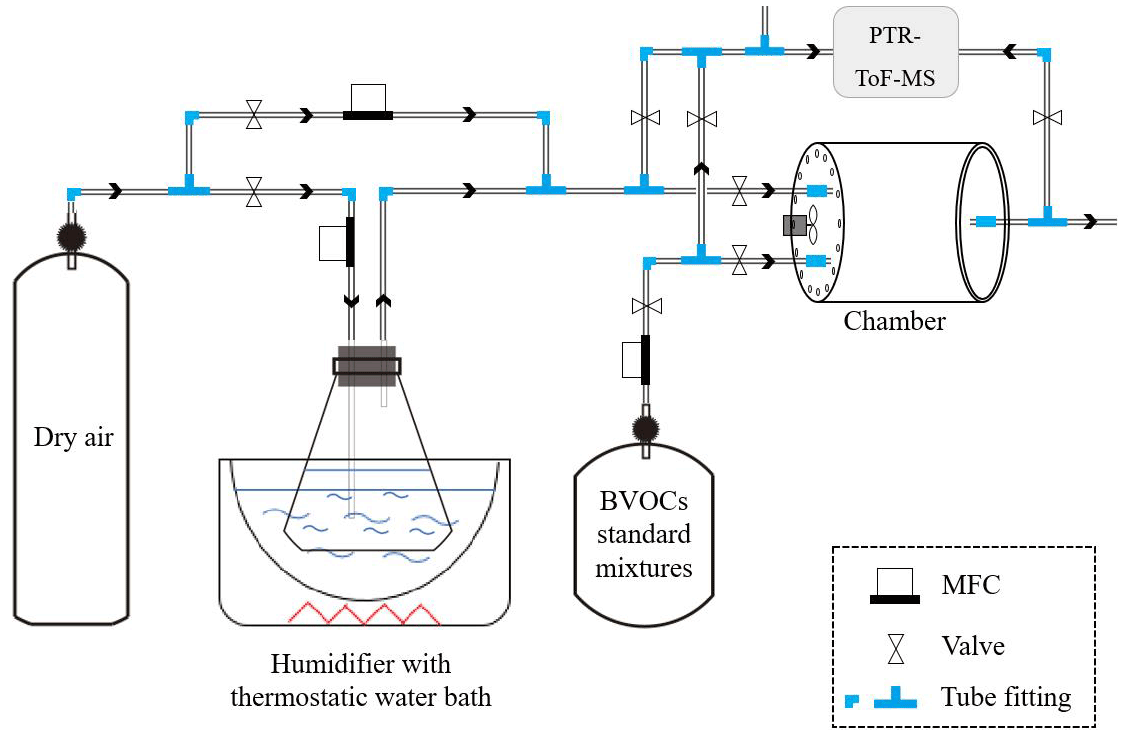
Figure 2Schematic diagram of chamber characterization experiments in the laboratory using standard BVOCs mixture to imitate emissions of BVOCs from branches. MFC stands for mass flow controller.
2.5 Field tests
The tests of the influence of flow rate on ambient–enclosure differences in temperature and RH was carried out in the campus of Guangzhou Institute of Geochemistry (GIG) with branches of Mangifera indica (a broad-leaved isoprene emitter) under sunny and cloudless days with small winds. In total, about 7.0 g dry mass of leaves were enclosed in the chamber. The ambient air temperature was 31–33 ∘C, and PAR was 1000–1200 µmol m−2 s−1. The enclosure and ambient temperature and RH were measured by calibrated sensors (HC2A-S, Rotronic, Switzerland) under circulating air flow rates of 3, 6, 9, 12, and 15 L min−1.
Field tests were also carried out during 09:00–17:30 local time (LT, UTC+8) on 8 October 2019 in the Guangdong Tree Garden (23.20∘ N, 113.38∘ E) of the Guangdong Academy of Forestry in Guangzhou, southern China. The coniferous pine trees are typical monoterpene emitters (Aydin et al., 2014). Pinus massoniana, which is a widely distributed pine tree species in southern China (Gu et al., 2019; Wang et al., 2019), was selected for our field tests. Healthy nature-grown branches of Pinus massoniana (∼ 20-years old and ∼ 12 m high) were enclosed in the dynamic chamber (Fig. 1), and environmental parameters inside and outside of the chamber were compared only under a medium circulating air flow rate of 9 L min−1.
3.1 Equilibrium time
Theoretically, concentrations of BVOC species that emitted by plant leaves inside a dynamic chamber can be described as follows (Niinemets et al., 2011):
where V (L) is the volume of the chamber; E (µg min−1) is the emission rate of BVOCs; C0 (µg L−1) is the background concentrations of the BVOC species in air entering into the chamber, which were determined by PTR-ToF-MS in the lab tests and in field tests were determined both online by PTR-ToF-MS and offline by sampling ambient air near the inlet with adsorbent cartridges followed by TD-GC/MSD analysis back in the lab; C (µg L−1) is the concentrations of the BVOC species in air exiting the chamber; and F (L min−1) is the air flow rate through the chamber. The above equation can be expressed explicitly for changing C(t) with time t as follows:
Based on the above Eq. (2), with prolonged time t, C(t) will approach a steady-state concentration Cs:
and then E can be calculated as
With leaf dry mass (m, g), the emission factors (EF, µg g−1 min−1) of enclosed leaves can be expressed as
As shown in Eq. (2), the value, which is the reciprocal of residence time (), determines how fast a steady state will be reached. At a given E, a lower F will result in a longer time to reach steady state but will have a higher steady state concentration that benefits instrumental measurements (and vice versa). In the field measurements, we prefer a shorter equilibrium time to track the variation of emission rates with changing environment parameters (like PAR) if is well above the method detection limits. In fact, as shown in Fig. S6, theoretically steady-state concentrations inside the enclosure would decrease with the increasing flow rates. However, even at flow rates as high as 50 L min−1 (residence time <15 s), if leaves with 5.0 g dry mass are enclosed, a BVOC species with an extremely low emission rate of 0.01 µg g−1 h−1 would have a predicted steady-state concentration of ∼10 ng m−3, which is still well above the method detection limits (Table S1) of SQTs that typically have much lower emission rates when compared to isoprene and MTs. Therefore, the influence of circulating air flow rates on the detection of BVOCs is not an important issue to limit the performance of the dynamic enclosure method and thus will be not discussed further here.
Equilibrium time is vital for evaluating the performance of a dynamic chamber. Based on Eq. (2), if (three cycles of residence time), and if (five cycles of residence time), , and in this case it can be concluded with confidence that after five cycles of residence time the equilibrium or the steady state is reached. With the high time resolution online monitoring by PTR-ToF-MS, equilibrium time could be determined more directly in our lab tests.
Figure 3 shows real-time concentrations of VOCs in the chamber at a flow rate of 9 L min−1 when using a standard mixture to imitate the BVOC emission in the lab (Fig. 2). The mixing ratios of VOCs in the chamber increased with time and became stable after ∼3–6 min or ∼2–4 cycles of residence time (Fig. 3). The representative VOC species differ in their times reaching steady state, varying from ∼3 min for α-pinene to ∼6 min for acetone and acrylonitrile. The equilibrium time are all within the five cycles of residence time (7.5 min).
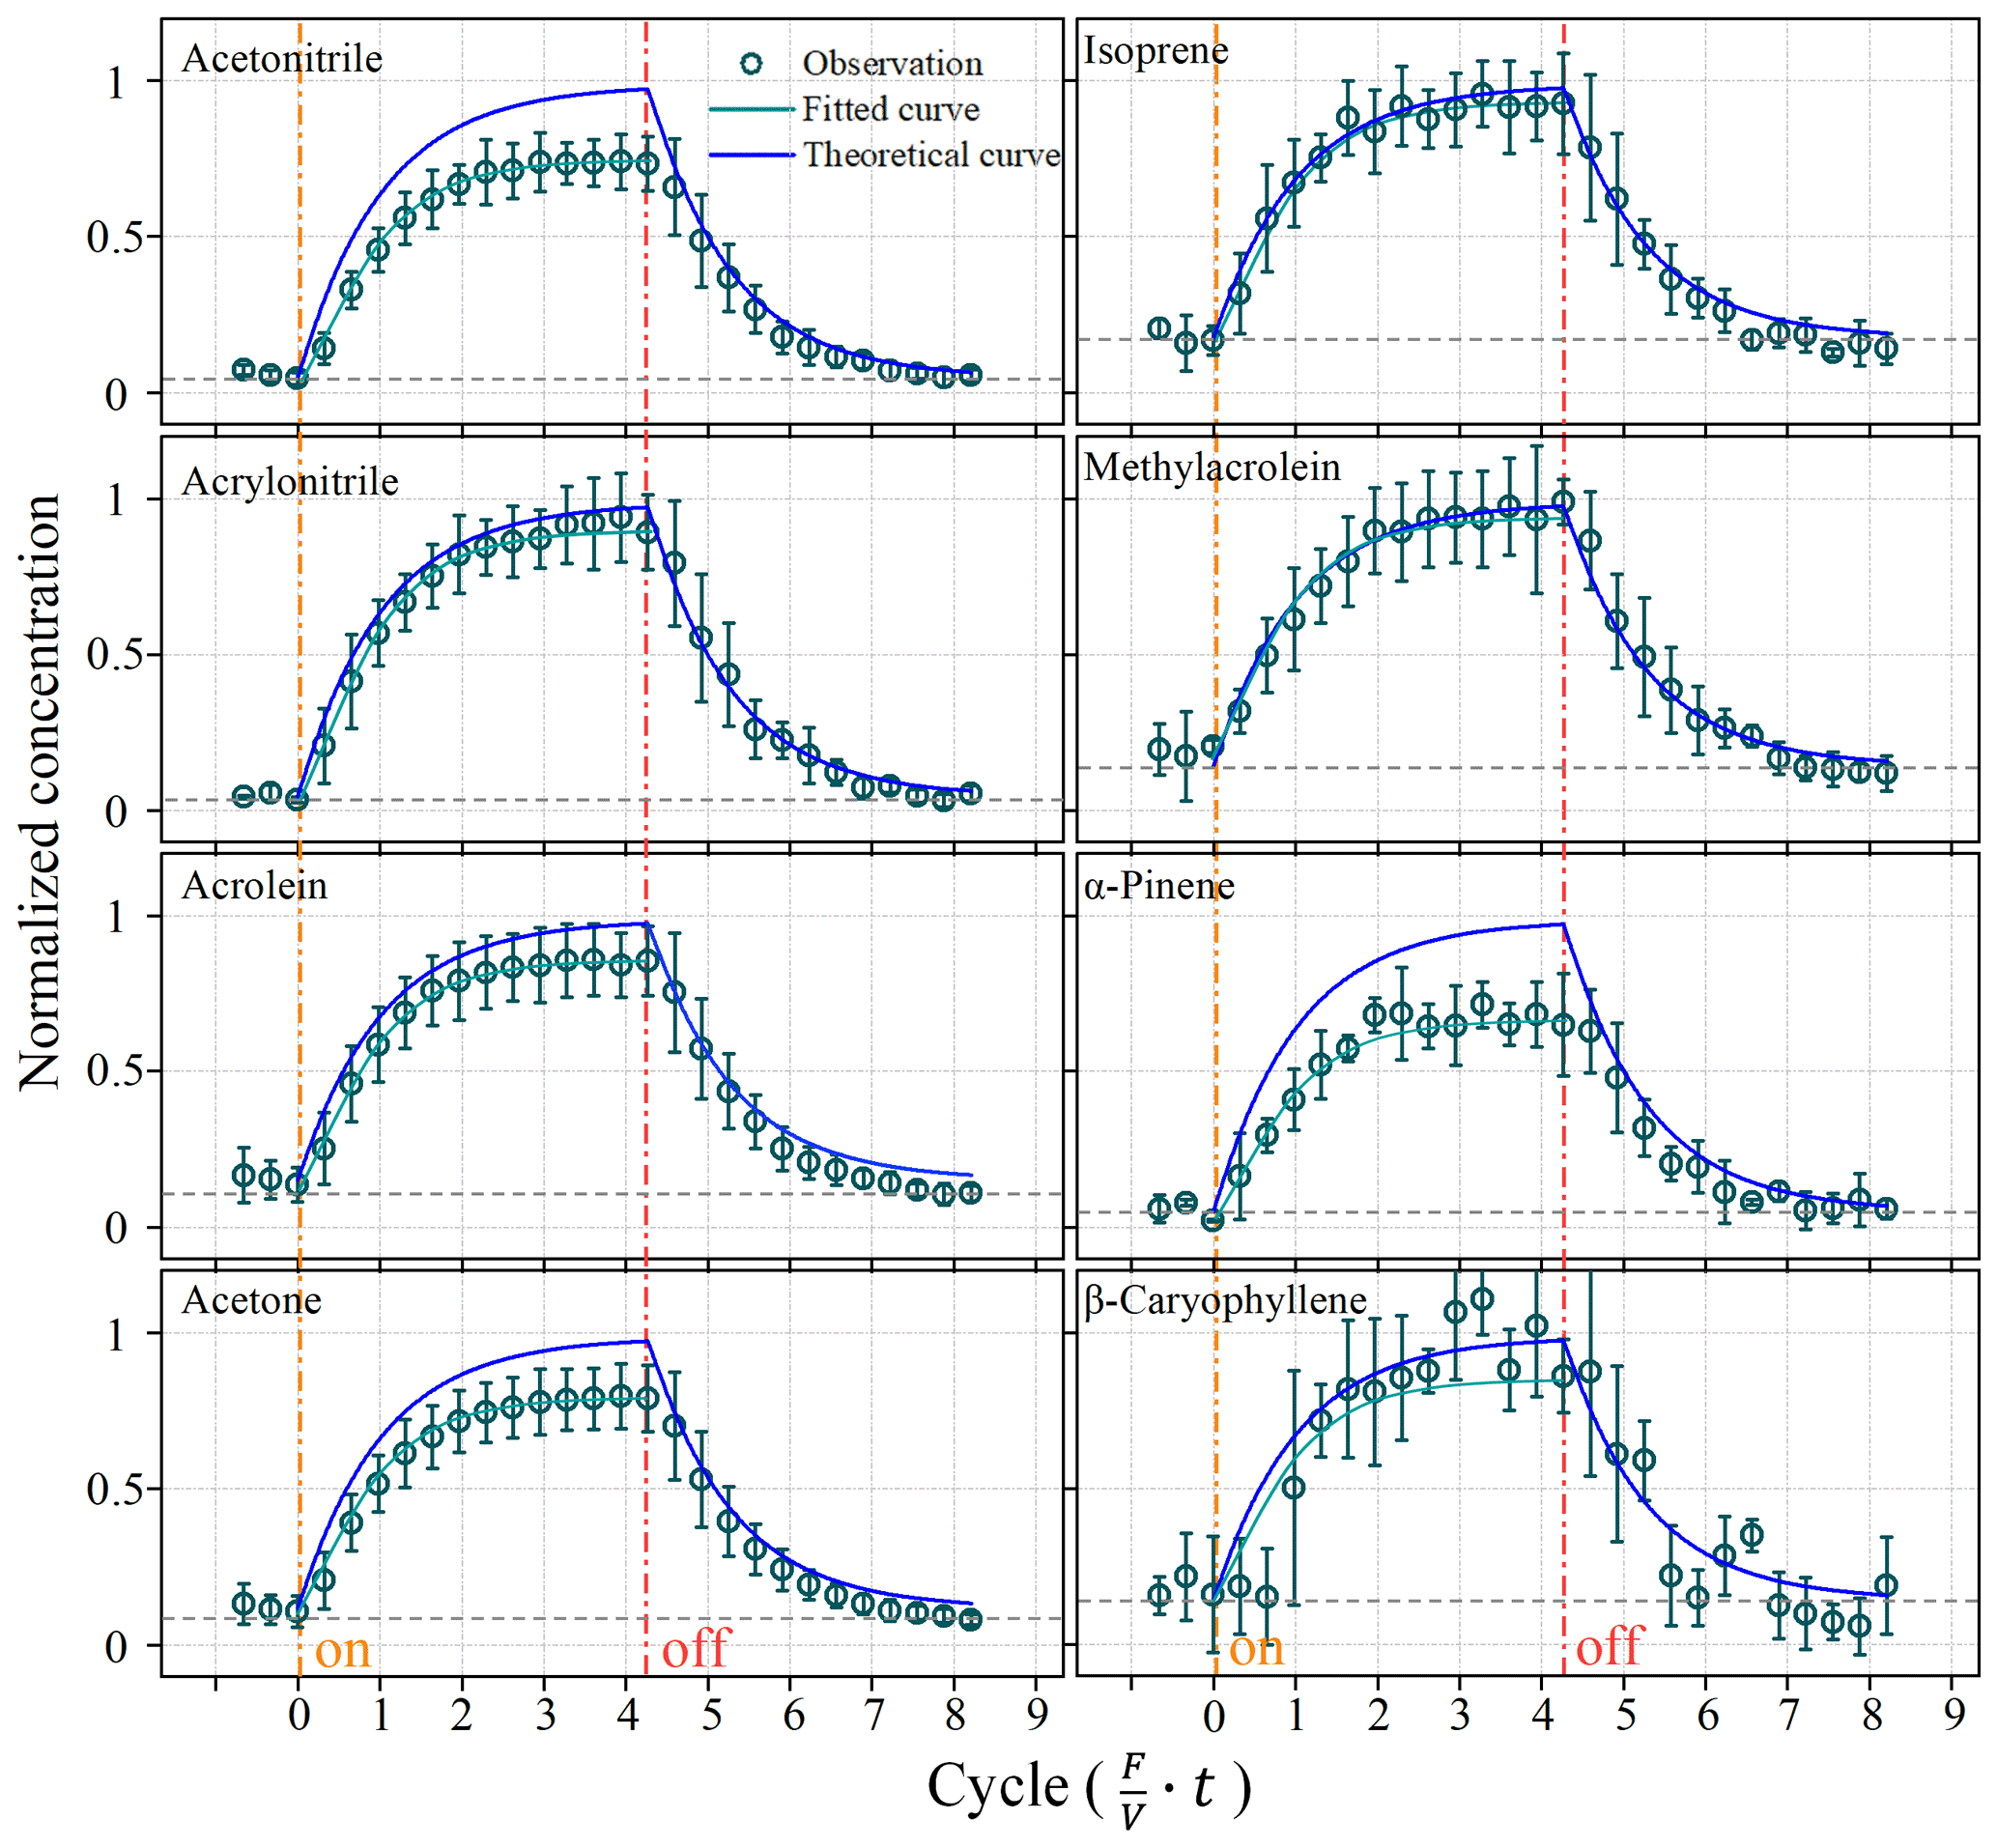
Figure 3Changes in BVOC concentrations in the chamber during lab simulation experiments. The dashed black lines are background concentrations. Solid blue lines represent the theoretically predicted BVOC concentrations in the chamber. The green circles are concentrations measured by the PTR-ToF-MS. Solid green lines represent fitted BVOC concentrations in the chamber.
The real-time mixing ratios of VOCs in the chamber changed in a pattern that was in fairly good agreement with that theoretically predicted by Eq. (2); however, they were all close and consistently lower than the theoretically predicted values (Fig. 3). The gaps between the measured and predicted values seemed to be larger for heavier BVOC compounds (e.g. α-pinene and β-caryophyllene) than lighter species (e.g. isoprene). As shown in Fig. 3, after the stopping the injection of the standard mixture, the mixing ratios inside the chamber dropped to their initial background values in a way that was fitted well with theoretical predictions.
The lower than predicted steady-state concentrations were largely due to losses of VOCs in the chamber, which would result in a lower Cs in Eq. (3) and thereby a lower “real” E by Eq. (4). Therefore, apart from equilibrium time, the loss or transfer efficiency must be further considered for an accurate emission measurement by a dynamic chamber.
3.2 Transfer efficiency
Adsorption losses of BVOCs can be a significant fraction in enclosure systems (Helmig et al., 2004). Although Tedlar or Teflon films, which are chemically inert with low surface uptake rates for BVOCs, were used for most dynamic enclosures to diminish the adsorption in the enclosure (Ortega and Helmig, 2008; Gonzaga Gomez et al., 2019; Chen et al., 2020), adsorptive losses cannot be completely eliminated. Kolari et al. (2012) observed 6 %–29 % compound losses in a chamber made of transparent acrylic plastic with Teflon-coated inner surfaces. Hohaus et al. (2016) observed average losses of 15 % in their enclosure consisting of FEP film. In this study, tests were conducted under different flow rates and RH in the lab with the standard mixture to assess the adsorptive losses and transfer efficiencies (Fig. 2).
3.2.1 Influence of flow rate on transfer efficiency
Figure 4 shows transfer efficiencies under air circulating rates (dry air) of 3, 6, 9, 12, and 15 L min−1. Transfer efficiencies of all species increased when flow rates increased from 3 to 15 L min−1, such as from 41.9 ± 2.6 % to 85.4 ± 4.6 % for acetonitrile, 56.5 ± 5.5 % to 90.8 ± 8.7 % for acrylonitrile, 24.7 ± 3.0 % to 65.4 ± 2.8 % for acrolein, 42.5 ± 3.5 % to 110.9 ± 2.9 % for acetone, 48.4 ± 4.6 % to 106.9 ± 8.3 % for isoprene, 40.6 ± 5.2 % to 92.8 ± 5.8 % for methylacrolein, 26.6 ± 3.2 % to 69.7 ± 3.7 % for α-pinene, and 22.8 ± 3.4 % to 65.9 ± 3.8 % for β-caryophyllene.
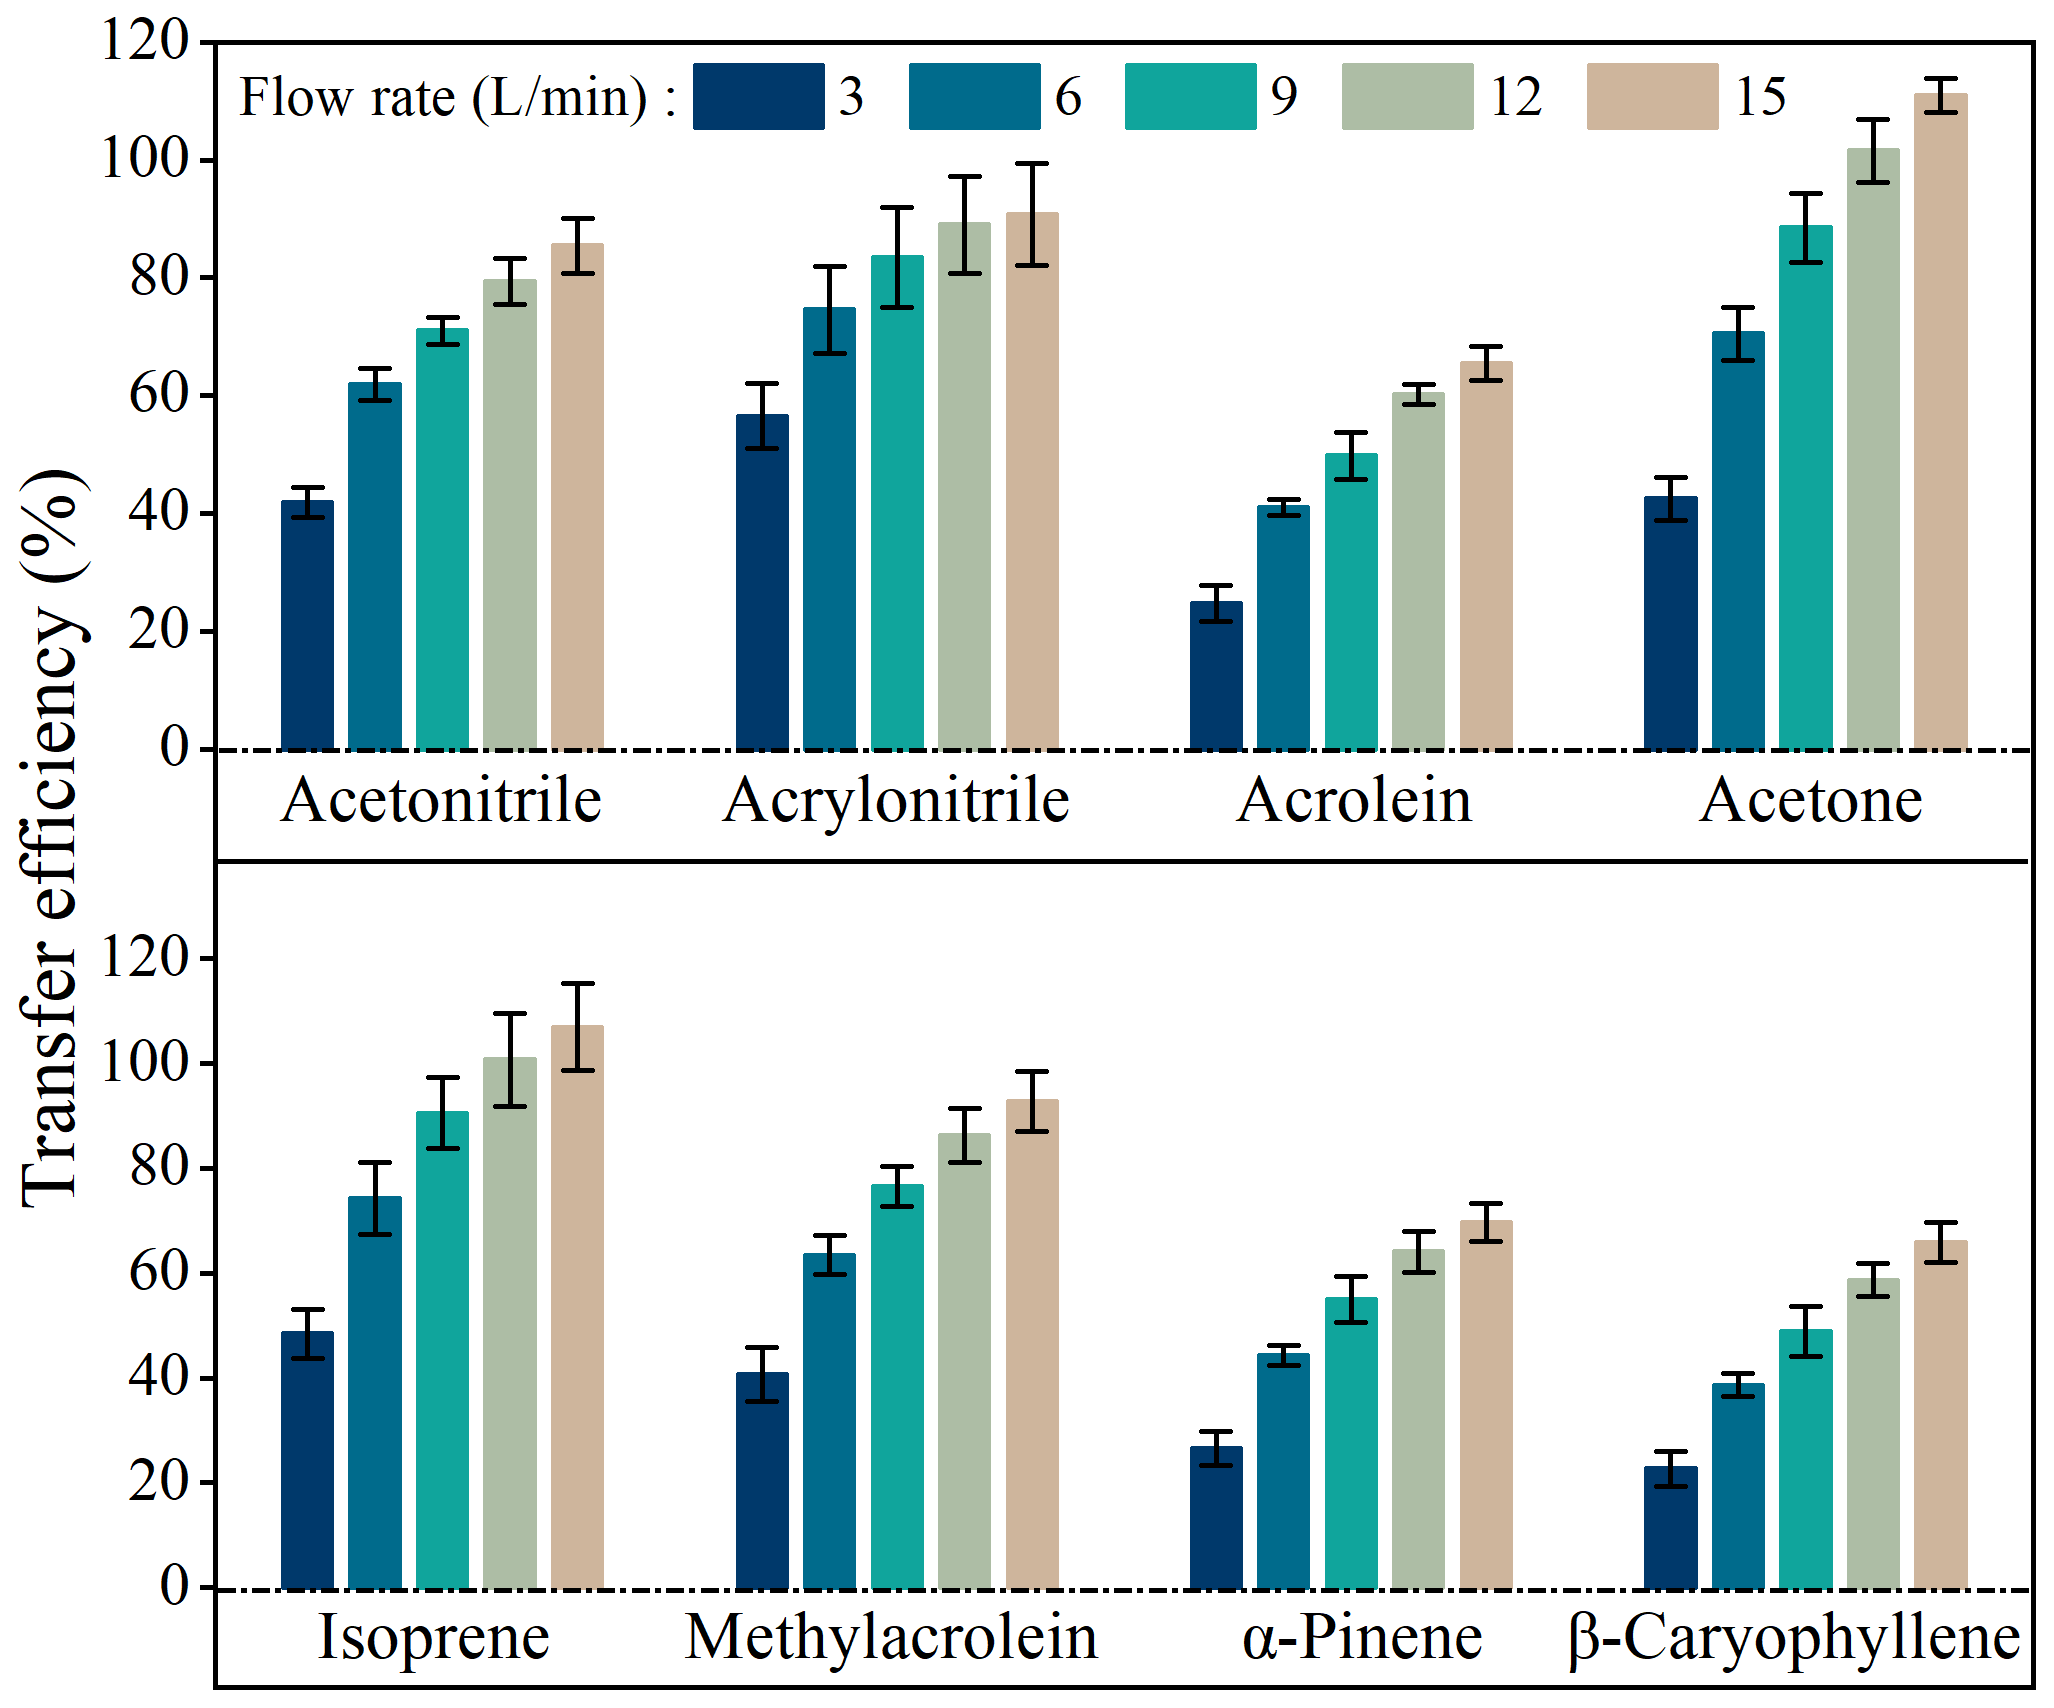
Figure 4Transfer efficiencies of BVOCs when passing through the chamber under different flow rates in the lab simulation experiments. Error bars represents standard deviations of triplicate measurements.
Transfer efficiencies were apparently unsatisfactory at lower flow rates. For example, at a flow rate of 3 L min−1, for the most important BVOC species like isoprene and α-pinene, their transfer efficiencies on average were as low as 48.4 % and 26.6 %, respectively (Fig. 4). This confirms that larger losses might occur if a static chamber is used to measure emission rates. Even at a flow rate of 15 L min−1 (residence time <1 min), transfer efficiencies were still below 70 % for acrolein, α-pinene, and β-caryophyllene (Fig. 4) although fairly good transfer efficiencies (85 %–111 %) were observed for other species. This result implies that measured emission rates from branches in enclosures might be seriously flawed in cases where transfer efficiencies are not well characterized and optimized.
For a given volume chamber, a higher flow rate is associated with a lower residence time (). More adsorptive losses would occur at longer residence times since VOCs have more time to adsorb onto chamber inner surfaces (Kolari et al., 2012). Therefore, the VOC loss ratios increased with residence times (Fig. 5) and decreased with flow rates (Fig. S7), and a larger flow rate would be preferred if the losses are to be reduced to acceptable levels.
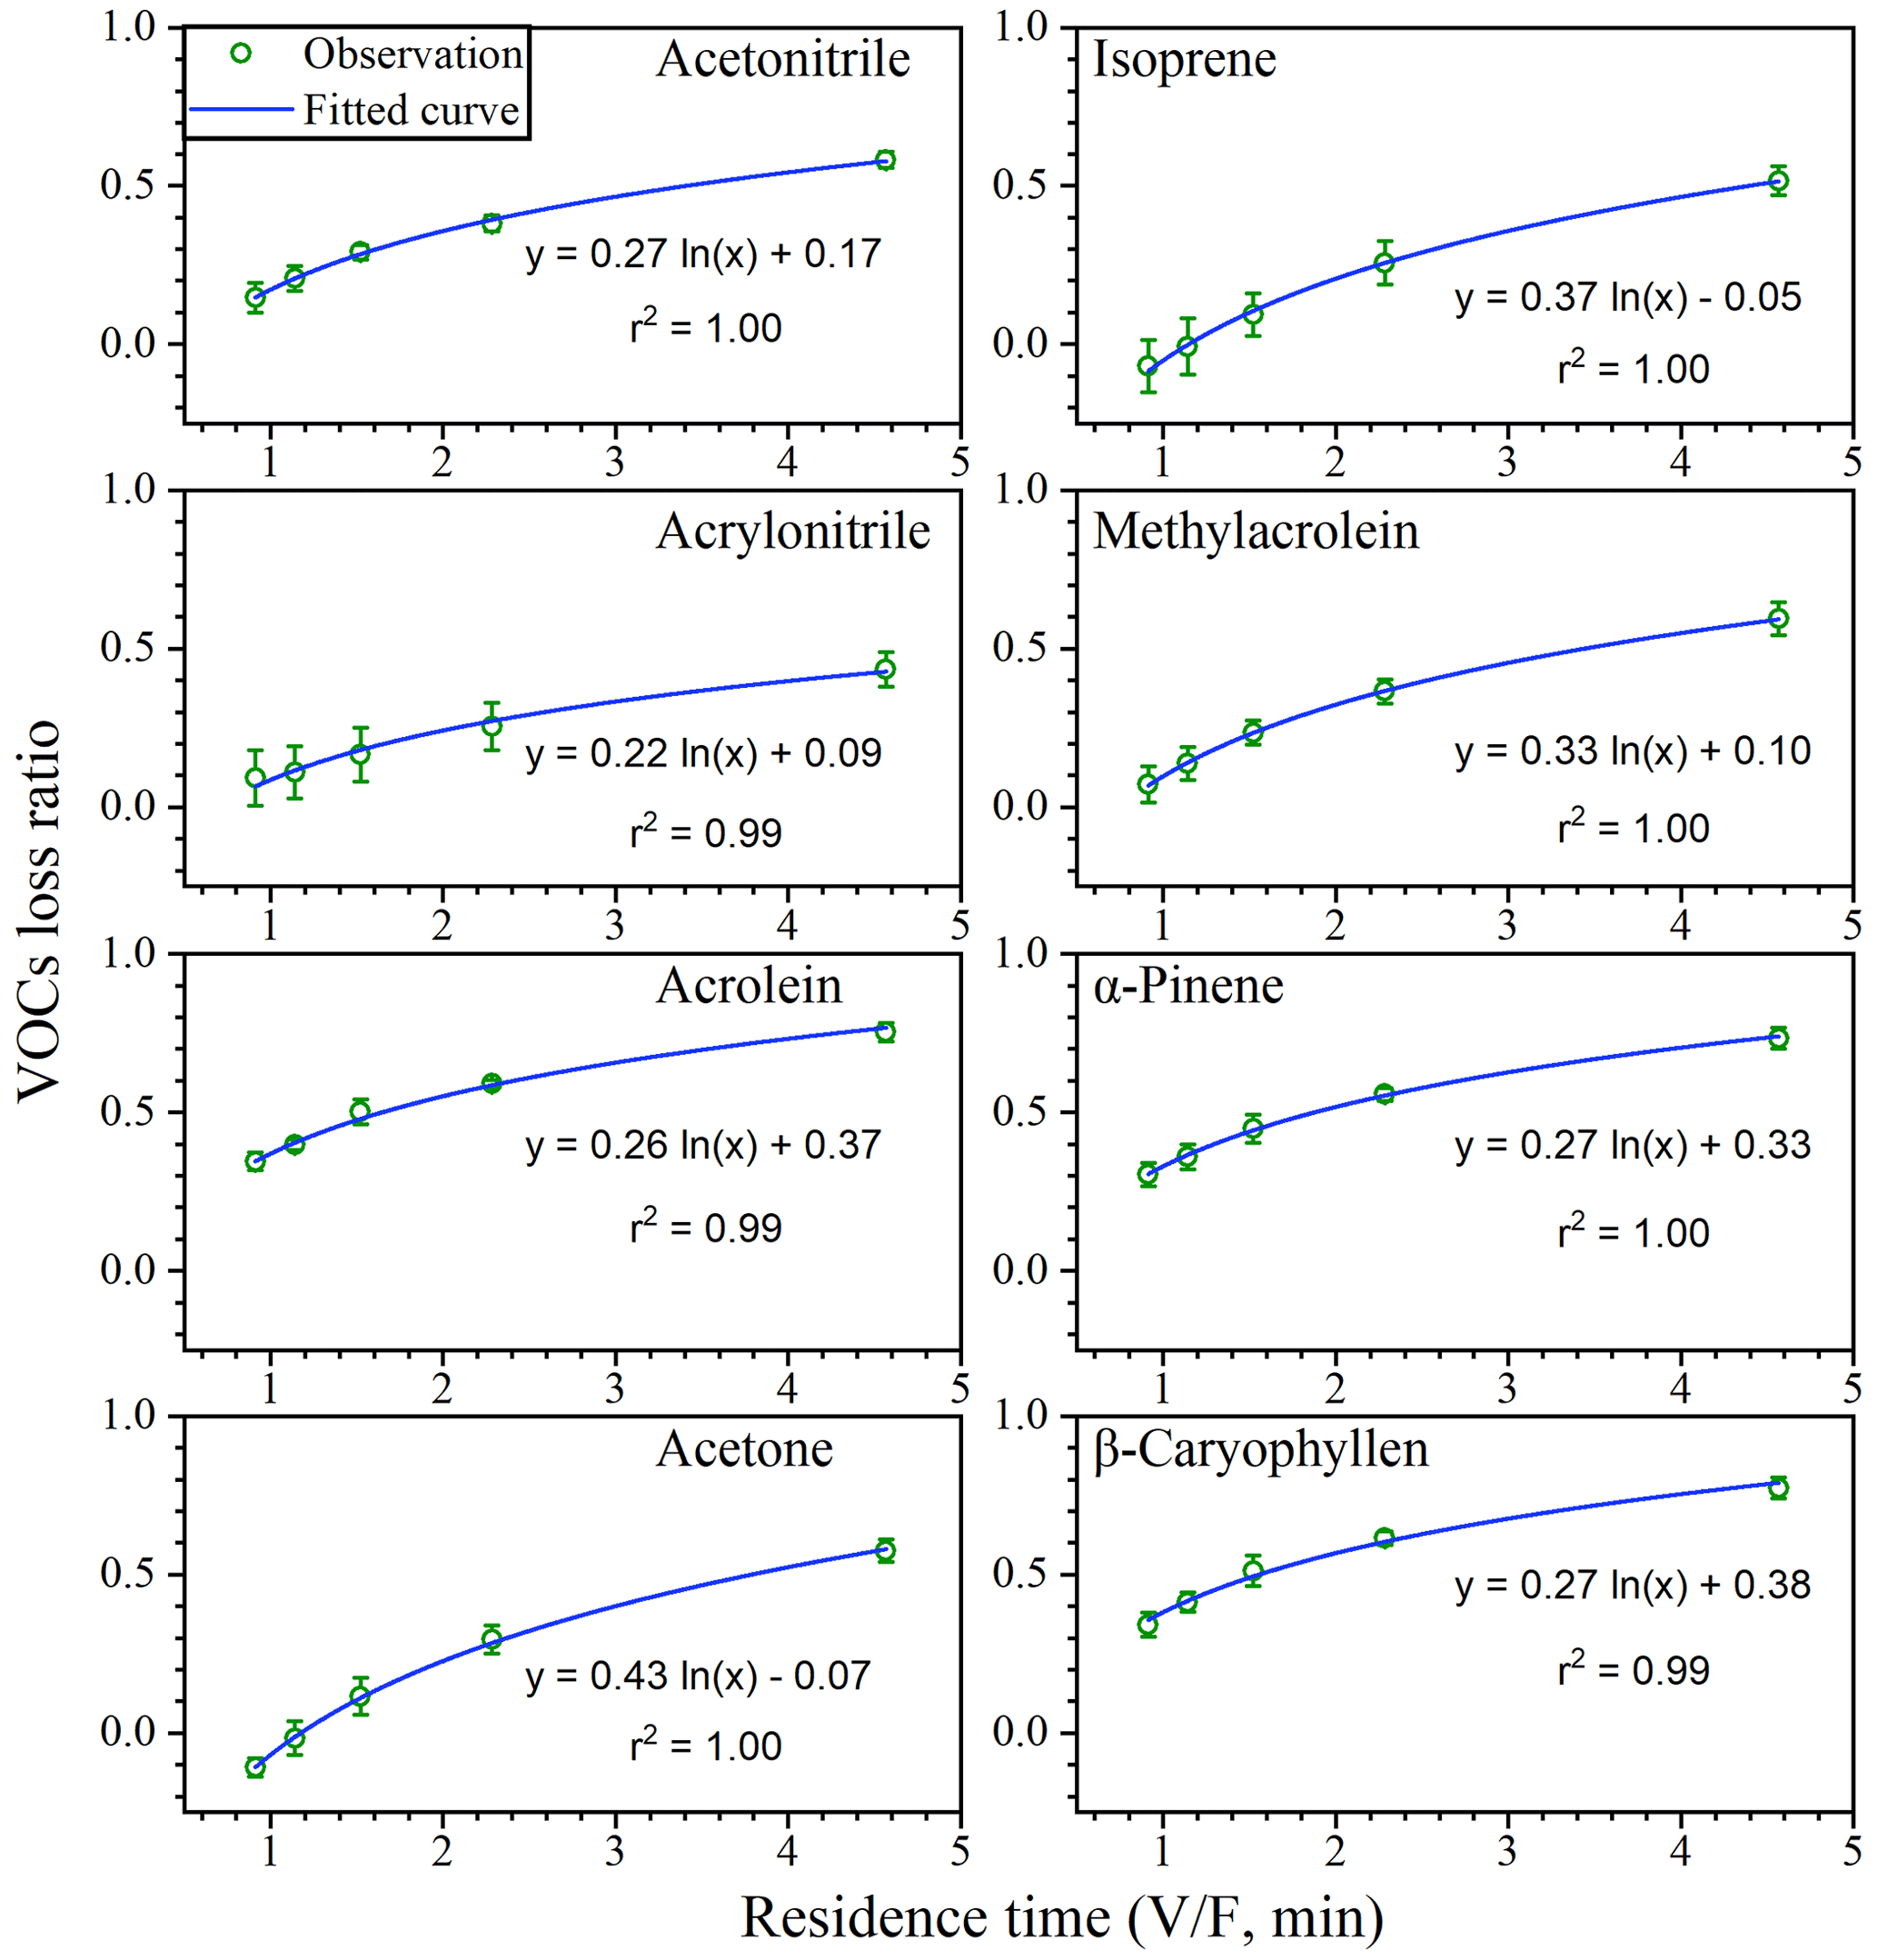
Adsorptive losses may vary with VOC species. The loss is generally related to vapour pressure, which is modified by molecular weight and boiling point (Ortega and Helmig, 2008). As a result, heavier VOCs like α-pinene and β-caryophyllene with lower vapour pressure are easier to be adsorbed. Kolari et al. (2012) observed that heavier VOCs () such as hexanal and MTs showed stronger adsorption in their dynamic chamber. Schaub et al. (2010) also found stronger adsorption for SQTs in a branch chamber where weaker adsorption occurred at higher temperature. Our results also demonstrated that running conditions like flow rates need to be carefully modulated, especially for heavier BVOCs like MTs and SQTs.
3.2.2 Influence of RH on transfer efficiency
The influence of RH on transfer efficiencies or adsorptive loss of BVOC in a chamber is not so consistent in previous studies. While Kolari et al. (2012) observed notable adsorptive loss for isoprene and methyl vinyl ketone at wet environment and no significant differences between wet and dry environment for hexanal and α-pinene, Hohaus et al. (2016) observed transfer efficiencies independent of RH (ranging 25 %–100 %) for VOCs with different vapour pressure and polarity through the “PLant chamber Unit for Simulation (PLUS)”. In this study, transfer efficiency under different RHs (0 %, 20 %, 40 %, 60 %, 80 %, 100 %) and flow rates (3, 6, 9, 12, 15 L min−1) were further investigated with the standard VOC mixture (Fig. 2).
As shown in Fig. 6, unlike flow rates RH seemed to have less influence on transfer efficiencies, as reflected by the relative standard deviation (RSD) of transfer efficiencies at different RH. The RSD of transfer efficiencies under different RH varied from 2.6 % for acetone at 15 L min−1 to 14.8 % for sesquiterpene at 3 L min−1. There is no consistent decreasing or increasing trend for transfer efficiencies with the increase of RH. Instead, the influence of RH on transfer efficiencies showed compound-specific patterns. For acetonitrile and methylacrolein, the highest transfer efficiency occurred at low RH = 0 % (dry air); for α-pinene and β-caryophyllene, the highest transfer efficiency occurred under higher RH (100 %); for acrylonitrile, acetone, and isoprene, higher transfer efficiency occurred at medium humidity levels (∼40 %); and for acrolein, transfer efficiencies were close to each other under different RH, agreeing with the results by Hohaus et al. (2016). Theoretically, the influence of RH on adsorptive loss depends on the competition of adsorption sites by water molecules on the surfaces and the modification of energy spectrum of the adsorption sites by condensed water on the surface. Therefore, for water-insoluble or hydrophobic BVOCs like isoprene, MTs, and SQTs, higher RH may help suppress their uptake on surfaces, while for water-soluble or hydrophilic OVOCs, lower RH would be preferred for higher transfer efficiencies.
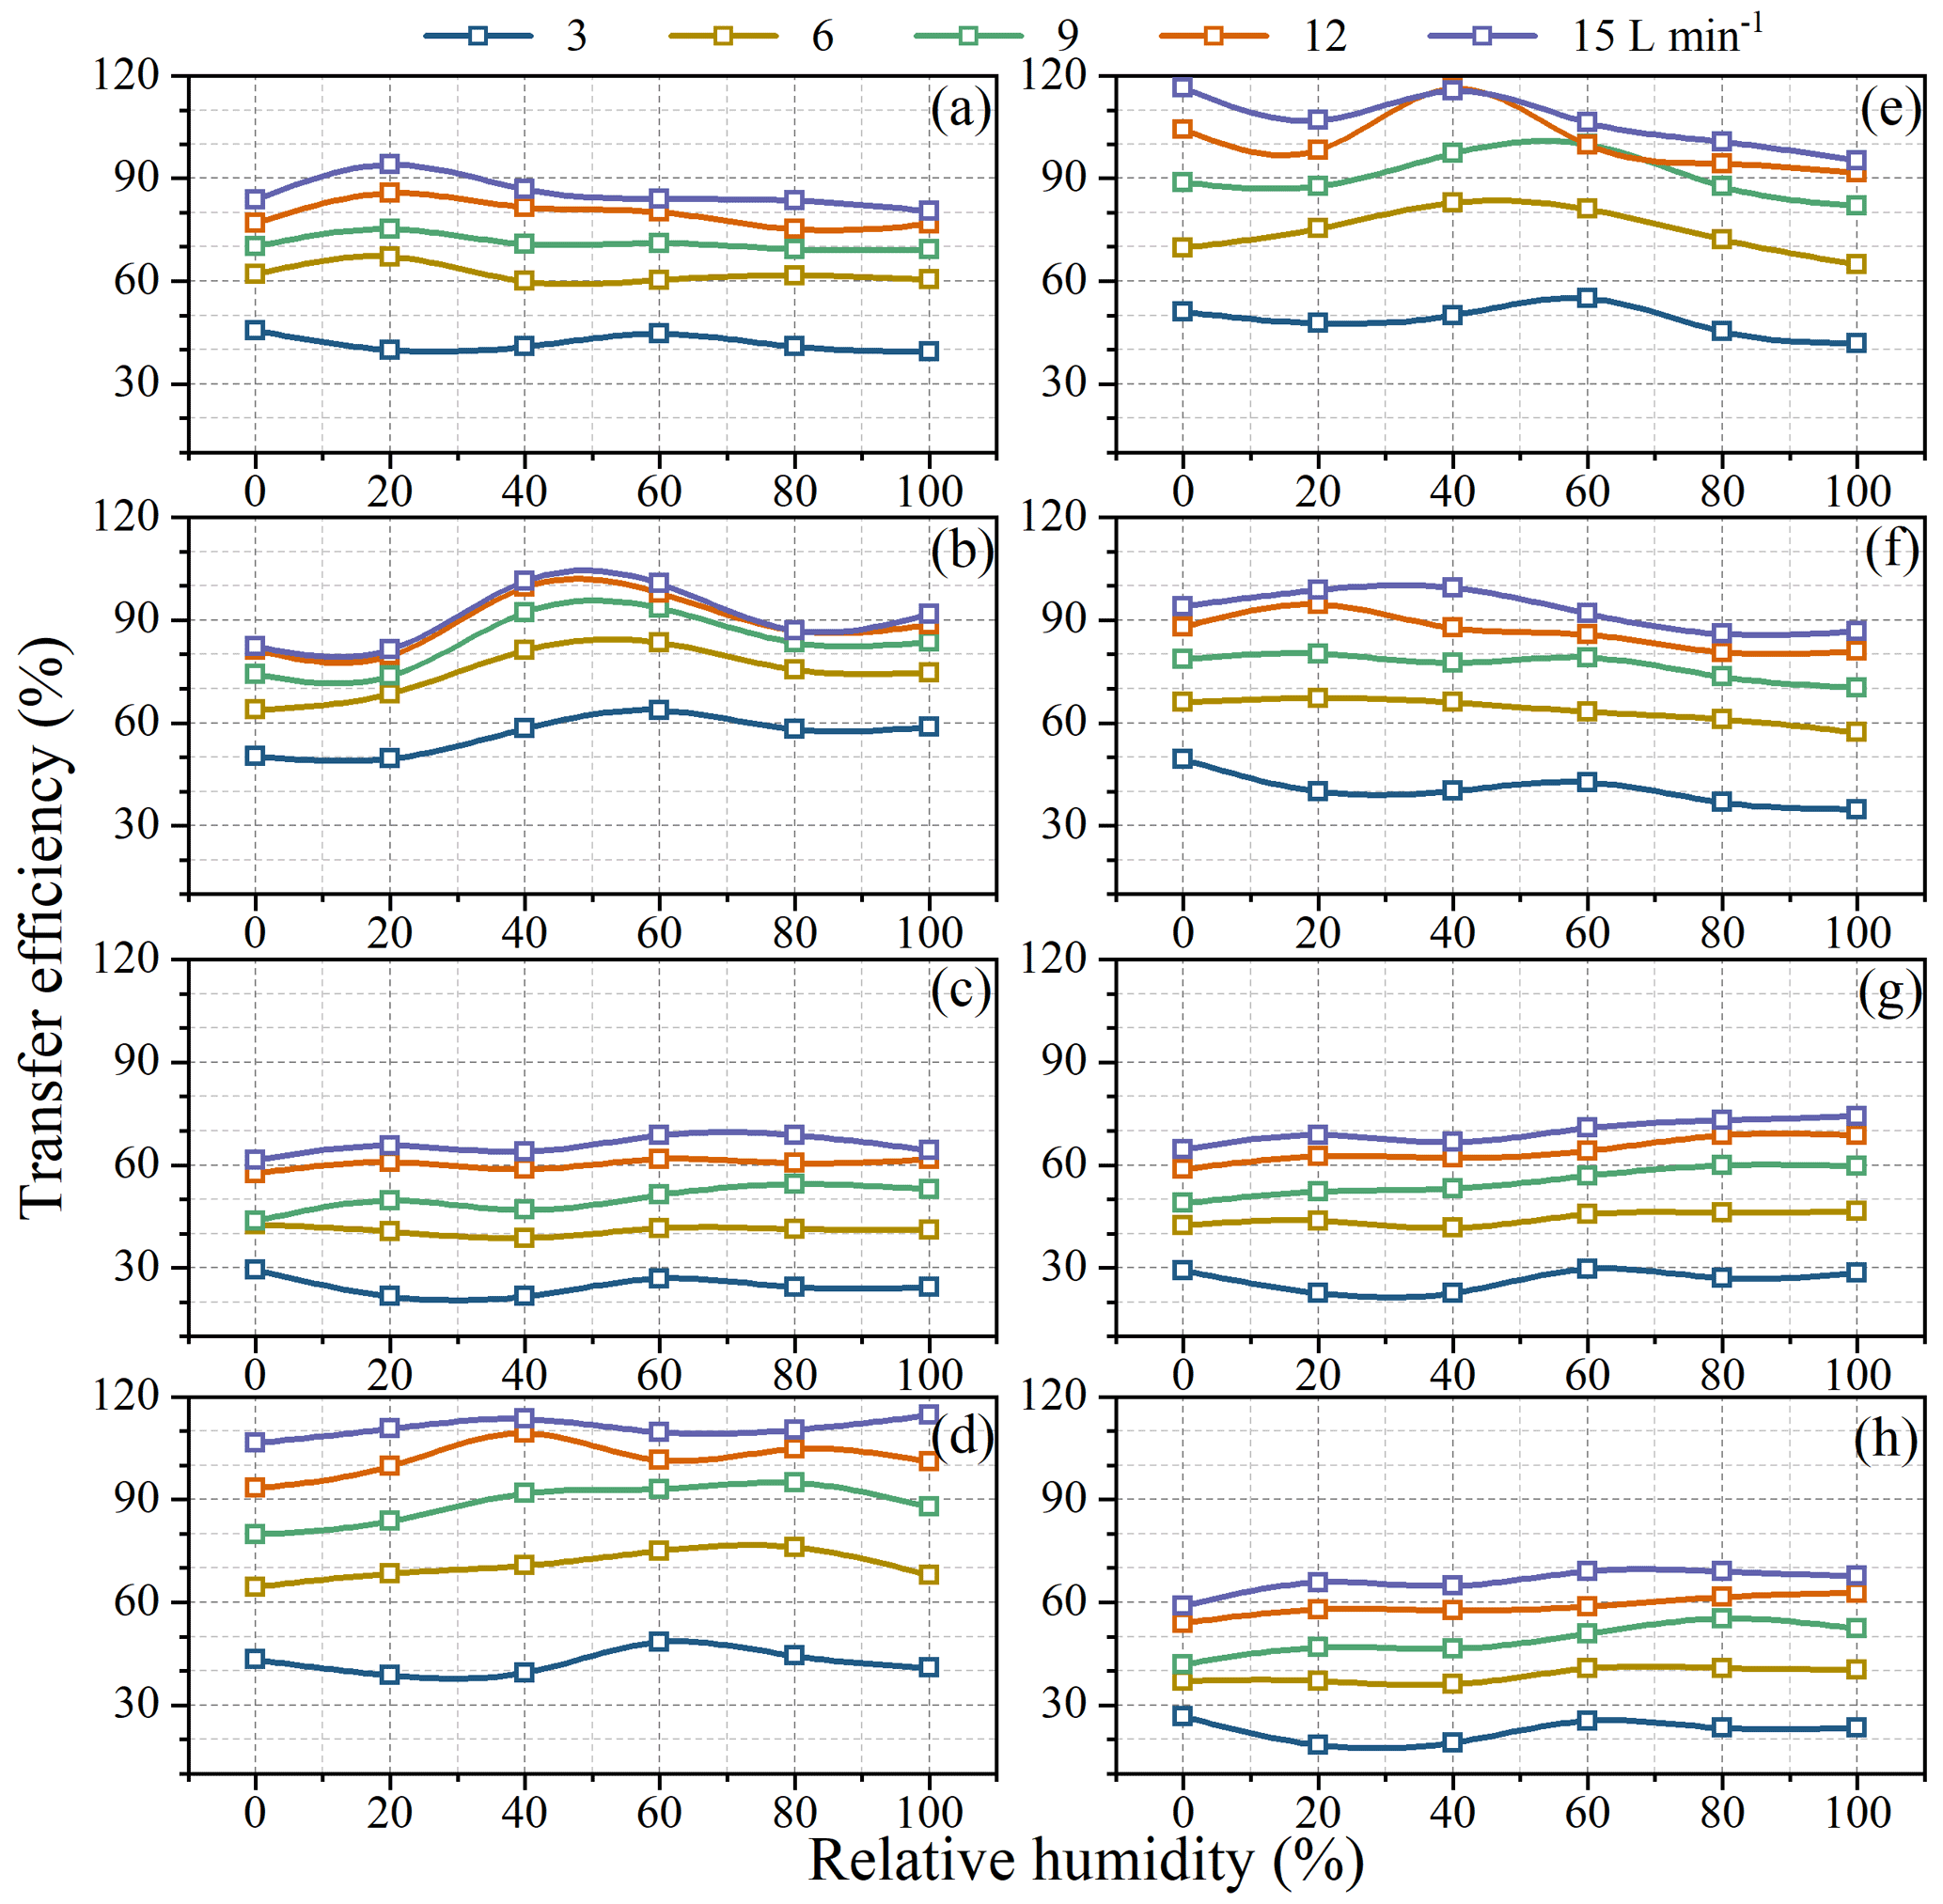
Figure 6Influence of relative humidity and flow rates on transfer efficiencies of BVOCs: (a) acetonitrile, (b) acrylonitrile, (c) acrolein, (d) acetone, (e) isoprene, (f) methylacrolein, (g) α-pinene, and (h) β-caryophyllene.
3.2.3 Possible correction of VOCs losses in lab simulations
Due to the adsorptive losses, the measured emission rates from plant leaves would be underestimated, particularly for those with unsatisfactory transfer efficiencies, even under high flow rates and short residence times. If the adsorptive loss rate is simplified to be linearly proportional to the VOC concentration inside the chamber, Eq. (1) can be rewritten as follows:
where k is the correction factor due to adsorptive loss. When the VOC concentration in the chamber reaches steady-state Cs, the emission rates can be estimated as follows:
In our simulation tests in the lab with the standard mixtures with the known E and F, after measuring the steady-state concentration Cs, based on Eq. (7) we could calculate the adsorptive loss term k×Cs and k as well.
The correction factors for different VOCs at different flow rates and RH are presented in Table S4. Consistent with the lower transfer efficiencies at lower flow rates, for a VOC species the largest k value occurs at 3 L min−1, while the smallest k value occurs at 15 L min−1. In addition, k is less affected by RH than by flow rates, and varies among the VOCs probably due to their different adsorptive behaviour on the surfaces.
It is under question, however, if this kind of simplified loss correction in lab simulations is applicable to field measurements due to complex adsorption behaviour. For example, in field measurements of branch-scale emissions, the surfaces may have limited adsorption capacity, especially for the Teflon-coated inner walls, and thus with the prolonged enclosure time of a branch in the chamber some species may become adsorption saturated on the surfaces and thus would be less affected by the adsorptive loss. To avoid the influence of VOC adsorption, it may be a plausible way to measure emissions after getting adsorption saturation (Chen et al., 2019). In the field, 1 to 2 h of balance time prior to tests will be set to reduce the artificial disturbance to the physiological state of the enclosed branch and to ensure that emissions in the enclosure get stabilized, such a procedure would also set enough time for adsorption of emitted compounds and thereby benefit lowering the adsorptive loss during tests afterwards. On the other hand, adsorption of VOCs on surfaces in the enclosure will be weakened at high temperatures (Schaub et al., 2010; Kolari et al., 2012). Some more adsorptive species, like SQTs, after getting adsorption saturated at lower temperature, would release again from the surface when air temperature elevated (Schaub et al., 2010). When considering the temperature effect on the adsorptive loss, field enclosure measurements of branch-scale emissions at higher temperature intervals (e.g. near midday) during a day would have less interferences by adsorptive loss.
Despite the limitations of loss correction from the lab simulation in this study, this approach might be implicative to deal with the more complex adsorption behaviour in field measurements. Previous lab studies also eliminated loss by using VOC standards to calibrate the whole measuring system (Ghirardo et al., 2011, 2020). Ortega et al. (2008) made adsorption loss corrections of VOCs by adding internal standard into the enclosure to calculate the recovery. Therefore, for more accurate emission measurements by dynamic enclosures in the field, adding surrogate compounds in the circulating air in the same way as this simulation study (Fig. 2) would be a possible way to evaluate in situ transfer efficiencies.
3.3 Comparison of environmental parameters inside and outside of the chamber in field measurements
When conducting field measurements of BVOCs with branch enclosures, it is vital that environmental parameters, particularly temperature, resemble the natural growing conditions and are not seriously deviated due to enclosure. As temperature will affect the emission of BVOCs from plants in an exponential way mainly due to the fact that temperature can modify the activity of biosynthetic enzymes, the vapour pressures and the cellular diffusion rates of BVOCs (Laothawornkitkul et al., 2009), and a small change in leaf temperature may induce a large variation in BVOC emissions. Here we first conducted tests about the influence of flow rates (3–15 L min−1) on the differences in temperature and RH between ambient and enclosure, and then we conducted tests for Pinus massoniana at a medium flow rate of 9 L min−1.
3.3.1 Ambient–enclosure differences under different flow rates
As shown in Fig. 7, when conducting tests of BVOC emissions (Fig. S8) with a branch of Mangifera indica (∼7 g dry mass of leaves) under ambient air temperature of 31–33 ∘C and PAR of 1000–1200 µmol m−2 s−1, the differences in both temperature and RH between enclosure and ambient air decreased sharply with the increase of flow rates. As flow rates increased from 3 L min−1 (residence time ∼4.5 min) to 15 L min−1 (residence time ∼0.9 min), the ambient–enclosure temperature differences (ΔT) decreased from 4.5±0.3 to 1.0 ± 0.2 ∘C (Fig. 7a) and the RH differences (ΔRH) decreased from 9.8 ± 0.5 % to 1.2 ± 0.1 % (Fig. 7b). The results confirmed that the ambient–enclosure differences in could be largely reduced if enclosure air is sufficiently circulated. It seemed that at a flow rate of 9 L min−1 (residence time ∼1.5 min), the differences could be fairly satisfactory (ΔT<2 ∘C; Δ RH <5 %).
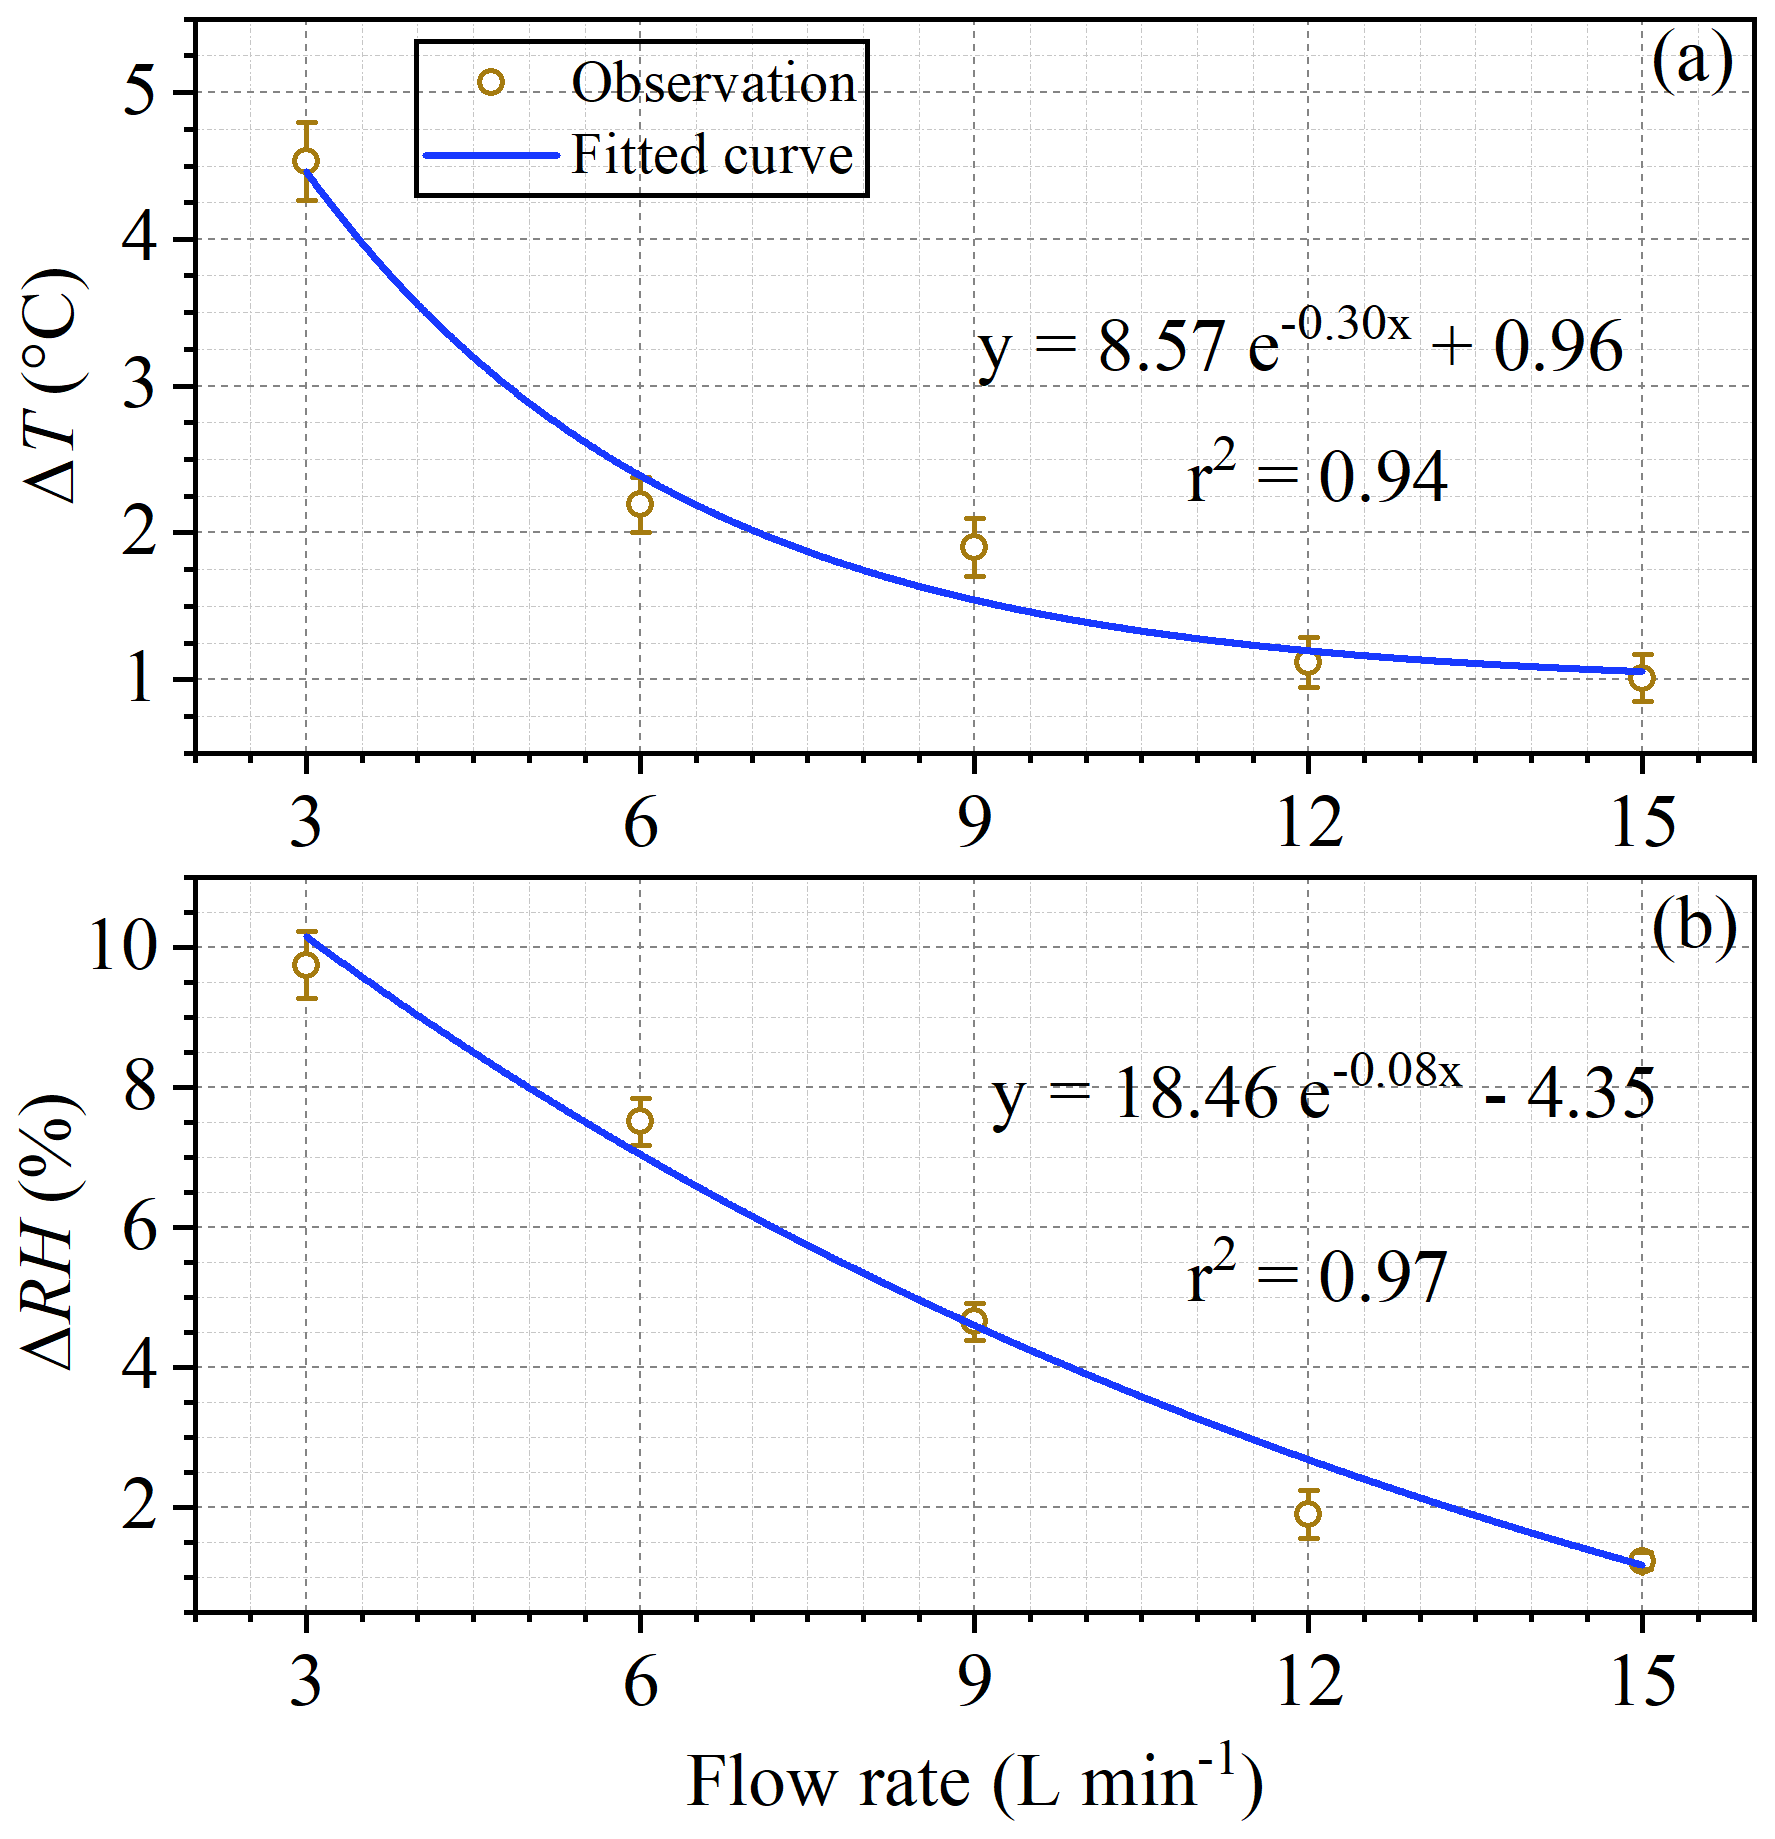
Figure 7Ambient–enclosure differences in temperature (a) and RH (b) under different flow rates. Circles with errors bars are the measured means and standard deviations. The solid lines are exponential fit curves.
3.3.2 Ambient–enclosure differences of environmental parameters during field tests of BVOC emissions from Pinus massoniana
As mentioned above, higher flow rates will result in lower steady-state concentrations. To guarantee the detection of BVOCs species (Fig. S8) with very low emission rates, we only adopted a medium flow rate of 9 L min−1 when conducting tests on a pine (Pinus massoniana) tree to compare the environmental parameters inside and outside the enclosure.
As expected, higher temperature and RH but lower PAR and CO2 concentrations were observed inside than outside the enclosure (Fig. S9). On average, the temperature deviation inside the chamber was ∘C and the RH deviation was %; The CO2 concentrations inside showed −53 ppm deviation on average, with a relative deviation of −(4–15) % during the day. The light transmittance was 92.4 ± 5.4 % on average.
Higher temperature inside the chamber could be attributed to the greenhouse effect (Ortega et al., 2008). The temperature deviation inside the chamber in this study is smaller when compared to those reported previously (Fig. 8). The largest relative temperature deviation of 11.4 % was much lower than that of over 50 % reported in previous studies (Fig. 8a). Even under full sunlight at noon a temperature deviation of 4 ∘C was observed in this study, lower than that of 6–7 ∘C observed by Helmig et al. (2006) and 8 ∘C by Ortega et al. (2008) and comparable to 3–4 ∘C by Kolari et al. (2012) (Fig. 8b). Higher RH inside the chamber is caused by leaf transpiration, and the +12.8 % deviation is acceptable in field tests. Photosynthetic adsorption by leaves will lead to depletion of CO2 in the chamber. Kesselmeier et al. (1996) also observed 50 ppm lower CO2 concentration (relative deviation of −13.2 %) in their chamber due to the depletion, and they considered it well within an acceptable range for normal physiological conditions. The light transmittance of 92.4±5.4 % in this study is comparable with that reported in previous studies, such as that of 90 % by Aydin et al. (2014), 92 % by Karlik et al. (2001), 95 % by Chen et al. (2020), and 97 % by Lüpke et al. (2017). The comparison suggests the environmental parameters in the semi-open dynamic chamber were less disturbed. Moreover, tests in this study were conducted at flow rates of 9 L min−1 with residence time of 1.5 min, and observed steady-state concentrations for major emitted BVOC species (such as ∼15 µg m−3 for α-pinene) were orders of magnitude higher above their MDLs. Therefore, as discussed above, if we raised flow rates to be as high as 50 min L−1 with residence time of ∼15 s, we could still successfully measure the emission rates for the major species, and the equilibrium time, the adsorptive loss, and the inside–outside differences of temperature and RH would be further reduced to a larger extent.
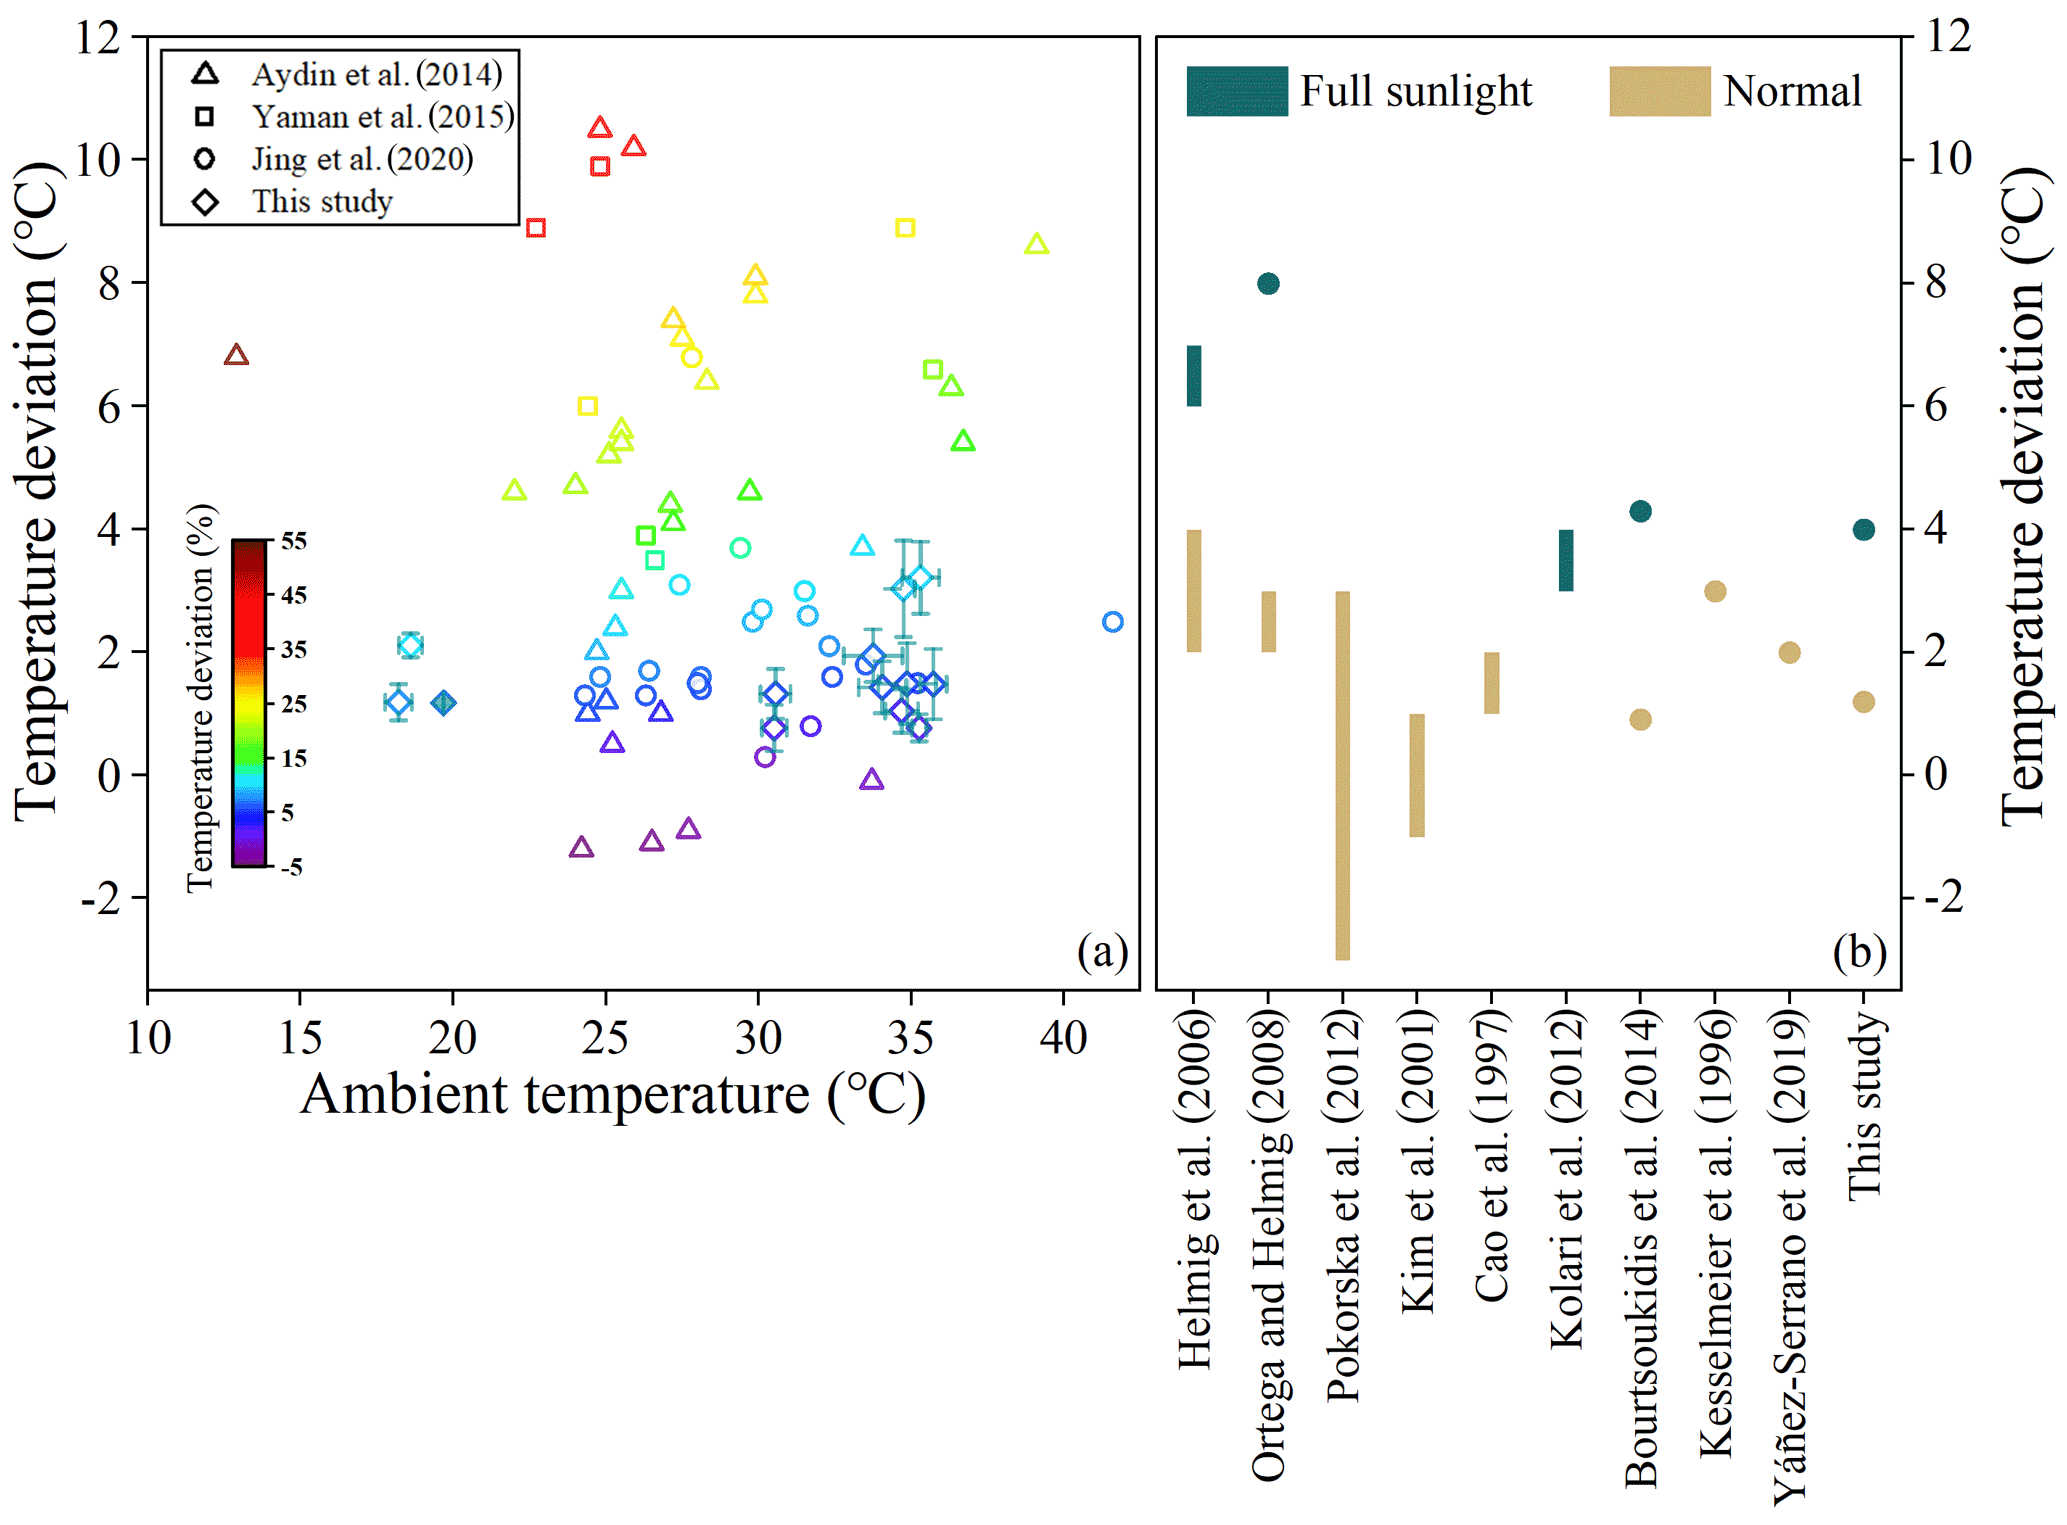
Figure 8Comparison of temperature deviation (∘C) and relative temperature deviation (%) with that reported in previous studies: (a) temperature deviation versus ambient temperature; error bars represent 1σ of deviation. (b) Temperature deviation (∘C) under normal and full sunlight for different enclosures. Bars are ranges of temperature deviation, while points indicate average temperature deviations.
In order to obtain accurate emission rates of BVOCs from plants growing in a natural environment, it is vital for a branch-scale enclosure to reduce the adsorptive loss and minimize the disturbance to the natural growing microenvironments. In this study, based on tests in the lab and in the field with a self-made dynamic enclosure, we demonstrated that operational parameters like air circulating rates could impact heavily on the performance of dynamic enclosures, and therefore they should be optimized before field applications. As revealed by the results, higher circulating rates could not only reduce the equilibrium time and facilitate higher time resolution emission measurements, but also reduce the adsorptive losses and the ambient–enclosure temperature and RH differences and thus obtain more accurate emission rates under natural conditions. Therefore, in field measurements using the dynamic enclosure method, if advanced analytical techniques like PTR-ToF-MS can assure sensitive enough detections, higher air circulating flow rates are preferred.
It is worth noting that although the inner surfaces were coated with inert Teflon films, based on a lab simulation with standard mixtures, BVOC species like monoterpenes and sesquiterpenes showed transfer efficiencies of less than 70 % even when the residence times were kept as low as <1 min. This suggests that emission factors of these species from dynamic enclosures might be underestimated if the adsorptive losses were not seriously considered and reduced, and further efforts are needed to develop a certified protocol to assure accurate emission measurements, particularly for species (e.g. monoterpenes and sesquiterpenes) with lower transfer efficiencies.
In the future, surrogate compounds like deuterated monoterpenes and sesquiterpenes can be added in the circulating air, as was done in our lab simulation study, to track the chamber performance and to correct the losses. Ghirardo et al. (2011, 2020) performed calibrations by passing a mixture of VOCs in N2 through the whole gas exchange system. Inspired by this approach, in field tests deuterated monoterpenes and sesquiterpenes can be doped into circulating air, or a deuterated monoterpene and sesquiterpene standard mixture can be released into the chamber at a constant flow rate. This way we may both calibrate target species and evaluate chamber performance.
Data are available from Zenodo (https://doi.org/10.5281/zenodo.5347841, Zhang and Wang, 2021) or upon request by contacting the corresponding authors (zhang_yl86@gig.ac.cn; wangxm@gig.ac.cn).
The supplement related to this article is available online at: https://doi.org/10.5194/amt-15-79-2022-supplement.
JZ designed and characterized the chamber with the support of HZ, XW, YZ, and WS. JZ and HZ carried out the chamber assessments. JZ, HZ, and ZW carried out the BVOC measurements in the field. JZ prepared the manuscript with input from all co-authors. XW and YZ revised the manuscript.
The contact author has declared that neither they nor their co-authors have any competing interests.
Publisher’s note: Copernicus Publications remains neutral with regard to jurisdictional claims in published maps and institutional affiliations.
The efforts of the three anonymous reviewers have greatly improved the quality of this paper and are sincerely appreciated.
This research has been supported by the National Natural Science Foundation of China (grant nos. 42022023, 41673116, and 41961144029), the Research Grants Council, University Grants Committee (grant no. T24-504/17-N), the Chinese Academy of Sciences (grant nos. XDA23010303, XDPB1901, and QYZDJ-SSW-DQC032), the Guangdong Science and Technology Department (grant nos. 2020B1111360001 and 2020B1212060053), and the Youth Innovation Promotion Association of the Chinese Academy of Sciences (grant no. 2017406).
This paper was edited by Glenn Wolfe and reviewed by three anonymous referees.
Atkinson, R. and Arey, J.: Gas-phase tropospheric chemistry of biogenic volatile organic compounds: a review, Atmos. Environ., 37, S197–S219, https://doi.org/10.1016/S1352-2310(03)00391-1, 2003.
Aydin, Y. M., Yaman, B., Koca, H., Dasdemir, O., Kara, M., Altiok, H., Dumanoglu, Y., Bayram, A., Tolunay, D., Odabasi, M., and Elbir, T.: Biogenic volatile organic compound (BVOC) emissions from forested areas in Turkey: Determination of specific emission rates for thirty-one tree species, Sci. Total Environ., 490, 239–253, https://doi.org/10.1016/j.scitotenv.2014.04.132, 2014.
Bai, J., Guenther, A., Turnipseed, A., Duhl, T., and Greenberg, J.: Seasonal and interannual variations in whole-ecosystem BVOC emissions from a subtropical plantation in China, Atmos. Environ., 161, 176–190, https://doi.org/10.1016/j.atmosenv.2017.05.002, 2017.
Bourtsoukidis, E., Bonn, B., Dittmann, A., Hakola, H., Hellén, H., and Jacobi, S.: Ozone stress as a driving force of sesquiterpene emissions: a suggested parameterisation, Biogeosciences, 9, 4337–4352, https://doi.org/10.5194/bg-9-4337-2012, 2012.
Bourtsoukidis, E., Williams, J., Kesselmeier, J., Jacobi, S., and Bonn, B.: From emissions to ambient mixing ratios: online seasonal field measurements of volatile organic compounds over a Norway spruce-dominated forest in central Germany, Atmos. Chem. Phys., 14, 6495–6510, https://doi.org/10.5194/acp-14-6495-2014, 2014.
Cao, X. L., Boissard, C., Juan, A. J., Hewitt, C. N., and Gallagher, M.: Biogenic emissions of volatile organic compounds from gorse (Ulex europaeus): Diurnal emission fluxes at Kelling Heath, England, J. Geophys. Res.-Atmos., 102, 18903–18915, https://doi.org/10.1029/97jd00421, 1997.
Chen, J., Bi, H., Yu, X., Fu, Y., and Liao, W.: Influence of physiological and environmental factors on the diurnal variation in emissions of biogenic volatile compounds from Pinus tabuliformis, J. Environ. Sci. (China), 81, 102–118, https://doi.org/10.1016/j.jes.2019.01.020, 2019.
Chen, J., Tang, J., and Yu, X.: Environmental and physiological controls on diurnal and seasonal patterns of biogenic volatile organic compound emissions from five dominant woody species under field conditions, Environ. Pollut., 259, 113955, https://doi.org/10.1016/j.envpol.2020.113955, 2020.
Copolovici, L. and Niinemets, Ü.: Flooding induced emissions of volatile signalling compounds in three tree species with differing waterlogging tolerance, Plant Cell Environ., 33, 1582–1594, https://doi.org/10.1111/j.1365-3040.2010.02166.x, 2010.
de Souza, V. F., Niinemets, U., Rasulov, B., Vickers, C. E., Duvoisin Junior, S., Araujo, W. L., and Goncalves, J. F. C.: Alternative carbon sources for isoprene emission, Trends Plant Sci., 23, 1081–1101, https://doi.org/10.1016/j.tplants.2018.09.012, 2018.
Di Carlo, P., Brune, W. H., Martinez, M., Harder, H., Lesher, R., Ren, X. R., Thornberry, T., Carroll, M. A., Young, V., Shepson, P. B., Riemer, D., Apel, E., and Campbell, C.: Missing OH reactivity in a forest: Evidence for unknown reactive biogenic VOCs, Science, 304, 722–725, https://doi.org/10.1126/science.1094392, 2004.
Douma, J. C., Ganzeveld, L. N., Unsicker, S. B., Boeckler, G. A., and Dicke, M.: What makes a volatile organic compound a reliable indicator of insect herbivory?, Plant Cell Environ., 42, 3308–3325, https://doi.org/10.1111/pce.13624, 2019.
Fang, H., Luo, S., Huang, X., Fu, X., Xiao, S., Zeng, J., Wang, J., Zhang, Y., and Wang, X.: Ambient naphthalene and methylnaphthalenes observed at an urban site in the Pearl River Delta region: Sources and contributions to secondary organic aerosol, Atmos. Environ., 252, 118295, https://doi.org/10.1016/j.atmosenv.2021.118295, 2021.
Feng, Z., Yuan, X., Fares, S., Loreto, F., Li, P., Hoshika, Y., and Paoletti, E.: Isoprene is more affected by climate drivers than monoterpenes: A meta-analytic review on plant isoprenoid emissions, Plant Cell Environ., 42, 1939–1949, https://doi.org/10.1111/pce.13535, 2019.
Ghirardo, A., Gutknecht, J., Zimmer, I., Brueggemann, N., and Schnitzler, J.-P.: Biogenic volatile organic compound and respiratory CO2 emissions after 13C-Labeling: Online tracing of C translocation dynamics in poplar plants, Plos One, 6, e17393, https://doi.org/10.1371/journal.pone.0017393, 2011.
Ghirardo, A., Lindstein, F., Koch, K., Buegger, F., Schloter, M., Albert, A., Michelsen, A., Winkler, J. B., Schnitzler, J. P., and Rinnan, R.: Origin of volatile organic compound emissions from subarctic tundra under global warming, Glob. Chang. Biol., 26, 1908–1925, https://doi.org/10.1111/gcb.14935, 2020.
Gonzaga Gomez, L., Loubet, B., Lafouge, F., Ciuraru, R., Buysse, P., Durand, B., Gueudet, J.-C., Fanucci, O., Fortineau, A., Zurfluh, O., Decuq, C., Kammer, J., Duprix, P., Bsaibes, S., Truong, F., Gros, V., and Boissard, C.: Comparative study of biogenic volatile organic compounds fluxes by wheat, maize and rapeseed with dynamic chambers over a short period in northern France, Atmos. Environ., 214, 116855, https://doi.org/10.1016/j.atmosenv.2019.116855, 2019.
Gu, D., Guenther, A. B., Shilling, J. E., Yu, H., Huang, M., Zhao, C., Yang, Q., Martin, S. T., Artaxo, P., Kim, S., Seco, R., Stavrakou, T., Longo, K. M., Tota, J., Ferreira de Souza, R. A., Vega, O., Liu, Y., Shrivastava, M., Alves, E. G., Santos, F. C., Leng, G., and Hu, Z.: Airborne observations reveal elevational gradient in tropical forest isoprene emissions, Nat. Commun., 8, 15541, https://doi.org/10.1038/ncomms15541, 2017.
Gu, H., Wang, J., Ma, L., Shang, Z., and Zhang, Q.: Insights into the BRT (Boosted Regression Trees) method in the study of the climate-growth relationship of Masson pine in subtropical China, Forests, 10, 228, https://doi.org/10.3390/f10030228, 2019.
Guenther, A. B., Jiang, X., Heald, C. L., Sakulyanontvittaya, T., Duhl, T., Emmons, L. K., and Wang, X.: The Model of Emissions of Gases and Aerosols from Nature version 2.1 (MEGAN2.1): an extended and updated framework for modeling biogenic emissions, Geosci. Model Dev., 5, 1471–1492, https://doi.org/10.5194/gmd-5-1471-2012, 2012.
Guenther, A., Hewitt, C. N., Erickson, D., Fall, R., Geron, C., Graedel, T., Harley, P., Klinger, L., Lerdau, M., McKay, W. A., Pierce, T., Scholes, B., Steinbrecher, R., Tallamraju, R., Taylor, J., and Zimmerman, P.: A global model of natural volatile organic compound emissions, J. Geophys. Res.-Atmos., 100, 8873–8892, https://doi.org/10.1029/94jd02950, 1995.
Guenther, A., Karl, T., Harley, P., Wiedinmyer, C., Palmer, P. I., and Geron, C.: Estimates of global terrestrial isoprene emissions using MEGAN (Model of Emissions of Gases and Aerosols from Nature), Atmos. Chem. Phys., 6, 3181–3210, https://doi.org/10.5194/acp-6-3181-2006, 2006.
Helin, A., Hakola, H., and Hellén, H.: Optimisation of a thermal desorption–gas chromatography–mass spectrometry method for the analysis of monoterpenes, sesquiterpenes and diterpenes, Atmos. Meas. Tech., 13, 3543–3560, https://doi.org/10.5194/amt-13-3543-2020, 2020.
Helmig, D., Bocquet, F., Pollmann, J., and Revermann, T.: Analytical techniques for sesquiterpene emission rate studies in vegetation enclosure experiments, Atmos. Environ., 38, 557–572, https://doi.org/10.1016/j.atmosenv.2003.10.012, 2004.
Helmig, D., Ortega, J., Guenther, A., Herrick, J. D., and Geron, C.: Sesquiterpene emissions from loblolly pine and their potential contribution to biogenic aerosol formation in the Southeastern US, Atmos. Environ., 40, 4150–4157, https://doi.org/10.1016/j.atmosenv.2006.02.035, 2006.
Helmig, D., Ortega, J., Duhl, T., Tanner, D., Guenther, A., Harley, P., Wiedinmyer, C., Milford, J., and Sakulyanontvittaya, T.: Sesquiterpene emissions from pine trees – Identifications, emission rates and flux estimates for the contiguous United States, Environ. Sci. Technol., 41, 1545–1553, https://doi.org/10.1021/es0618907, 2007.
Helmig, D., Daly, R. W., Milford, J., and Guenther, A.: Seasonal trends of biogenic terpene emissions, Chemosphere, 93, 35–46, https://doi.org/10.1016/j.chemosphere.2013.04.058, 2013.
Hohaus, T., Kuhn, U., Andres, S., Kaminski, M., Rohrer, F., Tillmann, R., Wahner, A., Wegener, R., Yu, Z., and Kiendler-Scharr, A.: A new plant chamber facility, PLUS, coupled to the atmosphere simulation chamber SAPHIR, Atmos. Meas. Tech., 9, 1247–1259, https://doi.org/10.5194/amt-9-1247-2016, 2016.
Holopainen, J. K., Kivimäenpää, M., and Nizkorodov, S. A.: Plant-derived secondary organic material in the air and ecosystems, Trends Plant Sci., 22, 744–753, https://doi.org/10.1016/j.tplants.2017.07.004, 2017.
Huang, X., Lai, J., Liu, Y., Zheng, L., Fang, X., Song, W., and Yi, Z.: Biogenic volatile organic compound emissions from Pinus massoniana and Schima superba seedlings: Their responses to foliar and soil application of nitrogen, Sci. Total Environ., 705, 135761, https://doi.org/10.1016/j.scitotenv.2019.135761, 2020.
Huang, Z., Zhang, Y., Yan, Q., Zhang, Z., and Wang, X.: Real-time monitoring of respiratory absorption factors of volatile organic compounds in ambient air by proton transfer reaction time-of-flight mass spectrometry, J. Hazard. Mater., 320, 547–555, https://doi.org/10.1016/j.jhazmat.2016.08.064, 2016.
Jing, X., Lun, X., Fan, C., and Ma, W.: Emission patterns of biogenic volatile organic compounds from dominant forest species in Beijing, China, J. Environ. Sci. (China), 95, 73–81, https://doi.org/10.1016/j.jes.2020.03.049, 2020.
Kajos, M. K., Hakola, H., Holst, T., Nieminen, T., Tarvainen, V., Maximov, T., Petäjä, T., Arneth, A., and Rinne, J.: Terpenoid emissions from fully grown east Siberian Larix cajanderi trees, Biogeosciences, 10, 4705–4719, https://doi.org/10.5194/bg-10-4705-2013, 2013.
Karlik, J. F. and Winer, A. M.: Measured isoprene emission rates of plants in California landscapes: comparison to estimates from taxonomic relationships, Atmos. Environ., 35, 1123–1131, https://doi.org/10.1016/s1352-2310(00)00258-2, 2001.
Kesselmeier, J., Schafer, L., Ciccioli, P., Brancaleoni, E., Cecinato, A., Frattoni, M., Foster, P., Jacob, V., Denis, J., Fugit, J. L., Dutaur, L., and Torres, L.: Emission of monoterpenes and isoprene from a Mediterranean oak species Quercus ilex L. measured within the BEMA (Biogenic Emissions in the Mediterranean Area) project, Atmos. Environ., 30, 1841–1850, https://doi.org/10.1016/1352-2310(95)00376-2, 1996.
Kim, J. C.: Factors controlling natural VOC emissions in a southeastern US pine forest, Atmos. Environ., 35, 3279–3292, https://doi.org/10.1016/s1352-2310(00)00522-7, 2001.
Kleist, E., Mentel, T. F., Andres, S., Bohne, A., Folkers, A., Kiendler-Scharr, A., Rudich, Y., Springer, M., Tillmann, R., and Wildt, J.: Irreversible impacts of heat on the emissions of monoterpenes, sesquiterpenes, phenolic BVOC and green leaf volatiles from several tree species, Biogeosciences, 9, 5111–5123, https://doi.org/10.5194/bg-9-5111-2012, 2012.
Kolari, P., Back, J., Taipale, R., Ruuskanen, T. M., Kajos, M. K., Rinne, J., Kulmala, M., and Hari, P.: Evaluation of accuracy in measurements of VOC emissions with dynamic chamber system, Atmos. Environ., 62, 344–351, https://doi.org/10.1016/j.atmosenv.2012.08.054, 2012.
Laothawornkitkul, J., Taylor, J. E., Paul, N. D., and Hewitt, C. N.: Biogenic volatile organic compounds in the earth system, New Phytol., 183, 27–51, https://doi.org/10.1111/j.1469-8137.2009.02859.x, 2009.
Li, L., Guenther, A. B., Xie, S., Gu, D., Seco, R., Nagalingam, S., and Yan, D.: Evaluation of semi-static enclosure technique for rapid surveys of biogenic volatile organic compounds (BVOCs) emission measurements, Atmos. Environ., 212, 1–5, https://doi.org/10.1016/j.atmosenv.2019.05.029, 2019.
Loreto, F. and Schnitzler, J.-P.: Abiotic stresses and induced BVOCs, Trends Plant Sci., 15, 154–166, https://doi.org/10.1016/j.tplants.2009.12.006, 2010.
Lüpke, M., Steinbrecher, R., Leuchner, M., and Menzel, A.: The Tree Drought Emission MONitor (Tree DEMON), an innovative system for assessing biogenic volatile organic compounds emission from plants, Plant Methods, 13, 14, https://doi.org/10.1186/s13007-017-0166-6, 2017.
Matsunaga, S. N., Mochizuki, T., Ohno, T., Endo, Y., Kusumoto, D., and Tani, A.: Monoterpene and sesquiterpene emissions from Sugi (Cryptomeria japonica) based on a branch enclosure measurements, Atmos. Pollut. Res., 2, 16–23, https://doi.org/10.5094/apr.2011.003, 2011.
Mermet, K., Sauvage, S., Dusanter, S., Salameh, T., Léonardis, T., Flaud, P.-M., Perraudin, É., Villenave, É., and Locoge, N.: Optimization of a gas chromatographic unit for measuring biogenic volatile organic compounds in ambient air, Atmos. Meas. Tech., 12, 6153–6171, https://doi.org/10.5194/amt-12-6153-2019, 2019.
Mozaffar, A., Schoon, N., Digrado, A., Bachy, A., Delaplace, P., du Jardin, P., Fauconnier, M. L., Aubinet, M., Heinesch, B., and Amelynck, C.: Methanol emissions from maize: Ontogenetic dependence to varying light conditions and guttation as an additional factor constraining the flux, Atmos. Environ., 152, 405–417, https://doi.org/10.1016/j.atmosenv.2016.12.041, 2017.
Niinemets, U., Kuhn, U., Harley, P. C., Staudt, M., Arneth, A., Cescatti, A., Ciccioli, P., Copolovici, L., Geron, C., Guenther, A., Kesselmeier, J., Lerdau, M. T., Monson, R. K., and Penuelas, J.: Estimations of isoprenoid emission capacity from enclosure studies: measurements, data processing, quality and standardized measurement protocols, Biogeosciences, 8, 2209–2246, https://doi.org/10.5194/bg-8-2209-2011, 2011.
Ortega, J., and Helmig, D.: Approaches for quantifying reactive and low-volatility biogenic organic compound emissions by vegetation enclosure techniques – part A, Chemosphere, 72, 343–364, https://doi.org/10.1016/j.chemosphere.2007.11.020, 2008.
Ortega, J., Helmig, D., Daly, R. W., Tanner, D. M., Guenther, A. B., and Herrick, J. D.: Approaches for quantifying reactive and low-volatility biogenic organic compound emissions by vegetation enclosure techniques – Part B: Applications, Chemosphere, 72, 365–380, https://doi.org/10.1016/j.chemosphere.2008.02.054, 2008.
Pape, L., Ammann, C., Nyfeler-Brunner, A., Spirig, C., Hens, K., and Meixner, F. X.: An automated dynamic chamber system for surface exchange measurement of non-reactive and reactive trace gases of grassland ecosystems, Biogeosciences, 6, 405–429, https://doi.org/10.5194/bg-6-405-2009, 2009.
Peñuelas, J., Rutishauser, T., and Filella, I.: Phenology feedbacks on climate change, Science, 324, 887–888, https://doi.org/10.1126/science.1173004, 2009.
Pokorska, O., Dewulf, J., Amelynck, C., Schoon, N., Simpraga, M., Steppe, K., and Van Langenhove, H.: Isoprene and terpenoid emissions from Abies alba: Identification and emission rates under ambient conditions, Atmos. Environ., 59, 501–508, https://doi.org/10.1016/j.atmosenv.2012.04.061, 2012.
Pollmann, J., Ortega, J., and Helmig, D.: Analysis of atmospheric sesquiterpenes: Sampling losses and mitigation of ozone interferences, Environ. Sci. Technol., 39, 9620–9629, https://doi.org/10.1021/es050440w, 2005.
Rhoderick, G. C., and Lin, J.: Stability assessment of gas mixtures containing monoterpenes in varying cylinder materials and treatments, Anal. Chem., 85, 4675–4685, https://doi.org/10.1021/ac400324v, 2013.
Rinne, J., Taipale, R., Markkanen, T., Ruuskanen, T. M., Hellén, H., Kajos, M. K., Vesala, T., and Kulmala, M.: Hydrocarbon fluxes above a Scots pine forest canopy: measurements and modeling, Atmos. Chem. Phys., 7, 3361–3372, https://doi.org/10.5194/acp-7-3361-2007, 2007.
Schaub, A., Blande, J. D., Graus, M., Oksanen, E., Holopainen, J. K., and Hansel, A.: Real-time monitoring of herbivore induced volatile emissions in the field, Physiol. Plant., 138, 123–133, https://https://doi.org/10.1111/j.1399-3054.2009.01322.x, 2010.
Scott, C. E., Arnold, S. R., Monks, S. A., Asmi, A., Paasonen, P., and Spracklen, D. V.: Substantial large-scale feedbacks between natural aerosols and climate, Nat. Geosci., 11, 44–48, https://doi.org/10.1038/s41561-017-0020-5, 2017.
Šimpraga, M., Takabayashi, J., and Holopainen, J. K.: Language of plants: Where is the word?, J. Integr. Plant Biol., 58, 343–349, https://doi.org/10.1111/jipb.12447, 2016.
Simpson, D., Winiwarter, W., Borjesson, G., Cinderby, S., Ferreiro, A., Guenther, A., Hewitt, C. N., Janson, R., Khalil, M. A. K., Owen, S., Pierce, T. E., Puxbaum, H., Shearer, M., Skiba, U., Steinbrecher, R., Tarrason, L., and Oquist, M. G.: Inventorying emissions from nature in Europe, J. Geophys. Res.-Atmos., 104, 8113–8152, https://doi.org/10.1029/98jd02747, 1999.
Situ, S., Wang, X., Guenther, A., Zhang, Y., Wang, X., Huang, M., Fan, Q., and Xiong, Z.: Uncertainties of isoprene emissions in the MEGAN model estimated for a coniferous and broad-leaved mixed forest in Southern China, Atmos. Environ., 98, 105–110, https://doi.org/10.1016/j.atmosenv.2014.08.023, 2014.
Spirig, C., Neftel, A., Ammann, C., Dommen, J., Grabmer, W., Thielmann, A., Schaub, A., Beauchamp, J., Wisthaler, A., and Hansel, A.: Eddy covariance flux measurements of biogenic VOCs during ECHO 2003 using proton transfer reaction mass spectrometry, Atmos. Chem. Phys., 5, 465–481, https://doi.org/10.5194/acp-5-465-2005, 2005.
Wang, G., Guan, D., Xiao, L., and Peart, M. R.: Forest biomass-carbon variation affected by the climatic and topographic factors in Pearl River Delta, South China, J. Environ. Manage., 232, 781–788, https://doi.org/10.1016/j.jenvman.2018.11.130, 2019.
Wang, X. M., Situ, S. P., Guenther, A., Chen, F., Wu, Z. Y., Xia, B. C., and Wang, T. J.: Spatiotemporal variability of biogenic terpenoid emissions in Pearl River Delta, China, with high-resolution land-cover and meteorological data, Tellus B, 63, 241–254, https://doi.org/10.1111/j.1600-0889.2010.00523.x, 2011.
Wang, X., Liu, T., Bernard, F., Ding, X., Wen, S., Zhang, Y., Zhang, Z., He, Q., Lü, S., Chen, J., Saunders, S., and Yu, J.: Design and characterization of a smog chamber for studying gas-phase chemical mechanisms and aerosol formation, Atmos. Meas. Tech., 7, 301–313, https://doi.org/10.5194/amt-7-301-2014, 2014.
Wiß, F., Ghirardo, A., Schnitzler, J.-P., Nendel, C., Augustin, J., Hoffmann, M., and Grote, R.: Net ecosystem fluxes and composition of biogenic volatile organic compounds over a maize field-interaction of meteorology and phenological stages, Glob. Change Biol. Bioenergy, 9, 1627–1643, https://doi.org/10.1111/gcbb.12454, 2017.
Yaman, B., Aydin, Y. M., Koca, H., Dasdemir, O., Kara, M., Altiok, H., Dumanoglu, Y., Bayram, A., Tolunay, D., Odabasi, M., and Elbir, T.: Biogenic Volatile Organic Compound (BVOC) emissions from various endemic tree species in Turkey, Aerosol Air Qual. Res., 15, 341–356, https://doi.org/10.4209/aaqr.2014.04.0082, 2015.
Yáñez-Serrano, A. M., Mahlau, L., Fasbender, L., Byron, J., Williams, J., Kreuzwieser, J., and Werner, C.: Heat stress increases the use of cytosolic pyruvate for isoprene biosynthesis, J. Exp. Bot., 70, 5827–5838, https://doi.org/10.1093/jxb/erz353, 2019.
Zhang, H., Zhang, Y., Huang, Z., Acton, W. J. F., Wang, Z., Nemitz, E., Langford, B., Mullinger, N., Davison, B., Shi, Z., Liu, D., Song, W., Yang, W., Zeng, J., Wu, Z., Fu, P., Zhang, Q., and Wang, X.: Vertical profiles of biogenic volatile organic compounds as observed online at a tower in Beijing, J. Environ. Sci. (China), 95, 33–42, https://doi.org/10.1016/j.jes.2020.03.032, 2020.
Zhang, Y. and Wang, X.: Design and characterization of a semi-open dynamic chamber for measuring biogenic volatile organic compounds (BVOCs) emissions from plants, Zenodo [data set], https://doi.org/10.5281/zenodo.5347841, 2021.
Zhang, Y., Zhang, R., Yu, J., Zhang, Z., Yang, W., Zhang, H., Lyu, S., Wang, Y., Dai, W., Wang, Y., and Wang, X.: Isoprene mixing ratios measured at twenty sites in China during 2012–2014: Comparison with model simulation, J. Geophys. Res.-Atmos., 125, e2020JD033523, https://doi.org/10.1029/2020jd033523, 2020.